department of economics working paper series...
TRANSCRIPT

Department of Economics
Working Paper Series Consumption, sentiment, and economic
news
By:
Martha Starr
No. 2008-16
Fall 2008
http://www.american.edu/cas/econ/workpap.htm
Copyright © 2008 by Martha Starr. All rights reserved. Readers may make verbatim copies of this document for non-commercial purposes by any means, provided that this copyright notice appears on all such copies.

2
Consumption, sentiment, and economic news
Martha Starr
Abstract
This paper investigates the influence of economic news on consumer sentiment, and examines whether ‘news shocks’ –- changes in coverage that would not be expected from incoming data on economic fundamentals -– have aggregate effects. Using monthly U.S. data and a structural vector-autoregression, I find that (1) sentiment is affected by news shocks, (2) after filtering out effects of news shocks, shocks to sentiment still have positive effects on consumer spending, and (3) news shocks influence both spending and unemployment in significant, though transitory ways. These results are consistent with other evidence of a role of non-fundamental factors in aggregate fluctuations. JEL Codes: E21, D12, E32 Keywords: Consumption, consumer sentiment, economic news, aggregate fluctuations ___________________________________________________________________ * Please address correspondence to: Prof. Martha A. Starr, Department of Economics, American University, 4400 Massachusetts Ave. NW, Washington, DC 20016. Tel: 202-885-3747. Email: [email protected].
2
Introduction
Since the introduction of surveys of consumer sentiment after World War II, it has been a
puzzle why measures of consumer sentiment have predictive value for changes in consumer
spending. Because sentiment measures are based on questions about households’ expectations
for changes in business conditions and their personal finances, they may reflect emergent shifts
in fundamental determinants of spending, like income, not yet apparent in economic data. It is
also possible that they reflect shifts in outlook or mood exogenous to changes in fundamentals,
but that influence people’s willingness to spend. An important study by Carroll, Fuhrer, and
Wilcox (1994) found that, after controlling for fundamental determinants of spending,
sentiment still has a small but significant value for predicting future changes in spending.1 The
finding that ‘non-fundamental’ changes in consumer sentiment affect consumption is
consistent with recent developments in the real business cycle literature, in which it has been
shown that models with non-fundamental demand shocks and indeterminate equilibria can
match observed patterns in macroeconomic data relatively well (e.g. Farmer and Guo 1994,
Benhabib and Farmer 1999, Benhabib and Wen 2004).
It remains poorly understood, however, what ‘non-fundamental’ fluctuations in consumer
sentiment reflect. The traditional interpretation is that they capture intangible psychological
factors that vary over time and have independent causal effects on consumers’ willingness to
spend.2 Such factors are variously described as ‘animal spirits’, optimism or pessimism,
outlook, mood, or emotional response to uncertainty. However, there is limited information on
whether all non-fundamental fluctuations in consumer sentiment are ‘psychological’ in this
sense, or whether other types of intangible factors are also involved. An important possibility is
that some part of non-fundamental fluctuations in sentiment reflect discrepancies between 1 This finding has been repeated in many studies using data for the U.S. and other countries. See, for example, Howry (2001) and Ludvigson (2004) on the U.S.; Acemoglu and Scott (1994) and Berry and Davey (2004) on the U.K.; Bryant and Macri (2005) on Australia; and Kwan and Cotsomitis (2006) on Canada. The ‘fundamentals’ for which Carroll, Fuhrer, and Wilcox control are after-tax income, interest rates, stock prices, and inflation. 2 This was also the opinion of George Katona, the founding father of surveys of consumer attitudes. See, e.g. Katona (1968: 22-23).

3
what people think is happening in terms of economic fundamentals and actual changes in
conditions. Notably, it is commonly questioned whether the news media cover changes in
economic conditions in ways that accurately represent incoming information on them -– which
is important because the media are the public’s primary source of information on the
economy.3 For one, pressures to confine news coverage to stories with demonstrable ‘news
value’ mean that only relatively dramatic economic news tends to get covered. Thus, for
example, newly-released government statistics showing modest, positive changes in economic
conditions may not be covered on the nightly news, while those showing larger, negative
changes may be the lead story.4 For another, the probability that given economic news gets
covered depends on what else is going on in the news landscape; for instance, even notable
changes in inflation or unemployment may be only briefly mentioned when there are major
developments in other areas (White House scandals, terrorist attacks, celebrity murder trials).
Additionally, the salience of economic news to the public may vary over time; in particular,
people are known to pay more attention to the state of the economy in the months before
presidential elections, so that a given news item may become more widely known then than at
other times.5
If media representations of changes in economic conditions are not consistently in line with
reality, then the perceptions of economic conditions with which businesses and consumers
operate may also at times be misaligned with economic fundamentals. An example given in this
respect concerns the recession of the early 1990s; although it was by all measures a relatively
mild downturn, some analysts thought that unduly negative news stories created anxiety among
consumers, which in turn depressed spending and delayed the onset of recovery (Kurtz 1990,
3 See Stein (1975), Kurtz (1990), and Weinstein (1992) on the subject of media representations of economic news, and Blinder and Krueger (2004) for evidence that the public’s main sources of information on the economy are television news programs and newspapers. 4 See, for example, Burns (2002), on traditional journalistic criteria for evaluating a story’s news value. Harrington’s (1989) analysis of television-news transcripts documents this greater probability that ‘bad’ economic news will be covered than ‘good’. 5 See Fogarty (2005) for empirical evidence on crowding-out and election-related effects. The latter is of course consistent with the well-known finding of Fair (e.g. 2002), that economic conditions have significant value for predicting election outcomes.

4
Blanchard 1993, Doms and Morin 2004). Conceivably, then, at times when media coverage
makes economic conditions seem too strong or too weak relative to incoming data on economic
fundamentals, it is possible that consumers may spend more or less than one would expect
them to, given the ‘hard data’ on economic fundamentals –- but as a result of their information
sets being misaligned with fundamentals, not because of exogenous changes in ‘mood’. This
indicates the problem for inferences that non-fundamental causes of aggregate fluctuations are
‘psychological’ in nature, because they may instead or also reflect variations in the
correspondence between people’s perceptions of economic conditions and what they actually
are.
There is limited previous research on whether discrepancies between economic fundamentals
and the media’s coverage of them contribute to non-fundamental fluctuations in aggregate
economic variables. Doms and Morin (2004) investigate whether economic news coverage plays
a role in fluctuations in consumer sentiment, which (as mentioned) are known to correlate with
fluctuations in consumer spending. Using data from Lexis-Nexis, they compile a ‘recession
index’, which tracks the number of articles in 30 major U.S. newspapers that have the word
‘recession’ or ‘slowdown’ in the headline or first paragraph. They find that indeed, there are
periods when recession mentions occur too frequently relative to what would be expected from
incoming economic data and opinions of professional forecasters, and that such ‘bad news’
exerts a significant drag on consumer sentiment. However, they do not in turn examine the
extent to which such news discrepancies help to explain observed ‘sentiment effects’ on
spending.
This paper extends the work of Doms and Morin, reinvestigating the question of how economic
news contributes to fluctuations in consumer sentiment, and further examining whether ‘news
shocks’ have macroeconomic effects. Unlike Doms and Morin, instead of measuring media
coverage from analysis of media content, we use survey data on what people say they have
heard about how the economy is doing to measure consumption of economic news. These data

5
come from the University of Michigan’s Survey of Consumers, the monthly survey of U.S.
households used to collect data for the Index of Consumer Sentiment. Measuring economic
news in terms of what people have heard or read, rather than in terms of media content, has
the advantage of taking into account changing patterns of media consumption over the past 25-
30 years -- wherein daily newspaper readership has fallen, evening network-news audiences
have shrunk, business programs on cable channels have multiplied, and ‘soft news’ formats like
morning-news programs have risen in popularity.6
To examine effects of economic news on consumer sentiment and other macroeconomic
variables, we insert both the news measure and the Index of Consumer Sentiment into a small
structural vector-autogression (SVAR) that is an extension of the standard framework for
analyzing monetary policy (Christiano, Eichenbaum and Evans 1999). In particular, the SVAR’s
identifying restrictions are based on standard assumptions about the Federal Reserve’s
information set at the time it decides interest rates, plus extensions related to lags in
information availability and the channels by which people get information on changing
economic conditions. This approach has the advantage of explicitly modeling processes of
feedback between consumption, sentiment, and ‘fundamental’ determinants of spending
(including monetary policy), rather than trying to ‘control’ for fundamentals by lagging their
values in single-equation models (e.g. Carroll, Fuhrer, and Wilcox 1992). The SVAR results
indicate that, indeed, sentiment is significantly affected by economic-news shocks, with the
latter accounting for 1/4 of the variance of the forecast error of the former at a one-year
horizon. However, even after effects of news shocks are filtered out, shocks to sentiment still
have a small positive and significant effect on consumer spending, consistent with the vast
body of literature in this area. We also find that ‘news shocks’ significantly affect aggregate
economic activity, wherein portrayals of economic conditions that are too positive relative to
economic fundamentals tend to boost spending and lower unemployment. Altogether, the
6 For evidence, see the Project for Excellence in Journalism (2007). Jensen (2002) discusses content- versus audience-approaches in media research.

6
results are consistent with other studies finding empirical evidence of non-fundamental factors
in aggregate fluctuations (e.g. Matsusaka and Sbordone 1995, Chauvet and Guo 2003). They
also indicate a need for further research to identify more precisely what these non-
fundamental factors are, including their relative importance in explaining output changes at
business-cycle frequencies.
Data and specification
The University of Michigan’s Survey of Consumer Attitudes (SCA) is a telephone survey of 500
households which asks various questions about their perceptions of economic conditions.7 A
subset of the survey questions, shown in Appendix Table 1, is used to compute the Index of
Consumer Sentiment; these include two questions about business conditions, two about the
household’s personal finances, and one about whether now is a good time to make major
purchases. Because these data have been described and analyzed in a number of previous
studies (see, notably, Ludvigson 2004), they are not discussed in detail here.
In addition to the questions used as inputs into the sentiment index, respondents are also asked
a number of other questions about what they have heard or what they think about various
other economic developments. Of chief interest to us is the question, “During the last few
months, have you heard of any favorable or unfavorable changes in business conditions?” If the
respondent says yes, she is asked, “What did you hear?” The replies are recorded according to
the subject mentioned, with prices, employment, consumer demand, the stock market, and
ease of access to credit being most commonly mentioned. Also recorded is whether the news
mentioned was favorable or unfavorable, e.g. higher unemployment is coded as unfavorable,
easier access to credit as favorable, etc.8
7 See Curtin (2002) for further information on the survey methodology. 8 If the favorability of the change mentioned by the respondent news is not clear, the interviewer asks “Would (MENTION CHANGE) be favorable or unfavorable?” and records the respondent’s reply.

7
Figure 1 shows how reports of favorable and unfavorable news have fluctuated since 1978,
when the survey shifted from a quarterly to a monthly frequency. News about employment is
the single-most important category mentioned, with the most pronounced pattern in the data
being large increases during recessions of reports of bad news about employment. Other
notable patterns include a rise in reports of bad news about prices in the “stagflation” of the
late 1970s, a rise in reports of good news about credit during the 1980s Volcker disinflation, a
spike in bad news about the stock market around the October 1987 crash, and reports of good
news about the stock market during the “irrational exuberance” of the later 1990s. Altogether
the data suggest a good broad correspondence between reports of news heard and changes in
key economic variables.9
To collapse the detailed answers into a scalar measure, we use the SCA’s news index which is
computed using the same method as the sentiment index, where the share of respondents
mentioning unfavorable news is subtracted from the share mentioning favorable news, and the
balance is added to 100. Figure 2 shows that upturns and downswings in consumer sentiment
tend to be accompanied by parallel swings in reporting of good news. This is not surprising
given that two of the questions in the sentiment index relate specifically to people’s
expectations of aggregate business conditions, which are presumably influenced importantly by
economic news. We would also expect answers to the two questions on people’s personal
finances to be influenced by the news, especially about employment, as well as their own
information sets. Also apparent from the graph is that both indexes co-move closely with
consumer spending. This highlights the possibility that documented “sentiment effects” on
spending may be partly due to “news effects”: that is, if the media portray economic
conditions as more positive or negative than the fundamentals imply, consumer sentiment may
9 It is also worth noting, however, that except during recessions implied shares of respondents reporting that they had heard economic news are not particularly high. This is consistent with other evidence that the general public does not tend to follow closely the economic news (Blinder and Krueger 2004). Note also that, at any given time, the share of respondents saying they had heard bad news about the economy exceeds the share reporting good news, consistent with the idea that media coverage of economic news is ordinarily on the negative side (see Doms and Morin 2004).

8
rise, and they may spend more or less freely than they otherwise would -- but due to their
information set being “too positive”, not because of an exogenous shift in outlook or mood.
To examine the role of changes in news coverage in explaining sentiment effects on spending,
we set up a small structural vector-autoregressive (SVAR) model which embeds issues of
consumption, sentiment and economic news in the context of the Federal Reserve’s monetary-
policy problem, wherein the central bank monitors incoming data on changes in economic
activity and adjusts interest rates to offset effects of shocks that might increase inflation or
boost unemployment. The model parallels that used by Ludvigson, Steindel, and Lettau (2002)
to analyze monetary policy transmission through the consumption-wealth channel, except that
it allows for a possible role of economic news in conditioning consumer sentiment and
spending, and for the use by the Federal Reserve of incoming data on sentiment to gauge
possible shifts in consumption growth.
The seven variables included in the SVAR are inflation (INFL), unemployment (UNEMPL), the log
of personal consumption expenditures (LPCE), the economic news index (NEWS), the index of
consumer sentiment (SENT), the log change in the Dow Jones Industrial Average (∆STK), and
the Federal Funds rate (FF); precise definitions and data sources are shown in Appendix Table
2.10 Because the data are monthly, we use a combination of standard assumptions about the
Fed’s information set at the time it decides interest rates, plus extensions related to the
10 This approach to the consumption/sentiment relation is non-standard in that it does not include personal disposable income (DPI). Because our interest is in embedding this relation in the monetary-policy problem, we focus on unemployment rather than DPI because monthly changes in unemployment are closely watched by the Federal Reserve and constitute a central object of its policy-making, whereas monthly fluctuations in DPI are not. It is anyway also the case that changes in unemployment likely capture the dimension of income variation of greatest importance for understanding fluctuations in spending at the business cycle frequency. Some recent studies have used a cointegration framework to account for the necessary long-run relationship between consumption and income in understanding sentiment effects on consumption (e.g. Mehra and Martin 2003). However, as discussed by Carroll, Otsuka, and Slacalek (2006), there are important reasons to be careful about using the cointegration framework in analysis of aggregate consumption, including evidence that in the aggregate data, cointegrating relations may not be stable over time.
9
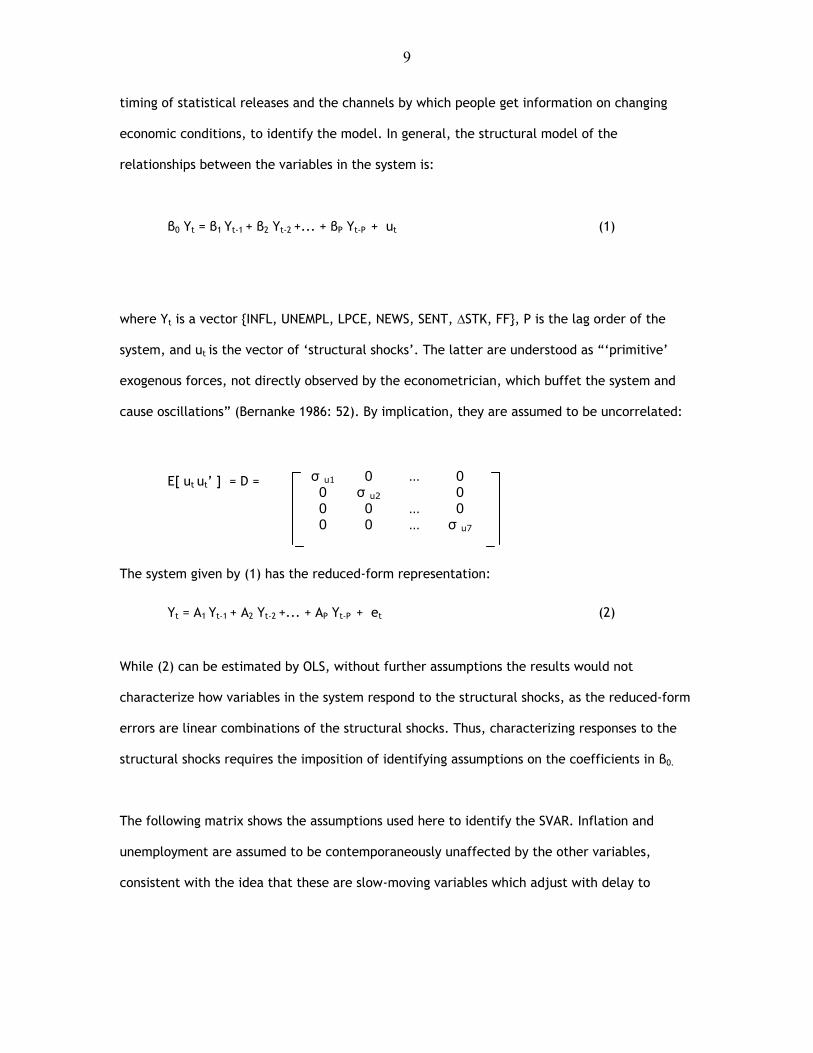
timing of statistical releases and the channels by which people get information on changing
economic conditions, to identify the model. In general, the structural model of the
relationships between the variables in the system is:
β0 Yt = β1 Yt-1 + β2 Yt-2 +... + βP Yt-P + ut (1)
where Yt is a vector {INFL, UNEMPL, LPCE, NEWS, SENT, ∆STK, FF}, P is the lag order of the
system, and ut is the vector of ‘structural shocks’. The latter are understood as “‘primitive’
exogenous forces, not directly observed by the econometrician, which buffet the system and
cause oscillations” (Bernanke 1986: 52). By implication, they are assumed to be uncorrelated:
σ u1 0 … 0 0 σ u2 0 0 0 … 0 0 0 … σ u7
E[ ut ut’ ] = D = The system given by (1) has the reduced-form representation:
Yt = A1 Yt-1 + A2 Yt-2 +... + AP Yt-P + et (2)
While (2) can be estimated by OLS, without further assumptions the results would not
characterize how variables in the system respond to the structural shocks, as the reduced-form
errors are linear combinations of the structural shocks. Thus, characterizing responses to the
structural shocks requires the imposition of identifying assumptions on the coefficients in β0.
The following matrix shows the assumptions used here to identify the SVAR. Inflation and
unemployment are assumed to be contemporaneously unaffected by the other variables,
consistent with the idea that these are slow-moving variables which adjust with delay to

10
changes in conditions.11 Consumption is allowed to be affected within the month by economic
news and by sentiment, supposing that people may use both updated information on the state
of the economy and non-fundamental dimensions of their outlook on it in monthly spending
decisions.12 In terms of the news variable, we assume that the only variable that influences it
within the month is the stock market; because government statistics on inflation,
unemployment and consumption are released in the month after the month to which they
pertain, information updates received within the month always relay changes in conditions in
the previous month.13 By this reasoning, it may seem preferable to allow changes in the
Federal Funds rate to affect the news variable within the month, because at least potentially
rate change made within the month may come to the attention of survey respondents during
the month in question. However, because interest rate decisions are made every 6-8 weeks
(and meetings scheduled for late in the month may occur after interviews for the Michigan
survey are over), it is often the case that the most recent rate change about which people
could have heard will have been made in the previou
a
s month.
11 See Ludvigson, Steindel and Lettau (2002) for discussion. 12 Ludvigson, Steindel and Lettau (2002) measure consumption in terms of non-durable goods and services only, in the interest of understanding consumption-income relations in terms of the flow of consumption services. Consumption in the present paper is measured in terms of total personal consumption expenditures, given our interest in understanding relations between sentiment and consumer spending in the short-term, where postponing decisions to buy durable goods may be an important part of the story (see Mishkin 1978). 13 Presently, unemployment statistics are usually released on the first Friday after the month to which they pertain, inflation statistics are released in the third week of the month after the month to which they pertain, and statistics on personal consumption expenditures are released at the end of the month after the month to which they pertain or the beginning of the month after that. Preliminary data from the Michigan survey, which are available to subscribers only (including the Fed), are usually available 7-12 days into the month to which they pertain and are based on one-half of the month’s interviews, whereas the final data are released near the end of that month.

11
1 0 0 0 0 0 0 INFL
0 1 0 0 0 0 0 UNEMPL
0 0 1 β43 β44 0 0 CONS
0 0 0 1 0 β54 0 NEWS
0 0 0 β45 1 0 0 SENT
0 0 0 0 β56 1 β76 ∆ STK
β17 β27 0 0 β57 0 1 FF The only variable which is allowed to affect consumer sentiment within the month is the
economic news, on the grounds that this is the channel via which the general public becomes
informed about ‘breaking’ economy-wide developments. Because data on consumer sentiment
are released within the month to which they pertain, and are monitored by the Federal
Reserve and financial markets as an early indicator of consumer spending, it is assumed that
they can influence both the Federal Funds rate and the stock market. Finally, following
Bernanke and Blinder (1992) and many other studies, the Federal Reserve is assumed to set
interest rates with knowledge of the shocks to inflation and unemployment, with the rationale
that its detailed monitoring and analysis of secondary data series (e.g. weekly unemployment
claims data, prices of gasoline at the pump, lay-offs at auto companies, etc.) give it good
insights into what to expect when ‘hard’ data on these items are eventually released.14
Conversely, however, it is assumed that, due to planning and production lags and the public’s
reliance on the media for economic news, changes in the Federal Funds rate do not
contemporaneously affect any variables in the system except the stock market.
Results from the reduced-form VAR along with these assumptions enable us to recover the
effects of the structural shocks on the variables in the system. The reduced-form VAR is
estimated using three lags of the endogenous variables, with this lag length selected using the
14 See Romer and Romer (2000) on the Fed’s informational advantage, and Christiano, Eichenbaum and Evans (1999) for discussion of timing-related identifying assumptions.

12
Akaike information criterion.15 The model also includes a time trend and dummy variables for
the months around 9/11, when consumer sentiment and the news index fell sharply but quickly
bounced back. Because the model is over-identified,16 we can check whether the restrictions
imposed on the matrix β0 are rejected by the data. The restrictions are not rejected by the
data at a 5% level, although relatively small changes in specification (such as including dummy
variables for other unusual times, like the October 1987 stock market crash) sometimes result
in them being rejected at 10%. Nonetheless, we proceed with the model as specified, on the
grounds that it is well-situated in the previous literature and yields highly sensible findings with
respect to responses of monetary policy to changes in economic conditions.17
SVAR results
As a preliminary check on the sensibility of the SVAR model, Figure 3 shows how the Federal
Funds rate is estimated to respond to one standard-deviation shocks in inflation,
unemployment and consumption (left column), and in turn how these variables are estimated
to respond to a one standard-deviation shock to the Federal Funds rate (right column). In all
graphs, dotted lines represent 95% confidence intervals. The estimated relationships between
these variables and the Federal Funds rate are clearly consistent with previous research using
SVAR approaches, as well as our general understanding of how monetary policy has been made
in the past 25-30 years.18 As shown in the left column of the figure, in response to a shock to
inflation or consumption, the Federal Reserve would increase the Federal Funds rate, whereas
15 Three lags were also selected according to the final prediction error. As a robustness check, we also estimated with model using different lag lengths (namely, one, two, and four as indicated by the Schwartz, Hannan-Quinn, and Maximum Likelihood criteria respectively). While some specific results differed somewhat according to the lag length selected, general patterns of findings are common across specifications. 16 Identification requires the imposition of (n2+n)/2=28 restrictions on β0. n of these restrictions can be obtained by assuming that the diagonal elements of β0 are equal to unity (via normalization), which leaves n(n–1)/2=21 required restrictions. Because the zero restrictions described above imply 33 off-diagonal restrictions, the model is over-identified. 17 Note also that alternative over-identifying restrictions which are slightly different but similarly sensible (e.g. letting stock prices affect consumption directly, rather than via economic news) yield results that are qualitatively similar to those presented here, although depending on the precise specification they are more likely to be rejected at a 5% level than the model presented here. 18 See Christiano, Eichenbaum and Evans (1999).

13
a shock to unemployment would be followed by a rate reduction. As shown in the right column,
responses to rate shocks also follow expected profiles: the inflation rate would fall, the
unemployment rate would rise, and consumption spending would decline, where all of these
effects are temporary. Thus, the model has the advantage of reproducing expected features
the monetary-policy problem.19
Turning to our extensions of the standard SVAR, Figure 4 shows how the news variable reacts to
the different shocks. As would be expected, shocks to inflation, unemployment, and the
Federal Funds rate cause the news index to move down, i.e. they reduce reporting of good
news and/or increase reporting of bad news. Shocks to stock prices have a significant positive
effect on reporting of good news that tapers down over the following several months. In
contrast, shocks to consumer sentiment and consumption have small, positive but fleeting
effects on reporting of good news, suggesting that attention to these news items is not
widespread in the general public. From the SVAR’s variance decomposition, given in Table 1, it
can be seen that shocks to stock prices account for the single largest share of forecast error in
the news equation, apart from the good amount of the variance associated with the news
variable itself. Taken together, these findings suggest that the news index moves in expected
ways with changes in economic conditions, but also has a good amount of independent
movement to it.
Figure 5 shows how consumer sentiment reacts to shocks in the other variables in the model.
Certainly shocks to economic news play an important role in sentiment fluctuations:
unexpectedly good news has a small, but positive and significant effect on sentiment that takes
over 10 months to fade out. Sentiment also moves in expected ways in response to shocks to
19 Of course, as Faust (1998) and Uhlig (2005) discuss, this is not a grounds for declaring a model to be valid, as such reasoning would be circular. Nonetheless, given that the present paper’s contribution relates to embedding the sentiment/consumption relation in a standard framework for analyzing monetary policy, it is desirable for the model to reproduce its findings.

14
the other variables: inflation, unemployment, and interest rate shocks drive it down, while
shocks to stock prices drive it up; a consumption shock has a small, but quite fleeting positive
effect. Looking at the variance decomposition (Table 1), news shocks have the single-largest
effect in the variance of forecast error for sentiment, accounting for about one-third of it at a
6-month horizon, tapering down to about ¼ of it at a 3-year horizon. This finding suggests that,
especially in the short-run, non-fundamental shocks to news coverage –- that is, media
portrayals of economic conditions more or less favorable than would be implied by the
incoming economic data -– have non-negligible effects on sentiment, which may potentially in
turn affect the pace of consumer spending.
Figure 6, then, addresses the questions as to whether unduly positive or negative portrayals of
economic conditions, relative to quantitative measures of economic conditions, have
significant aggregate effects, and whether shocks to sentiment still affect spending after the
influence of news coverage is filtered out. As shown in row (a) of the table, the SVAR results
suggest that non-fundamental shifts in news coverage have small, but significant aggregate
effects: a one standard-deviation shock to the news index tends to be followed by a 1/10
percentage point decline in the unemployment rate which phases in over the next year and
fades away thereafter. It also causes a pick-up in consumer spending of approximately 1/10
percentage point which has the same kind of time profile, and an increase in the Federal Funds
rate occurring some 3-5 months after the news shock occurs. News shocks generally play quite
a small role in forecast errors for these variables, with the exception of the unemployment
rate: news shocks account for about ¼ of the variance in its forecast error over a 12-24 month
time horizon, dwindling down thereafter. Taken together, these results suggest that, indeed,
exogenous shifts in how favorably the media portray changes in economic conditions have
modest and transitory but significant macroeconomic effects.
The question remains whether sentiment effects on spending remain after we filter out shifts
in sentiment due to exogenous shifts in news coverage. The relevant SVAR results, shown in

15
row (b) of Table 5, suggest that the answer is yes. Positive shocks to sentiment have a small
but significant positive effect on consumer spending: a one standard-deviation shock to the
sentiment index that persists indefinitely boosts consumer spending by 1/10 percentage point,
with the effect persisting over a 3-year horizon. The finding of a small positive and significant
‘sentiment effect’ on spending remains in line with the vast body of research on this subject
(Carroll, Fuhrer, and Wilcox 1994; Ludgivson 2004), even though our model filters out effects of
news shocks and differs from previous work by situating sentiment changes in the monetary-
policy problem. The SVAR results also suggest that monetary policy reacts to expansionary
tendencies that result from sentiment shocks: Some 3-5 months after a one standard-deviation
shock to sentiment, the Federal Reserve raises the Federal Funds rate by about 20 basis points,
with the rate hike phasing out thereafter.
Given the sentiment effect on spending, we might expect the higher consumer spending due to
the sentiment shock to contribute to lower unemployment and/or higher inflation. However,
the SVAR results show no significant effect on unemployment, and a small but anomalously
negative effect on inflation. In interpreting this result, it is important to recognize that
sentiment shocks in the present model are assumed to be orthogonal to shocks due to non-
fundamental changes in news –- that is, if sentiment rose by more than would seem warranted
by measured changes in economic conditions, the rise would not be attributed to a sentiment
shock unless it could not be traced to news coverage being “too positive” relative to underlying
changes in conditions. The influence of the news index here can be seen by re-estimating the
SVAR without it, but otherwise using similar identifying assumptions.20 In this case, the
estimated effects of a sentiment shock are qualitatively the same as those of a news shock in
the main SVAR model: it boosts consumption, lowers unemployment, and induces an increase in
the Federal Funds rate, while having no significant effect on inflation. The difference between
this result and the one shown in Figure 6 suggests that shifts in sentiment resulting neither
20 In this case we allow the stock market to have a concurrent direct effect on sentiment and consumption (rather than working indirectly via the economic news).

16
from changes in fundamentals nor from non-fundamental changes in news coverage tend to be
slightly deflationary, whereas those coming from non-fundamental factors generally are not.
Conceivably, this may reflect some tendency for producers to exercise restraint in pricing when
responding to a pick-up in consumer spending coming from something other than improving
fundamentals and/or a broad shift in public perceptions of how the economy is doing.
Conclusions
To summarize, this study has three main findings. First, ‘news shocks’ –- that is, instances
when news portrayals of economic conditions move unexpectedly relative to incoming
economic data –- are important in explaining short-term fluctuations in consumer sentiment,
accounting for 1/3 of the variance of its forecast error at a 6-12 month horizon. Second, even
after effects of news shocks on sentiment are filtered out, shocks to consumer sentiment
continue to have a small positive effect on consumer spending. And third, news shocks also
have aggregate effects, tending to boost consumption and lower unemployment by modest
amounts in the months after they occur, but where these effects are strictly temporary.
These results are consistent with those of other studies finding a statistically significant role of
non-fundamental factors in short-term aggregate fluctuations. Oh and Waldman (1990) found
that ‘false announcements’ –- data on leading indicators that were subsequently revised, and
so can be interpreted as expectational shocks –- explain more that 20% of fluctuations in
growth in industrial production at a quarterly frequency. Also using quarterly data, Matsusaka
and Sbordone (1995) found that consumer sentiment Granger-causes aggregate output, and
that non-fundamental shifts in sentiment explain 13% to 26% of output fluctuations in a
reduced-form VAR. Salyer and Sheffrin (1997) used financial market data to recover ‘belief
shocks’, and showed that they have incremental predictive power for macroeconomic time
series. Chauvet and Guo (2003) analyzed effects of non-fundamental movements in both
consumer and business sentiment, where the latter is measured via the rate of business
formation; their results suggest that non-fundamental changes in sentiment have been quite

17
important around business-cycle turning points, with unduly bearish attitudes playing non-
trivial roles in the 1969-70, 1973-75, and 1981-82 recessions.21
The paper’s results are potentially of interest for recent empirical work using dynamic
stochastic general equilibrium (DSGE) models, in which ‘preference shocks’ are found to
account for sizable shares of output fluctuations in the short-run, especially in the U.S. (Smets
and Wouters 2007). In the context of DSGE models, such shocks are interpreted as shifts in
parameters governing inter-temporal substitution or habit persistence, although given how
generically specified they are, it is possible that they capture other ‘preference-related’
sources of exogenous variation in consumer spending instead or as well. The present paper’s
findings are also relevant to recent theoretical debates about the role of sunspots in real
business cycle (RBC) models. In the literature following from Farmer and Guo (1994), it has
been shown that RBC models with indeterminate equilibria and non-fundamental demand
shocks can match observed patterns in macroeconomic data relatively well, and much more
compellingly than traditional RBC models (see, e.g. Wen 1998, Benhabib and Wen 2004). Of
course, the present paper is not informative with respect to the key question of whether
contemporary economies have indeterminate equilibria (McCallum 2003, Lubik and Schorfheide
2004, Duffy and Xiao 2007). But it does suggest that more should be done to explore the
dynamics of the multiple types of non-fundamental factors –- among consumers, businesses,
and financial markets, and in information, expectations, and ‘mood’ –- that seem to be at work
in aggregate fluctuations at business cycle frequencies.
21 For contrary evidence, however, see Choy, Leong and Tay (2006).

18
Table 1. Share of variance of forecast errors at various horizons associated with shocks to:
Endog. variable: Months Inflation Unempl. Cons. News Sent. Stock
price FF rate
6 89.0 4.9 0.9 0.2 2.2 1.1 1.6
12 77.3 5.6 3.5 1.3 8.0 2.6 1.6 24 58.1 4.2 10.5 2.5 11.9 4.1 8.8
Inflation
36 47.4 3.6 16.9 2.5 10.6 4.1 14.8
6 0.4 77.9 1.5 12.5 1.5 3.1 3.3 12 1.1 53.5 1.8 23.8 1.3 6.6 12.0 24 8.0 34.9 1.3 25.8 2.0 6.6 21.4
Unempl.
36 17.8 28.1 1.5 22.5 4.0 5.3 20.7
6 1.7 0.0 77.6 3.9 6.9 5.6 4.3 12 5.0 0.2 65.6 6.0 10.2 5.7 7.2 24 14.9 1.5 50.0 5.5 16.6 4.3 7.3
Cons.
36 22.4 2.5 39.8 4.3 22.1 3.3 5.7
6 2.8 3.8 0.8 65.1 1.6 22.3 3.6 12 4.7 3.5 1.3 62.5 2.6 21.1 4.4 24 5.8 4.1 4.8 57.6 2.8 19.9 5.1
News
36 5.6 3.8 7.5 53.8 2.7 18.8 7.7
6 8.7 4.1 0.9 32.9 40.5 10.1 2.8 12 13.6 4.0 0.8 31.1 39.1 8.9 2.6 24 19.0 3.5 2.9 26.9 38.0 7.4 2.4
Sent.
36 19.0 3.4 6.8 24.5 35.8 6.9 3.6
6 1.5 0.5 2.9 1.1 0.5 92.0 1.6 12 1.6 0.5 3.0 1.3 0.5 91.7 1.6 24 1.6 0.5 3.1 1.3 0.5 91.4 1.6
Stock price
36 1.6 0.6 3.2 1.3 0.5 91.3 1.6
6 2.0 12.0 1.1 4.1 8.2 3.1 69.4 12 5.3 14.8 1.3 10.1 8.5 5.9 54.0 24 10.1 15.6 1.7 14.2 7.1 8.0 43.2
FF rate
36 10.9 14.8 2.6 14.2 7.3 8.2 42.0

19
Figure 1. Share of respondents mentioning given types of economic news Favorable mentions
Unfavorable mentions
Data source: University of Michigan, Surveys of Consumers.

20
Figure 2. Consumption, sentiment and economics news
-4
-2
0
2
4
-2
0
2
4
6
8
78 80 82 84 86 88 90 92 94 96 98 00 02 04 06
news index (solid)sentiment index (dotted)
% change in consumption (dashed)
Notes: News and sentiment indexes are normalized. Left scale for sentiment and news indexes, right for % change in consumption.

21
Figure 3. Responses of Federal Funds rate to macro shocks, and responses of macro variables to Federal Funds rate shocks
Response of FF to inflation shock Response of inflation to FF shock
-.4
-.2
.0
.2
.4
.6
.8
5 10 15 20 25 30 35
-.3
-.2
-.1
.0
.1
.2
.3
.4
.5
5 10 15 20 25 30 35
Response of FF to unemployment shock Response of unemployment to FF shock
-.4
-.2
.0
.2
.4
.6
.8
5 10 15 20 25 30 35
-.15
-.10
-.05
.00
.05
.10
.15
.20
5 10 15 20 25 30 35
Response of FF to a consumption shock Response of consumption to FF shock
-.4
-.2
.0
.2
.4
.6
.8
5 10 15 20 25 30 35-.003
-.002
-.001
.000
.001
.002
.003
.004
.005
5 10 15 20 25 30 35
Notes: Shocks are one standard-deviation changes. Horizontal axes show months since the shock. Dotted lines are 95% confidence intervals.

22
Figure 4. Response of news index to various shocks
Inflation Unemployment
-8
-4
0
4
8
12
5 10 15 20 25 30 35
-8
-4
0
4
8
12
5 10 15 20 25 30 35
Consumption Sentiment
-8
-4
0
4
8
12
5 10 15 20 25 30 35
-8
-4
0
4
8
12
5 10 15 20 25 30 35
Stock price Federal Funds rate
-8
-4
0
4
8
12
5 10 15 20 25 30 35
-8
-4
0
4
8
12
5 10 15 20 25 30 35
Notes: Shocks are one standard-deviation changes. Horizontal axes show months since the shock. Dotted lines are 95% confidence intervals.

23
Figure 5. Response of sentiment index to various shocks
Inflation Unemployment
-2
-1
0
1
2
3
4
5 10 15 20 25 30 35
-2
-1
0
1
2
3
4
5 10 15 20 25 30 35
Consumption News index
-2
-1
0
1
2
3
4
5 10 15 20 25 30 35
-2
-1
0
1
2
3
4
5 10 15 20 25 30 35
Stock price Federal Funds rate
-2
-1
0
1
2
3
4
5 10 15 20 25 30 35
-2
-1
0
1
2
3
4
5 10 15 20 25 30 35
Notes: Shocks are one standard-deviation changes. Horizontal axes show months since the shock. Dotted lines are 95% confidence intervals.

24
Figure 6. Effects of news and sentiments shocks on macro variables
EFFECTS OF NEWS SHOCKS ON: … inflation … unemployment … consumption … Federal Funds rate
-.3
-.2
-.1
.0
.1
.2
.3
.4
.5
5 10 15 20 25 30 35
-.15
-.10
-.05
.00
.05
.10
.15
.20
5 10 15 20 25 30 35
-.003
-.002
-.001
.000
.001
.002
.003
.004
.005
5 10 15 20 25 30 35
-.4
-.2
.0
.2
.4
.6
.8
5 10 15 20 25 30 35
EFFECTS OF SENTIMENT SHOCKS ON: … inflation … unemployment … consumption … Federal Funds rate
-.3
-.2
-.1
.0
.1
.2
.3
.4
.5
5 10 15 20 25 30 35
-.15
-.10
-.05
.00
.05
.10
.15
.20
5 10 15 20 25 30 35
-.003
-.002
-.001
.000
.001
.002
.003
.004
.005
5 10 15 20 25 30 35
-.4
-.2
.0
.2
.4
.6
.8
5 10 15 20 25 30 35
Notes: Shocks are one standard-deviation changes. Horizontal axes show months since the shock. Dotted lines are 95% confidence intervals.

25
References Acemoglu, Daron and Andrew Scott (1994). “Consumer Confidence and Rational Expectations: Are Agents' Beliefs Consistent with the Theory?” Economic Journal, vol. 104, no. 422 (Jan.), pp. 1-19 Benhabib, Jess and Roger Farmer (1999). “Indeterminacy and sunspots in macroeconomics.” In John Taylor and Michael Woodford, eds., Handbook of Macroeconomics, Vol. 1, pp. 387-448. _____________ and Yi Wen (2004). “Indeterminacy, aggregate demand, and the real business cycle,” Journal of Monetary Economics, Vol. 51, No. 3 (April), pp. 503–530. Bernanke, B. S. (1986). “Alternative Explanations of the Money-Income Correlation,” Carnegie- Rochester Conference Series, 25, pp. 49–100. Bernanke, B. S., and A. Blinder (1992). “The Federal Funds Rate and the Channels of Monetary Transmission,” American Economic Review, Vol. 82, No. 4, pp. 901–921. Berry, Stuart, and Melissa Davey (2004). “How Should We Think about Consumer Confidence?” Bank of England Quarterly Bulletin, vol. 44, no. 3 (Autumn), pp. 282-90. Blinder, Alan and Alan Krueger (2004). “What Does the Public Know about Economic Policy, and How Does It Know It?” Brookings Papers on Economic Activity, No. 1, pp. 327-397.
Blood, Deborah J. and Peter Phillips (1995). “Recession headline news, consumer sentiment, the state of the economy, and presidential popularity: A time series analysis, 1989-1993,” International Journal of Public Opinion Research, Vol. 7, No. 1, pp. 2-22.
Bryant, W. D. Anthony, and Joseph Macri (2005). “Does Sentiment Explain Consumption?” Journal of Economics and Finance, vol. 29, no. 1 (Spring), pp. 97-111. Burns, Lynette Sheridan (2002). Understanding journalism. London, Thousand Oaks: Sage Publications. Carroll, Christopher (2003). “Macroeconomic expectations of households and professional forecasters,” Quarterly Journal of Economics, Vol. 118, No. 1 (Feb.), pp. 269–298. _________________, Jeffrey Fuhrer, and David Wilcox (1994). “Does Consumer Sentiment Forecast Household Spending? If So, Why?”American Economic Review, vol. 84, no. 5 (Dec.), pp. 1397-1408. _________________, Misuzu Otsuka, and Slacalek (2006). “How Large is the Housing Wealth Effect? A New Approach.” Johns Hopkins University Working Paper (Oct.). Accessed electronically at http://econ.jhu.edu/people/ccarroll/papers/COS-WealthEffects.pdf (10/14/2007). Chauvet, Marcelle and Jang-Ting Guo (2003). “Sunspots, Animal Spirits, and Economic Fluctuations,” Macroeconomic Dynamics, vol. 7, no. 1 (Feb.), pp. 140-69
Choy, Keen Meng, Kenneth Leong and Anthony Tay (2006). “Non-fundamental expectations and economic fluctuations: Evidence from professional forecasts,” Journal of Macroeconomics, Vol. 28, Iss. 2 (June), pp. 446-460

26
Christiano, Lawrence, Martin Eichenbaum, and Charles Evans (1999). “Monetary Policy Shocks: What Have We Learned and To What End?” In John Taylor and Michael Woodford, eds., Handbook of Macroeconomics. Amsterdam: North Holland/Elsevier, pp. 65-148. Curtin, Richard (2002). “Surveys of Consumers: Theory, Methods, and Interpretation.” Paper presented at the 44th Annual Meeting of the National Association of Business Economists, Washington, DC (Sept.). Doms, Mark and Norm Morin (2004). “Consumer sentiment, the economy, and the news media.” Federal Reserve Board of Governors, FEDS working paper No. 2004-51. Duffy, John and Wei Xiao (2007). “Instability of sunspot equilibria in real business cycle models under adaptive learning,” Journal of Monetary Economics, Vol. 54, No. 3 (Apr.), pp. 879-903. Fair, Ray C. (2002). Predicting Presidential Elections and Other Things. Stanford, CA: Stanford University Press. Farmer, R. and J.T. Guo (1994). “Real business cycles and the animal spirits hypothesis,” Journal of Economic Theory, Vol. 63, pp. 42–72. Faust, Jonathan (1998). “The Robustness of Identified VAR Conclusions about Money,” Carnegie-Rochester Conference Series on Public Policy, Vol. 49, pp. 207–244. Fogarty, Brian (2005). “Determining economic news coverage,” International Journal of Public Opinion Research, Vol. 17, No. 2, pp.149-172 Goidel, Robert and Ronald Langley (1995). “Media coverage of the economy and aggregate economic evaluations: Uncovering evidence of indirect media effects,” Political Research Quarterly, Vol. 48 (June), pp. 313-28. Harrington, David (1989). “Economic News on Television: The Determinants of Coverage,” Public Opinion Quarterly, Vol. 53, Iss. 1 (Spring) pp. 17-41. Howrey, E Philip (2001). “The Predictive Power of the Index of Consumer Sentiment,” Brookings Papers on Economic Activity,” No. 1, pp. 175-207.
Jensen, Klaus Bruhn, ed. (2002). A Handbook of Media and Communication Research: Qualitative and Quantitative Methodologies. London and New York: Routledge.
Kurtz, Howard (1990). “Is the economy suffering from media malady?” Washington Post (Oct. 28), Section H, p. 1. Kwan, Andy, and John Cotsomitis (2006). “The Usefulness of Consumer Confidence in Forecasting Household Spending in Canada: A National and Regional Analysis,” Economic Inquiry, vol. 44, no. 1 (Jan.), pp. 185-97. Lubik, Thomas and Frank Schorfheide (2004). “Testing for indeterminacy: An application to U.S. monetary policy,” American Economic Review, Vol. 94, pp. 190–217. Ludvigson, Sydney C. (2004). “Consumer Confidence and Consumer Spending,” Journal of Economic Perspectives, vol. 18, no. 2 (Spring), pp. 29-50. _________, Sydney, Charles Steindel, and Martin Lettau (2002). “Monetary Policy Transmission through the Consumption-Wealth Channel.” New York Federal Reserve Economic Policy Review, Vol. 8, No. 1, pp. 117-133.

27
Matsusaka, John and Argia Sbordone (1995). “Consumer Confidence and Economic Fluctuations,” Economic Inquiry, vol. 33, no. 2 (Apr.), pp. 296-318. McCallum, Bennett (2003). “Multiple-solution indeterminacies in monetary policy analysis,” Journal of Monetary Economics, Vol. 50, No. 5 (July), pp. 1153-1175. Mehra, Yash and Elliot Martin (2003). “Why Does Consumer Sentiment Predict Household Spending?” Federal Reserve Bank of Richmond Economic Quarterly, Vol. 89, No. 4 (Fall), pp. 51-67. Mishkin, Frederic S (1978). “Consumer Sentiment and Spending on Durable Goods,” Brookings Papers on Economic Activity, No. 1, pp. 217-31. Mueller, Eva (1963). “Ten Years of Consumer Attitude Surveys: Their Forecasting Record,” Journal of the American Statistical Association, Vol. 58, No. 304. (Dec.), pp. 899-917. Oh, Seonghwan and Michael Waldman (1990). “The macroeconomic effects of false announcements,” Quarterly Journal of Economics, Vol. 105, No. 4 (Nov.), pp. 1017–1034 Project for Excellence in Journalism (2007). The State of the News Media, 2007: An Annual Report on American Journalism. Accessed electronically 10/14/2007 at http://www.stateofthenewsmedia.com/2007/ Romer, Christina and David Romer (2000). “Federal Reserve Information and the Behavior of Interest Rates,” American Economic Review, Vol. 90, No. 3, pp. 429–457. Salyer, Kevin and Steven M. Sheffrin (1998). “Spotting sunspots: Some evidence in support of models with self-fulfilling prophecies,” Journal of Monetary Economics, Vol. 42, No. 3 (Oct.), pp. 511-523 Smets, Frank and Rafael Wouters (2007). "Shocks and Frictions in US Business Cycles: A Bayesian DSGE Approach," American Economic Review, vol. 97, No. 3 (June), pp. 586-606. Stein, Herbert (1975). “Media Distortions: A Former Official’s View.” Columbia Review of Journalism, Vol. 13, No. 6, pp. 37–41. Uhlig, Harald (2005). "What are the effects of monetary policy on output? Results from an agnostic identification procedure," Journal of Monetary Economics, vol. 52, No. 2 (March), pp. 381-419. Weinstein, Michael (2002). "Economists and the Media," Journal of Economic Perspectives, Vol. 6, No. 3 (Summer), pp. 73-77. Wen, Yi (1998). “Capacity utilization under increasing returns to scale,” Journal of Economic Theory, Vol. 81, pp. 7–36. Wu, Denis, Robert Stevenson, Hsiao-Chi Chen and Nuray Guner (2002). “The Conditioned Impact of Recession News: A Time-Series Analysis of Economic Communication in the U.S., 1987-1996,” International Journal of Public Opinion Research, Vol. 14 (spring), pp. 19-36.

28
APPENDIX TABLE 1. Components of the Index of Consumer Sentiment Q1. "We are interested in how people are getting along financially these days. Would you say that you (and your family living there) are better off or worse off financially than you were a year ago?" Q2. "Now looking ahead--do you think that a year from now you (and your family living there) will be better off financially, or worse off, or just about the same as now?" Q3. "Now turning to business conditions in the country as a whole--do you think that during the next twelve months we'll have good times financially, or bad times, or what?" Q4. "Looking ahead, which would you say is more likely--that in the country as a whole we'll have continuous good times during the next five years or so, or that we will have periods of widespread unemployment or depression, or what?" Q5. "About the big things people buy for their homes--such as furniture, a refrigerator, stove, television, and things like that. Generally speaking, do you think now is a good or bad time for people to buy major household items?"

29
Appendix Table 2. Variable definitions and sources
Variable Definition Data source
INFL Percent change in the consumer price index, year-over-year Bureau of Labor Statistics
UNEMPL Unemployment rate Bureau of Labor Statistics
LPCE Log of total personal consumption expenditures, in billions of chained 2000 dollars Bureau of Economic Analysis
NEWS News index: Share of respondents mentioning favorable news, minus share mentioning unfavorable news, plus 100
University of Michigan, Survey of Consumers
SENT Index of Consumer Sentiment (see Appendix Table 1)
University of Michigan, Survey of Consumers
D(LSTK) Log change in the Dow Jones Industrial Average, month to month Dow Jones Corporation
FF Federal Funds rate Federal Reserve Board of Governors, H.15 statistical release
Note: The data are monthly and cover the period between Jan. 1978 and July 2006.