department of economics volatility gives rise to fear, greed, and ego farmers forum iii west point,...
TRANSCRIPT
Department of Economics
Volatility Gives Rise to Fear, Greed, and Ego
Farmers Forum IIIWest Point, Nebraska
February 11, 2009
Chad HartAssistant Professor/Grain Markets Specialist

Department of Economics
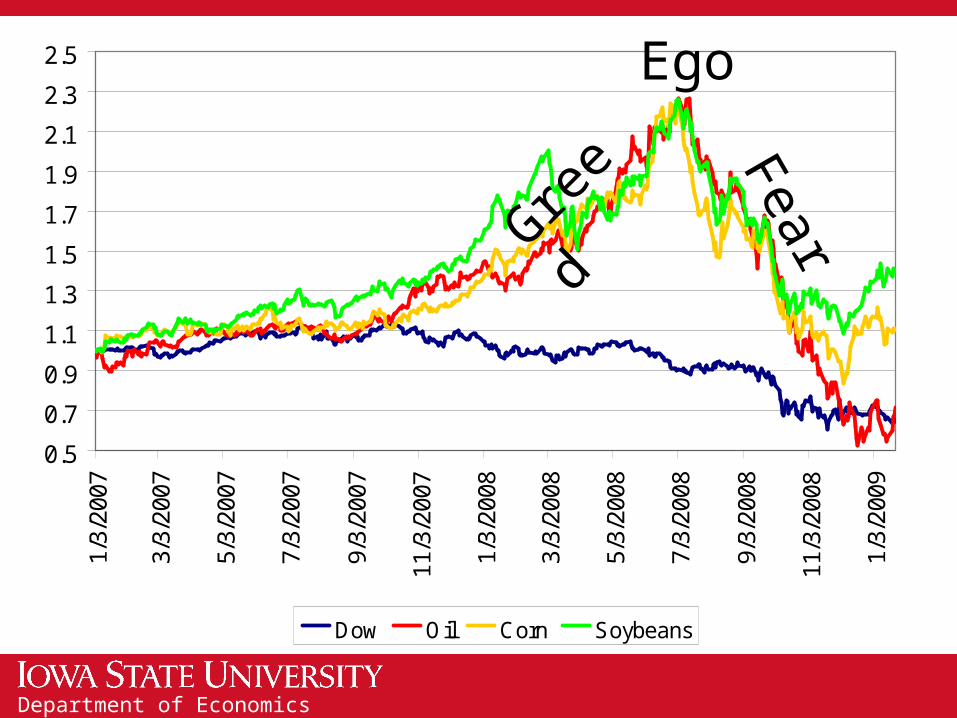
Price Shifts (Jan. 2007 = 1)
0.5
0.7
0.9
1.1
1.3
1.5
1.7
1.9
2.1
2.3
2.51
/3/2
00
7
3/3
/200
7
5/3
/200
7
7/3
/200
7
9/3
/200
7
11/3
/20
07
1/3
/200
8
3/3
/200
8
5/3
/200
8
7/3
/200
8
9/3
/200
8
11/3
/20
08
1/3
/200
9
Dow Oil Corn Soybeans

Department of Economics
Price Shifts (Sept. 2008 = 1)
0.30
0.40
0.50
0.60
0.70
0.80
0.90
1.009/2
/2008
9/9
/2008
9/1
6/2
008
9/2
3/2
008
9/3
0/2
008
10/7
/2008
10/1
4/2
008
10/2
1/2
008
10/2
8/2
008
11/4
/2008
11/1
1/2
008
11/1
8/2
008
11/2
5/2
008
12/2
/2008
12/9
/2008
12/1
6/2
008
12/2
3/2
008
12/3
0/2
008
1/6
/2009
1/1
3/2
009
1/2
0/2
009
Dow Oil Corn Soybeans

Department of Economics
Changes in Price Volatility
Source: Zulauf and Roberts, Ohio State

Department of Economics
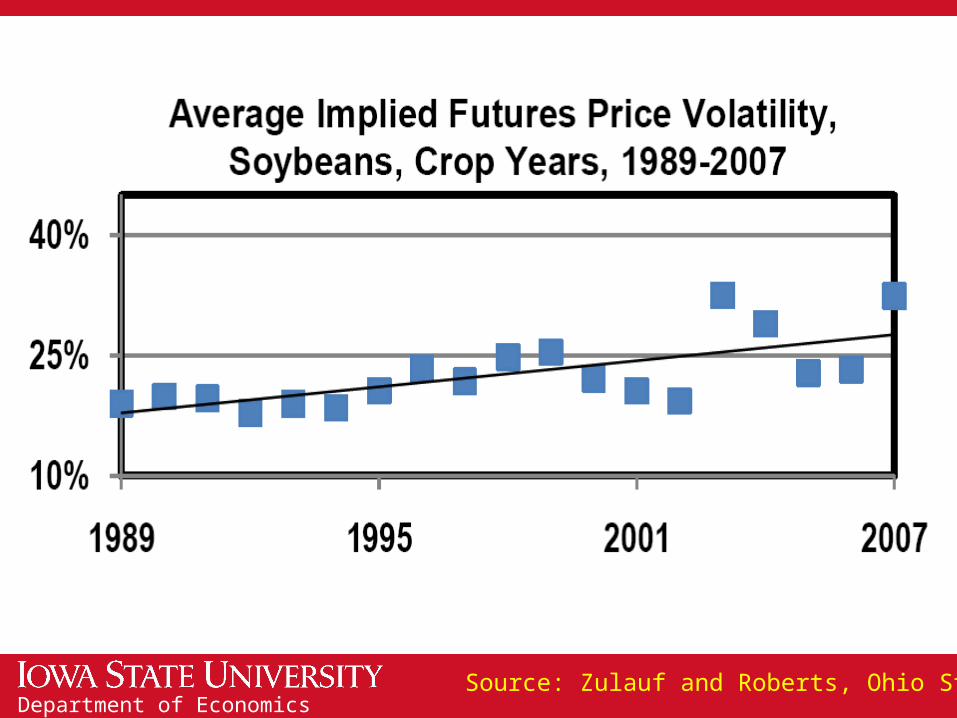
Historical Soybean Volatility Changes
Source: Zulauf and Roberts, Ohio State

Department of Economics
Historical Wheat Volatility Changes
Source: Zulauf and Roberts, Ohio State

Department of Economics
Overall Shift
Source: Zulauf and Roberts, Ohio State

Department of EconomicsSource: Zulauf and Roberts, Ohio State

Department of EconomicsSource: Zulauf and Roberts, Ohio State

Department of EconomicsSource: Zulauf and Roberts, Ohio State
Department of EconomicsSource: Zulauf and Roberts, Ohio State

Department of EconomicsSource: Zulauf and Roberts, Ohio State

Department of EconomicsSource: Zulauf and Roberts, Ohio State

Department of Economics
World Stocks-to-Use Ratios
0%
5%
10%
15%
20%
25%
Corn Soybeans Wheat

Department of Economics
World Wheat Stats
0
100
200
300
400
500
600
700
800
Mill
ion
me
tric
to
ns
Production Consumption

Department of Economics
World Corn Stats
0
100
200
300
400
500
600
700
800
900
Mill
ion
me
tric
to
ns
Production Consumption

Department of Economics
World Soybean Stats
0
50
100
150
200
250
Mill
ion
me
tric
to
ns
Production Consumption

Department of Economics
Factors Leading to Higher Commodity Prices
Source: USDA-ERS, Trostle, July 2008

Department of Economics
Population2008 2020 2050
(billion) (billion) (billion)World 6.678 World 7.601 World 9.393
China 1.330
China 1.431
India 1.808
India 1.148
India 1.362
China 1.424
U.S. 0.304 U.S. 0.336 U.S. 0.420Indonesia 0.238
Indonesia 0.268
Nigeria 0.357
Brazil 0.192
Brazil 0.212
Indonesia 0.313
Pakistan 0.168
Pakistan 0.204
Bangladesh 0.280
Bangladesh 0.154
Bangladesh 0.190
Pakistan 0.278
Russia 0.141
Nigeria 0.184
Brazil 0.228
Nigeria 0.138
Russia 0.132 Congo 0.189
Source: U.S. Bureau of the Census

Department of Economics
Liquid Fuel Use
Source: EIA, International Energy Outlook 2007
2004 Million Barrels Oil Equivalent per Day
United States 20.7Canada 2.3Mexico 2.0Europe 15.6Japan 5.4China 6.4India 2.5Africa 2.8Central and South America 5.4World 82.5
2010 2015 2020 2025 2030 Percent of 2004 Value
103 109 115 121 129100 100 104 104 104110 115 130 135 145 99 99 100 101 101 96 96 96 96 96147 164 186 213 245108 128 144 160 176118 139 154 164 175120 137 152 167 180110 118 126 134 143

Department of Economics
Countries Pursuing BiofuelsUSBrazilArgentinaColombiaParaguayCanadaUruguayMexico
ThailandNew ZealandSouth AfricaSouth KoreaPhilippinesIndonesiaPakistanChina
IndiaMalaysiaAustraliaJapanEURussia
Not a complete list

Department of Economics
Iowa Corn Prices vs. Costs
Source: USDA-NASS and Duffy and Smith, http://www.extension.iastate.edu/agdm/crops/pdf/a1-21.pdf
0.00
0.50
1.00
1.50
2.00
2.50
3.00
3.50
4.00
4.50
5.00
$ pe
r B
ushe
l
Season-average Price Cost

Department of Economics
Iowa Soybean Prices vs. Costs
Source: USDA-NASS and Duffy and Smith, http://www.extension.iastate.edu/agdm/crops/pdf/a1-21.pdf
0.00
2.00
4.00
6.00
8.00
10.00
12.00
$ pe
r B
ushe
l
Season-average Price Cost
Department of Economics
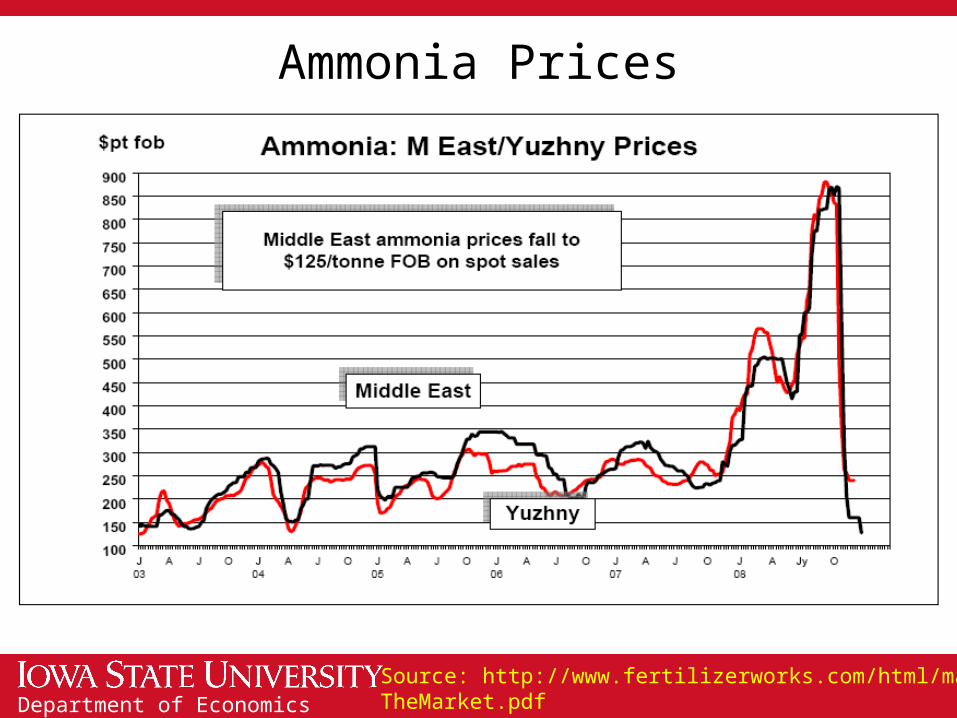
Ammonia Prices
Source: http://www.fertilizerworks.com/html/market/TheMarket.pdf
Department of Economics
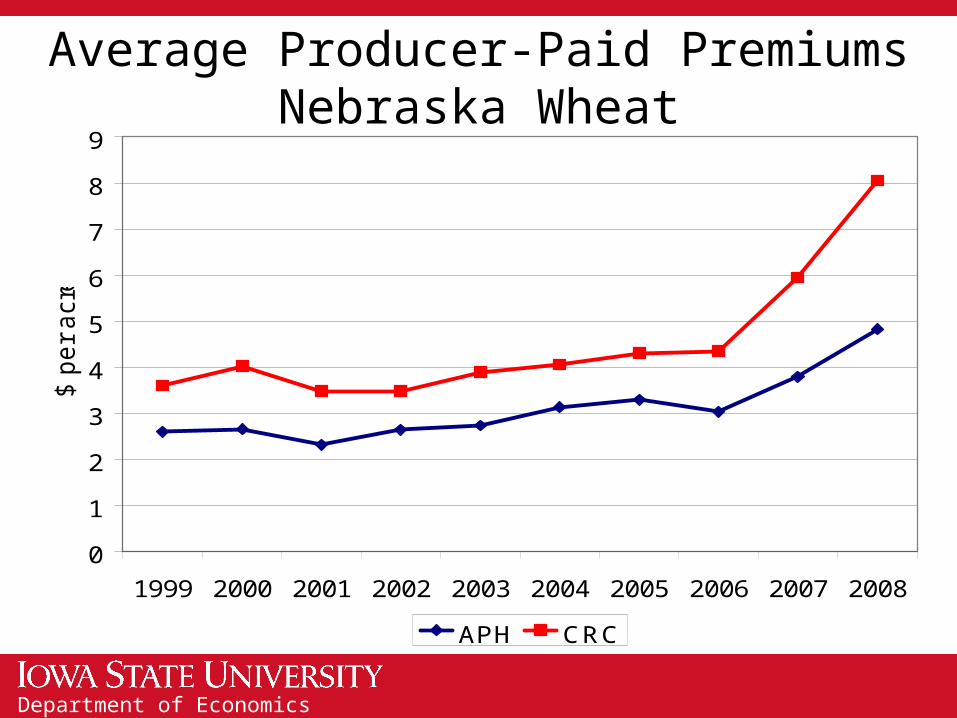
Average Producer-Paid PremiumsNebraska Wheat
0
1
2
3
4
5
6
7
8
9
1999 2000 2001 2002 2003 2004 2005 2006 2007 2008
$ p
er
acre
APH CRC
Department of Economics
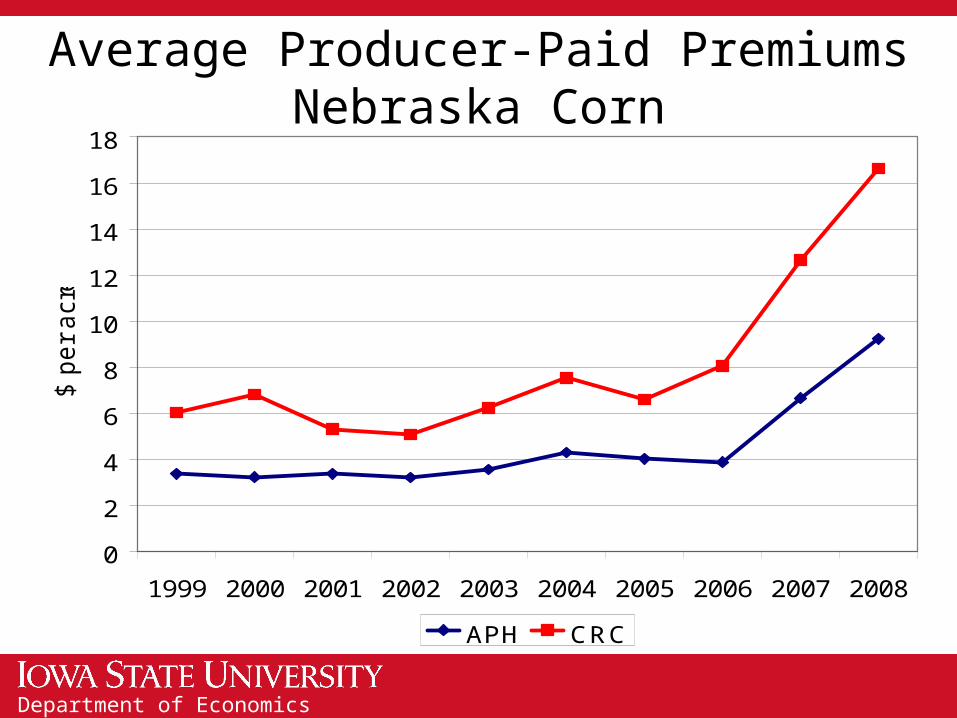
Average Producer-Paid PremiumsNebraska Corn
0
2
4
6
8
10
12
14
16
18
1999 2000 2001 2002 2003 2004 2005 2006 2007 2008
$ p
er
acre
APH CRC

Department of Economics
Average Producer-Paid PremiumsNebraska Soybeans
0
2
4
6
8
10
12
14
1999 2000 2001 2002 2003 2004 2005 2006 2007 2008
$ p
er
acre
APH CRC

Department of Economics
Fear, Greed, and EgoFear of making a bad decision
-- Watching prices slip away as you wait
Greed of expecting even higher prices-- Not taking advantage of good price opportunities
Ego of wanting to claim you caught the market high-- “Lake Wobegon” marketing
Much of the following discussion comes from the online Advanced Grain Marketing course from Iowa State University
Department of Economics
0.5
0.7
0.9
1.1
1.3
1.5
1.7
1.9
2.1
2.3
2.5
1/3/
2007
3/3/
2007
5/3/
2007
7/3/
2007
9/3/
2007
11/3
/200
7
1/3/
2008
3/3/
2008
5/3/
2008
7/3/
2008
9/3/
2008
11/3
/200
8
1/3/
2009
Dow Oil Corn Soybeans
Greed Fear
Ego

Department of Economics
Marketing PlanTo avoid fear, greed, and ego dominating your marketing, have a plan and stick to it.
A marketing plan outlines your market strategy and your marketing objectives.
It should examine marketing opportunities before and after harvest.

Department of Economics
Marketing Objectives
Get the highest selling pricePretty tough to doMore realistic objective: Obtain better than average prices
Reduce price risk
Cover cash flow needs
Minimize tax liability
Look at short and long-term goals for your business
Department of Economics
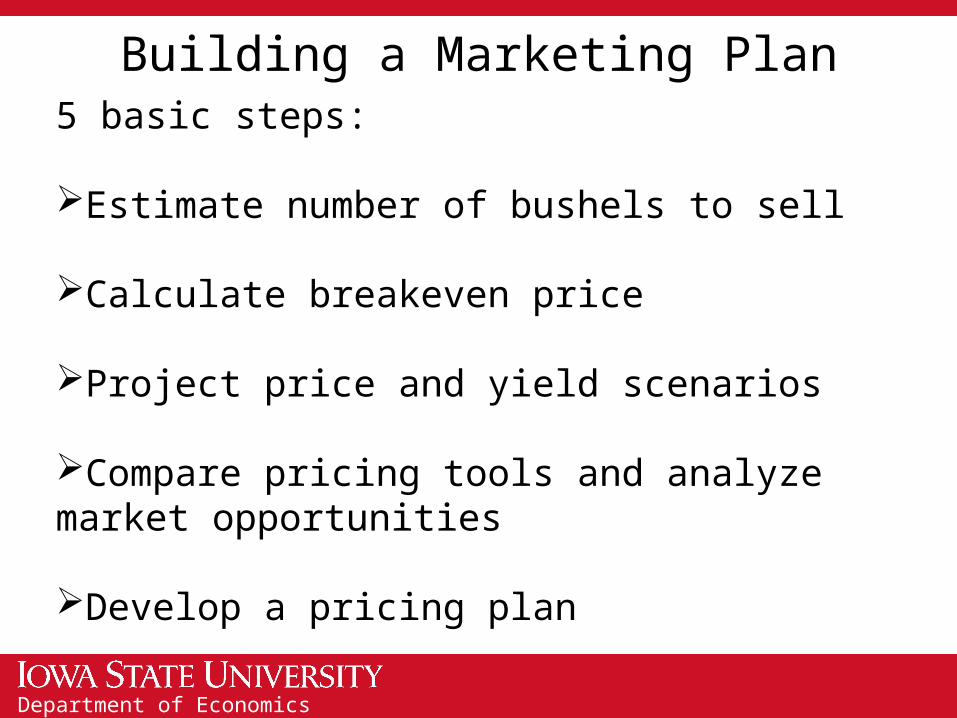
Building a Marketing Plan5 basic steps:
Estimate number of bushels to sell
Calculate breakeven price
Project price and yield scenarios
Compare pricing tools and analyze market opportunities
Develop a pricing plan

Department of Economics
Bushels to SellWhat’s your expected production?What do you have in storage?What about on-farm use?
Breakeven CostsWhat are your production costs?What are your storage costs?
On-farm vs. off-farm?What are your cash flow needs?

Department of Economics
ScenariosSeasonal price trendsWeather outlookExport pictureLivestock outlook
Tools and OpportunitiesMarket tools: Futures, options, forward contractsGovernment tools: Crop insurance, marketing loans, CCP/ACRE
Department of Economics
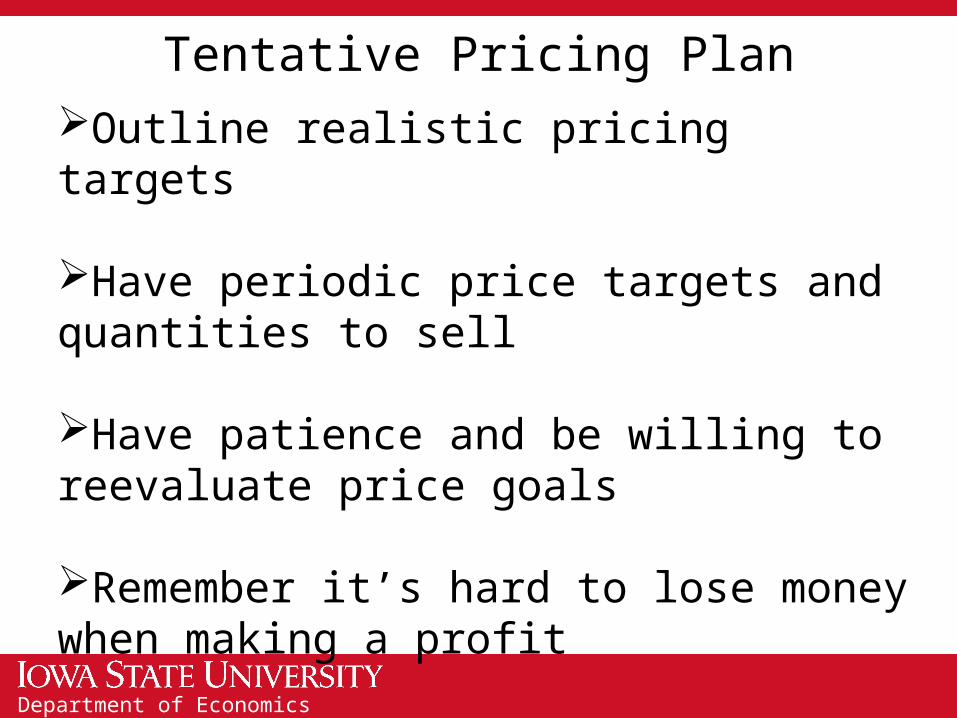
Tentative Pricing PlanOutline realistic pricing targets
Have periodic price targets and quantities to sell
Have patience and be willing to reevaluate price goals
Remember it’s hard to lose money when making a profit
Department of Economics
Some ExamplesUniversity of Nebraska:“Achieving Success with a Business Plan: Case Study to Prepare a Grain Farm Business Plan (CC424)
University of Missouri:http://extension.missouri.edu/explore/agguides/agecon/g00600.htm
Purdue University:http://www.agecon.purdue.edu/extension/sbpcp/resources/mrktplan.xls
AgRisk website:http://www.agrisk.umn.edu/library1/a0000037.pdf

Department of Economics
Thank you for your time!
Any questions?
My web site:http://www.econ.iastate.edu/faculty/hart/
Iowa Farm Outlook:http://www.econ.iastate.edu/outreach/agriculture/periodicals/ifo/
Ag Decision Maker:http://www.extension.iastate.edu/agdm/