department of economics, ucsb - uci
TRANSCRIPT

Department of Economics, UCSBDepartmental Working Papers
(University of California, Santa Barbara)
Year Paper ↩
One Chance in a Million: Altruism and
the Bone Marrow Registry
Ted C. Bergstrom ∗ Rod Garratt †
Damien Sheehan-Connor ‡
∗University of California, Santa Barbara†University of California, Santa Barbara‡UCSB
This paper is posted at the eScholarship Repository, University of California.
http://repositories.cdlib.org/ucsbecon/dwp/3-07
Copyright c©2007 by the authors.

One Chance in a Million: Altruism and
the Bone Marrow Registry
Abstract
Transplants of donated stem cells save the lives of many patients with blooddiseases. Donation is somewhat painful, but rarely has lasting adverse effects.Patients can accept transplants only from donors with compatible immune sys-tems. Those lacking a sibling match must seek donations from the populationat large. The probability that two persons of the same race are compatibleis less than 1/10,000. Health authorities maintain a registry of several milliongenetically-tested potential donors who have agreed to donate if asked. Westudy the peculiar structure of voluntary public good provision represented bythe registry, and compare the marginal benefits and marginal costs of expandingthe registry.

One Chance in a Million: Altruism and the Bone
Marrow Registry
Ted Bergstrom, Rod Garratt, and Damien Sheehan-Connor1
September 4, 2007
1The authors are grateful to Anna Albergini, Linda Melnick, Marco Sahm, andGary Saxonhouse for helpful remarks and suggestions and to Martin Maiers andStephen Spellman of the National Marrow Donor Program for information and usefuladvice.

Abstract
Transplants of donated stem cells save the lives of many patients with blooddiseases. Donation is somewhat painful, but rarely has lasting adverse effects.Patients can accept transplants only from donors with compatible immune sys-tems. Those lacking a sibling match must seek donations from the populationat large. The probability that two persons of the same race are compatibleis less than 1/10,000. Health authorities maintain a registry of several milliongenetically-tested potential donors who have agreed to donate if asked. Westudy the peculiar structure of voluntary public good provision represented bythe registry, and compare the marginal benefits and marginal costs of expandingthe registry.

Introduction
For patients who suffer from leukemia or other blood diseases, a stem cell trans-plant frequently offers the best chance of survival. Such a transplant is likely tobe a life saving event. According to the web site of the London Health SciencesCenter [9]
“Long-term survival may be greater than 80 per cent, . . . depend-ing on the type of disease treated, the patient’s age, and the severityof illness. For patients with acute leukemia, long-term survival is50-60 per cent but this is much better than 20-25 per cent survivalwhen patients are treated with chemotherapy alone. . . . recipientseventually return to a normal lifestyle.”
The most effective treatment for many blood diseases is radiation that de-stroys all blood cells in the body, both diseased and healthy. The blood cellsmust then be replaced with healthy ones. This is accomplished by transplantingblood-forming stem cells from a healthy donor whose immune system is compat-ible with that of the recipient. Finding a compatible stem cell donor is vastlymore difficult than finding a match for blood donation. The blood type that hasthe fewest compatible donors (O negative) can accept transfusions from aboutseven percent of the population.1 For stem cell donations, one’s best chance ofa match is a brother or sister. The probability that two siblings are acceptablematches is one-fourth. The chance of a match with a relative other than a sib-ling is very small. Patients who lack a genetically compatible sibling generallymust seek a match from the population at large. People of the same race aremore likely to be a match than those of different races, but the probability of amatch between two randomly selected persons of the same race is less than onein ten thousand.
Over the past twenty years, a remarkable set of institutions has been devel-oped for matching needy patients with compatible donors. (See McCullough etal [25] and Fisher [17] for discussions of the history of bone marrow registriesin the United States.) The United States National Marrow Donor Program(NMDP) began to operate in 1986 and currently maintains a registry of more
1Roth, Sonmez, and Unver, [34] report that kidney donations require the same compatibil-ity between donor and receiver as blood donations, with the additional complication that somepatients have preformed antibodies against one of the donor’s proteins. Although compatiblepairs for kidney donation are orders of magnitude more common than compatible pairs forstem cell donation, the costs to the donor are far greater, and people are much less likelyto be willing to donate a kidney to save a stranger’s life than to contribute bone marrow.Though few would sacrifice a kidney for a stranger, many are willing to do so for a loved one.Roth et al devised ingenious exchange networks to facilitate multilateral kidney trades thatallow people to donate kidneys for the benefit of specific patients with whom they are notthemselves donor-compatible.
2

than six million potential donors whose type has been determined. The NMDPnow includes approximately 1.5 million registrants from the German Bone Mar-row Registry (DKMS) and smaller numbers from the registries of Sweden, Nor-way, the Netherlands, and Israel. Other countries have national registries thatare not incorporated in the NMDP, but are at least partially linked by a world-wide clearing house. There are approximately eleven million registrants in bonemarrow registries throughout the world. Those who join a registry must expresstheir willingness to make a stem cell donation if someone of their type shouldneed a transplant. At the time of registration, a saliva sample is collected fromthe potential donor for DNA testing. The outcome of the test is stored alongwith the donor’s contact information.
The existence of bone marrow registries raises interesting questions aboutthe prevalence and nature of altruistic behavior. The matching technology ofstem cell donations poses a rather unusual and interesting “free-rider problem.”Given the large size of the current registry, a potential registrant can reasonablyconclude that there is a good chance that someone of his type is already presentin the registry. If so, his own contribution would simply replace that of anotherregistered potential donor. In this paper, we explore the incentive problemthat arises for a thoughtful potential donor who is deciding whether to join theregistry.
Joining the registry is painless and takes little time. Making a donation isa more serious matter. There are two major alternative procedures by whichstem cells can be contributed.2 The more traditional method is a bone marrowtransplant. Bone marrow is “harvested” from the donor’s pelvis by means ofinsertions of a large needle that reaches the center of the bone. This operationis performed under general or regional anesthesia. A more recently developedprocedure transfers stem cells collected by a filtering process from the donor’sbloodstream. This process, known as peripheral blood stem cell (PBSC) dona-tion, requires the same type of genetic match as marrow transplants. Before thetransfer, the donor is given a drug that produces a higher-than-normal numberof stem cells in the bloodstream. This procedure does not require anesthesia.Both procedures impose serious inconvenience and discomfort, along with tem-porary side effects.3 Neither procedure is likely to have long term health effects
2A third source for stem cells is umbilical cord blood collected from newborns’ placentasat delivery. Cord blood storage is unlikely to replace the bone marrow registry on a largescale because it is dramatically more expensive to store frozen cord blood than to store dataabout potential donors. The number of cord blood units stored is less than one percent of thenumber of people in the bone marrow registry.
3According to the NMDP web site, “Marrow donors can expect to feel some soreness intheir lower back for a few days or longer... Some may take two to three weeks before they feelcompletely recovered.” According to the German bone marrow registry web site, “Pain usuallyoccurs directly after collection and can vary greatly in duration and intensity. The feeling is
3

on the donor.Everyone in society faces a risk that at some time they or a loved one will
need a stem cell transplant. The bone marrow registry is a public good thatincreases everyone’s probability of finding a suitable donor in case of need. Asthe number of people in the registry increases, there is a diminishing probabilitythat an additional registrant adds to the number of distinct types represented inthe registry. Eventually, the value of marginal benefits from adding a registrantwill fall below the marginal cost. This paper includes a benefit-cost analysis inwhich we estimate the marginal value of lives saved from adding an additionalregistrant of specified race, and compare this benefit to the marginal cost. Foreach race, we also estimate the optimal number of registrants and compare theseto existing numbers.
Our results suggest a strong case for increasing the number of persons ofall races in the registry, with the greatest net benefit from additional AfricanAmericans. This leads us to inquire whether a sufficiently large registry can bemaintained on a purely voluntary basis, and to consider alternative mechanismsfor increasing the size of the registry. To approach this problem we consider themotives that lead people to join the registry and to contribute if asked.
Some Genetic Background
The body’s immune system uses proteins known as human leukocyte antigens(HLA) to distinguish cells that belong to the body from those that do not. Astem cell transplant is likely to be successful only if the donor’s HLA type issufficiently close to that of the recipient. The probability that two randomlyselected individuals are HLA compatible is less than one in ten thousand.
A person’s HLA type is determined by genes located on chromosome 6, onecopy of which is inherited from each parent. The current medical standard foran HLA match focuses on the specific contents, or alleles, of the genes HLA-A,HLA-B, and HLA-DRB1.4 Two siblings have matching HLA types with prob-ability one-fourth, since they match only if they both inherit the same version
often described as if you had banged into a table leg.” According to the NMDP, PBSC donorsoften experience bone pain and flu-like symptoms, as well as occasional insomnia, headaches,fatigue, nausea, and vomiting.
4Some medical centers seek “higher-resolution” matches, based on additional genes of theHLA family. The genetic data available to us is only at the resolution level of the three genesmentioned. Most available data on the effectiveness of transplants is based on the experienceof matches at the three-gene level. If more rigorous matching standards lead to improvedoutcomes, then the benefits from increasing the size of the registry will be greater than thosethat we have calculated. Until medical evidence of the effectiveness of higher resolutionmatches becomes available, our estimates serve as a useful lower bound on the value of anincreased registry.
4

of chromosome 6 from each parent. A specified combination of three alleles onone chromosome is known as a haplotype. An individual’s HLA compatibilityis determined by the full list of six alleles on her two copies of chromosome 6.This is known as her phenotype. At the level of resolution used for donor match-ing, there are several thousand possible haplotypes and about twenty millionpossible phenotypes.
We obtained data on the population distribution of HLA types from a studyby Motomi Mori et al [28], which is based on a sample of about 400,000 indi-viduals who were registered with the National Marrow Donor Program in 1995and whose HLA-A,-B,-DR phenotypes were recorded. The distribution of HLAtypes is markedly different across races, and sample observations have accord-ingly been partitioned into five racial groups: whites, African Americans, AsianAmericans, Hispanics, and Native Americans.
Because the sample is small relative to the number of possible phenotypes,direct estimation of the population distribution of phenotypes would not beeffective. However, with an elegant application of statistics and genetic the-ory, geneticists are able to exploit this data much more powerfully. Mori etal assume that within racial groups, mating is random with respect to HLAtype. With this assumption, they use the observed distribution of phenotypesto construct a maximum likelihood distribution of haplotypes for each of thefive racial groups. By this process, they assign non-zero estimated frequencies toabout eleven thousand haplotypes. With an estimate of haplotype frequenciesand the assumption of random mating within races, one is able to estimate thefrequency distributions of a large number of genetic types that are not directlyobserved in the sample. Our study uses the haplotype distribution publishedby Mori et al to reconstruct an estimate of the distribution of phenotypes ineach group.5 This process assigns positive probabilities to more than ten milliondistinct phenotypes.
Table 1 shows the probabilities by race that two randomly selected personswould have matching HLA types. Although two people are more likely to matchif they are of the same race, the probability of matches across races is not neg-ligible. The distribution of types is far from uniform. Some types are relativelycommon and some are extremely rare. The probability is about one in eleventhousand that two randomly selected white Americans are of matching types.But about half of the white population are of types that occur with frequencyless than one in one hundred thousand, and about one-fifth are in groups withfrequency less than one in a million. The African American population is even
5An individual’s phenotype is determined by the contents of his or her two haplotypes. Thedistribution of phenotypes is not the same as the distribution of haplotype pairs (genotypes)because phenotypes do not distinguish how alleles are divided between the two chromosomes.
5

Table 1: Probability of HLA Match by Race
White Afr Am Asian Am Hisp Nat AmWhite 1/11,000Afr Am 1/113,000 1/98,000Asian Am 1/223,000 1/1,310,000 1/29,000Hisp 1/44,000 1/259,000 1/254,000 1/34,000Nat Am 1/13,000 1/116,000 1/173,000 1/36,000 1/11,000
Notes: Probabilities are calculated with MatLab, using our construction of phenotype distri-bution for each race, based on the Mori estimates [28] of haplotype distribution.
more heterogeneous. The probability that two randomly selected African Amer-icans have matching types is less than one tenth of the corresponding probabilityfor two whites.
Benefit Cost Analysis
The welfare economics of the bone marrow registry is simplified and sym-metrized by a “veil of ignorance” that shrouds knowledge of our medical fu-tures. Nobody knows whether they or their loved ones will ever need a stemcell transplant. Hardly anyone knows whether they have a rare or a commonHLA type. Additions to the registry are public goods that benefit everyone byincreasing the probability that they can find a donor if one is needed.
Estimating Probabilities of Finding a Match
Our first step in measuring benefits is to estimate the effect of an additional reg-istrant of specified race on the probability that individuals who seek transplantswill find a match in the registry. We estimate this effect using the probabilitydistributions of HLA types by race that we constructed from the Mori data onthe distribution of haplotypes. Since there are about ten million types withnon-zero probabilities, the estimated probability distributions of HLA types arevectors with ten million components. This calculation is made possible by theremarkable computational power of MatLab.
A significant fraction of those listed in the bone marrow registry are notavailable to donate when called upon. Some registrants have moved withoutleaving forwarding addresses, some have health conditions that prevent themfrom donating, and some are no longer willing to contribute. The registry sizesthat we use to estimate probabilities of finding a match are “effective” registrysizes—estimated numbers of persons in the registry who are available, willing,
6

and able to donate if called. Kollman et al [23] supply statistics, by race, on thefraction of persons from the registry who were fully available when asked. Foreach race, Table 2 reports the number of persons in the registry, the effectivenumber in the registry, and the probability that a randomly selected memberof this race lacks an HLA-match in the registry.
Table 2: Registry size and probability of no match, by race, in 2006
Race Number in Fraction Effective No. ProbabilityRegistry Available in Registry of No Match
White 4,444,335 .65 2,888,818 .08Afr Am 485,791 .34 165,169 .38Asian Am 432,293 .44 190,209 .21Hisp 594,801 .47 279,556 .16Nat Am 70,781 .48 33,975 .11
Notes: Registration statistics are obtained from NMDP Registry and Transplant Statistics[31]. The published table includes 1.5 million registrants of “unknown” race. According tothe NMDP, almost all of these are recruited through international registries in Germany, theNetherlands, Sweden, Norway, and Israel, which do not collect information on race. Since theracial composition of these countries is almost entirely white, we count all of the unknownsas white. After 2002, the NMDP began to ask those listed as Hispanic, to also specifywhether they were white, African American, Asian American, or Native American. Thusrecent statistics on new registrations count Hispanic registrants twice. We have opted toretain the Hispanic classification and thus our figures include a correction for double countingin the other categories.
The probability that a person of a specified race will find a match in theregistry is calculated as follows. Let R be a vector listing the effective numberof persons of each of the five races, white, African American, Asian American,Hispanic, and Native American, in the registry. For each race x, Rx is thenumber of persons of race x in the registry. Let px
i be the fraction of thepopulation of race x that is of HLA type i. We assume that a person’s HLAtype does not influence the probability of joining the registry. The probabilitythat no type i’s are found among registrants of race x is the probability thatno type i’s are selected in Rx random draws from the population of race x.This probability is (1 − px
i )Rx . A registry with enrollment vector R containsno persons of type i if there are no type i’s among registrants of any race. Letp0
i (R) be the probability that a type i has no match in the registry when R isthe vector of registrants by race. Then
p0i (R) =
∏x
(1− pxi )Rx (1)
Let P 0x (R) be the probability that a randomly selected person of race x has
7

no match in a registry whose membership is described by the vector R. Thisprobability is
P 0x (R) =
∑i
pxi p0
i (R). (2)
Let us define Gxy(R) to be the increase in the probability that a randommember of race y has a match in the registry if one adds one registrant of racex to a registry of composition R. As we demonstrate in Appendix A,
Gxy(R) =∑
i
pyi px
i P 0i (R). (3)
It is interesting to see that Gxy(R) is symmetric in x and y. Thus, we knowthat the effect of adding a registrant of race x on the probability that a person ofrace y will find a match is the same as that of adding a registrant of race y on theprobability that a person of race x will find a match. Since we have estimatedthe type frequencies, px
i and pyi , for any two races x and y and the probabilities
P 0i (R) that a member of type i will have no match, we can calculate the effects
Gxy(R) for any pair of races. Table 3 shows the increase in the probability offinding a registered match for persons of each race that result from adding oneperson of specified race to the registry.
Table 3: Gain in match probability from adding one registrant(Figures in table must be multiplied by 10−7)
Gain to Race of Added registrantthis Race White Afr Am. Asian Am Hisp Nat Am.
White 0.143 0.136 0.094 0.146 0.132Afr Am 0.136 6.043 0.154 0.547 0.287Asian Am 0.094 0.154 3.727 0.212 0.201Hispanic 0.146 0.546 0.212 1.124 0.305Nat Am 0.132 0.287 0.207 0.305 1.012
Notes: Entries are calculated with MatLab using Equations 2 and 3 above, with estimated
frequency distribution of phenotypes based on Mori’s haplotype distribution [28]. Numbers
reported in table are 107 times actual effects of one person.
Estimating the Number of Lives Saved
To estimate the number of lives saved by an additional registrant, we first es-timate the number of patients of each race who would accept transplants ifthey could find a match. We then calculate the expected increased probabilitiesof finding a transplant that would result from adding one more donor of eachrace. Finally, we multiply the increased probabilities of finding a transplant
8

by the increase in long term survival probability that results from obtaining atransplant.
The first column of Table 4 reports the number of persons of each race whoreceived transplants in 2006. The second column reports our estimates of thenumbers who would have obtained transplants had a match been available, butwere unable to find a match. The third column is the estimated number ofpersons who sought a transplant and would have received one if a match wereavailable.
Table 4: Numbers of Actual and Potential Transplants (2006)
Actual Number with PotentialRace Transplants No Match TransplantsWhite 2394 203 2597Afr Am 120 72 192Asian Am 83 22 105Hispanic 191 38 229Nat Am 12 1 13All Races 2800 336 3136
Notes: The NMDP report Number of Allogenic Transplants Performed [32], shows that in
2006, approximately 2,800 patients received transplants through the NMDP, either from bone
marrow or peripheral stem cell donations. We apply the proportions of registrants by race
reported in the 2004 Biennial Report of the NMDP [30] to estimate numbers of patients of
each race in 2006. To estimate the number of potential transplants of each race, we divide the
number of transplants by 1 − p0r where p0
r is the estimated probability that a person of race
r finds no match in the registry, as reported in table 2.
We next estimate the expected annual increase in the number of transplantsto persons of race y that would result from an additional registrant of race x.To obtain this estimate, we multiply the number of potential recipients of racey found in Table 4 by the estimate in Table 3 of the increased match probabilityfor persons of race y resulting from an additional registrant of race x.
Not every additional transplant will “save a life”. With some probability,the recipient will die shortly after receiving the transplant. With some proba-bility, a patient would survive without a transplant. To obtain the effect of anadditional registrant on the expected number of lives saved, we need to multi-ply the increase in the expected number of transplants by the probability thata transplant saves an additional life. The biennial report of the NMDP ([30],page 3-37), reports that the probability that a transplant recipient survives forat least ten years after a transplant is about thirty percent. Survival probabil-ities of patients who do and do not receive transplants depend on the medical
9

condition for which they are treated. We have surveyed the medical literatureon each of the most common conditions treated by stem cell transplants. Ap-pendix B of this paper reports estimates for each condition of long term survivalprobabilities of those who receive transplants and those who receive the nextbest available treatment. From this study, we estimate that the availability ofan HLA compatible donor increases long term survival probability of a patientseeking a transplant by an average of twenty-one percentage points. Thereforewe calculate the expected number of lives saved by an additional registrant astwenty-one percent of the probability that the additional registrant is a matchfor a patient who had no other match in the registry. Table 5 reports the ex-pected number of lives saved by adding 1,000 new registrants of each specifiedrace.
Table 5: Expected annual additional transplants and lives savedby adding 1,000 effective registrants
Race of New Expected Annual Expected AnnualRegistrants Transplants Added Lives SavedWhite 0.044 0.009Afr American 0.166 0.035Asian American 0.072 0.015Hispanic 0.077 0.016Native American 0.050 0.010
Valuing Lives Saved
The benefits of the bone marrow registry are well suited to measurement usingthe value of statistical life approach. This method was introduced by E.J. Mis-han [27], and further developed for analysis of public projects by T.C. Bergstrom[5] and Pierre Dehez and Jacques Dreze [14]. The underlying theory and its em-pirical implications are lucidly explained in a survey by Kip Viscusi and JosephAldy [39]. An individual’s “value of statistical life” (VSL) is her marginal rateof substitution between survival probability and wealth—the rate at which sheis willing to make exchanges between monetary wealth and small changes insurvival probability. For example, someone who would pay $1000 to eliminatea one-time fatality risk of .0001 would have a value of statistical life of approx-imately $1000÷ .0001 = $10, 000, 000. A larger registry benefits each person insociety by adding a small increment to the survival probability of each. Themarginal rate of substitution of an individual between this public good and pri-vate consumption is the product of the effect on her survival probability times
10
her value of statistical life. The Samuelson condition for efficient provision of apublic good compares the sum of individual marginal rates of substitution be-tween the public good and private goods to the marginal cost of the public goodrelative to private goods. If individuals’ values of statistical life are uncorrelatedwith their gains in survival probability from a larger registry, then the sum ofmarginal rates of substitution is equal to the average VSL times the expectednumber of lives saved.
Many efforts have been made to estimate the value of a statistical life usinga wide variety of methods, including ingeniously designed surveys (Jones-Lee,Hammerton, and Philips [22] and Johannesson, Johansson, and Lofgren [21]),studies of market wage premiums for dangerous work, consumer decisions aboutpurchasing consumer safety devices, health care decisions, and decision rulesused by government agencies. Viscusi and Aldy [39] review a large number ofthese studies. Estimated valuations vary widely across studies and methodolo-gies, but according to Viscusi and Aldi, are mainly concentrated in the rangefrom four to nine million U.S. dollars. We assume a value of statistical life of$6.5 million, the midpoint of this range. This is consistent with the policiesof the U.S. Environmental Protection Agency, as reported in their publication“Guidelines for Preparing Economic Analyses” [38], which recommends a VSLthat is equivalent to 6.75 million 2004 dollars.
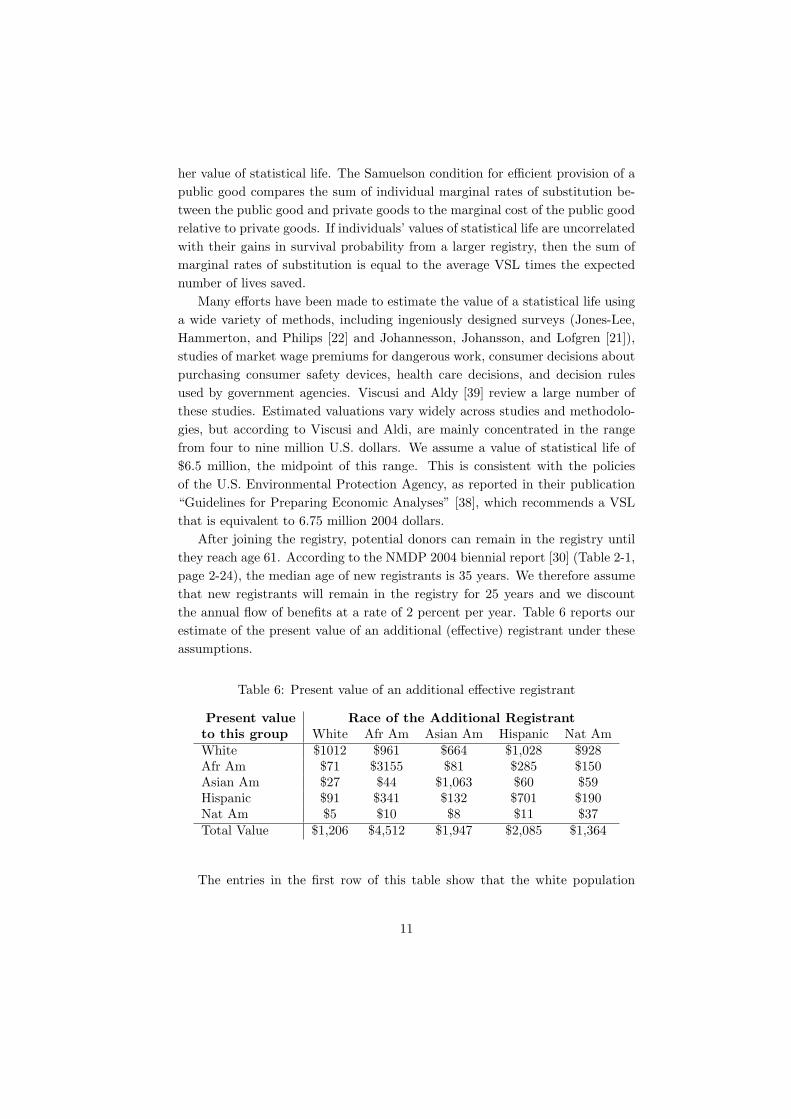
After joining the registry, potential donors can remain in the registry untilthey reach age 61. According to the NMDP 2004 biennial report [30] (Table 2-1,page 2-24), the median age of new registrants is 35 years. We therefore assumethat new registrants will remain in the registry for 25 years and we discountthe annual flow of benefits at a rate of 2 percent per year. Table 6 reports ourestimate of the present value of an additional (effective) registrant under theseassumptions.
Table 6: Present value of an additional effective registrant
Present value Race of the Additional Registrantto this group White Afr Am Asian Am Hispanic Nat AmWhite $1012 $961 $664 $1,028 $928Afr Am $71 $3155 $81 $285 $150Asian Am $27 $44 $1,063 $60 $59Hispanic $91 $341 $132 $701 $190Nat Am $5 $10 $8 $11 $37Total Value $1,206 $4,512 $1,947 $2,085 $1,364
The entries in the first row of this table show that the white population
11

benefits substantially from additional registrants of the other races. This istrue mainly because there is a large population of whites who are potentialbeneficiaries.
Costs of An Additional Registrant
The NMDP website reports the cost of tissue typing an additional registrantis $52 in 2007. Personal communication with sources at the NMDP indicatesthat the total cost of obtaining sample material, tissue-typing, and maintaininga record of a new potential donor’s contact information is approximately $105.We have calculated benefits for an additional effective registrant, that is a reg-istrant who is able and willing to make a donation if called upon. Since notall registrants are available when called upon, the registry must on average addmore than one registrant to gain an effective resident. Therefore, our cost esti-mates must include the cost of registering more than one person per additionaleffective registrant. Kollman et al report that, based on NMDP experience, thefractions of registrants who can be located, pass the physical examination, andwho consent to make a donation are .70 for white registrants, .42 for AfricanAmericans, .50 for Asian Americans, and .52 for Hispanics.6
Increasing the number of registrants increases the expected number of trans-plants and hence the expected total hospital and physician costs of performingthese transplants. We estimate total hospital and physician costs for a trans-plant are about $166,000.7 Multiplying this cost by the probability that anadditional registration results in an additional transplant, we find that the ex-pected annual hospitalization costs resulting from adding a registrant rangefrom about $7 for whites to about $28 for African American registrants.
Comparing Benefits and Costs
Table 7 shows our estimates of benefits and costs from adding an effective reg-istrant to the bone marrow registry. We see that the benefit-cost ratio is wellabove unity for registrants of all races, and is highest for African Americans.The 2004 Biennial Report of the NMDP [30] (page 2.27) announced that theNMDP has “changed its strategy in recent years to focus more on recruitingminority volunteer donors and less on recruiting Caucasian volunteers.” The
6These fractions are slightly larger than the fractions of the the current registry whoare available for donation because a significant number of earlier registrants are unavailablebecause their HLA type was misclassified. Current DNA testing methods have apparentlyeliminated this problem for new registrants.
7This estimate is based on a survey of costs in 2001 by Redeaelli et al [33] and convertedto 2007 dollars.
12

report shows that the number of new registrants of Caucasian ancestry dimin-ished by about twenty five percent from 1996 until 2004, while the number ofnew registrants from minority groups was roughly constant. The NMDP’s em-phasis on recruiting African American donors is consistent with our estimates ofbenefit cost ratios. Unless total funding for the program is increased,8 however,this entails a reduction in efforts to recruit members of other racial groups. Ourresults suggest that there is a strong case for increasing the total budget of theNMDP to allow increased registration of all races.
Table 7: Benefit-cost comparison for an additional registrant
Race of the additional registrantWhite Afr Am. Asian Am Hispanic Nat Am
Benefit $1206 $4,512 $1,947 $2,078 $1364Total Cost $297 $800 $446 $455 $455B/C Ratio 4.1 5.6 4.4 4.6 3.8
Our calculations of benefits and costs have treated the population served bythe NMDP as a closed system. Thus we have not accounted for the possibilitythat patients in the countries served by the NMDP may get transplants fromregistries in other countries. If the world clearing house for registrants operatedentirely smoothly, the total number of registrants available would be almosttwice as large as the number in the NMDP. It would also be the case thatthe number of persons seeking transplants would be on the order of twice thenumber seeking transplants from the NMDP. We do not have data on the racialcomposition of registries outside the NMDP, nor do we have data on the numberof persons receiving or seeking transplants from non-NMDP countries. To geta rough idea of the effect of including the entire world registry, we calculatedexpected present value of an additional registration, based on the assumptionsthat the racial composition of total world registry is the same as that of theU.S. population in the NMDP, that the ratio of number of transplant recipientsto the size of the registry is the same as for the NMDP, and that sharing acrossregistries is frictionless. With these assumptions, the ratio of the present valueof benefits to costs for a new registrant is 3.3 for whites, 3.8 for Asian Americans,4.1 for Hispanics, and 5.4 for African Americans.
8The major source of government funding for the NMDP is the US Department of Healthand Social Services. Funding from this source was $25 million in 2005 and 2006 and fell to$23 million in 2007.
13

Optimal Registry Size and Composition
We have seen that the expected present value of benefits exceeds the cost ofadding registrants to the current NMDP registry. Therefore a larger registryis called for on efficiency grounds. As the registry gets larger, a new additionbecomes less likely to add a new HLA type to the registry and so the expectedbenefit from an additional registrant diminishes. If there were no cross-racematches, finding the optimal registry size would be relatively simple. For eachrace, we would simply find the registry size at which the marginal benefit fromadding an additional person of that race is equal to the marginal cost. Our taskis complicated by the fact that registrants sometimes match patients of otherraces. Therefore to calculate the optimal number of persons of each race, we needto account for the number of persons of each other race who are registered. Weused MatLab’s numerical optimization procedures to find an optimal registry,such that the marginal benefit to persons of all races from adding an additionalregistrant of any race is equal to the marginal cost. Table 8 reports the results ofthis calculation. Here we present the actual and optimal registry sizes for whites,African Americans, Asian Americans and Hispanics.9 By our calculations, theoptimal registry size is more than two-and-a-half times as large as the currentregistry for all races, and nearly ten times times as large for African Americans.10
Table 8: Actual and optimal registry size (in millions)
Race Number in Optimal number Ratio optimalregistry in registry to actual
White 4.44 12.11 2.72Afr Am 0.49 4.73 9.75Asian Am 0.43 1.76 4.07Hispanic 0.59 2.93 4.93
The bone marrow registry is less than twenty years old, and registrantsremain eligible on average for about twenty-five years after joining. Therefore,the registry has continued to grow, although the number of new registrantshas diminished in recent years.11 Current registration rates, however, do not
9We omit estimates for Native Americans. The distribution of HLA types of Native Ameri-cans in the registry is very similar to that of whites. As a result, the calculation of the optimalnumber of Native American registrants is volatile with respect to the relative cost of addinga Native American or a white to the registry.
10We also calculated the optimal size for the entire world registry, based on the assumptionthat the distribution by race in the world registry and among those seeking transplants wouldbe in the same as for the NMDP. This crude estimate indicates that the optimal size for theworld registry is about 32 million, as compared to the current 11 million.
11The number of new registrants was 630,000 in 1996 and was approximately 500,000 in
14

appear to be sufficient to achieve the optimal registry size, even in the long run.If registrants remain in the registry for an average of 25 years, then in long runequilibrium, the number of new registrants per year would have to be aboutfour percent of the optimal registry size. Table 9 compares current registrationrates with steady state optimal rates for each race.
Table 9: Current and steady state optimal registrations per year
Race Current annual Annual registrants for Ratio optimalnew registrants optimal steady state to current
White 340,000 480,000 1.4Afr Am 30,000 189,000 6.3As Am 40,000 70,000 1.8Hispanic 45,000 117,000 2.6
Notes: Current annual new registrants is estimated by the average number of new registrants in
2003 and 2004, as reported in the NMDP Biennial Report [30], Table 2.19. Annual registrants
for optimal steady state is calculated as four percent of the optimal registry size reported in
Table 8.
In Table 10, we see that between two and three percent of the eligible pop-ulation of whites, African Americans, and Hispanics are enrolled in the bonemarrow registry, while six-and-a-half percent of Asian Americans are enrolled.In an optimal registry, this percentage would be about seven percent for whitesand close to twenty-five percent for African Americans and Asian Americans.
Table 10: Percent of population in registry and probability of no match
Race Pct of eligible Pct of eligible P(No Match) P(No Match)
population in population in in actual in optimal
actual registry optimal registry registry registry
White 2.7 7.1 .08 .03Afr Am 2.4 23.8 .38 .12As Am 6.5 26.5 .21 .09Hisp 2.9 14.3 .11 .06
Notes: Figures in the first and second columns represent the ratio of U.S. registrations in the
NMDP to U.S. population aged 18-61, by race.
Table 10 also shows the probability that a patient seeking a transplant willfail to find a match given the current registry size and the optimal registrysize. It is interesting to note that although an optimal registry includes largerfractions of the African American and Asian American populations than of
2004. In 2004, approximately 85,000 registrants turned 61 and were removed from the registry.
15

whites, whites would remain more likely than other races to find a match. Inan optimal registry, the probability that an African American patient wouldfail to find an HLA match falls from the current thirty-eight percent to twelvepercent, while for white patients this probability would fall from seven percentto three percent. This discrepancy arises largely because there are “economiesof scale” in the technology of matching. The African American and AsianAmerican populations are both smaller and more genetically diverse than thewhite population. Our calculations indicate that even if all eligible AfricanAmericans were added to the registry, the probability of finding a match in theregistry would be lower for an African American patient than for a white.
What Motivates Potential Donors?
Those who join the bone marrow registry are explicitly told that if called uponto donate, they will bear risk, inconvenience and discomfort, they will receive nomonetary reward, and the beneficiary will almost certainly be a stranger. Yetmillions of people have voluntarily joined bone marrow registries. Why havethey done so?
The decision problem for bone marrow donors is not the same as that for do-nating money to the poor. Private donations to the poor could be encompassedin the standard Nash-equilibrium model of private provision of public goods (seeBergstrom, Blume, and Varian [6]), where the well-being of the poor people istreated as a public good. In that model, a donation from one person is a perfectsubstitute for an equal donation from another. The biology of immune systemsensures that this is not the case with the bone marrow registry. Contributionsby two people of different HLA types can not be substituted for each other.If someone is the only representative of his HLA type in the registry, then hiscontribution would be essential should a needy patient of this type appear. Butif there are others of this HLA type in the registry, then even if he were calledupon to donate, his participation would not be essential to anyone’s survivalprobability, since another equally suitable donor would be available.
The probability that a registrant will ever be asked to donate is small; thelifetime probability for a white who joins the registry at age 35 is about onepercent and for other races it is even lower. If a registrant is the only person ofhis HLA type in the registry, we say that he is pivotal. If there is more than oneregistrant whose HLA type matches a patient seeking a transplant, only one ofthem needs to make a donation. We assume that in this case, selection is atrandom and we calculate the conditional probability that someone who is askedto donate is pivotal. This probability depends on the registrant’s own race andon the size and racial composition of the registry. In Appendix A, we present
16

a detailed probability model that estimates the probability π that a registrantwill ever be asked to donate and the conditional probability h that a registrantwho is asked to donate is pivotal.
Table 11: Probabilities of being asked and of being pivotal if asked
Current Registry Optimal RegistryP (Asked|Reg) P (Pivotal|Asked) P (Asked|Reg) P (Pivotal|Asked)
Race π h π h
White .013 .08 .004 .03Afr Am .005 .78 .001 .19As Am .006 .30 .002 .11Hisp .008 .22 .003 .08
Table 11 reports the probabilities π and h by race. We see that the condi-tional probability is about eight percent that a white registrant will be pivotalif asked to donate. The corresponding probability for an Asian American isthirty percent and for an African American is almost eighty percent. As thetable shows, if the registry size were increased to optimal levels, the conditionalprobabilities of being pivotal would be much lower for members of all races butwould remain much larger for the other races than for whites.
Those who join the registry currently have no way of knowing the probabilityh. Perhaps many donors would not be interested in this number if they weretold. We believe, however, that the number of people willing to join the registrywould be an increasing function of the perceived likelihood that if asked todonate, they would play a pivotal role in saving a life. It is therefore instructiveto consider the decision problem faced by a potential donor who is aware of theprobability that he will be asked to donate if he joins the registry, and of theconditional probability that he will be pivotal if asked to donate.
Meditations of a Consequentialist Altruist
Let us consider the choice problem faced by a rational donor with specified be-liefs about the probability distributions of relevant outcomes and whose choicesare consistent with a von Neumann Morgenstern utility function. For a first passat this problem, we consider a “consequentialist altruist,” who values actionsonly by their results.12
Three distinct possible states of the world are of concern to a consequentialistaltruist who considers joining the registry. One possibility is that she is never
12The Stanford Encyclopedia of Philosopy [41] defines consequentialism is “the view thatnormative properties depend only on consequences.”
17

asked to donate. A second is that she is asked to donate and is the only personof her type in the registry. The final possibility is that she is asked to donate,although the registry contains at least one other person of her type. Let πi bethe probability that person i will be asked to donate if registered, and let hi bei’s perceived probability that if asked to donate, she is the only registrant of hertype.13
Assume that there is no cost, positive or negative, for joining the registry.Then a consequentialist altruist will assign the same utility U0i to joining theregistry and not being asked to donate as to not joining the registry. Supposethat i assigns a utility cost Ci to the risk, pain, and inconvenience of making adonation and that making a pivotal donation adds Bi to i’s utility, where Bi >
Ci. Then i attaches a utility of U0i+Bi−Ci > U0i to making a pivotal donation.If i makes a donation when there is at least one other willing registrant of hertype, then i’s participation has no effect on the patient’s survival probability,but simply saves another registrant the cost of donating. Let Vi < Ci be theutility that i attaches to saving someone else the trouble of donating. Then i
assigns utility U0i + Vi − Ci < U0i to making a donation that is not pivotal.The NMDP asks registrants to promise that they are “willing to donate
to any person in need,” but there is no contractual obligation to do so. Aconsequentialist altruist who is not rewarded for joining the registry would joinonly if she intended to donate if asked. The expected utility of i for joining theregistry is then:
(1− πi)U0i + πi (hi(U0i + Bi − Ci) + (1− hi)(U0i + Vi − Ci)) . (4)
Therefore i will prefer to join the registry if and only if the utility in Expres-sion 4 exceeds U0i. This is the case if and only if
hi(Bi − Ci) + (1− hi)(Vi − Ci) > 0. (5)
It seems reasonable to assume that a consequentialist’s value Vi of savinganother donor the trouble of donating is small. Let us simplify by setting Vi = 0.Then Condition 5 becomes
Bi
Ci>
1hi
. (6)
As shown in Table 11, we estimate the probability h of being pivotal atabout 0.08 for white Americans. If this were the probability perceived by allpotential donors, then Condition 6 tells us that those who join the registry
13It is the policy of the NMDP not to reveal to potential donors whether they are theonly person of their HLA types in the registry. Although we have been able to estimate theprobability h for persons of each race, no such estimates are publicly available, and perceptionsabout this probability are likely to vary widely.
18

must have benefit-cost ratios Bi/Ci > 12.5. According to Table 10, about 2.7percent of the eligible white population is enrolled in the registry. This meansthat the current registry of white Americans can be supported by motives ofconsequentialist altruism if 2.7 percent of the population have benefit-cost ratiosexceeding 12.5 for making a pivotal stem cell donation to a stranger. An AfricanAmerican who is asked to donate is much more likely to be pivotal than awhite. For African Americans, the current African American enrollment couldbe maintained if 2.4 percent of the population have personal benefit-cost ratiosexceeding 1.25. For Asian Americans, maintaining the current registry wouldrequire 6.5 percent of the population to have benefit-cost ratios of at least 3.3,and for Hispanics, would require 2.9 percent to have benefit-cost ratios of atleast 5.
An optimal registry of well-informed consequentialist altruists would requiremuch more intense and widespread altruism than is needed to maintain thecurrent registry. According to Table 8, an optimal registry would have abouttwice as many whites, about four times as many Hispanics and Asian Americans,and almost ten times as many African Americans as the current registry. Notonly would the registry have to be much larger, but we see from Table 11 thatwith the optimal registry, each person’s probability of being pivotal would be lessthan half of what it is in the current registry. These considerations suggest thatto achieve an optimal registry with a population of consequentialist altruists, itmay be necessary to offer additional inducements for potential registrants.
More Complex Motivations
Economists, whose usual fare is the study of rational, selfish agents, are lessadept at predicting behavior of those who act with generosity. Some useful in-sights can be captured by upgrading the sensibilities of our familiar workhorse,homo economicus, to those of a consequentialist altruist. But this modest up-grade is unlikely to capture the full variety of motives that underlie much ofaltruistic behavior.
In recent years, economists have developed several models and laboratoryexperiments that explore alternative motives for altruistic behavior. Andreoni[2] proposed that people feel a “warm glow” from giving that depends on thesize of their own gift, independent of the ultimate stock of public goods. Duncan[15] introduces the notion of “impact philanthropy,” where people take pleasurein the difference made by their own actions. Benabou and Tirole [3] suggestthat “people perform good deeds and refrain from selfish ones because of socialpressure and norms that attach honor to the former and shame to the latter.”These authors show that to determine motives from actions requires a somewhat
19

subtle signal extraction model in which good actions may or may not impressothers. As Ellingsen and Johannesson [16] put it, “some people are generous,but everyone wants to appear generous.” Benabou and Tirole also suggest thatpeople perform prosocial acts in order to improve their own self-image, usingconcrete actions to signal to their future selves the kind of person that theyreally are.
A series of papers by Dana, Weber, and Kuang [13], Dana, Cain, and Dawes,[12], Broberg, Ellingsen, and Johannesson [8], and Lazear, Malmendier, andWeber[24] shows that while people often act generously when the consequencesof their actions are clearly spelled out, they are adept at finding “moral wig-gle room.” These papers report evidence from separate experiments in whichpeople who would play generously with full information are willing to concealinformation from themselves or from potential recipients so that they can be-have selfishly without making their motives transparent. This is the case eventhough the potential recipient will never know who has behaved selfishly orunselfishly toward him.
Richard Titmuss [37] argued that paying people for blood “donations” mightreduce the supply of blood from those who had previously contributed for free.Many donors are motivated either by social acclaim or by self-satisfaction fromperforming a good deed. Benabou and Tirole [3] suggest that if blood donorsare paid, the value of blood donation as a signal of generosity will be weakened,possibly producing the “Titmuss effect.” Mellstrom and Johanneson [26] in-vestigated the effect of payments on donations by means of a field experiment,conducted in Gothenberg, Sweden. In one treatment they gave subjects an op-portunity to donate blood without compensation. In a second treatment theyoffered subjects a small payment (about $7) to make a donation, and in a thirdtreatment they offered those who donated a choice between a payment and theopportunity to give the payment to charity. For men, they found no significantdifference among the treatments, but they found that in the second treatmentonly about half as many women were willing to contribute as in the first andthe third. Thus, they suggest that money payments seem to reduce rather thanincrease donations from Swedish women.
A desire to signal altruism appears to be a useful motivator for blood do-nations, which occur immediately and certainly after one has agreed to donate.This motivation does not necessarily serve the bone marrow registry so well.The problem is that a bone marrow registrant can signal altruism by joiningthe registry, while realizing that the probability is small that he will have tofollow through with an actual donation. Since the registry cannot make bindingcontracts, registrants who are motivated by a desire for acclaim may refuse todonate if they are “unlucky” enough to be called upon.
20

It is important to remember that the motives and ethical views that guidegenerous actions differ widely in the population. There is also likely to be widevariation in people’s perceptions of the probability distribution of consequencesof joining the registry. Even if people are, on average, correct about the proba-bilities, the average perception is not what is relevant here. The current registrycontains less than four percent of the eligible population, and an optimal registrywould contain less than ten percent. Much as crime-prevention policies mustfocus on the actions of those who believe they are least likely to be caught andwho are least troubled by conscience, membership in the bone marrow registryis likely to come from those who most strongly believe that their gifts will bepivotal and who have the strongest altruistic feelings.
An Enriched Model
We do not aspire to capture the full variety of plausible motivations for donorsin one simple model, but we do think it important to account for altruisticbehavior motivated by the desire for social acclaim. We also want to extendour earlier model to account for possible time and/or money costs of joiningthe registry and to explore likely effects of paying those who join the registry orthose who make donations.
Our earlier model of consequentialist altruists assigned the same utility U0i
to joining the registry and not being asked to donate as to not joining theregistry at all. But if there is social acclaim for registering or social stigma tonot doing so, then the utility of joining and not being called upon would exceedthat of not joining. If there is no social acclaim and no payment for joiningthe registry, people would join only if they hope to be called on to donate.Those who register would certainly intend to donate if asked. But if joining theregistry is rewarded, either with money or status, some may choose to registereven though they hope never to be asked to donate. Moreover, registrants areunder no contractual obligation to donate when called on, though they are askedat the time of registration to affirm that they intend to do so. Some personsmight register to gain payments or social acclaim, with the intention to declineif asked to donate. A significant fraction of those called upon to donate failto do so. According to Kollman et al [23], approximately 30 percent of whiteregistrants, 60 percent of African American registrants, and 50 percent of AsianAmerican and Hispanic registrants who are asked to donate either are not ableto or do not agree to make a donation. Not all of these are direct refusals.Some are unable to donate for medical reasons and some cannot be found atthe address listed with the registry. Others are likely to regard it as shamefulnot to keep their promise and would donate even if they regret having joined
21

the registry.We will work with a simple additive utility model that provides a useful way
of keeping track of these interacting effects. Let xi be the net cost in termsof time and money of joining the registry. (If there are payments for joiningthe registry, xi could be negative.) Let ai(xi) represent i’s utility valuation ofthe social acclaim for joining. The social acclaim that one receives for joiningthe registry may be greater if joining the registry is more expensive and maybe reduced if one is paid to join. Person i receives a net utility increment ofai(xi)− xi from joining the registry, whether or not i is asked to donate.
Suppose that person i intends to donate if asked. The probability that i willbe asked is πi. The gain (or loss) in expected utility from having to make adonation is hiBi +(1−hi)Vi−Ci, where hi is i’s perceived probability of beingpivotal if asked. Weighing the direct benefit and/or cost of registering and thatof donating if asked, i will prefer to join the registry if and only if
ai(xi)− xi + πi (hiBi + (1− hi)Vi − Ci) > 0. (7)
To complete this model, we need to account for the possibility that someonemay join the registry for social acclaim or financial reward, but would declineto donate if called upon. If hiBi + (1 − hi)Vi > Ci then i is glad to be calledupon and will donate willingly. But if Ci > hiBi + (1− hi)Vi, then if asked todonate, i will do so only if the shame, Si, from not donating is greater than theexpected disutility of donating. That is
Si > Ci − hiBi − (1− hi)Vi (8)
Taking account of the option to refuse to donate when asked, a necessaryand sufficient condition for i to join the registry is
ai(xi)− xi > πi min{Si, Ci − hiBi − (1− hi)Vi}. (9)
Expression 9 tells us that that i compares the net direct benefit from joining theregistry with the expected cost of being asked to donate if registered. If askedto donate, i will do so only if Condition 8 is satisfied.
Fees and Payments for Registrants and Donors
Until recently, potential donors could join the national bone marrow registrywithout paying a fee. This is no longer the case. The bone marrow registry lackssufficient funding to pay the costs of adding new registrants and has begun tocharge a fee of $52 to volunteers who wish to join the registry online. With theuse of the internet, the time cost of joining the registry has been much reduced.
22

Previously, to join the registry one would have to travel to a collection center.With internet registration, an eligible donor simply completes an online form,pays a fee, orders a “tissue-typing kit,” takes a swab of cheek cells, and mails theswab to the registry for testing. Apparently some donors can avoid the fee byregistering in person. According to the registry web site: “For volunteers whojoin in person, sometimes all or part of the tissue-typing costs may be coveredby a patient family, community group, or corporation.” The US Department ofDefense pays all costs for military personnel who join the registry at a designatedcollection center.
Our study suggests that the number of persons of all races in the currentregistry is less than optimal. It seems unfortunate that the NMDP must chargea significant fee to new registrants. The likely effect of fees is to deter newregistrants. It is possible in principle that there is a “reverse Titmuss effect”making people more likely to register if they have to pay to do so, but this seemshighly unlikely. There is, however, one likely beneficial side-effect of fees. Feesshould tend to deter registration by those who join for social acclaim but haveno intention of donating if asked. Thus a registration fee is likely to reduce thenumber of registrants, but it might increase the proportion of registrants whoare ready to donate if called upon.
Although the bone marrow registry continues to grow, our analysis suggests(see Table 9) that for all races, current rates of registration will not be sufficient,even in the long run, to sustain a registry of optimal size. This suggests that itmay not be possible to achieve an optimal registry solely with unpaid volunteers.
One strategy for attracting more registrants would be to pay people to jointhe registry. Aside from possible Titmuss effects, this method of attractingdonors has a significant disadvantage. Paying new registrants may attract peo-ple who plan to collect the reward, while intending to refuse to donate if asked.Alternatively, payments might be made only to those who actually make a do-nation. Paying donors would increase the utility of joining the registry only forthose who intend to donate if asked. Thus, paying donors should increase theproportion of registrants who agree to donate, and also attract more registrants.Since less than one percent of all registrants are ever called upon to donate, thesame total expenditure would support much larger payments to donors than toregistrants.
Payments to bone marrow donors do not represent a diversion of resourcesfrom other purposes, but are simply transfer payments. Standard benefit-costmethodology14 does not treat transfer payments as costs, though it does countadministrative costs and dead-weight loss due to incentive effects. Transfer
14See, for example, Boadway and Wildasin [7], pp 40-41.
23

payments are evaluated mainly on grounds of equity. It is arguable that thereis a strong equity case for payments to bone marrow donors, who bear pain,risk, and inconvenience for the benefit of strangers. The case for regardingpayments to donors simply as transfer payments can be disputed, however. Ifpaying donors deprives them of the good feeling of having sacrificed for others,then the net gain to donors from being paid will be less than the loss to thetaxpayers who contributed the payments. Measuring this difference requiresa deeper understanding of the motives of donors than we now have. Futureexperimental studies and field interviews may shed useful light on this question.
Conclusion
Our benefit-cost analysis suggests that for all of the large racial groups, benefitsfrom an additional registrant are more than four times as large as costs, andthe benefit-cost ratio is highest for African Americans. The NMDP currentlyfocuses on recruitment of minority donors and has allowed the annual numberof new white registrants to decline. Although a focus on African Americanand minority registration appears to be justified by the benefit-cost ratios, thecurrent registry has fewer people of all races than is optimal.
We estimated optimal registry sizes for each race. Currently, the registrycontains between two and three percent of eligible whites, African Americans,and Hispanics, and six-and-one-half percent of eligible Asian Americans. Op-timal levels are almost ten times as large as the existing registry for AfricanAmericans, three times as large for whites, and between four and five times aslarge for Asian Americans and Hispanics. Even with an optimal registry, AfricanAmericans would be less likely to find a match than persons of other races. Thisis a consequence of the relatively small size and great genetic diversity of theAfrican American population.
A lack of sufficient funds has forced the NMDP to charge potential donorsfor joining the registry. Charging fees for those who wish to join the bone mar-row registry seems an unfortunate impediment to participation given that thecurrent registry appears to be much smaller than optimal. Because the registryis relatively new, it is still growing, but the current rate of new registrations isnot large enough to sustain an optimal registry size in the long run. This sug-gests a strong economic case for providing sufficient funding to the NMDP toallow it to waive fees for all new registrants. New registrants could be given theoption to make voluntary cash donations to cover the costs of their registration.
The bone marrow registry confronts us with an interesting variant of thestandard free-rider problem. Donations by two people of different HLA typesare not substitutes. Each potential donor will, with some probability, be the
24

only person who can save the life of one particular stranger. As the size of theregistry increases, it becomes less likely that a new registrant will be the onlypotential donor of her type. In an optimal registry, these probabilities would beless than half as large as they are with the current registry.
The bone marrow registry has been able to attract almost three percent ofthe eligible US population. This is impressive evidence of generous behavior.But an optimal registry would need almost ten times as many African Americansand between two and five times as many persons of other races as the currentregistry. If those who have already joined are the “most generous” individualsin society, it may be difficult to find enough volunteers to double their number.This difficulty is compounded by the fact that if the registry approaches optimalsize, the free rider problem will become more severe, since new registrants willbe less likely to be unique in the registry.
If increased recruitment efforts do not achieve sufficient increases in volun-tary enrollments, one might consider offering financial rewards to attract donors.This could be done either by paying a small sum to each new registrant, or bypaying a larger sum to those who actually make a donation. Payments to newregistrants may attract some who join for the reward, but refuse to donate whenasked. Registrants who refuse to donate are likely to cause damaging delays fora patient in urgent need of a transplant. A policy of rewarding only thosewho make a donation would avoid this ill effect, and instead would be likely toincrease the proportion of registrants who intend to donate.
25

Appendix A:
The effect of an additional registrant on the probability ofa match
Recall that an effective registrant is defined as one who will be willing and ableto donate if asked to do so. Where R is the vector of numbers of effectiveregistrants of each race, define Gxy(R) to be the effect that adding a randomlyselected person of race x to the registry has on the probability that a randomlyselected person of race y will find a match. Let px
i be the probability that aperson of race x is of type i, and let P 0
i (Rx, x) be the probability that a personof type i has no match of race x in a registry that contains Rx persons of racex. Then
P 0i (Rx, x) = (1− px
i )Rx . (10)
The probability that a person of type i has no match in the registry fromany race is the product across races of the probabilities that there is no matchin each race. This probability is given by the product
P 0i (R) =
∏z
P 0i (Rz, z). (11)
Adding one person of race x to the registry changes the probability that a personof type i will not find a match by the amount
∆xi (R) =
∏z 6=x
P 0i (Rz, z)
(P 0
i (Rx + 1, x)− P 0i (Rx, x)
). (12)
NowP 0
i (Rx + 1, x) = (1− pxi )Rx+1 = (1− px
i )P 0i (Rx, x). (13)
Therefore
P 0i (Rx + 1, x)− P 0
i (Rx, x) = (1− pxi − 1)P 0
i (Rx, x) = −pxi P 0
i (Rx, x), (14)
and it follows that
∆xi (R) = −
∏z 6=x
P 0i (Rz, z)
(pxi P x
i (Rx, x)) . (15)
Then the change in the probability that a person of race y does find a matchif one registrant of race x is added will be
Gxy(R) = −∑
i
pyi ∆x
i (R) =
∏z 6=x
P 0i (Rz, z)
∑i
pyi px
i P xi (Rx, x), (16)
26

which simplifies toGxy(R) =
∑i
pyi px
i P 0i (R). (17)
This proves the desired result.15
Probability of being pivotal if asked to donate
Let Rx and Nx be the number of registrants and the number of needy patientsof race x and let R and N be the corresponding vectors of registrants and needypatients by race. Let Hx(R,N) be the conditional probability that a registrantof race x is the only person of his type in the registry, given that he is asked tomake a donation.
Define P xd (R,N) as the annual probability that a registrant of race x will be
chosen to make a donation and P xo (R,N) to be the probability that a registrant
of race x is chosen to donate and is the only registrant of his HLA type in theregistry. Then by Bayes’ law,
Hx(R,N) =P x
o (R,N)P x
d (R,N)(18)
To estimate P xo (R,N), we proceed as follows. The probability that there
are no other registrants of type i is p0i (R), which is defined in Equation 1. Let
ni(N) be the probability that there is at least one patient of type i seeking adonation. Then
ni(N) = 1−∏x
(1− pxi )Nx (19)
The conditional probability that a donor is pivotal in saving a life, given thathe is of type i is
poi (R,N) = p0
i (R)ni(N). (20)
The probability that a registrant of race x is pivotal in saving a life is
P xo (R,N) =
∑i
pxi po
i (R,N). (21)
A potential donor has no initial knowledge of his HLA type, beyond whatis implied by knowledge of his race. Therefore the prior probability of beingasked to donate is the same for all members of a given race. If we know theannual number of persons of each race who are asked to donate and the size ofthe registry, we can estimate P x
d as the ratio of the former to the latter.
15An alternative proof can be constructed as follows. The probability that someone of racey is of type i, previously had no match, but finds a match with the addition of one moreperson is px
i pyi p0
i (R). Therefore the probability that a randomly selected member of race y
who previously had no match finds a match with a new registrant of race x is∑
ipx
i pyi p0
i (R).
27

Alternatively, we can use our knowledge of the distribution of HLA types andthe number of transplant-seeking patients of each race to estimate the numberof persons of each race who are asked to donate. We do this as follows: Let
mi(N) =∑
x
pxi Nx (22)
be the expected number of type i persons in need of a transplant. The fractionof type i registrants that are of race x is estimated by
rxi (R) =
pxi Rx∑
y∈S pyi Ry
. (23)
Then the expected number of registrants of race x who are asked to donate is
ExR(R,N) =
∑i
mi(N)rxi (R). (24)
The probability that a registrant of race x is asked to donate is therefore
P xd (R,N) =
ExR(R,N)
Rx. (25)
We can now use equations 25, 21, and 18 to calculate Hx(R,N).
Appendix B
Here we estimate the expected change in survival probability from receiving astem cell transplant rather than the next best medical treatment. Transplantsare used to treat many conditions and data on relative effectiveness varies acrossdiseases in availability, quality, and generality. We use available medical datato estimate the expected number of lives saved by an additional transplant foreach of the most common conditions. We then calculate an average, weightedby the frequency of each ailment. The weighted average net gain in long termsurvival probability across the diseases in Table 12 is 0.21. We use this figure toestimate the expected number of lives saved by an additional match from thebone marrow registry.
Survival Gains by Condition
More than twenty thousand patients with various conditions have been treatedby bone marrow transplantation using NMDP donors between 1987 and 2004.The numbers by disease as reported by the NMDP [30], are listed in Table 12.
28

Table 12: Net Survival Gains From Transplants, by DiseaseNumber of Percent of Net Survival
Disease Transplants Transplants GainAcute myelogenous leukemia 4,800 0.24 0.16Chronic myelogenous leukemia 4,686 0.23 0.15Acute lymphoblastic leukemia 3,815 0.19 0.42Myelodysplastic syndromes 2,110 0.10 0.25Non-Hodgkin’s lymphomas 1,344 0.07 0.00Severe aplastic anemia 733 0.04 0.20Other 2,886 0.14 0.21
Disease by disease review
Acute Myelogenous Leukemia
An examination of long-term survival for patients with acute myelogenous leukemia(AML) observed 5-year survival rates of 45% for bone marrow transplantationand 29% for an alternative chemotherapeutic approach [4]. We therefore usea value of 0.16 as the change in survival probability attributable to bone mar-row transplantation for patients with AML. This value is consistent with thosefound in other studies (e.g. Zittound et al [43]).
Chronic Myelogenous Leukemia
The bone marrow registry notes that use of bone marrow transplantation totreat chronic myelogenous leukemia (CML) decreased after the 2001 introduc-tion of the drug imatinib mesylate. (NMDP Biennial Report 2003-2004 [30]) Amore recent review article [35] concludes that while imatinib mesylate improvesoutcomes, it is not curative for CML and there remains a role for bone mar-row transplantation. We therefore include CML in our calculation. A textbookdiscussion of treatment for CML by Garcia-Manero [18] refers to four studiescomparing bone marrow transplantation with chemotherapy . We use the arith-metic mean survival advantage of these studies, 0.15, as the change in survivalprobability attributable to bone marrow transplantation for patients with CML.
Acute Lymphoblastic Leukemia
A recent study found 68% 15-year survival for patients with acute lymphoblasticleukemia (ALL) who received a bone marrow transplant from an unrelated donor[11] . Two studies that assess the effectiveness of chemotherapy in treatingALL found long term survival rates of 20% and 32% [36] [42]. We take thearithmetic mean of these two studies to compute a change in survival probability
29

attributable to bone marrow transplantation of 0.42.
Myelodysplastic Syndromes
There is no curative chemotherapy available for myelodysplastic syndromes andten year survival is on the order of 2% [19]. Among patients treated withbone marrow transplants facilitated by the national registry, 10 year survivalis approximately 27% (NMDP Biennial report [30]). We attribute a change insurvival probability of 0.25 to bone marrow transplantation for myelodysplasticsyndrome. This value is consistent with at least one study directly assessingthe impact of bone marrow transplantation in patients with myelodysplasticsyndrome [1].
Non-Hodgkin’s Lymphomas
According to a recent review article [29] on the subject, “the role of [bonemarrow] transplantation in the management of lymphomas remains uncertain.”A recent textbook describes the use of bone marrow transplantion in Non-Hodgkin’s Lymphoma as “controversial” and concludes that “only a fractionof the most advanced patients... may be salvaged by the use of [bone marrowtransplantation]” [20]. Because years of research have failed to elucidate thebenefit of bone marrow transplantation for patients with Non-Hodgkins Lym-phoma, we assume here that there is currently no associated gain in survival.
Aplastic Anemia
A recent textbook presents a summary of 13 studies comparing bone marrowtransplantation to immunosuppressive therapy, a primary alternative, for thetreatment of aplastic anemia [40]. Because the studies vary in the age of partic-ipants, we separately computed average survival advantage (weighted by studysize) attributable to bone marrow transplantation for adults and children. Wethen weight the results by the number of adults and children who have beentransplanted from donors through the registry to compute an overall averagechange in survival probability of 0.20.
30

References
[1] Jeanne E. Anderson, Claudio Anasetti, Frederick R. Appelbaum, GarySchoch, Ted A. Gooley, John A. Hansen, C. Dean Buckner, Jean E. Sanders,Keith M. Sullivan, and Rainer Storb. Unrelated donor marrow transplan-tation for myelodysplasia (mds) and mds- related acute myeloid leukemia.British Journal of Haematology, 93(1):59–67, 1996.
[2] James Andreoni. Giving with impure altruism: Applications to charity andricardian equivalence. Journal of Political Economy, 97:1447–1458, 1989.
[3] Roland Benabou and Jean Tirole. Incentives and prosocial behavior. Amer-ican Economic Review, 96(5):1652–1678, December 2006.
[4] John M. Bennett, Mary L. Young, Janet W. Andersen, Peter A. Cassileth,Martin S. Tallman, Elisabeth Paietta, Peter H. Wiernik, and Jacob M.Row. Long-term survival in acute myeloid leukemia. Cancer, 80(11):2205–2209, 1997.
[5] Theodore Bergstrom. When is a man’s life worth more than his humancapital? In M. W. Jones-Lee, editor, The Value of Life and Safety, pages3–26. North Holland, Amsterdam, 1982.
[6] Theodore Bergstrom, Lawrence Blume, and Hal Varian. On the privateprovision of public goods. Journal of Public Economics, 29:25–49, 1986.
[7] Robin Boadway and David Wildasin. Public Sector Economics. Little,Brown and Company, Boston, second edition, 1984.
[8] Tomas Broberg, Tore Ellingson, and Magnus Johannesson. Is generosityinvoluntary. Economics Letters, 94(1):32–37, January 2007.
[9] London Health Sciences Centre. Bone marrow transplantation. Online athttp://www.lhsc.on.ca/transplant/bnmarrow.htm, 2006.
[10] V Chalandon, J-M Tiercy, U Schanz, T Gungo, J Halter, C Helg, B Cha-puis, A Gratwohl, A Tichelli, G de Vaveri, E Roosnek, and J Passweg.Impact of high-resolution matching in allogenid unrelated donor stem celltransplantation in switzerland. Bone Marrow Transplantation, 37:909–916,2006.
[11] C.S. Chim, A.K.W. Lie, R. Liang, Au W.Y., and Kwong Y.L. Long-term re-sults of allogeneic bone marrow transplantation for 108 patients with acutelymphoblastic leukemia: favorable outcome with bmt at first remission and
31

hla-matched unrelated donor. Bone Marrow Transplantation, 40(4):339–47,August 2007.
[12] Jason Dana, Daylian M. Cain, and Robyn M. Dawes. What you don’t knowwon’t hurt me: Costly (but quiet) exit in dictator games. OrganizationalBehavior and Human Decision Processes, 100(2):193–201, October 2006.
[13] Jason D. Dana, Roberto A. Weber, and Jason X. Kuang. Exploiting moralwiggle room: Behavior inconsistent with a preference for fair outcomes.Economic Theory, to appear, 2007.
[14] Pierre Dehez and Jacques Dreze. State dependent utility, the demand forinsurance, and the value of safety. In M. W. Jones-Lee, editor, The Valueof Life and Safety, pages 41–65. North Holland, Amsterdam, 1982.
[15] Brian Duncan. A theory of impact philanthropy. Journal of Public Eco-nomics, 88:2159–2180, 2004.
[16] Tore Ellingsen and Magnus Johannesson. Generosity. Technical report,Stockholm School of Economics, February 2007.
[17] Bart S. Fisher. The national marrow donor program with emphasis on theearly years. Transfusion, 47(6):1101–1102, June 2007.
[18] Guillermo Garcia-Manero, Moshe Talpaz, Stefan Faderi, and Hagop M.Kantarjian. Chronic myelogenous leukemia. In Robert I. Handin, Samuel E.Lux, and Thomas P. Stossel, editors, Blood: Principles and Practice ofHematology, 2nd ed. Lippincott Williams & Wilkins, Philadelphia, 2003.
[19] D. Gary Gilliland and Cynthia E. Dunbar. Myelodysplastic syndromes.In Robert I. Handin, Samuel E. Lux, and Thomas P. Stossel, editors,Blood: Principles and Practice of Hematology, 2nd ed. Lippincott Williams& Wilkins, Philadelphia, 2003.
[20] D. Gary Gilliland and Cynthia E. Dunbar. Allogeneic stem cell transplan-tation for non-hodgkin’s and hodgkin’s lymphoma. In George Canellos,T. Andrew Lister, and Bryan Young, editors, The Lymphomas, SecondEdition. Saunders Elsevier, Philadelphia, 2006.
[21] Magnus Johannesson, Per-Olav Johansson, and Lofgren Karl-Gustav. Onthe value of changes in life expectancy: Blips versus parametric changes.Journal of Risk and Uncertainty, 15:221–239, 1997.
[22] Michael Jones-Lee, M. Hammerton, and P.R. Philips. The value of safety:results of a national sample survey. Economic Journal, 95:49–72, 1985.
32

[23] C. Kollman, E. Abella, R.L. Baitty, P.G. Beatty, R. Chakraborty, C.L.Christiansen, R.J. Hartzman, C.K. Hurly, E. Milford, J.A. Nyman, T.J.Smith, G.E. Switzer, R.K. Wada, and M. Setterholm. Assessment of op-timal size and composition of the U.S. national registry of hematopoieticstem cell donors. Transplantation, 78(1):89–95, July 2004.
[24] Edward P. Lazear, Ulrike Malmendier, and Roberto A. Weber. Sorting inexperiments with application to social preferences. Technical report, NBERWorking Paper, February 2006.
[25] Jeffrey McCullough, Herbert A. Perkins, and John Hansen. The nationalmarrow donor program with emphasis on the early years. Transfusion,46(7):1248–1255, July 2006.
[26] Carl Mellstrom and Magnus Johannesson. Crowding out in blood dona-tion: Was Titmuss right? Working Papers in Economics 180, GoteborgUniversity, 2005.
[27] E.J. Mishan. Evaluation of life and limb: A theoretical approach. Journalof Political Economy, 79:687–705, 1971.
[28] M Mori, P.G. Beatty, M. Graves, KM Boucher, and F.L. Milford. HLA geneand haplotype frequencies in the North American population: the NationalMarrow Donor Program Donor Registry. Transplantation, 64:1017–1027,1997.
[29] Karl S. Peggs, Stephen Mackinnon, and David C. Linch. The role of al-logeneic transplantation in non-hodgkin’s lymphoma. British Journal ofHaematology, 128(2):153–168, 2004.
[30] National Marrow Donor Program. 2004 biennial report:the national bonemarrow donor registry. Technical report, US Health and Human Services,February 2006.
[31] National Marrow Donor Program. NMDP registry and transplant statistics.On line at http://www.marrow.org/NEWS/MEDIA/, February 2007.
[32] National Marrow Donor Program. Number of allogenic transplants per-formed. On line at http://www.marrow.org/PHYSICIAN/, 2007.
[33] Alberto Redaelli, Marc F. Botteman, Jennifer M. Stephens, and Chris L.Pashos. Economic burden of acute myeloid leukemia: A literature review.Cancer Treatment Reviews, 30(3):237–247, 2004.
33

[34] Alvin Roth, Tayfun Sonmez, and M. Utku Unver. Efficient kidney ex-change: Coincidence of wants in markets with compatibility-based prefer-ences. American Economic Review, 97(3):828–851, June 2007.
[35] Michael Savona and Moshe Talpaz. Chronic myeloid leukemia: Changingtreatment paradigms. Oncology, 20(7):707–711, 2006.
[36] Catherine Sebban, Eric Lepage, Jean-Paul Vernant, Elaine Gluckman,Michel Attal, Josy Reiffers, Laurent Sutton, and et al. Allogeneic bone mar-row transplantation in adult acute lymphoblastic leukemia in first completeremission: A comparative study. Journal of Clinical Oncology, 12(12):2580–2587, 1994.
[37] Richard Titmuss. The Gift Relationship. Allen and Unwin, London, 1970.
[38] U.S. Environmental Protection Agency. Guidelines for prepar-ing economic analyses. Internet publication, 1997. Available atyosemite.epa.gov/ee/epa/eed.nsf/webpages/Guidelines.html.
[39] W. Kip Viscusi and Joseph Aldy. The value of a statistical life: A criticalreview of market estimates throughout the world. Journal of Risk andUncertainty, 27(1):5–76, 2003.
[40] Neal S. Young and Akiko Shimamura. Acquired bone marrow failure syn-dromes. In Robert I. Handin, Samuel E. Lux, and Thomas P. Stossel,editors, Blood: Principles and Practice of Hematology, 2nd ed. LippincottWilliams & Wilkins, Philadelphia, 2003.
[41] Edward N. Zalta. Stanford Encyclopedia of Philosophy. Stanford University,http://plato.stanford.edu/entries/consequentialism/, 2006.
[42] Mei-Jie Zhang, Dieter Hoelzer, Mary M. Horowitz, Robert Peter Gale,Dorle Messerer, John P. Klein, Helmut Loffler, Kathleen Sobocinski, Eck-hard Thiel, and Daniel Weisdorf. Long-term follow-up of adults with acutelymphoblastic leukemia in first remission treated with chemotherapy orbone marrow transplantation. Annals of Internal Medicine, 123(6):428–431, 1995.
[43] Robert A. Zittound, Franco Mandelli, Roel Willemze, Theo de Witte,Boris Labar, Luigi Resegotti, Franco Leoni, and et al. Autologous or allo-geneic bone marrow transplantation compared with intensive chemother-apy in acute myelogenous leukemia. New England Journal of Medicine,332(4):217–223, 1995.
34