department of civil engineering and mechanics the ... reports... · department of civil engineering...
TRANSCRIPT

Department of Civil Engineering and Mechanics The University of South Florida
Restraint Effect of Bearings (Phase I)
Rajan Sen and Ken Spillett
Department of Civil Engineering and Mechanics
January 1994
A Report on a Research Project Sponsored by the Florida Department of Transportation in cooperation with
the U.S. Department of Transportation Contract C-4069
Tampa, Florida


DISCLAIMER The opinions, findings and conclusions expressed in this publication are those of the authors and not necessarily those of the State of Florida Department of Transportation or the US Department of Transportation.
i
ii

PREFACE
The investigation reported was funded by a contract awarded to the University of South Florida, Tampa by the Florida Department of Transportation in cooperation with the US Department of Transportation. Dr. Mohsen Shahawy, Chief Structural Analyst, Florida Department of Transportation was the Project Manager. It is always a pleasure to acknowledge his overall contribution to the project.
Additional financial support was provided by the College of Engineering, University of South Florida with matching support from the Division of Sponsored Research (DSR). We are indebted to Dr. Mel Anderson, Associate Dean, Dr. Tom Wade, former Associate Dean of Research, (both from the College of Engineering) and Dr. Richard Streeter, Director, DSR for this support. We also wish to thank Dr. Wayne Echelberger, Jr., Chairman, Department of Civil Engineering & Mechanics for his support and interest in the project.
A critical element in the study was the design of a refrigeration system that enabled sub-zero temperatures to be realized in a 26 ft x 10 ft x 15 ft 8 in. environmental chamber that enclosed the test bridge. We are indebted to Dr. Linus Scott, Professor of Mechanical Engineering, University of South Florida and his student assistant, Mr. Steve Weber, for providing the necessary expertise and for their enthusiastic support and cooperation in the project. The chamber itself was constructed by Mr. Ernie Hogue, formerly an undergraduate student in the Department of Civil Engineering and Mechanics.
The invaluable: contribution of Dr. John Stanton, Professor of Civil Engineering, University of Washington; Seattle is gratefully acknowledged. We also wish to thank Dr. Baidar Bakht, Ministry of Transportation, Ontario, Mr. Angelo Garcia and Mr. Jesse Ortiz - both from the Florida Department of Transportation, for their assistance. As always, the support of Mr. Gray Mullins, Mr. Robert Tufts (both Department of Civil Engineering & Mechanics, USF) and Mr. Jerry Miller, Mr. Bob Smith and Mr. Bryan O'Steen (all from the Engineering Shop, USF) was crucial in the experimental investigation.
Finally, the report could not been completed without the indefatigable efforts of graduate students Ms. Usha Ramachandaran, Mr. Jose Rosas and Ms. Satya Sukumar. We also wish to thank former graduate students Mr. David Hodge (of DRC consultants, Tampa) and Mr. Antoine Gergess (of Parsons Brinckerhoff, Tampa) for their assistance.
iii

EXECUTIVE SUMMARY
This report provides experimental and analytical results of an investigation to determine the restraint effect of elastomeric bearings. A simply supported, two-lane, 20 ft x 7 ft wide bridge consisting of three W8 x 24 steel beams acting compositely with a 4.5 in. thick concrete slab was designed and fabricated. The proportions of the steel beam were based on .a two-lane, :80 ft span prototype structure. Each steel beam was supported on elastomeric bearing pads that were designed to comply with current AASHTO provisions and also to be in broad agreement with criteria used in the design of standard bearing pads in the State of Florida.
A 26 ft long x 10 ft wide x 15 ft 8 in. high environmental chamber was constructed around the test bridge to allow simulation of historical temperature extremes in Florida. In the testing, a temperature of -3.7°F was realized using a 1 ton capacity 3 phase, 208 Volt, Bohn condensing unit in conjunction with a Bohn Evaporator Coil LET 1201 having an electric defrost and heat exchange unit.
Preliminary tests were conducted to assess the response of the test bridge. The service response was found to be linear and the validity of the principle of superposition was demonstrated. Load distribution tests were conducted in which the load position was varied along the span. Analysis of the test data indicated that the AASHTO 'D' value accurately characterized the bridge.
Tests to assess bearing restraint effects were conducted by subjecting the bridge to temperatures in the range of -2.5°F to 125°F and measuring the response to simulated truck loads. The results from the tests confirmed the presence of restraint forces at the elastomeric bearings. The maximum restraint effect, relative to the 80°F temperature at which the bridge was constructed, was found to be at the lowest temperature where about a 15 % reduction in the (maximum) service moment was obtained. However, reductions at higher temperatures were relatively insignificant.
While the tests confirm field data, the results from this study cannot be directly extrapolated to full sized structures in view of the dependence of the mechanical properties of elastomeric bearing pads on their manufacture. Nevertheless, the evidence that restraint forces are present suggests that consideration should be given to its eventual incorporation in the design of sub-structure elements.
iv


4. MATERIALS, FABRICATION AND INSTRUMENTATION OF BRIDGE MODEL
4.1 Introduction 4-1 4.2 Material Properties 4-1 4.2.1 Concrete 4-1 4.2.2 Reinforced Steel 4-1 4.2.3 Steel Girders 4-2 4.2.4 Stud Shear connectors 4-2
4.3 Fabrication 4-3 4.3.1 Deck Framing 4-3 4.3.2 Formwork 4-5 4.3.3 Deck Slab 4-5 4.3.4 Elastomeric Bearing Pads 4-9 4.3.5 Bridge Supports 4-9 4.4 Loading System 4-9 4.5 Instrumentation 4-10 4.5.1 Strain Gages 4-10 4.5.2 Load Cells 4-16 4.5.3 LVDT 4-16 4.5.4 Thermocouples 4-18 4.5.5 Data Acquisition System 4-18 4.6 Testing Program 4-18 5. SUPERPOSITION TESTS 5.1 Introduction 5-1 5.2 Test Program 5-1 5.3 Results 5-1 6. LOAD DISTRIBUTION 6.1 Introduction 6-1 6.2 Test Program 6-1 6.2.1 Results 6-2 6.3 Numerical Analysis 6-6 6.3.1 Grillage Analysis 6-6 6.3.2 Semi-Continuum Analysis 6-7 6.4 Discussion of Results 6-8 7. RESTRAINT EFFECT OF ELASTOMERIC BEARINGS 7.1 Introduction 7-1 7.2 Design of Bearing Pad 7-1 7.3 Environmental Chamber 7-4
vi

7.4 Test Procedure 7-7 7.5 Results 7-10 7.6 Absolute Bearing Restraint 7-10 7.6.1 Strain Data 7-10 7.6.2 Restraint Moment 7-10 7.7 Relative Restraint Effect 7-21 7.7.1 Strain Data 7-21 7.7.2 Restraint Moment 7-21 8. CONCLUSIONS 8-1 9. REFERENCES 9-1 APPENDIX A - Prototype Bridge Design A-1 APPENDIX B - Load `Distribution - Sample Calculation B-1 APPENDIX C - Model Bridge Bearing pad C-1
vii

LIST OF TABLES 2.1 Range of Shear Modulus 2-5 3.1 Section properties of prototype and model bridge 3-3 4.1 Concrete mix design 4-2 4.2 Girder dimensions 4-4 4.3 Embedded strain gage position 4-12 4.4 Strain gage distance - North girder 4-13 4:5 Strain gage distance - Center girder 4-14 4.6 Strain gage distance - South girder 4-15 4.7 Thermocouple numbering 4-19 6.1 D value for single load 6-5 6.2 D value for double load 6-6 6.3 D value for truck load 6-6 6.4 Comparison of D value for single load 6-11 6.5 Comparison of D value for double load 6-12 6.6 Comparison of D value for truck load 6-12 7.1 Summary of Temperature readings 7-8 7.2 Longitudinal Strain at Abutment (Adjusted to 2000 lb & 4000 lb) 7-11 7.3 Longitudinal Strain at Abutment (Adjusted to 8000 lb & 10000 lb) 7-12 7.4 Longitudinal Strain at Midspan (Adjusted to 2000 lb, 4000 lb, 8000 -lb & 10000 lb) 7-15 7.5 Longitudinal Strain at Abutment - Referred to 80°F (Adjusted to 2000 lb & 4000 lb) 7-23 7.6 Longitudinal Strain at Abutment - Referred to 80°F (Adjusted to 8000 lb & 10000 lb) 7-24 7.7 Longitudinal Strain at Midspan - Referred to 80°F (Adjusted to 2000 lb, 4000 lb, 8000.1b & 10000 lb) 7-25 A-1 Composite Section for Maximum Positive Moment (3n=24) A-4 A-2 Composite Section for Maximum Positive Moment (n=8) A-5 A-3 Summary of Composite Section Properties A-6 A-4 Maximum Stud Spacing for Girders A-10
viii

LIST OF FIGURES
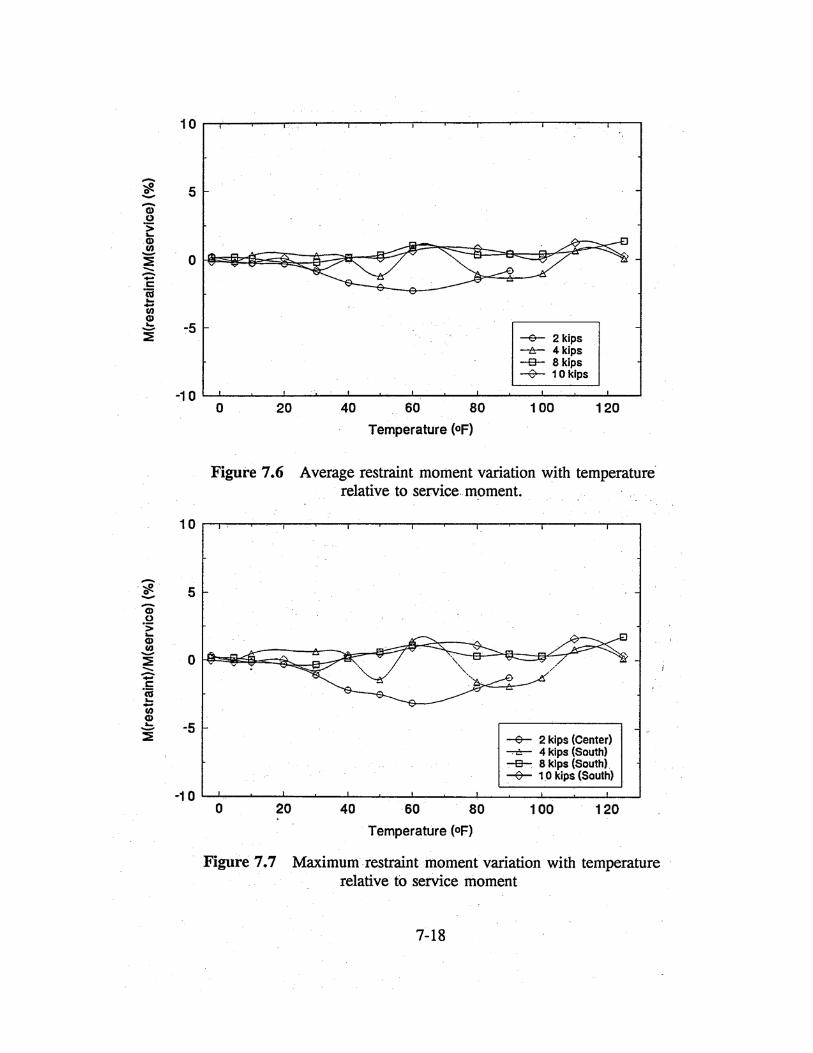
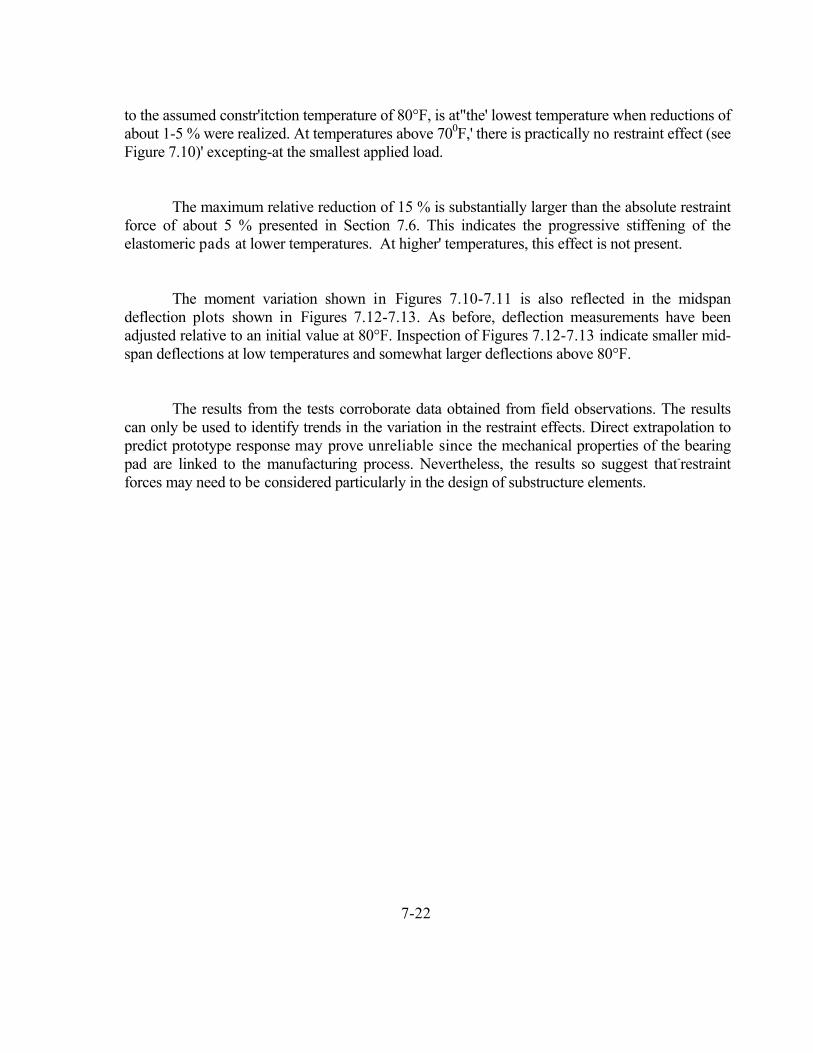
1.1 Schematic diagram of a laminated elastomeric bearing 1-1 1.2 Expansion Restraint - Reduction in Moment (after Bakht [1.4]) 1-3 2.1 Typical Bearing Deformation - Compression 2-2 2.2 Typical Bearing Deformation - Shear 2-2 2.3 Typical Bearing Deformation - Rotation 2-3 3.1 Bridge Plan and Elevation view 3-4 3.2 Test Bridge details 3-5 4.1 Girder dimension definition 4-3 4.2 Cross-section showing reinforcement details 4-6 4.3 Embedded strain Gage location 4-12 4.4 Strain Gage positions - North Girder 4-13 4.5 Strain Gage positions - Center Girder 4-14 4.6 Strain Gage positions - South Girder 4-15 4.7 Strain gauge locations - Diaphragms 4-16 4.8 Location of LVDT 4-18 4.9 Thermocouple Installation Locations 4-19 5.1 Truck load placement 5-2 5.2 Superposition of deflection results 5-4 5.3 Superposition of deflection results 5-5 5.4 Superposition of reaction results 5-6 5.5 Superposition of reaction results 5-7 6.1 Location of single load 6-3 6.2 Location of double load 6-3 6.3 Truck loading 6-4 6.4 Grillage idealization 6-7 6.5 Single load 6-9 6.6 Double load 6-9 6.7 Truck load - North lane loaded 6-10 6.8 Truck load - South lane loaded 6-10 6.9 Truck load - Both lane loaded 6-11 7.1 Type III Bearing pad 7-3 7.2 Model bearing pad 7-3 7.3 Horizontal movement of Bearing pad 7-13 7.4 Moment Ratio at loads of 2000 lb & 4000 lb 7-16 7.5 Moment Ratio at loads of 8000 lb & 10000 lb 7-17 7.6 Average restraint moment variation with temperature relative to service moment 7-18

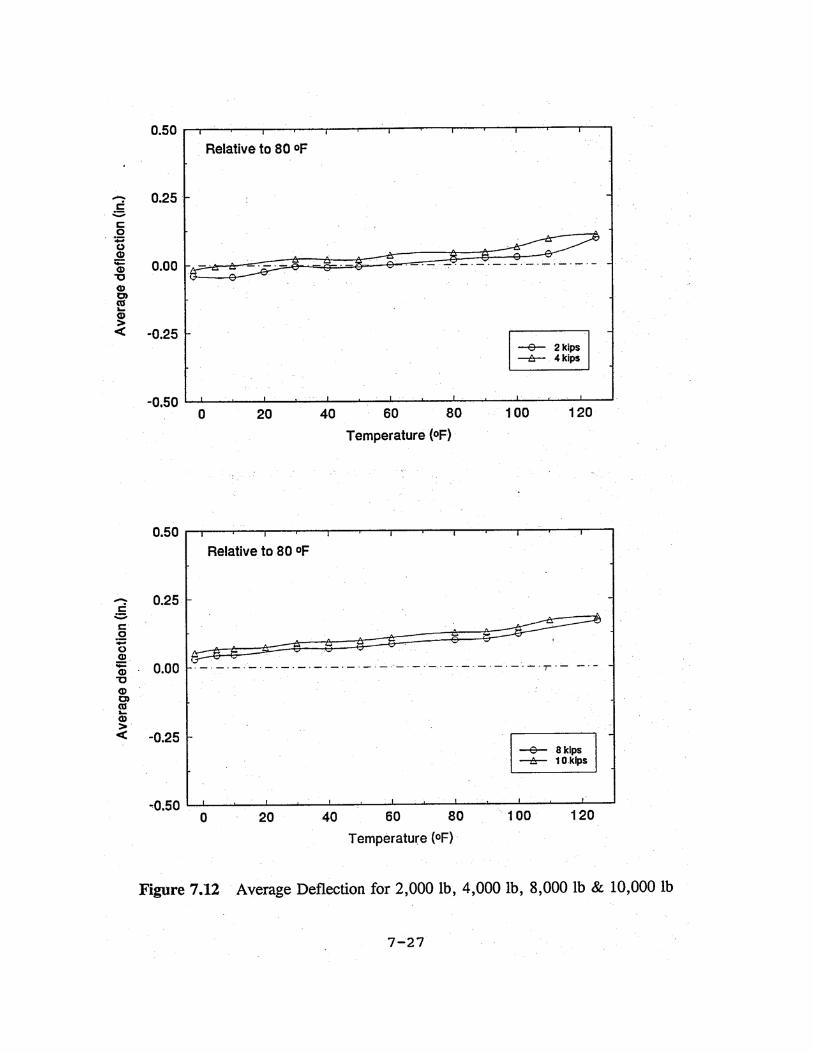
7.7 Maximum restraint moment variation with temperature relative to service moment 7-18 7.8 Deflection Ratio at loads of 2000 lb & 4000 lb 7-19 7.9 Deflection Ratio at loads of 8000 lb & 10000 lb 7-20 7.10 Average restraint moment variation with temperature relative to service moment (Referred to 80°F) 7-26 7.11 Maximum restraint moment variation with temperature relative to service moment (Referred to 80°F) 7-26 7.12 Average Deflection for 2000 lb, 4000 lb, 8000 lb &-10000 lb 7-27

LIST OF PLATES
4.1 Close-up of shear connectors 4-7 4.2 Welding of extra shear connectors for Phase 11 4-7 4.3 Close-up of deck reinforcement 4-8 4.4 Raking concrete in place 4-8 4.5 50 ton loading jacks 4-11 4.6 Truck load assembly 4-11 4.7 Load cells for measuring reactions 4-17 4.8 LVDT assembly to measure bearing pad movement 4-17 7.1 View of bridge inside environmental chamber 7-5 7.2 View of window irr north wall 7-5 7.3 Thermocouple reading 7-9 7.4 Thermocouple reading 7-9
xi


1. INTRODUCTION
1.1 Introduction
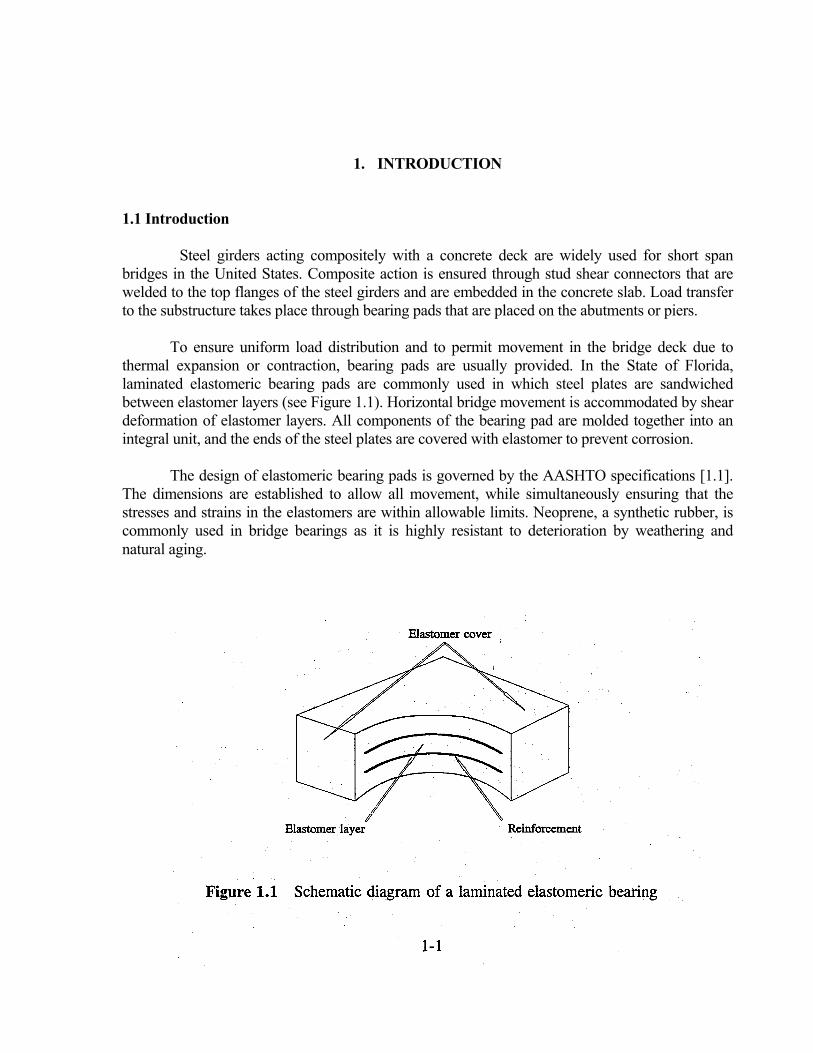
Steel girders acting compositely with a concrete deck are widely used for short span bridges in the United States. Composite action is ensured through stud shear connectors that are welded to the top flanges of the steel girders and are embedded in the concrete slab. Load transfer to the substructure takes place through bearing pads that are placed on the abutments or piers.
To ensure uniform load distribution and to permit movement in the bridge deck due to
thermal expansion or contraction, bearing pads are usually provided. In the State of Florida, laminated elastomeric bearing pads are commonly used in which steel plates are sandwiched between elastomer layers (see Figure 1.1). Horizontal bridge movement is accommodated by shear deformation of elastomer layers. All components of the bearing pad are molded together into an integral unit, and the ends of the steel plates are covered with elastomer to prevent corrosion.
The design of elastomeric bearing pads is governed by the AASHTO specifications [1.1].
The dimensions are established to allow all movement, while simultaneously ensuring that the stresses and strains in the elastomers are within allowable limits. Neoprene, a synthetic rubber, is commonly used in bridge bearings as it is highly resistant to deterioration by weathering and natural aging.

Although the bearing pad is designed to allow movement, such movement may not always be realized because of changes in the material properties of the elastomer. In such a case, restraint forces are set up at the bearings that modify superstructure bending moments. This has been observed in field tests [1.2-1.4].
The first results on bearing restraint effects were reported by Bakht, 1988 [1.2]. In the
study, the 54.33 ft. span, 30.33 ft. wide Bell River Bridge, Ontario, Canada consisting of 5 steel girders, acting non-compositely with concrete deck slab, was tested.
Each girder was supported on a 12 in. x 12 in. steel bearing plate at its ends. The restraint force was estimated from observed girder 'strains near the abutments. This indicated that the computed girder moments were up to 26% smaller than that predicted by analysis [1.3].
In the same year, Bakht [1.4] also conducted tests on the North Muskoka River Bridge, Ontario. This 152.3 ft. long, 48.7 ft. wide bridge comprises five steel girders acting compositely with an 8 in. thick concrete deck slab. Each end of the girders was supported on a 2.56 in. thick laminated neoprene bearing' pad measuring 1.87 ft. x 1.12 ft. in plan. As before, observed girder moments at mid-span were 9% less than the corresponding moments obtained from analysis. Bakht also showed that such a reduction of mid-span moment corresponded to a reduction of about 12% in the mid-span deflection.
Bakht reported [1.4] that when the same North Muskoka River Bridge had been
dynamically tested by Billing [1.5] in 1984, it appeared to be 20% stiffer in flexure than could be rationalized analytically. This reduction was much larger than the 12% reduction obtained by Bakht in 1988.
. Bakht suggested that the discrepancy in the test results was due to the nature of the
restraint at the bridge bearing. Since the stiffness of the elastomeric bearing pad was a function of temperature, at lower temperatures, the elastomer layers were stiffer than assumed in the design and therefore allowed less movement (see also Section 2.6).
Billing's test was conducted on a cool day in October, while the test by Bakht was
conducted on a very hot day in June. As a result, larger forces were introduced at the level of the bearing pad (see Figure 1.2) which were responsible for the greater reduction in the deck moments.
The reduction in observed bending moments suggests that posted bridges may have
larger capacities than predicted by analysis. The extent of this extra capacity over the entire temperature range can only be determined on the basis of careful experimentation.
1-2

1.2 Objectives of Study
The primary aim of the study was to establish whether observed restraint effects in beam and slab bridges supported on elastomeric bearings could also be reproduced in the laboratory. A secondary objective was to determine the elastic response of the test bridge and also to establish its load distribution characteristics.
To meet the overall objectives of the study, it was necessary to design, construct and
instrument a beam and slab bridge that was similar to that tested in the field. Additionally, it was necessary to construct an environmental chamber around the bridge that would allow it to be cooled to at least -2°F and heated to 109°F, the lowest and highest temperatures ever recorded in the State of Florida [1.6].
1.3 Organization of Report
General information on laminated elastomeric bearing pads is summarized in Chapter 2. The basis for designing the test bridge used in the study is described in Chapter 3. Information on materials, fabrication, instrumentation and loading of the test bridge is presented in Chapter 4.
1-3
Tests to determine characteristic parameters- of the beam and slab bridge tested appear, in Chapters 5 (superposition tests) and 6; (load distribution results). The focus of the project, the restraint effects of bearings is contained in Chapter 7. This describes the construction of the environmental chamber, the basis of modeling the bearing pads and provides complete results and analysis of all data. The main conclusions from the study are outlined in Chapter S.
In addition to the eight chapters, three appendices complement information on design
and analysis presented in the main text. .

2. ELASTOIVIERIC BEARINGS 2.1 Introduction
This chapter provides general information on elastomeric bearings. General background information and fabrication practices are described in Section 2.2. The mechanical properties are covered in Section 2.3. Sections 2.4 and 2.5 discuss the hardness characteristic and possible failure modes of elastomers, respectively. Finally, Section 2.6 presents information relating to the low temperature performance of elastomers.
2.2 General Background
Bearing pads accommodate movements due to creep or thermal effects, and act as seating pads to provide uniform bearing for members and to compensate for fabrication misalignment. For bridge applications, bearing pads must be designed to resist high stresses. Although plain pads can be used, high loads necessitate the use of laminated construction in which steel layers are sandwiched between layers of elastomer: The most common types of bearings presently in use are either steel or fiber reinforced elastomeric pads. The elastomer may be multifarious mixtures of polyisoprene (natural rubber) or polychloroprene (neoprene), each with dissimilar properties. This elastomer must be vulcanized after the reinforcement has been bonded to the rubber which assures a stable, durable bearing with, a high quality bond between the elastomer and the reinforcement. Also, cover layers of the elastomer are placed above and below the top and bottom layers of the reinforcement and around the edges, as shown in Figure 1. l, to provide corrosion protection.- However, manufacturers have developed methods in which a large sheet of steel reinforced elastomer is sawn into smaller bearings, thereby, eliminating edge cover. But these are not widely used for structural applications.
The reinforced elastomeric assemblies currently used in Florida, and in other areas, permit
the support of large loads and have the ability to withstand large movements. Under compressive loads, the elastomer bulges outward with the reinforcement restricting the bulge, as in Figure 2.1. Shear deformation of the elastomer permits horizontal movement of the bridge resulting from shrinkage, thermal expansion or creep as shown in Figure 2.2. Rotation is dealt with by the assembly through partial bulging as shown in Figure 2.3.
2-1

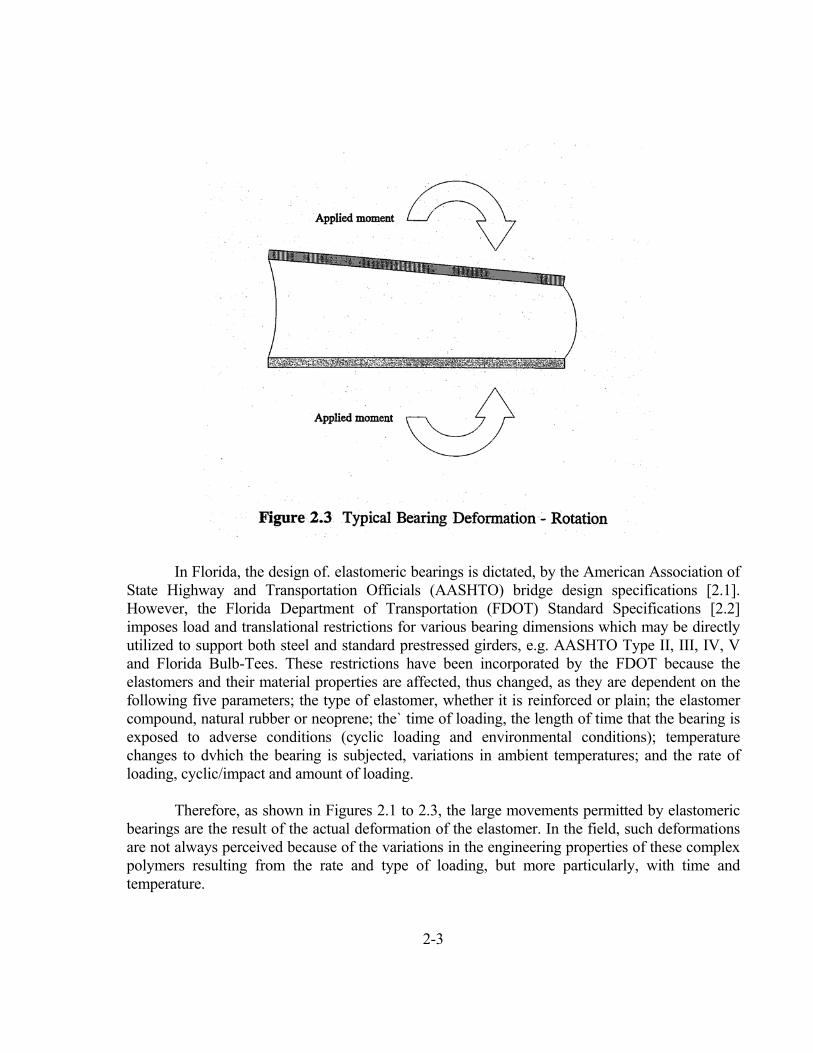
In Florida, the design of. elastomeric bearings is dictated, by the American Association of
State Highway and Transportation Officials (AASHTO) bridge design specifications [2.1]. However, the Florida Department of Transportation (FDOT) Standard Specifications [2.2] imposes load and translational restrictions for various bearing dimensions which may be directly utilized to support both steel and standard prestressed girders, e.g. AASHTO Type II, III, IV, V and Florida Bulb-Tees. These restrictions have been incorporated by the FDOT because the elastomers and their material properties are affected, thus changed, as they are dependent on the following five parameters; the type of elastomer, whether it is reinforced or plain; the elastomer compound, natural rubber or neoprene; the` time of loading, the length of time that the bearing is exposed to adverse conditions (cyclic loading and environmental conditions); temperature changes to dvhich the bearing is subjected, variations in ambient temperatures; and the rate of loading, cyclic/impact and amount of loading.
Therefore, as shown in Figures 2.1 to 2.3, the large movements permitted by elastomeric
bearings are the result of the actual deformation of the elastomer. In the field, such deformations are not always perceived because of the variations in the engineering properties of these complex polymers resulting from the rate and type of loading, but more particularly, with time and temperature.
2-3

2.3 Properties of Elastomers
An elastomer, whether neoprene or natural rubber, has highly nonlinear, visco-elastic, thixotropic constitutive properties [2-3]. This means that the stress-strain relationship is nonlinear due to the material's long chain cross-linked molecular structure. Also, the resistance to deformation is dependent on temperature and the rate of loading; it may or may not return to its original non-deformed state if left undisturbed.
Nevertheless, analyses of elastomeric bearings have been conducted with the
assumption that they are linear elastic, isotropic and that the deformations are small enough to be negligible [2.4, 2.5]. This provides results that can be easily used by design engineers. However, these assumptions are not entirely accurate because elastomeric bearings may undergo significant deformations in service. Investigations into the incorporation of nonlinear finite element analysis for the design of bearings are being presently undertaken [2.6].
2.4 Hardness
The elastic modulus, E, of rubber is related to its hardness where hardness is measured with a durometer. The degree of hardness is proportional to the depth of indentation for a known load. Since the nature of the test is, in itself, not very reproducible, a considerable dispersal of results is obtained. Still, because of the simplicity of the test, it is the most prevalent method of relating material properties of elastomeric bearings.
Relationships between the hardness differs for the same rubber because of the number
of hardness scales and the differing geometry of the indentor. However, reasonable correlation has been achieved with the Shore A Hardness Test [2.7]. The association between the respective moduli are shown in Eq. .2.1 and Eq. 2.2 below.
G = E/2(1 + v) (2.1)
K = E/3(1 - 2v) (2.2) where, G is the shear modulus, E the elastic modulus, K the bulk modulus and v, the, Poisson's ratio.
Within the AASHTO design code [2.1], the design values for the respective properties are shown in Table 2.1.
2-4

If the actual elastic properties of the material are measured, the elastic modulus, E,
will be nearly three times the value of the shear .modulus, G, (90-120 psi for 50 hardness; 180-240 psi for 70 hardness) and the bulk modulus, K, approximately 300,000 psi. These are generally accepted limits.
2.5 Failure Modes
The failure modes of elastomers do not necessarily result in the failure of a bridge bearing but are either used .as; an indication :of service life or a test of the material. Elastomer failure may occur through elongation of the rubber, internal rupture, crack propagation and/or fatigue.
2.5.1- Elongation
Generally, elastomers fail when tensile stresses are generated within, the body. The magnitude of this failure stress is dependent on the extent of elongation, which in turn relies on the stiffness and blend of elastomer. Although elongation is not a primary concern for bridge. bearings, as they are generally loaded in compression -Figures 2.1 to 2.3, it is used as a quality control device that facilitates verification of unfit or questionable compounds. However, instances do occur, where excessive rotations of the girder may induce tensile stresses in the elastomer. This is rare since design provisions limit rotation.
2.5.2 Internal Rupture
This mode of failure is autonomous of tensile stress and/or elongation and arises at- stress levels below the failure stress for uniaxial tension, Gent and Lindley [2.8]. The cause is from the build up of intermolecular stress which results in a separation within
2-5

the rubber. This failure indicates a reduced life expectancy of the bearing, but not failure. This happens in laminated bearings with high shape factors [2.9]. 2.5.3 Crack Propagation
investigations relating to crack propagation through elastomers have been based on tear tests [2.10,2:11] which demonstrate a possible association between tearing behavior and life expectancy of the bearing. Although there are useful correlations under linear elastic parameters, the validity for a polymer with nonlinear properties requires further study. Fatigue load with compressive forces further increases the cracking but the area of delamination is typically at the rubber steel reinforcement interface [2.12].
2.6 Effect of Temperature
The Low Temperature Performance of Elastomeric Bearings Report, published in 1990 [2.13], distinguishes two types of stiffness increase caused by low temperature. Firstly, low temperature crystallization is a time and temperature dependent stiffening process: The characteristic of this process is the reorientation of the molecular structure due to environmental conditions. Secondly, a second order transition or instantaneous thermal stiffening results, independent of time, when the material cools below the second order transition temperature. The extent of the stiffening varies with the type of elastomer compound. For synthetic rubbers, rapid crystallization begins at approximately 14°F and reaches second order transition at temperatures in the order of -58°F. The State of the Art Report on elastomerc bearings, published in 1991 [2.14], notes that the stiffness of elastomers at low temperatures may be as much as 20-50 times that at room temperature.
The lowest temperature ever recorded in Florida was -2°F in Tallahassee on
February 13, 1899, and the highest was 109°F in Monticello on June 21, 1931; both in Leon county [2.15]. This temperature range of 111°F, far exceeds the maximum range
of 85° F assumed in design [2.16]. As the lowest recorded temperature is below that for rapid crystallization of neoprene, a certain amount of stiffening of the elastomer may occur in some areas of Florida.
As previously noted, elastomerc bearings are designed [2.16] to accommodate specific movement of the bridge. Should such movement be prevented by the increase in the stiffness of the elastomer, restraining forces are generated at the bearings. Consequently, the bending moments in the super-structure are altered. If the bearings restrain thermal expansion, the resultant forces create negative moments that reduce the super-structure positive moments, as shown in Figure 1.2. Field tests conducted in
2-6

Canada have demonstrated such reductions [2.17-2.19].
A subsequent effect of bearing restraints on bridge structures, in addition to super-structure moment modification, is the introduction of bending moments within the sub-structure. To date, little data is available for sub-structure effects, and consequently, the current design specifications ignore these effects.
2-7

3. DESIGN OF TEST BRIDGE 3.1 Introduction
As noted earlier, the prime objective of the study was to assess the extent and importance of bearing restraint effects in beam and slab bridges. In view of this, the principles governing stress similitude in model structures [3.1] were not strictly followed. These departures were deemed necessary to ensure proper modeling of the bearing pad and also to ensure success in the second phase of the experimental investigation.
The most important departure was the use of a thicker deck slab and the simultaneous
provision of increased connection strength between the slab and steel beams. This means that stresses in the steel girder or in the concrete slab obtained from the tests cannot directly be related to those in the prototype. This however, is not the focus of the study.
The increase in the slab thickness and composite action was necessitated by the
requirement in Phase II of this study [3.2] in which the feasibility of strengthening steel composite beams using carbon fiber reinforced plastic laminates was to be investigated. For this purpose, it was very important to have sufficient capacity in the concrete slab to avoid premature failure.
A thicker slab was also very beneficial for the bearing restraint study since it ensured
higher compressive stresses in the bearing pads without having to resort to the placement of dead load compensation blocks that would otherwise be needed. Although
AASHTO [3.3] does not stipulate minimum compressive stresses in bearing pads, such provisions are included in the CALTRAN specifications [3.4] that require minimum compressive stress levels of`at least 200 psi.
The strategy used in the design of the test bridge was to base the dimensions of the steel beams on that of a prototype bridge using appropriate scaling factors. Subsequently, all efforts were directed towards ensuring that the elastomeric bearing pad allowed movements similar to that in prototype structures while simultaneously being subjected to similar stress levels.
The design of the prototype bridge used for sizing the steel beams in the test bridge was
based on the AASHTO Standard Specifications for Highway Bridges [3.3] and FDOT Design Guidelines [3.5]. The salient features of the design are discussed in Section 3.2. The basis of designing the test bridge is described in Section 3.3. Details on the design and modeling considerations of the elastomeric bearing pads used in the testing are presented in Section 7.2.
3-1

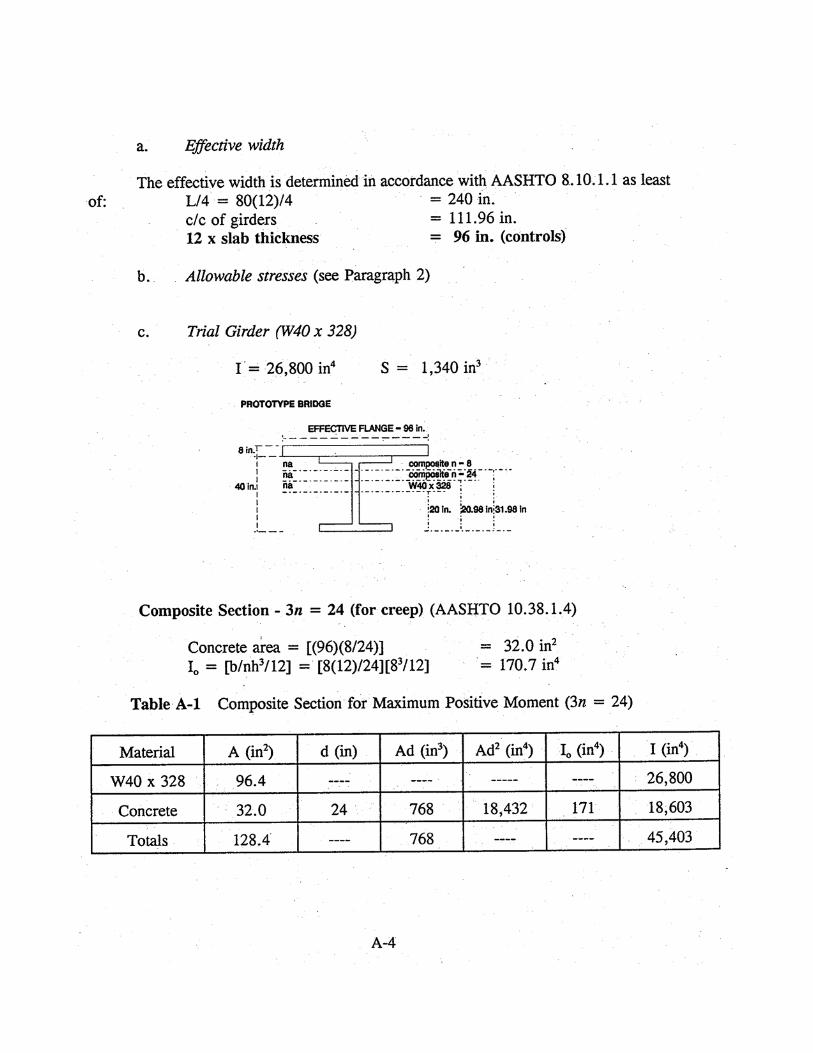
3.2 Prototype Design
The prototype bridge is a 80 ft span, 28 ft wide, two lane, simply supported steel composite bridge. It consists of three equally spaced girders acting compositely with a 8 in. thick concrete deck. Composite action between the concrete deck and the girders was ensured through stud shear connectors that were welded to the top flange.
The three steel girders spaced at 9 ft. 4 in. on center were laterally supported by channel (C 15 x 50) diaphragms attached to it at the supports, quarter points and mid-span sections. The girders were supported at each end on elastomeric bearing assemblies that allowed expansion at one end. Complete details of the design calculations for the prototype are included in Appendix A. 3.3 Model Design
As noted in the introduction, the principles of similitude were only used to obtain the initial dimensions of the test bridge from that of the prototype using scaling factors.
A scale factor, s;, is defined by Eq. 3.1 as Si= [ip/ im] (3.1)
where, ip and im correspond to the prototype and model properties respectively. The scale factors needed for the bridge are length and force.
For this study, the laboratory facilities at the University of South Florida dictated a maximum model length of 20 ft. Therefore, a one quarter scale factor was chosen for the physical dimensioning of the 80 ft. prototype bridge. Scale factors for stress, sa and strain, sσ, must be unity as the materials: for both the prototype and model were essentially the same. The applicable scale factors necessary for this study were provided by Eqs. 3.2-3.10 below:

3.3.1 Model Geometry
The initial dimensions of the model bridge decks were calculated by simply applying the length scale factor, Eq. 3.2, to the appropriate prototype dimensions.
Table 3.1 summarizes the properties of the prototype, the ideal model and the chosen
wide flange section, with applicable percent differences.
3.3.2 Reinforced Concrete Deck Slab
The W8 x 24 steel beam selected (see Table 3.1) was obtained from similitude principles and is therefore based on a slab thickness of 2 in. This slab thickness was insufficient to provide a minimum compressive stress of 200 psi on the bearing pad, recommended by the CALTRAN specifications [3.4].
While a 200 psi stress could be achieved by providing dead load compensation
blocks on the bridge deck, this would be both costly and. unnecessary, - since stress similitude was not the focus of the study. In view of this, a 4.5 in. thick slab was used instead. This ensured a total compressive stress of 200 psi in the bearing pad and at the same time provided the capacity needed for Phase II of this study.
The 4.5 in. thick slab was reinforced by two layers of No. 6 steel bars placed 9 in.
on center transversely and 12 in. on center longitudinally. Shear connectors provided ensured that the entire compression capacity of the slab could be transferred to be steel beams.
The plan and cross-section of the test bridge are shown in Figures 3.1-3.2.
3-3


3. MATERIALS, FABRICATION AND INSTRUMENTATION OF TEST BRIDGE
4.1 Introduction
This chapter presents details pertinent to the material properties (Section 4.2), fabrication (Section 4.3), loading (Section 4.4) and instrumentation (Section 4.5). Brief outline of the test program is included in Section 4.6.
4.2 Material Properties 4.2.1 Concrete
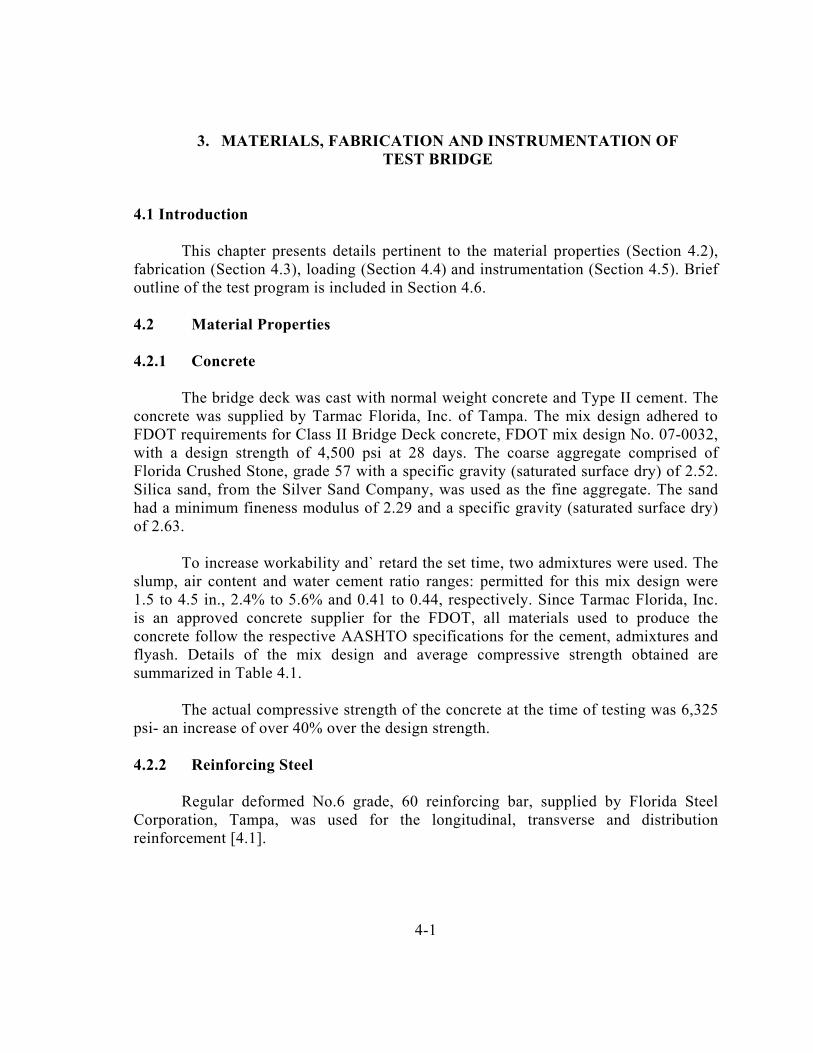
The bridge deck was cast with normal weight concrete and Type II cement. The concrete was supplied by Tarmac Florida, Inc. of Tampa. The mix design adhered to FDOT requirements for Class II Bridge Deck concrete, FDOT mix design No. 07-0032, with a design strength of 4,500 psi at 28 days. The coarse aggregate comprised of Florida Crushed Stone, grade 57 with a specific gravity (saturated surface dry) of 2.52. Silica sand, from the Silver Sand Company, was used as the fine aggregate. The sand had a minimum fineness modulus of 2.29 and a specific gravity (saturated surface dry) of 2.63.
To increase workability and` retard the set time, two admixtures were used. The slump, air content and water cement ratio ranges: permitted for this mix design were 1.5 to 4.5 in., 2.4% to 5.6% and 0.41 to 0.44, respectively. Since Tarmac Florida, Inc. is an approved concrete supplier for the FDOT, all materials used to produce the concrete follow the respective AASHTO specifications for the cement, admixtures and flyash. Details of the mix design and average compressive strength obtained are summarized in Table 4.1.
The actual compressive strength of the concrete at the time of testing was 6,325
psi- an increase of over 40% over the design strength. 4.2.2 Reinforcing Steel
Regular deformed No.6 grade, 60 reinforcing bar, supplied by Florida Steel Corporation, Tampa, was used for the longitudinal, transverse and distribution reinforcement [4.1].
4-1

Manufacture of the rebar conformed to ASTM-A615-90, Thermex Treated, and resulted in a- yield strength of 76.8 ksi and tensile strength of 96.3 ksi. 4.2.3 Steel Girders
The wide flange steel girders, W8 x 24 x 20 ft. long, used for the model bridge, were furnished by O'Neal Steel Inc., Tampa. The material properties of the -steel conformed to the ASTM Structural Steel Specifications for ASTM A36. Tests conducted on this section adhered to ASTM A-6-90A and provided the specific material characteristics. The yield and tensile strengths for the girder were 53.5 ksi and 74.9 ksi respectively.
4.2.4 Stud Shear Connectors
Commercially available 3/4 in. diameter, 2 in. long headed steel studs were used. See Plate 4.1-4.2.
4-33

4.3 Fabrication
Construction of the model bridge was carried out beneath the load reaction frame at the University of South Florida, Tampa, due to the model size, weight and limitations on the lifting equipment available.
Gulf Coast` Marine Construction Inc., St. Petersburg, assisted in the pouring, screeding
and finishing of the bridge:
4.3.1 Deck Framing
The W8 x 24 steel girders were first verified for actual length and dimensional tolerances as shown in Figure 4.1 and 'Table 4.2. They were then trimmed to the 20 ft.
span length and placed at their 2 ft. 4 in. on center spacing. The diaphragm channels, C4 x 7.25, were cut to length and similarly laid out at their proposed locations - supports, quarter points and mid-span, or 5 ft. on center. Since Phase II of the investigation did not require the channel sections, a bolted connection was used to secure the channels. This consisted of a 5/16 in. x 3 in. x 4 in. flat bar; grade A36, welded in a vertical orientation to the web of the girders.
4-3

The outside girders had the connecting bars on one side of the web pointing towards the inside of the bridge; whereas, the bars for the interior girder were placed on either side of the web. Two holes were drilled into each of the bars to accommodate the 0.5 in. diameter A325 bolts.
The stud shear connectors were welded to the top flange of the girder. Spacing of
these stud connectors was symmetrical about the mid-span and was governed by the shear distribution along the bridge. Additionally, bearing stiffeners made up of 5/16 in. plates were welded between the top and bottom flanges over the center of the bearing pad location.
All the welded connections utilized in the model bridge substructure were made by
the shielded metal arc welding process (SMAW). Full penetration welds, consisting of one pass with a 1/8 in., 6010 welding rod and a second pass using a 3/32 in., 7018 rod, were used throughout.
Girder supports comprised of 1/2 in. x 6 in. x 10 in. A36 steel plates bolted to the
underside of the beam. The bearing plate for both the fixed and expansion ends, of the bridge were drilled with: two 3/8 in. diameter holes. However, the expansion end holes were slotted to permit movement.
4-4

4.3.2 Formwork
To ensure comparative construction practices, the model bridge was formed in a similar manner to full scale structures in the field. This method of unshored construction forces the steel girder to support the entire weight of the formwork and the wet concrete.
Initially, 4 in. x 4 in. x 8 ft. timbers were placed 2 feet on center transversely under the
bridge below the bottom flange of the steel girders. Smaller 4 in. x 4 in. x 2 ft. lumber was placed between the girders resting on the inside bottom flange over the transverse timber. These two pieces of lumber were bolted through with 1/2 in. diameter all-thread rods at four locations. For the cantilevered portion of the bridge deck, 4 in. x 4 in. x 18 in. wood blocks were nailed to the top of the timber members and an extra 1/2 in. bolt with a plate washer tightened to the outside edge of the bottom flange. This was to ensure that there would be no deflection of the forms under pouring operations.
Due to the height variation between the bottom of the deck and the top of the timbers,
wooden spacers, were nailed to the timbers to adjust the bottom deck forms to the required elevation. On top of this timber bracing, 2 in. x 4 in. x 8 ft. studs were laid out on 7 in. -centers for the length of the bridge. This provided support for the 3/4 in. plywood bottom forms of the deck.
The depth of the deck was controlled by the use of a 1/2 in. x 3 in. x 4 in. steel angle
for the side forms. To meet the thickness, of the deck required, 1/2 in. plywood spacers were placed under the steel angle throughout the perimeter of the deck form. Using the steel angle as a side form not only provided the rigidity needed to maintain the deck dimensions but also established the elevation for screeding and finishing the deck. 4.3.3 Deck Slab
Following the set-up of the formwork, the surfaces were coated with a. bond releasing
oil, to enable easy removal of the forms after curing. Next layers of steel reinforcement were tied at each longitudinal and transverse intersection with a minimum of two bar ties. The spacing of the longitudinal and transverse steel was at 11 in. and 9 in. on center, respectively, Figure 4.2. This . spacing of the reinforcement was maintained with the use of "preachers", wooden spacing blocks.
Clear cover of the reinforcing steel was a minimum of 1 in. all around except for the
lower mat which was 1/2 in. above the girder flange. To keep the same clearance, "crab apples", pre-molded sand/cement grout blocks, were used (see Plate 4.3).
4-5


Following inspection of the formwork and steel reinforcement placement, concreting was started. Ready mixed concrete was placed with the help of a three quarter cubic yard concrete bucket suspended from a 3 ton overhead electric crane.
Because of the restricted clearance for the concrete bucket, a plywood slide was used to
place the concrete in one locale (see Plate 4.4). It was then raked into position and consolidated with an internal vibrator. Concrete placement started at the east end of the bridge and progressed to the west end. Screeding and finishing were performed for approximately every 5 feet of deck poured.
After concreting and finishing of the bridge deck, a membrane pigmented curing
compound was sprayed over the concrete surface and covered with a plastic sheet. The room temperature was maintained at 75 °F throughout the curing phase.
The bridge forms were stripped after 7 days of curing when the compressive strength of
the concrete had reached 5,361 psi. All concreting procedures, mix design, placement, screeding, finishing, curing, form removal, were carried out in conformance with FDOT Standard Specifications [4.2]. 4.3.4 Elastomeric Bearing Pads
The girders were supported on 4.5 in. x 1.75 in by 0.168 in. thick laminated elastomeric bearing pads. These were specially fabricated for the study by Dynamic Rubber Products, Athens, TX. The basis for the design of these bearing pads is discussed in Section 7.2.
4.3.5 Bridge Supports
The test bridge was supported on two poured in-place reinforced concrete abutments, designed and cast specifically for the bridge using the same concrete mix design as the deck.
The abutments were 10 in. wide, 24 in. high and. 84 in. long and included shear blocks, 3
in. wide x 1 in. high x 20 in. long, between the girders. Load cells were bolted to the bottom flange of the girder and a 6 in. x 10 in. bearing plate similarly bolted to the bottom of the load cell. This bearing assembly was seated on the supports. 4.4 Loading System
The test bridge was cast under the load reaction frame and within a partially constructed environmental chamber at the University of South Florida, Tampa. The reaction frame had a clear space of 26 ft. x 10 ft. x 15 ft. height with a center deflection
4-9

of 0.1 in. at a capacity of fifty thousand pounds. The ultimate capacity of the frame is one hundred thousand pounds matching that of each hydraulic ` ram cylinder. Both hydraulic. ram cylinders were used to load the bridge model.
Loads were applied to the deck through two simulated trucks. The trucks were constructed of W6 x 20 spreader beams bolted to two W6 x 12 beams transversely. Each spreader beam could apply four point loads through four 1/2 in. x 6 in. x 8 in. Capralon Fabric Pads spaced at 4 'ft 3 in. center to center longitudinally and 18 in. across. The Capralon pads, composed of impregnated 8.1 oz. duck (64 layers per inch of thickness), were manufactured by JVI Inc, Skokie, Ill. The pads can withstand a compressive load of 10,000 psi with a permanent set of less than 13 % , AASHTO 10. 3.12, Division II.
A support frame was constructed for each hydraulic ram cylinder to carry the load of the
trucks and their self weight. These frames were mounted on rollers to the bottom flange of the reaction frame with clamping devices to secure them in the desired position.
The applied load was monitored by a cylindrical load cell positioned between the hydraulic cylinder and the reaction frame. Plate 4.5 shows the hydraulic jacks and Plate 4.6 the truck loading assembly. 4.5 Instrumentation
To monitor the behavior of the bridge throughout the testing gages, were installed to measure stresses, deflections, temperature and loads at critical locations on and within the structure.
4.5.1 Strain Gages
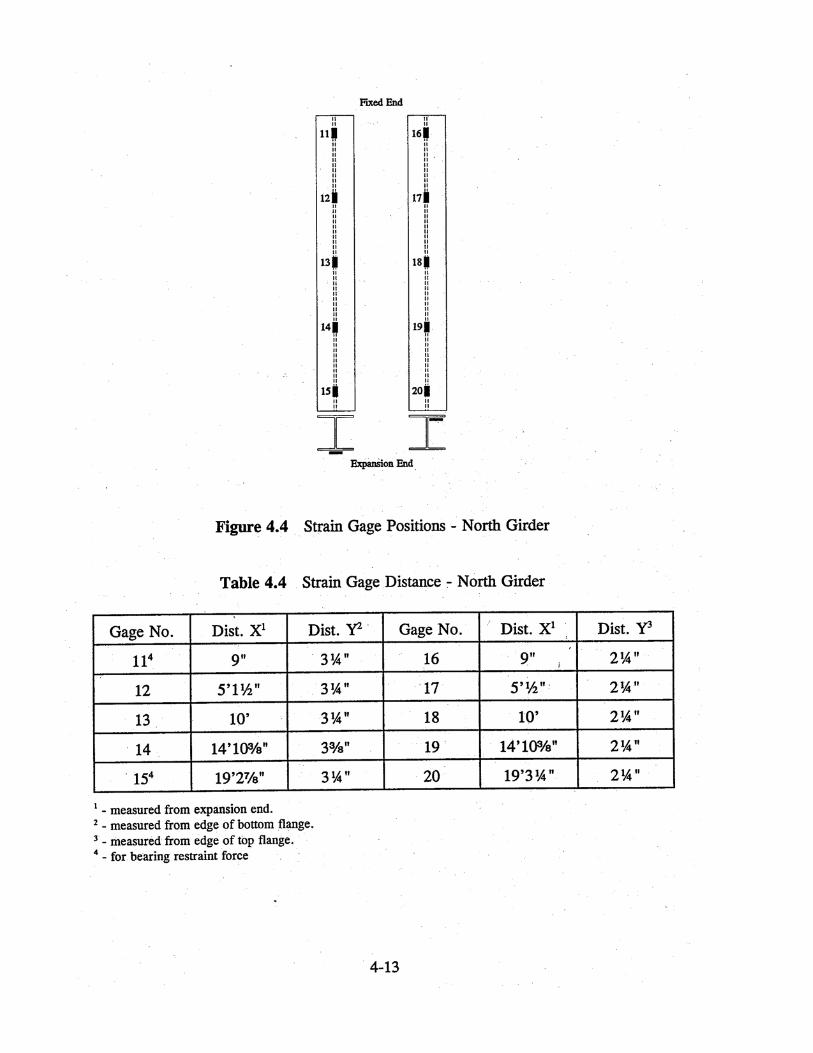
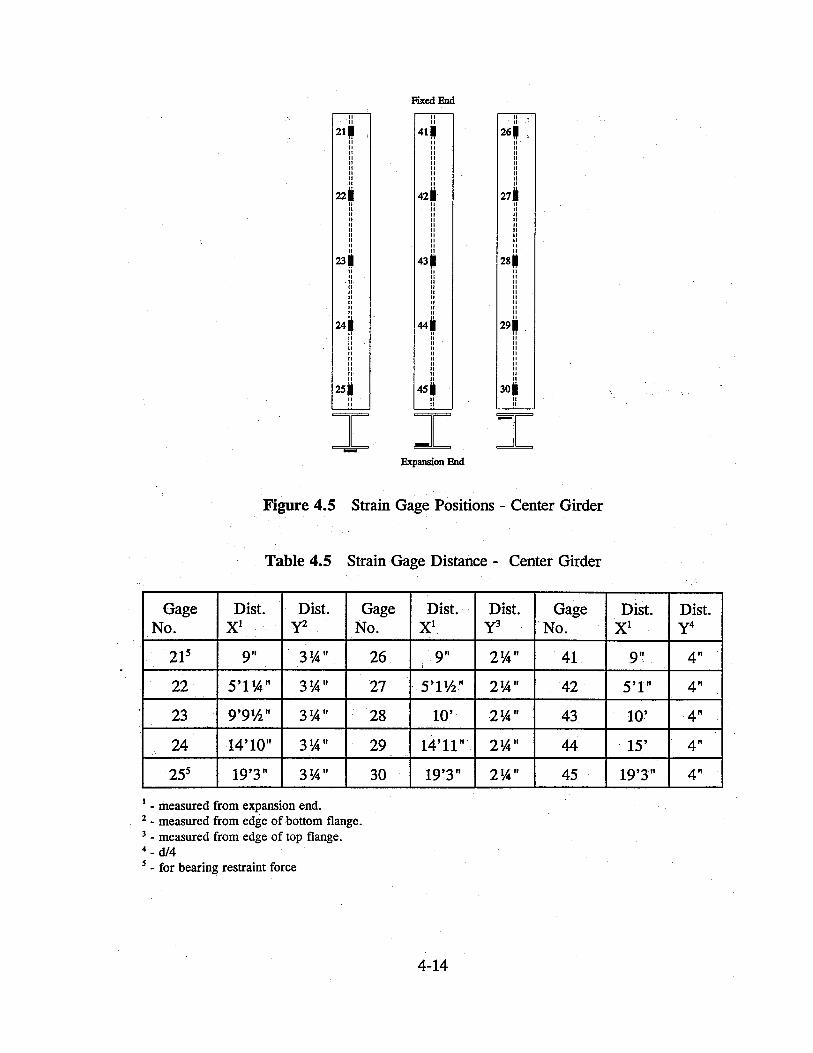
Electrical resistance strain gages were attached to the bottom flange of the W8 x 24 steel girders and on the underside of the top/bottom flanges at quarter points and midspan. For assessing restraint effects, gages were also attached. on the bottom flange 9 in. from each end of the beam i.e., 6 in from the support. Additional gages were installed on both the upper- and lower flanges of the diaphragms. The orientation of the girder gages were parallel to the longitudinal axis of the bridge, whereas those of the diaphragms were transversely placed. The actual locations of the strain gages are depicted in Figures 4.4 through 4.7 and Tables 4.4 through 4.6 for the girders and diaphragms.
Supplementary embedded concrete strain gages were placed within the bridge deck at
three locations, at each quarter point and the mid-span located over each of the three girders. The specific locations are shown in Figure 4.3 and Table 4.3. After the casting
And curing of the bridge deck surface strain gages were affixed directly over the embedded gages.
4-41


For the steel members the gages used were CEA-06-250UW-350 (Gage Factor 2.095) supplied by Micro-Measurements Group, Raleigh, NC. The embedded and surface gages were 60 mm long model PML-60-2LT (Gage Factor 2.12) and PL-60-1L (Gage Factor 2.11), respectively. The concrete gages were provided by Texas Measurements, TX.
4-43


4.5.2 Load Cells
Load cells were employed to measure the applied loads by the hydraulic cylinder and the reactions at the six girder ends (see Plate 4.7). The load cells were initially calibrated using an MTS Hydraulic Testing Machine and a proving ring: Reaction load cells were rated at a capacity of 10 tf, whereas those verifying the applied load were rated for 50 tf. All load cells were supplied by Tokyo Sokki Kenkyujo Co., Ltd., Tokyo, Japan.
4.5.3 Linear Variable Differential Transformer (LVDT)
Deflections of the bridge under service conditions were measured by LVDT's. Nine 50 mm LVDT's were located at the quarter points and mid-span beneath each of the three steel girders, Figure 4.8. Also, three 5 mm LVDT's, with "paddle" type extensions, were placed at each elastomeric bearing pad at the expansion end of the model bridge. The assembly aligning the LVDT's is shown in Plate 4.8. The LVDT's were furnished by Tokyo Sokki Kenkyujo Co., Ltd., Tokyo, Japan.
4-16


4.5.4 Thermocouples
Type SA1-K thermocouples with self-adhesive backing, provided by Omega Engineering, Stamford, CT., were affixed at the mid-span and expansion end of the bridge girders. The K calibration refers to a chromel-alumel combination. Figure 4.9 and Table 4.7 depict the location of the thermocouples.
4.5.5 Data Acquisition System
Data compilation from all steel, concrete embedded and surface strain gages, load cells and LVDT's was fully automated using System 4000 manufactured by Measurements Group, Raleigh, NC. The system was comprised of the Data Acquisition Control Unit (DACU), an IBM personal computer, monochrome monitor, video screen monitor and printer. The DACU contained five strain gage scanners capable of scanning '100 strain gage based transducers and two universal scanners capable of scanning 20 LVDT channels. The monochrome monitor displayed the program disk commands that control the system and the video screen monitor, not required for this study, displayed direct plots of observed results from ongoing- testing. The software, accompanying the system, collected the data, reduced it and printed the results. The program permitted the reduced data for the load cells to be presented on the monitor in its reduced units in pounds.
4.6 Test Program
Tests on the bridge were performed over a three month period. The first series of tests related to characterization of the bridge to verify the principle of superposition and to establish load distribution characteristics. This is described in Chapters 5 and 6. The restraint effect was investigated with the temperature in the environmental chamber varied between -2.5°F to 125°F. This is covered in Chapter 7.
4-18


5. SUPERPOSITION TESTS 5.1 Introduction
Eleven tests were conducted to study the response of the test bridge and to verify the applicability of the principle of superposition that forms the basis of all subsequent elastic analysis. The test program is described in Section 5.2 and typical results from the superposition tests for deflection and reactions are presented in Section 5.3.
5.2 Test Program
The bridge constructed was tested for eleven different arrangements of the truck load. The :dimensions of this truck are given in Section 4.4.
The location of the truck load on the bridge in these tests is shown schematically
in. Figure 5.1. From Figure 5.1 it may be seen that a single truck load is applied in cases 1, 2, 4, 5, 7 while two truck loads are applied at the same locations in cases 3, 6, 9-11. The arrangement of the trucks corresponding to cases 1-9 were also used to assess load distribution characteristics that are described in Chapter 6.
The target truck load on the bridge was 5.85 kips that was incrementally applied in
steps of 1,000 lbs. For each increment, measurements of deflections, reactions and strains were automatically recorded by the data acquisition- system.
5.3 Results
Since load cases where a single truck load is applied (#1, #2; #4, #5, #7 and #8 in Figure 5.1) are subsets of respective load cases where two trucks are applied, the applicability of the principle of superposition may be verified by combining load cases as follows
a. Case 1 + Case 2 = Case 3
b. Case 4 + Case 5 = Case 6
c. Case 7 + Case 8 = Case 9
5-1


d. Case 4 + Case 8 = Case 10 e. Case 5 + Case 7 = Case 11
Typical test results for. deflections and reactions obtained using the above load cases is shown in Figures 5.2-5.5. The location of the LVDT's are defined in Figure 4.8.
Inspection of Figures 5.2-5.5 generally confirm linearity of the elastic response
though minor departures may be seen (Figure 5.2 and 5.5), possibly due to the inability of load cells to accurately measure the relatively small applied loads. Thus, the tests indicate that elastic analysis is suitable for predicting the response of the bridge model.
5-3


6. LOAD DISTRIBUTION 6.1 Introduction
The process of live load transfer to indirectly loaded girders is often referred to as load distribution. Load distribution is one of the key elements for determining member size and consequently, strength and serviceability of highway bridges. Therefore, it is critically important both in the design of new bridges and in the evaluation of load carrying capacity of existing bridges.
The AASHTO code [6.1] provides load distribution factors for the
determination of longitudinal moments in bridge girders; that are expressed in terms of the quotient S/D, where S is the girder spacing and D is a characteristic width associated with the particular bridge type and geometry. For steel composite bridges, the distribution factor is S/5.5, i.e. D is 5.5 ft. In the AASHTO method, the value of D depends only on the bridge type and girder spacing. Thus, it is unable to allow for differences in the pattern of load distribution arising from such factors as the aspect ratio of the bridge, flexural and torsional stiffness variation or position of the load along the bridge. In view of this, tests were conducted to determine the extent of validity of the AASHTO specified load distribution factor. From the tests, the load distribution factor, D, was experimentally determined and compared to the 5.5 ft AASHTO value.
A brief description of the test program and the analysis of test results is
presented in Section 6.2. Section 6.3 summarizes results of numerical analyses based on. The grillage and semi-continuum methods [6.2,6:3]. A discussion of results from test and numerical analyses is reported in Section 6.4.
6.2 Test Program
Since longitudinal moments are greatest when truck loads are positioned closest to the curb, this case should ideally be tested. Unfortunately, this position could not be tested since the load positions were dictated by the relative location of the bridge to the load frame (see Plate 4.5). As a result, several alternate load positions involving single, double and ,simulated truck loads were investigated experimentally. In each test, all strains, deflections and loads, were automatically recorded using a SYSTEM 4000
6-1
Computerized Data Acquisition System. In all tests the applied load was distributed to the slab over a 6 in x 8 in x 1/2 in thick Capralon pad (manufactured by JVI Inc, Skokie, Ill.) to simulate the tire contact area.
In the first series of tests, a single concentrated load was applied 17 in from the north girder, and 11 in from the center girder, as shown in Figure 6.1. In the second series, two equal loads were applied such that, one load was at 5 in from the north girder, and the other 7 in from the center girder, as shown in Figure 6.2.
For both series, nine load positions were investigated in which the applied load
was successively moved from OIL to 0.9L in increments of O.IL. For each load position, three loads of approximately 1,000 lb, 2,000 lb and 3,000 lb were applied. However, all analyses reported relate to the maximum load of 3,000 lb since it is more representative of service loading. In any event, since the bridge response is essentially linear (see Chapter 5), same results would also be obtained for other loads.
For the simulated truck load case, only three load positions corresponding to
the mid-span and two quarter span locations were investigated. Three cases were investigated in which the truck was positioned in each lane (north or south) followed by truck loads in both lanes. These load positions are summarized in Figure 6.3. As for the single and double load cases, more than one load was applied although the results presented correspond to a 4,000 lb load on the bridge deck.
6.2.1 Results
Following Bakht and Jaeger-[6.4],t the live load girder moment, Mg, is related to the total moment, M, by Eq. 6.1 as:
Mg = (S/D) M (6.1) Where, S and D are as defined earlier. This may be solved for D, Eq. 6.2, as: D = S/(M/Mg) (6.2) For the bridge tested, the spacing between girders, S, was 28 in. or 2.33 ft.
6-2


Therefore, if Mg and M are determined on the basis of strain measurements, D can be obtained experimentally, from Eq. 6.2.
The girder moment, Mg, can be obtained from measured strains using Eq. 6.3 as: Mg = (єb(Es)(Sb ) (6.3)
where eb is the steel strain in the bottom flange, Es, the Young's modulus for steel and Sb, the corresponding section modulus for the composite beam. This was determined for the untracked section for f'c of 6,325 psi, the compressive strength of the bridge deck. The concrete modulus was obtained using Nilson's equation [6.5] giving a modular ratio of 6.94. Note that the concrete strain on the deck surface was not used since it could lead to erroneous results due to shear lag effects. The total moment, M, is obtained by summing moments in each of the three girders, calculated from Eq. 6.3.
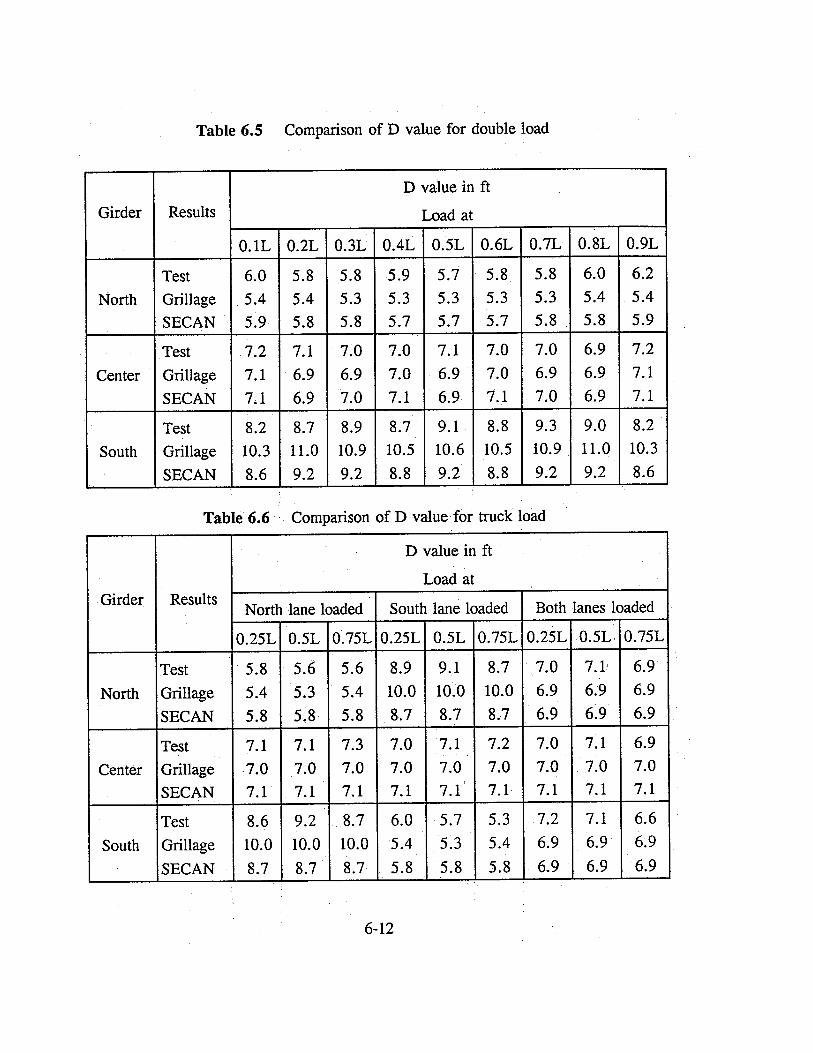
A summary of the experimentally obtained D values, calculated from Eq. 6.2, is shown in Tables 6.1 to 6.3. Calculation of D values for typical cases are summarized in Appendix B.
Inspection of Tables 6.1-6.3 and Figures 6.5-6.9 indicates that the minimum D value
obtained experimentally is 5,6 ft (Table 6.3) compared to the 5.5 ft value stipulated by AASHTO. Since the test value is larger than the AASHTO value, it is conservative (see Eq. 6.1). The variation in D values in the results presented reflect the dependence of the load distribution factor on the load position and also on the type of load that is applied. .


idealizing a bridge deck as a two dimensional grid of discrete, interconnected beams having bending and torsional stiffness. The grillage mesh for the test bridge members used in the study is shown in Figure 6.4. It has three longitudinal members corresponding to the three actual girders and nine equally spaced transverse members.
The equivalent stiffness of the grillage member is calculated on the basis of recommendations made in [6.3]. Complete details of the idealization are presented elsewhere [6.5] 6.3.2 Semi-continuum Analysis
In the semi-continuum analysis, a slab-on-girder bridge is idealized by discrete longitudinal members and a continuous transverse medium. The longitudinal bending and torsional stiffness of the bridge is concentrated in the one dimensional longitudinal beams while the transverse bending and torsional stiffness is uniformly spread along the length in the form of an infinite number of transverse beams that constitute a continuous transverse medium. This is a closer representation of a slab-on-girder type of bridge than grillage idealization, [6.4]. A computer program, SECAN, an acronym derived from Semi-Continuum Analysis, developed by Jaeger and Bakht [6.5], was used. This program can analyze simply supported composite bridges with unequally spaced girder, transversely shear-weak simply supported bridges, continuous bridges and bridges with random intermediate supports. SECAN provides values of the commonly required responses such as, longitudinal moments, shears and deflections. The input data can be
6-7

in any set of compatible units. 6.3 Discussion of-results
The load distribution parameter, D, from the test, grillage and semi-continuum analysis are compared in Table 6.4 through Table 6.6. In general, both analyses predict values that are within 5 % of the test results, although the results from SECAN are closer to the test values (Tables 6.4-6.6). However, for single. loads, 'D' value from SECAN are somewhat larger than the test values (see Table 6.4), i.e., they are unconservative.
For single and double load conditions (Figures 6.5 & 6.6), D values for the south girder
is greater compared to the other two girders due to the location of the load. When. the loads were moved, a variation of 0.1 ft to 0.4 ft occurred. This shows that the position of the load along the length of -the span does not have much effect on the D value. However, variation of the load position across the span has a much more significant effect, as expected. When the loads were placed between. the south and center girders, the north girder is lightly loaded and therefore has a larger D value.
For truck loading (Figures 6.7 - 6.9), the bridge behaves similar to single or double
loads. When the north lane was loaded at 0.5L, the D value for all three girders was very close to the concentrated load values. This shows that whether the load is applied as single or multiple concentrated loads the response of the bridge is similar. For both lanes loaded, test results gave D value between 6.6 ft to 7.2 ft whereas analysis gave value between 6.9 ft to 7.1 ft.
6-8


7. RESTRAINT EFFECT OF ELASTOMERIC BEARINGS
7.1 Introduction
The beam and slab bridge constructed was tested under temperature extremes encountered in Florida to determine if stiffening of the elastomeric bearing pad resulted in any changes in the superstructure moments reported from field tests [1.2-1.5]. This chapter provides, all details of the study.
The modeling considerations in the design of the elastomer bearing pad used to support
the test structure are discussed in Section 7.2. Brief details of the design and construction of the environmental chamber to simulate temperature changes is described in Section 7.3. The test procedure is outlined in Section 7.4 and he results obtained from the study are summarized in Sections 7.5-7.7.
7.2 Design of bearing pad
The function of the elastomeric bearing pad is to distribute the superstructure load to the supports and to allow bridge movement due to temperature effects and in case of prestressed members, due to creep and shrinkage. The distribution of superstructure loads sets up compressive stresses in the elastomer whereas movement is accomodated by shear deformation.
The movement of the test bridge is a function of the lengthof the bridge, the expansion
coefficient of steel and the temperature range relative to the temperature at which the bridge was constructed. The AASHTO specifications [7.1], require the total elastomer thickness, T, to be at least twice,this movement (at least 3 times the movement according to the CALTRAN specifications [7.2]).
MOT uses the AASHTO specifications and have provided standard bearing pad sizes
that may be used to support steel or concrete girders. The bearing assembly has also been standardized and load ranges and movement for each of the standard pads is available [7.3].
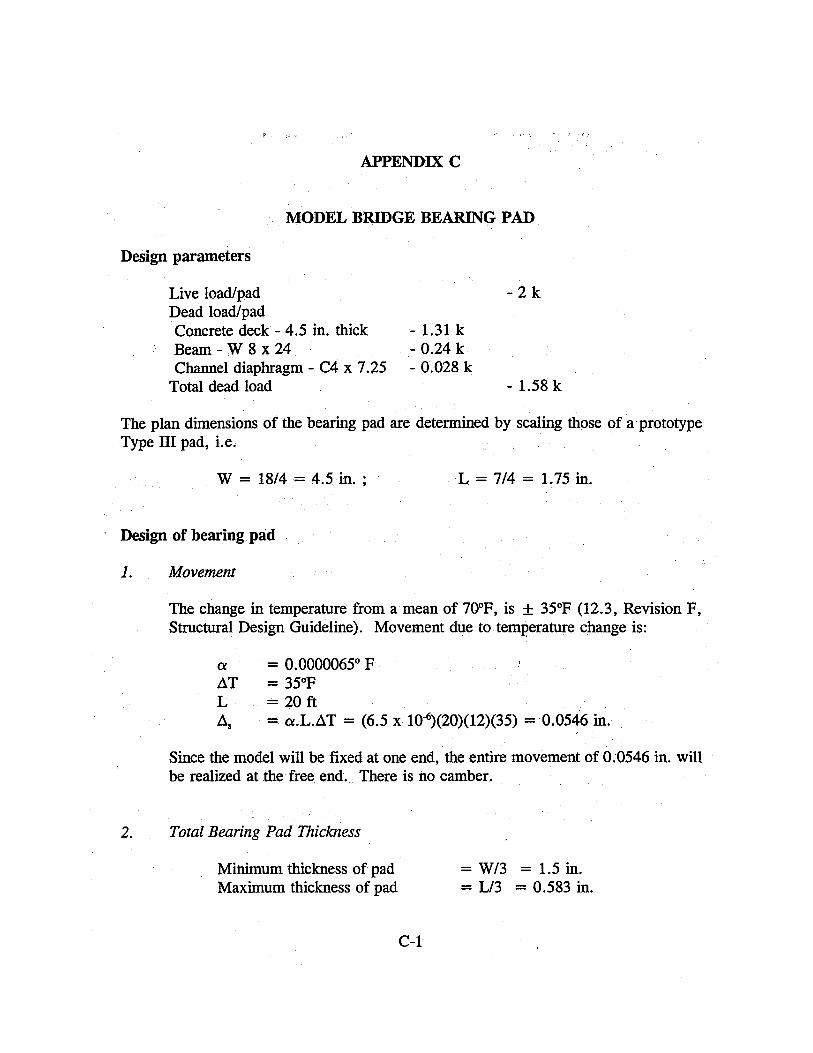
For the test bridge, the design movement (see Appendix C) is about 0.06 in.. Therefore,
the total elastomer thickness, provided should be 0.12 in. if shear stresses in the elastomer are to be comparable to those in prototype structures that are designed in Florida.
7-1
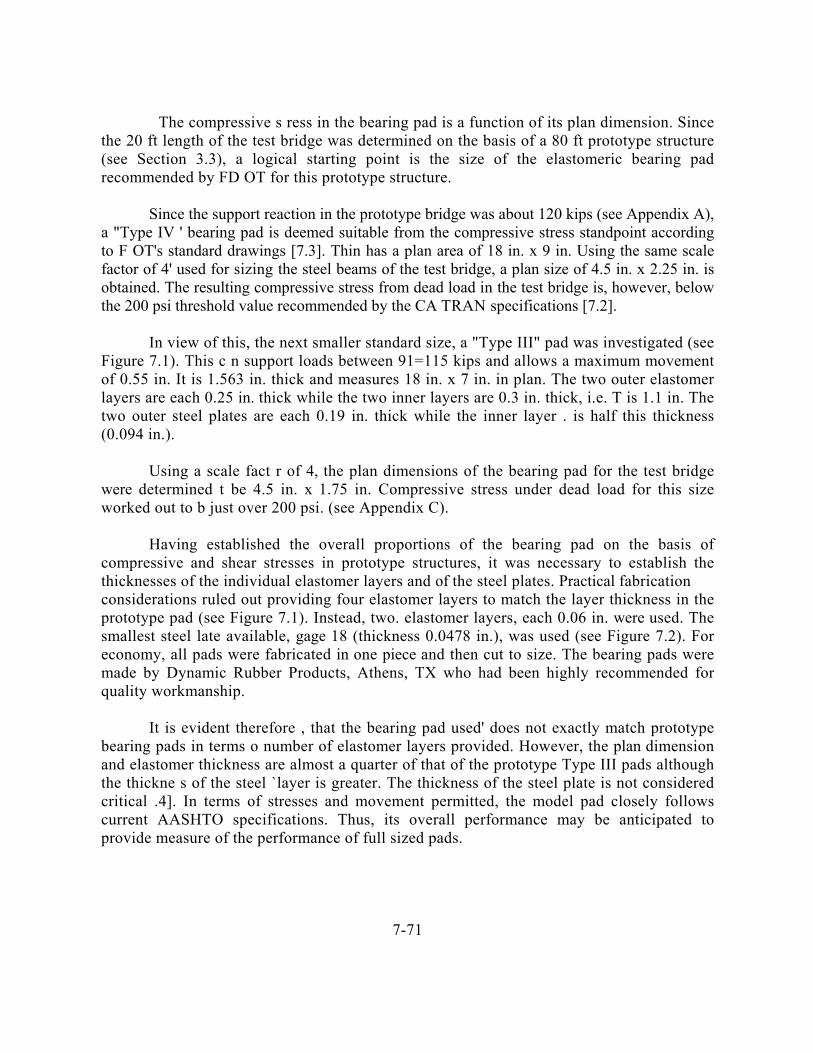
The compressive s ress in the bearing pad is a function of its plan dimension. Since the 20 ft length of the test bridge was determined on the basis of a 80 ft prototype structure (see Section 3.3), a logical starting point is the size of the elastomeric bearing pad recommended by FD OT for this prototype structure.
Since the support reaction in the prototype bridge was about 120 kips (see Appendix A),
a "Type IV ' bearing pad is deemed suitable from the compressive stress standpoint according to F OT's standard drawings [7.3]. Thin has a plan area of 18 in. x 9 in. Using the same scale factor of 4' used for sizing the steel beams of the test bridge, a plan size of 4.5 in. x 2.25 in. is obtained. The resulting compressive stress from dead load in the test bridge is, however, below the 200 psi threshold value recommended by the CA TRAN specifications [7.2].
In view of this, the next smaller standard size, a "Type III" pad was investigated (see
Figure 7.1). This c n support loads between 91=115 kips and allows a maximum movement of 0.55 in. It is 1.563 in. thick and measures 18 in. x 7 in. in plan. The two outer elastomer layers are each 0.25 in. thick while the two inner layers are 0.3 in. thick, i.e. T is 1.1 in. The two outer steel plates are each 0.19 in. thick while the inner layer . is half this thickness (0.094 in.).
Using a scale fact r of 4, the plan dimensions of the bearing pad for the test bridge
were determined t be 4.5 in. x 1.75 in. Compressive stress under dead load for this size worked out to b just over 200 psi. (see Appendix C).
Having established the overall proportions of the bearing pad on the basis of
compressive and shear stresses in prototype structures, it was necessary to establish the thicknesses of the individual elastomer layers and of the steel plates. Practical fabrication considerations ruled out providing four elastomer layers to match the layer thickness in the prototype pad (see Figure 7.1). Instead, two. elastomer layers, each 0.06 in. were used. The smallest steel late available, gage 18 (thickness 0.0478 in.), was used (see Figure 7.2). For economy, all pads were fabricated in one piece and then cut to size. The bearing pads were made by Dynamic Rubber Products, Athens, TX who had been highly recommended for quality workmanship.
It is evident therefore , that the bearing pad used' does not exactly match prototype bearing pads in terms o number of elastomer layers provided. However, the plan dimension and elastomer thickness are almost a quarter of that of the prototype Type III pads although the thickne s of the steel `layer is greater. The thickness of the steel plate is not considered critical .4]. In terms of stresses and movement permitted, the model pad closely follows current AASHTO specifications. Thus, its overall performance may be anticipated to provide measure of the performance of full sized pads.
7-71


7.3 Environmental chamber
To simulate temperature changes, an environmental chamber was constructed around the bridge. Complete details relating to its construction are given in Hogue's report [7.5]. This also includes a summary of the underlying heat loss/gain calculations by Weber [7.6] that led to the selection of the refrigeration and heating units as well as the insulation that was provided.
The inside dimensions of the chamber were 26 ft long x 10, ft wide x 15 ft 8 in.
high. These dimensions provided some working space between the 20 ft long x 7 ft wide bridge. The height allowed a 2 in. clearance over the 15 ft 6 in. high reaction frame. A 5 ft. x 7 ft. double door served as the entrance to the chamber. This had two 16 in. x 24 in. double insulated Plexiglas windows that were ,framed in each half of the door. Aside from the door, two 36 in. x 48 in. double insulated windows were framed into the north wall to allow visual inspection of the room (see Plates 7.1-7.2). A 6 ft. x 10 ft. removable plug was framed into ceiling, so that the overhead crane could be used to move heavy equipment. Since the structure was temporary, 3/8 in. plywood and dual headed nails were used to make all connections.
A modular construction form was adopted in which the size of each module was
the same as a plywood sheet, i.e. 4 ft x 8 ft. The walls were made of 14 such units and the units placed directly on the floor were bolted to Hilti anchors that had been set in epoxy in pre-drilled holes on the Structural floor. The` thickness of the units was dictated by insulation requirements. Calculations [7.6] indicated that R-30 fiberglass insulation would be needed. Since this is 9.5 in. thick and available in 2 ft widths, 2 x 10 studs spaced at 2 ft or 4. ft centers were used in the fabrication of the. individual wall units. The 2 ft spacing was used to provide support for the heavy industrial grade refrigeration unit that was placed on the roof of the environmental chamber along with the hydraulic pump for the loading system. The 4 ft spacing was used elsewhere.
In an effort to add strength and reduce infiltration, plywood joints were staggered
on the inside and outside. In addition to this, a 6 mil continuous vapor barrier was placed on the outside of the studs, underneath the plywood. The visqueen was stapled to the studs well enough to hold it in place, then the plywood was placed over it. All seams in the vapor barrier were taped using 2 in. duct tape to limit cold air exfiltration. The plywood was nailed tightly to the studs in order to hold the visqueen in place and eliminate leaks at the nail holes.
Framing for the roof was quite simple, even with the removable plug. For the first
12 feet on the end that would support the refrigeration unit, the 2 x 10 rafters were on 2 feet centers. This allowed the roof to be sturdy enough to support the large, heavy
7-73


7.5 Results
Since all data recorded was relative to -2.5-F, two separate analyses were conducted. The first provides information on the variation in the bearing restraint effect with temperature. In other words, the absolute bearing restraint force at each temperature is determined. This is described in Section 7.6. The second analysis determines changes in the bearing restraint force relative to- the temperature at which the bridge was constructed (assumed to be 80°F). This is described in Section 7.7.
7.6 Absolute Bearing Restraint 7.6.1 Strain Data
Since the test bridge is simply supported, under applied vertical loads, only tensile strains may be expected in all the gages attached to the bottom flange (see Figures 4.44.6 and Tables 4.4-4.6 for exact locations) including the ones located near the abutments. At the latter locations - 6 in. from the bearings = bending moments are small and calculated tensile strains (using SECAN) are about 1Ae/kip of load. Thus, if compressive strains are recorded at these locations, stiffening effects are indicated.
Table 7.2-7.3 provides a summary of the strains (positive values indicate tension)
recorded in the gages located close to the abutments, i.e. gages 11, 15, 21, 25 etc. in Figures 4.4-4.6, for the temperature range investigated. The strain data was linearly interpolated to obtain values corresponding to loads of exactly 2,0001b, 4,000 lb, 8,000 lb and 10,000 lb. Where no values appear, no readings close to the specified load level had been taken.
Inspection of Table 7.2 indicates that although there are some compressive strains, i.e.
negative values, these were recorded at loads of 2,0001b and 4,000 lb and not at the higher loads of 8,000 lb. or 10,000 lb (see Table 7.3). Furthermore, even at loads of 2,000 lb, compressive strains were generally only present in the Center and South girders (see Figure 4.2) but not in the North girder.
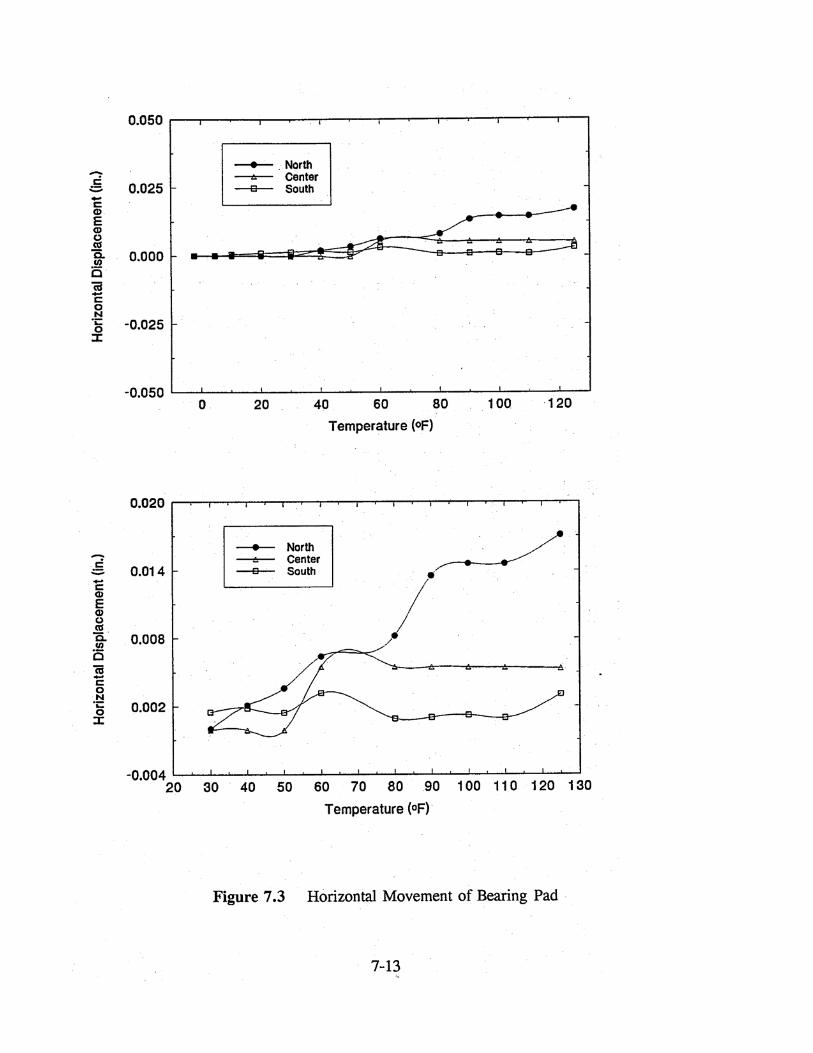
To reconcile this discrepancy, plots. showing the movement of each of the bearing pads
monitored by horizontally placed LVDTs at the expansion end (see Plate 4.8) are shown in Figure 7.3. Inspection of Figure 7.3 shows that the bearing pad under the North girder recorded movements that were much greater than those in the other two girders. Not surprisingly, less restraint force developed in the supported beam.
7.6.2 Restraint Moment
The restraint moment is defined as the change in superstructure mid-span moment at different temperatures relative to that at room temperature under the same load. As
7-10


for the load distribution study, beam moments are calculated from measured strains in the bottom flange using Eq. 6.3.
Table 7.4 provides a summary of the mid-span strain variation with temperature for applied loads of exactly 2,000 lb, 4,000 lb, 8,000 lb and 10,000 lb. As before, strains values were obtained by linear interpolation of the test results and positive values signify tensile strains.
Inspection of Table 7.4 shows that mid-span strains are proportionately smaller at a load of 2,000- lb. in comparison to the values at 10,000 loads. Thus, this data confirms the strain measurements near the abutments summarized in Tables 7.2 and 7.3 that indicated the presence of restraint effects only at smaller loads.
Figures 7.4 and 7.5 plot the variation: in bending moment ratios, i.e. the mid-span bending moments calculated from strains in Tables 7.4 using Eq. 6.3, relative to the moment values obtained similarly from strain readings at room temperature. There is both a reduction and an increase in the bending moment relative to the value. obtained at room temperature. The effect of the reduction is more pronounced at lower loads than at higher loads.
The difference between the mid-span moments at various temperatures and that at room
temperature, i.e. the restraint moment, is normalized with respect to the service moment in the bridge so as to provide a measure of its relative importance. The service moment is that corresponding to the stress in the bottom -flange reaching its allowable value.
Figure 7.6 plots the variation in average restraint moment normalized with respect to the
service moment for load levels of 2,000 lb, 4,000 lb, 8,000 lb, and 10,000 lb. Figure 7.7 is the same plot but with respect to the maximum restraint moment that developed in one of the bridge girders. Inspection of these figures show that the maximum change in bending moment is less than 5%. Thus, the restraint effect is relatively unimportant.
The same trends may be discerned in plots of the mid-span deflection in all girders (and
their average value) -relative to that of the deflection observed as room temperature (defined as a deflection ratio) in Figures 7.8-7.9. Inspection of these plots shows that whereas for loads of 2;000 lb., deflections tend to be smaller, i.e. there is a stiffening effect, for higher loads, the deflections may be greater, signifying increased in bending moments. However, these increases are much smaller than the reductions observed (compare Figure 7.8 vs Figure 7.9):
Thus, the test data indicates that there is a reversal in the nature of the bearing restraint
force. At low loads, stiffening effects are present that lead to a reduction in mid-span deflections. At- higher loads, however, these effects appear to be reversed.
7-14


7.7 Relative Restraint Effect
In the previous section, results for the absolute restraint effect at different temperatures were presented. This provides a measure of the importance of the restraint effect but fails to provide any index of the relative restraint effect with respect to the temperature at which the bridge was constructed.
Since all data was originally recorded with respect to the lowest temperature (see
Section 7.4), the effect of construction temperature may be readily incorporated by a simple transformation in which the initial value is re-set. In essence, all data must be shifted with respect to the assumed temperature at which the bridge was constructed which is set as zero. This involves a numerical adjustment to the recorded values. All results presented in this section assume 80°F as the construction temperature. The effect of other construction temperatures are presented elsewhere [7.7].
7.7.1 Strain Data
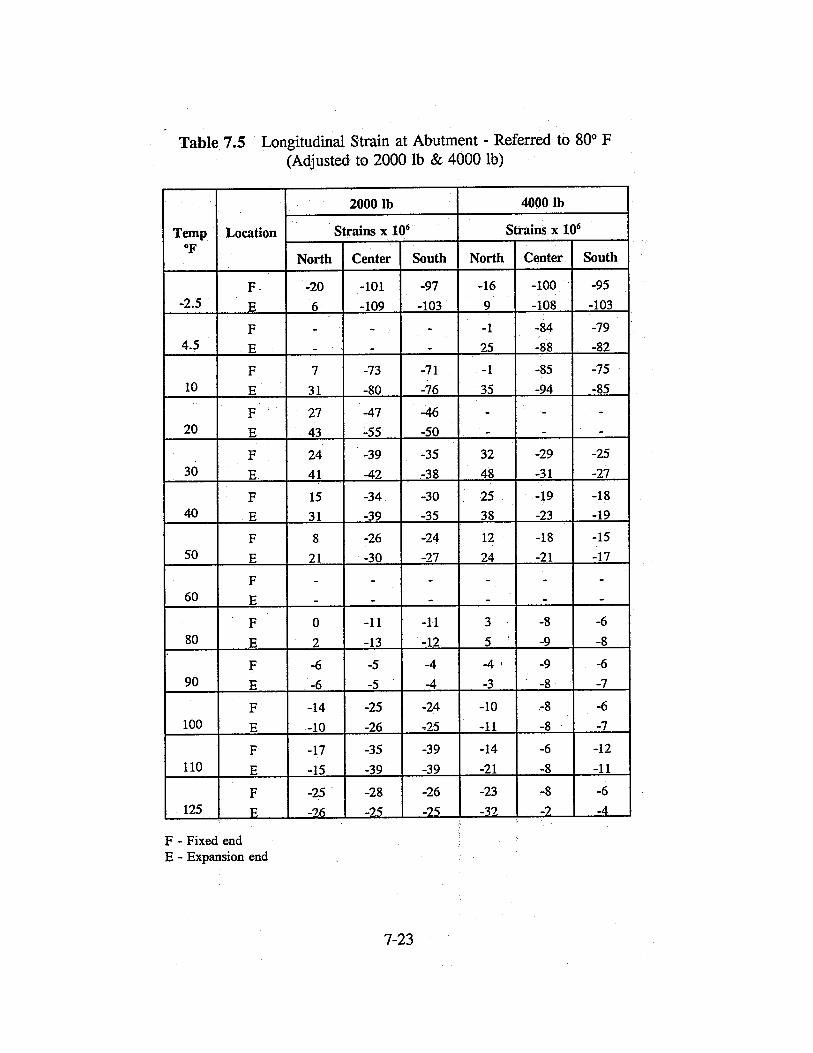
The strain data near the abutment, adjusted so that it is initialized at 80°F, is summarized in Tables 7.5-7.6. As before, tensile strains are positive.
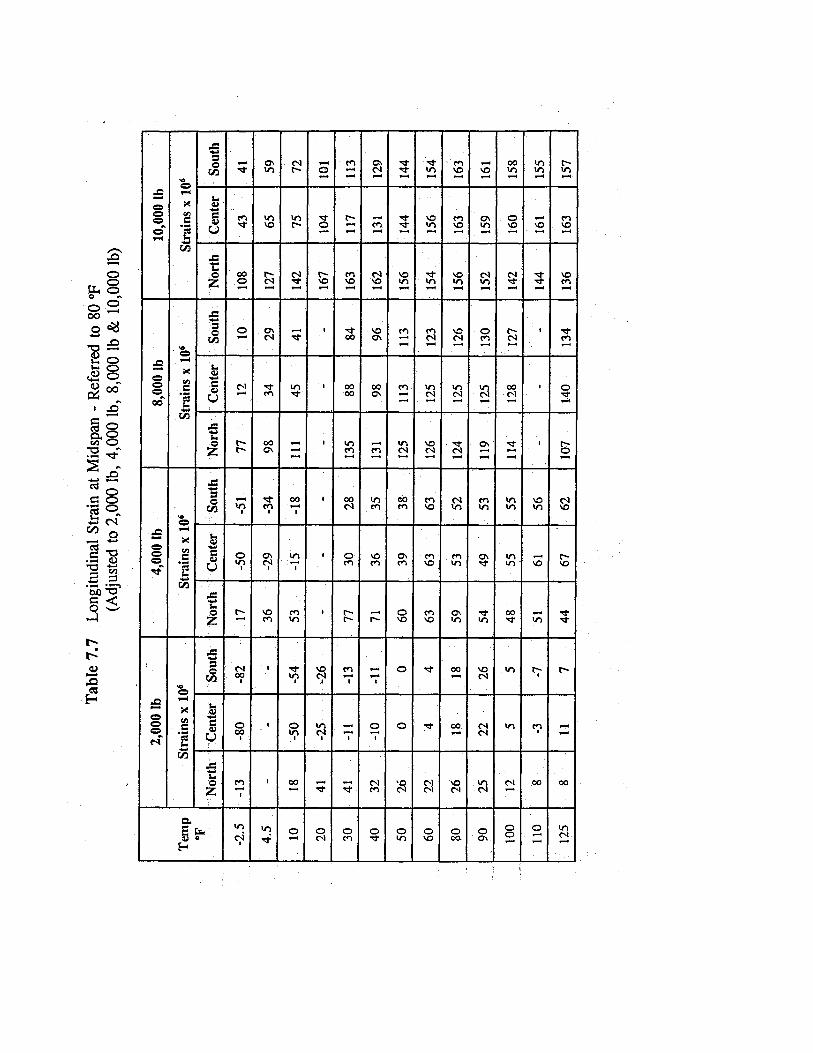
Inspection of Tables 7.5 and 7.6 indicates that strain values are generally much larger
(in comparison to Tables 7.2-7.3) signifying greater restraint forces. This is also confirmed by the mid-span strain values summarized in Table 7.7 that may be seen to be much smaller than the 161tc-/kip value predicted by theoretical analysis. Thus, the calculated restraint forces may be anticipated to be greater than those reported in Section 7.6.
7.7.2 Restraint Moment
Restraint moments, defined and calculated in the same manner as in Section 7.6.2, are plotted in Figures 7.10-7.11.
The restraint moment average of all three girders relative to the maximum service
moment, i.e. resulting in the girders reaching their allowable stress (as before) is plotted in Figure 7.10 whereas the maximum (of the three girders) restraint moment is plotted in Figure 7.11.
Inspection of Figures 7.10-7.11 shows that the maximum restraint effect, relative
7-21
to the assumed constr'itction temperature of 80°F, is at"the' lowest temperature when reductions of about 1-5 % were realized. At temperatures above 700F,' there is practically no restraint effect (see Figure 7.10)' excepting-at the smallest applied load.
The maximum relative reduction of 15 % is substantially larger than the absolute restraint force of about 5 % presented in Section 7.6. This indicates the progressive stiffening of the elastomeric pads at lower temperatures. At higher' temperatures, this effect is not present.
The moment variation shown in Figures 7.10-7.11 is also reflected in the midspan
deflection plots shown in Figures 7.12-7.13. As before, deflection measurements have been adjusted relative to an initial value at 80°F. Inspection of Figures 7.12-7.13 indicate smaller mid-span deflections at low temperatures and somewhat larger deflections above 80°F.
The results from the tests corroborate data obtained from field observations. The results
can only be used to identify trends in the variation in the restraint effects. Direct extrapolation to predict prototype response may prove unreliable since the mechanical properties of the bearing pad are linked to the manufacturing process. Nevertheless, the results so suggest that-restraint forces may need to be considered particularly in the design of substructure elements.
7-22


8. CONCLUSIONS
This report presents information on an experimental study to assess the restraint effect of elastomeric bearings. As part of this study, a test bridge was designed and constructed based on a 80 ft span two-lane prototype steel composite bridge (see Chapter 3). The elastomeric bearing pads supporting the test bridge were designed (see Section 7.2) to ensure that shear stresses and compressive stresses set up were similar to that in prototype structures. An environmental chamber was constructed around the bridge to allow simulation of historical temperature extremes in the State of Florida (-2°F to 109° F). All measurements were recorded to allow both the absolute, i.e. without regard to the construction temperature, and relative restraint, i.e. incorporating the effect of the temperature at which the bridge was constructed, to be examined.
On the basis of the results obtained from the study the following conclusions may be drawn:
1. The response of the test bridge under service loads was largely linear and the validity of the principle of superposition was demonstrated (see Chapter 5).
2. The load distribution characteristics of the test bridge were accurately represented by AASHTO. Measured 'D' values of 5.6 ft agreed closely with the AASHTO specified value of 5.5 ft.
3. Restraining effects at the bearings were experimentally confirmed. At strain gages located 6 in. from the bearings in the bottom flange, compressive strains were recorded in the simply supported bridge (see Tables 7.2-7.3). Analysis of the data indicated that the absolute variation in restraint effect with temperature was minor. Changes of upto 5 % were recorded but only for small loads (see Figure 7.6-7.7).
4. Restraining effects relative to an assumed construction temperature of 80°F were significant. Reductions of upto about 15 % in the superstructure moments were recorded at temperatures of -2.5°F (see Figure 7.10). By contrast, there was practically no reduction at temperatures above 70°F.
5. The test results corroborate the trend from field observations [1.2-1.5]. Thus, consideration should be given towards incorporating restraint effects in the design of substructure elements.
8-1