department for international development india › media › 57a... · contents dfid / india:...
TRANSCRIPT

Department for International Development India Western India Rainfed Farming Project CNTR 04 5752
Final Report ©
October 2005

ADDRESS TELEPHONE FACSIMILE EMAIL WEBSITE
Enterplan Limited +44 (0) 118 956 6066 +44 (0) 118 957 6066 [email protected] www.enterplan.co.uk 1 Northfield Road
Reading RG1 8AH, UK
Department for International Development India Western India Rainfed Farming Project CNTR 04 5752
Final Report ©
October 2005

Abbreviations and Acronyms
DFID / India: Western India Rainfed Farming Project / Final Report / October 2005
Abbreviations and Acronyms
CBA Cost Benefit Analysis DFID Department for International Development DR Drudgery Reduction Activities EIRR Economic Internal Rate of Return FIRR Financial Internal Rate of Return GOI Government of India GVT Gramin Vikas Trust HH Household IFFDC Indian Farm Forestry Development Cooperative IGA Income Generating Activity JFM Joint Forest Management MLSP Migration Labour Support Programme NABARD National Bank for Agriculture and Rural Development NHIS Net Household Income Study NPC National Planning Commision NPV Net Present Value OCC Opportunity Cost of Capital PPGF Participatory Planning and Group Formation SC State coordinator (at District HQ) SCF Standard Conversion factor SHG Self Help Group SWC Soil and Water Conservation VOD Village Organisation and Development WB The world Bank WBR Well-Being Rank (or class) WIRFP Western India Rainfed Farming Project WRD Water Resource Development
WUA Water Users Association
This report has been prepared by Enterplan Limited for the Department for International Development (DFID) by Dermot Shields and Michael Blandy, through the DFID Economist Resource Centre framework. The views expressed herein are those of the author and do not necessarily represent the views of DFID.

Contents
DFID / India: Western India Rainfed Farming Project / Final Report / October 2005
Contents
Executive Summary i
Background
1
C.1 Introduction 1 C.2 Project Area 2 C.3 Implementing Agencies 3 C.4 Methodology 3 C.5 Project Structure and Analytical Framework 5 C.6 Project Costs 11
Financial Analysis 13
2
C.7 Introduction 13 C.8 Self-help Groups 13 C.9 Income Generating Activities (IGSAs) 17 C.10 On-farm Returns 21 C.11 Employment Generation 22 C.12 Conclusion 24
Economic Analysis 25
3
C.13 Introduction 25 C.14 Economic Parameters 25 C.15 Economic Project Costs 27

Contents
DFID / India: Western India Rainfed Farming Project / Final Report / October 2005
C.16 Incremental Crop and Livestock Benefits 27 C.17 Forestry Benefits on State or Communal Land 28 C.18 Incremental Benefits from IGAs 28 C.19 Drudgery Reduction Benefits 29 C.20 Migration Labour Support Programme (MSLP) 29 C.21 Project Returns and Analysis 29 C.22 Sustainability of Benefit Assumptions 31 C.23 Changes in Cost and Benefits Assumptions 32 C.24 Incremental Household Crop net Margins 33 C.25 Conclusion 34
Social and Institutional Factors 35
4
C.26 Introduction 35 C.27 Distribution of Benefits 35 C.28 Sustainability of Activities and Benefits 37 C.29 Institutional and Contractual Agreements 37 C.30 Sustainability and Viability of the Jankar System 39 C.31 Conclusion 39
Conclusions and 41
Recommendations 5
C.32 Introduction 41 C.33 Conclusion 41 C.34 Recommendation 44

Contents
DFID / India: Western India Rainfed Farming Project / Final Report / October 2005
Appendices
Proposal to Validate net A1-1
Incremental Income Estimates Using Area Measurements
A1
Background A1-1 Methodology A1-1
Suggested Methodology to A2-1
Undertake a CBA Study in “Prasaar” Villages
A2
Background A2-1 Methodology A2-1
List of Tables
Table 1: Core villages by year of entry 5 Table 2: Average investment costs per village 12 Table 3: IFFDC sample villages SHGs: Key financial indicators 15 Table 4: GVT sample villages SHGs: Key financial indicators 17 Table 5: IGAs: Summary of key financial indicators 20 Table 6: Incremental crop net margin per household 22 Table 7: Incremental livestock net margin per household 22 Table 8: Employment generated (4 sample villages) 23 Table 9: Cost-benefit analysis individual village results 31 Table 10: Effect of changes in assumptions about period of
analysis 32
Table 11: Effect of changes to cost and benefit assumptions 33
Contents
DFID / India: Western India Rainfed Farming Project / Final Report / October 2005
List of Figures
Figure 1: Analytical framework 6 Figure 2: Project processes 8 Figure 3: Link between NHIS (district level) and CBA Study (village
level) 27
Annexes
Background AN1: Terms of Reference AN1-1 AN2: Analytical Framework AN2-1 AN3: Study Methodology AN3-1 Case Studies
AN4: Jada Village AN4-1 AN5: Kadwapada Village AN5-1 AN6: Gara Village AN6-1 AN7: Moti Keheri Village AN7-1 ` Financial Analysis
AN8: Project Costs AN8-1 AN9: Self Help Groups AN9-1 AN10: Income Generating Activities AN10-1 AN11: Incremental Benefits AN11-1 Economic Analysis
AN12: Village Cost Benefit Analysis AN12-1 AN13: Project Cost Benefit Analysis AN13-1

DFID / India: Western India Rainfed Farming Project / Final Report / October 2005
Executive Summary
1
Executive Summary
i
DFID / India: Western India Rainfed Farming Project / Final Report / October 2005
Executive Summary
Background
1 The Western India Rainfed Farming Project (WIRFP) is a complex and innovative project whose objective is to ”enhance the livelihoods of 675,000 poor rural people” in west central India. The indicators of success, for the end of the project, are that:
• all households should have sustainably enhanced their livelihoods; and,
• effective community organisations should be in place to allow an exit from the villages.
2 The project builds on the success of Phase I, which was implemented by an NGO, GVT, set up by a public fertiliser company (KHRIBCO). In Phase II, which started in 2000, operations were scaled up with the introduction of additional districts and villages as well as a second implementing agency, IFFDC.
3 The project is located in one of the poorest regions in India, with poor soils and limited markets. In recent times, the main livelihood option for the almost exclusively tribal population is out migration for wage employment. Project villages were selected on the grounds of poverty and inaccessibility.
4 The cost benefit analysis (CBA) study is limited to the main component of the project (development in core villages) and does not address changes in nearby or “prasaar” villages (included under Component “B”) or in crop participatory technology development (Component “C”).
5 The CBA study addresses three issues:
• What are the economic returns to activities in the core villages (Component “A”)?
• What are the financial returns and viability to key stakeholders of project activities, including on-farm development, wage employment, Income generating activities and the operations of the main community institution involved in project implementation, the self-help group (SHG)?
• What is the effectiveness of the institutional and social arrangements in sustaining group and community activities after the project?
Economic Analysis
6 The overall economic returns for component “A” of the project, over 20 years using the assumptions set out in the report and annexes, was 10 percent. Although this is lower than the test discount rate generally used for project appraisal in India

Executive Summary
ii
DFID / India: Western India Rainfed Farming Project / Final Report / October 2005
this is highly commendable given the poor resource base, infrastructure and access to markets in the project area. Furthermore, it is clear that the project targeted and, therefore, benefited the poorest and least accessible villages in the one of the poorest areas of India.
7 The economic analysis is sensitive to four key assumptions:
• the period over which incremental benefits are assumed to continue. If this period was reduced from 20 to 12 years, the economic returns would fall to zero percent. The subsequent financial and institutional analysis suggests that 20 years may be an over-optimistic assumption;
• the incremental crop net margin was based on the results of the Net Household Income Study (NHIS) carried out in 2003. Although the study was carefully conducted, the sample size was relatively small and therefore care must be taken when interpreting disaggregated results. However, an overall increase of 20 percent in crop incremental benefits is required to achieve an economic return of 12 percent;
• the economic wage rate used to determine the opportunity cost of unskilled agricultural labour. This was estimated to be 75 percent of the official government wage rate. The migration labour study should provide additional information with which to test this assumption; and
• recurrent costs have not been factored into either project or activity budgets, and, therefore, the CBA team estimated recurrent cost post-project on the percent basis of investment or activity costs. If these initial base assumptions, by the CBA team, were further increased by 20 percent, overall economic returns would fall to eight percent.
8 Many of the cost norms used by the project are based on government standards and, therefore, are similar to other projects. As a result, the realisation of the surprisingly high estimated economic returns depends critically on the incentives for stakeholders to continue new practices and the arrangements put in place to secure these benefits in the post project period.
Financial Analysis
9 The financial analysis focused on the viability and sustainability of project activities for specific stakeholders, including farmers, labourers, SHGs, IGAs and, by extension, the jankar system. The financial analysis is critical to understanding the incentives for key stakeholders to participate and sustain new activities into the future. Generally speaking, where activities are not financially viable (i.e. activities which are a cost rather than a benefit) to stakeholders, it is highly unlikely that activities will be sustained.
10 The analysis suggests that the bulk of the sustainable project benefits are due to on-farm activities. The NHIS results show substantial returns for both crops and livestock investments. For all farmers this will have resulted in increased production, better nutrition and reduced out-migration.
Executive Summary
iii
DFID / India: Western India Rainfed Farming Project / Final Report / October 2005
11 Wage employment from project works was for many, if not most, people the main project benefit. Access to wage employment was through membership of a self-selected community group, called a self-help group (SHG). However, wage employment only provides benefits in a limited number of years during the life of the project.
12 Although some income-generating activities (IGAs) are clearly viable, especially when considered as supplementary income, most require further subsidies to ensure viability. This is not altogether surprising given local purchasing power. However, the low returns to specific enterprises raise doubts as to whether the associated jankars will continue as viable agents supporting project activities into the future.
13 The sustainability of most community based activities is dependant of the viability of the SHGs. Although many of these groups already hold considerable assets in cash and equipment, their continued functioning after the end of the project is not certain since they are still heavily dependant on project inputs including support from group jankars, who receive a project honorarium. Although some groups will maintain a sense of purpose beyond project activities, for others, the motivation to continue participation will wane after the project finishes and project promoted wage-labour activities finish.
14 The exit strategy for the programme is critical to both the continuation of the programmes and, where programmes cease, the distribution of private and group assets. In the case of IFFDC supported villages, the future of SHGs appears more secure under the umbrella of the cooperative movement and with the benefit of more focused group development during the project. GVT-supported villages have a less certain future, as a result of less attention being paid to developing SHG management and accounting systems.
15 The SHGs are responsible both for accounting for project activities and for operating a savings and credit programme. However, the role of the SHGs was perceived very differently by the implementing agencies, with the result that different levels of information were available for SHGs supported by IFFDC and GVT. Both implementing agencies maintain transactional records (such as passbooks and so on) at SHG level. In IFFDC-supported SHGs, SHG level accounts are also prepared and there is generally greater financial discipline in terms of clarity of “loan terms” and a better overall understanding of the financial status of each SHG. Apart from the transactional records, there were no summary accounts and much less financial discipline in GVT-supported communities.
16 The consequences of SHGs stopping depend on the nature of the SHG. Some of the SHGs are based around large WRD and JFM programmes which have their own identity and oversight, with their own incentives and financial rigour. Other project activities, such as on-farm activities will continue without the need for external or group support. Other groups are based around specific enterprises, whose sustainability is closely linked to the sustainability of the SHG. For groups based around employment-related activities, such as the soil and water conservation (SWC), the incentive to continue will fall once project activities cease and regular savings are no longer seen as a means to accessing wage labour.

Executive Summary
iv
DFID / India: Western India Rainfed Farming Project / Final Report / October 2005
17 However, the nature of the project design has resulted in nearly all SHGs building up substantial cash balances and acquiring assets. These could provide an incentive to continue operation after the project period, although in many cases members appear to have a weak and uncertain sense of ownership of balances in their own name, and an even weaker sense of ownership over group balances.
Institutional and Social Factors
18 Institutional and social arrangements, not all of which are under the control of the project, determine the overall returns as much as the financial and economic incentives. In particular, the sustainability of activities, including post-project operation and maintenance of the assets created by the project, depends on the continuation of effective institutional arrangements. The most critical social institution to sustain group and community activities after the end of the project and to determine the distribution of project assets and benefits is the SHG.
19 Clearly, strong personal relationships have been developed between project staff and SHG leaders, members and jankars. This people-friendly approach has assisted project implementation at all stages and resulted in positive feedback.
20 However, there are concerns about the capability of the SHGs to sustain project activities in the future. This is evidenced by the lack of “control and ownership” which SHGs exercise over the savings and credit arrangements, where there is both a lack of clarity over the loan and repayment conditions and, in the case of GVT supported SHGs, the absence of village summary accounts, which can be used to determine progress. The reasons for the ambiguity over the role of SHGs relate to the governance arrangements associated with the initial project approach (i.e. the distribution of power and voice between project, village and SHG) and the rigid accounting rules of the implementing agencies.
21 Conceptually, the project is still seen, at different times and by different people, as being about different objectives:
• investment in productivity; • public works and employment generation, and • a savings and credit programme.
22 Although these are not mutually exclusive perceptions, overhead expenditure can only be justified in terms of the priority assigned to each of these objectives. Clearly, the relationship between investment in productive assets and employment generation is positively related. However, justification for the development of a savings and credit programme and even the promotion of participatory planning and group formation is not so clearly made, given the role of these institutions in project implementation processes. These conceptual uncertainties, in turn, affect project systems and, therefore, project outcomes.
23 There was a clear perception that the main project benefit had been wage employment leading to reduced out-migration and debt repayment. This perception is supported by the analysis of the purposeful sub-sample, which shows that an average of between 40 and 145 workdays per household were generated per year during the project period.

Executive Summary
v
DFID / India: Western India Rainfed Farming Project / Final Report / October 2005
24 Voluntary labour contributions are required from communities for work on both private land and public land. Even with these contributions, the primary economic benefit for many people will have been wage employment. This conclusion is supported by the lack of concern exhibited in the community and amongst project staff about the use of public works (where half of the labour contribution is provided freely by the labourer) to create a private benefit in the form, for example, of SWC structures on private land. In theory and often in practice, SWC activities rotational through all SHG members, but inevitably farms differ in both their size and need for SWC works.
25 The lack of clarity in the contractual arrangements (agreements) over the terms of loans for borrowers or responsibility for repairs and replacement of IGAs has resulted in recurrent costs not being considered and allowing for non-repayers to capture an unfair share of benefits.
26 The viability and sustainability of the jankar system depends on the institutions, such as SHGs, remaining in place. The group jankers are also dependent on the savings and credit arrangements continuing at the end of the project. Livestock jankars may have more scope to become self-funding from fee income and, although there are few government vets in the area, they will have to compete with more qualified government staff with subsidised drugs.
Conclusion
27 The project has had considerable success in delivering benefits to some of the poorest people in central India. However, the analysis has shown that the overall returns depend heavily on the viability and sustainability of key institutions and enterprises. The proposals for post-project support may ensure longer sustainability. However, given the resource base and limited demand, it is unlikely that many of these interventions would be viable without external technical and financial support.
28 In addition, the financial and institutional arrangements required to ensure the success and continuation of the unique features associated with the project (viz., participation, SHGs and the Jankar system, the link between savings and credit programmes and investments) remain uncertain.

DFID / India: Western India Rainfed Farming Project / Final Report / October 2005
Background
1

Background
1
DFID / India: Western India Rainfed Farming Project / Final Report / October 2005
Background
1
C.1 Introduction 1 The Western India Rainfed Farming Project (WIRFP) is a complex and innovative project whose objective is “to enhance the livelihoods of 675,000 poor rural people”. The project memorandum states that, by the end of the project:
• “all households should have sustainably enhanced their livelihoods”, and • “effective community organisations will enable an ‘exit’ from the villages”. 2 Phase II of the project, which started in 2000, replicates and broadens the experience of the Phase I approach. The key features of the WIRFP approach are to:
• target the very poorest areas and people, • plan using a participatory planning process, • implement through Self Help Groups (SHGs), • require contributions through labour and compulsory savings, and • use local para-professionals (jankars) to support activities.
3 The “cost-benefit analysis” (CBA) study, undertaken by a team of three external consultants and eleven project staff, was commissioned to determine the economic impact of the programme on people’s livelihoods and to better inform priorities during the exit phase (Annex 1). A secondary objective was to provide training in economic analysis to project staff.
4 The key issues for the Cost-benefit analysis (CBA) study, derived from the project objectives, are to determine whether:
• incremental benefits (current and projected, direct and indirect) exceed project costs; and,
• community organisations are able to ensure the sustainability of the incremental benefits after the end of the project.
5 The three main questions that the study addressed were:
• What are financial returns and viability from the perspective of different stakeholders, for example, SHGs, Jankars, borrowers, land and livestock owners? The financial analysis determines whether there is an incentive for key stakeholders to continue after the end of the project period.
• What are the expected economic returns to the project and the main programmes from society’s perspective (i.e. in a holistic sense)? The economic analysis determines whether the project costs were justified in terms of the impact on beneficiaries and stakeholders.
Background
2
DFID / India: Western India Rainfed Farming Project / Final Report / October 2005
• What is the likely effectiveness of the institutional and social arrangements to sustain group and community activities, after the end of the project. The effectiveness of institutional arrangements depends on the sense of community empowerment (ownership, control and voice, inclusion, leadership), sense of fairness (in the distribution of benefits), capability to maintain management systems and processes. These institutional and social arrangements, not all of which are under the control of the project, determine the overall returns as much as the financial and economic incentives. In particular, the sustainability of activities, including post-project operation and maintenance of the assets created by the project, depends on the continuation of effective institutional arrangements.
6 The report is broken into five Sections: Section I provides background to the project, project activities and to the study; Section II focuses on a financial analysis of the SHGs and IGAs from a private perspective. Section III is the economic analysis from a societal perspective of the crop, livestock and forestry activities and of the project as whole. Section IV, examines the institutional and social factors which underlie both the distribution of benefits and the sustainability of the benefit flows. Finally, Section V provides overall conclusions and recommendations.
7 The annexes to the report should be treated as an integral part of the study. Annexes 1 to 3 provide additional background information for the study and to the analytical framework. Annexes 4 to 7 set out the case study material for the four villages selected for more in-depth study including institutional and social issues, while Annexes 8 to 13 provide a more detailed description of the assumptions and models from the 20 sample villages from which the financial and economic analysis is derived.
C.2 The Project Area
8 The project is located in seven contiguous districts of three states in West central India: Jhabua, Dhar and Ratlam along the western border of MP; Banswara and Pratapgarh along the southern border of Rajasthan and Dahod and Panchmahals Districts in eastern Gujurat.
9 The project area is one of the poorest in India. The natural resource base is characterised by poor soils, low and erratic rainfall and low productivity. The whole region can be considered as ecologically fragile.
10 Economically, the area suffers from being physically inaccessible with poorly developed infrastructure and limited access to markets. Migration has long been a major element of local livelihoods for the predominantly tribal population (80 percent of the total population in the eight districts). Little government funding has reached the area and there are few experienced NGOs operating the area.
11 The majority of the population are classified as “Schedule tribes”. Literacy levels are low and although the area benefits from additional tribal development funding, people have less access to public services such as roads, clinics and schools when compared to more developed areas.

Background
3
DFID / India: Western India Rainfed Farming Project / Final Report / October 2005
C.3 Implementing agencies
12 The project is implemented by two separate implementing agencies operating in different villages (Table 1):
• Gramin Vikas Trust (GVT) operates in 202 core villages covering three states of Gujurat, MP and Rajasthan. GVT is an NGO established by KHRIBCO, a Government fertiliser company, and retains many of the procedures (including financial systems) used by the parent company. GVT were the sole implementing agency in Phase I of the project and were therefore able to start implementation from the beginning of Phase II;
• Indian Farm Forestry Development Cooperative (IFFDC) were not involved in Phase I of the project. They started initially (1999/00) in one district in Rajasthan and slowly and carefully built up experience in 25 villages. Since 2002/03, IFFDC have expanded into a further 50 villages in Madhya Pradesh.
13 In general, the study findings apply to villages supported by both agencies. However, in some instances there were significant differences in either practice or results and, in these cases, comparison between the agencies has been made.
C.4 Methodology1/
14 The analysis is villages only.
15 The study consisted of three main data collection components carried out in Phase II villages:
• Main village sample (random), • Case study sample (selected), and • Enterprise sample (selected IGAs). 16 The main village sample consisted of 20 project villages drawn randomly from the population of 90 villages, which started in 2000/01, the second year of the project. The reason for focusing on the second year was to exclude both the first, start-up, year villages and the later villages for which there was less data. About one third of all project villages were started in this year (Table 1).
17 The village data from the random sample, together with the project investment costs was used to build the financial and economic models. For each of these villages, data was collected on project development activities and the associated costs and benefits.
18 The study made use of the findings of the Net Household Income Study (NHIS), which had been undertaken in 2004 to estimate benefits. The NHIS provided critical information about incremental income due to on-farm crop, livestock and forestry activities. The NHIS study provides results aggregated at a village level and broken down by “well-being” (or poverty) class. Although village and households
1/ The methodology was agreed at a planning workshop held in Ratlam (July 2004).

Background
4
DFID / India: Western India Rainfed Farming Project / Final Report / October 2005
were randomly selected, the study suffers from a small sample size – particularly at the level of well-being classes. However, the study was carefully and fully conducted and was, therefore, used in the analysis.
19 The main implication of this approach is that “households”, rather than “areas”, are used as the basis for aggregation. The alternative of using “areas” was not possible because of the difficulty in obtaining area data for different investments from project records. Although planned (command) areas were available for some, but not all, project investments, information on actual areas covered is not readily available and does not include information on areas where different activities overlap. As a result, the assumptions required to aggregate by “area” are likely to be greater than those, which underlay the NHIS and aggregation by household. Nonetheless because of the small sample size in some well-being classes, the results are likely to be more robust at higher levels of aggregation (i.e. district results will be more robust than village results and project results more robust than district results).
20 Consideration was also given to replicating the NHIS in additional villages, i.e. effectively expanding the sample size and therefore the reliability of the results. However, given the difficulties the NHIS team had in data collection, this was not possible give the CBA resources. Another alternative was to reduce the CBA sample and to map areas, including overlapping areas, in a limited number of villages. However, this was not acceptable given the variation in activities across the project.
21 The case study sample was based on a purposeful selection, based on discussion with field staff, of 4 “representative” villages from the 20 random sample villages, for a more in-depth study of both the social and institutional arrangements in a village and the impact of the project on them. The qualitative information, available from the social and institutional sample, provided additional insights into project operations and was especially useful in the analysis of sustainability and the distribution of benefits. These villages were also used to derive the financial analysis of the Self-Help Groups (SHGs); and
22 Enterprise “sample” was based on a purposeful selection of 12 keys Income Generating Activities (IGAs) out of the many and diverse IGAs found in the project. Data on these IGAs were purposively sought, both inside and outside study villages, since not all IGAs were found in project villages. The data was used, together with a number of common assumptions, to develop 12 stand-alone IGA models which were then used for the financial analysis of each IGA. The standalone models were then incorporated into the overall village models used for the economic analysis.

Background
5
DFID / India: Western India Rainfed Farming Project / Final Report / October 2005
Table 1: Core Village Entry by Year
Implementing Agent State / District
1990/1 2000/1 2001/2 2002/3 2003/4 Total
GVT 1 Gujarat Dahod 5 15 - - - 202 Madhya Pradesh Jhabua 22 19 6 25 - 72 Ratlam - - 18 32 - 503 Rajastan Banswara - 37 14 9 - 60 Subtotal 27 71 38 66 202IFFDC 1 Rajastan Pratapgarh 6 19 - - - 252 Madhya Pradesh Ratlam - - - 50 - 50 Subtotal 6 19 - 50 - 75Totals 33 90 38 116 - 277Source: GVT / IFFDC Coordination Office Ratlam, Madhya Pradesh. GVT = Gramin Vikas Trust, IFFDC = Indian Farm Forestry Development Cooperative.
C.5 Project Structure and Analytical Framework
23 The first step in constructing an economic model or analytical framework is to describe the benefits (or outcomes) and costs (or activities) and to ensure a causal link between them. As well as identifying relevant costs and incremental benefits (Figure 1), the analytical framework represents our understanding of the project structure (Annex 2).
24 The project consists of two main costs elements:
• Administrative overheads at HQ and State coordinator (SC) level, plus technical assistance (TA) including international consultancies; and
• Developmental costs consisting of three Components:
• Core villages; • Prasaar (or low-intensity nearby) villages and the Challenge Fund; and • Crop participatory technology development.
25 The CBA analysis relates only to Component “A” (core village development) and, as a result, administrative costs have been apportioned between these three Components.
26 Component ”A” development costs have been further disaggregated into:
• Village organisation and development (VOD) costs which relate to participatory planning and group formation; and
• Field investment costs, relating to different activities.

Background
6
DFID / India: Western India Rainfed Farming Project / Final Report / October 2005
27 The analytical framework reorganises costs and activities to present the budget in terms of impact and benefits to beneficiaries. As a result, the field activities are grouped in terms of impact on:
• Household income (from crop, livestock and forestry activities), • Interest income from IGAs, • Time savings from drudgery reduction, and • Increased and additional wages for MLSP. 28 This framework includes household benefits from increased production (such as improved nutrition) and, where debt has been reduced or savings acquired, from reduced vulnerability as measured in terms of income. However, the framework excludes “externalities” such as improved environmental protection which are difficult to measure and are discussed in the final section.
29 The overall returns depend not only on costs and benefits, but on the extent to which the investments are used and continued to be used into the future. Assumptions about sustainability and long-term adoption of project investments are therefore critical.
30 In summary, costs are split between administration, VOD and development. Adoption or uptake of new technologies and use of new assets have been estimated in terms of numbers of households or IGAs promoted. Finally, unit benefits for land-based activities are derived from the NHIS study and study estimates have been prepared of interest income, time saved (drudgery reduction) and increased employment and higher wages. These have been aggregated by the uptake rates to estimate total benefits.
Figure 1: Analytical Framework (not drawn to scale)
31 The analytical framework for the study (Figure 1) provides an overview of the analysis. The project structure and project processes show the underlying causal links and relationships.
32 Project Processes – The project approach emphasises the importance of people’s participation. A key strategy of Phase II was “to enhance group’s capacity to
HH
Area
No
AdminHQSCTA
VOD
PPGFSHG
Crops
IGA
DR
L’stockForestry
Costs Adoption Benefits
HH Income
Interest Income
Time saved
MLSP High wages

Background
7
DFID / India: Western India Rainfed Farming Project / Final Report / October 2005
function independently of the project with more attention to savings and credit and federations, cooperatives and other formal group structures” (Figure 2). Further a specific aim of the project is to create effective and empowered community organisations.
33 Planning through participatory processes – The starting point for all project activities is a participatory planning exercise carried out at village level, including both wealth ranking and the development of a village resource map. The output of this exercise is a village development plan with a prioritised list of “wants” which determines demand. However, this planning process is formally disconnected from implementation, monitoring and evaluation, which are the responsibility of the SHG or other appropriate committees.2/ No village level committee is established.
34 Implementation through formation of Self Help Groups (SHGs) – The SHGs are self-formed (i.e. not formed by the project) and therefore based on “natural affinities”, often around hamlets (falias), patrilineal decent groups, gender or a particular activity follow on from village development planning. These groups are the hub through which the project is implemented and managed. The SHGs are the primary project-created institutions.
35 Budgeting and thematic programmes – Budgets and programmes are prepared at district level and approved by the project, based on consolidation of the village development plans. This may also involve some prioritisation especially for large “lumpy” investments such as WRD structures, to ensure that activity levels are consistent with resources and capacity.
36 Implementation is managed through agencies other than the village. These include SHGs, jankars, and different types of user association. Although the SHG is the key agency through which implementation takes place, some of the larger interventions are organised at a higher level than the SHG. Even in these cases, the SHG will be involved in organising and accounting for voluntary labour collections. These interventions include:
• WRD schemes which often cover several villages and many SHGs;
• Livestock (cattle) programmes which are organised at a village level, especially if government officials are involved; and
• JFM activities which are organised at village level.
2/ For large capital intensive investments or where the investment involves more than one SHG or village
– such as WRD - the unit of management is a users association, such as Water Users Association (WUA) or a Joint Forest Management (JFM) Committee.

Background
8
DFID / India: Western India Rainfed Farming Project / Final Report / October 2005
37 A schema of project processes is set out in Figure 2. This shows three main managerial areas:
• the management of larger lumpy investments such as WRD and JFM which tend to be centrally managed by project staff, often through contractors. The main link with the SHG is through labour which is organised through the SHG and to whom workers contribute part of their wage;
• the management of SHG related activities, including savings and credit activities and some IGA related activity;
• the management of IGAs lie with specific jankars and can be considered as an sub-enterprises of the SHG.
Figure 2: Project Processes 38 This categorisation gives rise to different types of beneficiaries: farmers from increased productivity; workers from increased employment; borrowers from improved liquidity and access to credit; entrepreneurs from returns to IGAs and, more generally, “users” of new assets brought into the area.
39 Project activities – Finally, the analytical framework requires an overview of project activities whether implemented through SHGs or directly by the project. SHG implemented activities are those activities which the SHG is expected to implement post project while project related activities are ones which would required external finance.
ProjectBudgets by activity
VillageVillage development plan
SHG
IndividualaccountAssets Group
account
Works
Contractor
Workers
IGA
Users
5% deduction
Jankar
Borrowers
Wages
3%2%
Repayments
Loans
Jankar
Members
Regular
savings
Fees
Honarium
S&C

Background
9
DFID / India: Western India Rainfed Farming Project / Final Report / October 2005
40 Self-Help Groups – SHGs exist as the main institutional structure around which the project is implemented and through which activities will be sustained into the future. In general, an SHG corresponds to a hamlet (or falia). In some falias there are separate SHGs for women and men. In other cases, SHGs are organised around particular enterprises or activities. Formation of an SHG is a condition of participation in the project and is integral to project implementation.
41 SHGs are responsible for the management and accounting of:
• the savings programme; • the credit programme; and • SHG assets and income generating activities. 42 Savings – The savings programme consists of two parts: individual savings and group savings. All funds are consolidated and held in a bank account from which the SHG earns (bank) interest.
43 There are two forms of individual savings, both of which are entered in an individual’s passbook:
• regular savings are fixed by the SHG members at a reasonable figure usually ranging from Rs 5 to Rs 40 per month. In SHGs, there is a system of fines for late payment, although most lack the financial discipline required to enforce these penalties; and
• voluntary savings of five percent of paid wages are automatically deducted, 3 percent of which goes to the individual members account and two percent goes to the group funds. This is on top of the voluntary labour contribution from members of 25 percent free labour for work on public land and 50 percent free labour for work on private land.
44 Group savings are kept collectively in the name of the SHG. As well as the voluntary contribution from wages, group savings includes other group income from:
• lending to individuals • lending to individuals for IGAs; • operation of group assets as IGAs and, finally, • bank interest, penalties and fines.
45 Finally, project funds flow through the SHG for various activities including the IGAs. Some IGAs are managed as group assets, for which the SHG earns fee income, while others are managed as individual loans for which the SHG receives (loan) interest payments.
46 IGA – Although there is a wide range of IGA activities associated with each SHG, these activities broadly fall into two main categories.
• SHG owned assets and managed enterprises. Here the SHG appoints a Jankar to manage the activity on the SHG’s behalf, either on a lease or wage basis; and

Background
10
DFID / India: Western India Rainfed Farming Project / Final Report / October 2005
• Individual enterprises, with loans through the SHG, for members to set up small businesses,and so on.
47 The SHG accounts provide a mechanism to bring together all project activities around a particular group. Although transactional records of deposits and payments are maintained in each SHG and for each passbook holder, in GVT-supported SHGs, the accounts are not consolidated and therefore no use is made of these records. In IFFDC-supported SHGs, accounts are prepared and utilised. The result is that IFFDC considers SHGs as a key agent of project implementation while GVT treats SHGs as an instrument for project implementation.
48 Development activities – The project supports an enormous range of different interventions – under the principle that no reasonable proposal is rejected. It is therefore essential to categorise interventions into a meaningful and tractable set. These categories must reflect the way both cost and benefit data is presented. The categories proposed by the CBA team are as follows:
• Crop related activities, including SWC, WRD, crop technologies (crop, varieties, inputs, techniques etc) and farm forestry, the end-user benefits of which are found on private farms. The reason for treating these activities as a single programme is that ultimately the benefits of each are measured in the value of increased yields, the interactions between changes in water, soils, variety and technology are difficult to separate resulting in the danger of double counting the benefits on farmer fields.
• Water from WRD investments can be used for both crop irrigation and domestic purposes. WRD includes both large scale investments in irrigation and smaller scale construction and rehabilitation of broken wells. Data was not available as to the proportion of costs spent on different types of investments. Further, it would not be possible to partition water use between crops and domestic use. As a result, the assumption used for the calculation is that all the water has been used for crops, and that the health and other benefits from additional and improved water supplies are worth at least as much as the returns from irrigation.
• Livestock (cattle) activities, including the activities of the livestock jankar, the vaccination, de-worming, castration and general vet/med programmes. The benefits here are measured in terms of herd productivity which also includes the effect of increased fodder/grass and water where available. The Livestock Jankar charges a fee for his services and, therefore, the viability of this arrangement, with and without project support will determine the sustainability of this programme.
• Communal forest plantations, including JFM. Community plantations are self contained and support by the project, while JFM activities require no direct project funding.
• Drudgery reduction (or so-called “social development”) activities, mostly low cost inputs, often designed to assist women, which have direct benefits, but which might as be regarded as “entry-point” activities.

Background
11
DFID / India: Western India Rainfed Farming Project / Final Report / October 2005
• Migration labour support programme (MLSP) is a relatively new development activity being limited to budget allocations for GVT operations in Gujarat, Rajasthan and Madhya Pradesh. The programme is the subject of ongoing studies in these states with very small expenditure to date.
49 The analytical framework provides a structure for the economic analysis by describing and defining what is included (and excluded). The framework is also important in identifying those elements of the project, which are critical to success and to sustainability. Before proceeding to the analytical sections of the report, we first set out project costs.
C.6 Project Costs3/
50 Project investment cost data for both administration and development was provided for the four-year period 1999/2000 to 2003/04 in actual terms and for two-year period 2004/05 to 2005/06 in budgeted terms. Financial and in-kind contributions, by government and by communities were also included in the total project costs. However, project budgets do not include the projected recurrent costs required to operate and maintain project assets.
51 Administrative costs account for 40 percent and 50 percent of total project costs for GVT and IFFDC respectively. Administrative costs are basically all the costs which have not been allocated to specific activities, including the overhead costs of HQ,and regional administration (staff, offices and facilities, equipment ) as well as consultants commissioned directly from DFID managed funds. There were small variations in co-ordination office costs.
52 Development costs are all costs directly attributable to development activities in core villages of which the main costs are for SWC and WRD. These activities together account for about 70 percent of the development costs, with soil and water conservation (SWC) activities comprising about half (46 percent of the total) of these costs. Water resource development (WRD) accounts for about a quarter of total costs (22 percent of development costs).
53 Village investment (overheads and development) and recurrent costs were prepared by:
• allocating administration costs including Project HQ and the cost of DFID hired consultants to each Coordination Office and, then, dividing total costs equally per village; and
• reconstructing development expenditure for component “A” on the basis of actual physical activities in the sample villages and actual unit costs. These figures show a wide range of variation when compared with overall averages. The costs of components “B” and “C” and the cost of the “challenge fund” were excluded from the analysis;
• Estimating on-going recurrent costs In the absence of business plans or alternative plans, recurrent costs were estimated as percentages of annual or
3/ See Annex 8, for details.

Background
12
DFID / India: Western India Rainfed Farming Project / Final Report / October 2005
accumulated investment costs (see Annex 8, Table A8.4). For the purpose of the analysis, recurrent costs have been estimated and included in the total project cost, adding approximately 15 percent to the average budgeted cost for each enterprise. The assumption is that these costs would be met directly by beneficiaries.4/
54 Average village investment costs – On the basis of the adjustments made to apportion administrative costs and include recurrent costs, estimates of average village level costs were prepared for each district (Table 2). These averages show variation in both administration and development costs between coordination offices. IFFDC costs are roughly the same as the average of GVT districts.
55 The variation across districts reflects the different areas under development. Interestingly, IFFDC investments in WRD are substantially higher than GVTs investments (approximately double) although GVT invests more in crop technology. Likewise, GVT investments are substantially greater for SWC than IFFDC (by a factor of about five). IFFDC also spend less per village on VOD than GVT
56 Although the variation between GVT districts is mostly explained by different circumstances found in the districts, expenditure on WRD and livestock development is broadly similar across each of the district.
Table 2: Average Investment Costs per Village Rs’000 (Financial)
Agency GVT IFFDC State Gujarat M Pradesh Rajasthan Rajasthan Office Dahod Jhabua Banswara Pratapgarh Administration Costs Project HQ 383.7 383.7 383.7 432.5 DFIDI 338.6 338.6 338.6 338.6 Coordination Office 1,757.7 903.1 869.2 1,595.6 Subtotal 2,480.0 1,625.4 1,591.5 2,366.7 Development Costs Component A PPGF 124.7 41.6 90.4 49.4 VOD 405.7 195.3 312.3 156.0 Crop Technology 228.4 134.2 209.4 98.1 SWC 1,132.1 796.7 1,091.8 175.1 WRD 641.4 616.4 692.8 1.396.1 Livestock 178.3 118.1 122.2 60.8 Forestry 134.1 82.7 60.2 75.9 Migration Support 34.4 11.7 7.3 - Subtotal 2,879.1 1,996.7 2,586.4 2,011.4 Totals 5,359.1 3,622.1 4,177.9 4,378.1 Source: Cost Benefit Analysis Study Jan 2005. GVT = Gramin Vikas Trust, IFFDC = Indian Farm Forestry Development Cooperative. DFIDI = Department for International Development (India). PPGF = Participatory Planning and Group Formation, VOD = Village Organisation and Development, SWC = Soil and Water Conservation, WRD = Water Resource Development
4/ Recurrent costs extend beyond the project period in the same way as benefit flows. Without these
recurrent costs being met, benefit flows would cease. If these real costs were to be excluded the net benefits would be overstated and investment returns inflated.

DFID / India: Western India Rainfed Farming Project / Final Report / October 2005
Financial Analysis
2
Financial Analysis
13
DFID / India: Western India Rainfed Farming Project / Final Report / October 2005
Financial Analysis
2
C.7 Introduction
57 The financial analysis addresses the viability and sustainability of project activities from the perspective of SHGs and private individuals. The two main issues relate to:
• the role and status of the SHG as both:
• a savings and credit institution;
• a conduit for the management of project activities in the post-project period; and
• the financial viability of IGAs both for SHGs who tend to manage larger initiatives and for those individuals who have taken loans from SHGs.
58 Finally, the assumptions about the financial returns from on-farm activities are considered. These have been derived from the Net Household Income Study (NHIS) undertaken by the project in 2003/04.
C.8 Self-Help Groups (SHGs)1/
59 Introduction – in practice, as was discussed earlier, the role of the SHG within the project varies between the two implementing agencies. For IFFDC, with a more explicit focus on institutions and their sustainability, the SHG has a more autonomous status than for GVT, which treats SHGs as a means for the implementation of activities. The analysis in the following section therefore differs in its treatment of the SHGs supported by the tow implementing agencies.
60 IFFDC maintains good accounts and records for each SHG, considerably in excess of the minimum requirements suggested by NABARD. Information was available for all six-sample villages (Table 3).
• Membership
• SHG participation was over 90 percent of participating households in the six sample villages.
1/ See Annex 9 for details.

Financial Analysis
14
DFID / India: Western India Rainfed Farming Project / Final Report / October 2005
• Savings
• The average savings per group was about Rs 115,000 accumulated over four years – about Rs 1,340 per household or Rs 40 per month.
• Roughly 60 percent of the group savings was in the form of individual deposits, the remained being held as group savings.
• Loan portfolio
• The average loan is small at Rs 354. The main purpose given for taking a loan is production (mainly seed and fertiliser) – accounting for 50 percent of loans followed by consumption (32 percent) and health (15 percent). IGAs (two percent) and Education (one percent) accounted for the remainder of the loan portfolio.
• No breakdown was available on the status of the outstanding loans and no provision was made for “bad debt”. This may be due to the system of loan specification where no final date is set for capital repayment and interest payments are expressed as a fixed sum – effectively for an indefinite period.
• Loans account for only 53 percent of total savings, with the remainder (47 percent) being held in the form of a bank deposit. These high un-disbursed balances, in the context of widespread indebtedness and with households continuing to take loans from other sources, suggests a reluctance of the SHG to make loans. The reasons behind this paradox are unclear – although the lack of financially viable IGAs being proposed is clearly one possible factor.
• In Moti Kheri, one of the villages studied in depth, although savings levels had been maintained over a four-year period and the average size of loans had increased very modestly, the number of loans advanced had reduced significantly. (The number of loans in 2004 was 65 percent of the total advanced in 2003.) Further data is required to determine whether this reflects the market for loans and IGAs.

Financial Analysis
15
DFID / India: Western India Rainfed Farming Project / Final Report / October 2005
Table 3: IFFDC Sample Village Self Help Group Financial Indicators
Item Chhayan Chhota Manga
Dharis Kheri
Kachotia Moti Kheri
S Ka Khera
SHG Membership (No) 87 51 94 106 164 15 Deposits (Rs) Individual 102,150 39,536 68,493 67,206 150,852 6,002 Group 45,635 30,481 22,467 32,499 127,135 727 Total 147,785 70,017 90,960 99,705 277,987 6,729 Average Deposit / Member 1,699 1,373 968 941 1,695 449 Loans Outstanding 156,560 36,950 31,803 37,180 103,038 5,000 Balance on Deposit (8,775) 33,067 59,157 62,525 174,949 1,732 Income Interest 32,307 4,379 7,315 4,270 14,889 214 Penalty Interest 295 70 62 2,535 1,077 5 Total 32,602 4,449 7,377 6,805 15,966 219 Expenditure (6,940) - (334) (277) (48.500) - Income Less Expenditure 28,862 4,449 7,043 6,528 (30,334) 219 Cash (in hand and Bank) 20,087 37,516 66,200 69,053 144,615 1,951 Loan Portfolio Outstanding 156,560 36,950 31,803 37,180 103,038 5,000 Repaid 207,615 39,953 64,080 93,158 176,872 4,130 Total 364,175 76,903 95,883 130,338 279,910 9,130 Loan Numbers 896 199 227 533 824 23 Average Loan Size 406 389 422 245 340 397 Loan Types (%) Consumption 28 35 19 31 45 96 Health 25 4 2 3 11 1 Education 0 1 2 2 1 0 Micro enterprise 4 0 0 3 1 0 Production 43 60 77 61 42 3 Total 100 100 100 100 100 100 Source: IFFDC Coordination Office Pratapgarh, Rajasthan. IFFDC = Indian Farm Forestry Development Cooperative. 61 GVT – Although GVT maintains records of deposits and payments (i.e. passbooks and ledgers) for each SHG, there was virtually no physical or financial information as to the functional status of each SHG. This finding supports the conclusion that the SHG is not seen as decision-making agency for GVT since there has been no attempt to provide information to enable the SHG to make strategic and post-project decisions.
62 The absence of summary accounts does not, of itself, make the SHG unviable and, therefore, the team undertook the time-consuming task of extracting inflows and outflows from a random sample of SHGs in the villages selected for in-depth study (Table 4). The key findings from this exercise were:
• Membership – The average size of each SHG was about 17 members.
• Savings and deposits – Average deposits for the three villages ranged from Rs 1,262 to Rs 2,134 per household over four years representing monthly savings per member of between Rs 26 and Rs 47.

Financial Analysis
16
DFID / India: Western India Rainfed Farming Project / Final Report / October 2005
• Loan portfolio – The total loan portfolio ranged from Rs 450 to Rs 1,980 per member. The purpose of the loans was not extracted. In Kadwapada village, where the deposits were also significantly higher, the outstanding loans accounted for 73 percent of the accumulated cashflow. Elsewhere, this figure was similar to the 50 percent found in the IFFDC villages and ranged from 49 percent to 58 percent of accumulated savings.
63 More generally, SHGs, supported by both agencies, appear to maintain relatively high cash balances given the indebtedness found in the villages. Possible reasons for this paradox, all of which require further investigation, include:
• a cautious, low-risk approach to lending on the part of the SHG and/or project staff;
• limited viable investment opportunities; and
• non-financial benefits or pressures (social reciprocity) from money lenders, which are not included in the SHG loans.
64 Summary – The two implementing agencies have held different concepts about the role of SHGs and this has resulted in different approaches:
• For IFFDC, SHGs are treated as agencies within the project. There is information available on the status and progress of each SHG. There is vision and plan for incorporating SHGs as cooperatives under a federated structure. Hence, there is a possibility that IFFDC-established SHGs could and will be sustainable in the post-project period.
• GVT have not conceptualised SHGs in the same way and treat SHGs as a means of working “through” communities. As a result the status of each group is unknown to GVT management, to the SHG leadership and to its individual members.
65 Effectively, SHGs are responsible for the implementation of a micro-finance programme with both savings and credit components. They hold increasing large amounts of money on behalf of very poor people. In the case of GVT-supported SHGs, the mechanisms to track and monitor performance of the savings and credit programme is missing. Such information is essential to the operation of an empowered community group.
66 An interesting question arises around the future of individual savings held in the SHG accounts. Individuals have accrued capital from voluntary savings, from compulsory contributions and have claim on a share of the assets (machinery or outstanding loans) and operating returns (interest, fees, etc) of the SHG. The arrangements for the winding up of an SHG, with positive assets, had not been developed or tested. However, the “ownership” of these assets/claims has not been tested in practice. Since for some people, voluntary monthly savings are regarded as the entry fee to employment opportunities, even these (substantial) amounts may not be fully appreciated as assets with a private claim. For some people, withdrawal of

Financial Analysis
17
DFID / India: Western India Rainfed Farming Project / Final Report / October 2005
these assets (often in excess of Rs 2,000) might be more rational than acquiring further debt.
67 Closely connected to the role of SHGs is the promotion and operation of Income generating activities (IGAs) and the role of Jankars.
Table 4: GVT Self Help Group Cash Flow Analysis and Financial Indicators
Item \1 Gujarat Jadha
M Pradesh Kadwapada
Rajastan Gara
Cash Inflow Deposits Member Savings 93.803 71,217 48,195 Group Savings 63,101 37,609 61,613 Subtotal 156.904 108,826 109,808 Group Activities (Net) 48,420 27,899 12,500 Interest Income 31,669 2,065 1,540 Total Cash Inflow 236,993 138,790 123,848 Cash Outflow Loans Outstanding Individuals 131,883 100,980 53,100 Group 5,064 - 500 Total Cash Outflow 136,947 100,890 53,600 Cash Balance 100,046 37,810 70,248 Key Financial Indicators Membership 99 51 87 Average Savings / Member 1,585 2,134 1,262 Annual Increase 259 547 451 Outstanding Loans As Percent of Cash Inflow 58% 73% 49% Average Loan Size 1,383 1,980 616 Interest Income As percent of Average Loans 7% 1% 4% Source: Cost Benefit Analysis Study, Jan 2005 based on field interviews. \1 Field data as at March 2004. C.9 Income-Generating Activities (IGAs)2/
68 Background – The project has promoted a wide range of IGAs – too many to subject to individual analysis. In this chapter, we analyse 12 typical, but different IGAs of which nine were individual loans and the remaining three group IGAs. In general, the individual IGAs were for smaller items (less than Rs 5,000) while the
2/ See Annex 10 for details.

Financial Analysis
18
DFID / India: Western India Rainfed Farming Project / Final Report / October 2005
group IGAs were for significantly larger enterprises ranging from Rs 20,000 to Rs 25,000
69 Methodology – For each of the representative IGAs, a financial plan (model or business plan) was developed based on data provided by key informants. Some of the models were owned by individual entrepreneurs while others were group owned and managed. Each model consisted of:
• capital investment costs, and the associated financing plan consisting of equity, subsidies and loans, and a residual asset value at the end of 12 months, showing increases or decreases in capital;
• the operating costs required to run the enterprise; and,
• sales and returns - based on actual 12 month records.
70 In practice, the financing arrangements (monthly interest payments, grace periods and loan period) were varied. In many cases, they were not clearly defined and, in some cases, neither borrower nor lender knew the terms of the loan! In order to compare IGAs, using a common basis, two assumptions were used:
• fixed interest rate of 1.5 percent per month on the outstanding balance was used for all IGAs. This was at the lower end of current SHG interest rates which varied from one percent to five percent per month, and
• principal repayments were only made in months when a positive cash flow was generated, effectively allowing for a loan extension.
71 Where IGAs were managed by an SHG, the project advanced money to the SHG bank account for capital purchase. A fee was charged by the SHG to users to cover running costs and remuneration of the Jankar. There was no charge for capital and no “sinking fund” built up to cover the replacement costs at the end of the life of the asset. Again, in order to determine the viability of these enterprises, capital and financing costs (equivalent to a sinking fund or the taking of new loan at the end of the life of the equipment) were included in the model.3/
72 Results – the analysis shows financial returns ranged from zero percent to 18 percent (Table 5).Since the cost of borrowing is 1.5 percent per month (approximately 18 percent per annum), this suggest that these enterprises are not viable at full cost. However, as well as the financial returns, or returns to capital, the IGAs also provide a return to labour which ranges from Rs 41 to Rs 82. This is slightly better than the prevailing wage labour rates in Kharif (Rs 40-50) and considerably better in Rabi (Rs 20 – 30) and hence provides an incentive for entrepreneurs to consider an IGA as an alternative or supplementary source of wage
3/ Without considering capital costs, the issue of viability becomes irrelevant since the operation depends
on external subsidies. Since the fee doers not include repayment of the capital cost, neither the lender (the SHG) nor the borrower is in a position to recycle the capital in the future. In practice, however, it is unlikely that a “sinking fund” would be build up to cover replacement at the end of the useful life of the equipment/asset.

Financial Analysis
19
DFID / India: Western India Rainfed Farming Project / Final Report / October 2005
labour. However, it should be remembered that most of the IGAs do not provide full time employment throughout the year.
73 Although most of the individual IGAs are marginally financially viable, they provide additional family income at times when alternative employment is scarce. However, the scope to expand IGA activities remains constrained by the limited markets for products. This finding was especially true for service IGAs, such as sewing machines and village stores.
74 Surprisingly, most of the group IGAs were not financially viable. In the case of large equipment such as irrigation pumps, this appears to reflect high overhead costs including the costs of capital and financing, which are not covered by hire charges. High overhead costs are also due to relatively low levels of usage. Given the priority given to crop technology and the apparent increase in land coming under cultivation, it remains surprising that water augmenting technologies do not have higher returns.
75 In livestock rearing, the problem appears to be insecure input supply. Although the sale of livestock products is less dependant on local demand, there is a requirement for secure sources of fodder, water and veterinary support and, especially in the case of poultry IGAs, technical support to reduce the risks of disease.
76 Summary – The analysis shows that some of the smaller, private IGAs are viable. However, this fact does not mean that these enterprises will be viable in all villages and, therefore, can be promoted with consideration of local markets. In those (many) cases, where demand is only sufficient to make a single local unit profitable, additional units will result in all units becoming unprofitable.4/
77 The larger IGAs have not been so successful and also require careful analysis before being actively promoted buy the project. Further investigation of the low returns to irrigation pumps is required to explore the institutional arrangements around operations and to ensure that demand has not met by other project related activities.
4/ The CBA team provided training to project staff on the use of the methodology to analyse the financial
viability of individual enterprises

Financial Analysis
20
DFID / India: Western India Rainfed Farming Project / Final Report / October 2005
Table 5: Income Generating Activities: Summary of Key Financial Indicators
IGA Activity IGA Financing Plan Cash Flow (before finance) Finance Net Return to Labour Financial
returns Status Equity Loan Total Income Expend Cash Charge Cash P/Days Return (FIRR) Rs’000 Rs’000 Rs’000 Rs’000 No/Yr Rs/day %
Service Electric Motor Repairs Individual 4.0 3.0 7.0 12.7 6.8 5.9 1.7 4.2 60 70 8% Grocery Shop Individual 1.5 3.0 4.5 23.3 14.0 9.3 3.1 6.2 120 52 17% Irrigation Pump (A) Individual 12.0 4.0 16.0 9.0 3.0 6.0 2.5 3.5 50 70 2% Sewing Machine Individual 0.7 2.5 3.2 8.0 1.3 6.7 2.7 4.0 80 50 18% Tailoring Individual 1.2 2.0 3.2 4.1 1.1 3.0 1.3 1.7 69 25 8% Vegetable Marketing Individual 1.5 3.5 5.0 18.7 14.6 4.1 1.6 2.5 108 23 8% Livestock Production Buffalo Rearing Individual 1.0 5.0 6.0 10.8 6.4 4.4 3.2 1.2 60 20 6% Goat Rearing Individual 1.0 1.0 2.0 1.4 0.1 1.3 0.6 0.7 60 12 9% Poultry Production Individual 0.1 0.9 1.0 6.5 2.2 4.3 1.1 3.2 60 53 13% Crop Production Irrigation Pump (B) Group 2.0 20.0 22.0 9.3 5.0 4.3 7.3 ( 3.0) N/A N/A 0% Irrigation Pump (C) Group 3.0 25.0 28.0 6.0 2.0 4.0 7.1 ( 3.1) N/A N/A 0% Service Flour Mill Private 16.5 20.0 36.5 127.2 98.2 29.0 8.2 20.8 240 87 7% Source: Cost Benefit Analysis (CBA) Study Estimates Jan 2005. FIRR = Financial Internal Rate of Return.
N/A = Not analysed, Jankar allowance covered under expenditure.

Financial Analysis
21
DFID / India: Western India Rainfed Farming Project / Final Report / October 2005
C.10 On-farm Returns
78 The crop, livestock and on-farm forestry benefits are due to a range of project investments in WRD, SWC, crop technology, livestock development, and so on. The CBA study uses the findings of the 2003 Net Household Income study (NHIS) which was conducted in both Phase I and Phase II villages to estimate the returns to on-farm activities.5/
79 The NHIS estimated the incremental income from both crops and livestock activities in a limited number of villages, broken down into four “well-being classes”, viz. Very poor, Poor, Moderate and Better off (Table 6). The overall incremental benefit was about Rs 5,500 per household per year, with “very poor” households benefit by roughly 50 percent of the overall average and “better off” households gaining nearly twice the overall average. Surprisingly, the overall incremental benefits to all Phase II villages was about 50 percent of those estimated in Phase I villages (Rs 10,100 per household per year). The reasons for this are unclear and may be due to the very small Phase I sample. More likely, the difference is due to the substantially poorer and more remote villages selected for Phase II of the project. However, there may also be a learning effect whereby, over time, farmers have increased the flow of benefits from project investments and new crop technologies.
80 The overall pattern of incremental increases differs across sample villages, with the main difference being in the Rajasthan villages (Rs 2,565 per household per annum), where the overall incremental income is less than 40 percent of the incremental income in the villages in Gujurat (Rs 6,475 per household per annum) and MP (Rs 6,796 per household per year). The main reason for this is that the sizeable better–off group in the Rajasthan sample gained very little – in fact, less than the very poor group - from project activities. Given the small, albeit randomly selected, sample used by NHIS, care should be exercised in interpreting the results, especially at a disaggregated level.
81 The crops returns from the NHIS suggest relatively high financial returns. The overall average of Rs 5,500 per household per year is equivalent of about 140 days of labour per household per year (at a wage rate of Rs 40 per day). Clearly, in general, better-off farmers gained proportionally more due to their larger land holdings.
82 As well as crop benefits, the NHIS estimated the net incremental income from livestock activities to be Rs 2,000 per household per annum (Table 7). This represents an additional 40 percent of the returns from crop investments. Again, the better off gained most – 165 percent of the overall average, while the very poor only gained 65 percent of the overall average.
83 There was less difference between districts than for crop-related increases, although, again, because of the sample size, the pattern across well-being classes and districts was not always consistent. However, since there is some evidence of a specialisation, with low crop increments being associated with high livestock returns, the overall aggregated net returns from all on-farm related activities will be more robust than individual results. For example, in Morena district, although the
5/ IFFDC supported villages were not included in this study.
Financial Analysis
22
DFID / India: Western India Rainfed Farming Project / Final Report / October 2005
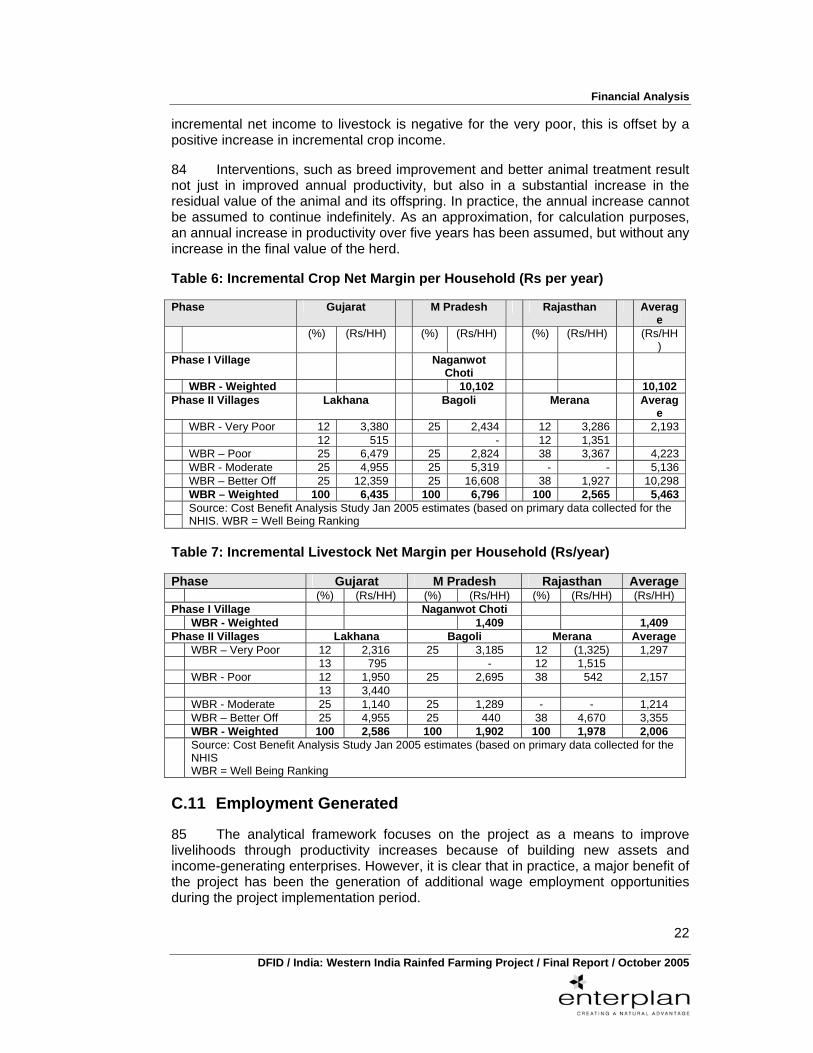
incremental net income to livestock is negative for the very poor, this is offset by a positive increase in incremental crop income.
84 Interventions, such as breed improvement and better animal treatment result not just in improved annual productivity, but also in a substantial increase in the residual value of the animal and its offspring. In practice, the annual increase cannot be assumed to continue indefinitely. As an approximation, for calculation purposes, an annual increase in productivity over five years has been assumed, but without any increase in the final value of the herd.
Table 6: Incremental Crop Net Margin per Household (Rs per year)
Phase Gujarat M Pradesh Rajasthan Average
(%) (Rs/HH) (%) (Rs/HH) (%) (Rs/HH) (Rs/HH)
Phase I Village Naganwot Choti
WBR - Weighted 10,102 10,102 Phase II Villages Lakhana Bagoli Merana Averag
e WBR - Very Poor 12 3,380 25 2,434 12 3,286 2,193 12 515 - 12 1,351 WBR – Poor 25 6,479 25 2,824 38 3,367 4,223 WBR - Moderate 25 4,955 25 5,319 - - 5,136 WBR – Better Off 25 12,359 25 16,608 38 1,927 10,298 WBR – Weighted 100 6,435 100 6,796 100 2,565 5,463
Source: Cost Benefit Analysis Study Jan 2005 estimates (based on primary data collected for the NHIS. WBR = Well Being Ranking
Table 7: Incremental Livestock Net Margin per Household (Rs/year)
Phase Gujarat M Pradesh Rajasthan Average (%) (Rs/HH) (%) (Rs/HH) (%) (Rs/HH) (Rs/HH) Phase I Village Naganwot Choti WBR - Weighted 1,409 1,409 Phase II Villages Lakhana Bagoli Merana Average WBR – Very Poor 12 2,316 25 3,185 12 (1,325) 1,297 13 795 - 12 1,515 WBR - Poor 12 1,950 25 2,695 38 542 2,157 13 3,440 WBR - Moderate 25 1,140 25 1,289 - - 1,214 WBR – Better Off 25 4,955 25 440 38 4,670 3,355 WBR - Weighted 100 2,586 100 1,902 100 1,978 2,006 Source: Cost Benefit Analysis Study Jan 2005 estimates (based on primary data collected for the
NHIS WBR = Well Being Ranking
C.11 Employment Generated
85 The analytical framework focuses on the project as a means to improve livelihoods through productivity increases because of building new assets and income-generating enterprises. However, it is clear that in practice, a major benefit of the project has been the generation of additional wage employment opportunities during the project implementation period.

Financial Analysis
23
DFID / India: Western India Rainfed Farming Project / Final Report / October 2005
86 The employment generation, in terms of household income and person days of work, created in the four sample villages during the assumed five year implementation period was calculated (Table 8).6/ This suggests that a typical household has benefited by an average annual increase in income from wage labour from SWC and WRD development activities ranging from a low of Rs 1,700 to a high of Rs 5,800.
87 This represents an average of between 43 person days and 145 person days of employment per household per year, most of which will have been available in the rabi season when alternative income sources necessitate migration.
88 The importance of wage employment was supported by the social investigation, where it was clear that for many people the main benefit of the project was the wage employment from project works. With the tapering of employment related project activities, the assumption was that migration would increase.
Table 8: Employment Generation of Four Villages
Agency GVT IFFDC State Gujarat M Pradesh Rajasthan Rajasthan Office Dahod Jhabua Banswara Pratapgarh Sample Village \1 Jadha Kadwapada Gara Moti Kheri Administration Costs Subtotal 2,480.0 1,625.4 1,591.5 2,366.7 Development Costs Component A SWC 3,003.4 531.1 2,482.6 645.1 WRD 2,778.8 515.6 2,471.4 2,745.2 All Other Activities 1,601.9 1,296.0 947.0 1,551.9 Subtotal 7,384.1 2,342.7 5,901.0 4,942.2 Total Costs 9,864.1 3,968.1 7,492.5 7,308.9 Employment Generation Wages -SWC \2 2,402.7 424.9 1,986.1 516.1 Wages – WRD \3 1,667.3 309.4 1,482.8 1,647.1 Total Wage Costs 4,070.0 734.3 3,468.9 2,163.2 Household Employment HHs / Village (No) 363 86 120 112 Income / HH / Year \4 2,242.4 1,707.7 5,781.5 3,862.9 Days / HH / Year \5 56 43 145 97 Source: Cost Benefit Analysis Study Jan 2005. 1\ Villages selected for in-depth social analysis. 2\ SWC wage labour estimated at 80 percent. 3\ WRD wage labour estimated at 60 percent. 4\ Average period of construction estimated at five years. 5\ Average daily wage rate estimated at Rs 40 per day GVT = Gramin Vikas Trust, IFFDC = Indian Farm Forestry Development Cooperative. PPGF = Participatory Planning and Group Formation, VOD = Village Organisation and Development, SWC = Soil and Water Conservation, WRD = Water Resource Development
6/ See Annex 8 for details

Financial Analysis
24
DFID / India: Western India Rainfed Farming Project / Final Report / October 2005
C.12 Conclusions
89 The financial analysis is critical to understanding the incentives for key stakeholders to participate and to continue to participate post-project. Where activities are not financially viable (i.e. activities which are a cost rather than a benefit) to stakeholders, it is highly unlikely that activities will be sustained.
90 The analysis, therefore, suggests that the bulk of the sustainable project benefits are due to on-farm activities. The NHIS results show substantial returns for both crops and livestock investments. For all farmers this will have resulted in increased production, better nutrition and reduced out-migration.
91 Wage employment from project works was for many, if not most, people the main project benefit. Access to wage employment was through membership of the SHG. However, wage employment only provides benefits in a limited number of years during the life of the project.
92 Although some IGAs are clearly viable, especially when considered as supplementary income, most require further subsidies to ensure viability. This is not altogether surprising given local purchasing power. However, the low returns to specific enterprises raise doubts as to whether the associated jankars will continue as viable agents supporting project activities into the future.
93 The viability of the SHGs is of even greater concern since they already hold considerable assets in cash and equipment. The continued functioning of these community groups is not certain; they are still heavily dependant on project inputs including support from group jankars, who receive a project honarium. Although some groups will maintain a sense of purpose beyond project activities, for others, the motivation to continue participation will wane after the project finishes and project promoted wage-labour activities finish.
94 The exit strategy for the programme is critical to both the continuation of the programmes and, where programmes cease, the distribution of private and group assets. In the case of IFFDC supported villages, the future of SHGs appears more secure under the umbrella of the cooperative movement and with the benefit of more focused group development during the project. GVT-supported villages have less certain future, as result of less attention being paid to developing SHG management and accounting systems.
95 The nature of project design, with village-level planning and group-level implementation, has limited the scope for the project to promote autonomous community empowerment. This is despite the obviously good relationships which have been built up between project staff in both implementing agencies and villagers. As result the sustainability of project interventions remains uncertain and in some cases unlikely, without further external inputs.
DFID / India: Western India Rainfed Farming Project / Final Report / October 2005
Economic Analysis
3

Economic Analysis
25
DFID / India: Western India Rainfed Farming Project / Final Report / October 2005
Economic Analysis
3
C.13 Introduction
96 The economic analysis, differs from financial analysis, in that it considers project activities from the perspective of society as whole, by considering whether benefits to society as whole, rather than to specific stakeholders. The financial prices used for the financial analysis are the prices actually paid, in the market, by stakeholders. The economic analysis includes the same costs and benefits, but adjusts the prices to reflect their real or economic values. This is done by adjusting inputs and outputs to:
• remove taxes, subsidies and any other distortions to market prices which are regarded as transfers between sections of society rather than as overall benefits, and,
• value “unemployed and underemployed” resources, such as unskilled labour, in terms of its the contribution to increased productivity (i.e. its opportunity cost to society) rather than at the financial or market wage.
97 The first part of this section (C.10) sets out the assumptions used to convert financial to economic values, followed (C.11) by a description of the methodology and an analysis of the results for each type of incremental benefit. The next section (C.12), brings together incremental benefits and costs to estimate village returns and the overall economic returns and, finally (C.13), the effects of changes in the underlying assumptions analysed.
C.14 Economic Parameters
98 The following economic parameters have been used in the analysis:
• an analysis period of twenty years for costs and benefits;
• the Standard Conversion Factor (SCF)1/ for India of 0.9 was applied to allow for market and exchange rate distortions and to covert all cost and benefits to a common numeraire (viz. border equivalent Rupees); and
• an opportunity cost of capital (OCC)2/ of 12 percent has been used, where necessary, to estimate the present value of both costs and benefits.
1/ A conversion factor (CF) is used by economists to calculate the true economic value of resources by
adjusting market prices to remove the effects of transfers (taxes and subsides) and other market distortions. The SCF is used for all resources for which resource-specific conversion factors are not available to ensure that all resources are valued on the same basis. The SCF used is a standard figure prepared by the World Bank, based on sector work by the Bank and Government agencies.

Economic Analysis
26
DFID / India: Western India Rainfed Farming Project / Final Report / October 2005
99 Economic wage rate – Unskilled labour is a major element of both project investment costs and farm incomes and, for financial purposes, the project uses government-set wage rates for unskilled labour. However, clearly, in the project area, characterised by out migration, labour is both structurally and seasonally unemployed and underemployed. As a result, neither the government fixed rate nor the market wage rate will reflect the opportunity cost (i.e. the true cost to society) of employment generated by the project.
100 We would expect the economic wage rate to be lower than the financial wage rate because of:
• evidence of out-migration assumes the existence of both unemployed and underemployed unskilled labour;
• reports that out-migration has dropped during the project period as a result of work generated by the project;
• evidence that people have been happy receiving 50 percent or 75 percent of the government rate since this is, effectively, the implication of the voluntary labour contribution;
• data on agricultural market wage rates vary by season from Rs40-Rs60 in Kharif to Rs20- Rs40 in Rabi. A weighted average of the days worked suggests an average annual figure of about Rs45 or 75 percent of the Government fixed rate of Rs60 per day.
101 This conclusion is supported by evidence from the social and institutional case studies and field staff that, for most people, wage employment has been significantly more important to them than the investment in assets.
102 However, in the absence of full scale study of the labour market both locally and elsewhere, it is not possible to determine a true economic wage rate. A more accurate assessment of the true value of labour will be available following the migration study scheduled for 2005.
103 On the basis of the above arguments we have assumed an economic wage rate of 75 percent of the official wage rate which has been applied to the costs of the SWC and WRD. Actual seasonal market rates were used for the incremental benefit models. For the livestock analysis, a wage rate of Rs25 per day was assumed, reflecting the lower opportunity cost of labour used on many livestock activities.
2/ The Opportunity cost of capital (OCC) is estimated by the National Planning Commission and the World Bank,
The simplest way to regard the OCC is as the rate at which a country borrows money on the international markets. However, since countries have other ways of raising capital (through tax, for example), a more useful way is to see the OCC as the rate of interest which allocates all the government budget while ensuring that only investments with the highest returns are included. The effect of applying the OCC rate is to set a “time preference rate” which gives preference (higher values) to earlier benefits over later benefits. Since poor people tend to have higher time preference rates than wealthier people (who can afford to wait longer for returns), there is an argument for using a higher OCC in poorer areas such as those found in WIRFP villages. However, for pragmatic reasons, the standard OCC of 12 percent is used for all projects in India since it allows comparisons to be made between projects.

Economic Analysis
27
DFID / India: Western India Rainfed Farming Project / Final Report / October 2005
C.15 Economic Project Costs 104 Project costs were converted from financial to economic values using the SCF of 0.9. The major component of all project activities and, therefore, costs is labour, which was adjusted using the economic wage rate. Other construction materials, such as cement, which although subject to market restrictions in India account for only a small proportion of costs and, therefore, no further adjustments have been made.
C.16 Incremental Crop and Livestock Benefits3/ 105 Economic incremental crop and livestock benefits were estimated using the results of the Net Household Income Study (NHIS) discussed earlier. However, since the NHIS sample was small and not drawn from the CBA sample villages, the results of the NHIS are more applicable at a district or project level than at an individual village level. Further, since WDR, SWC and crop technology activities all result in crop increases, it is not possible to separate out the returns to each activity (Figure 3).
Figure 3: Link between NHIS (district level) and CBA Study (village level)
106 The individual household results from the NHIS for each “well-being” class have been applied to the proportion of households in each well-being class in each of the sample village. The implicit assumption captured here is that well-being classes will have different incremental net margins because of larger farm sizes, greater access to assets and less exposure to risk.
107 Benefits and costs are, therefore, related in terms of the number of households in each village rather than the more usual method of linking areas treated. This ensures that the synergies between the different interventions are
3/ See Annex 10 for details.
N Inc WBC
BO
M
P
VP
N Inc WBC
BO
M
P
VP
Inc AftBef
BO
M
P
VP
Inc AftBef
BO
M
P
VP
District
Village
SWC
Crops
WRD
Non crop
NHIS

Economic Analysis
28
DFID / India: Western India Rainfed Farming Project / Final Report / October 2005
captured in the analysis and avoids the problem of overlapping areas with its associated data problems.4/
108 Incremental crop and livestock net margins for the CBA study reflect the underlying variability of the NHIS. This shows substantially lower margins in Rajasthan compared to the other two states. Since the main reason for this variability relates to the lower returns to one of the disaggregated categories, the better-off in one village, the CBA used the overall average net margins weighted by WBR.
109 The increases in economic household income are based on increases in crop and livestock productivity. The economic value of these crops and livestock products were derived by adjusting market prices by the SCF.
110 Given that migration is key policy issue for the region and the project, there is an argument that the economic analysis should be prepared from the perspective of the sub-region rather than the nation as whole. This argument is supported by the policy of preserving a way of life – and a tribal culture - in these regions rather than maximising economic returns within India as whole. If this argument was accepted, then economic parity prices would need to estimated for crops and livestock products.
C.17 Forestry Benefits on State or Communal Land5/ 111 The forestry investment programmes includes the promotion of existing and the establishment of new, joint forestry management (JFM) schemes on common property resource land, in association with the forestry department. Other initiatives comprise the purchase and distribution of young fruit tree seedlings in association with the establishment of a village nursery programme using both grafting and budding skills. The average investment costs, in the forestry programme, account for four percent respectively of both GVT and IFFDC development activity expenditure.
112 The quantified benefits of the forestry programme are measured in terms of the potential incremental household net margin derived from primarily fruit production to obtain a positive return. For the sample villages, this net margin ranged from Rs 200 to 600 per household and falls within the levels identified in the NHIS. No significant expenditure was identified for JFM development in the sample villages.
C.18 Incremental Benefits from IGAs6/ 113 Individual IGAs appear attractive but very limited in scope for replication, because of the limited market for such goods and services. However group IGAs are generally less financially viable. Loan repayment terms (monthly interest rate, capital grace periods, the period for capital repayment, and so on) remain ill defined. Individual IGAs can justify an interest rate of two percent per month (24 percent per year) but repayment of principle is more problematic owing to the seasonality of crop production and migration income.
4/ A framework to validate this approach - using area measurements - in the selected sample of four core
villages is set out in Appendix 1. 5/ See Annex 10 for details 6/ See Annex 10 for details

Economic Analysis
29
DFID / India: Western India Rainfed Farming Project / Final Report / October 2005
114 Potential interest income is assessed on the percentage of individual / group deposits held by the individual SHG / village that it is onlent for IGAs to individual members of an SHG. Interest income charges are highly variable between SHGs and are reported to vary from 12 percent to 24 percent per year (equivalent to one percent to two percent per month) with penalties applied for non-payment. In quantifying the benefits, namely the interest income derived from the volume of deposits onlent to members, use has been made of both field verification data and implementing agency SHG records.
C.19 Drudgery Reduction Benefits7/ 115 Quantified benefits, resulting from drudgery reduction for household activities (ball bearings, access to water and so on), are measured as hours / days savings per household / village valued at the economic shadow wage rate. This assumes that such time saved will be gainfully employed in alternative productive activities.
116 Potential productive drudgery reduction benefits per household are assessed at an average of one hour per day per household for 200 days per year assuming an average eight hour day (the equivalent of 25 days per year per household) valued at an economic wage rate of Rs 25 per day to reflect the assumption that only 50 percent of the time saved will be devoted to economically productive activities.
117 These assumptions have little effect on the overall returns. Nonetheless, they have been applied to all villages through the 20-year analysis period even though it appears that in most villages provision for replacing the drudgery reduction items has not been made.
C.20 Migration Labour Support Programme (MSLP)8/ 118 The quantified benefits of the MLSP programme are measured in terms of the potential incremental household income from migration labour. These benefits result from the incremental household income derived from migration labour, for both the ‘before’ and ‘after’ project situation and are based on estimates of:
• the average increase in the daily wage rate secured, • the increase in the average number of days of work obtained, and • the number of households, within the village, engaged in migration labour. 119 These initial estimates are set at levels to obtain a positive contribution to returns. They are based on limited discussions during the field verification process and will need to be further adjusted as a result of the ongoing migration survey and when projected investment expenditure is more clearly identified.
C.21 Project Returns and Analysis 120 The economic costs and incremental benefits were prepared for each sample village (Annex 12) and then aggregated to give an overall rate of return for the whole project (Annex 13). The overall incremental benefits include the increases in:
7/ See Annex 10 for details 8/ See Annex 10 for details

Economic Analysis
30
DFID / India: Western India Rainfed Farming Project / Final Report / October 2005
• On-farm crop and tree productivity caused by three project activities: viz. WRD, SWC and crop technology (new varieties and practices);
• Livestock production arising from new breeds, the increased availability of fodder, water and veterinary services;
• Forestry production on common or state land which is the result of new management arrangements which permit and encourage investment and protection;
• Income from successful IGA operations, which accrues to the SHGs;9/
• Drudgery reduction interventions in terms of time saved; and
• Additional employment and higher wages because of the migration labour support programme.
121 As well as these direct benefits, improved productivity and increases incomes will have indirect benefits in terms of health and general well being. Some of these benefits are captured in the overall returns, but direct measurement of such indirect benefits would require a separate study.
122 The estimated overall economic returns10/ based on the 20 sample villages, over a period of 20 years and using the assumptions outlined in this report, is 10 percent. Although this is less than the 12 percent opportunity costs of capital used for projects in India, this is a surprisingly high and commendable result given the exceedingly poor resource base and the targeted selection of the poorest and most inaccessible villages within the area.
123 Of the twenty sample villages, only six villages (Gujarat 2, Madhya Pradesh 2 and Rajasthan 2) achieved returns in excess of the 12 percent OCC (Table 9).
9/ The income accruing to the lender (SHG) is a proxy for the overall returns to all individual borrowers. 10/ As measured by the Economic internal rate of return (EIRR)

Economic Analysis
31
DFID / India: Western India Rainfed Farming Project / Final Report / October 2005
Table 9: Cost Benefit Analysis – Individual Village Results
Implementing Agency HHs Economic Costs Cost Benefit Analysis District / State Admin Dev Total NPV EIRR Villag
e Sample Village (No) (Rs M) (Rs M) (%) (No)
\1 Gramin Vikas Trust (GVT) Dahod – Gujarat 2.3 2.2 2.5 6.5 23% 2 1 Jadha 363 2.3 5.3 7.6 4.4 28% * 2 Kasotia 193 2.3 2.3 4.6 2.3 27% * 3 Poyali 120 2.3 2.9 5.2 (0.2) 11% Jhabua - M Pradesh 1.5 1.5 3.0 (3.9) 6% 2 1 Bagoli 86 1.5 2.9 4.4 (1.4) 3% 2 Borwa 36 1.5 1.0 2.5 (0.5) 5% 3 Chamjar 79 1.5 2.7 4.2 (1.9) N/A 4 Chenpura 160 1.5 2.9 4.4 1.0 18% * 5 Kadwapada 86 1.5 1.9 3.4 0.2 14% * 6 Padabanda 37 1.5 2.1 3.6 (1.6) N/A Banswara - Rajasthan 1.5 1.9 3.4 1.5 15% 2 1 Bakaner 90 1.5 2.6 4.1 (0.9) 4% 2 Bhuripada 160 1.5 2.8 4.3 0 3 14% * 3 Gara 120 1,5 4.2 5.7 (0.6) 4% 4 Merana 147 1,5 1.8 3.3 2.9 32% * 5 Sundripada 80 1.5 2.2 3.7 (0.1) 11% Indian Farm Forestry Development Cooperative (IFFDC) Pratapgarh – Rajastan 2.2 1.4 3.6 (8.8) -1% 0 1 Chhayan 60 2.2 2.7 4.9 (2.4) N/A 2 Chhota Mayanga 49 2.2 1.7 3.9 (1.6) N/A 3 Dharis Kheri 80 2.2 1.7 3.9 (1.1) 1% 4 Kachotia 108 2.2 2.2 4.4 (0.5) 8% 5 Moti Kheri 112 2.2 3.6 5.8 (1.5) 2% 6 S Ka Khera 42 2.2 1.5 3.7 (1.5) N/A Overall Cost Benefit (4.6) 10% 6 Source: Cost Benefit Analysis Study, Jan 2005. \1 Number of individual villages achieving an EIRR in excess of 12 percent (the opportunity cost
of capital for rural development projects in India) EIRR = Economic Internal Rate of Return, NPV = Net Present Value at 12% interest
HHs = Participating households per sample village, N/A = Not analysed as EIRR negative. C.22 Sustainability of Benefit Assumptions 124 Incremental benefits are expected to continue well after project funding has ceased. The base assumption is that benefits will be sustained at final levels for a period of 20 years. The base returns are not very sensitive to extensions in the benefit period: if benefits were sustained for 25 years, the economic returns would only rise to 12 percent, while a further extension to 30 years would leave the economic returns unaltered at 12 percent (Table 9).
125 However, the returns are very sensitive to a shortening of the benefit flow period. If benefits were only sustainable for 12 years, the economic returns would fall to zero and the net worth of the project investments would show a very substantial loss of Rs – 17.6 million.
126 Given the earlier discussion about the institutional arrangements and the provisions for funding replacement assets, the danger of benefits not being sustained

Economic Analysis
32
DFID / India: Western India Rainfed Farming Project / Final Report / October 2005
for this length of time is of great concern. As the financial analysis shows many of the IGAs cannot physically last this length of time without replacement. Further, the livestock benefits are dependant on veterinary support. The switch in crop technology, especially where it is not dependant on group managed water sources are more likely to be irreversible and sustainable.
Table 10: Effect of Changes in Assumption about Period of Analysis
20 Years 12 Years 25 Years 30 Years Base case Overall Sample EIRR (%) 10% 0% 12% 12% Change from Base Case (%) - -10% +2% +2% Overall Sample NVP (Rs M) (4.6) (17.6) (0.8) 1.3 Change from Base Case (Rs M) - (13.0) 3.8 5.9 Number of Villages (No) 6 3 7 8 Change from Base Case (No) - -3 +1 +2
C.23 Changes in Cost and Benefit Assumptions 127 The usual sensitivity analyses was carried out, looking at the effect on overall returns of a 20 percent change in both costs and benefits (Table 11):
• Increase in crop benefits (Test 1) – Assumptions about incremental benefits are critical to the estimation of overall returns, especially given that crop development costs represent 70 percent of all development costs. A 20 percent increase in the base assumption would increase the net worth (12 percent. 20 years) to Rs + 5.2 million and the associated economic return would arise to 14 percent. A further three villages, bringing the total to nine villages would achieve a positive rate or return. Such an increase in crop benefits is possible since it would still represent a smaller incremental increase than was assumed, in the NHIS, for phase I villages.
• Increase in livestock benefits (Test 2) – Incremental livestock benefits are substantial in all villages due to the relatively low development costs (five percent of the total development costs). A 20 percent increase in incremental livestock benefits, would increase the net worth to Rs -0.9 million and raise the associated economic returns to 12 percent. One more village would achieve an economic return greater than 12 percent.
• Reduced administration costs (Test 3) – Overheads costs were allocated in proportion to development costs and may have overstated overheads costs with respect to component ”A”. A 20 percent reduction in overhead costs would increase the net worth to zero and the associated economic returns to 12 percent. Twelve out of the 20 sample villages would have economic returns greater than 12 percent.
• Increased recurrent costs (Test 4) – In the absence of business plans or arrangements, the assumptions about recurrent costs were based on percentages of investment costs. Further, even if the requirement was

Economic Analysis
33
DFID / India: Western India Rainfed Farming Project / Final Report / October 2005
known, there is no village funding source11/ to provide these costs post-project. As result there is a possibility that recurrent costs are under-estimated. A 20 percent increase in recurrent costs would result in a negative net worth of Rs – 9.5 million and an associated economic return of eight percent. Only six of the sample villages would have economic returns above 12 percent.
Table 11: Effect of Changes to Cost and Benefit Assumptions
Test 1 Household
crop net margins
Test 2 Household livestock
net margins
Test 3 Admin Costs
Test 4 Recurrent
costs
increased by 20%
Increased by 20%
reduced by 20%
increased by 20%
Overall Sample EIRR (%) 14% 12% 12% 8% Change from Base Case (%) +6% +4% +2% -2% Overall Sample NVP (Rs M) 5.2 (0.9) (0.1) (9.5) Change from Base Case (Rs M) 9.8 3.7 3.5 (4.9) Number of Villages with positive economic returns (No)
9 7 7 6
Change from Base Case (No) +3 +1 +1 - Source: Cost Benefit Analysis Study, Jan 2005. \1 Number of villages achieving an economic internal rate of return (EIRR) greater than 12 percent
(taken as the opportunity cost of capital for rural development projects in India). EIRR = Economic Internal Rate of Return, NPV = Net Present Value at 12% interest rate.
C.24 Incremental Household Crop net Margins. 128 Only six of the 20 sample villages achieved economic returns in excess of 12 percent, using the base case assumptions for incremental household net crop margin. After weighting for WBR, this ranged from a low of Rs 2,880 to a high of Rs 7,060 per household (Annex 12).
129 Given the significance of the net incremental household income to the overall returns, we calculated the breakeven increment required to achieve an economic return of 12 percent. These ranged from a low of Rs 7,230 to a high of Rs 12,700 suggesting that incremental incomes would have to roughly double in the remaining 12 sample villages – to achieve an economic return of 12 percent.
130 A comparison of the results of the Phase I and Phase II villages in the Net incremental income study shows that Phase II villages had significantly lower (30 percent to 50 percent) incremental incomes than Phase I villages. This may reflect the small sample used for Phase I villages, but could also reflect a learning process in phase I villages whereby new technologies and methods have resulted in subsequent productivity growth. If a similar learning curve applied in Phase II villages, the base assumptions used in the analysis would underestimate final incremental benefits.
11/ Alternative funding sources, from user contributions or other government sources may be possible after
the end of the project. However, as demonstrated by project investments in rehabilitating previously constructed infrastructure, there is little historical evidence of locally generated funds being found for recurrent costs.

Economic Analysis
34
DFID / India: Western India Rainfed Farming Project / Final Report / October 2005
131 Using the Phase I incremental income levels, a further nine villages (giving a total of 15 villages) would achieve an economic return of 12 percent. The remaining five villages would require incremental income levels significantly above the phase I sample.
C.25 Conclusions 132 The main component of the project has achieved surprisingly high economic returns of 10 percent especially given the physical and economic condition of the project area. However, the base estimate depends most critically on the estimates returns being sustained well into the future.
133 In the following section, we consider an analysis of the institutional and social arrangements, which determine the sustainability of project outcomes.

DFID / India: Western India Rainfed Farming Project / Final Report / October 2005
Social and Institutional Factors
4

Social and Institutional Factors
35
DFID / India: Western Rainfed Farming Project / Final Report / October 2005
Social and Institutional Factors
4
C.26 Introduction
134 The realisation of estimated economic returns depends not just on relationship between returns and costs but also crucially on social, institutional, and managerial factors.
135 The CBA team studied a sub-sample of four purposively selected villages in order to better understand the project processes and the social conditions within which the project operated. The villages chosen for in-depth study were:
• Jada village, Dahod district of Gujurat (Annex 4) • Kawadapada village, Jhabua district, Madhya Pradesh (Annex 5) • Gara village, Banswara district, Rajasthan (Annex 6) • Moti Kheri village, Pratapgarh District, Rajasthan (Annex 7) 136 In this section, we bring together some of the themes from these case study villages. Firstly, we discuss the issue of benefit distribution and then we examine some of the key institutional and managerial factors, which contribute to the degree of confidence, which can be placed on the economic analysis.
C.27 Distribution of Benefits
137 Village selection – Prior to project start-up, the procedures and criteria for village selection were clearly rigorously followed, based on knowledge of the area and experience from Phase I. As a result, the GVT supported villages are without exception some of the poorest and least accessible villages in the area. Livelihood strategies, pre-project, included both head-loading and out-migration both characteristics of areas which have not been affected by India’s recent overall growth. As a result, implementation has been more difficult than it would have been in better off villages with greater access to markets. The overall economic returns are impressive when interpreted in this context.
138 IFFDC, who were not been involved in the Phase I programme, started activities one year later than GVT. Although the IFFDC villages are also poor, by any standard, they tend to be more accessible than the GVT villages. This, together with IFFDC’s approach to institution building, suggests that there is a greater chance of post-project sustainability.
139 Participation inclusiveness – Generally, all households in the falia join the SHG and participate in the programme. However, there are exceptions, with either individuals or falias who have been excluded. SHGs who were unable to form before the programme budgets were finalised have sometimes found it difficult to join at a later stage. There has also been some cases on initial suspicion of the programme – sometimes as result of previous experiences and sometimes a fear that the

Social and Institutional Factors
36
DFID / India: Western Rainfed Farming Project / Final Report / October 2005
programme was the “front end” for proselytising campaigns by either Christian or Hindu groups. In one case, there was competition from SHGs which had been formed by a church group which had similar programmes.
140 Nature of programme – The choice of activities supported under the programme has a major impact on the distribution of benefits. Benefits from the programme include:
• employment generation; • asset restoration; • entrepreneurial options and • institution building.
141 For most people, the main benefit has come from employment generation. People are generally happy to work for the wage rates provided. There was some reports that broken SWC bunding would not be repaired without project support suggesting that for many wage employment was more important than asset building.
142 The IGAs are dependent on identification of entrepreneurs, most of which will the younger and better educated. Little employment is generated from these enterprises compared to other activities.
143 Increased agricultural productivity, as result of the increased availability of water, will also generate additional employment for land preparation and harvesting.
144 Another aspect of the distribution of benefits occurs where public works give rise to private benefits. The project expects labour contributions of 25 percent for work carried out on public land and 50 percent for work carried out on private land. These rates are accepted as “offers of employment” – work on public land is preferred but less available than work on private land. In some cases, work will be undertaken on everyone’s land – so that over time everyone gains from enhanced productive assets. In other cases, clearly programme activities produce private gains for specific individuals from both public and private work over and above wage employment.
145 Although the effective wage rate is 50 percent or 75 percent of the government rate, there has been little recognition, and no protest, about this problem. This suggests that the paid wage rates are above expectations and that the unequal (and unfair) asset gains are of limited significance.
146 Summary – The main source of benefit for most people, and especially for the very poorest, has been wage employment from SWC and WRD activities. This conclusion is consistent with the economy of the area. Further, the lack of serious concern about the employment conditions and the apparently favourable advantages some landowners will have gained, all suggest that the primary concern has been wage employment.

Social and Institutional Factors
37
DFID / India: Western Rainfed Farming Project / Final Report / October 2005
C.28 Sustainability of Activities and Benefits
147 The economic analysis assumes that incremental benefits will continue through out the 20-year period of analysis. This assumption rests on a number of factors:
• the viability of the enterprise and, in particular, the provision for replacing assets at the end of their productive life. This assumption is generally valid for the WRD works and, less certainly, for most of the SWC works carried out on private land.
• the institutional arrangements for collective decision-making. As was argued earlier, there are concerns that SHGs will continue as decicion-making bodies or that activity Jankars will be viable in the long run. As a result, we have limited confidence that SWC structures on public land will be maintained or that many of the IGAs will be replaced at the end of their working lives.
148 Summary – The assumed benefit period of 20 years may be overoptimistic for the reasons set out here and in the economic analysis. The programme is currently focusing on an exit strategy, which will leave behind working institutions and viable support arrangements.
149 IFFDC are further ahead with the establishment of federation of cooperatives, which would fit into the wider cooperative movement in India.
150 GVT are proposing a “maha mandal”, but without the umbrella of a movement and the associated systems and networks available to IFFDC.
151 These are important steps although sustainability will be much harder to achieve after project investments than if the issue had been addressed at the time of group formation.
C.29 Institutional and Contractual Agreements
152 A major issue which affects both the distribution of benefits and the sustainability of the programme is the apparent lack of clarity over contractual arrangements throughout the programme. This lack of clarity applies to relationships between the implementing agencies and the communities as well as between the SHGs and individual members.
153 In terms of the relationships between the implementing agencies and community, there are significant differences in approach (although not necessarily in terms of actual personal relationships) between GVT and IFFDC. IFDDC have a much stronger institutional focus in their approach. Nonetheless, because of common project processes, the following observations apply to both agencies:
• GVT/IFFDC and the village – The village was the main institution for developing demand. The PRA and initial planning activities leading to the development of village development plan were undertaken at the village level. However, no village structure was established to oversee and monitor implementation. For implementation, the focus has been on the SHG (Falia).

Social and Institutional Factors
38
DFID / India: Western Rainfed Farming Project / Final Report / October 2005
Effectively this breaks a key “good governance” principle behind community empowerment - to bring together design, planning, implementation, monitoring and evaluation at a single community level in order to make planners and implementers directly responsible for their actions.
• GVT/IFFDC and the SHG – All fund management and procurement has been channelled through the SHG, rather than the village. SHGs are formed around “natural groupings”. These usually relate to a hamlet, a group of small hamlets or part of a large hamlet. Some SHGs are formed around a particular venture or set of activities. The SHGs are encouraged and supported by project staff to implement their part of the village development plan. There is no SHG or falia development plan. There are no SHG accounts which would enable members to track SHG progress or use this information to inform their strategy for decision-making.
154 Although the arrangements may be known to some SHG members, in most cases, this is not sufficient to ensure that the SHG is the “owner” of the activity. A critical test for this is to take responsibility for maintenance and replacement.
155 Another key governance principle – again promoting the sense of empowerment and ownership - is around the concept of “trade-offs, loss and risk”. This prevents the emergence of a bottom-up “wish list” - by more explictedly allocating SHGs a budget - which they can then decide how to allocate and use.
156 In practice, budgets are maintained and accounted for by “specialist” rather than by village or SHG. Once included in the village development plan, an activity is consolidated into a plan and budget and then implemented through an SHG. Although the project starts with a bottom-up participatory approach, control moves to the implementing agencies and is, effectively, driven through the technical divisions of their budgets. This is not to suggest the whole approach is top down; field staff and Jankars play an important role in negotiating and communicating between both project specialists and the community and within the communities.
157 It is important to recognise that many SHGs are functioning well. Clearly, in many cases, as the case studies show, project staff have established strong working relationships with SHGs and their members. In many cases, where there is strong leadership and an incentive to work with the project, the formation of a SHG will allow the group to continue working together and to access other finding sources.
158 However, the same lack of clarity and ambiguity as exists between the project and SHGs can be found in the relationship between the SHGs and the IGA entrepreneur or manager. As was noted in Section II, this is particularly a problem in GVT-supported villages where, in general, less financial discipline has been required of the SHGs and little or no aggregated information or accounts is available at decision-making levels.
159 SHG and IGA manager – Responsibility for management is often shared between the group and the Jankar, with respect to setting of fees, responsibility for repairs, etc. In the GVT supported case study villages, there is little expectation or likelihood of repayment of many assets.

Social and Institutional Factors
39
DFID / India: Western Rainfed Farming Project / Final Report / October 2005
160 SHG and borrower – The terms of the loan are rarely set out clearly in terms of responsibilities, schedules and repayment regimes. In IFFDC supported SHGs repayments regimes have been rigorously maintained.
161 SHG and members (savers) – In several cases, there was evidence of uncertainty as the purpose of the regular savings. Members appear to be unsure about the ownership of the SHG deposits with some treating the “monthly deposits” and “compulsory wage deductions” as entry fees to wage employment. Further, this ambiguity is further evidenced by the lack of concern by members as to some of the decisions made about the SHG.
162 The result of this lack of clarity around relationships and contractual arrangements is that there is a danger that, post-project, some of the (contractual) relationships currently supported by the implementing agencies will be contested and this will allow individuals to default or otherwise capture project assets.
C.30 Sustainability and Viability of the Jankar System
163 An innovative feature of the project, developed during Phase I and emphasised in Phase II, is the use of the jankar system. Jankars are local people either with prior expertise or trained by the project to support project activities. The advantages of the Jankars are threefold - they:
• provide on-the-spot support;
• should provide continuity in the post-project period; and
• cost-effective since they are paid local wages. This also opens up the possibility that the jankar system could be funded from locally generated fees and contributions.
164 The sustainability of the Jankar system is connected to both the sustainability of the SHGs and to the viability of the IGAs. In both cases, there is evidence that many IGAs will not be replaced or repaired and that entrepreneurs cannot afford the costs of support. In the case of the livestock Jankars, where the returns were relatively high, the Jankars will need to compete with Government veterinary staff, which will be difficult without the incentive of free drugs and medicine. Doubts were also raised, by some group members interviewed, over the skill levels of some jankars especially when required to treat valuable assets such as large ruminants.
C.31 Conclusions
165 The institutional and social analysis recognises the positive relationships which have been formed between project staff and local communities especially in poor, marginalised and inaccessible area.
166 The main concerns raised by the institutional analysis relate to the way the project is perceived by both communities and project staff, Some of these issues, relating to the role of the SHG and more widely to project governance, were raised in the earlier section. However, there is still a huge range of different understanding of the project purpose.

Social and Institutional Factors
40
DFID / India: Western Rainfed Farming Project / Final Report / October 2005
167 The sustainability of project institutions varies in significance: in some cases, benefits are largely on-farm and these can be continued with community or external support, while in other cases, sustainability is totally dependent on community institutions and organisation. This, in turn, depends on the sense of ownership and affiliation that members develop towards their SHGs. Although people were generally very positive, the analysis was concerned by the some of the perceptions encountered (such as membership of the SHG as a means to wage employment opportunities) and the practices observed (such as the lack of clarity around loans/IGAs and, in the case of GVT, the lack of summary accounts for each SHG).
DFID / India: Western India Rainfed Farming Project / Final Report / October 2005
Conclusions and Recommendations
5

Conclusion and Recommendations
41
DFID / India: Western Rainfed Farming Project / Final Report / October 2005
Conclusions and Recommendations
5
C.32 Introduction
168 In this final section of the main CBA report, we first set out our overall conclusions by bringing together the financial, economic and institutional analysis and addressing each of the initial questions posed for the CBA study in Section I (paragraph 4). This is followed by a list of specific recommendations which have come out of the analysis. The exercise of undertaking a CBA study throws up new or different perceptions and insights on the project and as a result we have a number of recommendations which are set out for consideration during the remainder of the project period.
C.33 Conclusions
169 Financial returns and sustainability – The first issue for the CBA study to address was to estimate the financial returns and viability of project activities for different stakeholders in order to assess their incentive to continue after the project finishes. This, in turn, partially determines the overall sustainability of the benefit flows.
170 Land owners – The financial returns to farmers were based on the NHIS study, which shown positive returns. An increase in water supply and/or more accessible water sources almost universally results in increased and more regular crop production. Furthermore, since the project pays all the investment costs, the risk to farmers relates largely to increases in their operating costs and any additional risk of crop failure. The additional crop failure risks associated with the new varieties promoted by the project are thought to be low; the new varieties and technologies have been tested in farmer’s fields - under component “C” of the project. However, the institutional arrangements around the management of communal assets, such as anicuts, will determine the maintenance and regularity of the additional water supply on which the increased productivity depends. These, in turn, depend on the SHG or WUA ensuring the strict financial discipline needed to operate, repair and, eventually, to replace these assets. Given the apparent financial benefits (and assuming that the relative returns to migration over local production do not increase substantially), there is likely to be direct pressure from beneficiaries for good asset management. Overall, therefore, the prospects for continued incremental crop benefits from additional water and new varieties and crop technologies are considered reasonably positive – provided the institutional arrangements remain in place. Incremental crop benefits are the major source of the overall economic returns.
171 Livestock owners – The introduction of new breeds always increases the exposure of farmers to disease and risk. Some of these risks are mitigated by the project support to veterinary and other services. However, without a supply of subsidised drugs, the post-project viability of the veterinary jankars is uncertain. Animal production is also heavily dependent on fodder which is in limited supply and

Conclusion and Recommendations
42
DFID / India: Western Rainfed Farming Project / Final Report / October 2005
on a good regular water supply. The prospects for continued increased livelihood production are probably reasonable.
172 Wage labourers – Official and project wage rates are attractive to may people. There is little work available and out migration is still the main alternative source of income for most people. As growth rates continue in India as whole and relative wage rates outside the area increase, the pressure for migration will also increase. Post-project it is unlikely that local employment prospects will improve.
173 Group enterprise jankars – Many of the group managed activities involved larger outlays and showed lower returns. Usually the reason for this was that there was insufficient demand or usage to cover full costs. Prospects for sustained use are limited because of their economic viability and their dependence on the effective continuation of the SHG.
174 IGA borrowers and jankars – These loans tend to be smaller than for the group enterprises and have higher financial returns than for the group enterprises. The prospects for sustained use in the medium term are positive. The main danger is of over supply of the same enterprises into limited markets.
175 SHGs – From a purely financial point of view, many SHGs appear to be potentially both viable and sustainable. However, institutionally, there are concerns about the capacity of SHGs to manage the savings and credit component without continued external support. Further, the role of the SHG differs between implementing agencies - as to whether it is an autonomous agency or merely an instrument through which the project delivers services. Without post-project external support, the prospects for many SHGs is limited.
176 Savers and group members – The security of savings depends on the quality of the SHG’s loan portfolio. On average, about half of the total contribution is on loan and remainder is on deposit. There is no information availability about the quality of the loan portfolio and therefore the extent of the risk to which members are exposed. Members do not seem very concerned – perhaps as a result of the lack of information, but also because the regular payments, voluntary wage contributions and compulsory wage reductions were seen as “entry conditions” to access the wage employment. Nonetheless, many SHGs have large balances for which there are no clear mechanisms to distribute back to members if the SHG was to close. The prospects of SHGs continuing to function as savings and credit programmes are limited – except in the case of IFFDC supported villages – and this raises dangers as regards the disposal and distribution of savings balances, outstanding loans and group assets.
177 Economic returns – The second key question raised at the start of this report, relates to the economic returns to society as whole:
• Investment returns – The EIRR over 20 years was 10 percent which is just less than the 12 percent test rate used for projects in India. However, this is very commendable, given the very poor resource base, and higher than was expected. Bluntly stated, it is difficult to imagine any investments in this area which would have produced high economic returns. A key issue relates to whether the assumptions used in the analysis, especially about the

Conclusion and Recommendations
43
DFID / India: Western Rainfed Farming Project / Final Report / October 2005
sustainability of incremental benefit streams, are valid. The EIRR falls to zero percent if incremental benefits do not extend beyond 12 years.
• Employment generation – The project has generated considerable wage employment opportunities which has temporarily reduced out-migration and allowed some people to reduce their debt while others will not have increased their indebtedness.
178 Another key question, not directly addressed by the CBA study, was an examination of the relative cost of WIRFP compared to other similar programmes undertaken by government and NGOs. In practice, the project uses the same rates as government for development “works” and Jankars are clearly less expensive that fully paid extension officers. Although further analysis is required to determine whether the project promotes more intensive field operations, differences in total costs are likely to relate to the purpose and use of “overhead costs”.
179 As well as producing direct economic benefits, project activities promote better environmental services, in terms of soil and water conservation and improved cropping technologies. These external benefits have not been measured and therefore are not included in the analysis.
180 Effectiveness of the institutional and social arrangements – The most critical social institution to sustain group and community activities after the end of the project and to determine the distribution of project assets and benefits is the SHG. These institutional and social arrangements, not all of which are under the control of the project, determine the overall returns as much as the financial and economic incentives. In particular, the sustainability of activities, including post-project operation and maintenance of the assets created by the project, depends on the continuation of effective institutional arrangements.
181 Clearly, strong personal relationships have been developed between project staff and SHG leaders, members and jankars. This people friendly approach has assisted project implementation at all stages and resulted in positive feedback.
182 However, there are concerns about the capability of the SHGs to sustain project activities in the future. This is evidenced by the lack of “control and ownership” which SHGs exercise over the savings and credit arrangements, where there is both a lack of clarity over the loan and repayment conditions and, in the case of GVT supported SHGs, the absence of village summary accounts, which can be used to determine progress. The reasons for the ambiquity over the role of SHGs relate to the governance arrangements associated with the initial project approach (i.e. the distribution of power and voice between project, village and SHG) and the rigid accounting rules of the implementing agencies.
183 Comparison with other schemes and projects requires further clarification of the conceptual framework for the project. At different times and by different people, the project is seen as:
• an investment in productivity; • public works and employment generation and • a savings and credit programme.

Conclusion and Recommendations
44
DFID / India: Western Rainfed Farming Project / Final Report / October 2005
184 Although these are not mutually exclusive perceptions, overhead expenditure can only be justified in terms of the priority assigned to each of these objectives. Clearly, the relationship between investment in productive assets and employment generation is positively related. However, justification for the development of a savings and credit programme and even the promotion of participatory planning and group formation is not so clearly made - given the role of these institutions in project implementation processes.
185 Many of the cost norms for the project are based on government standards and, therefore, are similar to other projects. However, the financial and institutional arrangements required to ensure the success and continuation of the unique features associated with the project (viz., participation, SHGs and the Jankar system, the link between savings and credit programmes and investments) remain uncertain and in many cases uncertain. Realisation of the surprisingly high estimated economic returns depends critically on the arrangements put in place to secure these benefits in the post project period.
C.34 Recommendations
186 The main recommendations from the CBA study were grouped into three themes:
• SHG savings and credit programme – Some SHGs have relatively large balances and even own valuable (communal) assets. However, despite this there is scant recognition that this is a full grown micro-finance programme in place and therefore that there is a duty of trust towards safeguarding the savings of poor people. Loans are being made without clear terms and repayment schedules. In the case of GVT, there are no SHG level accounts.
• Even if all individual savings could be repaid from balances and outstanding loans, the danger remains that when the project finishes, group funds and group assets will either remain unclaimed or will be grabbed by local elites.
• We recommend that action is taken, largely by GVT to ensure that:
• sound micro-finance principles and standards are adopted everywhere;
• financial discipline is actively promoted, including the preparation of summary accounts for each SHG;
• qgreements between borrowers and SHGs are reviewed to ensure that there are clear repayment terms in place and that borrowers are fully aware of the loan conditions, including responsibility for repairs and replacement and so on;
• workshops are conducted in all villages to inform members of their holdings and of the arrangements to access their shares, and
• procedures are developed, and in place, to be able to close down SHGs, where minimum standards are not possible or where SHGs are unlikely to

Conclusion and Recommendations
45
DFID / India: Western Rainfed Farming Project / Final Report / October 2005
survive post-project, and to make a “fair” distribution of any group balances and/or assets before the end of the project.
• Results-based programming and budgeting – organises the budget and the conceptual framework of the project around the targeted population (i.e. results) rather than around inputs (i.e. traditional line item accounting) or around activities (i.e. disciplines and organisational structures). Currently, a results-based focus sits uncomfortably with the traditional public sector corporation financial management system.
• Budget and expenditure information is maintained at state office level by activity/specialist, but is not consolidated at a village level. This means that management planning and monitoring is activity-focused rather than client focused. The budgets are prepared on the basis of the initial village PRA. However, there is no allocation for a village, no village development plan and no governance mechanism whereby a village would decide or prioritise (trade-off) between different investment options. And, consequently, there is no consideration for recurrent costs or for capital replacement.
• Results-based programming and budgeting has additional benefits as it increases the focus of the programme and encourages multi-sectoral and team working.
187 We recommend that both GVT and IFFDC explore the potential to use results-based programming and budgeting. Increasingly, state governments and some NGOs now have more flexible financial mechanisms than those used in GVT and IFFDC.
• Business plans – The WIRFP promotes new organisations and new activities and exposes often very poor people to new risks. Promotion of such innovation involves a “duty of care” by the promoting agencies to ensure that both the agency itself and the concerned individuals and groups have sufficient information and understanding of the risks involved to be able to make informed decisions.
• Business plans which bring together all the activities of a specific agency or stakeholder into a longer term framework including recurrent costs and residual values can contribute to this understanding.
• The business plan approach emphasises the autonomy of the agency, investor or entrepreneur for whom the plan applies and therefore provides a less project orientated perspective.
188 We recommend greater use of business plans within the project and as a means of ensuring adequate support is in place at the end of the project to secure project benefits into the future. This will require the development of internal capacity.

DFID / India: Western India Rainfed Farming Project / Final Report / October 2005
Proposal to Validate net Incremental
Income and Estimates using Area Measurements
A1

Proposal to Validate net Incermental Income Estimates using Area Measurments
A1-1
DFID / India: Western India Rainfed Farming Project / Final Report / October 2005
Proposal to Validate net Incremental
Income Estimates using Area Measurements
A1
Background
1 The CBA study for Component “A” depends heavily on the results of the Net Household Income Study (NHIS), which was based on careful analysis of small random study. The results of the study show considerable variation between households and between districts. The NHIS produced incremental benefits by well being class in terms of household income, which where translated in to village benefits on the basis of the number of households per well being class in the village. This approach, not unreasonably, assumes that farmsize differences are captured in differenced between well being classes.
2 In order to validate these results, an alternative approach to measuring crop incremental benefits is proposed.1/
Methodology
3 The proposed approach is based on building up village incremental benefits from estimates of:
• area and cropping patterns, before and after, the project intervention and • gross margin crop models. 4 Since the data requirements are more detailed than those required for the CBA study – comparable to the data required for the NHIS - it is proposed to limit data collection to three out of the four villages2/ used for the institutional and social study.
Step 1: Preparation of Cropping Pattern Tables and Maps
5 The choice of village assumes that it is possible to obtain good village-level cropping pattern data. If this is not possible, then villages from the larger random sample of 20 core villages should be used instead.
1/ The other issue which could be revisited in order to improve the quality of the analysis is the economic
wage rate. Further thought could be given to the assumptions used in the main report, once the migration labour study has been completed.
2/ In one of these villages (Kadwapada) the attribution of benefits to the project is difficult since another project has been carrying out similar programmes and so it is proposed to drop this village from the sample.

Proposal to Validate net Incermental Income Estimates using Area Measurments
A1-2
DFID / India: Western India Rainfed Farming Project / Final Report / October 2005
Step 2: Development of Gross Margin Crop Models.
6 This should be based on a series of informal interviews in the selected villages, with key informants. This information will be compared with published farm management data for the main crops and with data from the “Participatory Crop Technology Development” component in order to develop appropriate local models.
Step 3: Re-estimating Incremental Crop Benefits
7 Using the cropping patterns and crop model data, incremental crop margins will be re-calculated on village basis.
8 The output of this exercise will be a validation (or otherwise) of the data used in the main CBA study.
9 The results can be used to rerun the sensitivity analysis presented in the main report.

DFID / India: Western India Rainfed Farming Project / Final Report / October 2005
Suggested Methodology to Undertake a
CBA Study in “Prassar” Villages A2
Suggested Methodology to Undertake a CBA Study in “Prasaar” Villages
A2-1
DFID / India: Western India Rainfed Farming Project / Final Report / October 2005
Suggested Methodology to
Undertake a CBA Study in “Prasaar” Villages
A2
Background
1 Component “B” of the project includes the costs of activities outside the core village. This includes the challenge fund, which aims to promote activities with government and NGOs and which was started towards the end of the project, as well as activities in neighbouring or “prassar” villages. These villages are situated close to the core villages covered under Component “A”. They receive less intensive and more variable, but less costly support from Jankars. The formation of SHGs and the start of a regular savings programme as well as the availability of a jankar are the main criteria for inclusion as a “prasaar” village. Benefits are expected to be significant although there may be even greater variability between incremental benefits in prasaar villages than was found in core villages
2 Ideally, the design of the prasaar CBA study should parallel the methodology used for the core village analysis, but take cognisance of important differences. These include the likelihood of:
• greater variation in incremental benefits between villages as there has been less intense and more variable input into these villages
• less reliable information and more data accessibility problems than were encountered during the core village study.
Methodology
3 In the light of these concerns, a tentative methodology is set out below:
Step 1
4 Develop a conceptual framework for interventions in the prasaar villages and identify excepted benefits. This will require a qualitative analysis of several villages (perhaps around the same 4 villages as were used for the institutional and social sub-sample) and discussion with field staff.
5 The output of this step would be a conceptual framework and map.
Step 2
6 Prepare a table of all prasaar villages – showing year in which intervention started and the type of intervention.
7 The output of this stage is the population for consideration in the sample.
Suggested Methodology to Undertake a CBA Study in “Prasaar” Villages
A2-2
DFID / India: Western India Rainfed Farming Project / Final Report / October 2005
Step 3
8 Stratify the population in terms of the likely incremental benefits. The stratification should be based on the perception of field staff, as to the likely impact of the project in terms of both the number of people affected and the size of the impact. The criteria to be used to assess each prasaar will be developed following Step 1. The aim will be stratify each village into four roughly equal strata corresponding to the following categories:
• “successful”; • “moderately successful”; • “struggling”; and • “failed or failing”.
9 This will require considerable time from project staff. Although this may also have benefits for management and planning of future support, another option would be to use a two-stage process and randomly select a number of core villages, as was done in the Component “A” CBA study from which to prepare the stratified population.
10 The output of this stage will be a stratified population list.
Step 4
Select a random sample of six prasaar villages from each of the four strata. In order to minimise travel down and reduce costs, once a core village has been selected, a number of associated prasaar villages could be selected. If this option is taken, then the sample size should be increased. 11 The output of this stage will be a stratified random sample of about 24 prasaar villages.
Step 5
12 Carry out field studies in the selected villages, focusing on prasaar activities (i.e. exclude large WRD structures), but include:
• SHGs and their functioning, and • IGAs and the returns to jankars. 13 The output of this stage would be data on:
• Incremental benefits – This data should be collected in a similar format to that used for the core village study. The key issue is to determine whether the less intensive inputs have resulted in lower net increments than those assumed in the core village study (and NIHS study).
• Coverage – This data relates to the number of households, areas etc which have been affected by project activities.

Suggested Methodology to Undertake a CBA Study in “Prasaar” Villages
A2-3
DFID / India: Western India Rainfed Farming Project / Final Report / October 2005
Step 6
14 Prepare a table of project costs on prasaar interventions from discussions with field and other staff, including overheads, development and recurrent costs
15 The output of this stage would be a cost table.
Step 7
16 Prepare an economic model of the costs and benefits for each of the four categories of village. The models from each category can then be aggregated into a project-wide model by weighting the returns from each stratum by the number of villages in each category or if possible the total cost invested per stratum.
17 The output of this step, and the final output of the study, is a report, setting out the economic returns in a format which can be aggregated to the core village returns of component “A”.
Department for International Development India Western India Rainfed Farming Project CNTR 04 5752
Annexes ©
October 2005
ADDRESS TELEPHONE FACSIMILE EMAIL WEBSITE
Enterplan Limited +44 (0) 118 956 6066 +44 (0) 118 957 6066 [email protected] www.enterplan.co.uk 1 Northfield Road
Reading RG1 8AH, UK
Department for International Development India Western India Rainfed Farming Project CNTR 04 5752
Annexes ©
October 2005
DFID / India: Western India Rainfed Farming Project / Final Report / October 2005
Annexes

DFID / India: Western India Rainfed Farming Project / Final Report / October 2005
Background

DFID / India: Western India Rainfed Farming Project / Final Report / October 2005
Terms of Reference
AN1

Terms of Reference
AN1-1
DFID / India: Western India Rainfed Farming Project / Final Report / October 2005
Terms of Reference
AN1
Terms of Reference for Cost-Benefit Analysis
Background
The Western India Rainfed Farming Project Phase two (WIRFP) is a £28 million project supported by DFID India. The project aims to sustainably enhance the livelihoods of 675,000 poor tribal people in one of the poorest, drought prone and environmentally degraded regions of India, and to disseminate the technologies and approaches developed widely in the region. It is being implemented by Gramin Vikas Trust (GVT) and the India Farm Forestry Development Cooperative (IFFDC) over a seven-year period (1999-2006).
The first phase of the project (1993-1999) cost £3.8 million. It was implemented by Krishak Bharati Cooperative Ltd (KRIBHCO) and was successful in developing and implementing an innovative, participatory approach to farming systems development and in enhancing the livelihoods of 50,000 poor women and men farmers in 75 villages. This was largely achieved with new crop varieties, minor irrigation, tree planting, joint forest management and soil and water conservation with reduced subsidies. The economic internal rate of return of the project, including international consultancy costs was about 39 percent. Phase one pioneered poverty- and gender-focused innovations, which are being used by others and have had some significant impacts on government policies and programmes. Phase two includes an innovative component for support to migrant labourers from the project area, which migrates seasonally to urban centres in the three states in search of work.
The goal and purpose of WIRFP, Phase two is:
• Goal: More effective policies and programmes, which reduce poverty in rainfed areas of India, implemented widely by 2010.
• Purpose: Livelihoods of 675,000 poor rural people in selected areas of western India sustainably enhanced and technologies and approaches used widely disseminated.
In order to achieve the purpose of the project GVT and IFFDC will deliver the following outputs:
• Component A: Livelihoods of 465,000 poor people enhanced in 275 ‘core’ and 550 ‘proximal’ villages [GVT and IFFDC]
• Farmer managed groups, village specialists (jankars) and participatory planning system established and operational in core villages.

Terms of Reference
AN1-2
DFID / India: Western India Rainfed Farming Project / Final Report / October 2005
• Appropriate farming systems development technologies tested, adopted and implemented in core villages.
• Complimentary income generating and expenditure saving and off-farm activities for women and men promoted in core villages.
• Appropriate project technologies disseminated to farmers in 550 ‘dissemination villages’ close to the ‘core villages’.
• Component B: Project technologies and approaches disseminated through partnerships [GVT].
• Appropriate project technologies actively promoted to a further 500 villages via GOs and NGOs and disseminated to other organisations in India.
• Establishment of a Challenge Fund.
• Component C: Participatory Technology Development [GVT]
• New farming systems technologies generated, tested and made available in project villages and more widely in the region.
• All components
• Decentralised project management systems established and operational in GVT and IFFDC.
The total project cost is £28.0 million, which is made up as follows:
• A DFID grant of £20.0 million (71 percent) channelled through the Government of India to GVT and directly to IFFDC.
• GVT and IFFDC £1.0 million (three percent), provided by their parent organisations [KRIBHCO and Indian Farmers Fertiliser Cooperative Ltd (IFFCO)].
• Government organisations £3.5 million (13 percent) and community groups the equivalent of £3.5 million (13 percent), for development schemes in project villages.
The Mid-Term Review (MTR) of WIRFP was held in October 2003. The team included members from GVT, IFFDC, Government of India, Government of Madhya Pradesh and DFID India. The MTR recommended that GVT and IFFDC undertake more systematic evaluations of project interventions (for example, to assess financial viability, cost-effectiveness, socio-economic impact, sustainability), for which data on the costs and benefits of project interventions is needed. This information is needed both to (a) ensure that the project focuses on those activities that give the greatest benefits to poor people and (b) in order to interest government and/or other agencies in scaling-up these interventions in the long run.

Terms of Reference
AN1-3
DFID / India: Western India Rainfed Farming Project / Final Report / October 2005
GVT and IFFDC have requested the assistance of specialist consultants to assist them in carrying out these evaluations and to build their capacity to do so in future.
Purpose of the Study
The purpose of the study is to collect data on the costs and benefits of key project interventions in order to:
• Compare the different WIRFP activities with each other in order to identify the Project’s impact on livelihoods and help prioritise future interventions and areas of work.
• Compare WIRFP activities with similar externally aided projects/programmes and Government of India government schemes to identify differences in approach and interventions promoted and assess their relative viability.
• Train WIRFP staff in how to evaluate the sustainability and viability of enterprises and build their capacity to undertake such work on an on-going basis.
The results of the study will be used by GVT and IFFDC in business planning, identifying future focus areas and in the end-of-project economic assessment.
Scope of Work
The consultants will familiarise themselves with the project (background, context, activities) and then assist GVT and IFFDC to:
• Develop an analytic framework to compare rates of return adjusted for risk, for a sample of different WIRFP activities with similar government or other NGO run projects/ programmes. The activities will include but not be limited to new crops, soil and water conservation (contour bunds, gully plugs, cross-dams, pumps), joint forestry management and similar schemes, livestock schemes, and other enterprises.
• Prepare a table showing the different types of land-based and non-land-based interventions supported by WIRFP, and relate this with actual project expenditure to date;
For the selected activities:
• Identify and quantify all the relevant costs (in particular identifying cost to replicate the project in new areas) and benefits, commenting on the basis for these estimates and degrees of uncertainty involved.
• Estimate the returns (including costs of administration, capacity building and project staff time), presenting data in a disaggregated form to facilitate discussion.

Terms of Reference
AN1-4
DFID / India: Western India Rainfed Farming Project / Final Report / October 2005
• Assess both financial returns to the household and social cost-benefit analysis, taking into account externalities, transfer payments, and shadow pricing of labour.
• Estimate the expected rate of return based on sensitivities to key risks – both positive and negative risks.
• Collect easily available unit costs and returns for similar activities in government/ non-governmental run programmes and estimate any ‘hidden’ costs or benefits in implementing these programmes, which need to be taken into account in making comparisons with WIRFP.
• Compare WIRFP norms with the standard/government norms, analyse the findings and determine whether government plans to change its norms;
• Compare the costs and benefits of different WIRFP interventions using the actual unit costs, administrative inputs, staff time and rate of returns collected and analyse the findings.
• Analyse and comment on the budgetary implications and sustainability, if the project were to be adopted by the state government.
• Present the findings of the study to GVT, IFFDC and DFIDI in a report and at a workshop in Delhi.
The consultants will involve project staff fully in the study and build their capacity to undertake this type of analysis in the future. A framework (including resource needs) for an on-going programme of assessment will be prepared with project staff.
The consultants will establish with GVT, IFFDC and DFIDI a steering group, which will mange the consultancy (for example, establish and agree tasks, schedules and outputs; review progress at key stages).

Terms of Reference
AN1-5
DFID / India: Western India Rainfed Farming Project / Final Report / October 2005
Expected Outcomes and Deliverables
The consultants will:
Days
1-5 Familiarise themselves with the project by reading background documents and through discussions with GVT and IFFDC and prepare the methodology for the study.
6-48 After approval of the methodology, train GVT and IFFDC survey teams and supervise data collection and analysis (three weeks with GVT and three weeks with IFFDC).
49 -50 Collect information on similar government or non-governmental programmes.
51 Meet the Steering Committee and DFIDI to share initial findings.
52-59 Draft report not exceeding 20 pages, including a one page executive summary; annexure could be added separately) and submit to GVT, IFFDC and DFIDI).
60 Meet the Steering Committee and DFIDI to discuss the draft report.
61-62 Finalise the report and submit to the WIRFP and DFIDI (within two weeks).
Expertise, Timing and Conduct of Work
A three-person team consisting of a Team Leader, an agricultural economist and a social development/rural livelihoods specialist will undertake the assignment. The Team Leader will be an economist with a proven track record in leading evaluation studies of livelihood projects and capacity building in this area. The Team Leader will be responsible for ensuring the overall quality of the study. Both the agricultural economist and social development/rural livelihoods specialist should be well versed with national and state government livelihood schemes and with some experience in this kind of work. A sound knowledge of government’s norms on livelihoods and the policy thinking behind those norms would be essential. The Team Leader will have inputs at key stages of the study (30 person-days) while the other two consultants will work full-time (62 days each). The total consultancy input will be 154 days.
The study will be undertaken between July and September 2004.
The consultants will be briefed by DFID India before commencing the work and will work in close co-operation with DFID India and WIRFP staff. As a key aim of the exercise is to compare WIRFP with other similar projects/schemes, the consultants will meet relevant Government of India ministries and selected state governments to obtain relevant information. The consultants will be responsible for all logistical arrangements, including travel and boarding at the various places they visit.
Contacts
The DFID Economic Adviser (Loga Gnanasambanthan) with the Project Officer (Sonali Chibb) will be the key contacts in DFID India for the consultants. Shri Amar

Terms of Reference
AN1-6
DFID / India: Western India Rainfed Farming Project / Final Report / October 2005
Prasad (CEO, GVT), Dr P.S. Marwaha (CEO, IFFDC) will be the key contacts in GVT and IFFDC.

DFID / India: Western India Rainfed Farming Project / Final Report / October 2005
Analytical Framework
AN2

Analytical Framework
AN2-1
DFID / India: Western India Rainfed Farming Project / Final Report / October 2005
Analytical Framework
AN2
Project Framework
HH
Area
No
AdminHQSCTA
VOD
PPGFSHG
Crops
IGA
DR
L’stockForestry
Costs Adoption Benefits
HH Income
Interest Income
Time saved
MLSP High wages
HH
Area
No
AdminHQSCTA
VOD
PPGFSHG
Crops
IGA
DR
L’stockForestry
Costs Adoption Benefits
HH Income
Interest Income
Time saved
MLSP High wages

Analytical Framework
AN2-2
DFID / India: Western India Rainfed Farming Project / Final Report / October 2005
Project Processes
ProjectBudgets by activity
VillageVillage development plan
SHG
IndividualaccountAssets Group
account
Works
Contractor
Workers
IGA
Users
5% deduction
Jankar
Borrowers
Wages
3%2%
Repayments
Loans
Jankar
Members
Regular
savings
Fees
Honarium
S&C

DFID / India: Western India Rainfed Farming Project / Final Report / October 2005
Study Methodology
AN3
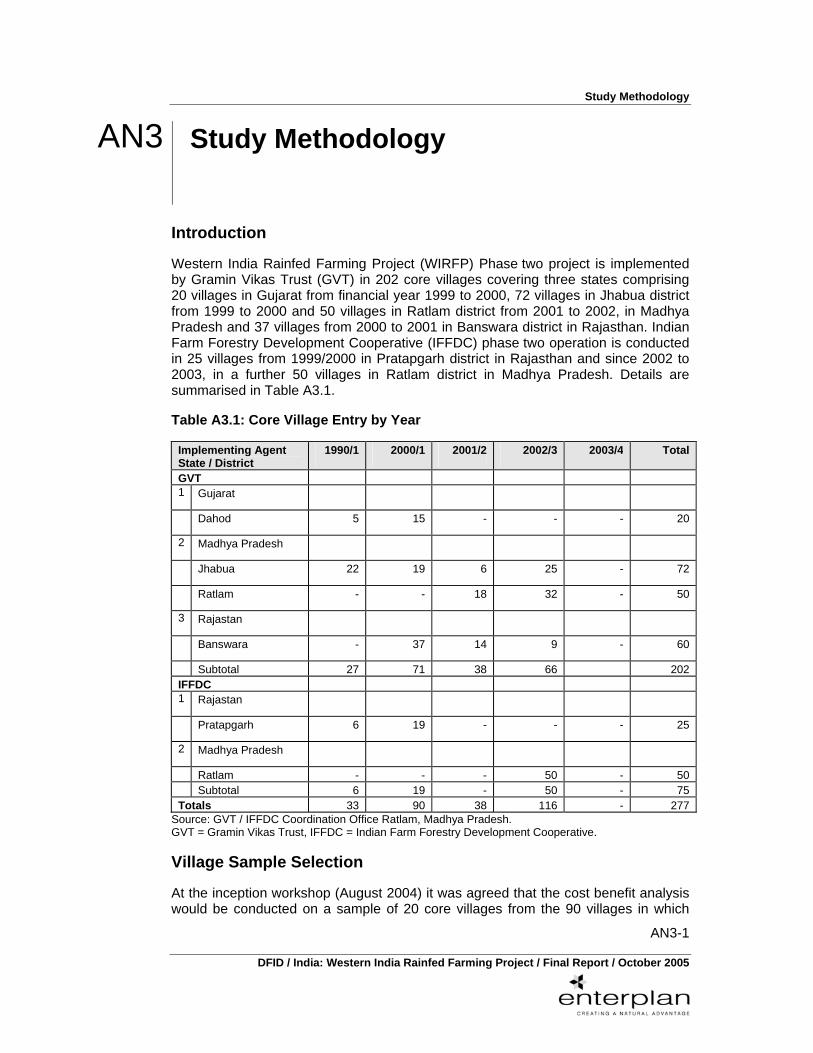
Study Methodology
AN3-1
DFID / India: Western India Rainfed Farming Project / Final Report / October 2005
Study Methodology
AN3
Introduction
Western India Rainfed Farming Project (WIRFP) Phase two project is implemented by Gramin Vikas Trust (GVT) in 202 core villages covering three states comprising 20 villages in Gujarat from financial year 1999 to 2000, 72 villages in Jhabua district from 1999 to 2000 and 50 villages in Ratlam district from 2001 to 2002, in Madhya Pradesh and 37 villages from 2000 to 2001 in Banswara district in Rajasthan. Indian Farm Forestry Development Cooperative (IFFDC) phase two operation is conducted in 25 villages from 1999/2000 in Pratapgarh district in Rajasthan and since 2002 to 2003, in a further 50 villages in Ratlam district in Madhya Pradesh. Details are summarised in Table A3.1.
Table A3.1: Core Village Entry by Year
Implementing Agent State / District
1990/1 2000/1 2001/2 2002/3 2003/4 Total
GVT 1 Gujarat
Dahod 5 15 - - - 20
2 Madhya Pradesh
Jhabua 22 19 6 25 - 72
Ratlam - - 18 32 - 50
3 Rajastan
Banswara - 37 14 9 - 60
Subtotal 27 71 38 66 202 IFFDC 1 Rajastan
Pratapgarh 6 19 - - - 25
2 Madhya Pradesh
Ratlam - - - 50 - 50 Subtotal 6 19 - 50 - 75 Totals 33 90 38 116 - 277
Source: GVT / IFFDC Coordination Office Ratlam, Madhya Pradesh. GVT = Gramin Vikas Trust, IFFDC = Indian Farm Forestry Development Cooperative.
Village Sample Selection
At the inception workshop (August 2004) it was agreed that the cost benefit analysis would be conducted on a sample of 20 core villages from the 90 villages in which

Study Methodology
AN3-2
DFID / India: Western India Rainfed Farming Project / Final Report / October 2005
GVT and IFFDC activities commenced during the financial year 2000 to 2001. Field specialists from the four representative districts (GVT three and IFFDC one) presented a list of villages in which project development activities had been initiated in the financial year 2000 to 2001. From these lists a random sample of 20 villages (GVT 14 and IFFDC six) were selected for detailed cost assembly. Details of the selected villages are given in Table A3.2.
Table A3.2: Villages Selected for Cost Benefit Analysis
GVT IFFDC
State Gujarat M Pradesh Rajasthan Rajasthan
District Dahod / Urolhara Jhabua / Dhao Banswara / Dungarpur
Pratapgarh
Jadha 1/ Bagoli Bakaner Chhayan
Kasotiya Borwa Bhuripada C Mayanga
Poyali Chamjar Gara 1/ Dharia Kheri
Chenpura Merana Kachotia
Kadwapada 1/ Sundripanda Moti Kheri 1/
Padabanda S Ka Khera
Source: Cost Benefit Analysis Study January 2005. GVT = Gramin Vikas Trust, IFFDC = Indian Farm Forestry Development Cooperative. 1/ Selected for in-depth social appraisal.
Team Resources
Gramin Vikas Trust (GVT)
• CBA Study Coordinator Mr Akhilesh Parey
• CBA Coordinator Ms Madhura Rawat
• CBA Supervisors Mr Naresh Bhal (Ratlam / M Pradesh) Mr Jeevan Porwal (Ratlam / M Pradesh)
• Field Resource Team Mr Sandeep Panwar (Dahod / Gujarat) Mr Dinesh Agarwaj (Jhabua / M Pradesh) Mr Sunil Yadav (Banswara / Rajasthan)
Indian Farm Forestry Development Cooperative (IFFDC)
• Project Coordinator Dr RPS Yadav
• CBA Supervisor Mr Rajesh Sen
• Field Resource Team Mr Vinod Lasod (Pratapgarh) Mr Anish Rizvi (Pratapgarh)

DFID / India: Western India Rainfed Farming Project / Final Report / October 2005
Case Studies

DFID / India: Western India Rainfed Farming Project / Final Report / October 2005
Jada Village
AN4

Jada Village
AN4-1
DFID / India: Western India Rainfed Farming Project / Final Report / October 2005
Jada Village
AN4
Profile of Gujarat1/
Gujarat state came into existence as a separate State on first May 1960. The State is situated on the west coast of India between 20-6' N to 24-42' N north latitude and 68-10'E to 74-28'E east longitude. It is bounded by the Arabian Sea in the West, by the States of Rajasthan in the North and Northeast, by Madhya Pradesh in the East and by Maharashtra in the South and South East. The State has an international boundary and has a common border with the Pakistan at the northwestern fringe. The two deserts, one north of Kutch and the other between Kutch and the mainland Gujarat are saline wastes.
The State has a long coastline of about 1600 kms. This coastline is the longest among all States of the country. For the purpose of administration, Gujarat State at present comprises of 25 districts, sub-divided into 226 talukas, having 18618 villages and 242 towns. Gujarat has a geographical area of 1.96 lakh sq.kms. And accounts for 6.19 percent of the total area of the country. With just five percent of the India’s total population and six percent of geographical area, Gujarat contributes to 16 percent of the country’s total investment, 10 percent of expenditure, 16 percent of exports and 30 percent of stock market capitalization. The state’s annual growth rate has been 10 to 12 percent for the last five years. As per the latest data of Centre for Monitoring Indian Economy (CMIE) of January 2003, Gujarat stands first in industrialization in India. Projects worth Rs 33,958 crores are under implementation.
63 percent of the total population of the State resides in rural areas. Seven percent of the total population of Gujarat belongs to SC community while 15 percent to the ST community. The sex ratio is 921.2/
Profile of Dahod District
Dahod district was carved out from the erstwhile Panchmahal district of Eastern Gujarat in 1997. The district has M.P in the east and Rajasthan on the Northeast, Vadodara on the south and Southwest, Kheda in the west, and Sabarkantha in the northwest. The district has been divided in seven talukas. The district is quite backward when indicators like agriculture, irrigation, forest, and education are considered. This is a poor region with only 20 percent of the arable area under irrigation. This is low in comparison to the State average of 36 percent. Literacy rates
1/ Source: Official website of Government of Gujarat. 2/ There is very little information available on the rural situation of Gujarat. Interestingly there is no
Department of rural development. The general thrust of the State is for industrialisation and for attracting investments. Unlike the States of M.P and Rajasthan there is no Human Development report prepared for Gujarat.

Jada Village
AN4-2
DFID / India: Western India Rainfed Farming Project / Final Report / October 2005
are also low at 45.20 percent. Dahod district accounts for 3.23 percent of the population of Gujarat State. 90.45 percent of the total population is in rural areas and 76.8 percent (ST) of the rural population is ST. The major caste group are Bhils, Patelia and Rathwa. The sex ratio of Dahod district is 985 as per 2001 census.
Agriculture and forest form the backbone of the economy of the district with 80 percent of the population dependent on the same. This is a rainfall deficient district. The average rainfall is 659.36mm. However in 2000, 2001 and 2002 it received only 275mm, 520mm and 560 mm rainfall. This resulted in severe drought conditions and a situation of famine. Every 10 years there is one cycle of drought that sometimes lasts two to three years at a stretch. The HDI of Dahod is 40. It compares rather poorly with the overall State HDI of 114 and 192 of Gandhinagar district that happens to be the most developed district of the state. Kharif is the main crop with maize, rice and cotton as the important crops.
Profile of Jada Village
Jada village is in Limkheda Block of Dahod district. It is located 26 km from the GVT State office in Dahod. Jada is a large village spread into 18 Falias consisting of 450 (?) households. The village settlement is in a radius of three kilometers. Majority of the village for example 350 HH consists of the Patelia Bhils. 68 HH have not joined with the programme. These are: 35 HH from Parmar Phalia, 20 from Patel Phalia and 13 from Khodiyar Phalia. The reasons for not joining in were the fear that they will be forced to convert to Christianity and/or the implementing agency will capture their lands.
There is a primary school in the village. The middle school is three kms away in village Kheria. 80 percent of the village population is illiterate. The nearest PHC is located 12 kms away in village Dadela. The Bank is 10 kms away in village Jeykot. The nearest bus point is five kms away in Kamboi. People go to Limkheda (25km) or Dahod (26 Km) for the weekly market.
The total land area of the village is 1137 Ha. Of this 251 ha is arable. According to the PRA report 60 percent of the land is used for growing maize in the Kharif season and rest for Tuar, Udad, and Moong. Only 50 percent arable land is used in the Rabi season. Of this 30 percent of the land is used for growing chickpea. The rest is used for growing Wheat, Maize, pea, castor and Moong.
Almost 80 percent of the people in Jada migrate in search of labour opportunities.
Evolution of the GVT Intervention
GVT made its first contact in the village in June 2000. The usual sequence of village entry and rapport building, PRA (three days), followed by CPA (Community Problem Analysis, done with representatives of the village) and VWP (Village work plan that includes prioritisation of development options and fixing of modalities and negotiated terms and conditions of the interventions), implementation, review PRA and withdrawal has been followed. At present Jada is in the Pre-withdrawal phase.

Jada Village
AN4-3
DFID / India: Western India Rainfed Farming Project / Final Report / October 2005
The CPA had revealed the following problems:
• degradation of forest; • soil erosion; • shortage of water (both for irrigation as well as drinking); • lack of electricity; • lack of pucca housing; and • shortage of fodder.
The CO spent a lot of time with the different groups when the SHGs were getting organized. In this process he developed a fair idea about the leaders in various groups and the problems the members wanted to address. The village work plan development took place almost nine months after the village entry was made. This period was good enough for the CO to build the necessary rapport with the community. Representatives from the different SHGs got involved in this process. It took a day to develop the VWP. This plan was shared with the entire village community.
Activities at the Village Level
As part of the field validation exercise the social development specialist has focused mostly on VOG that is a part of component B for example Development and only partially focussed on Component B called Dissemination for example the work in Prasaar villages
Component A Development Activities; VOG (Village Organisation Development)
Self Help Groups
Jada has 22 SHGs in all. There are five Women’s groups, two mixed and 15 men’s groups. According to the Jankaars, of the 22, 15 can be called as well functioning SHGs. Of these four are women’s groups and 11 are men’s groups. According to the people interviewed the weak groups are the ones where:
• members do not save regularly;
• members are away on migration eight months to the entire year;
• members do not attend meetings;
• social evils like drinking, fights regarding women, blind faith too have resulted in weakening the group; and
• members do not listen to the village Jankaars.3/
3/ At the time of the field visit 50 percent of the village had already migrated. So having separate meetings with the members of the SHGS was not very fruitful. This researcher decided to meet up with a cross
Jada Village
AN4-4
DFID / India: Western India Rainfed Farming Project / Final Report / October 2005
SHG 1: Shri Nijananad Gram Vikas Mahila Mandal
This SHG has a membership of 20 women (one-BO, two-M, 11 poor and six very poor). There is a parallel men’s group Shri Nijananad GVM with a membership of 20 men. Some of them are husbands of the members in the women’s group (two BO, two M, 11 P and five VP). The women’s group meets twice a month (on the first and the fifteenth). They save Rs.30 pm. They did try to introduce a fine for late payments but it never worked. The group was started four years ago. Four members have migrated at present. They have been saving regularly and usually put in their savings on their return from migration. Three of them are from VP category and one from the Poor category. Only one member of this group has stopped saving since February this year due to financial difficulties.
The group got Rs.10, 000 as a revolving fund grant from the Taluka. This amount was divided equally among the group members (Rs.500 per member). This money was mostly used for seed and fertilizer purchase and/or for hiring labour for weeding.
Major loans taken by group members and the purpose:
• Kalawati ben Kanubhai (WBR Medium) Rs. 10000 for Bangle store; Rs. 2000 for fertilize and Rs. 500 SGSY for weeding;
• Rameelaben Mangalsingh Deval (B.O) Rs. 10000 for tractor;
• Narmada ben Ramsingh Deval (poor) Rs. 1000 for seed and fertilizer; 500 SGSY; Rs. 1500 for fodder;
• Parvati ben RatansinghRathod (Poor) Rs.5000 for seed and fertilizer; Rs.500 SGSY; RS.1500 fodder;
• Kalaben Dalsingh Rathod (poor) Rs. 500 SGSY and Rs.1500 marriage; and
• Surtiben Ganabhai Rathod (Very poor) Rs. 5000 for marriage, Rs.500 SGSY.4/
This group has also got an SGSY loan for tent house. The amount of loan is Rs 1,30,000 and the subsidy is Rs. 1,20,000. Kanubhai (the husband of Kalavati and the Adhyaksha of the Manhamandal5/) has paid a bribe of Rs. 12000 to get this loan. While the loan is in the name of 13 women members of this SHG, the real manager and owner of this activity appears to be Kanubhai. He has been paying the monthly instalment of Rs. 2500 for the past three months. He is very confident of making a neat profit in the coming season. The terms of contract with the group are however not clear. It seems to this researcher that he has simply used the group to get access to this loan and the group too is not questioning his cornering the entire benefit. Of
section of SHGs. Between the CBA team and the social development person a total of six SHGs have been covered. This gives a fair picture of the village.
4/ The SGSY loan of Rs.500 came at the time of agricultural season. It was mostly used by members for weeding and fertilizer.
5/ The federation of SHGs of Village Jada.

Jada Village
AN4-5
DFID / India: Western India Rainfed Farming Project / Final Report / October 2005
course the other side of the story is that Kanubhai is looked upon as a benevolent person who is always around to help people, so nobody is looking at this situation with suspicion. According to him, he plans to share part of the profit from this activity with the SHG. However as mentioned earlier the terms of this arrangement are not yet clear. What is going to be the gain to the 13 members is something only time will tell.
Kanubhai is a very enterprising person. He has maintained very good contact with the erstwhile Sarpanch of the village. She lives in Dahod and is fairly influential. It is because of his initiative and effort that 13 groups have got registered under SGSY and three have got a revolving fund of Rupees 10000 each. Three groups have got group loans for general purposes that they are on-lending to members. Kanubhai has been groomed by the COs in-charge of the village.
SHG 2. Baba Ramdevpeer Gram Vikas Mandal
This group was also formed in 2001. It has a membership of 20 persons. At the time of field visit seven persons had already migrated. The repayment record has not been very good in this group. Many of loans have been due for more than two years. The group consists of poor and very poor HH. Many loans are consumption loans. That too explains poor repayment record. The literacy rates are very low. The group has the potential to become a good group. Unfortunately the Jankaar has not been very active. It is really the responsibility of the GVS to ensure that the Jankaar becomes more active. According to the previous CO pushing the Jankaar to become more active can revive this group. The people have to be made to realise that ensuring repayments will strengthen the group.
SHG 3. Pranaath ji Gram Vikas Mandal
This group was made in 2001. It has a membership of 20. The group meets and saves regularly. They save Rupees 30 per month. The group has a total savings of Rs.21342. It has a grain bank that was started in 2001 with 25 quintals of grain (please see the section on Grain Bank).
SHG 4. Pranaath ji Gram Vikas Mahila Mandal
This is a parallel SHG of the women. This too has a membership of 20. They save Rs. 20 per month. Like other groups they too save regularly. Unfortunately this group chose a rather unviable activity as a group IGA. This case is documented below (the case of leaf plate making).
Income Generating Activities (IGA); Minor IGAs where GVT makes a grant to the group
Case 1: Grocery Store
Maniben Mansingh Dewal of Jayguru Malik Gram Vikas Mahila Mandal got a loan of Rs. 5000 for setting up a Kirana shop. She got this money on 25 October 2002. Maniben has been repaying Rs.50 every month to the SHG. However the term of the loan was fixed at two and a half years. Two years have already gone by and she has

Jada Village
AN4-6
DFID / India: Western India Rainfed Farming Project / Final Report / October 2005
repaid only 1100 of the interest free loan of Rs 5000. Effectively a balance of Rs. 3900 has to be repaid in remaining six months. According to the ex-CO of the village it was the responsibility of the Mahamandal to keep track of loans. They have not done so till now. It was agreed that they would now have to look into all outstanding loans.
Maniben has not kept any record of the costs and the net profit she is making out of this activity. According to her she is able to meet the HH running expenses as well as repay Rs. 50 every month from the earnings of the Store. However she has no idea about the cost, sale and net profit. According to CO they never ran the store activity as an IGA. In fact they left it to the initiative and skill of the borrower. However this researcher is of the view that this is not a good argument, especially since the idea of IGA is to also help in grounding viable IGAs. Repayment for such loans continues to be an area of concern. Since this money does not come from the savings of the group there does not appear to be a group pressure for timely repayment. At the rate Maniben is repaying it will be 78 months (more that six years before the entire loan is repaid.
Case 2: Diesel Pump
This asset has been given to the group: the group in turn hires it out to various people. Here there is no pressure to recover the cost of the pump. The system is simple; the group charges a different fee from Members and non-members. The Jankaar gets a fee of Rs 10 per hour. He deposits the balance left after deducting all costs to the group. So what exactly is the benefit of the diesel pump? According to the people interviewed the benefits are as follows:
• The pump is available on time.
• The group members help each other to transport it and ensure that pump is made available to whoever needs it. Unlike the private pump operators who have to operate the pumps single handedly, the group pump can be shared even for handling (and not dependent on one individual). This means that the rotation of the pump is faster.
• The private pump charges are fairly flexible- could range from anywhere between 80 to 100 rupees an hour as compared to 60 (for members) and 80 for non-members. The private operators also charge for transportation (50-60 rupees).
While all this is fine, it needs to be ascertained if the group is earning enough to be able to replace the pump when it has run its life. According to the ex-CO, the cost of a diesel pump is Rs. 22500. The life of a pump is usually 10 years. The Jankaar has been depositing more than Rs 2000 per year. The ex-CO believes that they can easily deposit Rs. 4000 per year and that should be more than enough to take care of repair, maintenance and replacement of the pump.6/
6/ In case of Kadwapada, another GVT village covered in detail by the CBA team one of the groups has not been able to agree to pay for the repair of the diesel pump from the group funds. There was some

Jada Village
AN4-7
DFID / India: Western India Rainfed Farming Project / Final Report / October 2005
Case 3: Leaf Plate Making Machine
This intervention was started in 2001 where the group (Pranaathji GVMM) was given a grant of Rs10000. The group bought a plate-making machine for Rs. 6000. It kept aside Rs 4000 for purchase of raw material (the idea originally was to make paper plates). The women however decided to make leaf plates as there was local market for the same. 12 women were engaged in this activity. They used to collect Butea monosperma (Khakhra) leaves and then make plates from these leaves. The activity did not last for long as the women were not able to even earn minimum wages. They were not able to market their stock. The total turnover was Rs.3647 over a period of XX years and the expenditure was Rs. 375. They deposited Rs. 2150 with the group. There was no viability assessment done. The moral of the story is that non-traditional activities have to be introduced with care and no IGA should be started without assessing its viability.
Case 4: Rope Making
Nijanand GVM was given a group IGA for rope making (13 members). They were given a grant of Rs 10000. The group bought three machines worth Rs. 4000. They also bought Jute for making ropes. However the quality of ropes was poor and they could not sell the same. They used the ropes for personal use without paying for the same. The CO took a meeting and made the members pay for the ropes. It was decided to sell the machines. The fund of Rs. 10000 was given as a grant of Rs 5000 and a loan of Rs 5000 to another member, Kalawati W/O of Kanubhai. It was used for opening a Bangle store. Kalawati has returned the loan. She also made an investment of Rs. 20000 for other items like clothes, shoes, and cosmetics. 10 percent of the monthly profit is deposited with the SHG. Till the time of the study she had deposited Rs. 6134 with the SHG. All in the lesson is that any IGA has to be introduced with great care. Just because the people demand for a particular IGA is not a reason enough to support.
Minor IGAs - Where GVT Provides the Asset as a Grant to SHG Members
Usually Poultry and Goatry grants have been given to members under this category. However in case of Gara (the GVT village in Banswara District of Rajasthan), the CO felt that these were essentially efforts at breed improvement and not minor IGAs. Hence distribution of Poultry birds (Giriraja and Girirani) and the Jamnapaari and Sirohi goats is seen as an effort at breed improvement. In case of Jada these have been seen as IGAs.
Case 5: Poultry House
Waala Bhai took a loan of Rs.14450 from GVT through the SHG. He also spent 8500 for the construction of the poultry house. As per agreement 10 percent of total sale conflict in the group as a result of which five of the group members got together to buy a new diesel pump. Now the pump Jankaar is not able to convince the group to release the fund for the repair of the group pump. Ironically he had been depositing the earnings from the diesel pump in the group account very regularly and ideally that amount was to be used for repair and maintenance of the pump. There is a deadlock at present. Similar situations can crop up in other groups as well. Basically the lesson for GVT is that groups have to be monitored closely to avoid and /or resolve such situations of conflict.

Jada Village
AN4-8
DFID / India: Western India Rainfed Farming Project / Final Report / October 2005
was to be deposited with the SHG. However, Waala Bhai did not stick to this agreement. He has been making profits. He has also been paying the group regularly but the amount has been less than what was agreed. He has also diversified into poultry for eggs and to rabbit rearing.
Major IGAs. Individually Managed Assets through SHGs
These are cases where individual member gives a rent to the SHG and also makes a contribution (usually 10 percent of the cost of the asset) towards the purchase of the asset. The asset belongs to the SHG but the individual ‘Jankaar” takes the responsibility of managing, maintaining and renting/operating this asset on behalf of the SHG. Some examples of such assets are Multicrop Thresher, Maize Thresher, Bullock Cart, Hand Cart, Chaff cutter, Flour Mill, and Diesel pump.
Case 6: Flour Mill
The Flourmill was given to the Khodiyar GVM that happens to be from a very poor hamlet. People had to walk two to three k.m to get their grain ground. The cost of the mill was Rs. 26000. The beneficiary did the installation. The activity was started in March 2003. The terms were that 60 percent of the profit would go to the Jankaar and 40 percent to the SHG. On an average the mill runs for three hours. 40 kg of maize can be ground in one hour implying 120 kg per day. He charges Rs. 16 per 20 kg. His gross income averages from 1000-1200 pm. He has already deposited Rs. 5500 with the group in one year. Unfortunately the room where the mill was housed got burnt down last December. He withdrew this money to repair the same. He also got some compensation from the Government for house construction. He has now been able to construct a pucca house where the mill is located. He has been running the mill successfully and depositing the money.
Case 7: Oil Mill
There is an oilseed project running in the Project area with the support of NRCRM (National research center for rapeseed and mustard) since 1999. The idea is to promote cultivation of oilseeds in this area. The total consumption of oil per person according to health authorities should be 14 Kgs per year. However the consumption in this area is only three to four. It was to address this concern that GVT started this project. The oilseed production in village Jada and its adjoining villages has increased.
However GVT realised that there were no processing facilities in the vicinity. The oil mill was introduced as a group IGA (in Jagni GVM) to ensure that people processed the oil and consumed the same. GVT is aware that this activity will take a long time to become economically viable. So it is more in the nature of a welfare intervention. The cost of the expeller and filter was Rs. 58000. The cost of installation of Rs 10000 was borne by the community. The total turnover till now has been Rs. 2363. Expense is Rs.535. The group has deposited Rs. 1100 with the SHG. At present the Jankaar is anchoring the activity. He is not taking any incentive as of now. The activity is likely to pick up momentum this year as the area under oilseed has increased in this region. People have also started consuming this oil. People have been exploring the

Jada Village
AN4-9
DFID / India: Western India Rainfed Farming Project / Final Report / October 2005
option of getting a variety of oilseeds, processing the same and selling the same in the area. It is too early to give an assessment.
An impressionistic assessment was requested from one of the old timers of the team. According to him the IGAs have performed as below:
S.no IGA/Assets/ service provider
No of persons
Successful Possibly successful
Un-likely
Failure Comment
1 Flour Mill 1 Yes
2 Oil Mill 1 Yes as a welfare activity
3 Diesel Engine
3 2 1 Money has not been coming to the SHG in the case of possibly successful case
4 Poultry 3 1 2 Possibly successful as the 2 groups waited too long and then the birds died
5 Bangle Store
1 Yes
6 Leaf Plate Making
1 Yes Because of wrong choice of the activity
7 Grocery Shop
1 Yes Has not been repaying regularly
8 Carpentry 1 Yes Has not been repaying regularly
Social Development Interventions
Unlike IFFDC where all the members of the SHG in Moti Kheri village got the various items distributed under SDI, in the case of GVT a few members have got these and it was expected that others would see the utility pof the same and be willing to pay to get these items. This has not happened in practice. The number of users has remained stagnant at the numbers covered by GVT.
Fibre Sheets. A total of 150 Fibre sheets were given. GVT gave five to 20 fibre sheets to every SHG. The SHG decided who should get the sheets. The cost of the sheet was Rs. 58 in the first round and Rs. 97 in the second round (width was increased). There was no further demand for the sheets on payment basis - no scaling up although people did like these. Perhaps expecting GVT to provide these at subsidised rates. The problem is that GVT has not taken the scaling up of these technologies as an agenda. All they did was to introduce the technology - even if

Jada Village
AN4-10
DFID / India: Western India Rainfed Farming Project / Final Report / October 2005
people want to adopt these technologies there is no information available to them as to where they could access these. In some cases it appears that information was provided but people did not take the initiative to go and buy these. These are possibly not a high priority item for them. People did not provide a clear response to our queries. There is some sort of inertia.
Smokless Chulhas. This makes an interesting study. It seems the Chulhas were made using sand and cement - while these functioned well for seven to eight months they started cracking after this time. As a result there was heat loss and the fuel wood requirement increased. Either people switched back to old chulhas or repaired the smokeless chulha using mud. The lesson is that mud chulhas work better than the cement ones. These Chulhas were made only till 2003 financial year. GVT has now stopped this activity. In some villages there has been 100 percent coverage. In Jada of the 68 Chulhas made only 20 percent are being used for cooking. The others use these only for heating water.
Ball Bearings. The size of the Chakkis used in this village is larger. In fact according to women they have chakkis of different sizes. The ball bearings were small for the large sized chakkis hence broke/did not work. 115 were distributed but failed in many cases. The lesson for GVT is that they should have checked the size of the chakkis and the appropriate size of ball bearings. If they had taken care the ball bearings would have been useful.
Health Jankaar. Maniben was trained by the project as a Para health worker. Earlier she had been working as a mid-wife. Getting her trained to provide basic health services was a good idea. While Maniben is confident of her abilities and did succeed in curing the sick, people refused to pay for the medicine. Soon the medicines provided by the project got over. As a result her services got confined to helping in deliveries - something she had been doing earlier. The systems for her sustainable functioning were not put in place. People did not want to pay for the medicine. Ironically the same people are willing to walk 10 km to a private doctor for treatment. While this is not the core of GVT’s intervention, it is something that needs to be analysed and understood better. Why is it that the system has not sustained? GVT could take the help of organisations that have extensive experience in health services. Else it is likely that this intervention would have the same outcome in most if not all villages.
Community Assets
Wells for drinking water for cattle and humans, check dam for irrigation.
Grain Bank
It was started in May 2001. The past three years had been of poor monsoon. As a result there was a huge shortage of grain in the village. GVT started this intervention with 25 quintals of Maize. One SHG (Pranaathji GVM) was given the responsibility of managing this grain bank. Members of 16 groups benefited from this grain bank. The most needy members (100 in all) of the group were provided with grain. It may be noted that due to shortage of storage space, the grain bank was shared with two more groups Jagni (five quintals) and Khodiyar (eight Quintals) in the year 2003.
Jada Village
AN4-11
DFID / India: Western India Rainfed Farming Project / Final Report / October 2005
Both the groups have been given storage bins and weight balance by GVT. At the time of field visit the overall quantity of grain had increased to 43 quintals. People are very happy with this intervention and there is huge demand to bring in more grain so that more families can be covered.
Crop Technology
This includes crop trials, seed distribution, cropping practices, agriculture implements, compost pits, drip irrigation, PVS/PTD.
FAMPAR Trial
Mustard, horse gram trials, oilseeds promotion has been taken up under the NRCRM.
Agriculture Implements
Intraculture hoe, Spray pumps have been given either to the SHGs or to individuals with part contribution.
Drip Irrigation
A total of 15 people have got drip irrigation kits. According to some people interviewed they are able to use these well for growing vegetables like gourds. However, the flip side is that these do not fetch a good price, so the benefit does not really translate into more income. Even if the benefit translates into better nutrition at the family level it is important. However this is the first year of this activity making it a bit premature to assess the benefits.
Compost Pits
67 compost pits and eight NADEP. The response has been good.
SWC
Work worth 15 Lakh has been completed on 141 Ha of private land. The total planning is for 170 ha.
WRD
Under WRD two wells have been constructed with 10 percent of material cost contribution to group and 100 percent labour and masonry charges. The persons who have got these wells cannot stop group members from using the same for drinking purposes (human and cattle).
The check dam has helped irrigate 35 acres of land covering 27 beneficiaries. The cost of the check dam was 20 Lakhs. People worked at Rs 55 as a daily wage instead of Rs. 85. This was their contribution to the construction of the check dam. Like in case of Moti Kheri, it needs to be checked if the contribution was the same for

Jada Village
AN4-12
DFID / India: Western India Rainfed Farming Project / Final Report / October 2005
the people who benefited from the check dam and those who only got a wage benefit.
The project also constructed water tanks for drinking water for cattle.
Livestock (Breed improvement of cattle, poultry, goats)
Poultry-Chicks and goats were given to members with part contribution from members.
Case 1
Nijananad GVM Waala Deeta (from the poor category) was given a grant in the form of construction material and 200 chicks for one cycle in February 2001. He contributed the roof material and labour cost. One cycle is usually of two months (four cycles per year). Ideally he should have done 14 cycles in three and half years. At present he is running only the eighth cycle. While he has made a good profit, the number of cycles has been less. The reason is that two cycles were a complete flop. (One 10-day-old chick costs Rs 10-12.) Since he is poor he was not able to immediately start the next cycle after a flopped cycle. However all in all he has a good grip on the activity and is making money. On an average the net benefit works to 2000 to 2500 rupees per cycle of two months. The family manages the activity as a part-time activity.
Case 2
Giriraja and Girirani (GG) chicks were distributed to 10 HH (50 birds in all five female and one male) on 50 percent contribution made to the group. The response has been good but no scaling up has happened. While breed improvement has happened but the demand for GG chicks has not come in. People do not perceive this species as an IG activity. Another reason for this view is that the mortality rate in the other villages was reported to be high. GVT too did not push this breed. Instead, it changed the breed to Kadaknaath as GG is an outside breed.
Forestry
This includes JFM, Fruit trees, Nurseries, orchard development, grafting and budding, medicinal plants cultivation, and CPR development.
There is a registered JFM committee but they have not started protection. This committee was formed last year.
Four patch plantations consisting a mix of Eucalyptus, teak, Sal and ber and 17 orchards of fruit plants like Mango, Chikoo, Guava and Lemon were started in 2001. These plants were provided on a 50 percent contribution. It is still early for returns to start flowing in.

Jada Village
AN4-13
DFID / India: Western India Rainfed Farming Project / Final Report / October 2005
Component B Dissemination (Prasaar Villages)
The Prasaar work started from April 2002. There are 75 Prasaar villages in Dahod and Godra districts.7/ Jada has 10 Prasaar villages: Kheria, Katholia, Bawka, Matwa, Polisimal, Valundi, Rojahm, Jaikot, Khadda, Khodwa. There are three Prasaar Jankaars who are responsible for two to three villages. The Prasaar Jankaars of the Limkheda East cluster (two clusters) meet on fifth and twenty-eighth of every month to plan their work. They also visit a few villages jointly if required for convincing the village community. The work is being done in a fairly systematic manner.
Future scenario
A Mahamandal Federation or GVS Gram Vikas Samiti for example Village development organisation was created in 2003. This has been formed as part of the TOP (Take over plan) in preparation of the withdrawal phase of the project. The Mahamandal has been registered under the Societies registration act. The Presidents of the 22 SHGs are members of this body. The president of this body is Kanubhhai. Each SHG contributes Rs 100 per annum as membership to the Mahamandal. In addition the contribution for individual activities undertaken under the project too adds to the fund of the Federation. The plan is to transfer the group funds generated from GVT interventions and all the community assets to this body. The Mahamandal will be responsible for monitoring. There is a plan to form a cluster resource center consisting of 20 Mahamandals of 20 villages. This resource center will be in partnership with GVT. It will have a tent house, diesel engine, tractors, irrigation and agriculture equipment- that can be rented out through GVS and SHGs.
Summary and Analysis
Institutions
Self-Help Group (SHG)
Self-help group (SHG) is the primary institution at the village level. In Jada village 15 of the 22 groups are functioning well. The primary reason for the poorly functioning groups is poor leadership.
Governance In the well functioning groups there are a few more enterprising and dominating individuals. At the same time the other members too are fairly active. Groups do have transparency. Financial institutions assess these aspects before giving any loan. It is notable that 13 groups have been registered under SGSY.8/ One problem is that they stick to equity to a ridiculous extent to avoid conflict. The grants for instance are divided equally. Of course the good thing is that the Jankaars or the group leaders do not corner the group assets. People have complete access. The biggest problem is that they want to divide money equally. This may not be healthy
7/ Dahod and Godra were earlier part of the Panchmahal district. Dahod district was created in 1997. 8/ Swarna Jayanti Gram Swa-rojgar Yojana (SGSY) where group loans are made through Banks for
productive activities of a SHG

Jada Village
AN4-14
DFID / India: Western India Rainfed Farming Project / Final Report / October 2005
for the group in the long run as the needs of different members are different and the group does not seem to be addressing that issue.
Decision-Making all decisions is taken in the group meetings. There are conflicts but they get resolved (at times with the help of the CO). Usually the CO would resolve these in the group itself.
Leadership. There has been no rotation in leadership. This is something that GVT will have to look into.
Mahamandal
The role of the CO has been taken over by a Jankaar. The Federation (Mahamandal) has become operational and they have started operating from their office in the village. All the records of the SHGs and the works undertaken in the village are maintained at the Federation. There are a few dynamic, educated youth in this village who have been taking up these responsibilities very enthusiastically. GVT staff is now playing the role of simply guiding this group.
Management Process
Decision-Making. As described above the decision making process is fairly transparent yet the fact remains that the more enterprising have come forward to take the maximum advantage from the groups. The group members too feel that their resources are in safe hands. Large loans are usually given to the safer options. While this is healthy, the flip side is that the relatively poorer and less enterprising lot has got left out. There has to be an alternate strategy to rope in and reach out the latter category.
Responsibility for Assets. Mahamandal will be responsible from now on. At present it is the responsibility of the concerned SHG. In case of irrigation structures there are user groups (UG) who are responsible for repair and maintenance. These structures are recent therefore systems are still being put in place. The charge will be on a per acre basis on an annual basis. The group account has been opened in the local Bank.
Maintenance of Information. Project level information is maintained as part of the usual MIS system. However care is being taken that all village level information is maintained at the SHG level.
Inclusion and Targeting
Village Selection. DFID guidelines for village selection have been followed very strictly by GVT, particularly in Phase I. In phase II there was some dilution.
Activity Inclusion. The village entry was made in May 2000. PRA was done in November 2000. The village work plan was finalized in February 2001. The implementation was stared in March 2000. When the HH who had opted to stay out of the programme saw that SWC works were being done under the project, they approached GVT for getting included in 2002. However GVT refused as all the plans

Jada Village
AN4-15
DFID / India: Western India Rainfed Farming Project / Final Report / October 2005
had been finalized. The process of getting new HH included is complex. There are usually several queries from GVT. Usually the time between entry and the finalisation of plans is at least six to nine months, this time was considered long enough for the late entrants to join in. Yet the fact of the matter is that after the initial round of formation of SHGs there is very little scope for inclusion of the HHs left out. The CO too gets busy with implementation responsibilities and there is little time to form new groups. According to the staff interviewed the implementation phase of work is different and the priorities too change. GVT may want to examine if this was really the right approach and whether it would have been better to allow the late entrants to join in by making the administrative requirements a bit more flexible. After all SWC is the most critical intervention for these areas.
While the SWC work included all the SHG members, for other interventions the CO had to assess whether a group had too many IGAs or if the group had the capacity to run the activity. In case of individual activities the capacity and need of the people was considered. The CO used to hold a meeting with a group of Jankaars to do this assessment, so that it was not left to his discretion alone. According to the ex-Co, the presence of CO would help to take rational decisions. The proposals were made once the CO OK-ed the idea.
Repayment Regimes. For 13 of the 22 groups 50 percent repayment is on time. For the outstanding loans these groups do not bother too much as they are confident that the money will come. However, for the remaining groups the loans have been outstanding for much longer and this is a cause for concern.
Public Works Leading to Private Benefits. In case of Jada no work was done on public lands.
Jada Village
AN4-16
DFID / India: Western India Rainfed Farming Project / Final Report / October 2005
Stakes
SWC, WRD, and Crops. A fall out of the excessive rains has been that the mud bunds made in the palabandhi (bunding) operations have got washed off. On checking with the community as to whether they would be able to do the necessary repair to the damaged bunds before the next cropping season, the response has been almost uniformly in the negative. The reason is the crop failure of this year and the need to migrate. GVT too will not be in position to financially support the repair and maintenance of the bunds.
SWC, WRD interventions have generally benefited the people. SWC has been the most popular intervention as it has not only provided wage income but also has helped to improve the quality of land. In some cases it has also increased the arable area. However no formal assessment of the same has been made so far.
Social Development Interventions (SDI). A range of technologies was introduced by GVT under SDI. However it seems that these were not followed up carefully. For instance the ball bearings were small for the large sized chakkis used in this area. Consequently the bearings broke or did not work at all. 115 ball bearings were distributed but failed to work in many cases. The lesson for GVT is that they should have checked the size of the chakkis and provided the appropriate size of ball bearings. If they had taken care the ball bearings would have been useful.
A health Jankaar was trained by the project. She had been functioning as the village mid-wife before she got the training. However her work as health Jankaar lasted only as long as the medicines provided by GVT lasted. People were not willing to pay for medicines. Ironically the same people are willing to walk 10 km to a private doctor for treatment. While this is not the core of GVT’s intervention, it is something that needs to be analysed and understood better. Why is it that the system has not sustained? GVT could take the help of organisations that have extensive experience in health services. Else it is likely that this intervention would die a natural death in most if not all villages.
While the other interventions like light sheets, smokeless chulhas have been found to be useful these have stayed stagnant at the numbers that were covered initially. It seems that the problem is that GVT has not taken the scaling up of these technologies as an agenda. All they did was to introduce the technology. Even if people want to adopt these technologies there is no information available to them as to where they could access these. In some cases it appears that information was provided but people did not take the Initiative to go and buy these. These are possibly not a high priority item for them. People did not provide a clear response to our queries. There is some sort of inertia.
IGA. The experience of GVT in IGA activities in Jada has been mixed.
• The experience of rope making and leaf plate making units goes to show that any IGA has to be introduced with great care. Just because people demand for a particular IGA is not a reason enough to support. Non-traditional

Jada Village
AN4-17
DFID / India: Western India Rainfed Farming Project / Final Report / October 2005
activities in particular have to be introduced with care and no IGA should be started without assessing its viability.
• Another aspect of IGA activities has been that these are entirely left to the initiative and ability of the person taking up the activity. There is absolutely no back up support provided by the project. For instance Maniben (who is also the health Jankaar) took a loan for a Grocery store but has no idea about the cost, sale and net profit. (For details please see Case 1). She has also been far behind in repayments. According to the previous CO they never ran the store activity as an IGA. In fact they left it to the initiative and skill of the borrower. However this researcher is of the view that this is not a good argument, especially since the idea of IGA is to also help in grounding viable IGAs. Repayment for such loans continues to be an area of concern. Since this money does not come from the savings of the group there does not appear to be a group pressure for timely repayment. According to the ex-CO of the village it was the responsibility of the Mahamandal to keep track of loans. They have not done so till now. It was agreed that they would now have to look into all outstanding loans.
• Major IGAs like the flourmill and the oil mill are mostly doing well but given the high initial cost of these assets these are not likely to get replaced once they run their life. What would be the way out is something GVT may want to work on.
• In case of diesel pump the members are happy with the intervention. While the ex-Co is confident that when the pump has run its life it can be replaced by the earnings of the group, this needs to be factored in upfront. It needs to be ascertained for every group if the group is earning enough to be able to replace the pump.
Community Assets
The community in Jada is greatly influenced by a religious sect whereby they do a lot of things as a group. This is seen in the way the Grain Bank has been functioning. There is a strong community feeling in this village. The community is very active and aware. There is leadership at different levels: at SHG level, as well as at Village level. This leadership is well connected with the Panchayat leadership. The mutual understanding among the leadership is good. This is the strength of the village.
Savings and Credit
• The 13 SHGs are fairly strong in an economic social and political sense. This is a major contribution of the project. However the remaining SHGs need more support. This support has to essentially come from the Jankaar of the group under the overall guidance of the GVS and if necessary the CO.
• At the time of the field visit almost 50 percent of the village had migrated. This year the Kharif crop has been badly affected due to excessive rains. Most of the people are in heavy debt to private moneylenders. As in case of

Jada Village
AN4-18
DFID / India: Western India Rainfed Farming Project / Final Report / October 2005
Kadwapada, here too many families have mortgaged their silver to the moneylenders.
• The other area that needs to be watched is the potential of the groups being captured by the more enterprising. There is the case of Kanubhai who has taken a loan on behalf of the group for Tent house. As explained in the case study the terms of contract with the group are not clear. It seems to this researcher that he has simply used the group to get access to this loan and the group too is not questioning his cornering the entire benefit. Of course the other side of the story is that Kanubhai is looked upon as a benevolent person who is always around to help people, so nobody is looking at this situation with suspicion. According to him, he plans to share part of the profit from this activity with the SHG. However as mentioned earlier the terms of this arrangement are not yet clear. What is going to be the gain to the 13 members is something only time will tell.
Employment Generation
Employment generation has happened mostly from the SWC and WRD works taken up under the project. However these works are almost over. The other area of employment generation has been of IGAs, However looked at in the context of the entire village this number is not very large. So while we cannot discount the impact of IGAs, we need to be alive to the fact that the reach of the same is rather limited. Given the marginal nature of agricultural land and the poor resource base and economy of the region, people are likely to continue to depend on migration income as an important source of livelihood. The MLSP programme has come in at a very appropriate time. The project needs to focus on how to make the labour move from being unskilled to skilled labour, how to improve its negotiation power and how to facilitate better terms in the labour market.
Migration Support
The CBA team did not look at this intervention but as mentioned above it is a very timely and appropriate intervention. The response of the community to the work in Dahod has been very encouraging. Village Jada has a very active MLSP center.

DFID / India: Western India Rainfed Farming Project / Final Report / October 2005
Kadwapada Village
AN5
Kadwapada Village
AN5-1
DFID / India: Western India Rainfed Farming Project / Final Report / October 2005
Kadwapada Village
AN5
Profile of Madhya Pradesh (MP)
Madhya Pradesh is a land locked State surrounded by the States of Uttar Pradesh, Rajasthan, Gujarat, Maharashtra and Chattisgarh. Madhya Pradesh came into existence in its present form on November 1, 2000 following its bifurcation to create a new State of Chattisgarh. The undivided Madhya Pradesh was founded on November 1, 1956. Madhya Pradesh is the second largest State of India with an area of 308,000 sq. kms. The bulk of the state lies in Central India bounded by the upper Gangetic plains in the north and the Godavari valley in the South, the plains of Gujarat in the west and Orissa and Chotanagpur plateau in Bihar to the east .The main hill ranges of the State are the Aravallis, the Vindhyas and the Satpuras. The climate is typically tropical with three distinct seasons (winter, summer, and monsoon).
MP is divided into 45 districts and 313 Development Blocks. The districts in the western and northwestern part of the state are considered to be susceptible to desertification. These regions also do not have good forest cover in comparison with the central and eastern part of the state. 28.01 percent of the land area is under forest and 49.01 percent is the net sown area. Out of the 14 major river systems of India, the state of M.P is drained by as many as four for example Ganga, Narmada, Tapti and the Mahi systems. The spread of canal irrigation in the state is limited. The rivers in M.P are mostly seasonal and rainfed. Most of them dry up before summer. As far as ground water is concerned while Malwa region has shown a sharp growth in ground water utilization, the development in Shajapur, Vidisha, Hoshangabad, Jhabua and Morena is low. The ground water development is directly linked to the economic capability of the people to invest in ground water structures. However excessive groundwater utilization has led to the problem of rapid depletion of ground water in the State. Most agriculture therefore continues to be rainfed and dry land agriculture. It is often said that the soil of Madhya Pradesh is not only thirsty but also hungry. Integrated management of nutrients is the only viable and possible option for sustainable output. The demographic pressures on land have been increasing significantly. Agriculture and its allied activities account for 35 percent of the GDP of the State. 75 percent of the rural workers are engaged in agriculture and allied activities. The labour productivity in agriculture is low and there is an urgent need to take people out of agriculture sector to manufacturing, transport, services and trading.
Almost 20 percent of the population of M.P consists of STs and 15.4 percent of SC. While the overall literacy is 64.11 percent, the rural literacy rates are low at 35.53 percent. The rural female literacy rate is just 19.17 percent. The sex ratio is 920.
In terms of per capita income, M.P is counted as one of the poorest States of the fourteen largest states of the country. It was ranked at eleventh position in 1996 to 1997 (Source: CSO; World Bank staff estimates). M.P continues to be bracketed as

Kadwapada Village
AN5-2
DFID / India: Western India Rainfed Farming Project / Final Report / October 2005
part of the BIMARU1/ states for example states that have ailing economies. Although it would be fair to say that the state has registered a faster rate of growth in the decade of 90s yet it has a long way to go before it can pull itself out of the BIMARU bracket. The head count ratio of rural poverty stood at 37.1 as compared to 40.6 in 1993 to 1994. It has the second highest HDI (Human Development index) among the BUIMARU states, the first being Rajasthan.
Profile of Jhabua District2/
In terms of the HDI Jahbua is ranked 43 out of the 45 districts in the State. Jhabua has 1313 villages, 612 Gram panchayats, eigh tehsils and 12 tribal blocks. The entire district is a Schedule V district with 85.7 percent of the population belonging to the ST groups. Sex ratio is 990 with rural sex ratio at 996. Rural literacy rate has increased from 13.7 percent in 1991 to 32.3 in 2001.
Agro climatically Jhabua forms part of the Malwa Plateau and the Jhabua hills. The soil is medium black. 90.6 percent (1991) of the population is engaged in the primary sector. The employment in farm sector has gone down from 90.4 percent to 87.23 percent employed in the farm sector. Interestingly the population involved in agriculture labour has gone up from 5.9 percent in 1991 to 13.9 percent in 2001. Overall agriculture and wage income continue to be the major source of livelihood in the district.
Profile of Kadwapada Village
Kadwapada village is located 36 km away from the project headquarter in Jhabua and 18 km from the Tehsil headquarter in Meghnagar. It is part of Thandla Block of Jhabua district of Madhya Pradesh. At the time of village entry Kadwapada consisted of 139 households spread into four Falias. Now the number of households has gone up to 190. The main caste groups belong to the Bhil sub-castes like Rawal, Neenama, Bhuria,Maliwad, Dhama and Dangi. The Church has been very active in this village. 75 percent of the village population is Christian. The local priest has a house in the village where he comes and stays occasionally. The Church has taken up several welfare and economic programmes like house construction for the poor, poultry, improved agriculture etc for the past 15 years.
1/ This set consists of Rajasthan, M.P, U.P, Orissa and Bihar. 2/ Source: MP Human Development Report, 2002.

Kadwapada Village
AN5-3
DFID / India: Western India Rainfed Farming Project / Final Report / October 2005
The Falia wise break up of HH is as follows:
Name of the Fala No. Of
HH
No. Of participating
HH Self
Sufficient PoorMedium
Poor Very Poor
% Of families migrating for
more than 6 mt
1 Sarpanch Falia 70 36 10 12 23 25 75
2 Tadvi Falia 20 19 2 6 3 8 50
3 Maal Falia 45 16 4 8 13 20 75
4 Dangi Falia 20 14 5 4 6 5 60
5 Talav Falia 15 0 2 2 4 7 85
6 Amliyar Falia 20 1 3 3 6 8 75
Total 190 86 26 35 55 73
At the time of village entry 139 86 5 15 30 54
Kadwapada is a fairly remote village with poor access to basic services. People have to walk a minimum of seven km to Thandla to access public transport, health facilities, Bank, post office and the market. The village can be accessed by a Kuccha fair-weather road and gets cut off during rains. According to the staff interviewed, it was considered to be a tough village from the point of access. There is a primary school in the village. The Church supports some children for further education.
People in Kadwapada are primarily dependent on agriculture and migration to meet their requirements. As is clear from the above table the extent of migration is significant. The land varies from good black cotton flat land to undulating, stony poor quality land. The total arable area is 62.76 ha. The average landholding in the village is two to three bigha. The main Kharif crops are Maize and cotton with some paddy, soyabean and Black gram. Wheat and chickpea are the main crops of the Rabi season.
Evolution of the GVT Intervention
WIRFP had been operational in the nearby villages of Palasiapada and Navatapra since Phase one (1992 to 1999) of the project.Jeethra Bhai of Kadwapada got tot see this work as his son-in-law lived in Palasiapada. He talked about the SWC and other works being done in this village with the other people in his village. Consequently when they got to know about the second phase of the project, they approached the CO with a request to start work in Kadwapada. A formal entry was made in March 2000. Building a rapport with the community was not a problem as the community was pretty aware and organised possibly because of the work of the Church and the efforts of Jeethra Bhai and Parsingh. However this did not mean that the going was easy. Some HH chose to stay away from the project, consequently an

Kadwapada Village
AN5-4
DFID / India: Western India Rainfed Farming Project / Final Report / October 2005
exposure visit was organised in April 2000. Several meetings were also held both in the village as well at the GVT office in Jhabua. Interestingly the HH that did not join the project in the initial stage (for example up to one year), continued to stay out of the GVT interventions right through the entire duration of the project. In case of Kadwapada two falias have been left out of the interventions. The people in these falias have relatively poorer agricultural lands (more rocky and undulating, the cotton crop showed poorer growth as compared to the main village). It is interesting to note that this falia was also the furthest from the main village. This researcher interviewed a few members of these falias’s. According to them some of them were interested in joining in and even came to the CO with money to start a SHG, but the majority were not. The CO asked them to try convincing at least 15 people as an SHG of five persons would not work. They were not able to do the same as people were suspecting the intentions of GVT. This was as a result of an earlier Government programme where people were served with recovery notices. Another group of people scattered across Falias did not join in since one of the brothers/ parent had joined the programme making the family eligible for SWC work, the land being held jointly.
The main problems identified by the community in the PRA were:
• scarcity of water for drinking and irrigation; • grain scarcity; • lack of housing; • fodder shortage; • soil erosion; • scarcity of wood for construction and fuel; • poor access to seeds and manure; • problem of health both human and animal; • lack of electricity; • lack of transportation, and • Illiteracy.
According to the GVT staff Kadwapada village was used as a training ground for the staff of GVT. As a result the sequencing of PRA, WBR and VWP development was a bit muddled. The WBR (report date: 12 September 2001) was done much after CPA (report date: 8 January 2001) and VWP (Report date: 2 June 2001). Further the WBR ranking was done for 86 out of the total HH strength of 139.3/ These 86 were the HH that got organised as SHGs.
Another problem unique to Kadwapada has been a very high turnover of the COs in the past year. Infact during the initial visit of the researcher and the second field visit the CO had changed. The CO who was present at the time of the first visit had been
3/ While Kadwapada may be a one off example where well being ranking was not used for developing the initial intervention strategy or targeting the work. In the other GVT villages visited by this researcher, while WBR was done as part of the initial baseline work it was not always used for planning the intervention strategy. Part of the reason probably was to do with the fact that the major part of the intervention was seen to be SWC and that was done on the lands of all the members. As far as IGAs were concerned they were encouraged among the enterprising and skilled persons. Another intervention where the poor have been reached is the MLSP programme but that is a very recent programme.

Kadwapada Village
AN5-5
DFID / India: Western India Rainfed Farming Project / Final Report / October 2005
there only for a couple of months. Fortunately the first two COs did stay much longer and the quality of work at that time was better. But there has been a lot of change in the past one year. This has surely affected the work in the village. Kadwapada is at present in the pre- withdrawal phase. A take over plan (TOP) has been prepared for the village. This was prepared in October 2002. Both the VWP and the TOP list a whole lot of activities and interventions people desire to make with the help of GVT. TOP is a compilation of activities that need to be undertaken in the withdrawal phase. A review was also done of the work done and a group assessment exercise was carried out to understand the status of the SHGs. The purposes of the TOP was to provide continuity in the work done under the project and prepare the community in managing the project on their own. On the whole it reads as an interesting document with lot of possibilities. The TOP had been prepared under the guidance of a CO who had been responsible for Kadwapada for almost three years. However with the change in the CO, the work did not proceed as expected. The subsequent COs has not been able to come to grips with the situation in the village. In short they have failed to ground the TOP. The question is that who is responsible to keep track of the state of implementation of the TOP? Or has the TOP become a mere administrative requirement with no pressure to actually get it off the ground?

Kadwapada Village
AN5-6
DFID / India: Western India Rainfed Farming Project / Final Report / October 2005
Activities at the village level4/
Component A Development Activities VOG (Village Organisation Development)
Self Help Groups
There are a total of six SHGs in Kadwapada. The group details are as follows:
Name of the group
Male/Female No. of members
No. of active members
Year of starting
Major activities
Comments
1 Sheetalamata Bachat Samooh
Female 18 12 2000 Flour Mill, diesel pump, chaff cutter, vegetable vending
6 members have stopped saving for more than a year
2 Dhartimata Bachat Samooh
Female 18 16 2001 Nursery, vegetable shop, new well
3 Hanuman Samooh
Male 14 11 2001 Not able to tackle the defaulters
4 Dukan Samooh
Male 14 6 2001 There has been conflict in the group and the group has collapsed
5 Bagaja Samooh
Female 11 11 2001 Nadep, goats
Poor repayment discipline
6 Ujala Samooh
Male 14 12 2001 Savings regular but poor repayment record since 2002
SHG 1: Sheetlamata Samooh
Of the 18 members in the group, six have stopped saving for the past year or more. Members save Rs 50 per month. The Jankaar does the collection between twentieth and twenty-fifth of every month. According to the Jankaar he has to make several
4/ As part of the validation exercise the social development specialist has focused mostly on VOG that is a part of component B for example, Development and only partially focussed on Component B called Dissemination for example the work in Prasaar villages.
Kadwapada Village
AN5-7
DFID / India: Western India Rainfed Farming Project / Final Report / October 2005
rounds for this purpose. Ramesh was made the Jankaar for the Flourmill. The group Jankaar Gabboo is also a member of this group. Another member Saka/Kodaria has taken a loan of Rs 4500 (for motor and pump) in December 2002. He has not repaid this money. Rasli Ganni had taken three loans earlier and repaid the same but the most recent loan of Rs. 2000 taken in August 2003 has not been repaid. The group has decided not to extend any further loans to her. Similarly there have been a large number of loans extended to members in this group for amounts ranging from Rs. 1500 to Rs. 3000 or even 5000. Usually people have taken loans for seed/fertilizer purchase, illness in the family, purchase of an asset or for social use like Notra, and marriage. The rotation of money in this group has been by far the best among the groups in this village. The applications for loan too have been prepared very systematically. However at the same time the dropping out of six members from the group is a cause for concern. There is also system of fines for non-deposit of savings or for non-repayment. The non-repayment of loans is something the group Jankaar is now keen to look into. According to the group Jankaar, they plan to hold a meeting in December after cotton harvest where the decision will be taken on cases of default and non- repayment.
SHG 2: Hanuman Samooh
This group has 14 members. Three members of this group took a loan of Rs 3000 and passed on the same to a third person (not a member) at a higher rate of interest. This person defaulted. The three persons have stopped saving. The group is very angry but is feeling helpless about dealing with this situation.
SHG 3: Dhartimata Samooh
This group started with 18 members. At the time of field visit 16 members were saving regularly. This is one of the better groups.
SHG 4: Ujala Samooh
The group had 14 members. But one member is dead. The rest are saving regularly. However the repayment has not been good for the past one year. One member has recently joined the SHG started by the missionaries. The amount of outstanding loans since 2002 is significant ranging from Rs. 1000 to Rs 5000. The group members are keen to streamline the repayments after this Rabi harvest.
SHG 5: Dukan Samooh
This group has members from two extended families. The total membership is 12. Of these only six are saving regularly. Repayment record is poor. Six members have left the group and have joined a group promoted by the Church. There is a lot of tension in the group. The group has collapsed for all practical purposes. Several members of this group are under a huge debt burden (ranging from 10000 to 40000 rupees) with the local moneylenders from whom people have taken loans after mortgaging their silver.
SHG 6: Bagaja Samooh
The Jankaar for this group had changed three times. Now Gabboo, the group Jankaar is writing the records. The group has 11 members. Of them 10 have been

Kadwapada Village
AN5-8
DFID / India: Western India Rainfed Farming Project / Final Report / October 2005
saving regularly but the group does not meet regularly. The one member who has stopped saving is from the very poor category.
Some general observations that could be made after the intensive interaction with these groups are:
• none of the groups have been meeting regularly for the past one-year. The meetings are not held on a fixed day and on a regular basis;
• savings are collected door to door by the Jankaar of the group. This however means that there is no peer pressure on members who do not save or repay the outstanding loans. This is not healthy for the long-term sustainability of the group;
• the group records are not up to date. Especially the individual passbooks have not been filled for a long time for many of the groups;
• meetings are usually held;
• when some resolution has to be passed (for carrying out an activity, for appointment of a Jankaar);
• a request has to be made to GVT for some support (for forwarding a grant or loan application);
• a decision on giving a loan from the SHG funds has to be made, and
• the CO has to share some information.
These meetings usually take place once in two to three months for a particular group.
• The meetings details report tabulates the total no of meetings held in a month and the total number of people who attended these meetings. The concerned CO of the village compiles these reports. While the format also has the attendance according to well being category, it is usually left balk. The column for comments is also left blank. It appears that the filling up of these formats is really a formality and the data is not really used for any analysis except to compile broad information on the total number of meetings held and the total number of people who attended these meetings. It is also not possible to track who and how many people have stopped saving. This information is only available at the group level with the concerned Jankaar who maintains the primary record of the group.
• The focus of the COs has been on implementing the activities rather than in strengthening the SHGs. From the discussions with the staff this researcher concluded that strengthening the SHGs per say was not really part of their brief. Their brief was to organise the SHGs in order to implement the project activities that were mainly around SWC and WRD. SHGs were in a sense used in an instrumental sense to organise the community. In the words of one GVT staff, “if an SHG turned out to be functioning as a proper SHG then it was not because of a conscious effort of the programme”. This researcher

Kadwapada Village
AN5-9
DFID / India: Western India Rainfed Farming Project / Final Report / October 2005
would interpret this statement slightly differently; that wherever the SHGs were functioning well it was due to the individual initiative of the concerned CO or good leadership within the group. This was not really mandated by the project. What was mandated by the project was the implementation of the project components for example, SWC, WRD, distribution of assets like agricultural implements, small assets and promotion of a few IGAs among the interested people. Unfortunately this has meant that wherever the groups are not strong there is every chance of the activities not sustaining beyond the life of the project.
Income Generating Activities (IGA)
Where GVT makes a grant to the group (Minor IGA):
Case I: Vegetable Trading
Sena /Martin of Sheetalamata Samooh,took a loan of Rs 5000 for vegetable trading. Sena’s husband Martin manages this activity. Sena was busy in the fields so this researcher got to talk to Martin. He is functioning as a petty vegetable trader. He attends two to three weekly haats in the neighbouring villages. According to him he buys Rs. 400-500 worth of vegetables for each haat and ends up making a net profit of Rs. 50-60 per haat. This is the first time he has taken up this activity. From the minutes of the meeting register it emerges that it had been decided that he would be paying an interest of two percent and a lump sum payment of Rs. 100 per month. He got this loan in 2002. He has repaid Rs. 1300 till now. He is not aware of the interest that he has to pay. It is not clear to him or to the group whether the Rs. 100 he has to repay every month also includes interest. If it does then it should be calculated on a reducing balance. However these details have not been worked out. Martin is willing to pay interest as well if others too pay. There is also no clarity of the duration of this loan. The group members too were not clear about the terms of the loan.
Case 2: Carpentry
Aryat/ Hursingh of Seetlamata Samooh took a loan of Rs 3000 for Carpentry. Aryat got this loan in 2002. Aryut’s husband is a carpenter and she borrowed this money so that he could buy some more tools. In this case too a flat payment of Rs. 100 has been fixed. As in case of Martin there is confusion regarding interest payment and duration of loan. As far as latter is concerned there does not seem to be any pressure from the group for repayment, possibly because it is money that has come from GVT and not from the savings of the group. Aryat has repaid Rs. 800 till now. Aryat was busy in the field therefore this researcher met her huband Hursingh. On being questioned as to when they plan to repay the loan, his response was that they would repay after the harvest in February. He too agreed to pay the interest as well if the others too pay.
Where GVT provides the asset as a grant to the members of the SHG (Minor IGA)
Case 3: Maize Thresher
A Maize thresher was given to Hanuman Samooh. The contribution was Rs. 5000. The group appointed Dudha as the Jankaar. But the thresher was not used as

Kadwapada Village
AN5-10
DFID / India: Western India Rainfed Farming Project / Final Report / October 2005
moving it around from where Dudha lived was a problem. Therefore Hanuman Samooh in consultation with the Dhartimata Samooh decided to transfer the Maize thresher to Dhartimata Samooh. It was agreed that Dhartimata Samooh would pay a contribution of Rs 5000 to Hanuman Samooh. The thresher has been used in this season. Repairs were done. Shaitani bai has been appointed as the Jankaar. She had to spend Rs.7000 in repairs. The terms of arrangement have not been finalized as of now. Shaitani has been using the thresher and the pump for personal use only.
Case 4: Hand Cart
Seetlamata Samooh was given a handcart. A rent of Rs five was fixed for its use but this is not usually charged. Only members of Seetlamata use the handcart. Five groups have a handcart each. Since no money is being charged for its use it is not clear who will bear the cost of maintenance of such group assets.
Case 5: Honda Pump
The Honda pump given to Ujala Samooh had been functioning well in the last season. The Jankaar had deposited a total of Rs. 3000 from the earnings of the pump. However the pump had to be sent in for repair in this season. Martin, the pump Jankaar was complaining to this researcher that the Ujala group is not releasing the money for repair telling martin to spend the money from his pocket. The reason appears to be the fact that six members of the group have their own pumps so they are not concerned. The entire village used to benefit. There was a conflict in this group. Five members of this group have bought a new diesel pump and now they are not concerned about this pump. Hey are not interested in co-operating with the Jankaar. The Jankaar was sharing this state of affairs with this researcher when she made a follow-up visit in the month of November. There a clear need to resolve this conflict otherwise this activity will not sustain. This may even lead to a collapse of the group.
Case 6: Chaff Cutter
Kalla of Dukan Samooh was made the Jankaar for the Chaff cutter. However the Chaff cutter has not been used.
Case 7: Bullock Cart
Martin got a loan of Rs.13900 on 29 February 2004 to purchase a bullock cart. He made a contribution of Rs.3000. It was agreed that he would deposit Rs.100 per month with the group. However Martin has not deposited anything till now. On being questioned as to when he intends to pay he informed the researcher that he plans to do so after the soybean harvest. In his case too there does not seem to be any group pressure for repayment.
Individually Managed Assets Through SHGs (Major IGA)
Case 8: Flour Mill
Ramesh, husband of Hukli of Seetlamata Samooh was made the Jankaar for the flourmill. The flourmill was installed in April 2002. It functioned well for sometime but has not been functioning for the past five months. This has become a bit of a conflict
Kadwapada Village
AN5-11
DFID / India: Western India Rainfed Farming Project / Final Report / October 2005
issue in the village as the villagers are keen to have a functioning flour mill as they have to walk quite a distance to Sajeli or Thandla to get their grain ground. However Ramensh has been asking the group to pay the money for repair, something the group is not ready to do as they feel that repair is his responsibility. There was a suggestion that if Ramesh was not willing to repair the mill it could be transferred to another willing person. However Ramesh has not been agreeing to this as well. All in all there has been a deadlock for all these months and no solution seems to be emerging. Incidentally the group fixed a rent of Rs. 100 per month. Ramesh did deposit this amount when the mill was functional but has stopped since the mill broke down.
Case 9: Multicrop Thresher
Bahadur of Dokan. Samooh got the multicrop thresher two years back. The cost was Rs. 40000. While Bahadur and Victor have maintained some record, the group was not aware of the same. According to Bahadur he has spent Rs. 500 on the repair of the thresher. The thresher has been used. According to the Jankaar he is not able to earn much therefore he is not paying any money to the group. He has not deposited any money with the group in the past two years. While the thresher is in working condition it has not been used as it breaks down frequently. It is not turning out to be a viable implement.

Kadwapada Village
AN5-12
DFID / India: Western India Rainfed Farming Project / Final Report / October 2005
IGA/Assets/
service provider
No of persons
Successful Possibly successful
Unlikely Failure Comment
1 Carpentry 2 Yes
2 Vegetable Trading
1 Yes
3 Goatry 2 groups Yes Jamnapari failed, Sirohi successful
4 Diesel Engine 2 1
Functioning
1 has to be repaired
5 Kirana Shop 2 1 1
6 Flour Mill 1 Yes Ramesh willing to repair this
7 Maize Thresher
1 Yes Has just been transferred to Dharti mata will have to take a decision in the next meeting
8 Multicrop Thresher
1 Yes
9 Chaff Cutter 2 Yes Not fitted may be people do not want it
From the above cases the following can be concluded:
• the terms of payment are not clear to any of the borrowers;
• the lump-sum payment fixed has been paid very erratically;
• there is no group pressure on the borrowers to repay the IG loans that were extended by GVT through the SHGs. The idea of these loans was to make a revolving fund available to the groups so that many more people could take up some income enhancing activities. However since the repayments have been erratic that objective is still far from getting realised;
• many of the assets are either being used only as personal assets or are gradually breaking down and not getting maintained;
• while some individual IGA are continuing but in these cases too repayment is not regular, and
• all in all it appears that unless some effort is put in resolving conflict and setting up a working institutional mechanism for maintenance of assets they

Kadwapada Village
AN5-13
DFID / India: Western India Rainfed Farming Project / Final Report / October 2005
will not sustain. Interestingly the TOP was made precisely for this purpose. Each major activity was to be overseen by a Nigrani samiti. The plan also spelt out the names of the persons responsible for each activity.
Forestry (JFM, Fruit trees, Nurseries, orchard development, grafting and budding, medicinal plants cultivation, CPR development)
This researcher did not get to see much of the work done under this head. The work done has been primarily that of distributing saplings, orchard development. The project sanctioned a nursery of Eucalyptus plants in December 2003 and another one of 5000 plants consisting of Guava, Bamboo, Papaya, aonla, Custard apple and Kaju plants in 2004 to Huka/Prakash of Dhartimaata Samooh. There are two active JFM Samitis but these were started independent of the GVT intervention.
Social Development Interventions
The ball bearings for chakkis (Gatti) were not installed by anyone, as people in this village prefer to use the flourmill. When the flourmill was functional people got great relief from the trouble of walking to Thandla or Sejali to get their grain ground. The maize Shellers have been used for seed extraction. The Health Jankar system collapsed two years ago, as the person selected was not able to run the activity well. He failed to deposit the money for the health kit. People usually go to Thandla for treatment. The average expense of a family in a year comes up to Rs. 1000- 2000. There are two persons who provide traditional medicine. They were given further training and exposure by the project. They continue to treat people who seek treatment.
Paravet Jankaar has been catering to the needs of the people only in his falia. He got training three years ago. This comprised of a day long training every month for three years. He used to get guidance from the Vetinary doctor employed by the project, however the Vet has left the project as a result his training could not be completed. The paravet Jankaar charges a fee of Rs.10 and makes an average earning of Rs. 150-200 per month. The first CO of Kadwapada started a Grain Bank in the year 2000 with 16 Quintals of grain. All the 86 HH got grain and returned the same in the agreed quantities in the first round. The grain bank continued to function for one more round but stopped after that. According to people interviewed it was mainly because of drought. They are now keen to revive the grain bank. Smokeless chulhas were also introduced but due to faulty construction they tended to use too much fuel. Around five chulhas are functioning. The use of smokeless chulhas has not been scaled up.
Crop Technology (crop trials, seed distribution, cropping practices, agriculture implements, compost pits, drip irrigation, PVS/PTD)
This researcher did not study this component in great detail, as the focus was to understand the institution of SHG. However from the conversations with the people we gathered that a Spray Machine was given to each of the SHGs. People have been using these. People could also get agricultural implements like ploughs, spray tanks by making a 50 percent cost contribution.

Kadwapada Village
AN5-14
DFID / India: Western India Rainfed Farming Project / Final Report / October 2005
SWC
This was the most attractive of interventions and all the members of the SHGs benefited from this.
WRD
The project made funds available for wells for drinking water for cattle and humans. Ownership of these wells is with the group. Shaitani of Dharti mata Samooh got a new pucca well on her patch of land in December 2003. The water is to be used for irrigation as well as for drinking purposes. The total cost of the well was Rs.37000. A check dam was constructed for irrigation. This has benefited 15 members.
Livestock (Breed improvement of cattle, poultry, goats)
Goats and birds were distributed by the project. Some people have been able to go through a few cycles of profit in Goats. However the experience in poultry has not been good. In either of the cases the role of GVT was limited to distribution of goats and poultry on a contribution basis. The health Jankaar was also provided training and he made his services available to members of one Falia. These activities were not pursued in an intensive manner.
Component B Dissemination (Prasaar Villages)
Interestingly the ex-CO of Kadwapada maintained that the work in the Prasaar villages was not part of his beat. This was not the view of the CO of Jada village in Gujarat. Another confusion regarding Prasaar villages is that while we were initially told that these are essentially a cluster of villages around a core village. The subsequent interactions in Kadwapada and other core villages revealed that this might not always be the case. It is not as if the Prasaar villages depend on the core village for any support. As far as the Prasaar villages around Kadwapada are concerned this researcher met the MLSP workers of some of these villages. According to them they have not seen the Prasaar Jankaar functioning in their villages of Talawali, Unnikhali and Pawagoibadi. The Prasaar work seems to be on a low key in this area. However a deeper study would be fair to arrive at a definitive conclusion.
Future Scenario
One of the objectives of the project in the withdrawal phase is to help establish direct linkages of the community with the line department. In order to achieve this meetings have been held with the representatives of the community. However according to the people interviewed they have always had to rely on GVT to get any line department functionary to come to the village. Basically the staff has to be ferried to and from the village, they do not come on their own.
An attempt was made to federate the SHGs in to a Federation. The idea being that it could then gradually take over the supervision and maintenance of interventions made by the programme. GVT was also successful in getting a linkage established with the MP agro Industries Corporation for the Federation to deal in seeds and fertilizers. However the federation did not take off due to group conflict.

Kadwapada Village
AN5-15
DFID / India: Western India Rainfed Farming Project / Final Report / October 2005
Summary and Analysis
Institutions
One clear gap this researcher found in the whole effort is in the approach of GVTs’ work. The approach revolves around activities and technology. The emphasis is not on institution building or empowerment. As a result the communities have developed an attitude of dependency. It will be unfair to blame GVT entirely for this situation. The Missionaries have been active in this area for almost a decade and a half. Almost 75 percent of the HH are Christians. The Church has been doling out several benefits to them- building houses, distributing chicks, goats, seeds, and educating the children in their hostels. According to GVT staff, because of the heavy presence of church and a large Christian population, this village does not represent a typical GVT village of Jhabua district. Unfortunately this information became available to the researcher almost after two days of fieldwork; also it was part of the sample selected. However this researcher believes that several lessons that are emerging from this village remain valid and have a learning value.
As mentioned earlier an attempt was made by the project to create a Federation of SHGs However this had to be closed down due to too many conflicts within the groups. One of the areas of conflict has been religion. Only two of the six SHGs are of Hindus while the rest are Christians.
The SHGs too are not really functioning very well. While people did agree that they need to address the various issues, unless that happens these institutions are not likely to last beyond the life of the project.
Management Process
Decision-Making
The experience in Kadwapada has been mixed. While in two of the SHGs the decision making process is fairly transparent. In at least one there are several reasons to believe that some group members have felt alienated. As a result that group has almost collapsed. In another instance where the Jankaar is not able to get money released for the repair of Honda pump due to some members not being interested, there does not appear to be a mechanism by which this issue could be raised and discussed in the group. The groups do not have a monthly meeting and the Jankaar has not been able to convince the members to meet. The Jankaar has been looking up to the GVT staff to help resolve this issue.
Responsibility for Assets
In principal the responsibility for the maintenance of assets lies with the User group or the concerned Jankaar who is supposed to get the money from the group. This money is essentially the fund that the use of that asset helps generate in the form of rental/ usage fee. In practice this system has not worked for the Honda pump and the flourmill. In case of the multicrop thresher the asset has not been used. The maize thresher was recently transferred from one SHG to another. The repairs had to be done the individual Jankaar with her own money.

Kadwapada Village
AN5-16
DFID / India: Western India Rainfed Farming Project / Final Report / October 2005
Maintenance of Information
Identical systems of information maintenance are followed in GVT. These have been explained elsewhere. The only observation we would like to make is that we noticed that the formats developed for the monthly report of the CO are often incomplete. It also appears that they are used to fulfil an administrative requirement and not really to improve the work.
Inclusion and Targeting
Village Selection
As described this village got included at the request of a few members of the community who saw the work in the neighbouring Phase I village. However the researchers were wondering why this village was taken up if the Church was already doing so much work in the village.
Activity Inclusion
The members of two falias who did not join in have remained out of the project. As far as the members are concerned, all benefited from the SWC work. As in other villages IGAs were limited to a few more enterprising persons. There were some complaints from members of one group (the one that has almost collapsed) that the project was partial to some in the distribution of goats and poultry. However the team was not able to verify these observations. The situation in this village is complicated due to religion and presence of the Church.
Repayment Regimes
The repayment regimes are uniformly poor in this village. While drought has been offered as a reason for poor repayment record this is not a very convincing argument. Drought affected the entire region and it needs to be deliberated as to why the SHGs in other areas have shown better repayment discipline.
Stakes
SWC, WRD, Crops
This is one intervention that has got a uniformly positive response from the community. This is partly to do with the nature of intervention with a wage component in it and with land improvement and water resources development.
IGA
Very few IGAs have been taken up in this village. The experience has been mixed. As mentioned elsewhere with no business plan in place it is not clear whether these will eventually turn out to be viable and sustainable.
Community Assets
Not many community assets have been created in Kadwapada. Interestingly the community has demonstrated the ability to maintain CPRs by successfully managing

Kadwapada Village
AN5-17
DFID / India: Western India Rainfed Farming Project / Final Report / October 2005
the JFM programme as well as fisheries co-operative. However GVT did not have a role in either of these.
Savings and Credit
Interestingly GVT has not visualised these SHGs as savings and credit groups. These groups were essentially created for the implementation of interventions in order to be eligible for any GVT intervention a HH had to be a member of an SHG. Savings and credit has been an incidental fallout of the primary interventions like SWC, and WRD. Where there was a component of wage, part of that got saved due to a formula followed by GVT (two percent to go into group account and three percent as individuals savings in the group). An amount has also been fixed by each group as the monthly savings. However regular meetings are a thing of past. Meetings only happen if there is a need to take a decision regarding a loan application from the group or for forwarding a request to GVT. The group Jankaar makes a door-to-door collection of the monthly savings from each member- there are members who have not been saving regularly in some cases for more than a year. Some members have even crossed over and joined the SHG promoted by the Church and have become inactive in the GVT promoted group. The problem is that some of the inactive members have also defaulted on the loans that have taken from the SHG. As far as repayment of loans is concerned this is an area concern for almost all the groups.
This region has seen a good crop only in the past two years. Before that there were four years of continuous drought. The situation of drought has put most households in heavy debt with the private moneylenders. Apart from cash they owe to the ML, they have pawned their silver (locally called Rakam, that is seen as the most liquid and valuable asset) 500 gms to three kilograms) and there is no hope for the silver to get recovered. Basically people find themselves in a very vulnerable situation with nothing to fall back upon. In such a scenario it is quite difficult to expect SHGs to function well. Now there is talk that people will repay with the cotton crop. But given the collapse in-group discipline issues like whom will they repay first- the SHG or the ML need to be looked into. Possibly people will prefer to first pay the ML as they need the silver for the marriages in the coming season? This is an issue that needs to be looked into and a strategy worked out.
On the whole the SHGs have to be looked at carefully and supported if they have to sustain beyond the life of the project. Till now the CO had been under pressure to implement hardcore interventions. Very little time was devoted to institution building. Now in the withdrawal phase the stress has to be on focussing on institutions.
Employment Generation
As in other villages employment generation has remained mostly confined to SWC and WRD work. The few IGAs will generate some employment but that will be limited to a few individuals. It is too early to comment on the viability and sustainability of these interventions, as they have not been approached as businesses.

Kadwapada Village
AN5-18
DFID / India: Western India Rainfed Farming Project / Final Report / October 2005
Migration Support (wage labour support programme.)
This village has an MLSP center with a functional telephone and support services. The MLSP center is fairly active. It has got very good response from Kadwapada as well as the surrounding villages.

DFID / India: Western India Rainfed Farming Project / Final Report / October 2005
Gara Village
AN6

Gara Village
AN6-1
DFID / India: Western India Rainfed Farming Project / Final Report / October 2005
Gara Village
AN6
Profile of Banswara District
Banswara district is surrounded by the Aravali mountain range. It lays in the southern most part of Rajasthan. It is surrounded by Udaipur and Chittorgarh in the North, Dungarpur in the west, Ratlam and Jhabua districts of Madhya Pradesh in the east and south respectively.
The district is divided into two sub-divisions, viz., Banswara and Kushalgarh. There are a total of five tehsils and eight blocks. There are 1522 revenue villages in 325-gram panchayats. The population of Banswara district is 15,00,420. This is 2.66 percent of the total population of the State. 73.47 percent of the population belongs to Bhil and Meena scheduled tribes (ST) and about five percent population is of various castes of scheduled castes (SC). Literacy rates are low at 26 percent. . Banswara ranks 30 amongst the 32 districts in terms of the human development indicators.
The district has a climate that is very much milder than that in the desert regions in further north and northwest. It is the highest rainfall district of Rajasthan. The average rainfall is 96.07 cm. However during the year 1999, 2000, 2001 the rainfall was much below average at 64.94 cm, 49.10 cm, and 64.40 cm. Consequently, the district suffered from drought for these years. Agriculture is the backbone of the economy of this district. It provides partial or full time employment to 80 percent of the population.
Mahi is the major river of Banswara. It separates the district from Dungarpur district. The Anas, Chap, Hiran, Erav are the other important rivers of the district. There are several lift irrigation systems along the Banks of Mahi River. The completion of Mahi Bajaj Sagar Pariyojana brought most parts of Talwara, Garhi, Bagidora and Ghatol blocks under its command area. The irrigation facilities created by this project have encouraged people to adopt new techniques of agriculture. They are now able to grow wheat, rice, soybean and cotton. But in the non-command areas the cultivation of maize, pulses, and other rain fed crops is the only option left to the farmers. The recurrent drought of the last four years has further aggravated their problems. It may be noted that the GVT project villages fall outside the command area, are poorer and more deprived villages in all senses of the word.
Profile of Gara village
Gara is one of the very remote villages covered by GVT in Banswara District. It is a good 60 km from Banswara, the Project headquarter and 32 km from Bagidora where the CO is based. The road from Banswara to Bagidora is mostly metalled and in a reasonable shape. However the road from Bagidora is only partly metalled and is in a very bad shape. It takes a good two hours of travel time from Banswara to Gara and of that an hour and quarter from Bagidora to Gara. The village is also not

Gara Village
AN6-2
DFID / India: Western India Rainfed Farming Project / Final Report / October 2005
well serviced by motor transport. The nearest bus point is nine kms walk from the village. Interestingly the village was not electrified at the time of village entry. Now it is electrified but the electricity supply is erratic. The nearest PHC, Bank is in Shergarh (nine km). The village has a Shiksha Karmi Vidhyalaya till class five. Children from class six to eight have to go to Tandi nanai GP that is five k.m. From Gara. Only two children have pursued studies beyond eighth for which they have to go to Bagidora/Kalinjara in the Adiwasi Hostel. All in all this is a poorly serviced village. From the discussions with the GVT staff and village community it is clear that till GVT selected this village it had been completely neglected by the Government machinery.
This is a fairly old settlement. According to the PRA report, the village was settled almost 200 years ago. The village consists of 116 households. A large majority of these (86) belong to the Bhil Garasia Caste. The rest are also sub-castes of the Bhil caste like Machar, Damor, Ad, Keet, Bhabor, Singhara. The village is divided into five Falias (hamlets). These are:
• bhagat Fala; • mata Fala; • kasala Fala; • patel Fala, and • maal Fala.
Of the 116 HH, 104 have got organized into SHGs and have benefited from the efforts of GVT. The 12 remaining HH are mostly from Maal Fala and they have not joined in due to a previous bad experience with the SWC undertaken under a Government programme (in 1978 to1979) where they were served recovery notices much after the work was over. They also suspect GVT of being linked to the missionaries whereby they would force conversions to Christianity. There is also some old time conflict of this group of families with the rest of the village. So there is a mix of factors that has resulted in their non-participation.
Agriculture accounts for 60 to 75 percent of the income of the people. The average land holding is two bigha.1/ The quality of land is generally poor. It is undulating, stony and mostly rainfed. This is a largely monocrop area with maize as the main crop. Most families are able to grow food for three to four months and for the rest they have to turn to wage labour. They meet the deficit by migrating and working as casual labour in cities like Ahmedabad, Baroda, Surat, Bhuj, and Kutch. Almost 75 to 80 percent of the families migrate from one to four months a year. At the time of village entry only 10 percent of the HH had skilled labour, now this has gone up to 15 percent. As of now there are 25 skilled labourers, mostly masons, in the village. They earn about Rs. 160 per day when they migrate while the unskilled casual labour earns only in the range of Rs.50-60 per day. The local wage rate is Rs. 40. However there are very few local labour opportunities.
1/ 6.25 bigha= 1 hectare.

Gara Village
AN6-3
DFID / India: Western India Rainfed Farming Project / Final Report / October 2005
At the time of village entry the community problem analysis had revealed the following problems:
• soil erosion; • shortage/non-availability of safe drinking water; • lack of food security; • lack of health facilities both for human as well as animal; • no electricity; • no flour mill; • lack of employment; • lack of transport; • lack of irrigation; • housing for the very poor; • malnutrition among children; • no school; and • pest management. Evolution of the GVT Intervention
The village entry was made in 2000. According to the present CO who was the CO at the time of village entry as well, it took him six months to win the confidence of the community. After that the community has been very co-operative except a group of some 12 households who have not joined in. Interestingly unlike some other GVT villages where the number of participating households has remained static from the time of PRA to the later years- in Gara the number of participating HH has increased from 40 to 80 (beginning of 2003) to 1042/ over the past five years. The usual sequence of village entry and rapport building, PRA, followed by CPA and VWP, prioritisation of development options, implementation, review PRA and withdrawal has been followed. At present Gara is in the implementation phase. The GVS (Gram Vikas Samiti) has been formed in preparation of the withdrawal phase.
2/ This includes the sons who have got married and made a separate chulha. The landholdings have
therefore remained unchanged.

Gara Village
AN6-4
DFID / India: Western India Rainfed Farming Project / Final Report / October 2005
Interventions at the Village Level;3/ Component A: Development Activities; VOG (Village Organisation Development)
Self Help Groups
There are 10 SHGs functioning in the village. These are:
Name of the group
Male/ Female
No. of member
Year of starting
Major activities Comments
1 Mata Fala
Samooh
Male 17 2001 Diesel pump, Lift irrigation (13 members)
Diesel pump cornered by one family, LI not yet functional
2 Bhagat Fala Samooh
Male 18 2001 Lift Irrigation (17 members), Thresher, Breed improvement
No business plan for the thresher, LI not functional yet
3 Kasala Phala Samooh
Male 18 2001 Grain Bank, Diesel pump, grain bank, goatry, Lift Irrigation (3 members)
Grain Bank functioning well, Diesel pump has been a disaster, Li not yet functional
4 Mata Fala Mahila Samooh
Female 17 2002 Grain Bank, Tent house
Grain Bank functional, Tent house functional but due to some social conflict the returns to the group less than agreed
5 Bhagat Fala Mahila Samooh
Female 17 2002 Grain Bank, sewing machine
Grain Bank functional, still getting training for sewing
6 Patel Fala Samooh
Male 20 2003 Flour mill, grain bank, poultry
Flour mill, grain Bank functional, Poultry successful for breed improvement
7 Maal Fala Samooh
Male 16 2003 Conflict in the group, they have stopped saving
8 Dhuni Fala Samooh
Male 16 2004 2 months old at the time of field visit
9 Dhuni Fala Samooh
Female 12 2004 2 months old
10 Bajarang Dal Swayam Sahayata Samooh
Mixed 12 2004 2 months old
3/ As part of the validation exercise the social development specialist has focused mostly on VOG that is a
part of component B for example, Development and only partially on Component B called Dissemination for example, the work in Prasaar villages.

Gara Village
AN6-5
DFID / India: Western India Rainfed Farming Project / Final Report / October 2005
The CBA research team covered seven of the SHGs in detail. The social development person had extensive meetings with the members of five SHGs. The following observations could be made for all the five groups:
• All groups meet regularly twice a month. Once before fifteenth when the savings are collected and second time before the thirtieth.
• Members of all the groups are by and large saving regularly.
• However there is no system of fines or of ensuring that if a member has not saved then he or she has to deposit that amount at a later date. The records show this gap.
• The group records are up to date. The records are maintained by the group Jankaar.
• Very few loans have been advanced by the groups-the reason according to the members is the wage income coming in from the SWC and WRD works. Most people have been able to meet up their requirements from the wage income. They have also been able to get their mortgaged silver back from the moneylenders.
• However there have been cases of borrowings from the moneylenders for marriage purchase of bullock and other purposes. In these cases people have mortgaged their silver to access the loan. According to members of Kasala Fala Samooh almost all the people of the village have mortgaged 500gms to two Kgs of silver with the moneylenders to access credit. This needs to look into, as there is a lot of idle cash with the groups. In fact there have been very few loans advanced from the SHGs in this village. So while people do need credit, they are accessing it from the moneylenders and not the SHGs.
• Interestingly the arrangement with the moneylenders seems to be ongoing and people appear to be comfortable in these traditional arrangements.
There has been a recent attempt at federating the SHGs into a federation for each village called the Gram Vikas Samiti (GVS). This is expected to represent the interest of the community at the Block and district levels and act as a larger platform. However since the GVS is still in the process of getting formed it was not covered in the study.
IGA
Where GVT makes a grant to the group (Minor IGA):
Here the SHG on-lends to the individual member. The money that comes back to the group in the form of interest and principal repayment becomes part of the revolving fund of the group. In Gara very few loans have been made under this arrangement. There are five sewing machines, one carpentry loan and two diesel pumps. The experience has been as follows:

Gara Village
AN6-6
DFID / India: Western India Rainfed Farming Project / Final Report / October 2005
Case 1: Sewing Machines
Five sewing machines were given to five women in 2002. Of the five women two are getting trained in Bagidora. GVT is paying for this training (at 1200 rupees). The family is bearing the cost of living. It is likely to be a three-month training. The other three women are not able to mobilize resources to stay in Bagidora hence they have not been able to get the training. GVT is trying to work out a training arrangement in Shergarh. The principal and interest for the loan will be fixed once the activity starts. According to the CO the group will take the decision once the women complete the training and start their business.
Case 2: Carpentry Loan
Natha Sapa of Mata Fala Samooh got Rs3600 as a loan in 2003. He got this loan to purchase tools. He has been depositing Rs.100 per month with the SHG. So far he has repaid Rs. 600. He has been able generate good business in the village. His income has gone up from 800-900 rupees per month (for eight to nine months a year) to 1800-2000. He gets work from the surrounding villages as well. While his repayment has not been regular the group is monitoring this closely. The group members are confident of recovering the entire amount.
Where GVT provides the asset as a grant to the SHG Members (Minor IGA) No examples in Gara
Individually managed assets through SHGs (Major IGA)
Where individual member gives a rent to the SHG and also makes a contribution towards the purchase of the asset. The asset belongs to the SHG but the individual ‘Jankaar” takes the responsibility of managing, maintaining and renting out this asset on behalf of the SHG (Multicrop Thresher, Maize Thresher, Bullock Cart, Hand Cart, Chaff cutter, Flour Mill, Honda pump)
Case 3: Flour Mill
The mill was given to Patel Fala Samooh in March 2004. It cost Rs.32000. Birji Kalji is the Jankaar for the flourmill. The community made the house for the mill. The cost of Rs.15000 entirely came as contribution of the group members. Rs. 150 per member was collected as a contribution for this purpose. The mill has been functioning well. The Mill broke down in July 2004. The Jankaar had to spend Rs. 9000 for repair. He took a loan of Rs. 5000 from a SHG in village Bakaner at two percent. He mobilized the rest of the money on his own. The group has decided that till he recovers this amount he need not deposit any money in the group fund. This is likely to take 10-12 months. After that he is expected to deposit 60 percent of the earnings with the group.
It may be noted that 45 HH from three falas (Kasala, Maal and Patel) have benefited from this mill. They now have to travel far les to get their grain ground.
Case 4: Maize Thresher
The maize thresher was given to Ramji Jokha of Bhagat Fala Samooh on 29 September 2003. The cost of the thresher was Rs. 36000. Ramji gave a 10 percent

Gara Village
AN6-7
DFID / India: Western India Rainfed Farming Project / Final Report / October 2005
contribution of Rs. 3600. The thresher has speeded up the task of threshing. It also costs far less than threshing done using labour. According to the people interviewed the thresher is able to tackle five quintals of maize in six minutes and costs Rs. 50. While the same quantity would take a full day for five to six people at Rs 50 as wage rate for example, the cost of manual threshing would work out to Rs. 300. There is a significant labour and cost saving with the maize thresher. GVT has distributed 22 such threshers in its project villages. However the thresher has not yet been used in a commercial sense. There is no business plan in place as yet. Questions like in how many years will they earn enough to replace the machine, what is generally the life of the machine, what volume of business they will have to have in order to make it a viable and sustainable intervention etc have not been looked into. The group members did agree that there was need to develop a business plan at the earliest.
Case 5: Diesel pumps
One five HP pump was given to the Kaasla Fala Samooh on 22 February 2002. The cost of the pump was Rs. 17000. Here the group started with a group contribution of Rs. 25 per month. The group contribution was reduced to Rs. 20 in the second month and then on to Rs. five for a few months after which the group contribution was completely stopped. The reason for this was the fact that only five members of the group were really using the pump. The group had arranged that the pump Jankaar would charge Rs. 40 per hour of the pump operation and deposit 30 rupees per hour of the pump usage in the group account. However by and by the Jankaar stopped depositing the money for usage in the group as according to him the money got used up in the repair and maintenance of the pump. To add another twist to this story the CO informed this researcher that the water pump was sold off by the five people for Rs. 10000. However this information came back to the group. The CO called a meeting and the group decided to get the pump back. It also decided to make the five persons using the pump to pay the group as agreed initially. However this has not yet started.
Bharatlal of Mata Fala Samooh was made the pump Jankaar for the pump given to this group in September 2003.The cost of the pump and pipe was Rs. 22475. The contribution deposited by the Jankaar was Rs. 1500. Since Bharatlal had his own personal pump, he rented out the group pump to three persons. The terms of payment were Rs. 40 per hour where the Jankaar would get Rs. 10 and Rs. 30 would get deposited in the group account. However the records for the pump usage are incomplete. The payment received by the group also is much less. The people who have used the pump owe money to the group for example, Mohan (Rs. 300), Samsu (Rs. 400) and Kalu (RS. 200). There does not appear to be any pressure on them from the group to pay this amount.
Now the Jankaar has sold his pump. He now plans to use the group pump for himself or for the other five members of his family (his four brothers and one nephew).
The group has not been getting any income from the pump till now.
Conclusion
The diesel pumps have become the private property of a few individuals. The groups have not been getting the income that had been planned. The CO is aware of this
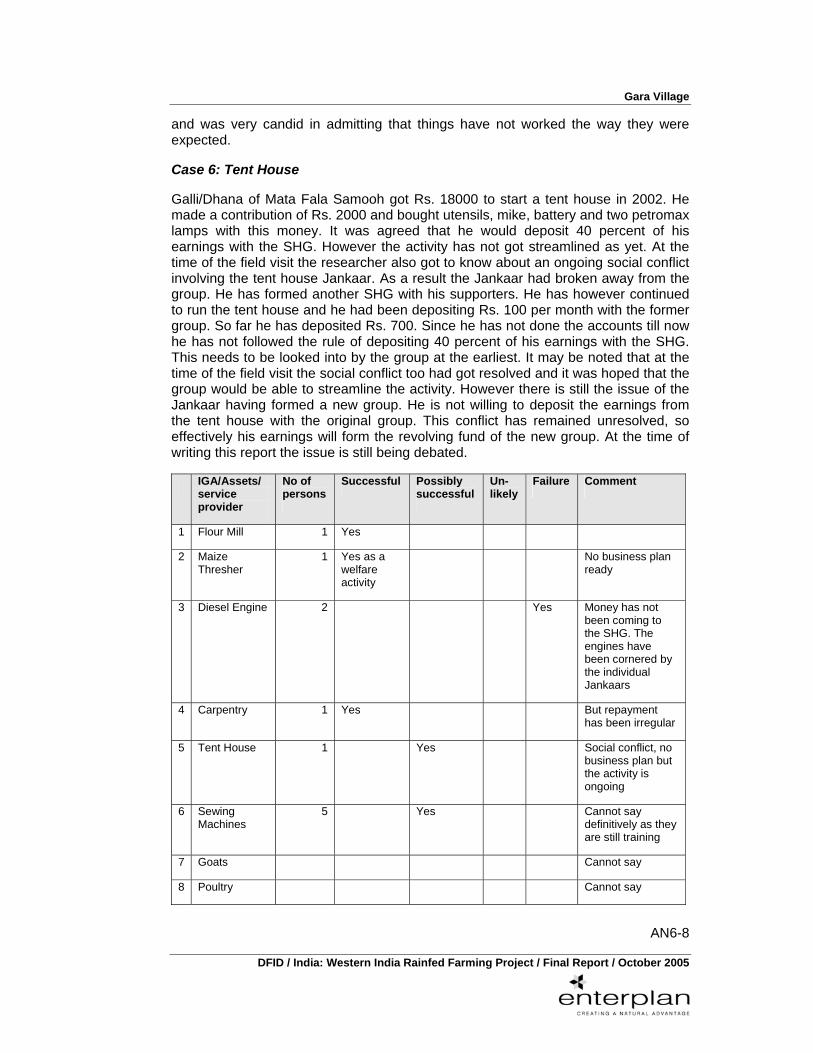
Gara Village
AN6-8
DFID / India: Western India Rainfed Farming Project / Final Report / October 2005
and was very candid in admitting that things have not worked the way they were expected.
Case 6: Tent House
Galli/Dhana of Mata Fala Samooh got Rs. 18000 to start a tent house in 2002. He made a contribution of Rs. 2000 and bought utensils, mike, battery and two petromax lamps with this money. It was agreed that he would deposit 40 percent of his earnings with the SHG. However the activity has not got streamlined as yet. At the time of the field visit the researcher also got to know about an ongoing social conflict involving the tent house Jankaar. As a result the Jankaar had broken away from the group. He has formed another SHG with his supporters. He has however continued to run the tent house and he had been depositing Rs. 100 per month with the former group. So far he has deposited Rs. 700. Since he has not done the accounts till now he has not followed the rule of depositing 40 percent of his earnings with the SHG. This needs to be looked into by the group at the earliest. It may be noted that at the time of the field visit the social conflict too had got resolved and it was hoped that the group would be able to streamline the activity. However there is still the issue of the Jankaar having formed a new group. He is not willing to deposit the earnings from the tent house with the original group. This conflict has remained unresolved, so effectively his earnings will form the revolving fund of the new group. At the time of writing this report the issue is still being debated.
IGA/Assets/ service provider
No of persons
Successful Possibly successful
Un-likely
Failure Comment
1 Flour Mill 1 Yes
2 Maize Thresher
1 Yes as a welfare activity
No business plan ready
3 Diesel Engine 2 Yes Money has not been coming to the SHG. The engines have been cornered by the individual Jankaars
4 Carpentry 1 Yes But repayment has been irregular
5 Tent House 1 Yes Social conflict, no business plan but the activity is ongoing
6 Sewing Machines
5 Yes Cannot say definitively as they are still training
7 Goats Cannot say
8 Poultry Cannot say

Gara Village
AN6-9
DFID / India: Western India Rainfed Farming Project / Final Report / October 2005
Social Development Interventions
Ball bearings for chakkis (Gatti), maize Shellers, Grain Bank, Paravet janakaar, Health camps (human and cattle), House construction for the poor, Solar energy, Adult literacy classes:
• Smokeless Chulha, four out of 20 Chulhas made are functioning well. According to the people interviewed there was design fault. This fault has been identified and now a fresh demand for 55 Chulhas has come in;
• Sanitation Kits, have been given to all the members of the SHG. These are being used;
• Light Sheets, Mata Fala and Patel Fala members have got one each. According to the CO the proposal for others has been approved and each member will get one light sheet;
• Maize Shellers, Four maize shellers were given to Patel Fala Samooh. People find it good for seed extraction. Many HH borrow the maize shellers for this purpose. People find it useful and would like more of these;
• Ball Bearing, 35 HH have got the ball bearings for their chakkis. All have reported that this has resulted in substantial reduction in drudgery with grinding time reduced from two hours to one hour. With the coming in of Flourmill the dependence on hand Chakki is less but they still use it for grinding pulses. The very poor HH continue to use it for grinding maize as well;
• Grain Bank, Four groups got grain from GVT to start a grain bank in June 2003. The rotation has been uninterrupted and they have been able to increase the stock from 20 quintals to 25 quintals in one cycle. It may be noted that since members of six groups are effectively from the same family (with three male groups and three female groups) making it three groups plus one more for example, four groups. The other three groups were started very recently in 2004.Thus all groups that were in existence in 2003 were covered except Maal Fala samooh that had stopped savings. Recently Maal Fala samooh has made a demand for a grain bank. In order to qualify for the same they have also resumed savings. But GVT has decided to wait and watch the group discipline before advancing grain to this group;
• House Construction, for the very poor was done for 3 HH. There is additional demand for eight houses.
• Solar Lanterns, Two solar lanterns have been given to two groups (Rs. 600 was taken as Bhagidari from individual beneficiary) and two gas lanterns have been given to the GVS. There is a huge demand from every HH and they are willing to give 50 percent Bhagidari. GVT has budget constraint therefore will try to get them linked with other sources, and
• Adult literacy Classes, were held for six months and then stopped. The girl running the class got married and moved out of the village. Now a new

Gara Village
AN6-10
DFID / India: Western India Rainfed Farming Project / Final Report / October 2005
daughter in law might take it up- GVT will pay her an incentive of 75 paisa per attendance per day. The impact of the literacy class has been that people are able to sign much faster than before.
Crop Technology
This includes crop trials, seed distribution, cropping practices, agriculture implements, compost pits, and drip irrigation, PVS/PTD.
FAMPAR Trial: Maize Paddy seed, Black gram and pigeon pea seed were distributed to all in the Kharif season. FGD revealed that the GDRM 187 maize variety is preferred. For rice Kalinga third. Pigeon pea BDN. Chickpea in Rabi- ICCV2 and ICCV 10 were preferred. These preferred seed varieties will be distributed.
Agriculture Implements: Have been distributed to every HH. According to the people interviewed the serrated sickle works better and there is time saving.
Hand Operated Winnowing Fan: Only 20 percent of the people using the fan, as it requires high stamina. This has not been a successful intervention in this village.
Drip Irrigation: A drip irrigation kit costing Rs1500 was given to Bhagat Fala SHG in February 2002. 17 members of this group have given the contribution at Rs.8 i.e. Rs. 136. The Jankaar made a contribution of Rs. 14 to make a total contribution of 10 percent for example, Rs. 150. According to the CO the idea of Bhagidari is not necessarily linked to getting benefit of a specific activity it is also a way to increase group fund. There are nine members who are taking vegetables from this facility. Two to three members from Mata Fala also take vegetables. Only five members are taking care of the facility. There has been a demand for seven more drip facilities from members living near hand pumps and wells.
Compost Pits: five compost pits were built with five groups in February 2002. There has been a good demonstration effect of this intervention. Earlier they were not making a proper size and not following the proper method. Now the proper size and method is being used. Earlier they used to get five kg manure from one kg dung. Now get 30 kg. Manure from one kg dung. There has been a good adoption of this activity. 10-12 pits have been dug through linkages with the help of Watershed department.
SWC
There is no village common land in Gara. All the SWC work has been done on private land with 50 percent contribution. Total area planned for treatment is 560.50 acres. Of this 466.72 acres has been treated. This has resulted in approximately 20 percent increase in cultivable area (for example, 70 acres). This area is located in the Nala portions, behind the existing fields. Usually the farmers do not cultivate on more sloppy parts of their land. Some land that was earlier used for growing maize has now been converted to growing paddy as a result of the SWC work.

Gara Village
AN6-11
DFID / India: Western India Rainfed Farming Project / Final Report / October 2005
WRD
The following interventions were made by GVT:
• Well construction (making existing wells pucca): three. • New dug out well one. • Well deepening: eight. • Lift Irrigation: one. • Hand pumps: three. • Diesel Pump (also covered in Minor IGA) three. • Water tanks for cattle six. There has been a huge reduction in drudgery due to a reduction in time taken to fetch water. Earlier women would spend three to four hours every day to fetch water, now this time has come down to between 30 minutes to one hour. There is no shortage of water throughout the year. Women have found time for leisure, are able to do the household chores more peacefully and take better care of their fields. The quality of water has also improved as earlier people were fetching water from the river or open wells.
The lift irrigation scheme is very ambitious but no assessment could be made, as it had not yet started functioning. It was expected to get functional by the month of November 2004 for the Rabi season. However the CBA team was worried to note that the arrangements for the use of this facility had not been worked out. People had no idea about how water would be shared, what they would have to pay for its use, and how the maintenance will be done.
Livestock (Breed improvement of cattle, poultry, goats)
Several members were given Giriraja, Girirani and Kadaknaath breed of poultry. While there was some mortality by and large the objective of crossbreeding was achieved not just in Gara but also in the surrounding villages. People reported good earnings from poultry and have expressed interest in continuing with the activity. The same holds for Goatry, the objective of breed improvement seems to have been achieved. Although people do recognize that Sirohi and Jamnapari are more susceptible to disease. Jamanpari suffers huge mortality even in the transportation (50 percent). Yet it still is considered a viable option, as the milk yield is much more. Need some more information on the crossbred goats. GVT has decided that they would entirely focus on breed improvement and give only the buck for this purpose. Community will be taken for an exposure visit to Dahod and Jhalod where contacts will be established with the poultry farms so that they can continue with the activity.
Forestry
JFM, Fruit trees, Nurseries, orchard development, grafting and budding, medicinal plants cultivation, CPR development
JFM. The community has got together and protected a patch of 100 ha of forestland for the past two years. They have formed groups of four persons each who are responsible for protection. The groups rotate daily. There has been no break in this protection. The immediate benefit the community got from protection is of grass.

Gara Village
AN6-12
DFID / India: Western India Rainfed Farming Project / Final Report / October 2005
They have got grass worth Rs.50000. For this they paid a royalty of Rs. 5000 to the FD. The JFM group has a separate bank account. It is now in the process of getting registered by the FD.
Orchard Development. Fruit plants have been distributed for the 2002, 2003, 2004 seasons. These have included 200 Aonla, 400-500 Mangoes, Bamboo (600), and improved tissue culture teak plants (75). No assessment has been made on survival percent.
Six horticulture trials, 93 trials of Aonla and three of mango have been taken up 2004.
Ber budding of 200 plants was done in 2002. People have reported improved fruiting.
Component B Dissemination (Prasaar Villages)
There are two Prasaar villages of Gada- Dhalar and Munakhada. These are six Km from Gada. Dhalar has had natural dissemination even before the formal entry of GVT. They made two groups (20 members each) on their own. There are 60 HH in this part of the village. These groups were formed in 2003. This village has 700 HH with Bhil Garasia and Damor as the dominant community. Dhalar groups have been saving regularly. The rest of the village is still not part of the effort. All the members of the SHG have got Smokeless Chulha and Fibre sheets, there is one water tank constructed for cattle, improved seeds have been given to all, and Kitchen gardening has been promoted with all. GVT also organised Vet camps, Human health camps. According to the CO Since this is a very large village GVT cannot really cover the entire village the strategy will be to work through linkages.
Munakheda, the second dissemination village has 85 HH. It has three groups with 45 members. Similar activities have been undertaken. One SHG will be getting a loan for dairying under SGSY.
Prasaar Jankaars receive regular training. There is a monthly training. The CO in charge of the villages has to give overall guidance and direction to the Jankaars. The CO is training in charge at Bagidora and provides training to the Prasaar Jankaars. He is also responsible for monitoring of the work of the Prasaar Jankaar. They submit their monthly Planning reports in the office. They are completely responsible for mobilizing the community in the villages. There are a total of 175 Prasaar villages in Banswara and 39 Prasaar Jankaar (of these nine are women)
Future Scenario
No take over plan (TOP) or hand over plan (HOP) has been prepared for Gara as of now. A review PRA also has not been done. Some work has begun in the direction of forming a federation of the SHGs for example, a Gram Vikas Samiti (GVS) however it is still in the process of getting formed. From the discussions held with the CO and other people it appears that the thinking on future has just about begun.

Gara Village
AN6-13
DFID / India: Western India Rainfed Farming Project / Final Report / October 2005
Summary and Analysis
Institutions
Self-help group (SHG) is the primary institution at the village level.
Governance
While the groups are meeting and saving regularly there does seem to some kind of inertia in dealing with the people who have taken up IGAs or are managing group assets like the diesel pumps, tent house. Almost all the groups have reported cases where repayments are either not coming in or are less than what was agreed. In almost none of the cases a business plan existed for the larger assets like the Maize thresher, tent house. The group records are well maintained by the Jankaars. But very few loans have been advanced by the SHGs. At the same time people have been taking loans from the moneylenders by mortgaging their silver. According to the CO the groups have taken much longer to gain the confidence to start lending from the group savings. They gave a few loans to see if people repay. Now they are far more confident. However the CO also agreed that people of Gara have been rather slow on the uptake and they have been really viewing the SHGs as a means to get the various kinds of interventions from the project. They feel that so long as they meet and save regularly they will continue to be eligible for the interventions and benefits. The CO has a very good rapport with the community and people also are very actively engaged with the project. It is possible that people have been more focussed on wage income coming in from SWC and WRD works and have not really focussed on making SHGs a viable and robust institution. This appears to be a general situation in the GVT project villages where there is a tendency to take on a more instrumental view of the SHG groups. The IGAs too are not being looked at as businesses where the groups may need some pushing and prodding. The money has been made available for these activities without much pressure for repayment. A lot more effort will be needed to make the institution of SHG a strong institution that could survive beyond the life of the project.
Decision Making
While the groups meet and save regularly they seem to have allowed some kind of inertia to develop. Even in the case of the sale of the diesel pump by the members who were using it, it was the CO who had to bring up this issue and facilitate a decision within the group to push the erring members to get the pump back. In other cases too the leadership is not pushing for timely repayment or the equitable and proper use of the groups asset. All loan decisions are taken at the group level but very few loans have been advanced. Strangely while people kept claiming that due to extra cash income from SWC and WRD work they did not need credit, yet the extent of indebtedness to the moneylenders is large. The reasons for this situation have to be explored by GVT.
Leadership
As of now the leadership of these groups is successful only to the extent of ensuring regular savings and meetings. This too has happened because people believe that that if they are not active members of the SHG they will not remain eligible for the

Gara Village
AN6-14
DFID / India: Western India Rainfed Farming Project / Final Report / October 2005
benefits of the project. From the various interviews and discussions their perception does not seem to wrong. There is no system though of making good any gap in savings. In case of Patel fala samooh for instance there are cases where members have not deposited the savings in some months. There is no system of imposing a fine or even of ensuring that this money is deposited at a later date. All in all, the group leadership is weak. According to the CO the group leaders of Gara did not attend all the trainings. Overall too there were less training held for leadership development than was desirable.
Gram Vikas Samiti (GVS)
Too new an institution for the CBA team to comment on.
Management Process
Decision Making
Decision-making is transparent and takes place in the group. However not many decisions have been taken in these groups. Most members are only interested in the wage income coming in from SWC and WRD works and in the other benefits flowing in from the project. The proposals too have been late in coming in. the literacy levels are very low and that has slowed the entire process.
Responsibility for Asset
User groups have been created for maintenance of group assets like the Lift irrigation scheme. However this system has not yet been tested as yet. For other assets it is the concerned SHG that is responsible for their maintenance and management. The experience has not been very good till now.
Maintenance of Information (which information is kept)
The group Jankaar maintains village level information. Till recently he was paid by the project. He has not been paid for some time. No decision has been taken as yet about how he will get compensated.
Inclusion and Targeting
Village Selection
This is a perfect village from the point of view of reaching out to a poorly served area and a poor community.
Activity Inclusion
Almost all the willing persons have been included in the intervention
Repayment Regimes
Very few loans have been advanced by the SHGs from their own savings. While the repayment has been reasonably satisfactory for the individual loans advanced from the group’s own fund, this has not been the case with the loans for asset purchase

Gara Village
AN6-15
DFID / India: Western India Rainfed Farming Project / Final Report / October 2005
that were routed from GVT through the SHG. The repayment amounts have been less than agreed, sometimes not taking place at all. The groups also do not have any control on the individuals who have taken these assets.
Stakes
SWC,WRD,Crops
SWC, WRD interventions have generally benefited the people. SWC has been the most popular intervention as it has not only provided wage income but also has helped to improve the quality of land. In some cases it has also increased the arable area. People informed this researcher that there has been some new area brought under paddy as well as some old maize fields have been converted into paddy fields. Paddy was not grown in this village. People used to buy rice for consumption. They are happy to grow this relatively higher value crop. However no formal assessment of the actual increase in this area has been made.
The response to drip irrigation and compost pits has been very positive and some scaling up with funds from other sources has also happened. There is demand for more units and GVT is trying to link the groups with other departments.
IGA
Very few IGAs have been taken up in this village. The experience has been mixed. As mentioned elsewhere with no business plan in place it is not clear whether these will eventually turn out to be viable and sustainable.
Community Assets
The community has demonstrated good community spirit in the JFM programme. There has been no break in the protection responsibilities and they have even got good returns in the form of grass. So the community does have the capacity to work together. This capacity has not been used by the project. GVT has acquired the image of a project that is there to distribute benefits and not as an organisation that is into building institutions of the community.
Savings and Credit
Members have very little stake as of now. The SHGs are being seen as a means to access the project benefits only. The institutions are unlikely to survive beyond the project
Social Development Interventions (SDI)
The response to solar lanterns has been very positive. People are willing to contribute 50 percent of the cost. GVT is trying to link them up with the concerned department.The response to the ball bearings, light sheets etc has been positive but only time will tell whether these will get replaced after they have run through their life.
The grain bank has been functioning well and it seems that it will be sustained.

Gara Village
AN6-16
DFID / India: Western India Rainfed Farming Project / Final Report / October 2005
Employment Generation
This has remained mostly confined to SWC and WRD work. The few IGAs will generate some employment but that will be limited to a few individuals. It is too early to comment on the viability and sustainability of these interventions, as they have not been approached as businesses.
Migration Support
The migration support programme is new. It was started in June 2004. Till now 189 identity cards have been made. The response to this programme has been good.

DFID / India: Western India Rainfed Farming Project / Final Report / October 2005
Moti Keheri Village
AN7

Moti Kheri Village
AN7-1
DFID / India: Western India Rainfed Farming Project / Final Report / October 2005
Moti Kheri Village
AN7
Profile of Rajasthan1/
Rajasthan is India’s largest State. It is divided into 32 administrative districts. It has the highest proportion of Scheduled Castes, and a high proportion of Scheduled tribes. Agriculture, the largest employer of the workforce in the State, has faced sluggish growth rates, while the more dynamic services sector has accounted for a small percentage of overall employment. The low employment in the industrial sector indicates an inactive secondary sector, resulting in a heavier dependency on the primary sector. Agriculture and Animal husbandry are the principal sources of livelihood in Rajasthan and together with mining and quarrying, make up the primary sector for employment in the State.
In the 10-year period 1981-1991 the population of Rajasthan increased by 28.4 percent while the number of main workers registered a growth of 33.3 percent, the maximum increase in the workforce occurring in one of the poorest districts, Banswara. An important feature of this decadal employment trend is the increase in women’s employment. The number of female workers increased by 79 percent, three times the men in the same category, mainly in the rural areas. Women therefore play a major role in the State’s economy.
The economy of Rajasthan is characterized by diversity in terms of livelihood sources and low levels of income poverty and unemployment. Susceptibility to drought, decelerating growth rates in the 1990s; low levels of technology and poor credit and marketing facilities are cause for concern. Strategies and programmes have to be evolved to improve the skills of the local population and encourage greater community participation to generate additional income and employment in the rural areas, especially among the poorer sections of the society.
50 percent of the total land holdings continue to be small or marginal and cover only 10 percent of the cultivated area. The poor quality of land and scarce irrigation facilities affect even the larger landholdings, so that land inequality is compounded by ecological fragility. This results in low productivity making food security the primary concern of farmers.
Most districts in Rajasthan have low HDI values. In terms of HDI, Chittorgarh ranks twenty-first out of the 32 districts. Pratapgarh is one of the Sub-divisions of Chittorgarh district.
1/ Source: Rajasthan Human Development Report, 2002.

Moti Kheri Village
AN7-2
DFID / India: Western India Rainfed Farming Project / Final Report / October 2005
Profile of Chittorgarh District and Pratapgarh Block
Chittorgarh district consists eight sub-divisions, 13 tehsils, 14 blocks and 2415 villages. The main crops of the area are maize, sorghum, sugarcane, wheat and oil seeds. This is also a mining belt with zinc, copper, lead, marble and limestone mines.
Pratapgarh block is located in the southern part of Chittorgarh district. It is located at 24.03 N, 74.78 E on height of 1660 ft from sea level. The block is bounded by Mandsaur, Ratlam, Neemuch districts of M.P. and Banswara and Udaipur districts of Rajasthan.
The area is known as “Kanthal” meaning the edge of the State. Pratapgarh was established in year 1699. The main language of the area is Malvi. The traditions of this area are mostly based on Gujarati culture. The total population of Pratapgarh is 236500 (census 2001). Out of this 8.5 percent belong to the scheduled caste and 53.6 percent belong to scheduled tribe. The Sex ratio is 953.
Agro climatically the area has mild summer and winters. The mean annual rainfall is 887 mm with an average of 50-60 rainy days, almost all of it falling in the monsoon period of July to September. The area is surrounded by river Chambal, Shivna, Jhakham, Retam and Mahi. Main crops in the area are Wheat, Rice, Gram, Cotton, Sugar cane, and Pulses.
Profile of Moti Kheri Village
Moti Kheri village is located 28 kms from the project headquarter in Pratapgarh. Though the village is connected by road to the Tehsil headquarter in Sohagpur, the last five kms of this road is kucha that gets cut off during rains. IFFDC made an entry in this village in August 1999. According to the village people interviewed, at the time of village entry, the situation in the village was very bad with a majority of families dependent on migration to meet their requirements. Almost the entire village used to do headloading of fuelwood to make the two ends meet. They also used to walk huge distances (35kms) to Mandsore and Bajna to sell timber.
The total number of households (hh) in the village is 115. These are spread into five hamlets. Of these 110 hh have got engaged with the project. The remaining five did not join for a variety of reasons. One family had a person in a Government job, another was concerned that IFFDC people were missionaries and would force them to convert at a later stage. Of all the poor families only one got left out, as this family took too long to get convinced. By the time they got convinced the SWC planning and budgeting had been completed.

Moti Kheri Village
AN7-3
DFID / India: Western India Rainfed Farming Project / Final Report / October 2005
The details of different hamlets including the WBR are as follows:
Name of the Fala No. of HHSelf Sufficient Poor
Medium Poor Very poor
percent of families migrating for more than 6 months
1 Semalkhedi Fala 40 1 15 17 7 60
2 Mamadev Fala 20 3 7 4 6 50
3 Haldukheda Fala 17 1 8 4 4 47
4 Rail Fala 15 0 8 3 4 46.66
5 Bhuri Ghati Fala 23 4 8 5 6 47.82
Total 115 9 46 33 27 52.17
Source: Panchmukhi Vikas ki aur Agrasar, Moti Kheri-A report, IFFDC Office, Pratapgarh, 10 October 2003
Most families are nuclear families and belong to Bhil Meena caste and sub caste groups. The literacy status is poor with only 30.4 percent men and 5.51 percent women being literate. There is one Middle school (upto standard eighth) in the village where 170 children study. For further studies the children go to Suhagpura (distance four kms), Arnod (distance six km) or Pratpgarh (Distance 22 kms). Lok Jumbish, a literacy programme supported by the Government of Rajasthan, is also running some informal literacy centers in the village. As a result of the informal literacy centers, the percentage of functionally literate is 17.28 percent of the total population.
There is no public or private transport facility to the village and the closest point for the public transport is Suhagpur/Arnod. The village has a PHC (Primary health center) sub center, however that does not function very well. There is also an Anganwadi (ICDS: Integrated Child Health Services) center. There is no electricity or telephone facility in this village.
The land is undulating and uneven with two to 10 percent slope. The valley portion has Black cotton soil and is more productive. The soil is red on the uplands and mixed on medium lands. Almost all households own a mix of different land types. The average rainfall in this area is 700 to 1000 mm but the intensity of the rainfall, its frequency and distribution is very irregular. The total arable land is 170.16 Ha. Of this only 25-30 percent is cultivated during the Rabi season. The major crops taken up in the Kharif season are Maize, Soyabean, Urd, Paddy, Cotton, Ajwain, red gram and Til. The Rabi crops are wheat, gram, mustard, lentil, maithi and Garlic. The technology used is traditional and seed material too is what the farmers are able to save from the previous years. All in all agriculture is low yielding
As far as Animal husbandry goes, Goatry seems to be very popular with more than 60 percent HH having goats. A few self-sufficient HH (12) have buffaloes.
Agriculture is the main source livelihood for the people. However it does not provide for the needs of 92 percent of the families. The agriculture income has to be supplemented by labour income from migration. Migrant people engage in both

Moti Kheri Village
AN7-4
DFID / India: Western India Rainfed Farming Project / Final Report / October 2005
agriculture and non- agricultural activities. More than 52 percent of the families migrate in search of wage labour to Pratapgarh, Malwa, Mandsore and Bhalod. The wages for casual unskilled labour range from Rs. 40-50 for men and Rs.30-40 for women. People usually migrate from December to June when there is not much work in the village. The ones who stay behind continue to work as daily wage labourers in nearby areas like Arnod. The large farmers from these areas come in their tractors to fetch labourers.
Evolution of the IFFDC Intervention
According to the CO who made the village entry in August 1999 Moti Kheri is one of the 25 villages covered under the WIRFP. It is one of the eight villages where IFFDC decided to put in the maximum effort in the first year of its operations. According to a report2/ prepared in November 2000 the process followed in Moti Kheri was different from the other villages. The key differences were that the process of social mobilisation was given greater emphasis and the PRA for understanding the baseline village situation was better linked to the planning process. Moti Kheri was developed as a model village. The team was able to establish its credentials by September 2000. The first VLDP (Village level development plan) was prepared for Moti Kheri. The other IFFDC villages also developed on the same lines but from various discussions it can be concluded that the intensity in the other villages was less than that in the model village.3/
Initially people were very scared and sceptical of the intentions of IFFDC. The fears ranged from the IFFDC staff coming in to convert them to Christianity or to take away their lands and women and so on. The team placed at Moti Kheri decided to go slow on social mobilisation and it was nine months before a PRA could be conducted in the village.4/ The period of nine months was spent in rapport building with the community, in working on the opinion leaders and gatekeepers, slowly conducting hamlet-based meetings to explain the programme. EPAs (Entry point activities) like construction of water storage tank near the hand pump and organizing of a health camp through one enthusiastic women’s SHG (Santoshi Mata Bachat Samooh), built the confidence of the women and some of the members of the village community. This effort was then complemented with an exposure visit to a few selected villages. Once they were convinced about the intentions of IFFDC the going was easy. The villagers started getting organized into SHGs with regular savings and meetings. IFFDC staff was careful in not giving them the impression that the physical works would follow soon.5/ The emphasis was on making strong and functional SHGs. Given the co-operative background of IFFDC, having strong functional groups was considered of primary importance.
2/ Participatory Development Process through Social Mobilisation at Moti Kheri, November 2000. 3/ Since the CBA team only took one IFFDC village for a detailed study, it is not in a position to
substantiate this observation. 4/ This is unusually long time. In most cases the PRA exercise is conducted in the first three months of
entry. 5/ It may be noted that once the programme started getting known, physical works did tend to become a
major point of attraction, especially in the villages that were covered later. In the Prasaar villages too the village community is hopeful of some physical interventions in the long run.

Moti Kheri Village
AN7-5
DFID / India: Western India Rainfed Farming Project / Final Report / October 2005
According to the report one of the lessons of Phase one of the WIRFP was not to allow a Jankaar dependent project model as in that model Jankaars become alternative power brokers for their groups. IFFDC has therefore opted for the concept of a broad based leadership where by capacity building inputs can be accessed by a larger number of group members (and not just a few select Jankaars) through Capacity building measures (CBM) conducted at the village level itself. According to the report, to practice the concept of broad based leadership, all group members were provided basic training on SHG concepts and functioning. The physical interventions were only made after appropriate CBMs. In practice it meant that while the Jankaars were given more intensive centralised training, the members of the SHGs were also given trainings at the village level so that they could follow what the Jankaar was doing and keep track of the work. The team followed a proper process of conducting a PRA, arriving at the Livelihood asset status, doing a critical problem analysis and finally deciding on interventions based on group discussions and negotiations among various stakeholders.
The following areas were identified in the CPA:
• Water for irrigation and drinking. • Unavailability of good seed and fertilizer on time. • Soil and water erosion. • Low crop productivity. • Scarcity of fuel and fodder. • Lack of credit. • Unproductive animals. • Lack of marketing avenues. • Lack of flourmill. • Lack of electricity. • Lack of a pucca road. • Women overburdened with work. • Degradation of forest and community lands. • Poor health status.
Activities at the Village Level6/
Component A: Development Activitie;VOG (Village Organisation Development)
Self Help Groups
There are a total of 13 SHGs in Moti Kheri village with a total membership of 231. Of these seven are women’s groups and six are men’s groups. Some of the features that stand out about the SHGs are as follows:
• The groups meet regularly twice a month.
6/ As part of the validation exercise the social development specialist has focused mostly on VOG that is a part of component B for example. Development and only partially focussed on Component B called Dissemination for example the work in Prasaar villages.

Moti Kheri Village
AN7-6
DFID / India: Western India Rainfed Farming Project / Final Report / October 2005
• They save regularly.
• The system of fines for late payment of savings or for non-attendance of meetings is enforced strictly. The fine is Rs five if savings are deposited within 15 days and Rs 10 if these are deposited within a month. The fine for non-attendance of meetings is Rs. Five.
• There has been a fairly good rotation of money in the groups with a good track record of repayments. (See the CBA team’s output) on repayment status.
• The members are not meeting all their credit requirements from the SHG especially the ones who have not been repaying their previous loans. The defaulters of the SHG groups have had to turn to the local moneylender for loans. In addition other people who need larger loans too are forced to turn to moneylenders. There are instances of people mortgaging their silver to access these loans. However people have reported a 50 percent decrease in dependence on moneylenders since the formation of SHGs. A few farmers (four to five) have also taken Kisan credit cards from Punjab National Bank.
• The record Jankaars for the SHGs, get an incentive from IFFDC for maintaining records of two to three SHGs. At the beginning this was fixed at Rs.five per member per month for example, 75 rupees for a group of 15 members. There has been some discussion on making the groups start paying for these services. It has now been decided that Re.one per meeting will be paid by every member, while IFFDC would pay Rs. two per member per meeting towards meeting the cost of record Jankaar. However this has not yet been put into practice.
• According to members of SHGs everybody has access to loans provided they have a good repayment record. The loans are cleared based on the need of the applying member. The decision to sanction a loan is taken in the group meeting.
Income Generating Activities (IGA)
Where IFFDC Makes a Grant to the Group (Minor IGA):
Case 1: Carpentry
Rajmal Nagji Meena (from the poor category) of Bheru Bhavji SHG, used to do minor carpentry jobs like making ploughs, and doors. He apprenticed under the local schoolteacher who taught him more complex items like box beds, and almirahs. Two years back he took a loan of Rupees 500 from the SHG to purchase tools at two percent rate of interest. He has repaid that amount. He has been operating as an itinerant carpenter taking up jobs in the surrounding villages as well. He gets a wage of Rupees 100 per day. If the job is big then he even employs an assistant at Rs. 50 to 60 per day. After repaying the first loan he took a second loan of Rs.1000 for purchase of wood, another Rs. 500 for loan repayment and Rs. 500 to tide over an illness in the family. He is fairly well established as a carpenter. Earlier he used to migrate as a casual labour for five to six months a year but for the past three years
Moti Kheri Village
AN7-7
DFID / India: Western India Rainfed Farming Project / Final Report / October 2005
he has stopped going out as casual labour. Now he goes as a skilled carpenter. He has applied for a loan of Rs. 30000 to buy a lathe machine. The proposal is presently with the PLDCS (Primary Livelihood Development Co-operative Society) started by IFFDC. The PLDCS would forward the application to the concerned Bank. People prefer to approach the Bank through this route because they feel that IFFDC would not only help them access money from other schemes of the Government but also help establish direct link with the Bank whereby they do not have to go through middlemen. The role of IFFDC is to help them with preparing a proper application.7/
Case 2: Goatery
10 members of Ganga Mata Samooh took a loan of Rs. 1000 each from the group loan of Rs. 10000 they got from the Bank in June 2002. Nine of them invested this money in purchase of goats. One person used the money for contributing in the investment of a flourmill. All of them have been able to multiply the goat population in the course of two years. They have utilised the earnings from the sale of goats for a range of activities like repayment of outstanding credit (four women), well deepening, seed purchase and meeting household expenses. The activity has been successful.
Case 3: Handpump Repair
Deetalal, the SWC Jankaar of Moti Kheri village was associated with the project activities right from the beginning of the project. He had several opportunities to attend training programmes and exposure visits related to SWC and WRD. He attended a handpump repair training in January 2004. He got a handpump repair toolkit as well as a certificate at the end of the training. Deetalal started repairing handpumps in and around his village. In the initial few months he earned Rs. 800 from this service. He decided to make handpump repair a supplementary livelihood for himself. When the project undertook digging of handpumps in 16 of the project villages, Deetalal offered his technical services to fit these. He earned Rs. 1600 from this service during May to June 2004. Now Deetalal is known in the area for this skill. He gets paid around Rs 50 for minor repairs and Rs 300 for major repair work. On an average he earns about Rs. 700 per month from this activity. This has become a source of supplementary income for him.
Case 4: Diesel Engine Repair
Kalu the engine repair Jankaar got training in the repair of diesel engine in December 2003. At the end of the training he got a tool kit. He earned Rs. 3300 from January to June 2004. During the peak agricultural season there is huge demand for his services. On an average he earns between Rs. 280 to 300 per day in season and gets work for 17 to 18 days in a month. For minor repair jobs he charges Rs. 40 to 50.
Case 5: Sewing Machine
Ranglal who is presently a Prasaar Jankaar has benefited greatly from the IFFDC intervention. He belongs to the very poor category. He and his wife have only five
7/ Eventually it is expected that PLDCS would take over this role from IFFDC.

Moti Kheri Village
AN7-8
DFID / India: Western India Rainfed Farming Project / Final Report / October 2005
bighas of land with a large family consisting of five children to feed. They were able to grow enough grain for six to eight months. He had got a sewing machine and some raw material financed from the Bank under the TRYSYM scheme. He learnt sewing in Suhagpur and started a tailoring business. However the business did not take off and Ranglal was burdened with the loan. The Bank threatened to take back the machine. Around the same time IFFDC intervention started (in 1999) and Ranglal became actively associated with the interventions. He was made the SWC and Group Jankaar. He started earning some incentive money as a result and that helped him to pay off the Bank loan. In June 2003 IFFDC started a sewing training center in Suhagpur. Ranglal’s wife Sajana joined this training programme along with 18 other women from 10 villages. This was a six month long training. Sajna has continued to take up tailoring work from home. It has continued to a source of supplementary income for her. Ranglal does the cutting jobs while Sajana does the stitching. They earn between Rs. 45 to 60 per day for 10 days a month.
The sewing training center in Suhagpur has attracted many women. Batches of 10 to 12 women from the project villages have been attending the six-month training course at this center. There are problems in maintaining continuity as women do drop out during the peak agricultural season. IFFDC has been taking feedback on how to make the training more effective.
Where IFFDC Provides the Asset as a Grant to SHG Members (Minor IGA)
No activity was undertaken under this head.
Individually Managed Assets Through SHGs (Major IGA)
These are cases where individual member gives a rent to the SHG and also makes a contribution (usually 10 percent of the cost of the asset) towards the purchase of the asset. The asset belongs to the SHG but the individual ‘Jankaar” takes the responsibility of managing, maintaining and renting/operating this asset on behalf of the SHG. Some examples of such assets are Multi-crop Thresher, Maize Thresher, Bullock Cart, Hand Cart, Chaff cutter, Flour Mill, and Diesel pump.
Case of the Chaff Cutter
A chaff cutter worth Rs. 40000 was purchased in June 2002 by the PLDCS by mobilizing resources from the savings of six SHGs. The SHG wise details are as follows:
• Kalkamata SHG Rs.11000 • Bhairu Bhavji SHG Rs. 8000 • Bhadui Mata SHG Rs. 5000 • Rambavji SHG Rs. 3000 • Ganga mata SHG Rs. 6000 • Bijwamata SHG Rs. 7000 • Total Rs 40,000
Moti Kheri Village
AN7-9
DFID / India: Western India Rainfed Farming Project / Final Report / October 2005
It is interesting to note the following:
• This purchase decision was not made in consultation with the community. The erstwhile, well meaning, ADM (Additional Divisional Magistrate), felt that this would be a good investment and the decision was imposed on the community.
• The PLDCS was not in existence at that time.
• No interest was fixed for the money lent by the respective SHGs for this purchase.
• No term of loan was fixed.
• A profit of Rs. 10000 was made in the first year due to the fodder-cutting job coming in from the district administration in the fodder camps opened for drought relief. This was a one-time source only. According to the people interviewed, chaff cutting is not traditionally practiced in this belt, so there is no market for this service. The chaff cutter has been unutilised since the second year. It is gathering dust. There was an attempt to sell it off; however the sole offer the group got was too low (Rs.15000 only).
• The SHGs have neither got the principle back and there is no question of getting the interest.
• All in all IFFDC staff too agrees that this was a bad decision. Unfortunately a huge amount of the hard earned money of people has got locked in this enterprise.
• There is some talk in IFFDC to write this off and give this money back to the groups from IFFDC resources. However no decision has been taken as yet.
• The group members appeared not to be happy about the state of affairs but this researcher did not see too much concern either, especially among the members of the PLDCS. Is it because they do not want to confront IFFDC? This just might be true, as the people do feel grateful to IFFDC for the interventions they have made.
• Interestingly one of wheels of the chaff cutter was stolen in the last quarter of 2003. This became a big issue in the community. It was asked to replace it with contribution from each member of the SHG. The members were not willing to make any further contributions. In fact they raised questions on the utility of a community asset that had been lying unused. Issues of who is responsible for the maintenance and safety of such an asset also came up. This has surely raised larger issues with respect to community assets.

Moti Kheri Village
AN7-10
DFID / India: Western India Rainfed Farming Project / Final Report / October 2005
One of the team members was asked to give an assessment as to how different activities have fared in Moti kheri. The following table presents that assessment:
IGA/Assets/
service provider No of persons
Successful Possibly successful
Unlikely Failure
1 Carpentry 2 Yes
2 Vegetable Cultivation
16 50% 50%
3 Goatry 35 100%
4 Sewing Machine 1 Yes
5 Diesel Engine repair
1 Yes
6 Hand Pump mechanic
1 Yes
7 Buffalo and Cow (AH)
8 100%
8 Chaff Cutter 1 Yes
Total 65
From the above it is quite clear that most activities have been quite successful except the Chaff cutter. The reasons for its failure have been discussed earlier.
Forestry (JFM, Fruit trees, Nurseries, orchard development, grafting and budding, medicinal plants cultivation, CPR development)
Orchard Development was taken up as an activity in Ratan Kachru’s plot of one bigha in the year 2000. This was primarily an orange orchard (50 plants) with gap filling with Pomegranate, and Guava. He also intercropped these plants with vegetables. By October 2003 papaya and oranges had started fruiting. The orchard has been a success. The farmers from other villages have come here for exposure visits and have taken up orchard development in their lands. About 10 villages have had the demonstration effect of this activity. The CO had to put in a lot of effort in convincing Ratan to take this up. IFFDC provided him 50 percent labour cost for pit digging, saplings, insecticides and fertilizer. He has maintained the patch. While he is very happy with the plantation and hopes to increase his income from the same, no projections have been worked out for the yields and income from this plantation. Plantation8/ of fuelwood species, eucalyptus, bamboo, neem, ber etc on farm bunds has been promoted by IFFDC. All the members as well as some non-members took
8/ It is interesting to note that IFFDC has promoted plantations in several of the project villages. How viable some of these are needs to be checked. In one of the villages (Bhiladi) visited by the CBA team the team noticed that the plants were being watered by water brought in by tankers. How sustainable and cost effective is such a plantation is something that needs to be looked into. The stream of benefits and costs of such plantations too need to be worked out to get an idea of their viability.

Moti Kheri Village
AN7-11
DFID / India: Western India Rainfed Farming Project / Final Report / October 2005
up this work. About 10,000 saplings were distributed by IFFDC in 2000. The pit digging was partially supported (50 percent) by the project. Saplings have been made available every year. A contribution of Rs. five per fruit sapling costing Rs.25 was taken. However the forestry species were given free of cost. Labour cost was not supported in later years. Unfortunately because of drought the survival percentage of these plants has been very low.
Crop Technology
Crop trials, seed distribution, cropping practices, agriculture implements, compost pits, drip irrigation, PVS/PTD
From a report9/ prepared by IIFDC on 10 October 2003 we gather that new varieties of Maize and Soyabean were introduced in the village. Of the 165 members of the SHGs 53 have adopted the new varieties. Line sowing has been adopted by only 79 members. Seed priming, seed treatment and seed culture is being practiced by some. People have found these methods useful but the adoption rates have been low. The report concludes that more work is required in dissemination of these technologies.
SWC
• People have reported clear increase in the productivity as a result of SWC intervention. Gita of Bhurighati Fala has reported an increase from six to seven bags of wheat to eight bags in her two-bigha plots. The maize yield has also increased from two to four bags to six to eight bags.
• According to Chanda of the same group the erosion of the fields has been checked. However according to Radha, the excessive rains of this year have meant that several of the mud buds have got washed away. They will need to do the bunding again in these plots.
• Ratni has two bighas land that has got irrigation from the Anicut. There is an increase in the yields of both wheat and maize by two bags. She has also taken to vegetable cultivation in half a bigha of land for the past two years.
WRD
Before the IFFDC intervention, the village had only three hand pumps. The 40 HH of Semalkhadi and Bhurighati Falas used to share one source of water (a well) during the summer months. Each HH would spend about three hours everyday to fetch drinking water. There used to be conflicts too. The number of handpumps has increased from three to 10 (three installed by IFFDC and four by the Government). The SWC work has also resulted in the increase in the water table. All in all drinking water is no more a problem in this village for the entire year. People (especially women) also spend far less time in fetching water, there is less conflict, and they are able to devote more time to their fields and for leisure.
9/ Panchmukhi Vikas Ki Aur, IFFDC report, Dated 10 October 2003.

Moti Kheri Village
AN7-12
DFID / India: Western India Rainfed Farming Project / Final Report / October 2005
Livestock (Breed improvement of cattle, poultry, goats)
IFFDC did not distribute any new breeds. It has conducted some livestock health camps, given a Travis and trained a Vet Jankaar.
Social Development Interventions
In the case of Moti Kheri village all the members of the SHGs have got light sheets, blowers for the Chulhas, Matka (Water Pot) Stand, strainer, storage bins and ball bearings. People interviewed said that they use these and have found them to be useful. There is no issue of an increase in demand from HH that got left out, as the coverage was 100 percent. Like in other villages here too ball bearing for chakkis has been found to be a good drudgery reducing intervention. People prefer to use their own chakkis for daily use as most households do not find it affordable to go to the flourmill where they not only have to pay for the job but there is also some quantity of flour that is retained by the flourmill. So while the better off people use the flourmill more regularly, the poorer households use the flourmill when they have a function. It may be noted that one flourmill services a group of five villages in the area so the flourmill has enough business.
Smokeless chulhas were made for members of only one SHG. The experience with cement smokeless chulhas has not been good. According to people the mud chulhas work better but there is a problem in getting the raw material (horse dung in particular) for the mud chulhas. So smokeless chulhas have not really taken off despite people recognising the benefits of the same.
Component B Dissemination (Prasaar Villages)
The project had identified 50 dissemination villages in Pratapgarh block and started working in the dissemination villages. 15 dissemination jankars (core villages jankar) are playing key roles in dissemination villages. The process of SHG formation in particular is being done in a very systematic fashion.
Moti Kheri has five Prasaar villages Lalpura, Tarabawdi, Khora, Ratanpuria, and Achalawada. The dissemination Jankaar Suguna is responsible for the Prasaar villages. She has been getting regular training from IFFDC. The major work is SHG formation, seed distribution for varietal improvement, livestock camps, drudgery reduction interventions for women (like ball bearings for chakkis). The work done on CPR of Motikheri (for example the Golkhora dam) has benefited the dissemination villages (lalpura and Taarabawdi). The dam has provided water for livestock as well as irrigation for 25 bighas of land belonging to 10 families.
Future Scenario
The (Primary Livelihood Development Co-operative Society) PLDCS
The PLDCS (Primary Livelihood Development Co-operative Society) has been set up as an institutional structure that will anchor all the interventions. There is a list of 22 functions that a PLDCS is expected to perform. (For details on PLDCS- its objectives, functions, source of funds etc please refer to the brochure on the PLDCS model brought out by IFFDC). During the field visit the social development specialist had a meeting with the PLDCS members of the Moti Kheri Village. This PLDCS has

Moti Kheri Village
AN7-13
DFID / India: Western India Rainfed Farming Project / Final Report / October 2005
members not only from Moti Kheri but also from Choti Futwas and Choti Kheri villages as well. The PLDCS has a membership of 14 SHGs (eight Men’s SHGs and six Women’s SHGs) and 88 individuals (42 Men and 46 Women). The SHGs have a share of Rs. 1000 each and the individual members of Rs. 100. As of now the total share capital with this PLDCS is Rs22, 800. The total fund with the PLDCS is Rs. 65,790. It has an executive committee consisting of 11 members with a term of three years. The detailed break up across the villages is as follows:
S.No Village No. of HH HH covered No. of SHGs Members
1 Moti Kheri 115 112 13 186
2 Chhoti Khei 17 15 2 34
3 Chhoti Phutwas 23 21 2 36
4 Total 155 148 17 256
According to the group members the primary functions of the PLDCS are:
• Ensure that the SHGs function smoothly.
• Make loans available to the members through the SHGs.
• Provide services like training, camps, farm produce marketing), Purchase of seed and fertilizer.
• Information dissemination.
The following observations can be made for the present:
• It may be noted that the functions listed above are the functions that have been undertaken by the PLDCS till now. Given the fact that these are early days it is hoped that they will slowly take up all the 22 functions.
• It may also be noted that the total number of HH in these villages is 155 from which 88 people have become individual members.
• However the PLDCS has decided to make its services available to both members and non-members on the same terms. This then raises the issue as to why should anybody want to become a member. On being questioned the EC representatives said that they are planning to ensure that the two SHGs and the remaining families that have not become members will also join in.
• Last year in the months of October and November the PLDCS had undertaken bulk purchase and sale of Maize, Soyabean, Udad, and three NTFPs (Charota, Baheda and Aonla). However even a year down the line they have not yet worked out the profit and loss account for this activity. The PLDCS is therefore not in a position to say whether they have actually made a profit out of this activity or not and whether it would be a viable activity.

Moti Kheri Village
AN7-14
DFID / India: Western India Rainfed Farming Project / Final Report / October 2005
• One of the SHGs (Jai Hanuman) undertook bulk purchase of fertilizer (25 bags) for nine of its members. They were able to negotiate a better deal as well as get it transported on time. Usually people used to buy individually and carry it as head load. The same is the case for grain. According to people interviewed if sale and purchase can be taken up on a larger scale it will not only benefit them financially, but also reduce the drudgery of head loading the seed, fertilizer and grain. The PLDCS plans to take this up but they are aware that they really need to develop Business development plans if this has to be a viable activity in the long run.
SWC and WRD works
• The SWC and WRD works have generated wage employment in the village. Consequently migration has come down in the past four to five years. According a report brought out by the IFFDC office in Pratapgarh10/ the irrigated area has increased from 53.2 ha to 96.2 ha. This has definitely meant that the production has increased from previous levels.
• From the discussions held with the community as well as the IFFDC team members it appears that there is a case of subsidisation by non-beneficiaries for large structures (Anicut, Earthen dams, Check dams) that provide irrigation to a few families. The rule being followed in the project is that if a structure is being built on public lands then the labour contribution both by the direct beneficiary and the non-beneficiary is 25 percent. Ideally the direct beneficiary should be contributing 50 percent as they are reaping the benefit of the structure even if it is built on public land. When probed people did agree that there is a case of subsidisation. This issue needs to be discussed further.
Summary and Analysis
Institutions
Self-Help Group (SHG) is the primary institution at the village level. IFFDC has been successful in setting up a fairly good system of running the SHGs. The records are well maintained; the record Jankaars have the responsibility of keeping the records up to date. While the Jankaars still continue to be paid by the project for their services, there is already some discussion to make the groups start bearing at least part of this expense. The governance of the SHGs is healthy. All decisions regarding loans are taken collectively at the time of the meeting of the SHG. The cases are assessed on merit and nobody is allowed to get away with breaking the rules and norms. Earlier the cases for larger loans were forwarded to the IFFDC through the CO who was also responsible for preparing the proposal. Now the loan applications are first passed on from the SHG to the PLDCS, which in turn forwards the same to IFFDC. The leadership has been with the Jankaars who have been playing a very active role in the promotion and management of the SHGs. However that does not mean that
10/ Pachmukhi Vikas Ki Aur, IFFDC, 10 October 2003.

Moti Kheri Village
AN7-15
DFID / India: Western India Rainfed Farming Project / Final Report / October 2005
other members are not playing an active role. These are still early years but it will be a good idea to promote multiple and a more broad based leadership. Despite IFFDC talking about not having a Jankaar dependent model the fact of the matter is that in the early years the Jankaars do have a critical role and place in the whole scheme of intervention. The Jankaars have demonstrated good examples of leadership in Moti Kheri. In the year 2000 (before the PLDCS was constituted), the community was motivated for collective purchase of fertilizer. Some Jankaars pooled the money from all the SHGs and made some individual loans. Using this fund four trolleys of fertilizer was bought from Pratapgarh. People got the fertilizer of better quality, on time and at better rates. This year there was a bumper crop. The local merchants lost out and threatened the farmers that they would not advance them credit if they did not purchase fertilizer from them. However with the SHGs in place people did not have to anyway depend on the merchants to make credit purchase of fertilizer. They have been taking loans from SHGs and making cash purchase of fertilizer.
This experience of collective action helped people appreciate the importance of a body like a PLDCS. IFFDC has federated groups of willing SHGs into a PLDCS (Primary livelihood development co-operative society). Eight such societies covering 25 villages have been registered till now in Pratapgarh.
However, PLDCS is still in the early formative years. As discussed in an earlier section not all HH or SHGs have taken the membership of the PLDCS while they all have access to its services. This issue was discussed with the members of the PLDCS and they agreed that there is a need to make their coverage 100 percent to develop everybody’s stake in the PLDCS.
The other area of concern is that of making the activities taken up by the PLDCS viable as a business. As mentioned earlier the purchase operations of PLDCS have not yet been analysed, although a year has passed since this activity was taken up. The members of the PLDCS are still learning bookkeeping and basic accounts. They will need support from IFFDC for some time to come. However that still does not explain why the activity has not been analysed for its viability even if it meant taking help from IFFDC staff. They plan to take up purchase of agricultural produce this year as well with no idea about how they fared last year.
Management Process
Decision-Making
As mentioned earlier decisions are taken either at the level of the SHG or at the PLDCS level. Only one instance of a somewhat top down decision is the case of Chaff cutter. The SHGs are still bearing the brunt of that decision with an unused Chaff cutter and Rs. 40000 of their savings locked up in this asset.
Responsibility for Assets
The maintenance of community assets is the responsibility of the concerned user groups. According to IFFDC the PLDCS is supposed to keep an eye on the management and use of these assets. Since it has not been a long time since the assets were created this has not yet been tested as yet. Only in the case of Chaff

Moti Kheri Village
AN7-16
DFID / India: Western India Rainfed Farming Project / Final Report / October 2005
cutter the PLDCS has not been able to make a breakthrough. It is very clear that they will need to be bailed out of this by IFFDC.
Till IFFDC completely withdraws from the project village, the Community Organiser (CO) will continue to have an important role. The nature of this role has been changing over time. At the beginning it was to build the rapport with the community, conduct the PRAs, CPA and to facilitate the annual plan. At present it is to participate in the PLDCS meetings, capacity building of the community, ensure smooth flow of project funds in the village, do the necessary planning and negotiation, interface with Government departments and financial institutions, monitor activities and institutions and conduct technical demonstrations.
Maintenance of Information
At the SHG level information on deposits, loans, repayments, fines, overdues, outstandings, meeting records, guest related information, and members profile, is maintained. The record Jankaar, who gets an incentive from the Project, mostly maintains this information. There is some discussion on making the groups pay for these services but it has not been made operational. The Monthly progress report of the village is maintained at the PLDCS level. The project office makes a quarterly progress report.
Inclusion and Targeting
• Village Selection IFFDC has not followed the DFID guidelines very strictly consequently most of the villages are better connected and accessible villages. It seems that the working conditions were difficult in Pratapgarh area. People were very suspicious of the foreign aided project and possibly this was a reason for relaxing the guidelines.
• Activity Inclusion Moti Kheri is a model village therefore intensive effort has gone in to involve the entire village community. The CO spent almost nine months before even the PRA was conducted in the village. No wonder almost the entire village community has got engaged with the project. AWP based on the CPA were developed for each SHG. These plans were developed after negotiation with the members in a meeting. All SHGs met on one platform to develop a long-term perspective plan that was broken down into yearly activities. Since this was the only village covered in the detailed study of IFFDC villages, it will be incorrect to generalise from this experience. It just goes to show that the more intensive the effort the better would be the inclusion of the community.
• Repayment Regimes The systems set up for the SHG have been enforced very strictly. The repayment regimes are good by any standards.
• Public Works Leading to Private Benefits The rule being followed in the project is that if a structure is being built on public lands then the labour contribution both by the direct beneficiary and the non-beneficiary is 25 percent. Ideally the direct beneficiary should be contributing 50 percent as they are reaping the benefit of the structure even if it is built on public land.

Moti Kheri Village
AN7-17
DFID / India: Western India Rainfed Farming Project / Final Report / October 2005
When probed people did agree that there is a case of subsidisation. This issue needs to be discussed further.
Stakes
A vision building exercise had been done by the CO at the beginning of the project. In this people had visualised a village where there would be no drinking water problem, there would be anicuts and water sources all over, better agriculture, food security, Co-operative in the village, they will have some asset like silver, facilities like transportation, schools, health services, Bank, pucca houses and so on. After four years of the project, people seem to be generally happy with the way things have grown. The village has no drinking water problem anymore. People are getting loans at low interest. They still have to turn to the moneylender for large loans, but these are required occasionally (for a large asset, enterprise, or a major expense). Small loans are available from the SHG. People are also now accessing loans from Banks. At least 10 families have built pucca houses. Pucca wells have meant that the recurring cost of Rs 2000 per year for maintaining a kuchha well is no more there. Bulk purchase of inputs has been another activity that has got a good response- it has made inputs available on time, at lower costs, of good quality and also saved the drudgery when people used to carry these on head loads. People have developed clear stakes in the sustainability of interventions.
SWC, WRD. SWC works have been done on private lands and people have clear stakes in maintaining these. Similarly the well deepening, well construction, hand pump installation and other such works done under WRD bring in clear benefits to the people and they have stakes in maintaining these. In all cases the community has contributed in the construction of these structures.
IGA. Individual IGA has by and large been a success but mostly as a supplementary source of income. Seen in the context of the entire village community, the number of people who have successfully taken up some IGA is miniscule. One of the primary reasons for this is lack of a large enough market to support the limited kinds of IGAs that have been taken up till now. After all how many tailors or engine /hand pump repair service providers can the area support. The experience in the case of grocery shops has not been very encouraging (as could be gathered from a case of another neighbouring village, Choti Futwaas) where the promoter could not pay the instalments as all his capital got blocked in credit sales. Similar stories of failure of some IGAs are available from other project locations. IGA is anyway one of the most difficult things to ground. So it still goes to the credit of the project that it has helped to promote a few successful ones even though the number of HH who have benefitted is small. The individuals have developed a stake in these activities and they have also been repaying the money they have borrowed for these to the concerned SHG.
Community Assets (Anicut, Chaff Cutter, Travis). These are early years to really see how the community assets will get maintained. The structures are mostly less than two years old. If one goes by the planning for maintenance then it appears to be satisfactory. The overall responsibility of maintenance is with the User group under the guidance of the PLDCS. The users also have to contribute a certain amount with the SHG for the use of the asset. The SHG in turn makes a deposit with the PLDCS. This fund will be available for the repair and maintenance of the asset. However in

Moti Kheri Village
AN7-18
DFID / India: Western India Rainfed Farming Project / Final Report / October 2005
case of the Chaff cutter the experience has not been good. The reason is obvious, as people have not found the Chaff cutter to be of any use. It is nobody’s baby and as a result nobody has taken the responsibility of maintaining the same. The experience however does raise issues of who should decide on creating/buying a community asset and further how the responsibility for the maintenance and safety of asset be shared. The Jankaar system has worked in the case of Moti Kheri for other assets that are managed by individual Jankaars, however can the large community assets also be managed by the same approach is something that needs to be explored further. The critical question is choice of the community asset that enjoys a clear stake of the community.
Savings and Credit. IFFDC has ensured that the SHGs function as viable savings and credit groups and not just as instruments for the project interventions. Consequently people have developed the required discipline for running these groups. People also recognise the utility of doing things together (fertilizer purchase and grain sale are two clear examples). Except for one SHG that the IFFDC team feels was a wrong choice (as the group consisted of youth who were not serious about the activity) all the other SHGs demonstrate that the members have developed stakes in the functioning of the groups. The groups are likely to survive beyond the life of the project. Employment Generation. The SWC and WRD works undertaken by the project meant that wage employment opportunity was available right in the village. These years have also seen a drop in migration. However it is not clear what would be the situation in the absence of wage income available from the project interventions. There are many questions: Will people be forced to revert back to migration and casual lab or they have alternatives as a result of the project. How many families have such alternatives? From what interventions? What has been the impact of interventions made under the project on the food security and livelihood options of the people? On how many HH? SWC, well deepening, well construction and other WRD interventions as well as input in crops have resulted in better yields. This has meant an increase in food security. To some extent IGAs have helped a few families but this number is small. While no detailed study has been conducted so far, it seems from various discussions that almost 60 percent of the HH are now in a position where they have food security for the entire year. They may undertake short-term migration to add to their incomes, however this would not be distress migration. However the remaining 40 percent families still would have to migrate in search of labour to meet the deficit. The wage labour support programme being run in Pratapgarh since past year has helped in Skill enhancement, awareness about rights, proper wages, tracing Haali labour and providing support to this labour. It is time that a study is commissioned to get a clearer picture of the impact of the project on food security and wage labour scenario. (Is this distress migration or migration by choice?)
Till now the programme has been very intensive on wage employment. As far as SWC work is concerned all members of the SHGs have got this benefit. All have had the opportunity to work as wage labour irrespective of the class from which they come from. The WRD works too have been taken up in consultation with the village community. However the IGA activities appear to be an area where the group vests greater faith in the people who are more enterprising and who are likely to return the money to the group. So we do find that it is entrepreneurial ability that has been a
Moti Kheri Village
AN7-19
DFID / India: Western India Rainfed Farming Project / Final Report / October 2005
deciding factor not class. By and large in most cases the very poor do not show enterprise and for them the benefit from the project remains confined to wage income coming in from SWC and WRD works.
The project is rightly focussing on MLSP because after the wage income opportunity from the project dry up, it is migration that will continue to provide the livelihood to most. According to some estimates a larger percentage of the population would now stay back or stay back longer than they did before, as there has been an increase in cropped area, or availability of water for irrigation whereby some people are able to take the Rabi crop. However migrant income continues to be an important source of income. Even the families who have reached some level of food security for the 12 months, still prefer to send one person as migrant labour for a few months a year to bring in the cash income to meet other requirements- of better housing, clothing, and input costs in agriculture.

DFID / India: Western India Rainfed Farming Project / Final Report / October 2005
Financial Analysis

DFID / India: Western India Rainfed Farming Project / Final Report / October 2005
Project Costs
AN8

Project Costs
AN8-1
DFID / India: Western India Rainfed Farming Project / Final Report / October 2005
Project costs
AN8
Introduction
WIRFP Phase two project financial investment cost expenditure by both implementing agencies (GVT and IFFDC) is subdivided into administration and village development investment cost headings. GVT administration is further subdivided into Bhopal project headquarters (PHQ) investment expenditure and the three state coordinating offices (Dahod in Gujarat, Jhabua and Ratlam in Madhya Pradesh and Banswara in Rajasthan). IFFDC administration is subdivided into the project headquarters in Delhi and two state coordinating offices at Pratapgarh in Rajastan and more recently at Ratlam in Madhya Pradesh.
Project administration and development investment costs identified by both GVT and IFFDC represent actual expenditure for the four-year period 1999/2000 to 2003/2004 (financial years run from 1 April to 31 March) and budgeted investment expenditure for the two years 2004/2005 and 2005/2006. No projected investment and or recurrent expenditure figures were produced for the period after March 2006. Financial and in kind contributions made by the village community and Government to the component A activities, at village level, have also identified and included in the project investment costs.
The phase two project consultancy costs, funded through the project by the Department for International Development (India) (DFIDI), relating only to development activities under component A, have also been identified and included under administration costs.
Development costs relate specifically to project intervention activities, at village level, and are subdivided into components A, B and C. Component A relates to activities conducted in the ‘core’ villages, component B relates to activities in the dissemination ‘prasaar’ villages and component C to the crop variety development programme. Agreement was reached at the inception workshop that the current study would relate only to those costs and benefits associated with component A activities.
Development costs for component A are further subdivided into the following cost subheadings:
• participatory planning and group formation (PPGF); • village organisation and development (VOD); • crop technology programme; • soil and water conservation (SWC) programme; • water resource development (WRD) programme; • livestock programme; • forestry programme; and more recently the, and • migration labour support programme (MLSP).
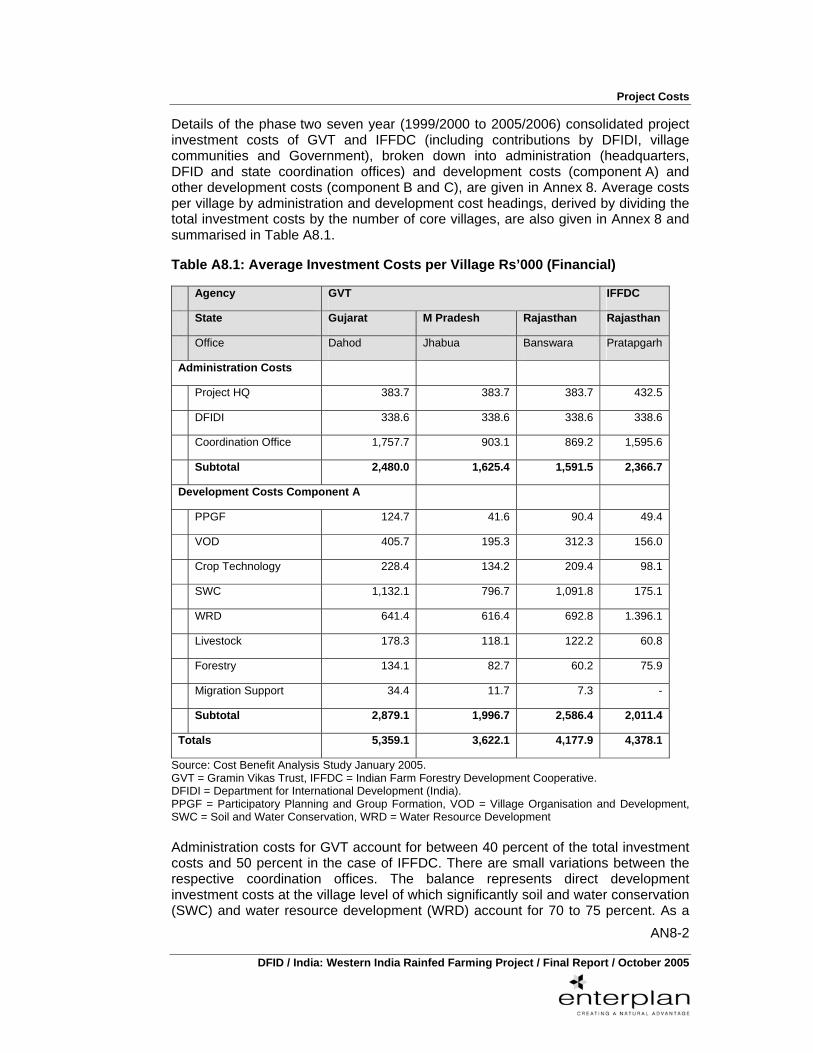
Project Costs
AN8-2
DFID / India: Western India Rainfed Farming Project / Final Report / October 2005
Details of the phase two seven year (1999/2000 to 2005/2006) consolidated project investment costs of GVT and IFFDC (including contributions by DFIDI, village communities and Government), broken down into administration (headquarters, DFID and state coordination offices) and development costs (component A) and other development costs (component B and C), are given in Annex 8. Average costs per village by administration and development cost headings, derived by dividing the total investment costs by the number of core villages, are also given in Annex 8 and summarised in Table A8.1.
Table A8.1: Average Investment Costs per Village Rs’000 (Financial)
Agency GVT IFFDC
State Gujarat M Pradesh Rajasthan Rajasthan
Office Dahod Jhabua Banswara Pratapgarh
Administration Costs
Project HQ 383.7 383.7 383.7 432.5
DFIDI 338.6 338.6 338.6 338.6
Coordination Office 1,757.7 903.1 869.2 1,595.6
Subtotal 2,480.0 1,625.4 1,591.5 2,366.7
Development Costs Component A
PPGF 124.7 41.6 90.4 49.4
VOD 405.7 195.3 312.3 156.0
Crop Technology 228.4 134.2 209.4 98.1
SWC 1,132.1 796.7 1,091.8 175.1
WRD 641.4 616.4 692.8 1.396.1
Livestock 178.3 118.1 122.2 60.8
Forestry 134.1 82.7 60.2 75.9
Migration Support 34.4 11.7 7.3 -
Subtotal 2,879.1 1,996.7 2,586.4 2,011.4
Totals 5,359.1 3,622.1 4,177.9 4,378.1
Source: Cost Benefit Analysis Study January 2005. GVT = Gramin Vikas Trust, IFFDC = Indian Farm Forestry Development Cooperative. DFIDI = Department for International Development (India). PPGF = Participatory Planning and Group Formation, VOD = Village Organisation and Development, SWC = Soil and Water Conservation, WRD = Water Resource Development Administration costs for GVT account for between 40 percent of the total investment costs and 50 percent in the case of IFFDC. There are small variations between the respective coordination offices. The balance represents direct development investment costs at the village level of which significantly soil and water conservation (SWC) and water resource development (WRD) account for 70 to 75 percent. As a

Project Costs
AN8-3
DFID / India: Western India Rainfed Farming Project / Final Report / October 2005
result, the quantification of the incremental crop benefits, and to a lesser extent livestock benefits’, resulting from this investment in association with crop technology, is critical to the reliability of the cost benefit analysis.
Individual Village Investment Cost Estimates
Development activity expenditure at the coordination office level is not accounted for by individual villages. Thus no actual year wise cost information was available for the individual sample villages. The sample village cost data were derived by reconstruction from the actual year-wise physical quantities of individual items and their unit costs with the help of the relevant village coordinator. These derived costs for the sample villages were comparing with the average village cost for the coordination office. Major variance from the average was noted.
Details of the average village investment cost for the four villages studied in depth are given in Table A8.2.
Table A8.2: Investment Costs of Four Villages Rs’000 (Financial)
Agency GVT IFFDC
State Gujarat M Pradesh Rajasthan Rajasthan
Coordination Office Dahod Jhabua Banswara Pratapgarh Sample Village 1/ Jadha Kadwapada Gara Moti Kheri Administration Costs Subtotal 2,480.0 1,625.4 1,591.5 2,366.7
Development Costs
Component A
PPGF 322.5 129.7 101.4 74.6
VOD 335.5 314.0 399.2 749.1
Crop Technology 258.2 415.6 167.3 273.7
SWC 3,003.4 531.1 2,482.6 645.1
WRD 2,778.8 515.6 2,471.4 2,745.2
Livestock 258.7 226.6 236.2 242.0
Forestry 191.9 129.1 42.9 212.5
Migration Support 235.1 81.0 - -
Subtotal 7,384.1 2,342.7 5,901.0 4,942.2
Totals 9,864.1 3,968.1 7,492.5 7,308.9
Source: Cost Benefit Analysis Study January 2005. 1\ Villages selected for in-depth social analysis. GVT = Gramin Vikas Trust, IFFDC = Indian Farm Forestry Development Cooperative. SWC = Soil and Water Conservation, WRD = Water Resource Development PPGF = Participatory Planning and Group Formation, VOD = Village Organisation and Development,

Project Costs
AN8-4
DFID / India: Western India Rainfed Farming Project / Final Report / October 2005
Employment Generation
Estimates have been made of the levels of employment generation, in terms of household income and person days of work, created in the four sample villages during the assumed five-year implementation period. The calculations indicate that a typical household has benefited by an average annual increase in income from wage labour from SWC and WRD development activities ranging from a low of Rs 1,710 (Kadwapada, Madhya Pradesh) to a high of Rs 5,780 (Gara, Rajastan). This represents the equivalent of 43 person days of employment per household in Kadwapada to 145 days person days in Gara. The annual wage income occurs mainly in the rabi season when alternative income sources necessitate migration of household members to major urban centres. Details of employment generation calculations are summarised in Table A8.3.

Project Costs
AN8-5
DFID / India: Western India Rainfed Farming Project / Final Report / October 2005
Table A8.3: Employment Generation of Four Villages
Agency GVT IFFDC
State Gujarat M Pradesh Rajasthan Rajasthan
Office Dahod Jhabua Banswara Pratapgarh
Sample Village 1/ Jadha Kadwapada Gara Moti Kheri
Administration Costs Subtotal 2,480.0 1,625.4 1,591.5 2,366.7
Development Costs Component A SWC 3,003.4 531.1 2,482.6 645.1
WRD 2,778.8 515.6 2,471.4 2,745.2
All Other Activities 1,601.9 1,296.0 947.0 1,551.9
Subtotal 7,384.1 2,342.7 5,901.0 4,942.2
Total Costs 9,864.1 3,968.1 7,492.5 7,308.9
Employment Generation Wages -SWC 2/ 2,402.7 424.9 1,986.1 516.1
Wages – WRD 3/ 1,667.3 309.4 1,482.8 1,647.1
Total Wage Costs 4,070.0 734.3 3,468.9 2,163.2
Household Employment
HHs / Village (No) 363 86 120 112
Income / HH / Year 4/ 2,242.4 1,707.7 5,781.5 3,862.9
Days / HH / Year 5/ 56 43 145 97
Source: Cost Benefit Analysis Study January 2005. 1/ Villages selected for in-depth social analysis. 2/ SWC wage labour estimated at 80 percent. 3/ WRD wage labour estimated at 60 percent. 4/ Average period of construction estimated at five years. 5/ Average daily wage rate estimated at Rs 40 per day GVT = Gramin Vikas Trust, IFFDC = Indian Farm Forestry Development Cooperative. SWC = Soil and Water Conservation, WRD = Water Resource Development Recurrent Cost Estimates for Administration and Development
No details had been identified by either implementing agency of the administration and development ongoing recurrent cost expenditure after 2005/2006, required to sustain the village development. Neither had the source of this funding been determined, whether this was to be by the implementing agency, the individual village community or by Government. Much emphasis was being placed on the ability of the individual village SHGs and/or federations of village SHGs to provide services to sustain village development. At the time of the study, planning was at an early stage and no estimates of costs and cost recovery had been developed. In the

Project Costs
AN8-6
DFID / India: Western India Rainfed Farming Project / Final Report / October 2005
absence of a projected village development business plan, ongoing recurrent costs have been calculated as percentages of annual and or accumulated investment costs. These estimates are summarised in Table A8.4.
Table A8.4: Recurrent Cost Estimates
Investment Cost Head / Subhead Recurrent Cost Assumption Percent
A. Administration Costs
Project Head Quarters
Staff Costs Percent of final year staff cost 10%
Office Costs Percent of final year cost 10%
Equipment Costs Percent of final year cost 10%
Capital Costs Percent of final year cost 10%
DFIDI Consultancy Contract None Zero
Coordination Offices (GVT/IFFDC)
Staff Costs Percent off final year staff cost 10%
Office Costs Percent of final year cost 10%
Equipment Costs Percent of final year cost 10%
Capital Costs Percent of final year cost 10%
B. Development Costs
Component A
1 PPGF Percent of final year cost 2.5%
2 VOD Percent of final year cost 5%
3 Crop Technology None 2.5%
4 SWC Annual O and M, percent of cumulated investment cost
12.5%
5 WRD Annual O and M, percent of cumulated investment cost
15%
6 Livestock Percent of final year cost 10%
7 Forestry Percent of final year cost 10%
8 Migration Labour Support Percent of final year cost 10%
Other Development Costs Not Apllicable
Source: Cost Benefit Analysis Study January 2005. GVT = Gramin Vikas Trust, IFFDC = Indian Farm Forestry Development Cooperative. DFIDI = Department for International Development (India), PPGF = Participatory Planning and Group Formation, VOD = Village Organisation and Development, SWC = Soil and Water Conservation, WRD = Water Resource Development, O and M = Annual Operation and Maintenance.

Project Costs
AN8-7
DFID / India: Western India Rainfed Farming Project / Final Report / October 2005
Cost Inflation
For the purpose of identifying the impact of cost inflation, it has been assumed that project investment costs relate to the actual expenditure in the relevant financial year and that the budget figures for 2004/2005 and 2005/2006 are projected in constant 2003/2004 terms. The major benefits resulting from the development activity investment relate to the crop incremental benefits as measured in by the Net Income Study1/ over the period 2002/2003. In relating cost and benefit streams, it is proposed that these should be valued in constant 2002/2003 terms. Investment costs disbursed before this year should therefore be adjusted to reflect their 2002/2003 equivalent value. The index for wholesale prices of all commodities in India, over the initial period of the project, is set out in Table A8.5 together with the indicative deflation factor relevant to this analysis. The factor is considered insignificant to the overall analysis of the sample villages and has therefore been excluded for the computations.
Table A8.5: Project Cost Deflation Index
Year Wholesale Price Index 1/ Project Cost Deflation Index
1998 / 1999 140.7 84.30
1999 / 2000 145.3 87.06
2000 / 2001 155.7 93.29
2001 / 2002 161.3 96.64
2002 / 2003 166.9 100.00
Source: Office of the Economic Adviser, Ministry of Industry, and Government of India. 1/ All commodities, base 1993 / 1994 = 100.
Conversion of Financial Costs to Economic Values
The economic analysis measures the contribution of the project to the development of the economy of the country or society as a whole and that this contribution is sufficient to justify the use of the scarce capital resource required for implementation. Financial prices are adjusted to reflect the value of these costs to society as a whole and are identified as adjustment for (a) direct transfer payments such as commodity taxes and duties, staff salary taxes and any subsidies, (b) price distortions relating to traded and non traded items, and (c) wage rates in the project area. Such adjusted prices are commonly referred to as shadow prices.
For the purpose of the analysis, no premium has been assigned to any foreign exchange portion of implementation costs. A conversion factor of 0.9 has been used to adjust administration costs, excluding DFIDI consultancy contracts, and development cost for direct transfer payments. The effects of any subsidy on building materials are considered negligible and as a result ignored. Further, it is assumed that, financial prices generally reflect the economic value of traded and non-traded materials used in any project construction activities.
1/ Study of Impact of WIRFP on Net Incomes of Target Households, January 2004, sees also Annex 11.
Project Costs
AN8-8
DFID / India: Western India Rainfed Farming Project / Final Report / October 2005
The financial expenditure for SWC and WRD construction works include a significant proportion of both skilled and unskilled labour costs. The unskilled labour component was estimated used the government wage rate prevailing in the project area. For the purpose of the analysis, it has been assumed that the wage rate for skill labour (masons) accurately reflects their opportunity cost. For unskilled casual labour, especially during the rabi season when most of the construction work was undertaken, the government rate does not accurately reflect the opportunity cost of rural labour where seasonal under employment is prevalent. As a result, a social conversion factor of 0.75 has been applied to the costs of SWC and WRD activities to reflect the economic value of such construction, which uses a high percentage local unskilled village labour. A more accurate assessment of the shadow wage rate will be possible following analysis of the results of the migration labour survey aimed at determining the net wage rates obtained by household members who migrate to major urban centres for employment during the dry season.
For the analysis, all costs and benefits are valued in the local Rupee currency and an opportunity cost of capital of 12 percent, evaluated over a twenty-year period, has been used as the measure of the contribution of the project to rural development in India. The conversion factors (CF) and social conversion factors (SCF) assumptions for the various administration and development cost subheads are set out in Table A8.6.

Project Costs
AN8-9
DFID / India: Western India Rainfed Farming Project / Final Report / October 2005
Table A8.6: Economic Conversion Factors
Cost Head / Subhead Conversion Factor (CF)
Social Conversion Factor (SCF)
A. Administration Costs
Coordination Offices (GVT/IFFDC)
Staff Costs 0.90 1.00
Office Costs 0.90 1.00
Equipment Costs 0.90 1.00
Capital Costs 0.90 1.00
DFIDI Consultancy Contract 1.00 1.00
B. Development Costs
Component A
1 PPGF 0.90 1.00
2 VOD 0.90 1.00
3 Crop Technology 0.90 1.00
4 SWC 0.90 0.75
5 WRD 0.90 0.75
6 Livestock 0.90 1.00
7 Forestry 0.90 1.00
8 Migration Labour Support 0.90 1.00
Other Development Costs Not Applicable
Source: Cost Benefit Analysis Study January 2005. GVT = Gramin Vikas Trust, IFFDC = Indian Farm Forestry Development Cooperative. DFIDI = Department for International Development (India). PPGF = Participatory Planning and Group Formation, VOD = Village Organisation and Development, SWC = Soil and Water Conservation, WRD = Water Resource Development Lessons Learnt
A number of comments relating to the identification of actual/budget project costs are given below:
• The identification of ‘actual’ investment costs per village has been complex, as expenditure records maintained by the accounts department are not recorded by individual village. Project M andE should insist at the outset of the project, that investment and recurrent expenditure, be analysed as per the village unit identified in the project proposal if a completion report cost benefit analysis is to be under taken.

Project Costs
AN8-10
DFID / India: Western India Rainfed Farming Project / Final Report / October 2005
• The ‘budget’ investment costs (both administration and development) are prepared at PHQ for the individual state coordination office. This resulted in a lack of a clear allocation at village level suggesting a top - down approach, which is not reconcilable with concept of a village development plan.
• Little concrete evidence existed as to the ongoing physical resources and annual recurrent expenditure requirements and possible funding sources, whether they be the implementing agency, Government or the village community itself, to sustain village development.
• Major WRD structures, such as the lift irrigation scheme being constructed at Gara village, need detailed business plans to identify the ongoing operation and maintenance costs for the scheme and more importantly the resulting water or other charges that will be required to meet these ongoing operation and maintenance costs.

WIRFP - Phase II - Cost Benefit Analysis Study
Tables AN8.0: Project Costs (Financial / Economic Values)
Project Investment CostTable AN8.1 WIRFP - Phase II: Core Village Development Years 1999/00 to 2004/05Table AN8.2 WIRFP - Phase II: Total Investment Cost Summary Years 1990/00 to 2005/06 (Rs '000).Table AN8.3 WIRFP - Phase II: DFIDI Consultancy Contract (Financial) Years 1999/00 to 2004/05.GVT Investment CostTable AN8.4 WIRFP - Phase II: Total Investment Cost (Financial) - GVT, DFIDI, Community and Government (Rs '000).
WIRFP - Phase II: Total Investment Cost (Economic) - GVT, DFIDI, Community and Government (Rs '000).Table AN8.5 WIRFP - Phase II: Indicative Average Cost per Village (Financial) - GVT, IFFDC, DFIDI, Community and Government (Rs '000).
WIRFP - Phase II: Indicative Average Cost per Village (Economic) - GVT, IFFDC, DFIDI, Community and Government (Rs '000).GVT Investment Cost - Bhopal HeadquartersTable AN8.6 WIRFP - Phase II: Bhopal Head Quarters Total Investment Cost (Financial) - GVT, DFID, Community and Government (Rs '000).
WIRFP - Phase II: Bhopal Head Quarters Total Investment Cost (Economic) - GVT, DFID, Community and Government (Rs '000).Table AN8.7 WIRFP - Phase II: Bhopal Head Quarters Total Indicative Investment Cost per Village (Financial) - GVT, DFIDI, Community and Government (Rs '000).
WIRFP - Phase II: Bhopal Head Quarters Total Indicative Investment Cost per Village (Economic) - GVT, DFIDI, Community and Government (Rs '000).GVT Investment Cost - Gujarat - DahodTable AN8.8 WIRFP - Phase II: Gujarat - Dahod: Actual Investment Cost (Financial) - GVT, DFIDI, Community and Government (Rs '000).
WIRFP - Phase II: Gujarat - Dahod: Actual Investment Cost (Economic) - GVT, DFIDI, Community and Government (Rs '000).Table AN8.9 WIRFP - Phase II: Gujarat - Dahod: Indicative Investment Cost per Village (Financial) - GVT, DFIDI, Community and Government (Rs '000).
WIRFP - Phase II: Gujarat - Dahod: Indicative Investment Cost per Village (Economic) - GVT, DFIDI, Community and Government (Rs '000).Table AN8.10 WIRFP - Phase II: Gujarat - Dahod: Summary of Investment Costs Per Village - Financial / Economic (Rs'000).GVT Investment Cost - Madhya Pradesh - JabhuaTable AN8.11 WIRFP - Phase II: Madhya Pradesh - Jabhua: Actual Investment Cost (Financial) - GVT, DFIDI, Community and Government (Rs'000).
WIRFP - Phase II: Madhya Pradesh - Jabhua: Actual Investment Cost (Economic) - GVT, DFIDI, Community and Government (Rs'000).Table AN8.12 WIRFP - Phase II: Madhya Pradesh - Jabhua: Indicative Investment Cost per Village (Financial) - GVT, DFIDI, Community and Government (Rs'000).
WIRFP - Phase II: Madhya Pradesh - Jabhua: Indicative Investment Cost per Village (Economic) - GVT, DFIDI, Community and Government (Rs'000).Table AN8.13 WIRFP - Phase II: Madhya Pradesh - Jhabua: Summary of Investment Costs Per Village - Financial (Rs'000).
WIRFP - Phase II: Madhya Pradesh - Jhabua: Summary of Investment Costs Per Village - Economic (Rs'000).GVT Investment Cost - Rajastan - BanswaraTable AN8.14 WIRFP - Phase II: Rajasthan - Banswara: Actual Investment Cost (Financial) - GVT, DFIDI, Community and Government (Rs'000).
WIRFP - Phase II: Rajasthan - Banswara: Actual Investment Cost (Economic) - GVT, DFIDI, Community and Government (Rs'000).Table AN8.15 WIRFP - Phase II: Rajasthan - Banswara: Indicative Investment Cost per Village (Financial) - GVT, DFIDI, Community and Government (Rs'000).
WIRFP - Phase II: Rajasthan - Banswara: Indicative Investment Cost per Village (Economic) - GVT, DFIDI, Community and Government (Rs'000).Table AN8.16 WIRFP - Phase II: Rajasthan - Banswara: Summary of Investment Costs Per Village - Financial (Rs'000).
WIRFP - Phase II: Rajasthan - Banswara: Summary of Investment Costs Per Village - Economic (Rs'000).IFFDC Investment Cost - Rajastan - PatapgarhTable AN8.17 WIRFP - Phase II: Rajasthan - Pratapgarh: Actual Investment Cost (Financial) - IFFDC, DFIDI, Community and Government (Rs'000).
WIRFP - Phase II: Rajasthan - Pratapgarh: Actual Investment Cost (Economic) - IFFDC, DFIDI, Community and Government (Rs'000).Table AN8.18 WIRFP - Phase II: Rajasthan - Pratapgarh: Indicative Investment Cost per Village (Financial) - IFFDC, DFIDI, Community and Government (Rs'000).
WIRFP - Phase II: Rajasthan - Pratapgarh: Indicative Investment Cost per Village (Economic) - IFFDC, DFIDI, Community and Government (Rs'000).Table AN8.19 WIRFP - Phase II: Rajasthan - Pratapgarh: Summary of Investment Costs Per Village - Financial (Rs'000).
WIRFP - Phase II: Rajasthan - Pratapgarh: Summary of Investment Costs Per Village - Economic (Rs'000).

Table AN8.1 WIRFP - Phase II: Core Village Development Years 1999/00 to 2004/05
Implementing AgentState / District 1999/00 2000/01 2001/02 2002/03 2003/04 2004/05 2005/06 Totals
Gramin Vikas Trust (GVT).Gujarat
DahodPer Year 5 15 - - - - - 20 Cumulated 5 20 20 20 20 20 20
Madhya Pradesh (MP)JhabuaPer Year 22 19 6 25 - - - 72 Cumulated 22 41 47 72 72 72 72
RatlamPer Year - - 18 32 - - - 50 Cumulated - - 18 50 50 50 50
RajastanBanswaraPer Year - 37 14 9 - - - 60 Cumulated - 37 51 60 60 60 60
Subtotal GVT Core VillagesPer Year 27 71 38 66 - - - 202 Cumulated 27 98 136 202 202 202 202
Indian Farm Forestry Development Cooperative (IFFDC)
RajastanPratapgarhPer Year 6 19 - - - - - 25 Cumulated 6 25 25 25 25 25 25
Madhya Pradesh (MP)
Ratlam - - - 50 - - - 50 Per Year - - - 50 50 50 50 Cumulated
Subtotal IFFDC Core VillagesPer Year 6 19 - 50 - - - 75 Cumulated 6 25 25 75 75 75 75
Total GVT and IFFDC Core VillagesPer Year 33 90 38 116 - - - 277 Cumulated 33 123 161 277 277 277 277
Source: Gramin Vikas Trust (GVT).Indian Farm Forestry Development Cooperative (IFFDC).

Table AN8.2 WIRFP - Phase II: Total Investment Cost Summary Years 1990/00 to 2005/06 (Rs '000).
Cost Head / SubheadIFFDC
Gujarat M Pradesh Rajastan GVT Gujarat M Pradesh Rajastan Rajastan(Rs'000) (%) (%) (Rs'000) (Rs'000) (Rs'000) (Rs'000) (%) (%)
A Administrative CostHead Quarter Allocation 383.7 8% 22% 383.7 383.7 383.7 432.5 10% 18% 345.4 345.4 345.4 345.4 389.2 DFIDI Consultancy 338.6 7% 20% 338.6 338.6 338.6 338.6 8% 14% 338.6 338.6 338.6 338.6 338.6 State Coordination Office 1,008.1 22% 58% 1,757.6 903.0 869.1 1,595.6 36% 67% 907.3 1,581.8 812.7 782.2 1,436.0
Total A 1,730.5 38% 100% 2,480.0 1,625.4 1,591.5 2,366.7 53% 100% 1,591.3 2,265.8 1,496.7 1,466.2 2,163.9 B Development Cost
Component A 1 PPGF 61.5 1% 3% 124.7 41.6 90.4 49.4 1% 2% 71.8 112.2 37.5 81.4 44.4 2 VOD 255.9 6% 12% 405.7 195.3 312.3 156.0 4% 8% 293.9 365.2 175.8 281.1 140.4 3 Crop Technology 161.9 4% 7% 228.4 134.2 209.4 98.1 2% 5% 179.9 205.5 120.8 188.4 88.3 4 SWC 909.9 20% 41% 1,132.1 796.7 1,091.8 175.1 4% 9% 750.1 764.2 537.7 737.0 118.2 5 WRD 611.7 13% 28% 641.4 616.4 692.8 1,396.1 31% 69% 447.9 432.9 416.1 467.6 942.4 6 Livestock 116.0 3% 5% 178.3 118.1 122.2 60.8 1% 3% 125.7 160.5 106.3 110.0 54.7 7 Forestry 79.5 2% 4% 134.1 82.7 60.2 75.9 2% 4% 86.8 120.7 74.4 54.2 68.3 8 Migration Support 13.3 0% 1% 34.4 11.7 7.3 - 0% 0% 12.0 30.9 10.5 6.5 -
Subtotal 2,209.7 49% 100% 2,879.1 1,996.7 2,586.3 2,011.4 45% 100% 1,968.1 2,192.2 1,479.1 1,926.1 1,456.7
Other Development Costs 612.5 13% 684.2 295.3 437.4 57.6 1% 655.6 615.8 265.7 393.7 51.8 Total B 2,822.3 62% 3,563.3 2,292.0 3,023.7 2,068.9 47% 2,623.7 2,808.0 1,744.9 2,319.8 1,508.5
Total A + B 4,552.8 100% 6,043.3 3,917.4 4,615.2 4,435.7 100% 4,215.0 5,073.8 3,241.6 3,786.0 3,672.4
Average Households / Village (No) 142 188 107 140 86
Average Componant A Cost Per Household (Rs'000) 15.6 15.3 18.7 18.5 23.4
Source: Cost Benefit Analysis (CBA) Study Estimates Jan 2005.
DFIDI = Department for International Development (India).PPGF = Participatory Planning and Group Formation.VOD = Village Organisation and Development.SWC = Soil and Water Conservation.WRD = Water Resource Development.
Indicative Average Costs Per Village (Econmic)GVT
Indicate Average Costs Per Village (Financial)
GVTIFFDC
RajastanGVT

Table AN8.3 WIRFP - Phase II: DFIDI Consultancy Contract (Financial) Years 1999/00 to 2004/05.
1999/00 2000/01 2001/02 2002/03 2003/04 2004/05 2005/06Cost Head / Subhead Actual Actual Actual Actual Actual Budget Budget (%)
Cosultancy Contract (UKL'000)Expatriate Fees 102.8 203.3 67.2 149.1 100.3 114.5 88.3 825.5 65%Indian Fees 22.7 57.2 19.5 43.3 43.0 38.6 25.2 249.4 20%Expenses 30.7 59.9 33.8 59.2 38.5 50.4 32.5 305.0 24%Subtotal 156.2 320.3 120.6 251.6 181.8 203.5 146.0 1,379.9 Adjustments \1 (13.3) (26.3) (10.1) (20.8) (13.9) (16.5) (12.1) (113.0)Total (UKL) 142.8 294.0 110.5 230.7 167.9 187.0 133.9 1,266.8 100%
Exchange Rate AssumptionsUKL 1.0 = Rs 69.5 67.3 67.5 75.9 78.2 81.0 81.0 74.0
Cosultancy Contract (Rs '000) 9,930.6 19,774.4 7,458.4 17,510.2 13,134.7 15,147.8 10,848.2 93,804.2 100%Allocation \2GVT Gujarat 717.0 1,427.8 538.5 1,264.3 948.4 1,093.7 783.3 6,772.9 7%
Madhya Pradesh - Jhabua 2,581.3 5,139.9 1,938.6 4,551.4 3,414.1 3,937.3 2,819.7 24,382.3 26%Madhya Pradesh - Ratlam 1,792.5 3,569.4 1,346.3 3,160.7 2,370.9 2,734.3 1,958.2 16,932.2 18%Rajasthan 2,151.0 4,283.3 1,615.5 3,792.8 2,845.1 3,281.1 2,349.8 20,318.6 22%Subtotal 7,241.8 14,420.3 5,438.9 12,769.1 9,578.3 11,046.4 7,910.9 68,405.9 73%
IFFDC 2,688.8 5,354.1 2,019.4 4,741.0 3,556.3 4,101.4 2,937.2 25,398.2 27%Total 9,930.6 19,774.4 7,458.4 17,510.2 13,134.7 15,147.8 10,848.2 93,804.2 100%
Per Village 35.9 71.4 26.9 63.2 47.4 54.7 39.2 338.6
Source: Department for International Development (India).\1 Component B and C estimated at 10 percent.\2 GVT Core Villages
Gujarat 20 M Pradesh - Jhabua 72 M Pradesh - Ratlam 50 Rajasthan 60 Subtotal 202
IFFDC Core Villages 75
Total
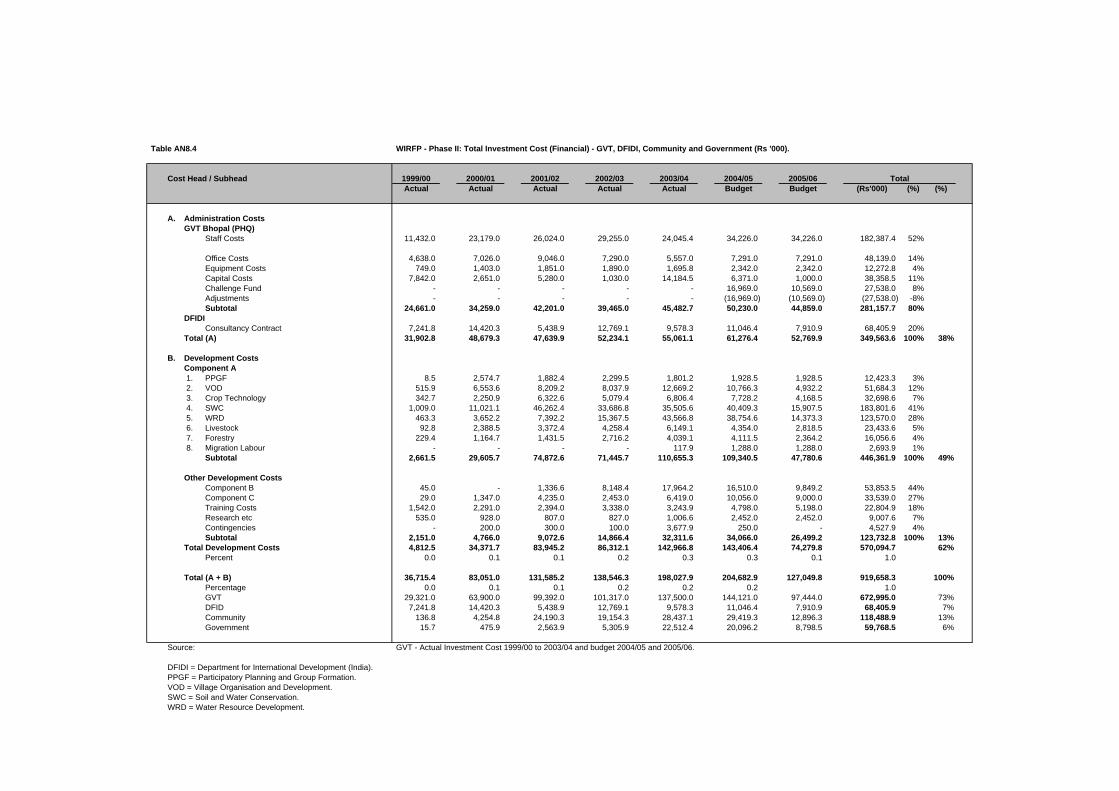
Table AN8.4 WIRFP - Phase II: Total Investment Cost (Financial) - GVT, DFIDI, Community and Government (Rs '000).
Cost Head / Subhead 1999/00 2000/01 2001/02 2002/03 2003/04 2004/05 2005/06Actual Actual Actual Actual Actual Budget Budget (Rs'000) (%) (%)
A. Administration CostsGVT Bhopal (PHQ)
Staff Costs 11,432.0 23,179.0 26,024.0 29,255.0 24,045.4 34,226.0 34,226.0 182,387.4 52%
Office Costs 4,638.0 7,026.0 9,046.0 7,290.0 5,557.0 7,291.0 7,291.0 48,139.0 14%Equipment Costs 749.0 1,403.0 1,851.0 1,890.0 1,695.8 2,342.0 2,342.0 12,272.8 4%Capital Costs 7,842.0 2,651.0 5,280.0 1,030.0 14,184.5 6,371.0 1,000.0 38,358.5 11%Challenge Fund - - - - - 16,969.0 10,569.0 27,538.0 8%Adjustments - - - - - (16,969.0) (10,569.0) (27,538.0) -8%Subtotal 24,661.0 34,259.0 42,201.0 39,465.0 45,482.7 50,230.0 44,859.0 281,157.7 80%
DFIDIConsultancy Contract 7,241.8 14,420.3 5,438.9 12,769.1 9,578.3 11,046.4 7,910.9 68,405.9 20%
Total (A) 31,902.8 48,679.3 47,639.9 52,234.1 55,061.1 61,276.4 52,769.9 349,563.6 100% 38%
B. Development CostsComponent A 1. PPGF 8.5 2,574.7 1,882.4 2,299.5 1,801.2 1,928.5 1,928.5 12,423.3 3% 2. VOD 515.9 6,553.6 8,209.2 8,037.9 12,669.2 10,766.3 4,932.2 51,684.3 12% 3. Crop Technology 342.7 2,250.9 6,322.6 5,079.4 6,806.4 7,728.2 4,168.5 32,698.6 7% 4. SWC 1,009.0 11,021.1 46,262.4 33,686.8 35,505.6 40,409.3 15,907.5 183,801.6 41% 5. WRD 463.3 3,652.2 7,392.2 15,367.5 43,566.8 38,754.6 14,373.3 123,570.0 28% 6. Livestock 92.8 2,388.5 3,372.4 4,258.4 6,149.1 4,354.0 2,818.5 23,433.6 5% 7. Forestry 229.4 1,164.7 1,431.5 2,716.2 4,039.1 4,111.5 2,364.2 16,056.6 4% 8. Migration Labour - - - - 117.9 1,288.0 1,288.0 2,693.9 1%
Subtotal 2,661.5 29,605.7 74,872.6 71,445.7 110,655.3 109,340.5 47,780.6 446,361.9 100% 49%
Other Development CostsComponent B 45.0 - 1,336.6 8,148.4 17,964.2 16,510.0 9,849.2 53,853.5 44%Component C 29.0 1,347.0 4,235.0 2,453.0 6,419.0 10,056.0 9,000.0 33,539.0 27%Training Costs 1,542.0 2,291.0 2,394.0 3,338.0 3,243.9 4,798.0 5,198.0 22,804.9 18%Research etc 535.0 928.0 807.0 827.0 1,006.6 2,452.0 2,452.0 9,007.6 7%Contingencies - 200.0 300.0 100.0 3,677.9 250.0 - 4,527.9 4%Subtotal 2,151.0 4,766.0 9,072.6 14,866.4 32,311.6 34,066.0 26,499.2 123,732.8 100% 13%
Total Development Costs 4,812.5 34,371.7 83,945.2 86,312.1 142,966.8 143,406.4 74,279.8 570,094.7 62%Percent 0.0 0.1 0.1 0.2 0.3 0.3 0.1 1.0
Total (A + B) 36,715.4 83,051.0 131,585.2 138,546.3 198,027.9 204,682.9 127,049.8 919,658.3 100%Percentage 0.0 0.1 0.1 0.2 0.2 0.2 1.0 GVT 29,321.0 63,900.0 99,392.0 101,317.0 137,500.0 144,121.0 97,444.0 672,995.0 73%DFID 7,241.8 14,420.3 5,438.9 12,769.1 9,578.3 11,046.4 7,910.9 68,405.9 7%Community 136.8 4,254.8 24,190.3 19,154.3 28,437.1 29,419.3 12,896.3 118,488.9 13%Government 15.7 475.9 2,563.9 5,305.9 22,512.4 20,096.2 8,798.5 59,768.5 6%
Source: GVT - Actual Investment Cost 1999/00 to 2003/04 and budget 2004/05 and 2005/06.
DFIDI = Department for International Development (India).PPGF = Participatory Planning and Group Formation.VOD = Village Organisation and Development.SWC = Soil and Water Conservation.WRD = Water Resource Development.
Total

Table AN8.4
Cost Head / Subhead
A. Administration CostsGVT Bhopal (PHQ)
Staff Costs
Office CostsEquipment CostsCapital CostsChallenge FundAdjustmentsSubtotal
DFIDIConsultancy Contract
Total (A)
B. Development CostsComponent A 1. PPGF 2. VOD 3. Crop Technology 4. SWC 5. WRD 6. Livestock 7. Forestry 8. Migration Labour
Subtotal
Other Development CostsComponent BComponent CTraining CostsResearch etcContingenciesSubtotal
Total Development CostsPercent
Total (A + B)PercentageGVTDFIDCommunityGovernment
Source:
DFIDI = Department for International Development (India).PPGF = Participatory Planning and Group Formation.VOD = Village Organisation and Development.SWC = Soil and Water Conservation.WRD = Water Resource Development.
WIRFP - Phase II: Total Investment Cost (Economic) - GVT, DFIDI, Community and Government (Rs '000).
1999/00 2000/01 2001/02 2002/03 2003/04 2004/05 2005/06 TotalsCF SCF Actual Actual Actual Actual Actual Budget Budget (Rs'000) (%)
0.90 1.00 10,288.8 20,861.1 23,421.6 26,329.5 21,640.9 30,803.4 30,803.4 164,148.7 0.90 1.00 0.90 1.00 4,174.2 6,323.4 8,141.4 6,561.0 5,001.3 6,561.9 6,561.9 43,325.1 0.90 1.00 674.1 1,262.7 1,665.9 1,701.0 1,526.3 2,107.8 2,107.8 11,045.6 0.90 1.00 7,057.8 2,385.9 4,752.0 927.0 12,766.0 5,733.9 900.0 34,522.6 0.90 1.00 - - - - - 15,272.1 9,512.1 24,784.2 0.90 1.00 - - - - - (15,272.1) (9,512.1) (24,784.2)
22,194.9 30,833.1 37,980.9 35,518.5 40,934.4 45,207.0 40,373.1 253,041.9 79%
1.00 1.00 7,241.8 14,420.3 5,438.9 12,769.1 9,578.3 11,046.4 7,910.9 68,405.9 21%29,436.7 45,253.4 43,419.8 48,287.6 50,512.8 56,253.4 48,284.0 321,447.9 42%
0.90 1.00 7.6 2,317.2 1,694.1 2,069.5 1,621.1 1,735.7 1,735.7 11,181.0 0.90 1.00 464.3 5,898.3 7,388.3 7,234.1 11,402.3 9,689.7 4,438.9 46,515.9 0.90 1.00 308.4 2,025.8 5,690.3 4,571.5 6,125.7 6,955.4 3,751.6 29,428.7 0.90 0.75 681.1 7,439.2 31,227.1 22,738.6 23,966.3 27,276.3 10,737.6 124,066.1 0.90 0.75 312.7 2,465.2 4,989.7 10,373.1 29,407.6 26,159.4 9,702.0 83,409.7 0.90 1.00 83.5 2,149.7 3,035.1 3,832.5 5,534.2 3,918.6 2,536.6 21,090.3 0.90 1.00 206.5 1,048.2 1,288.4 2,444.6 3,635.2 3,700.3 2,127.8 14,450.9 0.90 1.00 - - - - 106.1 1,159.2 1,159.2 2,424.5
2,064.1 23,343.6 55,313.1 53,263.9 81,798.5 80,594.5 36,189.4 332,567.1 43%
0.90 1.00 40.5 - 1,203.0 7,333.6 16,167.8 14,859.0 8,864.3 48,468.1 0.90 1.00 26.1 1,212.3 3,811.5 2,207.7 5,777.1 9,050.4 8,100.0 30,185.1 0.90 1.00 1,387.8 2,061.9 2,154.6 3,004.2 2,919.5 4,318.2 4,678.2 20,524.4 0.90 1.00 481.5 835.2 726.3 744.3 905.9 2,206.8 2,206.8 8,106.8 0.90 1.00 - 180.0 270.0 90.0 3,310.1 225.0 - 4,075.1
1,935.9 4,289.4 8,165.4 13,379.8 29,080.4 30,659.4 23,849.3 111,359.5 15%4,000.0 27,633.0 63,478.4 66,643.7 110,878.9 111,253.9 60,038.7 443,926.6 58%
33,436.8 72,886.4 106,898.3 114,931.3 161,391.6 167,507.3 108,322.7 765,374.5 100%
Cost Benefit Analysis (CBA) Study Estimates Jan 2005.
Conversion Factors

Table AN8.5 WIRFP - Phase II: Indicative Average Cost per Village (Financial) - GVT, IFFDC, DFIDI, Community and Government (Rs '000).
Cost Head / Subhead 1999/00 2000/01 2001/02 2002/03 2003/04 2004/05 2005/06Actual Actual Actual Actual Actual Budget Budget (Rs'000) (%) (%)
A. Administration CostsGVT Bhopal (PHQ) 122.1 169.6 208.9 195.4 225.2 248.7 222.1 1,391.9 DFIDI 35.9 71.4 26.9 63.2 47.4 54.7 39.2 338.6 Total (A) 157.9 241.0 235.8 258.6 272.6 303.3 261.2 1,730.5 100% 38%
B. Development CostsComponent A 1. PPGF 0.0 12.7 9.3 11.4 8.9 9.5 9.5 61.5 3% 2. VOD 2.6 32.4 40.6 39.8 62.7 53.3 24.4 255.9 12% 3. Crop Technology 1.7 11.1 31.3 25.1 33.7 38.3 20.6 161.9 7% 4. SWC 5.0 54.6 229.0 166.8 175.8 200.0 78.7 909.9 41% 5. WRD 2.3 18.1 36.6 76.1 215.7 191.9 71.2 611.7 28% 6. Livestock 0.5 11.8 16.7 21.1 30.4 21.6 14.0 116.0 5% 7. Forestry 1.1 5.8 7.1 13.4 20.0 20.4 11.7 79.5 4% 8. Migration Labour - - - - 0.6 6.4 6.4 13.3 1%
Subtotal 13.2 146.6 370.7 353.7 547.8 541.3 236.5 2,209.7 100% 49%Other Development Costs
Subtotal 10.6 23.6 44.9 73.6 160.0 168.6 131.2 612.5 100% 13%Total Development Costs 23.8 170.2 415.6 427.3 707.8 709.9 367.7 2,822.3 62%
Percent
Total (A + B) 181.8 411.1 651.4 685.9 980.3 1,013.3 629.0 4,552.8 100%GVT 145.2 316.3 492.0 501.6 680.7 713.5 482.4 3,331.7 73%DFID 35.9 71.4 26.9 63.2 47.4 54.7 39.2 338.6 7%Community 0.7 21.1 119.8 94.8 140.8 145.6 63.8 586.6 13%Government 0.1 2.4 12.7 26.3 111.4 99.5 43.6 295.9 6%
Core Village EntryPer Year 27 71 38 66 - - - 202 Cumulated 27 98 136 202 202 202 202
Source: GVT - Actual Investment Cost 1999/00 to 2003/04 and budget 2004/05 and 2005/06.
DFIDI = Department for International Development (India).PPGF = Participatory Planning and Group Formation.VOD = Village Organisation and Development.SWC = Soil and Water Conservation.WRD = Water Resource Development.
Total

Table AN8.5
Cost Head / Subhead
A. Administration CostsGVT Bhopal (PHQ)DFIDITotal (A)
B. Development CostsComponent A 1. PPGF 2. VOD 3. Crop Technology 4. SWC 5. WRD 6. Livestock 7. Forestry 8. Migration Labour
SubtotalOther Development Costs
SubtotalTotal Development Costs
Percent
Total (A + B)GVTDFIDCommunityGovernment
Core Village EntryPer YearCumulated
Source:
DFIDI = Department for International Development (India).PPGF = Participatory Planning and Group Formation.VOD = Village Organisation and Development.SWC = Soil and Water Conservation.WRD = Water Resource Development.
WIRFP - Phase II: Indicative Average Cost per Village (Economic) - GVT, IFFDC, DFIDI, Community and Government (Rs '000).
1999/00 2000/01 2001/02 2002/03 2003/04 2004/05 2005/06 TotalsCF SCF Actual Actual Actual Actual Actual Budget Budget (Rs'000) (%)
0.9 1.0 109.9 152.6 188.0 175.8 202.6 223.8 199.9 1,252.7 1.0 1.0 35.9 71.4 26.9 63.2 47.4 54.7 39.2 338.6
145.7 461.8 319.3 239.0 250.1 278.5 239.0 1,933.4 42%
0.90 1.00 0.3 23.6 12.5 10.2 8.0 8.6 8.6 71.8 0.90 1.00 17.2 60.2 54.3 35.8 56.4 48.0 22.0 293.9 0.90 1.00 11.4 20.7 41.8 22.6 30.3 34.4 18.6 179.9 0.90 0.75 25.2 75.9 229.6 112.6 118.6 135.0 53.2 750.1 0.90 0.75 11.6 25.2 36.7 51.4 145.6 129.5 48.0 447.9 0.90 1.00 3.1 21.9 22.3 19.0 27.4 19.4 12.6 125.7 0.90 1.00 7.6 10.7 9.5 12.1 18.0 18.3 10.5 86.8 0.90 1.00 - - - - 0.5 5.7 5.7 12.0
76.4 238.2 406.7 263.7 404.9 399.0 179.2 1,968.1 43%
71.7 43.8 60.0 66.2 144.0 151.8 118.1 655.6 14%148.1 282.0 466.8 329.9 548.9 550.8 297.2 2,623.7 58%
293.9 743.7 786.0 569.0 799.0 829.2 536.3 4,557.1 100%
27 71 38 66 - - - 27 98 136 202 202 202 202
Cost Benefit Analysis (CBA) Study Estimates Jan 2005.
Conversion Factors

Table AN8.6 WIRFP - Phase II: Bhopal Head Quarters Total Investment Cost (Financial) - GVT, DFID, Community and Government (Rs '000).
Cost Head / Subhead 1999/00 2000/01 2001/02 2002/03 2003/04 2004/05 2004/06Actual Actual Actual Actual Actual Budget Budget (Rs'000) (%)
A Administrative CostGVT Bhopal (Project HQ)
Staff Cost A - 7,135.6 8,108.7 9,102.0 5,234.1 8,569.0 8,569.0 46,718.4 22%Staff Cost B - - - - - 750.0 750.0 1,500.0 1%Office Cost - 3,389.1 5,139.5 3,672.6 1,470.6 2,082.0 2,082.0 17,835.7 8%Equipment Cost - 507.4 914.6 652.7 374.8 349.0 349.0 3,147.4 1%Capital Cost - 1,141.3 1,076.4 163.8 3,585.1 1,748.0 600.0 8,314.7 4%Challenge Fund - - - - - 16,969.0 10,569.0 27,538.0 13%Adjustment - - - - - (16,969.0) (10,569.0) (27,538.0) -13%Subtotal - 12,173.3 15,239.3 13,591.1 10,664.6 13,498.0 12,350.0 77,516.2 36%
DFIDIConsultant Contract 7,241.8 14,420.3 5,438.9 12,769.1 9,578.3 11,046.4 7,910.9 68,405.9 32%
Total A 7,241.8 26,593.6 20,678.2 26,360.3 20,242.9 24,544.4 20,260.9 145,922.1 68%
B Development CostComponent A
1. PPGF - - - - - - - - 0%2. VOD - - - - - - - - 0%3. Crop Technology - - - - - - - - 0%4. SWC - - - - - - - - 0%5. WRD \1 - - - 2,525.4 13,335.0 6,982.0 - 22,842.4 11%6. Livestock - - - - - - 0%7. Forestry - - - - - - - - 0%8. Migration Support - - - - - - - - 0%
Subtotal - - - 2,525.4 13,335.0 6,982.0 - 22,842.4 11%
Other Development CostsComponent - B & Dissemination - - 558.0 292.8 - - - 850.7 0%Component - C - 1,347.0 4,134.0 2,336.7 6,272.4 10,056.0 9,000.0 33,146.0 15%Training Cost - 451.6 124.7 307.3 216.3 2,500.0 3,500.0 7,100.0 3%Research, Evaluation & Workshop Cost - 467.2 361.0 397.7 556.1 1,000.0 1,000.0 3,782.0 2%Contingencies - - - - 141.8 250.0 - 391.8 0%Subtotal - 2,265.8 5,177.7 3,334.5 7,186.7 13,806.0 13,500.0 45,270.6 21%
Total B - 2,265.8 5,177.7 5,859.9 20,521.6 20,788.0 13,500.0 68,113.0 32%
Total A + B 7,241.8 28,859.4 25,855.9 32,220.1 40,764.5 45,332.4 33,760.9 214,035.1 100%
Source: GVT - Actual Investment Cost 1999/00 to 2003/04 and budget 2004/05 and 2005/06.\1 Sadguru Water and Development Foundation - large scale contracts.DFIDI = Department for International Development (India).PPGF = Participatory Planning and Group Formation.VOD = Village Organisation and Development.SWC = Soil and Water Conservation.WRD = Water Resource Development.
Total
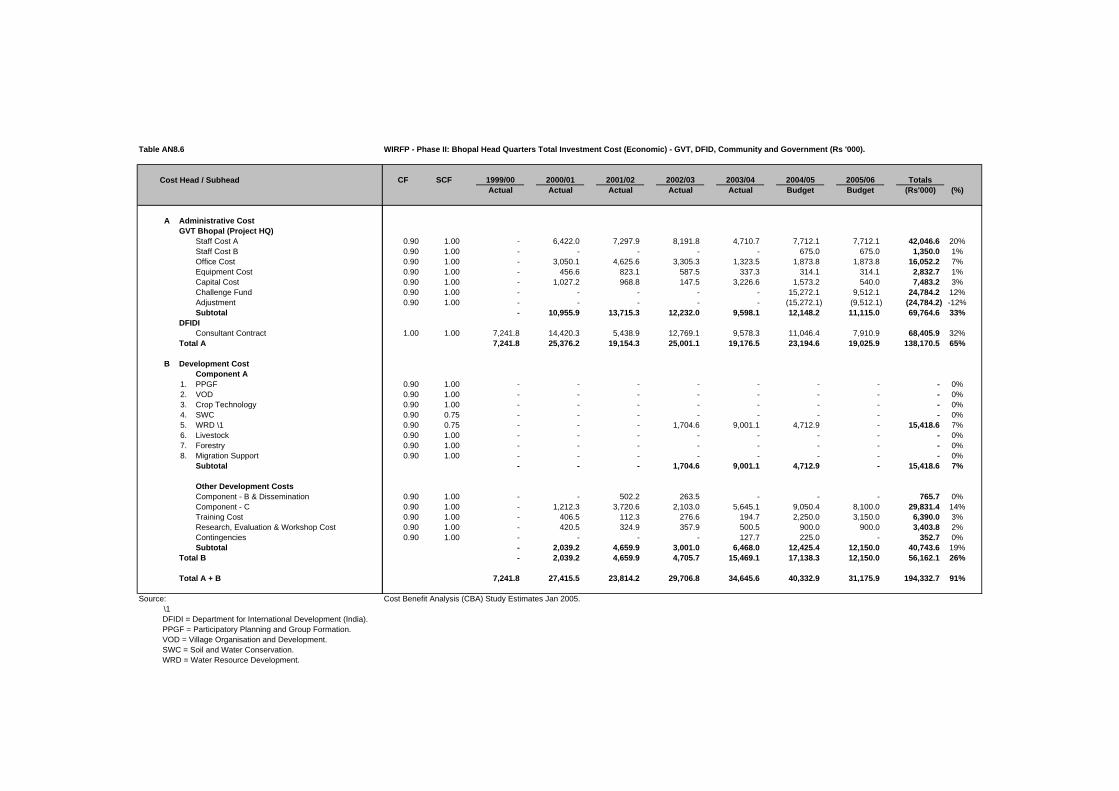
Table AN8.6
Cost Head / Subhead
A Administrative CostGVT Bhopal (Project HQ)
Staff Cost AStaff Cost BOffice CostEquipment CostCapital CostChallenge FundAdjustmentSubtotal
DFIDIConsultant Contract
Total A
B Development CostComponent A
1. PPGF2. VOD3. Crop Technology4. SWC5. WRD \16. Livestock7. Forestry8. Migration Support
Subtotal
Other Development CostsComponent - B & DisseminationComponent - CTraining CostResearch, Evaluation & Workshop CostContingenciesSubtotal
Total B
Total A + B
Source:\1DFIDI = Department for International Development (India).PPGF = Participatory Planning and Group Formation.VOD = Village Organisation and Development.SWC = Soil and Water Conservation.WRD = Water Resource Development.
WIRFP - Phase II: Bhopal Head Quarters Total Investment Cost (Economic) - GVT, DFID, Community and Government (Rs '000).
CF SCF 1999/00 2000/01 2001/02 2002/03 2003/04 2004/05 2005/06 TotalsActual Actual Actual Actual Actual Budget Budget (Rs'000) (%)
0.90 1.00 - 6,422.0 7,297.9 8,191.8 4,710.7 7,712.1 7,712.1 42,046.6 20%0.90 1.00 - - - - - 675.0 675.0 1,350.0 1%0.90 1.00 - 3,050.1 4,625.6 3,305.3 1,323.5 1,873.8 1,873.8 16,052.2 7%0.90 1.00 - 456.6 823.1 587.5 337.3 314.1 314.1 2,832.7 1%0.90 1.00 - 1,027.2 968.8 147.5 3,226.6 1,573.2 540.0 7,483.2 3%0.90 1.00 - - - - - 15,272.1 9,512.1 24,784.2 12%0.90 1.00 - - - - - (15,272.1) (9,512.1) (24,784.2) -12%
- 10,955.9 13,715.3 12,232.0 9,598.1 12,148.2 11,115.0 69,764.6 33%
1.00 1.00 7,241.8 14,420.3 5,438.9 12,769.1 9,578.3 11,046.4 7,910.9 68,405.9 32%7,241.8 25,376.2 19,154.3 25,001.1 19,176.5 23,194.6 19,025.9 138,170.5 65%
0.90 1.00 - - - - - - - - 0%0.90 1.00 - - - - - - - - 0%0.90 1.00 - - - - - - - - 0%0.90 0.75 - - - - - - - - 0%0.90 0.75 - - - 1,704.6 9,001.1 4,712.9 - 15,418.6 7%0.90 1.00 - - - - - - - - 0%0.90 1.00 - - - - - - - - 0%0.90 1.00 - - - - - - - - 0%
- - - 1,704.6 9,001.1 4,712.9 - 15,418.6 7%
0.90 1.00 - - 502.2 263.5 - - - 765.7 0%0.90 1.00 - 1,212.3 3,720.6 2,103.0 5,645.1 9,050.4 8,100.0 29,831.4 14%0.90 1.00 - 406.5 112.3 276.6 194.7 2,250.0 3,150.0 6,390.0 3%0.90 1.00 - 420.5 324.9 357.9 500.5 900.0 900.0 3,403.8 2%0.90 1.00 - - - - 127.7 225.0 - 352.7 0%
- 2,039.2 4,659.9 3,001.0 6,468.0 12,425.4 12,150.0 40,743.6 19%- 2,039.2 4,659.9 4,705.7 15,469.1 17,138.3 12,150.0 56,162.1 26%
7,241.8 27,415.5 23,814.2 29,706.8 34,645.6 40,332.9 31,175.9 194,332.7 91%
Cost Benefit Analysis (CBA) Study Estimates Jan 2005.
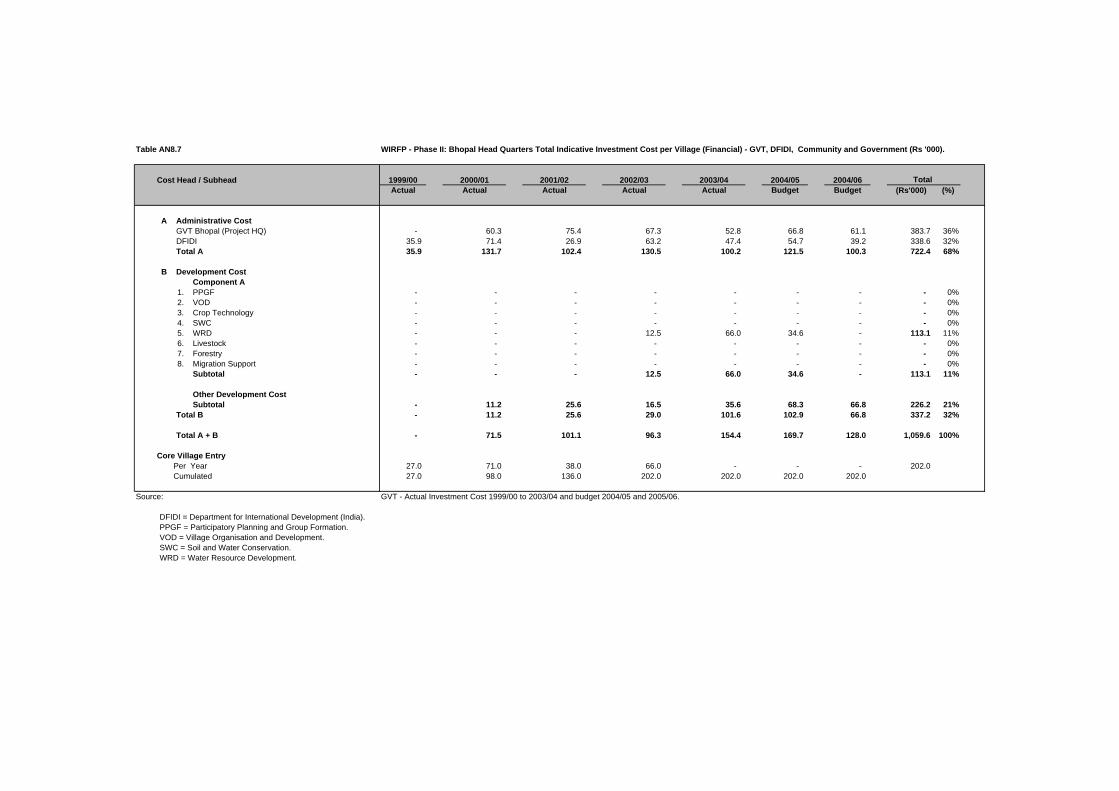
Table AN8.7 WIRFP - Phase II: Bhopal Head Quarters Total Indicative Investment Cost per Village (Financial) - GVT, DFIDI, Community and Government (Rs '000).
Cost Head / Subhead 1999/00 2000/01 2001/02 2002/03 2003/04 2004/05 2004/06Actual Actual Actual Actual Actual Budget Budget (Rs'000) (%)
A Administrative CostGVT Bhopal (Project HQ) - 60.3 75.4 67.3 52.8 66.8 61.1 383.7 36%DFIDI 35.9 71.4 26.9 63.2 47.4 54.7 39.2 338.6 32%Total A 35.9 131.7 102.4 130.5 100.2 121.5 100.3 722.4 68%
B Development CostComponent A
1. PPGF - - - - - - - - 0%2. VOD - - - - - - - - 0%3. Crop Technology - - - - - - - - 0%4. SWC - - - - - - - - 0%5. WRD - - - 12.5 66.0 34.6 - 113.1 11%6. Livestock - - - - - - - - 0%7. Forestry - - - - - - - - 0%8. Migration Support - - - - - - - - 0%
Subtotal - - - 12.5 66.0 34.6 - 113.1 11%
Other Development CostSubtotal - 11.2 25.6 16.5 35.6 68.3 66.8 226.2 21%
Total B - 11.2 25.6 29.0 101.6 102.9 66.8 337.2 32%
Total A + B - 71.5 101.1 96.3 154.4 169.7 128.0 1,059.6 100%
Core Village EntryPer Year 27.0 71.0 38.0 66.0 - - - 202.0 Cumulated 27.0 98.0 136.0 202.0 202.0 202.0 202.0
Source: GVT - Actual Investment Cost 1999/00 to 2003/04 and budget 2004/05 and 2005/06.
DFIDI = Department for International Development (India).PPGF = Participatory Planning and Group Formation.VOD = Village Organisation and Development.SWC = Soil and Water Conservation.WRD = Water Resource Development.
Total

Table AN8.7
Cost Head / Subhead
A Administrative CostGVT Bhopal (Project HQ)DFIDITotal A
B Development CostComponent A
1. PPGF2. VOD3. Crop Technology4. SWC5. WRD6. Livestock7. Forestry8. Migration Support
Subtotal
Other Development CostSubtotal
Total B
Total A + B
Core Village EntryPer YearCumulated
Source:
DFIDI = Department for International Development (India).PPGF = Participatory Planning and Group Formation.VOD = Village Organisation and Development.SWC = Soil and Water Conservation.WRD = Water Resource Development.
WIRFP - Phase II: Bhopal Head Quarters Total Indicative Investment Cost per Village (Economic) - GVT, DFIDI, Community and Government (Rs '000).
1999/00 2000/01 2001/02 2002/03 2003/04 2004/05 2005/06 TotalsActual Actual Actual Actual Actual Budget Budget (Rs'000) (%)
- 54.2 67.9 60.6 47.5 60.1 55.0 345.4 35.9 71.4 26.9 63.2 47.4 54.7 39.2 338.6 35.9 125.6 94.8 123.8 94.9 114.8 94.2 684.0 71%
- - - - - - - - - - - - - - - - - - - - - - - - - - - - - - - - - - - 8.4 44.6 23.3 - 76.3 - - - - - - - - - - - - - - - - - - - - - - - - - - - 8.4 44.6 23.3 - 76.3 8%
- 10.1 23.1 14.9 32.0 61.5 60.1 152.7 16%- 10.1 23.1 23.3 76.6 84.8 60.1 278.0 29%
35.9 135.7 117.9 147.1 171.5 199.7 154.3 962.0 100%
27 71 38 66 0 0 027 98 136 202 202 202 202
Cost Benefit Analysis (CBA) Study Estimates Jan 2005.

Table AN8.8 WIRFP - Phase II: Gujarat - Dahod: Actual Investment Cost (Financial) - GVT, DFIDI, Community and Government (Rs '000).
Cost Heads / Subhead 1999/00 2000/01 2001/02 2002/03 2003/04 2004/05 2005/06Actual Actual Actual Actual Actual Budget Budget (Rs'000) (%)
A Administrative CostGVT Bhopal (Project HQ)
Allocation - 1,205.3 1,508.8 1,345.7 1,055.9 1,336.4 1,222.8 7,674.9 6%DFIDI
Consultancy Contract 717.0 1,427.8 538.5 1,264.3 948.4 1,093.7 783.3 6,772.9 6%Dahod Coordination Office, Gujarat
Staff Cost A - 5,417.0 3,510.5 2,823.8 2,749.5 1,793.0 1,793.0 18,086.7 15%Staff Cost B - - - - - 2,200.0 2,200.0 4,400.0 4%Office Cost - 1,182.9 948.3 660.8 764.7 1,269.0 1,269.0 6,094.7 5%Equipment Cost - 323.7 294.7 205.0 125.7 432.0 432.0 1,813.0 2%Capital Cost - 391.4 597.0 99.0 972.2 2,598.0 100.0 4,757.5 4%Challenge Fund - - - - - - - - 0%Adjustments - - - - - - - - 0%Subtotal - 7,314.9 5,350.4 3,788.6 4,612.0 8,292.0 5,794.0 35,151.9 29%
Total A 717.0 9,948.0 7,397.8 6,398.5 6,616.2 10,722.1 7,800.0 49,599.7 41%
B Development CostComponent A
1 PPGF 1.6 765.4 306.1 439.8 416.8 282.0 282.0 2,493.6 2%2 VOD 14.2 2,117.1 1,600.7 967.5 1,335.2 1,433.2 647.0 8,115.0 7%3 Crop Technology 0.7 668.5 1,589.4 621.2 822.5 460.3 404.9 4,567.5 4%4 SWC - 2,586.9 6,651.7 5,406.0 3,828.2 2,914.9 1,253.8 22,641.5 19%5 WRD 10.2 862.2 1,311.2 1,740.2 3,993.0 3,491.8 1,419.4 12,828.1 11%6 Livestock 0.9 1,083.8 436.0 518.9 589.1 490.3 447.2 3,566.2 3%7 Forestry 0.6 745.6 486.4 312.4 373.5 404.2 359.9 2,682.6 2%8 Migration Support - - - - 11.7 338.0 338.0 687.7 1%
Subtotal 28.2 8,829.6 12,381.5 10,006.0 11,370.0 9,814.7 5,152.2 57,582.2 48%
Other Development CostsComponent - B & Dissemination - - 112.8 1,724.6 3,131.1 2,302.1 1,618.8 8,889.4 7%Component - C - - 101.0 116.3 146.7 - - 364.0 0%Training Cost - 556.6 407.6 335.5 315.8 141.0 141.0 1,897.4 2%Research, Evaluation & Workshop Cost - 115.8 46.6 72.3 83.7 710.0 710.0 1,738.5 1%Contingencies - - 40.5 - 754.8 - - 795.3 1%Subtotal - 672.4 708.5 2,248.7 4,432.1 3,153.1 2,469.8 13,684.6 11%
Total B 28.2 9,502.0 13,090.1 12,254.6 15,802.1 12,967.8 7,622.0 71,266.8 59%
Total A + B 745.3 19,450.0 20,487.8 18,653.1 22,418.3 23,689.9 15,422.0 120,866.5 100%
Source: GVT - Actual Investment Cost 1999/00 to 2003/04 and budget 2004/05 and 2005/06.
DFIDI = Department for International Development (India).PPGF = Participatory Planning and Group Formation.VOD = Village Organisation and Development.SWC = Soil and Water Conservation.WRD = Water Resource Development.
Total

Table AN8.8
Cost Heads / Subhead
A Administrative CostGVT Bhopal (Project HQ)
AllocationDFIDI
Consultancy ContractDahod Coordination Office, Gujarat
Staff Cost AStaff Cost BOffice CostEquipment CostCapital CostChallenge FundAdjustmentsSubtotal
Total A
B Development CostComponent A
1 PPGF2 VOD3 Crop Technology4 SWC5 WRD6 Livestock7 Forestry8 Migration Support
Subtotal
Other Development CostsComponent - B & DisseminationComponent - CTraining CostResearch, Evaluation & Workshop CostContingenciesSubtotal
Total B
Total A + B
Source:
DFIDI = Department for International Development (India).PPGF = Participatory Planning and Group Formation.VOD = Village Organisation and Development.SWC = Soil and Water Conservation.WRD = Water Resource Development.
WIRFP - Phase II: Gujarat - Dahod: Actual Investment Cost (Economic) - GVT, DFIDI, Community and Government (Rs '000).
1999/00 2000/01 2001/02 2002/03 2003/04 2004/05 2005/06CF SCF Actual Actual Actual Actual Actual Budget Budget (Rs'000) (%)
0.90 1.00 - 1,084.7 1,358.0 1,211.1 950.3 1,202.8 1,100.5 6,907.4 7%
1.00 1.00 717.0 1,427.8 538.5 1,264.3 948.4 1,093.7 783.3 6,772.9 7%
0.90 1.00 - 4,875.3 3,159.4 2,541.4 2,474.5 1,613.7 1,613.7 16,278.0 16%0.90 1.00 - - - - - 1,980.0 1,980.0 3,960.0 4%0.90 1.00 - 1,064.6 853.4 594.7 688.2 1,142.1 1,142.1 5,485.2 5%0.90 1.00 - 291.3 265.2 184.5 113.1 388.8 388.8 1,631.7 2%0.90 1.00 - 352.2 537.3 89.1 875.0 2,338.2 90.0 4,281.8 4%0.90 1.00 - - - - - - - - 0%0.90 1.00 - - - - - - - - 0%
- 6,583.4 4,815.4 3,409.7 4,150.8 7,462.8 5,214.6 31,636.7 31%717.0 9,095.9 6,711.9 5,885.1 6,049.5 9,759.3 7,098.4 45,317.0 45%
0.90 1.00 1.4 688.9 275.5 395.8 375.1 253.8 253.8 2,244.2 2%0.90 1.00 12.8 1,905.4 1,440.6 870.7 1,201.7 1,289.9 582.3 7,303.5 7%0.90 1.00 0.6 601.7 1,430.5 559.1 740.2 414.3 364.4 4,110.8 4%0.90 0.75 - 1,746.2 4,489.9 3,649.1 2,584.0 1,967.5 846.3 15,283.0 15%0.90 0.75 6.9 582.0 885.1 1,174.6 2,695.3 2,357.0 958.1 8,659.0 9%0.90 1.00 0.8 975.4 392.4 467.0 530.2 441.3 402.4 3,209.6 3%0.90 1.00 0.6 671.1 437.7 281.1 336.1 363.8 323.9 2,414.4 2%0.90 1.00 - - - - 10.5 304.2 304.2 618.9 1%
23.1 7,170.6 9,351.7 7,397.5 8,473.2 7,391.7 4,035.5 43,843.3 43%
0.90 1.00 - - 101.5 1,552.1 2,818.0 2,071.9 1,456.9 8,000.5 8%0.90 1.00 - - 90.9 104.7 132.0 - - 327.6 0%0.90 1.00 - 500.9 366.8 301.9 284.2 126.9 126.9 1,707.6 2%0.90 1.00 - 104.2 42.0 65.1 75.4 639.0 639.0 1,564.6 2%0.90 1.00 - - 36.4 - 679.3 - - 715.8 1%
- 605.1 637.7 2,023.8 3,988.9 2,837.8 2,222.8 12,316.1 12%23.1 7,775.7 9,989.4 9,421.3 12,462.1 10,229.5 6,258.3 56,159.5 55%
740.1 16,871.7 16,701.3 15,306.3 18,511.6 19,988.8 13,356.7 101,476.4 100%
Cost Benefit Analysis (CBA) Study Estimates Jan 2005.
TotalsConversion Factors

Table AN8.9 WIRFP - Phase II: Gujarat - Dahod: Indicative Investment Cost per Village (Financial) - GVT, DFIDI, Community and Government (Rs '000).
Cost Heads / Subhead 1999/00 2000/01 2001/02 2002/03 2003/04 2004/05 2005/06 Total Actual Actual Actual Actual Actual Budget Budget (Rs'000) (%)
A Administrative CostGVT Bhopal Project HQ - 60.3 75.4 67.3 52.8 66.8 61.1 383.7 6%DFIDI Consultancy 35.9 71.4 26.9 63.2 47.4 54.7 39.2 338.6 6%Dahod Coordination Office, Gujarat - 365.7 267.5 189.4 230.6 414.6 289.7 1,757.6 29%
Total A 35.9 497.4 369.9 319.9 330.8 536.1 390.0 2,480.0 41%
B Development CostComponent A
1 PPGF 0.1 38.3 15.3 22.0 20.8 14.1 14.1 124.7 2%2 VOD 0.7 105.9 80.0 48.4 66.8 71.7 32.3 405.7 7%3 Crop Technology 0.0 33.4 79.5 31.1 41.1 23.0 20.2 228.4 4%4 SWC - 129.3 332.6 270.3 191.4 145.7 62.7 1,132.1 19%5 WRD 0.5 43.1 65.6 87.0 199.7 174.6 71.0 641.4 11%6 Livestock 0.0 54.2 21.8 25.9 29.5 24.5 22.4 178.3 3%7 Forestry 0.0 37.3 24.3 15.6 18.7 20.2 18.0 134.1 2%8 Migration Support - - - - 0.6 16.9 16.9 34.4 1%
Subtotal 1.4 441.5 619.1 500.3 568.5 490.7 257.6 2,879.1 48%
Other Development Costs - 33.6 35.4 112.4 221.6 157.7 123.5 684.2 11%Subtotal - 33.6 35.4 112.4 221.6 157.7 123.5 684.2 11%
Total B 1.4 475.1 654.5 612.7 790.1 648.4 381.1 3,563.3 59%
Total A + B 37.3 972.5 1,024.4 932.7 1,120.9 1,184.5 771.1 6,043.3 100%
Core Village EntryPer Year 5 15 - - - - - 20 Cumulated 5 20 20 20 20 20 20 -
Source: GVT - Actual Investment Cost 1999/00 to 2003/04 and budget 2004/05 and 2005/06.
DFIDI = Department for International Development (India).PPGF = Participatory Planning and Group Formation.VOD = Village Organisation and Development.SWC = Soil and Water Conservation.WRD = Water Resource Development.

Table AN8.9
Cost Heads / Subhead
A Administrative CostGVT Bhopal Project HQDFIDI ConsultancyDahod Coordination Office, Gujarat
Total A
B Development CostComponent A
1 PPGF2 VOD3 Crop Technology4 SWC5 WRD6 Livestock7 Forestry8 Migration Support
Subtotal
Other Development CostsSubtotal
Total B
Total A + B
Core Village EntryPer YearCumulated
Source:
DFIDI = Department for International Development (India).PPGF = Participatory Planning and Group Formation.VOD = Village Organisation and Development.SWC = Soil and Water Conservation.WRD = Water Resource Development.
WIRFP - Phase II: Gujarat - Dahod: Indicative Investment Cost per Village (Economic) - GVT, DFIDI, Community and Government (Rs '000).
1999/00 2000/01 2001/02 2002/03 2003/04 2004/05 2005/06CF SCF Actual Actual Actual Actual Actual Budget Budget (Rs'000) (%)
0.9 1.0 - 54.2 67.9 60.6 47.5 60.1 55.0 345.4 7%1.0 1.0 35.9 71.4 26.9 63.2 47.4 54.7 39.2 338.6 7%0.9 1.0 - 329.2 240.8 170.5 207.5 373.1 260.7 1,581.8 31%
35.9 454.8 335.6 294.3 302.5 488.0 354.9 2,265.8 45%
0.90 1.00 0.1 34.4 13.8 19.8 18.8 12.7 12.7 112.2 2%0.90 1.00 0.6 95.3 72.0 43.5 60.1 64.5 29.1 365.2 7%0.90 1.00 0.0 30.1 71.5 28.0 37.0 20.7 18.2 205.5 4%0.90 0.75 - 87.3 224.5 182.5 129.2 98.4 42.3 764.2 15%0.90 0.75 0.3 29.1 44.3 58.7 134.8 117.8 47.9 432.9 9%0.90 1.00 0.0 48.8 19.6 23.4 26.5 22.1 20.1 160.5 3%0.90 1.00 0.0 33.6 21.9 14.1 16.8 18.2 16.2 120.7 2%0.90 1.00 - - - - 0.5 15.2 15.2 30.9 1%
1.2 358.5 467.6 369.9 423.7 369.6 201.8 2,192.2 43%
0.9 1.0 - 30.3 31.9 101.2 199.4 141.9 111.1 615.8 12%- 30.3 31.9 101.2 199.4 141.9 111.1 615.8 12%1.2 388.8 499.5 471.1 623.1 511.5 312.9 2,808.0 55%
37.0 843.6 835.1 765.3 925.6 999.4 667.8 5,073.8 100%
5 15 - - - - - 20 5 20 20 20 20 20 20
Cost Benefit Analysis (CBA) Study Estimates Jan 2005.
Total Conversion Factors

Table AN8.10 WIRFP - Phase II: Gujarat - Dahod: Summary of Investment Costs Per Village - Financial / Economic (Rs'000).
Cost Head / Subhead
A. Administration CostsGVT Bhopal (PHQ) 383.7 6% 383.7 4% 383.7 7% 383.7 6% 345.4 345.4 345.4 345.4 DFIDI Consultancy 338.6 6% 338.6 3% 338.6 6% 338.6 5% 338.6 338.6 338.6 338.6 Gujarat Coordination Office 1,757.6 29% 1,757.6 18% 1,757.6 32% 1,757.6 27% 1,581.8 1,581.8 1,581.8 1,581.8
Total A 2,480.0 41% 2,480.0 25% 2,480.0 45% 2,480.0 38% 2,265.8 2,265.8 2,265.8 2,265.8
B. Development CostsComponent A 1. PPGF 124.7 2% 322.5 3% 157.1 3% 185.4 3% 112.2 290.3 141.4 166.8 2. VOD 405.7 7% 335.5 3% 346.2 6% 297.5 5% 365.2 301.9 311.6 267.7 3. Crop Technology 228.4 4% 258.2 3% 202.0 4% 156.6 2% 205.5 232.4 181.8 140.9 4. SWC 1,132.1 19% 3,003.4 30% 1,709.2 31% 1,976.6 31% 764.2 2,027.3 1,153.7 1,334.2 5. WRD 641.4 11% 2,778.8 28% 312.0 6% 986.9 15% 432.9 1,875.7 210.6 666.1 6. Livestock 178.3 3% 258.7 3% 247.5 4% 119.2 2% 160.5 232.8 222.7 107.2 7. Forestry 134.1 2% 191.9 2% 42.7 1% 119.1 2% 120.7 172.7 38.4 107.2 8. Migration Support 34.4 1% 235.1 2% 25.9 0% 137.8 2% 30.9 211.6 23.3 124.0
Subtotal 2,879.1 48% 7,384.1 75% 3,042.5 55% 3,978.9 62% 2,192.2 5,344.7 2,283.5 2,914.2
Other Development CostsSubtotal 684.2 11% - 0% - 0% - 0% 615.8 - - -
Total B 3,563.3 59% 7,384.1 75% 3,042.5 55% 3,978.9 62% 2,808.0 5,344.7 2,283.5 2,914.2
Total A + B 6,043.3 100% 9,864.1 100% 5,522.5 100% 6,458.8 100% 5,073.8 7,610.5 4,549.4 5,180.0
GVT 7,744.2 79% 4,053.4 73% 4,938.6 76% N/A N/A N/ADFIDI 338.6 3% 338.6 6% 338.6 5% N/A N/A N/ACommunity 1,775.2 18% 1,115.0 20% 1,180.1 18% N/A N/A N/AGovernment 6.0 0% 15.5 0% 1.5 0% N/A N/A N/A
Households (No) 188 363 193 120
Average Componant A Cost Per Household (Rs'000) 15 20 16 33
Source: GVT Dahod Coordination Office, Gujarat. Cost Benefit Analysis (CBA) Study Estimates Jan 2005.\1 Cost Benefit Analysis (CBA) Study - Field Verification.
DFIDI = Department for International Development (India).PPGF = Participatory Planning and Group Formation.VOD = Village Organisation and Development.SWC = Soil and Water Conservation.WRD = Water Resource Development.
PoyaliFinancial Costs Economic Costs
Gujarat Jadha \1 KasotiyaAverage
Jadha \1GujaratAverage
PoyaliKasotiya

Table AN8.11 WIRFP - Phase II: Madhya Pradesh - Jabhua: Actual Investment Cost (Financial) - GVT, DFIDI, Community and Government (Rs'000).
Cost Heads / Subhead 1999/00 2000/01 2001/02 2002/03 2003/04 2004/05 2005/06Actual Actual Actual Actual Actual Budget Budget (Rs'000) (%)
A Administrative CostGVT Bhopal (Project HQ)
Allocation - 4,339.0 5,431.8 4,844.4 3,801.2 4,811.2 4,402.0 27,629.5 10%DFIDI
Consultancy Contract 2,581.3 5,139.9 1,938.6 4,551.4 3,414.1 3,937.3 2,819.7 24,382.3 9%Jhabua Coordination Office, M Pradesh
Staff Cost A - 5,129.7 6,458.5 6,838.3 6,763.7 2,787.0 2,787.0 30,764.1 11%Staff Cost B - - - - - 4,200.0 4,200.0 8,400.0 3%Office Cost - 1,159.4 1,005.6 1,045.2 1,164.0 1,285.0 1,285.0 6,944.2 2%Equipment Cost - 234.3 325.4 375.3 425.7 630.0 630.0 2,620.6 1%Capital Cost - 534.8 1,190.9 230.3 3,154.9 855.0 100.0 6,065.8 2%Challenge Fund - 534.8 1,190.9 230.3 3,154.9 - - 5,110.8 2%Adjustments - 534.8 1,190.9 230.3 3,154.9 - - 5,110.8 2%Subtotal - 8,127.7 11,362.1 8,949.5 17,818.0 9,757.0 9,002.0 65,016.4 23%
Total A 2,581.3 17,606.6 18,732.5 18,345.3 25,033.3 18,505.5 16,223.7 117,028.2 41%
B Development CostComponent A
1 PPGF 6.9 740.9 362.6 527.6 326.7 515.8 515.8 2,996.4 1%2 VOD 62.7 1,545.3 2,141.0 2,164.4 3,932.1 2,774.7 1,444.2 14,064.4 5%3 Crop Technology 3.0 911.1 2,087.2 1,251.5 1,827.4 2,142.1 1,442.6 9,665.0 3%4 SWC - 3,868.3 15,582.2 8,668.3 11,383.1 12,568.6 5,288.7 57,359.2 20%5 WRD 45.1 711.0 2,129.9 5,329.1 17,071.4 14,677.6 4,417.0 44,381.1 16%6 Livestock 3.9 728.8 1,222.5 1,480.5 2,486.8 1,718.2 863.0 8,503.7 3%7 Forestry 2.8 261.8 449.6 871.1 2,073.0 1,627.1 667.7 5,953.2 2%8 Migration Support - - - - 42.0 400.0 400.0 842.0 0%
Subtotal 124.3 8,767.3 23,975.1 20,292.5 39,142.5 36,424.2 15,039.0 143,764.9 51%
OtherComponent - B & Dissemination - - 258.2 2,052.9 5,192.5 4,320.5 2,800.8 14,624.9 5%Component - C - - - - - - - - 0%Training Cost - 691.4 888.0 1,108.1 1,246.9 810.0 610.0 5,354.4 2%Research, Evaluation & Workshop Cost - 160.3 119.2 138.5 72.2 290.0 290.0 1,070.1 0%Contingencies - - 13.1 - 197.3 - - 210.4 0%Sub Total - 851.7 1,278.5 3,299.4 6,708.9 5,420.5 3,700.8 21,259.8 8%
Total B 124.3 9,619.0 25,253.5 23,592.0 45,851.4 41,844.7 18,739.8 165,024.8 59%
Total A + B 2,705.5 27,225.6 43,986.1 41,937.2 70,884.8 60,350.2 34,963.5 282,053.0 100%
Source: GVT - Actual Investment Cost 1999/00 to 2003/04 and budget 2004/05 and 2005/06.
DFIDI = Department for International Development (India).PPGF = Participatory Planning and Group Formation.VOD = Village Organisation and Development.SWC = Soil and Water Conservation.WRD = Water Resource Development.
Total

Table AN8.11
Cost Heads / Subhead
A Administrative CostGVT Bhopal (Project HQ)
AllocationDFIDI
Consultancy ContractJhabua Coordination Office, M Pradesh
Staff Cost AStaff Cost BOffice CostEquipment CostCapital CostChallenge FundAdjustmentsSubtotal
Total A
B Development CostComponent A
1 PPGF2 VOD3 Crop Technology4 SWC5 WRD6 Livestock7 Forestry8 Migration Support
Subtotal
OtherComponent - B & DisseminationComponent - CTraining CostResearch, Evaluation & Workshop CostContingenciesSub Total
Total B
Total A + B
Source:
DFIDI = Department for International Development (India).PPGF = Participatory Planning and Group Formation.VOD = Village Organisation and Development.SWC = Soil and Water Conservation.WRD = Water Resource Development.
WIRFP - Phase II: Madhya Pradesh - Jabhua: Actual Investment Cost (Economic) - GVT, DFIDI, Community and Government (Rs'000).
1999/00 2000/01 2001/02 2002/03 2003/04 2004/05 2005/06CF SCF Actual Actual Actual Actual Actual Budget Budget (Rs'000) (%)
0.90 1.00 - 3,905.1 4,888.6 4,359.9 3,421.1 4,330.1 3,961.8 24,866.6 11%
1.00 1.00 2,581.3 5,139.9 1,938.6 4,551.4 3,414.1 3,937.3 2,819.7 24,382.3 10%
0.90 1.00 - 4,616.7 5,812.6 6,154.4 6,087.3 2,508.3 2,508.3 27,687.7 12%0.90 1.00 - - - - - 3,780.0 3,780.0 7,560.0 3%0.90 1.00 - 1,043.5 905.1 940.7 1,047.6 1,156.5 1,156.5 6,249.8 3%0.90 1.00 - 210.8 292.9 337.7 383.1 567.0 567.0 2,358.6 1%0.90 1.00 - 481.3 1,071.8 207.2 2,839.4 769.5 90.0 5,459.2 2%0.90 1.00 - 481.3 1,071.8 207.2 2,839.4 - - 4,599.7 2%0.90 1.00 - 481.3 1,071.8 207.2 2,839.4 - - 4,599.7 2%
- 7,314.9 10,225.9 8,054.6 16,036.2 8,781.3 8,101.8 58,514.7 25%2,581.3 16,359.9 17,053.2 16,965.9 22,871.4 17,048.7 14,883.3 107,763.6 46%
0.90 1.00 6.2 666.8 326.4 474.9 294.0 464.3 464.3 2,696.8 1%0.90 1.00 56.4 1,390.8 1,926.9 1,948.0 3,538.9 2,497.2 1,299.8 12,657.9 5%0.90 1.00 2.7 820.0 1,878.5 1,126.3 1,644.7 1,927.9 1,298.4 8,698.5 4%0.90 0.75 - 2,611.1 10,518.0 5,851.1 7,683.6 8,483.8 3,569.9 38,717.4 17%0.90 0.75 30.4 479.9 1,437.7 3,597.2 11,523.2 9,907.4 2,981.5 29,957.2 13%0.90 1.00 3.5 656.0 1,100.2 1,332.4 2,238.1 1,546.4 776.7 7,653.3 3%0.90 1.00 2.5 235.6 404.6 784.0 1,865.7 1,464.4 600.9 5,357.9 2%0.90 1.00 - - - - 37.8 360.0 360.0 757.8 0%
101.7 6,860.2 17,592.3 15,113.9 28,826.0 26,651.4 11,351.3 106,496.9 46%
0.90 1.00 - - 232.4 1,847.6 4,673.3 3,888.4 2,520.7 13,162.4 6%0.90 1.00 - - - - - - - - 0%0.90 1.00 - 622.3 799.2 997.3 1,122.2 729.0 549.0 4,819.0 2%0.90 1.00 - 144.3 107.3 124.6 65.0 261.0 261.0 963.1 0%0.90 1.00 - - 11.8 - 177.6 - - 189.3 0%
- 766.6 1,150.6 2,969.5 6,038.0 4,878.4 3,330.7 19,133.9 8%101.7 7,626.8 18,743.0 18,083.4 34,864.0 31,529.8 14,682.0 125,630.7 54%
2,683.0 23,986.7 35,796.1 35,049.2 57,735.4 48,578.5 29,565.4 233,394.4 100%
Cost Benefit Analysis (CBA) Study Estimates Jan 2005.
TotalsConversion Factors

Table AN8.12 WIRFP - Phase II: Madhya Pradesh - Jabhua: Indicative Investment Cost per Village (Financial) - GVT, DFIDI, Community and Government (Rs'000).
Cost Heads / Subhead 1999/00 2000/01 2001/02 2002/03 2003/04 2004/05 2005/06Actual Actual Actual Actual Actual Budget Budget (Rs'000) (%)
A Administrative CostGVT Bhopal (Project HQ) - 60.3 75.4 67.3 52.8 66.8 61.1 383.7 10%DFIDI Consultancy 35.9 71.4 26.9 63.2 47.4 54.7 39.2 338.6 9%Jabhua Coordination Office, M Pradesh - 112.9 157.8 124.3 247.5 135.5 125.0 903.0 23%
Total A 35.9 244.5 260.2 254.8 347.7 257.0 225.3 1,625.4 41%
B Development CostComponent A
1 PPGF 0.1 10.3 5.0 7.3 4.5 7.2 7.2 41.6 1%2 VOD 0.9 21.5 29.7 30.1 54.6 38.5 20.1 195.3 5%3 Crop Technology 0.0 12.7 29.0 17.4 25.4 29.8 20.0 134.2 3%4 SWC - 53.7 216.4 120.4 158.1 174.6 73.5 796.7 20%5 WRD 0.6 9.9 29.6 74.0 237.1 203.9 61.3 616.4 16%6 Livestock 0.1 10.1 17.0 20.6 34.5 23.9 12.0 118.1 3%7 Forestry 0.0 3.6 6.2 12.1 28.8 22.6 9.3 82.7 2%8 Migration Support - - - - 0.6 5.6 5.6 11.7 0%
Subtotal 1.7 121.8 333.0 281.8 543.6 505.9 208.9 1,996.7 51%
Other Development Costs - 11.8 17.8 45.8 93.2 75.3 51.4 295.3 8%Sub Total - 11.8 17.8 45.8 93.2 75.3 51.4 295.3 8%
Total B 1.7 133.6 350.7 327.7 636.8 581.2 260.3 2,292.0 59%
Total A + B 37.6 378.1 610.9 582.5 984.5 838.2 485.6 3,917.4 100%
Core Village EntryPer Year 22 19 6 25 - - - 72 Cumulated 22 41 47 72 72 72 72 -
Source: GVT - Actual Investment Cost 1999/00 to 2003/04 and budget 2004/05 and 2005/06.
DFIDI = Department for International Development (India).PPGF = Participatory Planning and Group Formation.VOD = Village Organisation and Development.SWC = Soil and Water Conservation.WRD = Water Resource Development.
Total

Table AN8.12
Cost Heads / Subhead
A Administrative CostGVT Bhopal (Project HQ)DFIDI ConsultancyJabhua Coordination Office, M Pradesh
Total A
B Development CostComponent A
1 PPGF2 VOD3 Crop Technology4 SWC5 WRD6 Livestock7 Forestry8 Migration Support
Subtotal
Other Development CostsSub Total
Total B
Total A + B
Core Village EntryPer YearCumulated
Source:
DFIDI = Department for International Development (India).PPGF = Participatory Planning and Group Formation.VOD = Village Organisation and Development.SWC = Soil and Water Conservation.WRD = Water Resource Development.
WIRFP - Phase II: Madhya Pradesh - Jabhua: Indicative Investment Cost per Village (Economic) - GVT, DFIDI, Community and Government (Rs'000).
1999/00 2000/01 2001/02 2002/03 2003/04 2004/05 2005/06CF SCF Actual Actual Actual Actual Actual Budget Budget (Rs'000) (%)
0.90 1.00 - 54.2 67.9 60.6 47.5 60.1 55.0 345.4 11%1.00 1.00 35.9 71.4 26.9 63.2 47.4 54.7 39.2 338.6 10%0.90 1.00 - 101.6 142.0 111.9 222.7 122.0 112.5 812.7 25%
35.9 227.2 236.8 235.6 317.7 236.8 206.7 1,496.7 46%
0.90 1.00 0.1 9.3 4.5 6.6 4.1 6.4 6.4 37.5 1%0.90 1.00 0.8 19.3 26.8 27.1 49.2 34.7 18.1 175.8 5%0.90 1.00 0.0 11.4 26.1 15.6 22.8 26.8 18.0 120.8 4%0.90 0.75 - 36.3 146.1 81.3 106.7 117.8 49.6 537.7 17%0.90 0.75 0.4 6.7 20.0 50.0 160.0 137.6 41.4 416.1 13%0.90 1.00 0.0 9.1 15.3 18.5 31.1 21.5 10.8 106.3 3%0.90 1.00 0.0 3.3 5.6 10.9 25.9 20.3 8.3 74.4 2%0.90 1.00 - - - - 0.5 5.0 5.0 10.5 0%
1.4 95.3 244.3 209.9 400.4 370.2 157.7 1,479.1 46%
0.90 1.00 - 10.6 16.0 41.2 83.9 67.8 46.3 265.7 8%- 10.6 16.0 41.2 83.9 67.8 46.3 265.7 8%1.4 105.9 260.3 251.2 484.2 437.9 203.9 1,744.9 54%
37.3 333.1 497.2 486.8 801.9 674.7 410.6 3,241.6 100%
22 19 6 25 - - - 72 22 41 47 72 72 72 72
Cost Benefit Analysis (CBA) Study Estimates Jan 2005.
TotalsConversion Factors

Table AN8.13 WIRFP - Phase II: Madhya Pradesh - Jhabua: Summary of Investment Costs Per Village - Financial (Rs'000).
Cost Head / Subhead
A. Administration CostsGVT Bhopal (PHQ) 383.7 10% 383.7 7% 383.7 13% 383.7 383.7 0% 383.7 10% 383.7 9%DFIDI Consultancy 338.6 9% 338.6 6% 338.6 12% 338.6 338.6 6% 338.6 9% 338.6 8%Jhabua Coordination Office 903.0 23% 903.0 16% 903.0 31% 903.0 903.0 17% 903.0 23% 903.0 20%
Total A 1,625.4 41% 1,625.4 29% 1,625.4 57% 1,625.4 30% 1,625.4 31% 1,625.4 41% 1,625.4 36%
B. Development CostsComponent A 1. PPGF 41.6 1% 68.4 1% 64.0 2% 57.8 1% 93.2 2% 129.7 3% 73.4 2% 2. VOD 195.3 5% 646.2 12% 222.4 8% 315.9 6% 566.8 11% 314.0 8% 316.7 7% 3. Crop Technology 134.2 3% 220.7 4% 159.0 6% 142.1 3% 358.4 7% 415.6 10% 156.1 3% 4. SWC 796.7 20% 1,495.9 27% 299.8 10% 1,406.2 26% 870.8 16% 531.1 13% 870.2 19% 5. WRD 616.4 16% 1,248.8 23% 396.8 14% 1,733.8 32% 1,218.9 23% 515.6 13% 1,255.5 28% 6. Livestock 118.1 3% 127.4 2% 53.6 2% 92.6 2% 130.9 2% 226.6 6% 129.4 3% 7. Forestry 82.7 2% 79.8 1% 45.4 2% 47.9 1% 452.5 8% 129.1 3% 37.5 1%8. Migration Support 11.7 0% - 0% 10.0 0% 2.1 0% 9.5 0% 81.0 2% 1.2 0%
Subtotal 1,996.7 51% 3,887.2 71% 1,250.9 43% 3,798.3 70% 3,700.9 69% 2,342.7 59% 2,840.0 64%
Other Development CostsSubtotal 295.3 8% - 0% - 0% - 0% - 0% - 0% - 0%
Total B 2,292.0 59% 3,887.2 71% 1,250.9 43% 3,798.3 70% 3,700.9 69% 2,342.7 59% 2,840.0 64%
Total A + B 3,917.4 100% 5,512.6 100% 2,876.3 100% 5,423.7 100% 5,326.3 100% 3,968.1 100% 4,465.4 100%
GVTDFIDICommunityGovernment
Households per Village (No) 107 86 36 79 160 86 37
Average Componant A Cost per Household (Rs'000) 18.7 45.2 34.7 48.1 23.1 27.2 76.8
Source: GVT Jhabua Coordination Office, Madhya Pradesh.\1 Cost Benefit Analysis (CBA) Study - Field Verification.
DFIDI = Department for International Development (India).PPGF = Participatory Planning and Group Formation.VOD = Village Organisation and Development.SWC = Soil and Water Conservation.WRD = Water Resource Development.
Madhya PradeshAverage
Chenpura \1Bagoli \1 ChemzherBorwa Kadwapada \1 Padabanda

Table AN8.13
Cost Head / Subhead
A. Administration CostsGVT Bhopal (PHQ)DFIDI ConsultancyJhabua Coordination Office
Total A
B. Development CostsComponent A 1. PPGF 2. VOD 3. Crop Technology 4. SWC 5. WRD 6. Livestock 7. Forestry8. Migration Support
Subtotal
Other Development CostsSubtotal
Total B
Total A + B
GVTDFIDICommunityGovernment
Households per Village (No)
Average Componant A Cost per Household (Rs'000)
Source:\1 Cost Benefit Analysis (CBA) Study - Field Verification.
DFIDI = Department for International Development (India).PPGF = Participatory Planning and Group Formation.VOD = Village Organisation and Development.SWC = Soil and Water Conservation.WRD = Water Resource Development.
WIRFP - Phase II: Madhya Pradesh - Jhabua: Summary of Investment Costs Per Village - Economic (Rs'000).
345.4 345.4 345.4 345.4 345.4 345.4 345.4 338.6 338.6 338.6 338.6 338.6 338.6 338.6 812.7 812.7 812.7 812.7 812.7 812.7 812.7
1,496.7 1,496.7 1,496.7 1,496.7 1,496.7 1,496.7 1,496.7
37.5 61.5 57.6 52.0 83.9 116.7 66.0 175.8 581.5 200.1 284.3 510.1 282.6 285.0 120.8 198.6 143.1 127.9 322.6 374.0 140.5 537.7 1,009.7 202.4 949.2 587.8 358.5 587.4 416.1 843.0 267.8 1,170.3 822.7 348.0 847.5 106.3 114.7 48.2 83.4 117.8 203.9 116.4 74.4 71.9 40.8 43.1 407.2 116.2 33.8 10.5 - 9.0 1.9 8.6 72.9 1.1
1,479.1 2,880.9 969.1 2,712.0 2,860.7 1,872.9 2,077.7
265.7 - - - - - - 1,744.9 2,880.9 969.1 2,712.0 2,860.7 1,872.9 2,077.7
3,241.6 4,377.6 2,465.8 4,208.7 4,357.4 3,369.6 3,574.4
Cost Benefit Analysis (CBA) Study Estimates Jan 2005.
Chenpura \1 Kadwapada \1 PadabandaAverage
Madhya Pradesh Bagoli \1 Borwa Chemzher

Table AN8.14 WIRFP - Phase II: Rajasthan - Banswara: Actual Investment Cost (Financial) - GVT, DFIDI, Community and Government (Rs'000).
Cost Heads / Subhead 1999/00 2000/01 2001/02 2002/03 2003/04 2004/05 2005/06Actual Actual Actual Actual Actual Budget Budget (Rs'000) (%)
A Administrative CostGVT Bhopal (Project HQ)
Allocation - 3,615.8 4,526.5 4,037.0 3,167.7 4,009.3 3,668.3 23,024.6 8%DFIDI
Consultancy Contract 2,151.0 4,283.3 1,615.5 3,792.8 2,845.1 3,281.1 2,349.8 20,318.6 7%Banswara Coordination Office, Rajasthan
Staff Cost A - 5,496.8 5,915.0 5,945.0 5,286.7 2,306.0 2,306.0 27,255.6 10%Staff Cost B - - - - - 4,520.0 4,520.0 9,040.0 3%Office Cost - 1,294.6 1,368.3 1,130.9 1,113.7 1,247.0 1,247.0 7,401.6 3%Equipment Cost - 337.7 381.5 365.1 472.4 452.0 452.0 2,460.7 1%Capital Cost - 583.6 1,154.9 214.7 3,430.1 505.0 100.0 5,988.2 2%Challenge Fund - - - - - - - - 0%Adjustments - - - - - - - - 0%Subtotal - 7,712.7 8,819.8 7,655.7 10,302.8 9,030.0 8,625.0 52,146.0 19%
Total A 2,151.0 15,611.7 14,961.9 15,485.5 16,315.6 16,320.4 14,643.1 95,489.2 34%
B Development CostComponent A
1 PPGF - 1,068.3 1,180.2 861.8 801.9 755.9 755.9 5,423.9 2%2 VOD - 2,891.2 3,681.3 2,811.6 4,180.2 3,737.7 1,436.0 18,738.1 7%3 Crop Technology - 671.3 2,466.0 1,814.1 2,328.1 3,825.0 1,458.7 12,563.2 5%4 SWC - 4,565.9 20,864.9 12,128.6 11,156.9 11,938.6 4,855.4 65,510.3 24%5 WRD - 2,079.0 3,750.1 6,222.5 14,100.2 11,165.5 4,248.3 41,565.6 15%6 Livestock - 575.9 1,507.2 1,265.7 1,911.0 1,299.8 770.5 7,330.0 3%7 Forestry - 157.2 472.6 678.1 796.4 819.6 686.8 3,610.7 1%8 Migration Support - - - - 35.0 200.0 200.0 435.0 0%
Subtotal - 12,008.8 33,922.3 25,782.4 35,309.7 33,742.2 14,411.5 155,176.8 56%
Other Development CostsComponent - B & Dissemination - - 338.8 2,640.4 6,694.6 6,202.2 2,652.5 18,528.4 7%Component - C - - - - - - - - 0%Training Cost - 591.4 754.8 1,110.9 943.9 809.0 609.0 4,819.1 2%Research, Evaluation & Workshop Cost - 184.7 275.0 144.2 98.7 152.0 152.0 1,006.5 0%Contingencies - 200.0 246.4 100.0 1,346.0 - - 1,892.4 1%Subtotal - 976.1 1,615.0 3,995.5 9,083.2 7,163.2 3,413.5 26,246.4 9%
Total B - 12,984.8 35,537.3 29,777.8 44,392.9 40,905.4 17,825.0 181,423.2 66%
Total A + B 2,151.0 28,596.6 50,499.1 45,263.3 60,708.5 57,225.8 32,468.1 276,912.5 100%
Source: GVT - Actual Investment Cost 1999/00 to 2003/04 and budget 2004/05 and 2005/06.
DFIDI = Department for International Development (India).PPGF = Participatory Planning and Group Formation.VOD = Village Organisation and Development.SWC = Soil and Water Conservation.WRD = Water Resource Development.
Total

Table AN8.14
Cost Heads / Subhead
A Administrative CostGVT Bhopal (Project HQ)
AllocationDFIDI
Consultancy ContractBanswara Coordination Office, Rajasthan
Staff Cost AStaff Cost BOffice CostEquipment CostCapital CostChallenge FundAdjustmentsSubtotal
Total A
B Development CostComponent A
1 PPGF2 VOD3 Crop Technology4 SWC5 WRD6 Livestock7 Forestry8 Migration Support
Subtotal
Other Development CostsComponent - B & DisseminationComponent - CTraining CostResearch, Evaluation & Workshop CostContingenciesSubtotal
Total B
Total A + B
Source:
DFIDI = Department for International Development (India).PPGF = Participatory Planning and Group Formation.VOD = Village Organisation and Development.SWC = Soil and Water Conservation.WRD = Water Resource Development.
WIRFP - Phase II: Rajasthan - Banswara: Actual Investment Cost (Economic) - GVT, DFIDI, Community and Government (Rs'000).
1999/00 2000/01 2001/02 2002/03 2003/04 2004/05 2005/06CF SCF Actual Actual Actual Actual Actual Budget Budget (Rs'000) (%)
0.90 1.00 - 3,254.2 4,073.9 3,633.3 2,850.9 3,608.4 3,301.5 20,722.2 7%
1.00 1.00 2,151.0 4,283.3 1,615.5 3,792.8 2,845.1 3,281.1 2,349.8 20,318.6 7%
0.90 1.00 - 4,947.1 5,323.5 5,350.5 4,758.0 2,075.4 2,075.4 24,530.0 9%0.90 1.00 - - - - - 4,068.0 4,068.0 8,136.0 3%0.90 1.00 - 1,165.2 1,231.5 1,017.8 1,002.3 1,122.3 1,122.3 6,661.4 2%0.90 1.00 - 303.9 343.4 328.6 425.2 406.8 406.8 2,214.6 1%0.90 1.00 - 525.2 1,039.4 193.2 3,087.1 454.5 90.0 5,389.4 2%0.90 1.00 - - - - - - - - 0%0.90 1.00 - - - - - - - - 0%
- 6,941.4 7,937.9 6,890.1 9,272.6 8,127.0 7,762.5 46,931.4 17%2,151.0 14,478.9 13,627.2 14,316.2 14,968.5 15,016.5 13,413.8 87,972.2 32%
0.90 1.00 - 961.5 1,062.2 775.6 721.7 680.3 680.3 4,881.5 2%0.90 1.00 - 2,602.1 3,313.1 2,530.5 3,762.2 3,364.0 1,292.4 16,864.3 6%0.90 1.00 - 604.1 2,219.4 1,632.7 2,095.3 3,442.5 1,312.8 11,306.9 4%0.90 0.75 - 3,082.0 14,083.8 8,186.8 7,530.9 8,058.6 3,277.4 44,219.4 16%0.90 0.75 - 1,403.3 2,531.3 4,200.2 9,517.6 7,536.7 2,867.6 28,056.8 10%0.90 1.00 - 518.3 1,356.5 1,139.1 1,719.9 1,169.9 693.4 6,597.0 2%0.90 1.00 - 141.5 425.3 610.3 716.8 737.7 618.1 3,249.6 1%0.90 1.00 - - - - 31.5 180.0 180.0 391.5 0%
- 9,312.8 24,991.7 19,075.1 26,095.9 25,169.5 10,922.0 115,567.1 42%
0.90 1.00 - - 304.9 2,376.3 6,025.1 5,582.0 2,387.2 16,675.6 6%0.90 1.00 - - - - - - - - 0%0.90 1.00 - 532.2 679.3 999.9 849.5 728.1 548.1 4,337.1 2%0.90 1.00 - 166.2 247.5 129.7 88.8 136.8 136.8 905.9 0%0.90 1.00 - 180.0 221.8 90.0 1,211.4 - - 1,703.2 1%
- 878.5 1,453.5 3,595.9 8,174.8 6,446.9 3,072.1 23,621.8 9%- 10,191.3 26,445.2 22,671.1 34,270.8 31,616.4 13,994.2 139,188.8 50%
2,151.0 24,670.2 40,072.4 36,987.3 49,239.3 46,632.9 27,407.9 227,161.0 100%
Cost Benefit Analysis (CBA) Study Estimates Jan 2005.
TotalsConversion Facors

Table AN8.15 WIRFP - Phase II: Rajasthan - Banswara: Indicative Investment Cost per Village (Financial) - GVT, DFIDI, Community and Government (Rs'0
Cost Heads / Subhead 1999/00 2000/01 2001/02 2002/03 2003/04 2004/05 2005/06Actual Actual Actual Actual Actual Budget Budget (Rs'000) (%)
A Administrative CostGVT Bhopal (Project HQ) - 60.3 75.4 67.3 52.8 66.8 61.1 383.7 8%DFIDI Consultancy 35.9 71.4 26.9 63.2 47.4 54.7 39.2 338.6 7%Banswara Coordination Office, Rajasthan - 128.5 147.0 127.6 171.7 150.5 143.8 869.1 19%
Total A 35.9 260.2 249.4 258.1 271.9 272.0 244.1 1,591.5 34%
B Development CostComponent A
1 PPGF - 17.8 19.7 14.4 13.4 12.6 12.6 90.4 2%2 VOD - 48.2 61.4 46.9 69.7 62.3 23.9 312.3 7%3 Crop Technology - 11.2 41.1 30.2 38.8 63.7 24.3 209.4 5%4 SWC - 76.1 347.7 202.1 185.9 199.0 80.9 1,091.8 24%5 WRD - 34.6 62.5 103.7 235.0 186.1 70.8 692.8 15%6 Livestock - 9.6 25.1 21.1 31.8 21.7 12.8 122.2 3%7 Forestry - 2.6 7.9 11.3 13.3 13.7 11.4 60.2 1%8 Migration Support - - - - 0.6 3.3 3.3 7.3 0%
Subtotal - 200.1 565.4 429.7 588.5 562.4 240.2 2,586.3 56%
Other Development Costs - 16.3 26.9 66.6 151.4 119.4 56.9 437.4 9%Subtotal - 16.3 26.9 66.6 151.4 119.4 56.9 437.4 9%
Total B - 216.4 592.3 496.3 739.9 681.8 297.1 3,023.7 66%
Total A + B 35.9 476.6 841.7 754.4 1,011.8 953.8 541.1 4,615.2 100%
Core Village EntryPer Year - 37 14 9 - - - 60 Cumulated - 37 51 60 60 60 60 -
Source: GVT - Actual Investment Cost 1999/00 to 2003/04 and budget 2004/05 and 2005/06.
DFIDI = Department for International Development (India).PPGF = Participatory Planning and Group Formation.VOD = Village Organisation and Development.SWC = Soil and Water Conservation.WRD = Water Resource Development.
Total

Table AN8.15
Cost Heads / Subhead
A Administrative CostGVT Bhopal (Project HQ)DFIDI ConsultancyBanswara Coordination Office, Rajasthan
Total A
B Development CostComponent A
1 PPGF2 VOD3 Crop Technology4 SWC5 WRD6 Livestock7 Forestry8 Migration Support
Subtotal
Other Development CostsSubtotal
Total B
Total A + B
Core Village EntryPer YearCumulated
Source:
DFIDI = Department for International Development (India).PPGF = Participatory Planning and Group Formation.VOD = Village Organisation and Development.SWC = Soil and Water Conservation.WRD = Water Resource Development.
WIRFP - Phase II: Rajasthan - Banswara: Indicative Investment Cost per Village (Economic) - GVT, DFIDI, Community and Government (Rs'000).
1999/00 2000/01 2001/02 2002/03 2003/04 2004/05 2005/06CF SCF Actual Actual Actual Actual Actual Budget Budget (Rs'000) (%)
0.9 1.0 - 54.2 67.9 60.6 47.5 60.1 55.0 345.4 9%1.0 1.0 35.9 71.4 26.9 63.2 47.4 54.7 39.2 338.6 9%0.9 1.0 - 115.7 132.3 114.8 154.5 135.5 129.4 782.2 21%
35.9 241.3 227.1 238.6 249.5 250.3 223.6 1,466.2 39%
0.9 1.0 - 16.0 17.7 12.9 12.0 11.3 11.3 81.4 2%0.9 1.0 - 43.4 55.2 42.2 62.7 56.1 21.5 281.1 7%0.9 1.0 - 10.1 37.0 27.2 34.9 57.4 21.9 188.4 5%0.9 0.8 - 51.4 234.7 136.4 125.5 134.3 54.6 737.0 19%0.9 0.8 - 23.4 42.2 70.0 158.6 125.6 47.8 467.6 12%0.9 1.0 - 8.6 22.6 19.0 28.7 19.5 11.6 110.0 3%0.9 1.0 - 2.4 7.1 10.2 11.9 12.3 10.3 54.2 1%0.9 1.0 - - - - 0.5 3.0 3.0 6.5 0%
- 155.2 416.5 317.9 434.9 419.5 182.0 1,926.1 51%
0.9 1.0 - 14.6 24.2 59.9 136.2 107.4 51.2 393.7 10%- 14.6 24.2 59.9 136.2 107.4 51.2 393.7 10%- 169.9 440.8 377.9 571.2 526.9 233.2 2,319.8 61%
35.9 411.2 667.9 616.5 820.7 777.2 456.8 3,786.0 100%
Cost Benefit Analysis (CBA) Study Estimates Jan 2005.
TotalsConversion Facors

Table AN8.16 WIRFP - Phase II: Rajasthan - Banswara: Summary of Investment Costs Per Village - Financial (Rs'000).
Cost Head / Subhead Bakaner Bhuripada \1 Gara \1 Merana \1 Sundripada
A. Administration CostsGVT Bhopal (PHQ) 383.7 8% 383.7 7% 383.7 7% 383.7 5% 383.7 10% 383.7 8%DFIDI Consultancy 338.6 7% 338.6 7% 338.6 6% 338.6 5% 338.6 8% 338.6 7%Rajastan Coordination Office 869.1 19% 869.1 17% 869.1 16% 869.1 12% 869.1 22% 869.1 19%Total (A) 1,591.5 34% 1,591.5 31% 1,591.5 29% 1,591.5 21% 1,591.5 40% 1,591.5 34%
B. Development CostsComponent A 1. PPGF 90.4 2% 223.7 4% 204.1 4% 101.4 1% 172.5 4% 235.7 5% 2. VOD 312.3 7% 375.0 7% 284.8 5% 399.2 5% 225.0 6% 228.0 5% 3. Crop Technology 209.4 5% 158.0 3% 215.6 4% 167.3 2% 170.8 4% 157.5 3% 4. SWC 1,091.8 24% 1,895.0 37% 1,949.5 35% 2,482.6 33% 971.4 24% 1,674.6 36% 5. WRD 692.8 15% 560.7 11% 1,017.3 18% 2,471.4 33% 477.9 12% 476.0 10% 6. Livestock 122.2 3% 294.6 6% 200.0 4% 236.2 3% 232.5 6% 231.1 5% 7. Forestry 60.2 1% 34.3 1% 38.3 1% 42.9 1% 150.5 4% 37.6 1% 8. Migration Support 7.3 0% - 0% - 0% - 0% - 0% - 0%
Subtotal 2,586.3 56% 3,541.4 69% 3,909.4 71% 5,901.0 79% 2,400.7 60% 3,040.6 66%
Other Development CostsSubtotal 437.4 9% - 0% - 0% - 0% - 0% - 0%
Total B 3,023.7 66% 3,541.4 69% 3,909.4 71% 5,901.0 79% 2,400.7 60% 3,040.6 66%
Total A + B 4,615.2 100% 5,132.9 100% 5,500.9 100% 7,492.5 100% 3,992.2 100% 4,632.1 100%
GVTDFIDICommunityGovernment
Households per Village (No) 140 90 160 120 147 80
Average Componant A Cost per Household (Rs'000) 18 39 24 49 16 38
Source: GVT Banswara Coordination Office, Rajasthan.\1 Cost Benefit Analysis (CBA) Study - Field Verification.
DFIDI = Department for International Development (India).PPGF = Participatory Planning and Group Formation.VOD = Village Organisation and Development.SWC = Soil and Water Conservation.WRD = Water Resource Development.
RajasthanAverage

Table AN8.16
Cost Head / Subhead
A. Administration CostsGVT Bhopal (PHQ)DFIDI ConsultancyRajastan Coordination OfficeTotal (A)
B. Development CostsComponent A 1. PPGF 2. VOD 3. Crop Technology 4. SWC 5. WRD 6. Livestock 7. Forestry 8. Migration Support
Subtotal
Other Development CostsSubtotal
Total B
Total A + B
GVTDFIDICommunityGovernment
Households per Village (No)
Average Componant A Cost per Household (Rs'000)
Source:\1 Cost Benefit Analysis (CBA) Study - Field Verification.
DFIDI = Department for International Development (India).PPGF = Participatory Planning and Group Formation.VOD = Village Organisation and Development.SWC = Soil and Water Conservation.WRD = Water Resource Development.
WIRFP - Phase II: Rajasthan - Banswara: Summary of Investment Costs Per Village - Economic (R
Rajasthan Bakaner Bhuripada \1 Gara \1 Merana \1 SundripadaAverage
345.4 345.4 345.4 345.4 345.4 345.4 338.6 338.6 338.6 338.6 338.6 338.6 782.2 782.2 782.2 782.2 782.2 782.2
1,466.2 1,466.2 1,466.2 1,466.2 1,466.2 1,466.2
81.4 201.4 183.7 91.3 155.2 212.1 281.1 337.5 256.3 359.3 202.5 205.2 188.4 142.2 194.0 150.6 153.8 141.8 737.0 1,279.1 1,315.9 1,675.7 655.7 1,130.4 467.6 378.5 686.7 1,668.2 322.6 321.3 110.0 265.2 180.0 212.6 209.3 208.0 54.2 30.9 34.5 38.6 135.5 33.9 6.5 - - - - -
1,926.1 2,634.7 2,851.0 4,196.3 1,834.5 2,252.6
1,926.1 - - - - 3,852.2 2,634.7 2,851.0 4,196.3 1,834.5 2,252.6
5,318.4 4,100.9 4,317.2 5,662.5 3,300.7 3,718.8
140 90 160 120 147 80
38 46 27 47 22 46
Cost Benefit Analysis (CBA) Study Estimates Jan 2005.

Table AN8.17 WIRFP - Phase II: Rajasthan - Pratapgarh: Actual Investment Cost (Financial) - IFFDC, DFIDI, Community and Government (Rs'000).
Cost Heads / Subhead 1999/00 2000/01 2001/02 2002/03 2003/04 2004/05 2005/06 Total Actual Actual Actual Actual Actual Budget Budget (Rs'000) (%)
A. Administration CostsIFFDC Head Quarters
Allocation 1,143.2 1,579.9 2,123.0 7,607.1 7,253.9 6,364.7 6,364.7 32,436.6 33% 33%DFIDI
Consultancy Contract 2,688.8 5,354.1 2,019.4 4,741.0 3,556.3 4,101.4 2,937.2 25,398.2 26% 26%State Coordination Office
Staff Cost A 679.0 1,705.2 2,569.4 4,190.4 6,119.2 6,119.2 6,119.2 27,501.5 18%Staff Cost B - - - - - - - - 0%Office Cost 512.0 918.2 1,022.4 1,253.8 1,488.2 1,488.2 1,488.2 8,171.0 5%Equipment Cost 1,749.4 63.5 13.8 867.3 507.7 507.7 507.7 4,217.2 3%Capital Cost - - - - - - - - 0%Challenge Fund - - - - - - - - 0%Adjustments - - - - - - - - 0%Subtotal 2,940.3 2,686.9 3,605.6 6,311.6 8,115.1 8,115.1 8,115.1 39,889.8 41% 41%
Total A 6,772.3 9,620.9 7,748.0 18,659.6 18,925.4 18,581.3 17,417.1 97,724.6 100% 100%
B. Development CostsComponent A 1. PPGF 196.1 283.8 235.7 338.2 75.2 60.2 45.1 1,234.3 2% 2. VOD 25.2 445.6 519.2 764.7 893.7 715.0 536.2 3,899.7 8% 3. Crop Technology 0.0 94.3 94.6 367.2 790.3 632.2 474.2 2,452.7 5% 4. SWC 0.1 1,234.5 1,172.4 1,257.3 297.7 238.2 178.6 4,378.7 8% 5. WRD 64.1 1,489.2 4,834.2 7,478.5 8,765.2 7,012.1 5,259.1 34,902.3 67% 6. Livestock 0.0 138.4 106.6 289.9 410.4 328.3 246.3 1,520.0 3% 7. Forestry 0.0 196.7 61.2 563.9 447.8 358.2 268.7 1,896.4 4% 8. Migration Support - - - - - - - - 0%
Subtotal 285.5 3,882.4 7,023.9 11,059.7 11,680.3 9,344.2 7,008.2 50,284.1 97% 97%
Other Development CostsComponent - B & Dissemination - - 65.2 163.7 1,210.4 - - 1,439.3 Component - C - - - - - - - - Training Cost - - - - - - - - Research, Evaluation & Workshop Cost - - - - - - - - Contingencies - - - - - - - - Subtotal - - 65.2 163.7 1,210.4 - - 1,439.3 3% 3%
Total B 285.5 3,882.4 7,089.1 11,223.3 12,890.7 9,344.2 7,008.2 51,723.4 100% 100%
Total A + B 7,057.8 13,503.3 14,837.1 29,883.0 31,816.1 27,925.5 24,425.3 149,448.0 100% 100%
Source: IFFDC - Actual Investment Cost 1999/00 to 2003/4 and budget 2004/05 and 2005/06.
DFIDI = Department for International Development (India).PPGF = Participatory Planning and Group Formation.VOD = Village Organisation and Development.SWC = Soil and Water Conservation.WRD = Water Resource Development.

Table AN8.17
Cost Heads / Subhead
A. Administration CostsIFFDC Head Quarters
AllocationDFIDI
Consultancy ContractState Coordination Office
Staff Cost AStaff Cost BOffice CostEquipment CostCapital CostChallenge FundAdjustmentsSubtotal
Total A
B. Development CostsComponent A 1. PPGF 2. VOD 3. Crop Technology 4. SWC 5. WRD 6. Livestock 7. Forestry 8. Migration Support
Subtotal
Other Development CostsComponent - B & DisseminationComponent - CTraining CostResearch, Evaluation & Workshop CostContingenciesSubtotal
Total B
Total A + B
Source:
DFIDI = Department for International Development (India).PPGF = Participatory Planning and Group Formation.VOD = Village Organisation and Development.SWC = Soil and Water Conservation.WRD = Water Resource Development.
WIRFP - Phase II: Rajasthan - Pratapgarh: Actual Investment Cost (Economic) - IFFDC, DFIDI, Community and Government (Rs'000).
1999/00 2000/01 2001/02 2002/03 2003/04 2004/05 2005/06CF SCF Actual Actual Actual Actual Actual Budget Budget (Rs'000) (%)
0.90 1.00 1,028.9 1,421.9 1,910.7 6,846.4 6,528.5 5,728.3 5,728.3 29,192.9 23%
1.00 1.00 2,688.8 5,354.1 2,019.4 4,741.0 3,556.3 4,101.4 2,937.2 25,398.2 20%
0.90 1.00 611.1 1,534.7 2,312.5 3,771.4 5,507.3 5,507.3 5,507.3 24,751.4 19%0.90 1.00 - - - - - - - - 0%0.90 1.00 460.8 826.4 920.2 1,128.4 1,339.4 1,339.4 1,339.4 7,353.9 6%0.90 1.00 1,574.5 57.2 12.4 780.6 456.9 456.9 456.9 3,795.5 3%0.90 1.00 - - - - - - - - 0%0.90 1.00 - - - - - - - - 0%0.90 1.00 - - - - - - - - 0%
2,646.3 2,418.2 3,245.1 5,680.4 7,303.6 7,303.6 7,303.6 35,900.8 28%6,364.0 9,194.3 7,175.1 17,267.8 17,388.5 17,133.3 15,969.1 90,492.0 71%
0.90 1.00 176.5 255.4 212.1 304.3 67.7 54.2 40.6 1,110.8 1%0.90 1.00 22.7 401.1 467.3 688.2 804.3 643.5 482.6 3,509.7 3%0.90 1.00 0.0 84.9 85.1 330.5 711.2 569.0 426.7 2,207.4 2%0.90 0.75 0.0 833.3 791.4 848.7 201.0 160.8 120.6 2,955.7 2%0.90 0.75 43.2 1,005.2 3,263.1 5,048.0 5,916.5 4,733.2 3,549.9 23,559.1 18%0.90 1.00 0.0 124.5 95.9 260.9 369.4 295.5 221.6 1,368.0 1%0.90 1.00 0.0 177.0 55.1 507.5 403.0 322.4 241.8 1,706.8 1%0.90 1.00 - - - - - - - - 0%
242.5 2,881.3 4,970.0 7,988.1 8,473.1 6,778.5 5,083.9 36,417.4 24%
0.90 1.00 - - 58.7 147.3 1,089.4 - - 1,295.4 1%0.90 1.00 - - - - - - - - 0%0.90 1.00 - - - - - - - - 0%0.90 1.00 - - - - - - - - 0%0.90 1.00 - - - - - - - - 0%
- - 58.7 147.3 1,089.4 - - 1,295.4 1%242.5 2,881.3 5,028.8 8,135.5 9,562.5 6,778.5 5,083.9 37,712.8 29%
6,606.4 12,075.6 12,203.9 25,403.2 26,950.9 23,911.7 21,053.0 128,204.8 100%
Cost Benefit Analysis (CBA) Study Estimates Jan 2005.
Conversion Factors Totals

Table AN8.18 WIRFP - Phase II: Rajasthan - Pratapgarh: Indicative Investment Cost per Village (Financial) - IFFDC, DFIDI, Community and Government (Rs'
Cost Head / Subhead 1999/00 2000/01 2001/02 2002/03 2003/04 2004/05 2005/06 Total Actual Actual Actual Actual Actual Budget Budget (Rs'000) (%) (%)
A. Administration CostsIFFDC Head Quarters 106.0 46.3 47.3 84.7 53.8 47.2 47.2 432.5 18%DFIDI Consultancy 35.9 71.4 26.9 63.2 47.4 54.7 39.2 338.6 14%Rajasthan Coordination Office 117.6 107.5 144.2 252.5 324.6 324.6 324.6 1,595.6 67%
Total A 259.5 225.1 218.4 400.3 425.8 426.5 411.0 2,366.7 100% 53%
B. Development CostsComponent A 1. PPGF 7.8 11.4 9.4 13.5 3.0 2.4 1.8 49.4 2% 2. VOD 1.0 17.8 20.8 30.6 35.7 28.6 21.4 156.0 8% 3. Crop Technology 0.0 3.8 3.8 14.7 31.6 25.3 19.0 98.1 5% 4. SWC 0.0 49.4 46.9 50.3 11.9 9.5 7.1 175.1 8% 5. WRD 2.6 59.6 193.4 299.1 350.6 280.5 210.4 1,396.1 67% 6. Livestock 0.0 5.5 4.3 11.6 16.4 13.1 9.9 60.8 3% 7. Forestry 0.0 7.9 2.4 22.6 17.9 14.3 10.7 75.9 4% 8. Migration Support - - - - - - - - 0%
Subtotal 11.4 155.3 281.0 442.4 467.2 373.8 280.3 2,011.4 97% 45%
Other Development Costs - - 2.6 6.5 48.4 - - 57.6 3%Subtotal - - 2.6 6.5 48.4 - - 57.6 3% 1%
Total B 11.4 155.3 283.6 448.9 515.6 373.8 280.3 2,068.9 100% 47%
Total A + B 270.9 380.4 502.0 849.3 941.5 800.3 691.3 4,435.7 100%
Core Village EntryPer Year 6.0 19.0 - - - - - 25.0 Cumulated 6.0 25.0 25.0 25.0 25.0 25.0 25.0
Source: IFFDC - Actual Investment Cost 1999/00 to 2003/4 and budget 2004/05 and 2005/06.
DFIDI = Department for International Development (India).PPGF = Participatory Planning and Group Formation.VOD = Village Organisation and Development.SWC = Soil and Water Conservation.WRD = Water Resource Development.

Table AN8.18
Cost Head / Subhead
A. Administration CostsIFFDC Head QuartersDFIDI ConsultancyRajasthan Coordination Office
Total A
B. Development CostsComponent A 1. PPGF 2. VOD 3. Crop Technology 4. SWC 5. WRD 6. Livestock 7. Forestry 8. Migration Support
Subtotal
Other Development CostsSubtotal
Total B
Total A + B
Core Village EntryPer YearCumulated
Source:
DFIDI = Department for International Development (India).PPGF = Participatory Planning and Group Formation.VOD = Village Organisation and Development.SWC = Soil and Water Conservation.WRD = Water Resource Development.
WIRFP - Phase II: Rajasthan - Pratapgarh: Indicative Investment Cost per Village (Economic) - IFFDC, DFIDI, Community and Government (Rs'000).
1999/00 2000/01 2001/02 2002/03 2003/04 2004/05 2005/06CF SCF Actual Actual Actual Actual Actual Budget Budget (Rs'000) (%)
0.90 1.00 95.4 41.6 42.5 76.2 48.4 42.5 42.5 389.2 11%1.00 1.00 35.9 71.4 26.9 63.2 47.4 54.7 39.2 338.6 9%0.90 1.00 105.9 96.7 129.8 227.2 292.1 292.1 292.1 1,436.0 39%
237.1 209.8 199.3 366.6 388.0 389.3 373.8 2,163.9 59%
0.90 1.00 7.1 10.2 8.5 12.2 2.7 2.2 1.6 44.4 1%0.90 1.00 0.9 16.0 18.7 27.5 32.2 25.7 19.3 140.4 4%0.90 1.00 0.0 3.4 3.4 13.2 28.4 22.8 17.1 88.3 2%0.90 0.75 0.0 33.3 31.7 33.9 8.0 6.4 4.8 118.2 3%0.90 0.75 1.7 40.2 130.5 201.9 236.7 189.3 142.0 942.4 26%0.90 1.00 0.0 5.0 3.8 10.4 14.8 11.8 8.9 54.7 1%0.90 1.00 0.0 7.1 2.2 20.3 16.1 12.9 9.7 68.3 2%0.90 1.00 - - - - - - - - 0%
9.7 115.3 198.8 319.5 338.9 271.1 203.4 1,456.7 40%
0.90 1.00 - - 2.3 5.9 43.6 - - 51.8 1%- - 2.3 5.9 43.6 - - 51.8 1%9.7 115.3 201.2 325.4 382.5 271.1 203.4 1,508.5 41%
246.8 325.0 400.4 692.0 770.5 660.5 577.2 3,672.4 100%
Cost Benefit Analysis (CBA) Study Estimates Jan 2005.
Conversion Factors Totals

Table AN8.19 WIRFP - Phase II: Rajasthan - Pratapgarh: Summary of Investment Costs Per Village - Financial (Rs'000).
Cost Head / Subhead IFFDCAverage
A. Administration CostsIFFDC Head Quarters 432.5 10% 432.5 7% 432.5 9% 432.5 9% 432.5 8% 432.5 6% 432.5 10%DFIDI 338.6 8% 338.6 5% 338.6 7% 338.6 7% 338.6 6% 338.6 5% 338.6 8%Pratapgarh Coordination Office 1,595.6 36% 1,595.6 26% 1,595.6 33% 1,595.6 35% 1,595.6 30% 1,595.6 22% 1,595.6 36%
Total A 2,366.7 53% 2,366.7 38% 2,366.7 49% 2,366.7 51% 2,366.7 44% 2,366.7 32% 2,366.7 53%
B. Development CostsComponent A 1. PPG 49.4 1% 62.0 1% 31.3 1% 73.1 2% 58.6 1% 74.6 1% 39.4 1% 2. VOD 156.0 4% 505.5 8% 280.1 6% 448.1 10% 545.3 10% 749.1 10% 336.6 8% 3. Crop 98.1 2% 96.1 2% 90.2 2% 167.4 4% 167.9 3% 273.7 4% 147.0 3% 4. SWC 175.1 4% 200.3 3% 272.3 6% 196.9 4% 294.0 6% 645.1 9% 68.8 2% 5. WRD 1,396.1 31% 2,807.0 45% 1,728.3 36% 1,176.8 26% 1,641.0 31% 2,745.2 38% 1,400.9 31% 6. Livestock 60.8 1% 92.1 1% 40.8 1% 93.2 2% 121.9 2% 242.0 3% 68.7 2% 7. Forestry 75.9 2% 61.0 1% 18.9 0% 86.5 2% 127.4 2% 212.5 3% 44.2 1% 8. Migration Support - 0% - 0% - 0% - 0% - 0% - 0% - 0%
Subtotal 2,011.4 45% 3,824.0 62% 2,461.9 51% 2,241.9 49% 2,956.1 56% 4,942.2 68% 2,105.5 47%
Other Development CostsSubtotal 57.6 1% - 0% - 0% - 0% - 0% - -
Total B 2,068.9 47% 3,824.0 62% 2,461.9 51% 2,241.9 49% 2,956.1 56% 4,942.2 68% 2,105.5 47%
Total A + B 4,435.7 100% 6,190.7 100% 4,828.7 100% 4,608.7 100% 5,322.8 100% 7,308.9 100% 4,472.3 100%
Households per Village (No) 86 60 49 80 108 112 42
Average Cost per Household (Rs'000) 52 103 99 58 49 65 106
Source: IFFDC Pratapgarh Coordination Office, Rajasthan.\1 Cost Benefit Analysis (CBA) Study - Field Verification.
DFIDI = Department for International Development (India).PPG = Participatory Planning and Group Formation.VOD = Village Organisation and Development.SWC = Soil and Water Conservation.WRD = Water Resource Development.
Dharia KheriChhayan \1 Soma Ka Khera \1KachotiaChhota Mayanga Moti Kheri \1

Table AN8.19
Cost Head / Subhead
A. Administration CostsIFFDC Head QuartersDFIDIPratapgarh Coordination Office
Total A
B. Development CostsComponent A 1. PPG 2. VOD 3. Crop 4. SWC 5. WRD 6. Livestock 7. Forestry 8. Migration Support
Subtotal
Other Development CostsSubtotal
Total B
Total A + B
Households per Village (No)
Average Cost per Household (Rs'000)
Source:\1 Cost Benefit Analysis (CBA) Study - Field Verification.
DFIDI = Department for International Development (India).PPG = Participatory Planning and Group Formation.VOD = Village Organisation and Development.SWC = Soil and Water Conservation.WRD = Water Resource Development.
WIRFP - Phase II: Rajasthan - Pratapgarh: Summary of Investment Costs Per Village - Economic (Rs'000).
IFFDC Chhayan \1 Dharia Kheri Kachotia Moti Kheri \1 Soma Ka Khera \1Average
389.2 389.2 389.2 389.2 389.2 389.2 389.2 338.6 338.6 338.6 338.6 338.6 338.6 338.6
1,436.0 1,436.0 1,436.0 1,436.0 1,436.0 1,436.0 1,436.0 2,163.9 2,163.9 2,163.9 2,163.9 2,163.9 2,163.9 2,163.9
44.4 55.8 28.2 65.8 52.7 67.1 35.4 140.4 454.9 252.0 403.3 490.8 674.2 303.0 88.3 86.5 81.2 150.6 151.1 246.3 132.3
118.2 135.2 183.8 132.9 198.5 435.4 46.4 942.4 1,894.7 1,166.6 794.3 1,107.7 1,853.0 945.6 54.7 82.9 36.8 83.9 109.7 217.8 61.9 68.3 54.9 17.0 77.9 114.7 191.2 39.7
- - - - - - - 1,456.7 2,764.9 1,765.6 1,708.7 2,225.1 3,685.1 1,564.3
51.8 - - - - - - 1,508.5 2,764.9 1,765.6 1,708.7 2,225.1 3,685.1 1,564.3
3,672.4 4,928.8 3,929.5 3,872.6 4,389.0 5,849.1 3,728.2
Cost Benefit Analysis (CBA) Study Estimates Jan 2005.
Chhota Mayanga

DFID / India: Western India Rainfed Farming Project / Final Report / October 2005
Self Help Groups
AN9

Self Help Groups
AN9-1
DFID / India: Western India Rainfed Farming Project / Final Report / October 2005
Self Help Groups
AN9
Gramin Vikas Trust
Physical and financial Information to assess the functional status of Self Help Groups (SHGs) in the three phase two districts organised by GVT is limited and barely meets the minimal evaluation criteria for SGHs suggested by National Bank for Agricultural and Rural Development (NABARD). In the absence of the availability of minimal recorded financial information, it was agreed that a limited field survey should be conducted to record the cash inflow/outflow from a randomly selected sample of SHGs based on information contained in the ledgers and bank pass books maintained at the villages. The objective being to provide a basic amount of financial information regarding the deposit levels and lending activities in the villages selected for field verification. This information is contained in Annex 9 and limited financial indicators from the GVT sample villages summarised in Table AN9.1.
Gujarat – Jadha Village
Limited financial indicators derived from the financial information covering the year end at March 2002, 2003 and 2004, recorded during the field verification at Jadha village are summarised below:
• Total membership from the six sample SHGs at Jhada village in September 2004 was 99 or on average 16 members per SHG;
• Total individual member and group savings from the sample amounted to Rs 156,904 in March 2004 representing an average of Rs 1,585 per member (US$ 351/), accumulated over a four year period or on average Rs 396 per year or Rs 33 per month per individual member;
• The net outstanding individual and group loans as at March 2004 amount to Rs 136,947 representing an average of Rs 1,380 per member. Outstanding loans represent 58 percent of the accumulated cash inflow.
Madhya Pradesh – Kadwapada Village
Limited financial indicators derived from the financial information covering the year end at March 2002, 2003 and 2004, recorded during the field verification at Kadwapada village are summarised below:
• Total membership from the three sample SHGs at Kadwapada village in September 2004 was 51 or on average 17 members per SHG;
1/ Assuming an exchange rate of US$ 1.0 = Rs 45 – December 2004.

Self Help Groups
AN9-2
DFID / India: Western India Rainfed Farming Project / Final Report / October 2005
• Total individual member and group deposits from the sample amounted to Rs 108,826 in March 2004 representing an average of Rs 2,134 per member (US$ 47), accumulated over a four year period or on average Rs 534 per year or Rs 44 per month per individual member;
• The net outstanding individual and group loans as at March 2004 amount to Rs 100,980 representing an average of Rs 1,980 per member. Outstanding loans represent 73 percent of the accumulated cash inflow.
Table AN9.1: GVT Self Help Group Cash Flow Analysis and Financial Indicators
Item 1/ Gujarat Jadha
M Pradesh Kadwapada
Rajastan Gara
Cash Inflow Deposits Member Savings 93.803 71,217 48,195 Group Savings 63,101 37,609 61,613 Subtotal 156.904 108,826 109,808 Group Activities (Net) 48,420 27,899 12,500 Interest Income 31,669 2,065 1,540 Total Cash Inflow 236,993 138,790 123,848Cash Outflow Loans Outstanding Individuals 131,883 100,980 53,100 Group 5,064 - 500 Total Cash Outflow 136,947 100,890 53,600Cash Balance 100,046 37,810 70,248Key Financial Indicators Membership 99 51 87 Average Savings / Member 1,585 2,134 1,262 Annual Increase 259 547 451 Outstanding Loans As Percent of Cash Inflow 58 percent 73 percent 49 percent Average Loan Size 1,383 1,980 616 Interest Income As percent of Average Loans 7 percent 1 percent 4 percent
Source: Cost Benefit Analysis Study, Jan 2005 based on field interviews. 1/ Field data as at March 2004.

Self Help Groups
AN9-3
DFID / India: Western India Rainfed Farming Project / Final Report / October 2005
Rajasthan – Gada Village
Limited financial indicators derived from the financial information covering the year end at March 2002, 2003 and 2004, recorded during the field verification at Gara village are summarised below:
• Total membership from the five sample SHGs at Gara village in September 2004 was 87 or on average 17 members per SHG;
• Total individual member and group savings from the sample amounted to Rs 109,808 in March 2004 representing an average of Rs 1,262 per member (US$ 28), accumulated over a four year period or on average Rs 316 per year or Rs 26 per month per individual member;
• The net outstanding individual and group loans as at March 2004 amount to Rs 53,600 representing an average of Rs 451 per member. Outstanding loans represent 49 percent of the accumulated cash inflow.
Lessons Learnt
Certain aspects of this analysis are common to many villages visited during the field verification and are itemised below:
• No breakdown of the status of the outstanding loan figure is available, thus no information is available as to the percentage of the loans for which repayments are on schedule, overdue or non performing and therefore to be written off;
• No information is recorded as to the use of the individual loans;
• It is assumed that the substantial cash balance is retained on deposit at the SHG and may indicate a reluctance on the part of the SHG membership to make loans to individuals or that there is a lack of attractive (financially viable) income generating activities (IGAs) for individuals to take up;
• Annual interest income over the period of the analysis, expressed as a percentage of the average outstanding loans during the year, is very low suggesting a very poor level of loan interest recovery probably limited mainly to bank deposit interest income.
Indian Farm Forestry Development Cooperative – Pratapgarh, Rajastan
Physical and financial Information to assess the functional status of SHGs at Pratapgarh is adequate and is considerably in excess of the minimal evaluation criteria for SGHs suggested by National Bank for Agricultural and Rural Development. Information for the six IFFDC sample villages is contained in Annex 9
Self Help Groups
AN9-4
DFID / India: Western India Rainfed Farming Project / Final Report / October 2005
Rastastan – Moti Kheri Village
Selected key financial indicators covering the year end at March 2002, 2003 and 2004 for Moti Kheri are given in Annex 9 and summarised below:
• The total reported membership in March 2004 was 164 from a total number of 115 households of which 112 are participating in the project;
• Membership shows a small decrease over the three year period, from 180 to 164 a nine percent decrease over the period;
• Individual and group deposits total Rs 277,987, at March 2004, and represent a current average saving per member of Rs 1,695.
• The figures for average membership savings per year show a continuing increase over the period at Rs 956, Rs1,239 and Rs 1,695, representing a 23 and 27 percent annual increase respectively, indicating that the savings regime is being maintained,
• Total loans outstanding (Rs 103,038) as a percentage of total deposits (37 percent) indicates a reluctance of membership to advance loans, a reluctance of the membership to borrow or the lack of financially viable income generating activities (IGAs) to expand household income,
• Loan size remains small with only a modest increase over the period from Rs 285, 330 and 400 a 16 and three percent annual increase respectively. The annual number of loans advanced has been reduced from 194 in the year to March 2003 to 126 in the year to March 2004;
• Consumption, health and education loans account for 44, 11 and one percent respectively by value, production loans (mainly seed and fertiliser) account for a further 42 percent by value and IGAs only account for 2 percent.
• Annual interest income for the 12 months to March 2004, expressed as a percentage of the average outstanding loans during the year, is only four percent suggesting a very poor level of interest recovery probably limited mainly to bank deposit income.
• Annual operating expenditure remains very low;
• No provision is made for provision of bad and doubtful debt as the status of the outstanding loans is not available.
Lessons Learnt
Key financial figures, as at March 2004, for the six IFFDC sample villages, are summarised in Table AN9.2.

Self Help Groups
AN9-5
DFID / India: Western India Rainfed Farming Project / Final Report / October 2005
Table AN9.2: IFFDC Sample Village Self Help Group Financial Indicators
Item Chhayan Chhota Manga
Dharis Kheri
Kachotia Moti Kheri
S Ka Khera
SHG Membership (No) 87 51 94 106 164 15 Deposits (Rs) Individual 102,150 39,536 68,493 67,206 150,852 6,002 Group 45,635 30,481 22,467 32,499 127,135 727 Total 147,785 70,017 90,960 99,705 277,987 6,729 Average Deposit /
Member 1,699 1,373 968 941 1,695 449
Loans Outstanding 156,560 36,950 31,803 37,180 103,038 5,000 Balance on Deposit (8,775) 33,067 59,157 62,525 174,949 1,732 Income Interest 32,307 4,379 7,315 4,270 14,889 214 Penalty Interest 295 70 62 2,535 1,077 5 Total 32,602 4,449 7,377 6,805 15,966 219
Expenditure (6,940) - (334) (277) (48.500) - Income Less Expenditure
28,862 4,449 7,043 6,528 (30,334) 219
Cash (in hand and Bank) 20,087 37,516 66,200 69,053 144,615 1,951 Loan Portfolio Outstanding 156,560 36,950 31,803 37,180 103,038 5,000 Repaid 207,615 39,953 64,080 93,158 176,872 4,130 Total 364,175 76,903 95,883 130,338 279,910 9,130 Loan Numbers 896 199 227 533 824 23 Average Loan Size 406 389 422 245 340 397
Loan Types (%) Consumption 28 35 19 31 45 96 Health 25 4 2 3 11 1 Education 0 1 2 2 1 0 Micro enterprise 4 0 0 3 1 0 Production 43 60 77 61 42 3 Total 100 100 100 100 100 100
Source: IFFDC Coordination Office Pratapgarh, Rajasthan IFFDC = Indian Farm Forestry Development Cooperative. Key financial indicators are summarised below:
• Total membership from the six sample villages is 517 from a total number of reported households of 566 or 398 participating households;
• Total individual member and group savings from the six sample villages amounted to Rs 693,200. This represents Rs 1,341 per member (US$ 30), accumulated over a four-year period or Rs 335 per year or Rs 30 per month per individual member. The average individual savings varies from Rs 1,699 (Chhayanne, a relatively wealthy village) to Rs 449 (S. Ka Khera, a more
Self Help Groups
AN9-6
DFID / India: Western India Rainfed Farming Project / Final Report / October 2005
recently developed SHG). Individual deposits account for 63 percent of the average membership saving with the balance held as group savings;
• Outstanding loans as at March 2004 amount to Rs 370,531 representing an average of Rs 717 or 53 percent per member. It is assumed that the balance of Rs 624 or 47 percent is retained on deposit and may indicate a reluctance on the part of the SHG membership to make loans to individuals or a lack of attractive (financially viable) income generating activities (IGAs) for individuals to take up;
• No breakdown of the status of the outstanding loan figure is available, thus no information is available as to the percentage of loan repayments which are on schedule, overdue or non performing and therefore to be written off;
• The average loan size remains small at Rs 354 (US$ 8). Consumption, health and education loans account for 32, 15 and one percent respectively by value, production loans (mainly seed and fertiliser) account for a further 50 percent by value and IGAs only account for two percent

WIRFP - Phase II - Cost Benefit Analysis Study
Tables AN9.0: Self Help Groups
Tables AN9.2: IFFDC Pratapgarh Coordination Office Rajasthan, Self Help Groups (SHG).
Table AN9.2.1 IFFDC Rajasthan - Pratapgarh Self Help Groups - Summary (Balance as at March 2004).
Table AN9.2.2 IFFDC Rajasthan - Pratapgarh Self Help Groups - Chhayan SummaryIFFDC Rajasthan - Pratapgarh Self Help Group - Chhayan 1 - Johda Bawji BS.
Table AN9.2.3 IFFDC Rajasthan - Pratapgarh Self Help Groups - Moti Kheri SummaryIFFDC Rajasthan - Pratapgarh Self Help Group - Moti Kheri 1 - Santoshi Mata BSIFFDC Rajasthan - Pratapgarh Self Help Group - Moti Kheri 2 - Mamadev BSIFFDC Rajasthan - Pratapgarh Self Help Group - Moti Kheri 3 - Bheru Baoji BSIFFDC Rajasthan - Pratapgarh Self Help Group - Moti Kheri 4 - Bajrang BSIFFDC Rajasthan - Pratapgarh Self Help Group - Moti Kheri 5 - Kalka Mata BSIFFDC Rajasthan - Pratapgarh Self Help Group - Moti Kheri 6 - Amba Mata BSIFFDC Rajasthan - Pratapgarh Self Help Group - Moti Kheri 7 - Gangotri BSIFFDC Rajasthan - Pratapgarh Self Help Group - Moti Kheri 8 - Ganga Mata BSIFFDC Rajasthan - Pratapgarh Self Help Group - Moti Kheri 9 - Johda Bawji BSIFFDC Rajasthan - Pratapgarh Self Help Group - Moti Kheri 10 - Mahadev BSIFFDC Rajasthan - Pratapgarh Self Help Group - Moti Kheri 11 - Vijwa Mata BSIFFDC Rajasthan - Pratapgarh Self Help Group - Moti Kheri 12 - Khagaldev BSIFFDC Rajasthan - Pratapgarh Self Help Group - Moti Kheri 13 - Dev Narayan BS
Table AN9.2.4 IFFDC Rajasthan - Pratapgarh Self Help Groups - Somawaton Ka Khera - SummaryIFFDC Rajasthan - Pratapgarh Self Help Group - Somawaton Ka Khera 1 - Devnarayan BSIFFDC Rajasthan - Pratapgarh Self Help Group - Somawaton Ka Khera 2 - Parwati BS
IFFDC Rajasthan - Pratapgarh Self Help Group - Chhayan 7 - Mahadev BSIFFDC Rajasthan - Pratapgarh Self Help Group - Chhayan 6 - Dev Dharma BS
IFFDC Rajasthan - Pratapgarh Self Help Group - Somawaton Ka Khera 3 - Shri Ganesh BS
IFFDC Rajasthan - Pratapgarh Self Help Group - Chhayan 2 - DevnarChhayan BSIFFDC Rajasthan - Pratapgarh Self Help Group - Chhayan 3 - Amba Mata BSIFFDC Rajasthan - Pratapgarh Self Help Group - Chhayan 4 - Diwag Mata BSIFFDC Rajasthan - Pratapgarh Self Help Group - Chhayan 5 - Bajrang Bali BS

Table AN9.2.1 IFFDC Rajasthan - Pratapgarh Self Help Groups - Summary (Balance as at March 2004).
Item
SGH Membership (No) 87 51 94 106 164 15 Savings (Rs)
Individual 102,150 39,536 68,493 67,206 150,852 6,005 Group 45,635 30,481 22,467 32,499 127,135 727 Total 147,785 70,017 90,960 99,705 277,987 100% 6,732
Average Savings per member (Rs) 1,699 1,373 968 941 1,695 449
Loans Outstanding (Rs) 156,560 36,950 31,803 37,180 103,038 37% 5,000 -
Balance on Deposit (Rs) (8,775) 33,067 59,157 62,525 174,949 63% 1,732
Income (Rs)Interest 32,307 4,379 7,315 4,270 14,889 214 Penalty 295 70 62 2,535 1,077 5 Subtotal 32,602 4,449 7,377 6,805 15,966 219 Grants 3,200 - - -
Expenditure (RS)Total 6,940 - 334 277 48,500 -
Net Income less Expenditure (Rs) 28,862 4,449 7,043 6,528 (30,334) 219
Cash (in hand and bank) (Rs) 20,087 37,516 66,200 69,053 144,615 1,951
Loan Portfolio (Cumulated)Outstanding 156,560 43% 36,950 48% 31,803 33% 37,180 29% 103,038 37% 5,000 55%Repaid 207,615 57% 39,953 52% 64,080 67% 93,158 71% 176,872 63% 4,130 45%Total (Rs) 364,175 100% 77,454 100% 95,883 100% 130,338 100% 279,910 100% 9,130 100%Loan Numbers 896 199 227 533 824 23 Average Loan Size (Rs) 406 389 422 245 340 397
Loan Types (Rs / %):Consumption 88,357 28% 23,250 35% 16,461 19% 22,950 31% 84,707 44% 3,700 96%Health 81,189 25% 2,810 4% 1,867 2% 2,600 3% 21,982 11% 50 1%Education 1,145 0% 570 1% 1,638 2% 1,600 2% 2,118 1% - 0%Micro Enterprise 12,573 4% - 0% 376 0% 2,400 3% 1,937 1% - 0%Production 135,942 43% 40,080 60% 67,627 77% 45,420 61% 80,741 42% 100 3%Total 319,206 100% 66,710 100% 87,969 100% 74,970 100% 191,485 100% 3,850 100%
Source: IFFDC Pratapgarh Coordination Office, Rajasthan.
Balance(as at)Mar-04
Balance(as at)Mar-04
Balance(as at)Mar-04
Balance(as at)Mar-04
Balance(as at)Mar-04
Balance(as at)Mar-04
Chhayanne Moti Kheri Soms Ka KheraChhota Mayanga Dharia Kheri Kachotia

Table AN9.2.2 IFFDC Rajasthan - Pratapgarh Self Help Groups - Chhayan Summary
Item Balance Movement Balance Movement Balance(as at) (year) (as at) (year) (as at)
Apr-02 Apr-02 Mar-03 Mar-03 Mar-04Mar-03 Mar-04
Membership 111 (16) 95 (8) 87 Savings
Individual 44,242 27,947 72,189 29,961 102,150 Group 13,254 8,734 21,988 23,647 45,635 Total 57,496 36,681 94,177 53,608 147,785
LoansOutstanding 36,970 37,320 74,290 82,270 156,560
Balance 20,526 (639) 19,887 (28,662) (8,775)
IncomeInterest 4,300 12,509 16,808 15,499 32,307 Penalty 196 55 250 45 295 Subtotal 4,495 12,563 17,058 15,544 32,602 Grants - 3,200 3,200
ExpenditureTotal 714 7,740 8,454 (1,514) 6,940
Net Income less Expenditure 3,781 8,023 11,804 17,058 28,862
Cash (in hand and bank) 24,307 7,384 31,691 (11,604) 20,087
Cash as per Records 24,307 7,384 31,691 (17,624) 14,067 Share & FDR - - 6,020 Difference - - -
Loan Portfolio (Cumulated)Outstanding 36,970 37,320 74,290 82,270 156,560 Repaid 91,117 53,478 144,595 63,020 207,615 Total 128,087 90,798 218,885 145,290 364,175 Loan No 644 118 762 134 896 Average Loan Size (Rs) 199 287 406
Loan Types:Consumption 42,918 43% 58,457 31% 88,357 28%Health 21,730 22% 27,690 15% 81,189 25%Education 845 1% 1,145 1% 1,145 0%Micro Enterprise 1,690 2% 6,590 4% 12,573 4%Production 33,359 33% 92,717 50% 135,942 43%Total 100,542 100% 186,599 100% 319,206 100%
Source: IFFDC Pratapgarh Coordination Office, Rajasthan.\1 Overdue loans reported:
Chhayan - Summary (7 Self Help Groups)
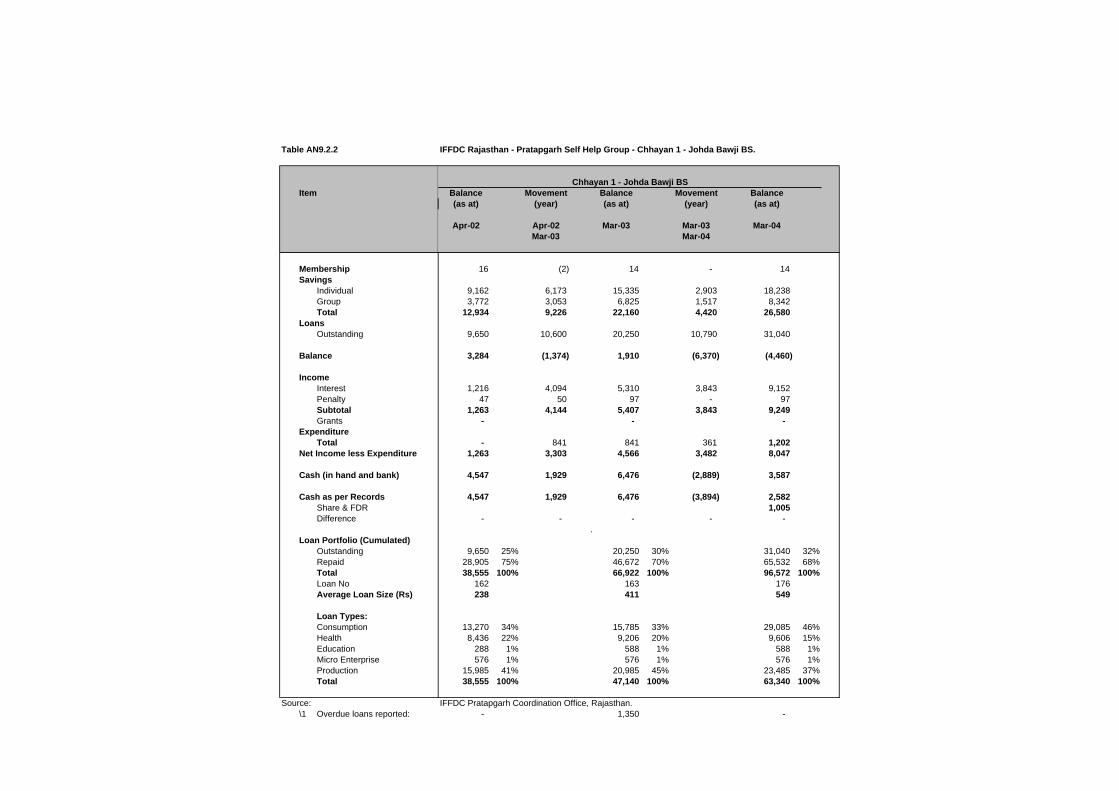
Table AN9.2.2
Item
MembershipSavings
IndividualGroupTotal
LoansOutstanding
Balance
IncomeInterestPenaltySubtotalGrants
ExpenditureTotal
Net Income less Expenditure
Cash (in hand and bank)
Cash as per RecordsShare & FDRDifference
Loan Portfolio (Cumulated)OutstandingRepaidTotalLoan NoAverage Loan Size (Rs)
Loan Types:ConsumptionHealthEducationMicro EnterpriseProductionTotal
Source:\1 Overdue loans reported:
IFFDC Rajasthan - Pratapgarh Self Help Group - Chhayan 1 - Johda Bawji BS.
Balance Movement Balance Movement Balance(as at) (year) (as at) (year) (as at)
Apr-02 Apr-02 Mar-03 Mar-03 Mar-04Mar-03 Mar-04
16 (2) 14 - 14
9,162 6,173 15,335 2,903 18,238 3,772 3,053 6,825 1,517 8,342
12,934 9,226 22,160 4,420 26,580
9,650 10,600 20,250 10,790 31,040
3,284 (1,374) 1,910 (6,370) (4,460)
1,216 4,094 5,310 3,843 9,152 47 50 97 - 97
1,263 4,144 5,407 3,843 9,249 - - -
- 841 841 361 1,202 1,263 3,303 4,566 3,482 8,047
4,547 1,929 6,476 (2,889) 3,587
4,547 1,929 6,476 (3,894) 2,582 1,005
- - - - - .
9,650 25% 20,250 30% 31,040 32% 28,905 75% 46,672 70% 65,532 68% 38,555 100% 66,922 100% 96,572 100%
162 163 176 238 411 549
13,270 34% 15,785 33% 29,085 46% 8,436 22% 9,206 20% 9,606 15%
288 1% 588 1% 588 1% 576 1% 576 1% 576 1%
15,985 41% 20,985 45% 23,485 37% 38,555 100% 47,140 100% 63,340 100%
IFFDC Pratapgarh Coordination Office, Rajasthan.- 1,350 -
Chhayan 1 - Johda Bawji BS

Table AN9.2.2
Item
MembershipSavings
IndividualGroupTotal
LoansOutstanding
Balance
IncomeInterestPenaltySubtotalGrants
ExpenditureTotal
Net Income less Expenditure
Cash (in hand and bank)
Cash as per RecordsShare & FDRDifference
Loan Portfolio (Cumulated)OutstandingRepaidTotalLoan NoAverage Loan Size (Rs)
Loan Types:ConsumptionHealthEducationMicro EnterpriseProductionTotal
Source:\1 Overdue loans reported:
IFFDC Rajasthan - Pratapgarh Self Help Group - Chhayan 2 - DevnarChhayan BS
Balance Movement Balance Movement Balance(as at) (year) (as at) (year) (as at)
Apr-02 Apr-02 Mar-03 Mar-03 Mar-04Mar-03 Mar-04
16 - 16 - 16
7,978 7,003 14,981 8,576 23,557 1,571 1,129 2,700 4,782 7,482 9,549 8,132 17,681 13,358 31,039
7,240 7,360 14,600 21,900 36,500
2,309 772 3,081 (8,542) (5,461)
865 2,479 3,344 4,444 7,788 5 5 10 - 10
870 2,484 3,354 4,444 7,798 - 3,200 3,200 - 3,200
- 5,393 5,393 (3,987) 1,406 870 291 1,161 8,431 9,592
3,179 1,063 4,242 (111) 4,131
3,179 1,063 4,242 (2,116) 2,126 2,005
- - - - -
7,240 32% 14,600 32% 36,500 44% 15,247 68% 30,985 68% 46,315 56% 22,487 100% 45,585 100% 82,815 100%
95 135 171 237 338 484
9,712 43% 13,412 32% 19,612 30% 1,525 7% 3,075 7% 3,575 5%
287 1% 287 1% 287 0% 573 3% 573 1% 1,573 2%
10,390 46% 25,043 59% 40,323 62% 22,487 100% 42,390 100% 65,370 100%
IFFDC Pratapgarh Coordination Office, Rajasthan.- - -
Chhayan 2 - Devnarayan BS

Table AN9.2.2
Item
MembershipSavings
IndividualGroupTotal
LoansOutstanding
Balance
IncomeInterestPenaltySubtotalGrants
ExpenditureTotal
Net Income less Expenditure
Cash (in hand and bank)
Cash as per RecordsShare & FDRDifference
Loan Portfolio (Cumulated)OutstandingRepaidTotalLoan NoAverage Loan Size (Rs)
Loan Types:ConsumptionHealthEducationMicro EnterpriseProductionTotal
Source:\1 Overdue loans reported:
IFFDC Rajasthan - Pratapgarh Self Help Group - Chhayan 3 - Amba Mata BS
Balance Movement Balance Movement Balance(as at) (year) (as at) (year) (as at)
Apr-02 Apr-02 Mar-03 Mar-03 Mar-04Mar-03 Mar-04
16 (2) 14 (2) 12
4,093 3,890 7,983 3,761 11,744 888 2,056 2,944 4,823 7,767
4,981 5,946 10,927 8,584 19,511
1,900 2,740 4,640 13,810 18,450
3,081 3,206 6,287 (5,226) 1,061
190 758 948 1,101 2,049 - 5 5 - 5
190 763 953 1,101 2,054 - - -
- 420 420 100 520 190 343 533 1,001 1,534
3,271 3,549 6,820 (4,225) 2,595
3,271 3,549 6,820 (5,230) 1,590 1,005
- - -
1,900 62% 4,640 52% 18,450 67% 1,170 38% 4,230 48% 9,030 33% 3,070 100% 8,870 100% 27,480 100%
57 69 84 54 129 327
1,706 56% 3,106 32% 10,306 16% 555 18% 555 6% 41,554 64% 58 2% 58 1% 58 0%
117 4% 2,617 27% 5,600 9% 584 19% 3,274 34% 7,474 11%
3,020 100% 9,610 100% 64,992 100%
IFFDC Pratapgarh Coordination Office, Rajasthan.- 940 -
Chhayan 3 - Amba Mata BS

Table AN9.2.2
Item
MembershipSavings
IndividualGroupTotal
LoansOutstanding
Balance
IncomeInterestPenaltySubtotalGrants
ExpenditureTotal
Net Income less Expenditure
Cash (in hand and bank)
Cash as per RecordsShare & FDRDifference
Loan Portfolio (Cumulated)OutstandingRepaidTotalLoan NoAverage Loan Size (Rs)
Loan Types:ConsumptionHealthEducationMicro EnterpriseProductionTotal
Source:\1 Overdue loans reported:
IFFDC Rajasthan - Pratapgarh Self Help Group - Chhayan 4 - Diwag Mata BS
Balance Movement Balance Movement Balance(as at) (in year) (as at) (in year) (as at)
Apr-02 Apr-02 Mar-03 Mar-03 Mar-04Mar-03 Mar-04
20 (6) 14 (1) 13
7,112 2,624 9,736 4,482 14,218 2,501 974 3,475 4,367 7,842 9,613 3,598 13,211 8,849 22,060
6,040 6,750 12,790 12,710 25,500
3,573 (3,152) 421 (3,861) (3,440)
677 2,067 2,744 2,162 4,906 64 5 69 15 84
741 2,072 2,813 2,177 4,990 - - - -
357 (357) - 726 726 384 2,429 2,813 1,451 4,264
3,957 (723) 3,234 (2,410) 824
3,957 (723) 3,234 (2,410) 824 -
- - -
6,040 26% 12,790 35% 25,500 44% 16,970 74% 23,790 65% 33,080 56%23,010 100% 36,580 100% 58,580 100%
116 137 161 198 267 364
6,810 47% 10,210 30% 10,860 23%4,462 31% 5,282 15% 10,482 22%
96 1% 96 0% 96 0%192 1% 1,392 4% 1,392 3%
2,900 20% 17,110 50% 24,610 52% 14,460 100% 34,090 100% 47,440 100%
IFFDC Pratapgarh Coordination Office, Rajasthan.
Chhayan 4 - Diwag Mata BS

Table AN9.2.2
Item
MembershipSavings
IndividualGroupTotal
LoansOutstanding
Balance
IncomeInterestPenaltySubtotalGrants
ExpenditureTotal
Net Income less Expenditure
Cash (in hand and bank)
Cash as per RecordsShare & FDRDifference
Loan Portfolio (Cumulated)OutstandingRepaidTotalLoan NoAverage Loan Size (Rs)
Loan Types:ConsumptionHealthEducationMicro EnterpriseProductionTotal
Source:\1 Overdue loans reported:
IFFDC Rajasthan - Pratapgarh Self Help Group - Chhayan 5 - Bajrang Bali BS
Balance Movement Balance Movement Balance(as at) (in year) (as at) (in year) (as at)
Apr-02 Apr-02 Mar-03 Mar-03 Mar-04Mar-03 Mar-04
14 (1) 13 (3) 10
3,844 2,703 6,547 1,225 7,772 707 630 1,337 872 2,209
4,551 3,333 7,884 2,097 9,981
1,900 1,620 3,520 (400) 3,120
2,651 1,713 4,364 2,497 6,861
180 134 314 376 690 - - - -
180 134 314 376 690 - - -
- - - 1,829 1,829 180 134 314 (1,453) (1,139)
2,831 1,847 4,678 1,044 5,722
2,831 1,847 4,678 39 4,717 1,005
- - -
1,900 61% 3,520 67% 3,120 52%1,200 39% 1,750 33% 2,850 48%3,100 100% 5,270 100% 5,970 100%
25 35 37 124 151 161
1,960 81% 2,060 60% 2,560 62%190 8% 340 10% 340 8%20 1% 20 1% 20 0%40 2% 40 1% 40 1%
200 8% 990 29% 1,190 29% 2,410 100% 3,450 100% 4,150 100%
IFFDC Pratapgarh Coordination Office, Rajasthan.
Chhayan 5 - Bajrang Bali BS

Table AN9.2.2
Item
MembershipSavings
IndividualGroupTotal
LoansOutstanding
Balance
IncomeInterestPenaltySubtotalGrants
ExpenditureTotal
Net Income less Expenditure
Cash (in hand and bank)
Cash as per RecordsShare & FDRDifference
Loan Portfolio (Cumulated)OutstandingRepaidTotalLoan NoAverage Loan Size (Rs)
Loan Types:ConsumptionHealthEducationMicro EnterpriseProductionTotal
Source:\1 Overdue loans reported:
IFFDC Rajasthan - Pratapgarh Self Help Group - Chhayan 6 - Dev Dharma BS
Balance Movement Balance Movement Balance(as at) (in year) (as at) (in year) (as at)
Apr-02 Apr-02 Mar-03 Mar-03 Mar-04Mar-03 Mar-04
9 1 10 (1) 9
4,941 2,930 7,871 4,532 12,403 1,314 (82) 1,232 2,919 4,151 6,255 2,848 9,103 7,451 16,554
4,200 1,500 5,700 10,750 16,450
2,055 1,348 3,403 (3,299) 104
495 910 1,405 1,412 2,816 16 (16) - 15 15
510 895 1,405 1,427 2,831 - - -
- 1,800 1,800 (1,269) 531 510 (906) (396) 2,696 2,300
2,565 443 3,008 (604) 2,404
2,565 443 3,008 (1,604) 1,404 1,000
- - -
4,200 28% 5,700 30% 16,450 48%10,655 72% 13,378 70% 17,728 52% 14,855 100% 19,078 100% 34,178 100%
73 86 106 203 222 322
2,650 51% 3,674 23% 5,074 19% 2,100 41% 3,950 25% 5,150 19%
- 0% - 0% - 0%- 0% - 0% 2,000 8%
400 8% 8,205 52% 14,250 54% 5,150 100% 15,829 100% 26,474 100%
IFFDC Pratapgarh Coordination Office, Rajasthan.
Chhayan 6 - Dev Dharma BS
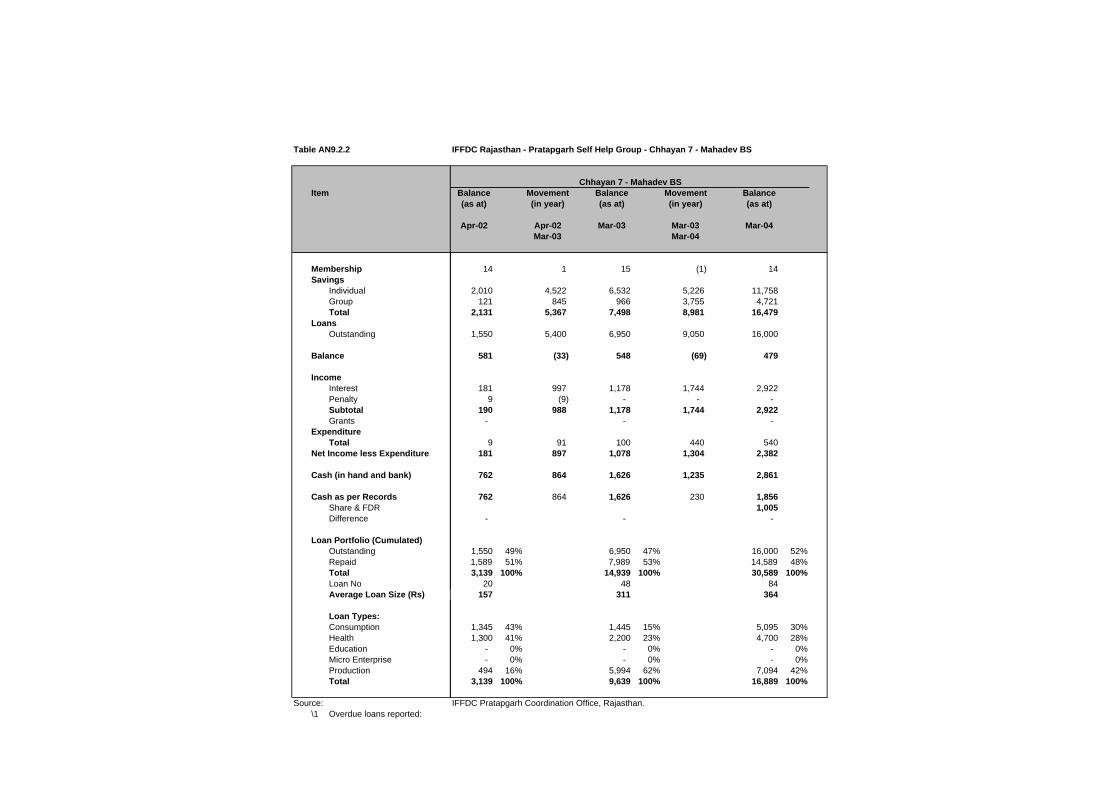
Table AN9.2.2
Item
MembershipSavings
IndividualGroupTotal
LoansOutstanding
Balance
IncomeInterestPenaltySubtotalGrants
ExpenditureTotal
Net Income less Expenditure
Cash (in hand and bank)
Cash as per RecordsShare & FDRDifference
Loan Portfolio (Cumulated)OutstandingRepaidTotalLoan NoAverage Loan Size (Rs)
Loan Types:ConsumptionHealthEducationMicro EnterpriseProductionTotal
Source:\1 Overdue loans reported:
IFFDC Rajasthan - Pratapgarh Self Help Group - Chhayan 7 - Mahadev BS
Balance Movement Balance Movement Balance(as at) (in year) (as at) (in year) (as at)
Apr-02 Apr-02 Mar-03 Mar-03 Mar-04Mar-03 Mar-04
14 1 15 (1) 14
2,010 4,522 6,532 5,226 11,758 121 845 966 3,755 4,721
2,131 5,367 7,498 8,981 16,479
1,550 5,400 6,950 9,050 16,000
581 (33) 548 (69) 479
181 997 1,178 1,744 2,922 9 (9) - - -
190 988 1,178 1,744 2,922 - - -
9 91 100 440 540 181 897 1,078 1,304 2,382
762 864 1,626 1,235 2,861
762 864 1,626 230 1,856 1,005
- - -
1,550 49% 6,950 47% 16,000 52%1,589 51% 7,989 53% 14,589 48% 3,139 100% 14,939 100% 30,589 100%
20 48 84 157 311 364
1,345 43% 1,445 15% 5,095 30% 1,300 41% 2,200 23% 4,700 28%
- 0% - 0% - 0%- 0% - 0% - 0%
494 16% 5,994 62% 7,094 42% 3,139 100% 9,639 100% 16,889 100%
IFFDC Pratapgarh Coordination Office, Rajasthan.
Chhayan 7 - Mahadev BS
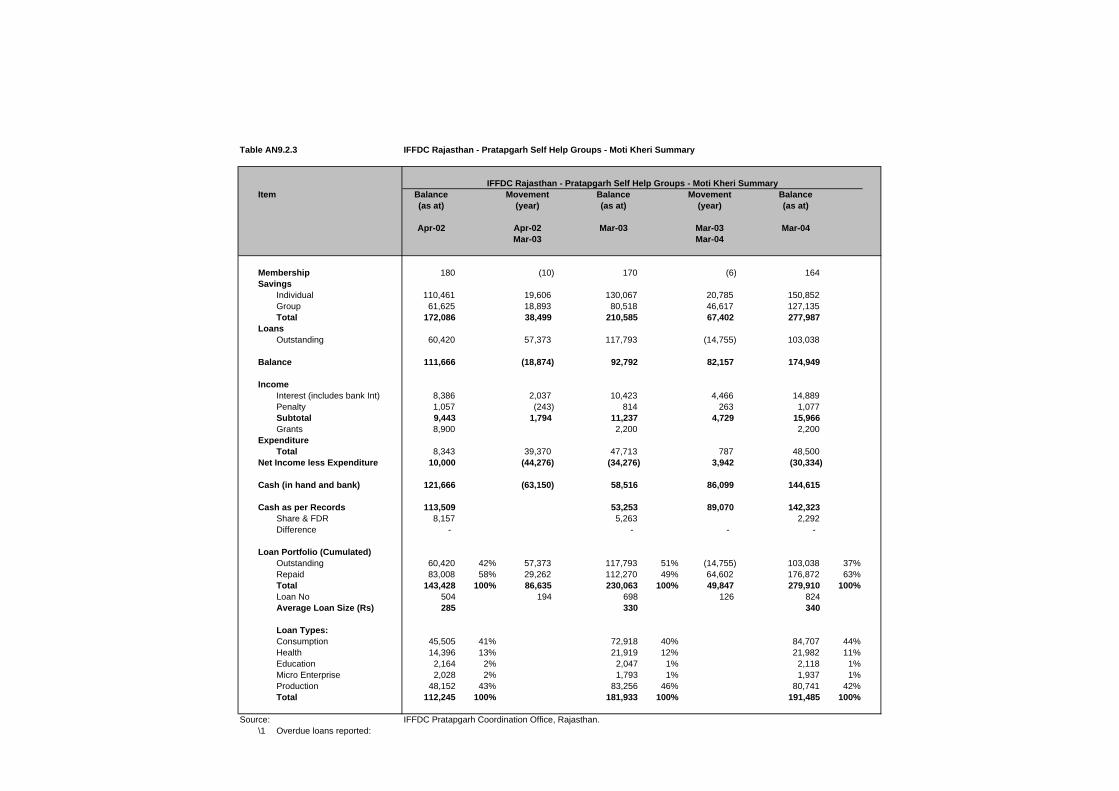
Table AN9.2.3 IFFDC Rajasthan - Pratapgarh Self Help Groups - Moti Kheri Summary
Item Balance Movement Balance Movement Balance(as at) (year) (as at) (year) (as at)
Apr-02 Apr-02 Mar-03 Mar-03 Mar-04Mar-03 Mar-04
Membership 180 (10) 170 (6) 164 Savings
Individual 110,461 19,606 130,067 20,785 150,852 Group 61,625 18,893 80,518 46,617 127,135 Total 172,086 38,499 210,585 67,402 277,987
LoansOutstanding 60,420 57,373 117,793 (14,755) 103,038
Balance 111,666 (18,874) 92,792 82,157 174,949
IncomeInterest (includes bank Int) 8,386 2,037 10,423 4,466 14,889 Penalty 1,057 (243) 814 263 1,077 Subtotal 9,443 1,794 11,237 4,729 15,966 Grants 8,900 2,200 2,200
ExpenditureTotal 8,343 39,370 47,713 787 48,500
Net Income less Expenditure 10,000 (44,276) (34,276) 3,942 (30,334)
Cash (in hand and bank) 121,666 (63,150) 58,516 86,099 144,615
Cash as per Records 113,509 53,253 89,070 142,323 Share & FDR 8,157 5,263 2,292 Difference - - - -
Loan Portfolio (Cumulated)Outstanding 60,420 42% 57,373 117,793 51% (14,755) 103,038 37%Repaid 83,008 58% 29,262 112,270 49% 64,602 176,872 63%Total 143,428 100% 86,635 230,063 100% 49,847 279,910 100%Loan No 504 194 698 126 824 Average Loan Size (Rs) 285 330 340
Loan Types:Consumption 45,505 41% 72,918 40% 84,707 44%Health 14,396 13% 21,919 12% 21,982 11%Education 2,164 2% 2,047 1% 2,118 1%Micro Enterprise 2,028 2% 1,793 1% 1,937 1%Production 48,152 43% 83,256 46% 80,741 42%Total 112,245 100% 181,933 100% 191,485 100%
Source: IFFDC Pratapgarh Coordination Office, Rajasthan.\1 Overdue loans reported:
IFFDC Rajasthan - Pratapgarh Self Help Groups - Moti Kheri Summary

Table AN9.2.3
Item
MembershipSavings
IndividualGroupTotal
LoansOutstanding
Balance
IncomeInterest (includes bank Int)PenaltySubtotalGrants
ExpenditureTotal
Net Income less Expenditure
Cash (in hand and bank)
Cash as per RecordsShare & FDRDifference
Loan Portfolio (Cumulated)OutstandingRepaidTotalLoan NoAverage Loan Size (Rs)
Loan Types:ConsumptionHealthEducationMicro EnterpriseProductionTotal
Source:\1 Overdue loans reported:
IFFDC Rajasthan - Pratapgarh Self Help Group - Moti Kheri 1 - Santoshi Mata BS
Balance Movement Balance Movement Balance(as at) (year) (as at) (year) (as at)
Apr-02 Apr-02 Mar-03 Mar-03 Mar-04Mar-03 Mar-04
12 - 12 - 12
5,735 3,161 8,896 2,616 11,512 2,106 6,185 8,291 4,481 12,772 7,841 9,346 17,187 7,097 24,284
2,400 3,845 6,245 (2,953) 3,292
5,441 5,501 10,942 10,050 20,992
302 438 740 440 1,180 55 (55) - - -
357 383 740 440 1,180 - -
- 5,808 5,808 (4,193) 1,615 357 (5,425) (5,068) 4,633 (435)
5,798 76 5,874 14,683 20,557
5,798 76 5,874 13,678 19,552 1,005
- - - - -
2,400 37% 6,245 41% 3,292 19% 4,155 63% 9,083 59% 13,681 81% 6,555 100% 15,328 100% 16,973 100%
30 58 63 219 264 269
1,150 55% 8,278 59% 10,778 65%- 0% 350 2% 350 2%- 0% - 0% - 0%- 0% - 0% - 0%
950 45% 5,506 39% 5,505 33% 2,100 100% 14,134 100% 16,633 100%
IFFDC Pratapgarh Coordination Office, Rajasthan. 1,900 1,350 -
IFFDC Rajasthan - Pratapgarh Self Help Group - Moti Kheri 1 - Santoshi Mata BS

Table AN9.2.3
Item
MembershipSavings
IndividualGroupTotal
LoansOutstanding
Balance
IncomeInterest (includes bank Int)PenaltySubtotalGrants
ExpenditureTotal
Net Income less Expenditure
Cash (in hand and bank)
Cash as per RecordsShare & FDRDifference
Loan Portfolio (Cumulated)OutstandingRepaidTotalLoan NoAverage Loan Size (Rs)
Loan Types:ConsumptionHealthEducationMicro EnterpriseProductionTotal
Source:\1 Overdue loans reported:
IFFDC Rajasthan - Pratapgarh Self Help Group - Moti Kheri 2 - Mamadev BS
Balance Movement Balance Movement Balance(as at) (year) (as at) (year) (as at)
Apr-02 Apr-02 Mar-03 Mar-03 Mar-04Mar-03 Mar-04
7 7 - 7
5,507 1,604 7,111 1,786 8,897 4,574 926 5,500 4,931 10,431
10,081 2,530 12,611 6,717 19,328
1,360 5,162 6,522 15,433 21,955
8,721 (2,632) 6,089 (8,716) (2,627)
347 238 585 502 1,087 80 (80) - 53 53
427 158 585 555 1,140 - - - - -
- 489 489 203 692 427 (331) 96 352 448
9,148 (2,963) 6,185 (8,364) (2,179)
9,148 (2,963) 6,185 2,746 8,931 (11,110)
- - - - -
1,360 34% 6,522 66% 21,955 55% 2,600 66% 3,304 34% 17,867 45% 3,960 100% 9,826 100% 39,822 100%
17 25 94 233 393 424
250 6% 6,256 65% 6,256 50%- 0% - 0% 2,200 18%- 0% - 0% - 0%- 0% - 0% - 0%
3,610 94% 3,410 35% 4,050 32% 3,860 100% 9,666 100% 12,506 100%
IFFDC Pratapgarh Coordination Office, Rajasthan. 1,360 - -
IFFDC Rajasthan - Pratapgarh Self Help Group - Moti Kheri 2 - Mamadev BS

Table AN9.2.3
Item
MembershipSavings
IndividualGroupTotal
LoansOutstanding
Balance
IncomeInterest (includes bank Int)PenaltySubtotalGrants
ExpenditureTotal
Net Income less Expenditure
Cash (in hand and bank)
Cash as per RecordsShare & FDRDifference
Loan Portfolio (Cumulated)OutstandingRepaidTotalLoan NoAverage Loan Size (Rs)
Loan Types:ConsumptionHealthEducationMicro EnterpriseProductionTotal
Source:\1 Overdue loans reported:
IFFDC Rajasthan - Pratapgarh Self Help Group - Moti Kheri 3 - Bheru Baoji BS
Balance Movement Balance Movement Balance(as at) (year) (as at) (year) (as at)
Apr-02 Apr-02 Mar-03 Mar-03 Mar-04Mar-03 Mar-04
20 - 20 (2) 18
15,303 2,566 17,869 2,521 20,390 18,161 2,590 20,751 130 20,881 33,464 5,156 38,620 2,651 41,271
14,151 6,237 20,388 (8,743) 11,645
19,313 (1,081) 18,232 11,394 29,626
1,532 34 1,566 34 1,600 545 30 575 200 775
2,077 64 2,141 234 2,375 - - -
1,470 11,750 13,220 (248) 12,972 607 (11,686) (11,079) 482 (10,597)
19,920 (12,767) 7,153 11,876 19,029
19,920 (13,772) 6,148 11,876 18,024 1,005 1,005
- - -
14,151 49% 20,388 43% 11,645 29% 15,026 51% 27,419 57% 29,056 71% 29,177 100% 47,807 100% 40,701 100%
70 100 101 417 478 403
13,447 51% 15,917 55% 16,917 56% 4,100 16% 4,100 14% 4,100 14%
357 1% 357 1% 357 1% 714 3% 714 2% 714 2%
7,618 29% 8,090 28% 8,090 27% 26,236 100% 29,178 100% 30,178 100%
IFFDC Pratapgarh Coordination Office, Rajasthan.- 940 -
IFFDC Rajasthan - Pratapgarh Self Help Group - Moti Kheri 3 - Bheru Baoji BS

Table AN9.2.3
Item
MembershipSavings
IndividualGroupTotal
LoansOutstanding
Balance
IncomeInterest (includes bank Int)PenaltySubtotalGrants
ExpenditureTotal
Net Income less Expenditure
Cash (in hand and bank)
Cash as per RecordsShare & FDRDifference
Loan Portfolio (Cumulated)OutstandingRepaidTotalLoan NoAverage Loan Size (Rs)
Loan Types:ConsumptionHealthEducationMicro EnterpriseProductionTotal
Source:\1 Overdue loans reported:
IFFDC Rajasthan - Pratapgarh Self Help Group - Moti Kheri 4 - Bajrang BS
Balance Movement Balance Movement Balance(as at) (in year) (as at) (in year) (as at)
Apr-02 Apr-02 Mar-03 Mar-03 Mar-04Mar-03 Mar-04
11 (1) 10 1 11
6,868 1,327 8,195 940 9,135 3,919 754 4,673 1,186 5,859
10,787 2,081 12,868 2,126 14,994
2,560 4,430 6,990 (1,435) 5,555
8,227 (2,349) 5,878 3,561 9,439
341 100 441 - 441 106 - 106 - 106 447 100 547 - 547
- - - -
539 1,065 1,604 1,200 2,804 (92) (965) (1,057) (1,200) (2,257)
8,135 (3,314) 4,821 2,361 7,182
8,135 (3,314) 4,821 2,361 7,182
- - -
2,560 31% 6,990 51% 5,555 39% 5,820 69% 6,850 49% 8,835 61%8,380 100% 13,840 100% 14,390 100%
81 89 94 103 156 153
- 0% 2,375 18% 2,375 18%- 0% 200 2% 200 2%- 0% - 0% - 0%- 0% - 0% - 0%
7,870 100% 10,265 80% 10,265 80% 7,870 100% 12,840 100% 12,840 100%
IFFDC Pratapgarh Coordination Office, Rajasthan.
IFFDC Rajasthan - Pratapgarh Self Help Group - Moti Kheri 4 - Bajrang BS

Table AN9.2.3
Item
MembershipSavings
IndividualGroupTotal
LoansOutstanding
Balance
IncomeInterest (includes bank Int)PenaltySubtotalGrants
ExpenditureTotal
Net Income less Expenditure
Cash (in hand and bank)
Cash as per RecordsShare & FDRDifference
Loan Portfolio (Cumulated)OutstandingRepaidTotalLoan NoAverage Loan Size (Rs)
Loan Types:ConsumptionHealthEducationMicro EnterpriseProductionTotal
Source:\1 Overdue loans reported:
IFFDC Rajasthan - Pratapgarh Self Help Group - Moti Kheri 5 - Kalka Mata BS
Balance Movement Balance Movement Balance(as at) (in year) (as at) (in year) (as at)
Apr-02 Apr-02 Mar-03 Mar-03 Mar-04Mar-03 Mar-04
20 (7) 13 (3) 10
12,155 (5,608) 6,547 (286) 6,261 6,007 (4,670) 1,337 872 2,209
18,162 (10,278) 7,884 586 8,470
8,510 (4,990) 3,520 (400) 3,120
9,652 (5,288) 4,364 986 5,350
478 (164) 314 376 690 160 (160) - - 638 (324) 314 376 690
- - -
1,406 (1,406) - 318 318 (768) 1,082 314 58 372
8,884 (4,206) 4,678 1,044 5,722
8,884 (4,206) 4,678 39 4,717 1,005
- - -
8,510 62% 3,520 67% 3,120 52%5,200 38% 1,750 33% 2,850 48%
13,710 100% 5,270 100% 5,970 100% 55 35 37
249 151 161
5,228 46% 2,060 60% 2,560 62%2,006 18% 340 10% 340 8%
137 1% 20 1% 20 0%275 2% 40 1% 40 1%
3,774 33% 990 29% 1,190 29% 11,420 100% 3,450 100% 4,150 100%
IFFDC Pratapgarh Coordination Office, Rajasthan.
IFFDC Rajasthan - Pratapgarh Self Help Group - Moti Kheri 5 - Kalka Mata BS

Table AN9.2.3
Item
MembershipSavings
IndividualGroupTotal
LoansOutstanding
Balance
IncomeInterest (includes bank Int)PenaltySubtotalGrants
ExpenditureTotal
Net Income less Expenditure
Cash (in hand and bank)
Cash as per RecordsShare & FDRDifference
Loan Portfolio (Cumulated)OutstandingRepaidTotalLoan NoAverage Loan Size (Rs)
Loan Types:ConsumptionHealthEducationMicro EnterpriseProductionTotal
Source:\1 Overdue loans reported:
IFFDC Rajasthan - Pratapgarh Self Help Group - Moti Kheri 6 - Amba Mata BS
Balance Movement Balance Movement Balance(as at) (in year) (as at) (in year) (as at)
Apr-02 Apr-02 Mar-03 Mar-03 Mar-04Mar-03 Mar-04
14 - 14 (1) 13
6,315 2,107 8,422 364 8,786 1,262 591 1,853 5,911 7,764 7,577 2,698 10,275 6,275 16,550
2,710 4,960 7,670 (4,475) 3,195
4,867 (2,262) 2,605 10,750 13,355
322 128 450 - 450 - - - - -
322 128 450 - 450 - - -
917 410 1,327 361 1,688 (595) (282) (877) (361) (1,238)
4,272 (2,544) 1,728 10,389 12,117
4,272 (2,544) 1,728 10,389 12,117
- - -
2,710 43% 7,670 62% 3,195 25%3,635 57% 4,785 38% 9,410 75% 6,345 100% 12,455 100% 12,605 100%
30 63 66 212 198 191
1,400 30% 2,870 29% 3,170 31% 355 8% 1,625 16% 1,625 16%
- 0% - 0% - 0%- 0% - 0% - 0%
2,860 62% 5,420 55% 5,420 53% 4,615 100% 9,915 100% 10,215 100%
IFFDC Pratapgarh Coordination Office, Rajasthan.
IFFDC Rajasthan - Pratapgarh Self Help Group - Moti Kheri 6 - Amba Mata BS

Table AN9.2.3
Item
MembershipSavings
IndividualGroupTotal
LoansOutstanding
Balance
IncomeInterest (includes bank Int)PenaltySubtotalGrants
ExpenditureTotal
Net Income less Expenditure
Cash (in hand and bank)
Cash as per RecordsShare & FDRDifference
Loan Portfolio (Cumulated)OutstandingRepaidTotalLoan NoAverage Loan Size (Rs)
Loan Types:ConsumptionHealthEducationMicro EnterpriseProductionTotal
Source:\1 Overdue loans reported:
IFFDC Rajasthan - Pratapgarh Self Help Group - Moti Kheri 7 - Gangotri BS
Balance Movement Balance Movement Balance(as at) (in year) (as at) (in year) (as at)
Apr-02 Apr-02 Mar-03 Mar-03 Mar-04Mar-03 Mar-04
14 - 14 - 14
10,438 2,731 13,169 3,476 16,645 5,949 527 6,476 3,224 9,700
16,387 3,258 19,645 6,700 26,345
5,942 9,398 15,340 (10,890) 4,450
10,445 (6,140) 4,305 17,590 21,895
867 167 1,034 1,228 2,262 75 - 75 - 75
942 167 1,109 1,228 2,337 - - -
1,388 (347) 1,041 - 1,041 (446) 514 68 1,228 1,296
9,999 (5,626) 4,373 18,818 23,191
9,999 (5,626) 4,373 16,438 20,811 2,380
- - -
5,942 45% 15,340 68% 4,450 15%7,258 55% 7,320 32% 25,620 85%
13,200 100% 22,660 100% 30,070 100% 29 45 48
455 504 626
3,500 43% 5,260 25% 10,360 37% 1,993 24% 1,993 9% 1,993 7%
210 3% 210 1% 210 1% 420 5% 420 2% 420 2%
2,098 26% 13,257 63% 14,757 53% 8,221 100% 21,140 100% 27,740 100%
IFFDC Pratapgarh Coordination Office, Rajasthan. 3,100 - -
IFFDC Rajasthan - Pratapgarh Self Help Group - Moti Kheri 7 - Gangotri BS

Table AN9.2.4 IFFDC Rajasthan - Pratapgarh Self Help Groups - Somawaton Ka Khera - Summary
Item Balance Movement Balance Movement Balance(as at) (year) (as at) (year) (as at)
Apr-02 Apr-02 Mar-03 Mar-03 Mar-04Mar-03 Mar-04
Membership 33 - 33 12 45 Savings
Individual 15,906 10,966 26,872 17,378 44,250 Group 4,444 4,027 8,471 9,790 18,261 Total 20,350 14,993 35,343 27,168 62,511
LoansOutstanding 9,660 19,415 29,075 18,950 48,025
Balance 10,690 (4,422) 6,268 8,218 14,486
IncomeInterest 1,087 2,318 3,405 4,988 8,392 Penalty 196 60 256 5 261 Subtotal 1,283 2,378 3,661 4,993 8,653 Grants - 3,595 2,482
ExpenditureTotal - 1,820 1,820 2,892 4,712
Net Income less Expenditure 1,283 4,153 5,436 988 6,423
Cash (in hand and bank) 11,973 (270) 11,704 9,206 20,909
Cash as per Records 11,973 4,153 11,704 988 20,504 Share & FDR 405 Difference - - - - -
Loan Portfolio (Cumulated)Outstanding 9,660 19,415 29,075 18,950 48,025 Repaid 10,250 25,465 35,715 41,250 76,965 Total 19,910 44,880 64,790 60,200 124,990 Loan No 85 57 142 83 225 Average Loan Size (Rs) 234 222 456 99 556
Loan Types:Consumption 1,675 29% 15,674 31% 63,848 59%Health 590 10% 790 2% 1,760 2%Education 200 3% 1,950 4% 1,200 1%Micro Enterprise - 0% 300 1% - 0%Production 3,250 57% 32,145 63% 41,880 39%Total 5,715 100% 50,859 100% 108,688 100%
Source: IFFDC Pratapgarh Coordination Office, Rajasthan.\1 Overdue loans reported:
IFFDC Rajasthan - Pratapgarh Self Help Groups - Somawaton Ka Khera - Summary

Table AN9.2.4
Item
MembershipSavings
IndividualGroupTotal
LoansOutstanding
Balance
IncomeInterestPenaltySubtotalGrants
ExpenditureTotal
Net Income less Expenditure
Cash (in hand and bank)
Cash as per RecordsShare & FDRDifference
Loan Portfolio (Cumulated)OutstandingRepaidTotalLoan NoAverage Loan Size (Rs)
Loan Types:ConsumptionHealthEducationMicro EnterpriseProductionTotal
Source:\1 Overdue loans reported:
IFFDC Rajasthan - Pratapgarh Self Help Group - Somawaton Ka Khera 1 - Devnarayan BS
Balance Movement Balance Movement Balance(as at) (year) (as at) (year) (as at)
Apr-02 Apr-02 Mar-03 Mar-03 Mar-04Mar-03 Mar-04
15 - 15 15
7,494 5,647 13,141 6,053 19,194 2,226 2,273 4,499 4,624 9,123 9,720 7,920 17,640 10,677 28,317
6,205 8,870 15,075 3,950 19,025
3,515 (950) 2,565 6,727 9,292
556 1,319 1,875 1,382 3,257 105 45 150 - 150 661 1,364 2,025 1,382 3,407
- 3,595 2,482
- 1,820 1,820 2,892 4,712 661 3,139 3,800 (2,623) 1,177
4,176 2,189 6,365 4,104 10,469
4,176 2,189 6,365 3,104 9,469 1,000
- - - - -
6,205 58% 15,075 45% 19,025 42% 4,460 42% 18,320 55% 26,520 58%
10,665 100% 33,395 100% 45,545 100% 39 62 101
273 539 451
925 51% 11,274 42% 30,074 57%- 0% - 0% 855 2%- 0% 500 2% 600 1%- 0% - 0% - 0%
900 49% 14,890 56% 20,890 40% 1,825 100% 26,664 100% 52,419 100%
IFFDC Pratapgarh Coordination Office, Rajasthan.- 5,695 -
IFFDC Rajasthan - Pratapgarh Self Help Group - Somawaton Ka Khera 1 - Devnarayan BS

Table AN9.2.4
Item
MembershipSavings
IndividualGroupTotal
LoansOutstanding
Balance
IncomeInterestPenaltySubtotalGrants
ExpenditureTotal
Net Income less Expenditure
Cash (in hand and bank)
Cash as per RecordsShare & FDRDifference
Loan Portfolio (Cumulated)OutstandingRepaidTotalLoan NoAverage Loan Size (Rs)
Loan Types:ConsumptionHealthEducationMicro EnterpriseProductionTotal
Source:\1 Overdue loans reported:
IFFDC Rajasthan - Pratapgarh Self Help Group - Somawaton Ka Khera 2 - Parwati BS
Balance Movement Balance Movement Balance(as at) (year) (as at) (year) (as at)
Apr-02 Apr-02 Mar-03 Mar-03 Mar-04Mar-03 Mar-04
18 18 (3) 15
8,412 5,319 13,731 5,320 19,051 2,218 1,754 3,972 4,439 8,411
10,630 7,073 17,703 9,759 27,462
3,455 10,545 14,000 10,000 24,000
7,175 (3,472) 3,703 (241) 3,462
531 999 1,530 3,392 4,921 91 15 106 - 106
622 1,014 1,636 3,392 5,027 - - - - -
- - - - - 622 1,014 1,636 3,392 5,027
7,797 (2,459) 5,339 3,151 8,489
7,797 (2,459) 5,339 3,746 9,084 (595)
- - - - -
3,455 37% 14,000 45% 24,000 39% 5,790 63% 17,395 55% 46,315 74% 9,245 100% 31,395 100% 62,300 100%
46 80 101 201 392 617
750 19% 4,400 18% 30,074 57% 590 15% 790 3% 855 2% 200 5% 1,450 6% 600 1%
- 0% 300 1% - 0% 2,350 60% 17,255 71% 20,890 40% 3,890 100% 24,195 100% 52,419 100%
IFFDC Pratapgarh Coordination Office, Rajasthan.- 5,500 -
IFFDC Rajasthan - Pratapgarh Self Help Group - Somawaton Ka Khera 2 - Parwati BS

Table AN9.2.4
Item
MembershipSavings
IndividualGroupTotal
LoansOutstanding
Balance
IncomeInterestPenaltySubtotalGrants
ExpenditureTotal
Net Income less Expenditure
Cash (in hand and bank)
Cash as per RecordsShare & FDRDifference
Loan Portfolio (Cumulated)OutstandingRepaidTotalLoan NoAverage Loan Size (Rs)
Loan Types:ConsumptionHealthEducationMicro EnterpriseProductionTotal
Source:\1 Overdue loans reported:
IFFDC Rajasthan - Pratapgarh Self Help Group - Somawaton Ka Khera 3 - Shri Ganesh BS
Balance Movement Balance Movement Balance(as at) (year) (as at) (year) (as at)
Apr-02 Apr-02 Mar-03 Mar-03 Mar-04Mar-03 Mar-04
- - - 15 15
- - - 6,005 6,005 - - - 727 727 - - - 6,732 6,732
- - - 5,000 5,000
- - - 1,732 1,732
- - - 214 214 - - - 5 5 - - - 219 219 - - -
- - - - - - - - 219 219
- - - 1,951 1,951
- - - 1,951 1,951
- - -
- - 5,000 55%- - 4,130 45%- - 9,130 100%- - 23
#DIV/0! #DIV/0! 397
- - 3,700 96%- - 50 1%- - - 0%- - - 0%- - 100 3%- - 3,850 100%
IFFDC Pratapgarh Coordination Office, Rajasthan.- 940 -
FFDC Rajasthan - Pratapgarh Self Help Group - Somawaton Ka Khera 3 - Shri Ganesh BS
DFID / India: Western India Rainfed Farming Project / Final Report / October 2005
Income Generating Activities
AN10

Income Generating Activities
AN10-1
DFID / India: Western India Rainfed Farming Project / Final Report / October 2005
Income Generating Activities
AN10
Income Generating Activities
Income generating activities (IGAs) are supported under the village organisation and development intervention. As part of the SHG start-up process, funds, in the form of seed capital, are made available by the implementing agencies to SHGs for onlending as small loans (up to Rs 5,000) to individual members for identified IGAs. In addition, funds are also made available to groups of SHG members for larger IGAs projects. As part of the cost benefit analysis field verification programme, field data was collected to assess the financial viability of both small individual and group IGAs. One private flourmill operator was interviewed.
Financial Analysis
Methodology
Field data for 12 representative IGAs was tabulated in the form of a 12-month cash flow forecast. Details of individual IGAs are given in Annex 10 and key financial indicators summarised in Table A10.1. Capital investment costs are identified together with a financing plan indicating equity and loan contributions to finance the capital investment. Sales income and expenditure, often extracted from records maintained by the individual / group, was recorded on a monthly basis to show a 12 month seasonal cash flow before finance charges. This incremental cash flow, inclusive of the capital investment and adjusted for any residual asset value in month 12, formed the basis for calculating the financial internal rate of return (FIRR).
Financial charges, both monthly interest and monthly principal repayment costs were less clearly defined. Monthly, interest charges agreed by the SHG membership varied considerably as did principal repayment with both grace periods and the number of repayment periods, varying widely. For the purpose of evaluating all IGAs on a common basis, it has been assumed that interest would be charged on a monthly basis at 1.5 percent per month on the outstanding loan balance and that realistic principal repayments would be made only during those months when sufficient cash flow was being generated.
The funding mechanism for payments advanced for group IGAs are different. Funds are first passed to the group SHG bank account and then withdrawn to make the purchase of the asset, namely the diesel engine, irrigation pump and pipes, in the case of the two-recorded models. As the asset belongs to the group, a hire charge is made to cover the direct operating costs of the equipment and the remuneration of the jankar responsible for the asset. Generally, no financing charge is made to cover interest foregone or a principle payment as a deposit towards replacement of the asset at the end of its useful life. To make a comparison with the individual IGA, financing charges are calculated in a similar manor.

Income Generating Activities
AN10-2
DFID / India: Western India Rainfed Farming Project / Final Report / October 2005
Financial Results
Financing Plan
Of the nine individual IGAs analysed, all had loans within the prescribed limit of Rs 5,000. The group SHGs advances for irrigation equipment and the private individual, were considerably larger at Rs 20 to 25,000. The loan amount accounted for between 25 and 50 percent of the asset value.
Cash Flow (Before Financing)
The individual and group IGAs had a cash income before financing, (a measure of the potential cash income after the loan has been repaid), that ranged from a low of Rs 1,240 to a high of Rs 9,330. The financial rate of return (FIRR) on this cash flow adjusted for the capital investment costs (in period zero) and any asset residual value (in period 12), ranged from an equivalent annual rate of zero percent (group irrigation pumps) to 18 percent (the village grocery shop) and should be assessed against the average SHG rate for these IGA loans of 1.5 percent per month or 18 percent per annum.
Financing Charges and Net Cash Flow
For the individual IGAs, finance charges range from a low of Rs 646 to a high of Rs 3,231 and between Rs 7 to 8,000 for the group and private models. The resulting net cash flows range from a low of Rs 600 to a high of Rs 3,238 but negative in the case of the group irrigation pump models. These incremental results should be compared with the average annual household crop net margin of Rs 5,463 (Annex 11 Table A11.1) and livestock net margin of Rs 2,006 (Annex 11 Table A11.2). The exception being the private flour mill operation where the indicative annual income is estimated at Rs 20,000.
Returns to Labour
Average monthly family labour requirements were also identified during the field survey. The resulting average seasonal return per person day generated by the IGA ranges from a low of Rs 10 to 69, cash only, or Rs 41 282 if the residual value the asset is included. These returns can be compared with reported daily rural wage rates in the project area, varying from Rs 40 to 50 per day in the khalif season and Rs 20 to 30 in the rabi season. Average seasonal migration labour wage rates are the subject of an ongoing survey in the project area (Gujarat).
Lessons Learnt
A number of conclusions are drawn from the analysis of IGAs:
• a selected number of individual IGA are financially viable and provide a useful addition to household income. Such opportunities could not be developed without access to loan finance at reasonable interest rates and with a flexible principal repayment schedule;

Income Generating Activities
AN10-3
DFID / India: Western India Rainfed Farming Project / Final Report / October 2005
• concern was expressed about service orientated IGAs which had failed due to an over supply in the local village with no realistic outlet to neighbouring markets (sewing machines and village stores were sited as examples);
• livestock rearing (buffalo and goats) are less dependent on the immediate village market and might therefore be considered more attractive. However, the activity is dependent on local veterinary services being readily available;
• some poultry IGAs had failed due to the high mortality of young (up to one week) chicks. It is considered unreasonable to introduce activities without providing the necessary technical and veterinary support;
• information provided by the resource team confirms that the number of successful individual IGAs, per village, are limited;
• it is recognised that the group irrigation (and flour mill) activities provide an essential service within the village. However, based on the financial analysis undertaken, the financial costs required to service the loan, are not being covered by the hire costs recovered. This suggests that, either the charge rate per application or the number of application during the short rabi season, need to be increased, and
• group IGA should be supported by a business plan identifying both expenditure and financing costs and therefore the resulting levels of income from hire charges necessary to achieve financial viability.

Income Generating Activities
AN10-4
DFID / India: Western Rainfed Farming Project / Cost Benefit Analysis / March 2005
Table A10.1: Income Generating Activities: Summary of Key Financial Indicators
Source: Cost Benefit Analysis (CBA) Study Estimates January 2005 N/A = Not analysed, Jankar allowance covered under expenditure.
IGA Activity Status Financing Plan Cash Flow (before finance) Finance Net Return to Labour FIRR Equity Loan Total Income Expend Cash Charge Cash P/Days Return Rs’000 Rs’000 Rs’000 Rs’000 No/Yr Rs/day % Service Electric Motor
Repairs Individual 4.0 3.0 7.0 12.7 6.8 5.9 1.7 4.2 60 70 8%
Grocery Shop Individual 1.5 3.0 4.5 23.3 14.0 9.3 3.1 6.2 120 52 17% Irrigation Pump
(A) Individual 12.0 4.0 16.0 9.0 3.0 6.0 2.5 3.5 50 70 2%
Sewing Machine Individual 0.7 2.5 3.2 8.0 1.3 6.7 2.7 4.0 80 50 18%
Tailoring Individual 1.2 2.0 3.2 4.1 1.1 3.0 1.3 1.7 69 25 8% Vegetable
Marketing Individual 1.5 3.5 5.0 18.7 14.6 4.1 1.6 2.5 108 23 8%
Livestock Production
Buffalo Rearing Individual 1.0 5.0 6.0 10.8 6.4 4.4 3.2 1.2 60 20 6% Goat Rearing Individual 1.0 1.0 2.0 1.4 0.1 1.3 0.6 0.7 60 12 9% Poultry
Production Individual 0.1 0.9 1.0 6.5 2.2 4.3 1.1 3.2 60 53 13%
Crop Production Irrigation Pump
(B) Group 2.0 20.0 22.0 9.3 5.0 4.3 7.3 ( 3.0) N/A N/A 0%
Irrigation Pump (C)
Group 3.0 25.0 28.0 6.0 2.0 4.0 7.1 ( 3.1) N/A N/A 0%
Service Flour Mill Private 16.5 20.0 36.5 127.2 98.2 29.0 8.2 20.8 240 87 7%

WIRFP - Phase II - Cost Benefit Analysis Study
Tables AN10.0: Income Generating Activities
Table AN10.1 Income Generating Activity: Summary of Key Financial Indicators.
Table AN10.2 Income Generating Activity: Electric Motor Repairs - SHG Individual (M Pradesh, Village Chenpura).Table AN10.3 Income Generating Activity: Grocery Store - SHG Individual (M Pradesh, Village Chenpura).Table AN10.4 Income Generating Activity: Irrigation Pump A - SHG Individual (Rajastan, Village S Ka Khedi).Table AN10.5 Income Generating Activity: Sewing Machine - SHG Individual (M Pradesh, Village Chenpura).Table AN10.6 Income Generating Activity: Tailoring - SHG Individual (Rajastan, Village Chhayan).Table AN10.7 Income Generating Activity: Vegetable Marketing - SHG Individual (M Pradesh, Village Kadwapada).
Table AN10.8 Income Generating Activity: Buffalo Rearing - SHG Individual (Rajastan, Village Chhayan).Table AN10.9 Income Generating Activity: Goat Rearing - SHG Individual (Rajastan, Village S Ka Khedi).Table AN10.10 Income Generating Activity: Poultry - SHG Individual (M Pradesh, Village Chenpura).
Table AN10.11 Income Generating Activity: Irrigation Pump B - SHG Group (Gujarat, Village Jadha).Table AN10.12 Income Generating Activity: Irrigation Pump C - SHG Group (M Pradesh, Village Kadwapada).Table AN10.13 Income Generating Activity: Flour Mill - Private (Gujarat, Village Jadha).

Table AN10.1 Income Generating Activity: Summary of Key Financial Indicators.
Income Generating Activity (IGA) IGA Status Net FIRREquity Loan Total Income Expenditure Cash Flow Interest Principal Total Cash Flow Days/year Cash Cash / Asset
(Rs'000) (Rs'000) (Rs'000) (Rs/Year) (Rs/Year) (Rs/Year) (Rs/Year) (Rs/Year) (Rs/Year) (Rs/Year) (No/Year) (Rs/P/day) (Rs/P/day) (%)
ServiceElectric Motor Repairs SHG - Individual 4,000 3,000 7,000 12,700 6,813 5,887 480 1,250 1,730 4,157 60 69 143 8%Grocery Shop SHG - Individual 1,500 3,000 4,500 23,345 14,015 9,330 378 2,700 3,078 6,252 120 52 85 17%Irrigation Pump (A) SHG - Individual 12,000 4,000 16,000 9,013 3,063 5,950 436 2,000 2,436 3,514 50 70 282 2%Sewing Machine SHG - Individual 700 2,500 3,200 7,980 1,245 6,735 244 2,500 2,744 3,991 80 50 82 18%Tailoring SHG - Individual 1,200 2,000 3,200 4,118 1,080 3,038 293 1,000 1,293 1,745 69 25 49 8%Vegetable Marketing SHG - Individual 1,500 3,500 5,000 18,720 14,570 4,150 481 1,167 1,648 2,502 108 23 41 8%
Livestock ProductionBuffalo Rearing SHG - Individual 1,000 5,000 6,000 10,795 6,400 4,395 731 2,500 3,231 1,164 60 19 57 6%Goat Rearing SHG - Individual 1,000 1,000 2,000 1,350 110 1,240 146 500 646 594 60 10 72 9%Poultry Production SHG - Individual 100 900 1,000 6,500 2,200 4,300 162 900 1,062 3,238 60 54 65 13%
Crop ProductionIrrigation Pump (B) SHG - Group 2,000 20,000 22,000 9,265 4,988 4,277 3,090 4,240 7,330 (3,053) N/A N/A N/A 0%Irrigation Pump (C) SHG - Group 3,000 25,000 28,000 5,992 2,032 3,961 2,100 5,000 7,100 (3,140) N/A N/A N/A 0%
ServiceFlour Mill Private 16,500 20,000 36,500 127,200 98,232 28,968 1,542 6,667 8,208 20,760 240 86 182 7%
Source: Cost Benefit Analysis (CBA) Study Estimates Jan 2005.FIRR = Financial Internal Rate of Return.
Financing Plan Cash Flow (before financing) Financing Charges Return to Labour (person/days)
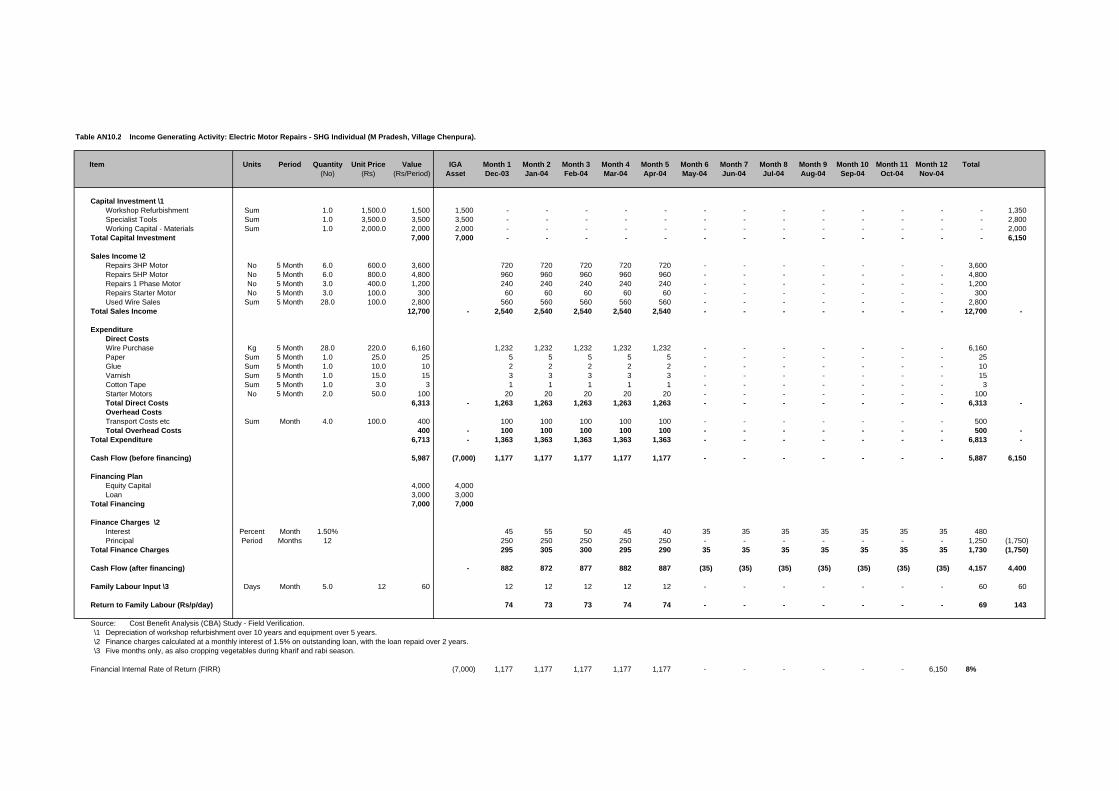
Table AN10.2 Income Generating Activity: Electric Motor Repairs - SHG Individual (M Pradesh, Village Chenpura).
Item Units Period Quantity Unit Price Value IGA Month 1 Month 2 Month 3 Month 4 Month 5 Month 6 Month 7 Month 8 Month 9 Month 10 Month 11 Month 12 Total(No) (Rs) (Rs/Period) Asset Dec-03 Jan-04 Feb-04 Mar-04 Apr-04 May-04 Jun-04 Jul-04 Aug-04 Sep-04 Oct-04 Nov-04
Capital Investment \1Workshop Refurbishment Sum 1.0 1,500.0 1,500 1,500 - - - - - - - - - - - - - 1,350 Specialist Tools Sum 1.0 3,500.0 3,500 3,500 - - - - - - - - - - - - - 2,800 Working Capital - Materials Sum 1.0 2,000.0 2,000 2,000 - - - - - - - - - - - - - 2,000
Total Capital Investment 7,000 7,000 - - - - - - - - - - - - - 6,150
Sales Income \2Repairs 3HP Motor No 5 Month 6.0 600.0 3,600 720 720 720 720 720 - - - - - - - 3,600 Repairs 5HP Motor No 5 Month 6.0 800.0 4,800 960 960 960 960 960 - - - - - - - 4,800 Repairs 1 Phase Motor No 5 Month 3.0 400.0 1,200 240 240 240 240 240 - - - - - - - 1,200 Repairs Starter Motor No 5 Month 3.0 100.0 300 60 60 60 60 60 - - - - - - - 300 Used Wire Sales Sum 5 Month 28.0 100.0 2,800 560 560 560 560 560 - - - - - - - 2,800
Total Sales Income 12,700 - 2,540 2,540 2,540 2,540 2,540 - - - - - - - 12,700 -
ExpenditureDirect CostsWire Purchase Kg 5 Month 28.0 220.0 6,160 1,232 1,232 1,232 1,232 1,232 - - - - - - - 6,160 Paper Sum 5 Month 1.0 25.0 25 5 5 5 5 5 - - - - - - - 25 Glue Sum 5 Month 1.0 10.0 10 2 2 2 2 2 - - - - - - - 10 Varnish Sum 5 Month 1.0 15.0 15 3 3 3 3 3 - - - - - - - 15 Cotton Tape Sum 5 Month 1.0 3.0 3 1 1 1 1 1 - - - - - - - 3 Starter Motors No 5 Month 2.0 50.0 100 20 20 20 20 20 - - - - - - - 100 Total Direct Costs 6,313 - 1,263 1,263 1,263 1,263 1,263 - - - - - - - 6,313 - Overhead CostsTransport Costs etc Sum Month 4.0 100.0 400 100 100 100 100 100 - - - - - - - 500 Total Overhead Costs 400 - 100 100 100 100 100 - - - - - - - 500 -
Total Expenditure 6,713 - 1,363 1,363 1,363 1,363 1,363 - - - - - - - 6,813 -
Cash Flow (before financing) 5,987 (7,000) 1,177 1,177 1,177 1,177 1,177 - - - - - - - 5,887 6,150
Financing PlanEquity Capital 4,000 4,000 Loan 3,000 3,000
Total Financing 7,000 7,000
Finance Charges \2Interest Percent Month 1.50% 45 55 50 45 40 35 35 35 35 35 35 35 480 Principal Period Months 12 250 250 250 250 250 - - - - - - - 1,250 (1,750)
Total Finance Charges 295 305 300 295 290 35 35 35 35 35 35 35 1,730 (1,750)
Cash Flow (after financing) - 882 872 877 882 887 (35) (35) (35) (35) (35) (35) (35) 4,157 4,400
Family Labour Input \3 Days Month 5.0 12 60 12 12 12 12 12 - - - - - - - 60 60
Return to Family Labour (Rs/p/day) 74 73 73 74 74 - - - - - - - 69 143
Source: Cost Benefit Analysis (CBA) Study - Field Verification.\1 Depreciation of workshop refurbishment over 10 years and equipment over 5 years.\2 Finance charges calculated at a monthly interest of 1.5% on outstanding loan, with the loan repaid over 2 years.\3 Five months only, as also cropping vegetables during kharif and rabi season.
Financial Internal Rate of Return (FIRR) (7,000) 1,177 1,177 1,177 1,177 1,177 - - - - - - 6,150 8%

Table AN10.3 Income Generating Activity: Grocery Store - SHG Individual (M Pradesh, Village Chenpura).
Item Units Period Quantity Unit Price Value IGA Month 1 Month 2 Month 3 Month 4 Month 5 Month 6 Month 7 Month 8 Month 9 Month 10 Month 11 Month 12 Total IGA(No) (Rs) (Rs/Period) Assets Apr-02 May-02 Jun-02 Jul-02 Aug-02 Sep-02 Oct-02 Nov-02 Dec-02 Jan-03 Feb-03 Mar-03 Assets
Capital Investment \1Grocery Shop Refurbishment Sum 1.0 2,000.0 2,000 2,000 1,800 Working Capital Sum 1.0 2,500.0 2,500 2,500 2,500
Total Capital Investment 4,500 4,500 - - - - - - - - - - - - 4,300
Sales IncomeTakings per month \2 Sum Year 1.0 23,345.0 23,345 1,970 2,925 2,495 1,365 1,470 1,610 1,915 2,695 1,455 1,555 1,945 1,945 23,345
Total Sales Income 23,345 1,970 2,925 2,495 1,365 1,470 1,610 1,915 2,695 1,455 1,555 1,945 1,945 23,345
ExpenditureDirect CostsPurchase of goods Sum Year 1.0 13,535.0 13,535 1,170 1,925 1,595 465 970 910 1,200 1,600 900 800 1,000 1,000 13,535 Total Direct Costs 13,535 1,170 1,925 1,595 465 970 910 1,200 1,600 900 800 1,000 1,000 13,535
Overhead CostsTransport to town Trips Month 2.0 20.0 40 40 40 40 40 40 40 40 40 40 40 40 40 480 Total Overhead Costs 40 40 40 40 40 40 40 40 40 40 40 40 40 480
Total Expenditure 1,210 1,965 1,635 505 1,010 950 1,240 1,640 940 840 1,040 1,040 14,015
Cash Flow (before financing) (4,500) 760 960 860 860 460 660 675 1,055 515 715 905 905 9,330 4,300
Financing PlanEquity Capital 1,500 1,500 Loan 3,000 3,000
Total Finance 4,500 4,500
Finance Charges \3Interest Percent Month 1.50% 45 45 45 45 41 36 32 27 23 18 14 9 378 Principal \4 Periods Months 10.0 - - - 300 300 300 300 300 300 300 300 300 2,700 (300)
Total Financing Charges - 45 45 45 345 341 336 332 327 323 318 314 309 3,078 (300)
Cash Flow (after financing) - 715 915 815 515 120 324 344 728 193 397 592 596 6,252 4,000
Family Labour Input Day equiv Month 10.0 12 120 10 10 10 10 10 10 10 10 10 10 10 10 120 120
Return to Family Labour 72 92 82 52 12 32 34 73 19 40 59 60 52 85
Source: Cost Benefit Analysis (CBA) Study - Field Verification.\1 Depreciation of capital assets over ten years.\2 Based on recorded daily figures for ten months prepared by owners son.\3 Finance charges calculated at a monthly interest of 1.5% on outstanding loan, with the loan repaid over 1 year.\4 Verified in group pass book.
Financial Internal Rate of Return (FIRR) (4,500) 760 960 860 860 460 660 675 1,055 515 715 905 5,205 17%

Table AN10.4 Income Generating Activity: Irrigation Pump A - SHG Individual (Rajastan, Village S Ka Khedi).
Item Units Period Quantity Unit Price Value IGA Month 1 Month 2 Month 3 Month 4 Month 5 Month 6 Month 7 Month 8 Month 9 Month 10 Month 11 Month 12 Total IGA(No) (Rs) (Rs/Period) Assets Sep-03 Oct-03 Nov-03 Dec-03 Jan-04 Feb-04 Mar-04 Apr-04 May-04 Jun-04 Jul-04 Aug-04 Asset
Capital Investment \1Diesel Engine (Kasan 6.5 HP) No 1.0 13,000.0 13,000 13,000 10,400 Irrigation Pump No 1.0 1,500.0 1,500 1,500 1,200 Pipes Sum 1.0 1,500.0 1,500 1,500 1,000
Total Capital Investment 16,000 16,000 12,600
Sales Income \2October Hire Income Hours Month 141 25.0 3,525 - 3,525 - - - - - - - - - - 3,525 November Hire Income Hours Month 84 25.0 2,088 - - 2,088 - - - - - - - - - 2,088 December Hire Income Hours Month 60 25.0 1,488 - - - 1,488 - - - - - - - - 1,488 January Hire Income Hours Month 30 25.0 750 - - - - 750 - - - - - - - 750 February Hire Income Hours Month 47 25.0 1,163 - - - - - 1,163 - - - - - - 1,163
Total Sales Income 361 9,013 - 3,525 2,088 1,488 750 1,163 - - - - - - 9,013 -
ExpenditureDirect CostsFuel \3 - - - - - - - - - - - - - - - - - - Total Direct Costs - - - - - - - - - - - - - -
Overhead CostsOil Sum Month 5.0 200.0 1,000 - 200 200 200 200 200 - - - - - - 1,000 Spares and Repairs Sum Year 1.0 2,500.0 2,500 - 313 313 313 313 313 - - - - - 500 2,063 Total Overhead Costs 3,500 - 513 513 513 513 513 - - - - - 500 3,063 -
Total Expenditure 3,500 - 513 513 513 513 513 - - - - - 500 3,063 -
Cash Flow (before financing) 5,513 (16,000) - 3,013 1,575 975 238 650 - - - - - (500) 5,950 12,600
Financing PlanEquity Capital 12,000 12,000 Loan 4,000 4,000 Total Financing 16,000 16,000
Finance Charges \4Interest Percent Month 1.5% 60 59 52 45 39 32 26 25 25 25 24 24 436 Principal Period Months 10.0 400 - 400 400 400 400 400 - - - - - - 2,000 (2,000)
Total Financing Charges 60 459 452 445 439 432 26 25 25 25 24 24 2,436 (2,000)
Cash Flow (after financing) - (60) 2,553 1,123 530 (201) 218 (26) (25) (25) (25) (24) (524) 3,514 10,600
Family Labour Input Days Month 5.0 10 50 - 15 15 10 5 5 - - - - - - 50 50
Return to Family Labour - 170 75 53 (40) 44 - - - - - - 70 282
Source: Cost Benefit Analysis (CBA) Study - Field Verification.\1 Depreciation of reconditioned diesel engine and pump over five years and irrigation pipes over 3 years.\2 Field records show some 55 percent of hire usage within family.\3 Fuel costs paid by hirer (estimated at 1.4 litres per hour at Rs 28.50 / litre).\4 Repayment over 2 years, at five months per year (10 periods), interest charged at 1.5% per month on the oustanding loan balance.
Financial Internal Rate of Return (FIRR) (16,000) - 3,013 1,575 975 238 650 - - - - - 12,100 2%

Table AN10.5 Income Generating Activity: Sewing Machine - SHG Individual (M Pradesh, Village Chenpura).
Item Units Period Quantity Unit Price Value IGA Month 1 Month 2 Month 3 Month 4 Month 5 Month 6 Month 7 Month 8 Month 9 Month 10 Month 11 Month 12 Total IGA(No) (Rs) (Rs/Period) Assets Apr-03 May-03 Jun-03 Jul-03 Aug-03 Sep-03 Oct-03 Nov-03 Dec-03 Jan-04 Feb-04 Mar-04 Assets
Capital Investment \1Sewing Machine No - 1.0 3,000.0 3,000 3,000 2,400 Training Course No 1.0 200.0 200 200 160
Total Capital Investment 3,200 3,200 - - - - - - - - - - - - - 2,560
Sales IncomeSchool Uniform \2 Contract Month 1.0 1,980.0 1,980 - 1,980 - - - - - - - - - - 1,980 General Work Days Month 10.0 75.0 750 750 - - - - 750 750 750 750 750 750 750 6,000
Total Sales Income 2,730 750 1,980 - - - 750 750 750 750 750 750 750 7,980
ExpenditureDirect CostsMaterial \3 - - - - - - - - - - - - - - - - - - Contract Costs Sum Month 1.0 120.0 120 - 120 - - - - - - - - - - 120 Total Direct Costs 120 - 120 - - - - - - - - - - 120
Overhead CostsThread / Needles etc Sum Month 1.0 100.0 100 100 100 - - - 100 100 100 100 100 100 100 900 Repair and Maintenance Sum Month 9.0 25.0 225 25 25 - - - 25 25 25 25 25 25 25 225 Total Overhead Costs 100 125 125 - - - 125 125 125 125 125 125 125 1,125
Total Expenditure 220 125 245 - - - 125 125 125 125 125 125 125 1,245
Cash Flow (before financing) (3,200) 625 1,735 - - - 625 625 625 625 625 625 625 6,735 2,560
Financing PlanEquity Capital 700 700 Loan 2,500 2,500
Total Finance 3,200 3,200
Finance Charges \4Interest Percent Month 1.50% - 38 34 31 28 25 22 19 16 13 9 6 3 244 Principal Periods Months 12 - 208 208 208 208 208 208 208 208 208 208 208 208 2,500 -
Total Financing Charges - 246 243 240 236 233 230 227 224 221 218 215 211 2,744 -
Cash Flow (after financing) - 379 1,492 (240) (236) (233) 395 398 401 404 407 410 414 3,991 2,560
Family Labour Input Days Month 8.0 10 80 10 10 - - - 10 10 10 10 10 10 - 80 80
Return to Family Labour (Rs/P/day) 38 149 - - - 39 40 40 40 41 41 - 50 82
Source: Cost Benefit Analysis (CBA) Study - Field Verification.\1 Depreciation of capital assets over 5 years.\2 Contract 1 School Uniform Items Contract 90.0 22.0 1,980.0
Contract 2 School Uniform Items Contract 110.0 22.0 2,420.0 \3 Material provided by client.\4 Finance charges calculated at a monthly interest of 1.5% on outstanding loan, with the loan repaid over 1 year.
Financial Internal Rate of Return (FIRR) (3,200) 625 1,735 - - - 625 625 625 625 625 625 3,185 18%

Table AN10.6 Income Generating Activity: Tailoring - SHG Individual (Rajastan, Village Chhayan).
Item Units Period Quantity Unit Price Value IGA Month 1 Month 2 Month 3 Month 4 Month 5 Month 6 Month 7 Month 8 Month 9 Month 10 Month 11 Month 12 Total IGA(No) (Rs) (Rs/Period) Assets Jan-03 Feb-03 Mar-03 Apr-03 May-03 Jun-03 Jul-03 Aug-03 Sep-03 Oct-03 Nov-03 Dec-03 Asset
Capital Investment \1Refurbishment of Shop Sum 1.0 500.0 500 500 450 Sewing Machine (Rita) \2 No 1.0 2,000.0 2,000 2,000 1,600 Other Equipment Sum 1.0 700.0 700 700 560
Total Capital Investment 3,200 3,200 - - - - - - - - - - - - - 2,610
Sales Income \3Garment Cutting and Stitching Garments - 275 15.0 4,118 533 465 398 503 435 128 120 368 360 345 270 195 4,118
Total Sales Income 4,118 - 533 465 398 503 435 128 120 368 360 345 270 195 4,118
ExpenditureDirect CostsMaterial \4 - - - - - - - - - - - - - - - - - - Total Direct Costs - - - - - - - - - - - - - - -
Overhead CostsThread, needles etc Sum Month 12.0 75.0 900 75 75 75 75 75 75 75 75 75 75 75 75 900 Utilities Sum Month 12.0 15.0 180 15 15 15 15 15 15 15 15 15 15 15 15 180 Total Overhead Costs 1,080 - 90 90 90 90 90 90 90 90 90 90 90 90 1,080 -
Total Expenditure 1,080 - 90 90 90 90 90 90 90 90 90 90 90 90 1,080 -
Cash Flow (before financing) 3,038 (3,200) 443 375 308 413 345 38 30 278 270 255 180 105 3,038 2,610
Financing PlanEquity Capital 1,200 Loan 2,000 Total Financing 3,200
Finance Charges \5Interest Percent Month 1.50% 30 30 30 29 27 26 24 23 21 20 18 17 293 Principal Sum Month 20 100 2,000 - - 100 100 100 100 100 100 100 100 100 100 1,000 (1,000)
Total Finance Charges 30 30 130 129 127 126 124 123 121 120 118 117 1,293 (1,000)
Cash Flow (after financing) - 413 345 178 284 218 (88) (94) 155 149 136 62 (12) 1,745 1,610
Family Labour Input Days Month 5.7 - 69 9 8 7 8 7 2 2 6 6 6 5 3 69 69
Return to Family Labour (Rs/P/day) 46 45 27 34 30 (41) (47) 25 25 24 14 (4) 25 49
Source: Cost Benefit Analysis (CBA) Study - Field Verification.\1 Depreciation of shop refurbishment over 10 years and sewing machine and equipment over 5 years.\2 Machine provided as grant for handicapped person.\3 Based on recorded figures for 18 months.\4 Material provided by client.\5 Finance charges calculated at a monthly interest of 1.5% on outstanding loan, with the loan repaid over 20 months over 2 years.
Financial Internal Rate of Return (FIRR) (3,200) 443 375 308 413 345 38 30 278 270 255 180 2,715 8%

Table AN10.7 Income Generating Activity: Vegetable Marketing - SHG Individual (M Pradesh, Village Kadwapada).
Item Units Period Quantity Unit Price Value IGA Month 1 Month 2 Month 3 Month 4 Month 5 Month 6 Month 7 Month 8 Month 9 Month 10 Month 11 Month 12 Total IGA(No) (Rs) (Rs/Period) Asset Nov-03 Dec-03 Jan-04 Feb-04 Mar-04 Apr-04 May-04 Jun-04 Jul-04 Aug-04 Sep-04 Oct-04 Asset
Capital Investment \1Vegetable Cart No 1.0 2,000 2,000 2,000 1,600 Weight and Balance No 1.0 1,500 1,500 1,500 1,200 Working Capital 1.0 1,500 1,500 1,500 1,500
Total Capital Investment 5,000 5,000 4,300
Sales IncomeVegetable Sales Days Month 13.0 240 3,120 3,120 3,120 3,120 3,120 3,120 3,120 - - - - - - 18,720
Total Sales Income 3,120 - 3,120 3,120 3,120 3,120 3,120 3,120 - - - - - - 18,720
ExpenditureDirect CostsVegetable Purchases Days Month 13.0 160 2,080 2,080 2,080 2,080 2,080 2,080 2,080 - - - - - - 12,480 Municiple Market Fee Days Month 13.0 5 65 65 65 65 65 65 65 - - - - - - 390 Purchased Food Days Month 13.0 10 130 130 130 130 130 130 130 - - - - - - 780 Hired Labour Days Month 2.0 60 120 120 120 120 120 120 120 - - - - - - 720 Total Direct Costs 2,395 - 2,395 2,395 2,395 2,395 2,395 2,395 - - - - - - 14,370
Overhead CostsRepairs Sum Month 1.0 33 33 33 33 33 33 33 33 - - - - - - 200 Total Overhead Costs 33 - 33 33 33 33 33 33 - - - - - - 200
Total Expenditure 2,428 - 2,428 2,428 2,428 2,428 2,428 2,428 - - - - - - 14,570
Cash Flow (before financing) 692 (5,000) 692 692 692 692 692 692 - - - - - - 4,150 4,300
Financing PlanEquity Capital 1,500 1,500 Loan 3,500 3,500
Total Finance 5,000 5,000
Finance Charges \2Interest Percent Month 1.50% - 53 50 47 44 41 38 35 35 35 35 35 35 481 - Principal Periods Months 18.0 - 194 194 194 194 194 194 - - - - - - 1,167 (2,333)
Total Finance Charges - 247 244 241 238 235 232 35 35 35 35 35 35 1,648 (2,333)
Cash Flow (after financing) - 445 448 451 453 456 459 (35) (35) (35) (35) (35) (35) 2,502 1,967
Family Labour Input Days Month 18.0 6 108 - 18 18 18 18 18 18 - - - - - - 108 108
Return to Family Labour - 25 25 25 25 25 26 - - - - - - 23 41
Source: Cost Benefit Analysis (CBA) Study - Field Verification.\1 Depreciation of capital assets over 5 years.\2 Finance charges calculated at a monthly interest of 1.5% on outstanding loan, with the loan repaid over 3 years (6 months per year).
Financial Internal Rate of Return (FIRR) (5,000.0) 691.7 691.7 691.7 691.7 691.7 691.7 - - - - - 4,300.0 8%

Table AN10.8 Income Generating Activity: Buffalo Rearing - SHG Individual (Rajastan, Village Chhayan).
Item Units Period Quantity Unit Price Value L'stock Month 1 Month 2 Month 3 Month 4 Month 5 Month 6 Month 7 Month 8 Month 9 Month 10 Month 11 Month 12 Totals L'stock(No) (Rs) (Rs/Period) Asset Apr-03 May-03 Jun-03 Jul-03 Aug-03 Sep-03 Oct-03 Nov-03 Dec-03 Jan-04 Feb-04 Mar-04 Asset
Livestock Asset ValueFemale \1 head 1 6,000.0 6,000 6,000 - - - - - - - - - - - - 5,250 Youngstock (calf) head 1 650.0 650 - - 650 - - - - - - - - - - 650
Total Livestock Assets 6,650 6,000 - 650 - - - - - - - - - - 5,900
Sales IncomeMilk litres 7 month 945 11.0 10,395 - 1,299 1,299 1,299 1,299 1,299 1,299 1,299 1,299 - - - 10,395 Dung cart year 1 400.0 400 - - - - - - - - - - 400 - 400 Draught days year - - - - - - - - - - - - - - - - Transport days year - - - - - - - - - - - - - - - -
Total Sales Income 10,795 - - 1,299 1,299 1,299 1,299 1,299 1,299 1,299 1,299 - 400 - 10,795 -
ExpenditureDirect CostsFeeding Forage sum month 12.0 300.0 3,600 300 300 300 300 300 300 300 300 300 300 300 300 3,600 Feeding Concentrate sum month 8.0 420.0 3,360 280 280 280 280 280 280 280 280 - - - - 2,240 Vet and Med sum year 2.0 50.0 100 - 50 - - - - - 50 - - - - 100 Other (grazing) sum month 12.0 30.0 360 30 30 30 30 30 30 30 30 30 30 30 30 360 Total Direct Costs 7,420 - 610 660 610 610 610 610 610 660 330 330 330 330 6,300 -
Overhead CostsBuilding / Equipment Repairs sum year 1.0 100.0 100 - 100 - - - - - - - - - - 100 Total Overhead Costs 100 - - 100 - - - - - - - - - - 100 -
Total Expenditure 7,520 - 610 760 610 610 610 610 610 660 330 330 330 330 6,400 -
Cash Flow (before finance) (6,000) (610) 539 689 689 689 689 689 639 969 (330) 70 (330) 4,395 5,900
Financing PlanEquity Capital 1,000 Loan 5,000
Total Financing 6,000
Finance Charges \5Interest Percent month 1.50% 75 75 75 71 68 64 60 56 53 49 45 41 731 Principal Periods months 20.0 250.0 5,000 - - 250 250 250 250 250 250 250 250 250 250 2,500 (2,500)
Total Finance Charges 75 75 325 321 318 314 310 306 303 299 295 291 3,231 (2,500)
Cash Flow (after financing) (685) 464 364 368 372 376 379 333 667 (629) (225) (621) 1,164 3,400
Family Labour Input Days Month 12.0 5 60 5 5 5 5 5 5 5 5 5 5 5 5 60 60
Return to Family Labour (137) 93 73 74 74 75 76 67 133 (126) (45) (124) 19 57
Source: Cost Benefit Analysis (CBA) Study - Field Verification.\1 In calf purchase price of adult female, with life expectancy estimated at eight years.\2 Finance charges calculated at a monthly interest of 1.5% on outstanding loan, with the loan repaid over 20 months over 2 years.
Financial Internal Rate of Return (FIRR) (6,000) (610) 539 689 689 689 689 689 639 969 (330) 70 5,570 6%

Table AN10.9 Income Generating Activity: Goat Rearing - SHG Individual (Rajastan, Village S Ka Khedi).
Item Units Period Quantity Unit Price Value L'stock Month 1 Month 2 Month 3 Month 4 Month 5 Month 6 Month 7 Month 8 Month 9 Month 10 Month 11 Month 12 Totals L'stock(No) (Rs) (Rs/Period) Assets Oct-02 Nov-02 Dec-02 Jan-03 Feb-03 Mar-03 Apr-03 May-03 Jun-03 Jul-03 Aug-03 Sep-03 Assets
Livestock Asset Value Opening ClosingFemale (pregnant) head 2 1,000.0 2,000 2,000 - - - - - - - - - - - - 3,200 Youngstock (kid) head 4 150.0 600 - - - 300 - - - - - 300 - - - 600
Total Livestock Assets 2,600 2,000 - - 300 - - - - - 300 - - - 3,800
Sales IncomeMilk litres year 150 10.0 1,500 - - 150 150 150 150 150 - 150 150 150 150 1,350 Dung sum year - - - - - - - - - - - - - - - - Sales no year 1 - - - - - - - - - - - - - - Other - - - - - - - - - - - - - - - - - -
Total Sales Income 1,500 - - 150 150 150 150 150 - 150 150 150 150 1,350
ExpenditureDirect Costs
Feeding kg 4 month 7.5 5.0 38 - - - - 9 9 9 9 - - 3 3 44 Vet and Med sum year 1.0 36.0 36 - - 18 - - - - - 18 - - - 36
Total Direct Costs 74 - - 18 - 9 9 9 9 18 - 3 3 80
Overhead CostsRepairs to shed sum year 1.0 30.0 30 - - - - - - - 30 - - - - 30
Total Overhead Costs 30 - - - - - - - 30 - - - - 30 Total Expenditure 104 - - 18 - 9 9 9 39 18 - 3 3 110
Cash Flow (before financing) (2,000) - - 132 150 141 141 141 (39) 132 150 147 147 1,240 3,800 (cumulated) 1,397 (2,000) - - 132 282 423 563 704 665 797 947 1,093 1,240
Financing PlanEquity Capital 1,000 1,000 Loan 1,000 1,000
Total Financing 2,000 2,000
Finance Charges \2Interest Percent month 1.50% 15 15 15 14 14 13 12 11 11 10 9 8 146 Principal Periods months 20.0 50.0 1,000 - - 50 50 50 50 50 50 50 50 50 50 500 (500)
Total Finance Charges 15 15 65 64 64 63 62 61 61 60 59 58 646 (500)
Cash Flow (after financing) (15) (15) 67 86 77 78 79 (101) 72 90 88 89 594 4,300
Family Labour Input Days Month 5.0 - 60 5 5 5 5 5 5 5 5 5 5 5 5 60 60
Return to Family Labour (3) (3) 13 17 15 16 16 (20) 14 18 18 18 10 72
Source: Cost Benefit Analysis (CBA) Study - Field Verification.\1 In kid purchase price of adult female, with life expectancy estimated at five years.\2 Finance charges calculated at a monthly interest of 1.5% on outstanding loan, with the loan repaid over 20 months over 2 years.
Financial Internal Rate of Return (FIRR) (2,000) - - 132 150 141 141 141 (39) 132 150 147 3,947 9%

Table AN10.10 Income Generating Activity: Poultry - SHG Individual (M Pradesh, Village Chenpura).
Item Units Period Quantity Unit Price Value IGA Month 1 Month 2 Month 3 Month 4 Month 5 Month 6 Month 7 Month 8 Month 9 Month 10 Month 11 Month 12 Total IGA(No) (Rs) (Rs/Period) Assets Feb-03 Mar-03 Apr-03 May-03 Jun-03 Jul-03 Aug-03 Sep-03 Oct-03 Nov-03 Dec-03 Jan-04 Assets
Capital Investment \1Day old chicks No 50.0 7.0 350 350 -Working Capital Sum 1.0 650.0 650 650 650
Total Capital Investment 1,000 1,000 650
Sales IncomeMonth 3 Sales No Month 10.0 60.0 600 - - 600 - - - - - - - - - 600 Month 10 Sales No Month 20.0 150.0 3,000 - - - - - - - - - 3,000 - - 3,000 Month 12 Sales No Month 10.0 250.0 2,500 - - - - - - - - - - - 2,500 2,500 Egg No - 200.0 2.0 400 - - - - - - - - - 133 133 133 400
Total Sales Income 6,500 - - - 600 - - - - - - 3,133 133 2,633 6,500 -
ExpenditureDirect CostsFeed Sum Month 12.0 125.0 1,500 125 125 125 125 125 125 125 125 125 125 125 125 1,500 Vet and Med Sum Month 12.0 8.3 100 8 8 8 8 8 8 8 8 8 8 8 8 100 Total Direct Costs 1,600 - 133 133 133 133 133 133 133 133 133 133 133 133 1,600 -
Overhead CostsGeneral Sum Month 12.0 50.0 600 50 50 50 50 50 50 50 50 50 50 50 50 600 Total Overhead Costs 600 - 50 50 50 50 50 50 50 50 50 50 50 50 600 -
Total Expenditure 2,200 - 183 183 183 183 183 183 183 183 183 183 183 183 2,200 -
Cash Flow (before financing) (1,000) (183) (183) 417 (183) (183) (183) (183) (183) (183) 2,950 (50) 2,450 4,300 650 Cash Flow (cumulated) (1,000) (183) (367) 50 (133) (317) (500) (683) (867) (1,050) 1,900 1,850 4,300
Financing PlanEquity Capital 100 100 Loan 900 900
Total Financing 1,000 1,000
Financing Charges \2Interest Percent Month 1.50% 14 14 14 14 14 14 14 14 14 14 14 14 162 Principal Periods Months - - - - - - - - - - - 900 900 -
Total Financing Charges 14 14 14 14 14 14 14 14 14 14 14 914 1,062 -
Cash Flow (after financing) - (197) (197) 403 (197) (197) (197) (197) (197) (197) 2,937 (64) 1,537 3,238 650
Family Labour Input Days Month 12.0 5 60 5 5 5 5 5 5 5 5 5 5 5 5 60 60
Return to Family Labour (Rs/P/day) (39) (39) 81 (39) (39) (39) (39) (39) (39) 587 (13) 307 54 65
Source: Cost Benefit Analysis (CBA) Study - Field Verification.\1 Assets (chickens) sold at year end.\2 Finance charges calculated at a monthly interest of 1.5% on outstanding loan, with the loan repaid in month 12.
Financial Internal Rate of Return (FIRR) (1,000) (183) (183) 417 (183) (183) (183) (183) (183) (183) 2,950 (50) 3,100 13%

Table AN10.11 Income Generating Activity: Irrigation Pump B - SHG Group (Gujarat, Village Jadha).
Item Units Period Quantity Unit Price Value IGA Month 1 Month 2 Month 3 Month 4 Month 5 Month 6 Month 7 Month 8 Month 9 Month 10 Month 11 Month 12 Total IGA(No) (Rs) (Rs/Period) Asset Sep-03 Oct-03 Nov-03 Dec-03 Jan-04 Feb-04 Mar-04 Apr-04 May-04 Jun-04 Jul-04 Aug-04 Asset
Capital Investment \1Diesel Engine (10 HP) No 1.0 14,000.0 14,000 14,000 12,000 Irrigation Pump No 1.0 6,000.0 6,000 6,000 5,143 Irrigation Pipes Sum 1.0 2,000.0 2,000 2,000 1,600
Total Capital Investment 22,000 22,000 18,743
Sales Income \2October Hiring Hours Month 43.0 85.0 3,655 - 3,655 - - - - - - - - - - 3,655 November Hiring Hours Month 40.0 85.0 3,400 - - 3,400 - - - - - - - - - 3,400 December Hiring Hours Month 26.0 85.0 2,210 - - - 2,210 - - - - - - - - 2,210
Total Sales Income 9,265 - - 3,655 3,400 2,210 - - - - - - - - 9,265 -
ExpenditureDirect CostsEngine oil Litre - 8.1 80.0 648 - 216 216 216 - - - - - - - - 648 Diesel Fuel Litre - 75.0 28.0 2,100 - 700 700 700 - - - - - - - - 2,100 Transport Sum - 1.0 750.0 750 - 250 250 250 - - - - - - - - 750 Operator fee (Jankar) Hour - 109.0 10.0 1,090 - 430 400 260 - - - - - - - - 1,090 Total Direct Costs 4,588 - - 1,596 1,566 1,426 - - - - - - - - 4,588 -
Overhead CostsSpares and repairs Sum - 1.0 400.0 400 - 200 200 - - - - - - - - - 400 Total Overhead Costs 400 - - 200 200 - - - - - - - - - 400 -
Total Expenditure 4,988 - - 1,796 1,766 1,426 - - - - - - - - 4,988 -
Cash Flow (before financing) 4,277 (22,000) - 1,859 1,634 784 - - - - - - - - 4,277 18,743
Financing PlanEquity Capital 2,000 2,000 Loan 20,000 20,000
Total Financing 22,000 22,000
Finance Charges \3Interest Percent Month 1.50% 300 300 285 270 255 240 240 240 240 240 240 240 3,090 Principal Periods Months 20.0 - 1,000 1,000 1,000 1,000 - - - - - - 240 4,240
Total Financing 300 1,300 1,285 1,270 1,255 240 240 240 240 240 240 480 7,330
Cash Flow (after financing) - (300) 559 349 (486) (1,255) (240) (240) (240) (240) (240) (240) (480) (3,053)
Family Labour Input Days Month 3.0 10.0 30.0 - 10 10 10 - - - - - - - - 30
Return to Family Labour - 56 35 (49) - - - - - - - - (102)
Source: Cost Benefit Analysis (CBA) Study - Field Verification.\1 Depreciation of diesel engine and pump over seven years and irrigation pipes over 5 years.\2 Based on jankar field records.\3 Finance charges calculated at a monthly interest of 1.5% on the outstanding loan, with the loan repaid over 5 years.
Financial Internal Rate of Return (FIRR) (22,000) - 1,859 1,634 784 - - - - - - - 18,743 0%

Table AN10.12 Income Generating Activity: Irrigation Pump C - SHG Group (M Pradesh, Village Kadwapada).
Item Units Period Quantity Unit Price Value IGA Month 1 Month 2 Month 3 Month 4 Month 5 Month 6 Month 7 Month 8 Month 9 Month 10 Month 11 Month 12 Total IGA(No) (Rs) (Rs/Period) Asset Sep-04 Oct-04 Nov-04 Dec-04 Jan-05 Feb-05 Mar-05 Apr-05 May-05 Jun-05 Jul-05 Aug-05 Asset
Capital Investment \1Honda Diesel Engine No N/A 1 20,000.0 20,000 20,000 17,143 Irrigation Pump No N/A 1 5,000.0 5,000 5,000 4,286 Irrigation Pipes No N/A 1 3,000.0 3,000 3,000 2,400
Total Capital Investment 28,000 28,000 23,829
Sales IncomeHire Income (members) \2 Hrs Year 171 25.0 4,280 - 1,960 1,480 580 120 140 - - - - - - 4,280 Hire Income (non members) Hrs Year 43 40.0 1,712 - 784 592 232 48 56 - - - - - - 1,712
Total Sales Income 5,992 - - 2,744 2,072 812 168 196 - - - - - - 5,992
ExpenditureDirect CostsPriming fuel and oil Sum Year 1 1,444.0 1,444 - 661 499 196 40 47 - - - - - - 1,444 Jankar Costs Sum Year 214 5.0 1,070 - 490 370 145 30 35 - - - - - - 1,070 Total Direct Costs 1,444 - - 661 499 196 40 47 - - - - - - 1,444
Overhead CostsRepairs Sum Year 1 587.5 588 - 118 118 118 118 118 - - - - - 450 588 Total Overhead Costs 588 - - 118 118 118 118 118 - - - - - 450 588
Total Expenditure 2,032 - - 779 617 313 158 165 - - - - - 450 2,032
Cash Flow (before financing) 3,961 (28,000) - 1,965 1,455 499 10 31 - - - - - (450) 3,961 23,829
Financing PlanEquity Capital 3,000 3,000 Loan 25,000 25,000
Total Financing 28,000 28,000
Finance Charges \3Interest Percent Month 1.5% - - 375 375 360 345 330 315 300 300 300 300 300 2,100 Principal Periods Months 25.0 1,000 - - 1,000 1,000 1,000 1,000 1,000 - - - - - - 5,000 (20,000)
Total Financing - - 1,375 1,375 1,360 1,345 1,330 315 300 300 300 300 300 7,100 (20,000)
Cash Flow (after financing) - - 590 80 (861) (1,335) (1,299) (315) (300) (300) (300) (300) (750) (3,140) 3,829
Family Labour Input \4 Days Month N/A - NA - - - - - - - - - - - - - -
Return to Family Labour - - - - - - - - - - - - - -
Source: Cost Benefit Analysis (CBA) Study - Field Verification.\1 Depreciation of diesel engine and pump over seven years and irrigation pipes over 5 years.\2 Total hours over 5 months rabi period Total 214 - - 98.0 74.0 29.0 6.0 7.0 - 214
Members 80% 171 - - 78.4 59.2 23.2 4.8 5.6 - 171 Non members 20% 43 - - 19.6 14.8 5.8 1.2 1.4 - 43
\3 Repayment over five years, at five months per year (25 periods), interest charged at 1.5% per month on the oustanding loan balance.\4 Jankar fees included in direct costs.
Financial Internal Rate of Return (FIRR) (28,000) - 1,965 1,455 499 10 31 - - - - - 23,379 0%

Table AN10.13 Income Generating Activity: Flour Mill - Private (Gujarat, Village Jadha).
Item Units Period Quantity Unit Price Value IGA Month 1 Month 2 Month 3 Month 4 Month 5 Month 6 Month 7 Month 8 Month 9 Month 10 Month 11 Month 12 Total IGA(No) (Rs) (Rs/Period) Assets Apr-03 May-03 Jun-03 Jul-03 Aug-03 Sep-03 Oct-03 Nov-03 Dec-03 Jan-04 Feb-04 Mar-04 Assets
Capital Investment \1Installation and Transport Sum 1.0 4,000.0 4,000 3,800 3,600 Diesel Engine 12HP No 1.0 22,000.0 22,000 19,800 17,600 Flour Grinder No 1.0 8,000.0 8,000 7,200 6,400 Other Equipment Sum 1.0 2,500.0 2,500 2,250 2,000
Total Capital Investment 36,500.0 36,500 33,050 - - - - - - - - - - - - 29,600
Sales Income \2Maize Grinding kg Month 10,000.0 0.90 9,000 9,000 9,000 9,000 9,000 9,000 9,000 9,000 9,000 9,000 9,000 9,000 9,000 108,000 Wheat Grinding kg Month 2,000.0 0.80 1,600 1,600 1,600 1,600 1,600 1,600 1,600 1,600 1,600 1,600 1,600 1,600 1,600 19,200
Total Sales Income 10,600 10,600 10,600 10,600 10,600 10,600 10,600 10,600 10,600 10,600 10,600 10,600 10,600 127,200
ExpenditureDirect CostsDiesel Fuel \3 Litres Month 196.0 28.5 5,586 5,586 5,586 5,586 5,586 5,586 5,586 5,586 5,586 5,586 5,586 5,586 5,586 67,032 Oil Litres Month 10.0 150.0 1,500 1,500 1,500 1,500 1,500 1,500 1,500 1,500 1,500 1,500 1,500 1,500 1,500 18,000 Other Sum Month 1.0 100.0 100 100 100 100 100 100 100 100 100 100 100 100 100 1,200 Total Direct Costs 7,186 7,186 7,186 7,186 7,186 7,186 7,186 7,186 7,186 7,186 7,186 7,186 7,186 86,232
Overhead CostsUtilities Sum Month 1.0 50.0 50 50 50 50 50 50 50 50 50 50 50 50 50 600 Rent of Shop Sum Month 1.0 350.0 350 350 350 350 350 350 350 350 350 350 350 350 350 4,200 Spares and Repairs Sum Month 1.0 600.0 600 600 600 600 600 600 600 600 600 600 600 600 600 7,200 Total Overhead Costs 1,000 1,000 1,000 1,000 1,000 1,000 1,000 1,000 1,000 1,000 1,000 1,000 1,000 12,000
Total Expenditure 8,186 8,186 8,186 8,186 8,186 8,186 8,186 8,186 8,186 8,186 8,186 8,186 8,186 98,232
Cash Flow (before financing) (33,050) 2,414 2,414 2,414 2,414 2,414 2,414 2,414 2,414 2,414 2,414 2,414 2,414 28,968 29,600
Financing PlanEquity Capital 16,500 15,000 Loan 20,000 18,050
Total Financing 36,500 33,050
Finance Charges \4Interest Percent Year 15.0% 167 160 153 146 139 132 125 118 111 104 97 90 1,542 - Principal Term Month 36.0 556 6,666 556 556 556 556 556 556 556 556 556 556 556 556 6,667 (6,667)
Total Financing Charges 722 715 708 701 694 688 681 674 667 660 653 646 8,208 (6,667)
Cash Flow (after financing) - 1,692 1,699 1,706 1,713 1,720 1,726 1,733 1,740 1,747 1,754 1,761 1,768 20,760 22,933
Family Labour Input Days Month 1.0 20 20 20 20 20 20 20 20 20 20 20 20 20 20 240 240
Return to Family Labour 85 85 85 86 86 86 87 87 87 88 88 88 86 182
Source: Cost Benefit Analysis (CBA) Study - Field Verification.\1 Depreciation of installation and transport over 20 years and engine, mill and other equipment over 10 years.\2 Assumes an average of 20 days per month and per day maize 500kg and wheat 100kg.\3 Assumes an average of 1.5 litres per hour, 7 hours per day for 20 days per month.\4 Purchased in 2002 with loan of Rs 20,000 repayable in 36 instalments at an annual interest rate of 15% on the outstanding balance.
Financial Internal Rate of Return (FIRR) (33,050) 2,414 2,414 2,414 2,414 2,414 2,414 2,414 2,414 2,414 2,414 2,414 32,014 7%

DFID / India: Western India Rainfed Farming Project / Final Report / October 2005
Incremental Benefits
AN11

Incremental Benefits
AN11-1
DFID / India: Western India Rainfed Farming Project / Final Report / October 2005
Incremental Benefits
AN11
Introduction
The identification of the overall arable cultivated area, within a village that has benefited from the crop technology development activity, was difficult to ascertain with any degree of certainty. Similarly, areas directly benefiting exclusively from SWC and WRD activities were again difficult to define and separate from the benefit derived from the village crop technology activity. Estimation of yields, variable, overhead and labour costs associated with the three activities would require a very detailed survey over a representative sample of villages. This was not practicable in terms of the financial and human resources allocated or within the reporting timescale of the present study. It was proposed in the CBA scoping report1/ and confirmed by the CBA consultants, that use should be made of the primary data collected during the GVT ‘Net Income Study.’2/ This recommendation was accepted at the inception workshop (September 2004).
Crop Incremental Benefits
For the Net Income Study, crop output data (yield, byproduct and price) were recorded on a unit area basis but variable costs and labour costs recorded on a household basis. Thus data was available on a unit area or household basis. No attempt was made to differentiate between areas under SWC or WRD activities. In using this data to measure the benefits, it has to be assumed that the randomly selected household sample was representative of all three-development activities. Incremental benefits for the three development activities are based on a household net margin adjusted for the well being ranking (WBR) of the village at the time of entry (village profile) multiplied by the number of households, in the village, participating the programme. The quantified benefits from all three development activities are therefore measured as the crop net margin3/ for the ‘with/after project’ situation less the ‘without/before project’ situation, the incremental benefit. The number of participating households within the village in relation to the overall investment in these three development activities will have a substantial effect on the cost benefit analysis and the resulting village economic internal rate of return (EIRR) and the net present value (NPV) of the net incremental benefit stream.
The sample for the income survey was conducted in one randomly selected phase two village in each of the three GVT operational states of Gujarat, Madhya Pradesh and Rajasthan, and covered all four of GVT household WBR types. The study fieldwork was carried out in September 2002 for the khalif crop and
1/ Scoping Mission: Cost-Benefit and Cost-Effectiveness Study, March 2004. 2/ Study of Impact of WIRFP on Net Incomes of Targeted Households, January 2004. 3/ Crop net margin represents the crop output (crop and byproduct) less the variable costs of production,
overhead costs and family labour measured at economic farm gate prices.

Incremental Benefits
AN11-2
DFID / India: Western India Rainfed Farming Project / Final Report / October 2005
February 2003 for the rabi crop, and data for both the current (after / with project) situation and the before (without project) situation was recorded.
As part of this study, a survey, again covering all WBR type households, was conducted in a village where activities had been conducted under phase one of the project.
Details of the household incremental net margins for the ‘before/without’ and ‘after/ with’ project situation for the khalif and rabi crops for the phase two villages in Gujarat, Madhya Pradesh and Rajasthan are given in Annex 11 and summarised in Table A11.1. The phase two results are compared with the results obtained by the phase one household incremental net margins. In order to prepare the comparison between the one phase one and three phase two villages from the three different states, it has been assumed that the four WBR types are equally distributed. For the analysis of the individual village, the WBR, as determined for the village profile, has been used.
The results highlight two key issues namely the significant difference between the incremental crop net margin from Rajasthan (Rs 2,656 per household) when compared with that of Gujarat (Rs 6,435 per household) and Madhya Pradesh (Rs 6,796 per household) and the substantial difference when compared with the equivalent figure for the phase one village (Rs 10,102 per household). These differences in the incremental household net margins based on the primary data extracted from the Net Income Study, were highlighted during the final presentations to DFIDI, GVT and IFFDC. There appeared little justification to differentiate between the results from the three GVT operational areas therefore it was proposed that the crop benefits should be averaged across the three states to give an average per WBR type but that this average should be weighted by the individual village WBR as determined by the village profile.
It was suggested that the differential between the phase one and phase two household incremental crop net margin reflected the selection, in phase two, of villages with significantly poorer resources. However, it is reasonable to assume that the household incremental crop net margin of the phase twoI villages can be expected to increase to the net margin levels approaching those recorded for the phase one households given a longer period for the adoption of crop technology in association with SWC and WRD interventions. The effect of this further increase over and above the net margin recorded in the phase two villages is tested in the sensitivity analysis.

Incremental Benefits
AN11-3
DFID / India: Western India Rainfed Farming Project / Final Report / October 2005
Table AN11.1: Incremental Crop Net Margin per Household Rs/HH (Economic)
Gujarat M Pradesh Rajasthan Average Phase ( %) (Rs/HH) ( %) (Rs/HH) ( %) (Rs/HH) (Rs/HH)
Phase I Village Naganwot Choti WBR - Weighted 10,102 10,102 Phase II Villages Lakhana Bagoli Merana Average WBR - Very Poor 12 3,380 25 2,434 12 3,286 2,193 12 515 - 12 1,351 WBR – Poor 25 6,479 25 2,824 38 3,367 4,223 WBR - Moderate 25 4,955 25 5,319 - - 5,136 WBR – Better Off 25 12,359 25 16,608 38 1,927 10,298 WBR - Weighted 100 6,435 100 6,796 100 2,565 5,463
Source: Cost Benefit Analysis Study Jan 2005 estimates (based on primary data collected for the Net Income Study). WBR = Well Being Ranking
Livestock Incremental Benefits
Details of the household incremental livestock net margins for the ‘before/without’ and ‘after/with’ project situation for the phase two villages in Gujarat, Madhya Pradesh and Rajasthan are given in Annex 11 and summarised in Table A11.2 and compared with results from the phase one household incremental livestock net margin. As with the crop net margin, in order to prepare the comparison between the one phase one and three phase two villages from the three different states, it has been assumed that the four WBR types are equally distributed in deriving an average incremental crop net margin.
In contrast to the household crop net margin results, there is relatively little variation between the three phase two villages from the three states of Gujarat, Madhya Pradesh and Rajasthan and again little difference between the phase one village and the phase two villages. In estimating the livestock benefits, for reasons of consistency, the average value per WBR type for the three phase two villages has been used but weighted by the individual village WBR as per the village profile.
Livestock numbers owned and estimates of their market values costs were recorded in the survey and the resulting herd valuation calculated for the without and with project situations. The resulting average annual increase in the herd valuation over a five period was determined. This increase has not been incorporated into the annual increment benefit stream, as it is unrealistic to assume that it would continua on an annual basis during the period of the project analysis. It has, however, been incorporated as a sensitivity test.

Incremental Benefits
AN11-4
DFID / India: Western India Rainfed Farming Project / Final Report / October 2005
Table A11.2: Incremental Livestock Net Margin per Household Rs/HH (Economic)
Phase Gujarat M Pradesh Rajasthan Average ( %) (Rs/HH) ( %) (Rs/HH) ( %) (Rs/HH) (Rs/HH) Phase I Village Naganwot Choti WBR - Weighted 1,409 1,409 Phase II Villages Lakhana Bagoli Merana Average WBR – Very Poor 12 2,316 25 3,185 12 (1,325) 1,297 13 795 - 12 1,515 WBR - Poor 12 1,950 25 2,695 38 542 2,157 13 3,440 WBR - Moderate 25 1,140 25 1,289 - - 1,214 WBR – Better Off 25 4,955 25 440 38 4,670 3,355 WBR - Weighted 100 2,586 100 1,902 100 1,978 2,006
Source: Cost Benefit Analysis Study Jan 2005 estimates (based on primary data collected for the Net Income Study) WBR = Well Being Ranking
Conversion of Financial Household Net Margins to Economic Values
It is assumed that crop inputs and outputs are locally traded and that as such the financial prices recorded during the interviews for the Net Income Study generally reflect their economic values. Possible exceptions include the cotton crop and fertiliser inputs but effects were considered insignificant and disaggregation of data to make such adjustment was considered impractical.
Seasonal agricultural wage rates were determined during the collection of primary data for the Net Income Study. For crop activities, the recorded wage rates ranged from Rs 40 to 50 per person day during the khalif season and Rs 20 to 40 during the rabi season. It is concluded that these rates reflect the real value of rural seasonal labour and have as such been incorporated into the calculation of household crop net margins used in the economic analysis.
Labour requirement for the livestock operations was generally less well recorded and reflects a general view in the household that there is no real financial cost for such family labour. In deriving an economic value for family labour (adult or child) an indicative person day requirement has been estimated, to take account of the level of activity, and valued at Rs 25 per person day. This reflects an average annual value in rural areas where under employment is prevalent, particularly in the rabi season, and extensive use is made of children’s labour.
Lessons Learnt
The identification and quantification of project benefits raised a number of issues, which are listed below:
• The current emphasis of the M and E programme has been to measure primarily physical achievements. This study has highlighted the need for the

Incremental Benefits
AN11-5
DFID / India: Western India Rainfed Farming Project / Final Report / October 2005
identification of key indicators, physical and/or financial, necessary to verify and quantify in financial terms the incremental benefits achieved by project.
• The existing data (Net Income Study) used to quantify benefits proved very general in relation to determining the specific incremental benefits from the crop technology, SWC and WRD activities.
• It is suggested that a small number of more detailed individual village case studies could be might be conducted to determine more accurately the specific crop areas benefiting from SWC and WRD development intervention and that crop area budgets, as opposed to household budgets, based on focal group discussions, applied to the specific area.

WIRFP - Phase II - Cost Benefit Analysis Study
Tables AN11.0 Incremental Benefits
Tables AN11.1 GVT Net Income Study Net Margin Data - Summary
Table AN11.1.1 GVT Net Income Survey Summary: Phase I and II - Summary of Incremental Crop Net Margin per Household (Economic).Table AN11.1.2 GVT Net Income Survey Summary: Phase I and II - Detail of Incremental Crop Net Margin per Household (Economic).Table AN11.1.3 GVT Net Income Survey Summary: Phase I and II - Weighted Crop Net Margin per Household and Area (Economic).Table AN11.1.4 GVT Net Income Survey Summary: Phase I and II - Summary of Incremental Livestock Net Margin per Household (Economic).Table AN11.1.5 GVT Net Income Survey Summary: Phase I and II - Detail of Incremental Livestock Net Margin per Household (Economic).

Table AN11.1.1 GVT Net Income Survey Summary: Phase I and II - Summary of Incremental Crop Net Margin per Household (Economic).
Well Being Ranking MeanWeight Increment Weight Increment Weight Increment Increment
(%) (Rs/HH) (%) (Rs/HH) (%) (Rs/HH) (Rs/HH)
Phase I - VillageMadhya Pradesh - WBR Weighted Data
Households Surveyed 1 1 Household Crop Net Margin (Rs) #REF! #REF!
Phase II - VillageVery Poor
Households Surveyed 2 1 2 5 Household Crop Net Margin (Rs) 12.5% 3,380.4 25.0% 2,433.5 12.5% 3,286.0 Household Crop Net Margin (Rs) 12.5% (548.5) 12.5% 1,350.9 1,980.5
PoorHouseholds Surveyed 2 1 1 3 Household Crop Net Margin (Rs) 0.0% (5,904.4) \1 25.0% 2,824.0 37.5% 3,367.0 4,386.0 Household Crop Net Margin (Rs) 25.0% 6,967.0
ModerateHouseholds Surveyed 1 1 - 2 Household Crop Net Margin (Rs) 25.0% 4,955.2 25.0% 5,317.5 0.0% - 5,136.4
Better OffHouseholds Surveyed 1 1 1 3 Household Crop Net Margin (Rs) 25.0% 12,358.5 25.0% 16,608.0 37.5% 1,926.5 10,297.7
Phase II - WBR Weighted Data 100% 100% 100%Household Crop Net Margin (Rs) 6,424.2 6,795.7 2,564.7 5,450.1
Source: Study of Impact of WIRFP on Net Incomes of Target Households, Jan 2004.WBR = GVT Well Being Ranking\1 Excluded from analysis.
Madhya Pradesh Rajasthan
Lakhana Bagoli Merana
Naganwot Choti
Gujurat

Table AN11.1.2 GVT Net Income Survey Summary: Phase I and II - Detail of Incremental Crop Net Margin per Household (Economic).
Well Being RankingWeight
(%) Khalif Rabi Total Khalif Rabi Total Khalif Rabi Total
Phase I - VillageMadhya Pradesh - WBR Weighted Data
Households Surveyed 6 Household Crop Net Margin (Rs) 100% #REF! #REF! #REF! #REF! #REF! #REF! #REF! #REF! #REF!
Phase II - VillageVery Poor
Households Surveyed 5 G Household Crop Net Margin (Rs) 936.0 - 936.0 3,159.5 1,156.9 4,316.4 2,223.5 1,156.9 3,380.4 G Household Crop Net Margin (Rs) 3,305.5 - 3,305.5 2,757.0 - 2,757.0 (548.5) - (548.5) M Household Crop Net Margin (Rs) 239.5 - 239.5 2,673.0 - 2,673.0 2,433.5 - 2,433.5 R Household Crop Net Margin (Rs) (15.0) - (15.0) 206.0 3,065.0 3,271.0 221.0 3,065.0 3,286.0 R Household Crop Net Margin (Rs) (293.0) 512.5 219.5 453.4 1,117.0 1,570.4 746.4 604.5 1,350.9
Average 25% 834.6 102.5 937.1 1,849.8 1,067.8 2,917.6 1,015.2 965.3 1,980.5
PoorHouseholds Surveyed 3
G Household Crop Net Margin (Rs) 2,810.0 - 2,810.0 9,167.0 610.0 9,777.0 6,357.0 610.0 6,967.0 M Household Crop Net Margin (Rs) 128.0 - 128.0 2,952.0 - 2,952.0 2,824.0 - 2,824.0 R Household Crop Net Margin (Rs) (1,025.0) - (1,025.0) 2,290.0 52.0 2,342.0 3,315.0 52.0 3,367.0
Average 25% 637.7 - 637.7 4,803.0 220.7 5,023.7 4,165.3 220.7 4,386.0
ModerateHouseholds Surveyed 2
G Household Crop Net Margin (Rs) 1,953.0 178.5 2,131.5 3,778.2 3,308.5 7,086.7 1,825.2 3,130.0 4,955.2 M Household Crop Net Margin (Rs) 35.0 - 35.0 3,644.5 1,708.0 5,352.5 3,609.5 1,708.0 5,317.5
Average 25% 994.0 89.3 1,083.3 3,711.4 2,508.3 6,219.6 2,717.4 2,419.0 5,136.4
Better OffHouseholds Surveyed 3
G Household Crop Net Margin (Rs) 7,892.0 5,270.0 13,162.0 19,402.5 6,118.0 25,520.5 11,510.5 848.0 12,358.5 M Household Crop Net Margin (Rs) 4,485.1 - 4,485.1 21,093.1 - 21,093.1 16,608.0 - 16,608.0 R Household Crop Net Margin (Rs) 6,165.5 - 6,165.5 8,092.0 - 8,092.0 1,926.5 - 1,926.5
Average 25% 6,180.9 1,756.7 7,937.5 16,195.9 2,039.3 18,235.2 10,015.0 282.7 10,297.7
Phase II - WBR Weighted Data 100% 2,161.8 487.1 2,648.9 6,640.0 1,459.0 8,099.0 4,478.2 971.9 5,450.1 Household Crop Net Margin (Rs)
Source: Study of Impact of WIRFP on Net Incomes of Target Households, Jan 2004.WBR = GVT Well Being Ranking\1 Excluded from analysis.
Before After Increment

Table AN11.1.3 GVT Net Income Survey Summary: Phase I and II - Weighted Crop Net Margin per Household and Area (Economic).
Item WBR(%) Khalif Rabi Total Khalif Rabi Total Khalif Rabi Total
Unit Area Analysis (Economic):Phase I 100%
Madhya Pradesh - WBR Weighted DataHousehold Crop Net Margin (Rs) #REF! #REF! #REF! #REF! #REF! #REF! #REF! #REF! #REF!Net Margin / bigha #REF! #REF! #REF! #REF! #REF! #REF! #REF! #REF! #REF!Net Margin / hectare \2 #REF! #REF! #REF! #REF! #REF! #REF! #REF! #REF! #REF!
Phase II Gujarat - WBR Weighted Data 33.3%
Household Crop Net Margin (Rs) 3,693.9 1,362.1 5,056.1 8,826.5 2,653.7 11,480.2 5,132.6 1,291.6 6,424.2 Net Margin / bigha 982.2 340.5 1,322.7 2,247.3 656.2 2,894.8 1,265.1 315.7 1,580.8 Net Margin / hectare \2 4,911.1 1,702.7 6,613.7 11,236.7 3,281.0 14,473.9 6,325.7 1,578.4 7,860.1
Madhya Pradesh - WBR Weighted Data 33.3%Household Crop Net Margin (Rs) 1,221.9 - 1,221.9 7,590.6 427.0 8,017.6 6,368.7 427.0 6,795.7 Net Margin / bigha 167.7 - 167.7 1,198.3 85.4 1,283.7 1,030.6 85.4 1,116.0 Net Margin / hectare \2 838.4 - 838.4 5,991.6 427.0 6,418.6 5,153.1 427.0 5,580.1
Rajasthan - WBR Weighted Data 33.3%Household Crop Net Margin (Rs) 1,889.2 64.1 1,953.3 3,975.7 542.3 4,517.9 2,086.5 478.2 2,564.7 Net Margin / bigha 49.8 42.7 92.5 429.7 304.1 733.9 379.9 261.4 641.3 Net Margin / hectare \2 249.0 213.5 462.6 2,148.6 1,520.7 3,669.3 1,899.5 1,307.2 3,206.7
Phase II - WBR Weighted Data 100%Household Crop Net Margin (Rs) 2,268.1 475.3 2,743.5 6,796.9 1,207.5 8,004.5 4,528.8 732.2 5,261.0 Net Margin / bigha 399.9 127.7 527.6 1,291.7 348.5 1,637.3 891.8 220.8 1,112.6 Net Margin / hectare \2 1,999.3 638.7 2,638.0 6,458.3 1,742.7 8,186.4 4,459.0 1,104.1 5,548.5
Source: Study of Impact of WIRFP on Net Incomes of Target Households, Jan 2004.WBR = GVT Well Being Ranking\1 One hectare equivalent to bigha = 5.0
Before / Without Project After / With Project Increment

Table AN11.1.4 GVT Net Income Survey Summary: Phase I and II - Summary of Incremental Livestock Net Margin per Household (Economic).
Well Being Ranking MeanWeight Increment Weight Increment Weight Increment Increment
(%) (Rs/HH) (%) (Rs/HH) (%) (Rs/HH) (Rs/HH)
Phase I - VillageMadhya Pradesh - WBR Weighted Data
Households Surveyed 6 6 Household Livestock Net Margin (Rs) #REF! #REF!
Phase II - VillageVery Poor
Households Surveyed 2 1 2 5 Household Livestock Net Margin (Rs) 12.5% 2,316.0 25.0% 3,185.0 12.5% (1,325.0) Household Livestock Net Margin (Rs) 12.5% 795.0 12.5% 1,515.0 1,297.2
PoorHouseholds Surveyed 2 1 1 4 Household Livestock Net Margin (Rs) 12.5% 1,950.0 \1 25.0% 2,695.0 37.5% 542.0 2,156.8 Household Livestock Net Margin (Rs) 12.5% 3,440.0 - -
ModerateHouseholds Surveyed 1 1 - 2 Household Livestock Net Margin (Rs) 25.0% 1,140.0 25.0% 1,288.8 0.0% - 1,214.4
Better OffHouseholds Surveyed 1 1 1 3 Household Livestock Net Margin (Rs) 25.0% 4,955.0 25.0% 440.0 37.5% 4,670.0 3,355.0
Phase II - WBR Weighted Data 100% 100% 100%Household Livestock Net Margin (Rs) 2,586.4 1,902.2 1,978.3 2,005.8
Source: Study of Impact of WIRFP on Net Incomes of Target Households, Jan 2004.WBR = GVT Well Being Ranking\1 Excluded from analysis.
Madhya Pradesh Rajasthan
Lakhana Bagoli Merana
Naganwot Choti
Gujurat

Table AN11.1.5 GVT Net Income Survey Summary: Phase I and II - Detail of Incremental Livestock Net Margin per Household (Economic).
Well Being Ranking Weight(%) Herd Value Net Margin Herd Value Net Margin Herd Value Net Margin
Phase I - VillageMadhya Pradesh - WBR Weighted Data
Households Surveyed 6 Household Livestock Net Margin (Rs) 100% #REF! #REF! #REF! #REF! #REF! #REF!
Phase II - VillageVery Poor
Households Surveyed 5 G Household Livestock Net Margin (Rs) 3,400 (1,144.0) 24,300 1,172.0 4,180 2,316.0 G Household Livestock Net Margin (Rs) 880 (135.0) 2,400 660.0 304 795.0 M Household Livestock Net Margin (Rs) 5,200 (175.0) 5,650 3,010.0 90 3,185.0 R Household Livestock Net Margin (Rs) 15,000 2,565.0 11,000 1,240.0 (800) (1,325.0) R Household Livestock Net Margin (Rs) 4,300 (365.0) 11,500 1,150.0 1,440 1,515.0
Average 25% 5,756 149.2 10,970 1,446.4 1,043 1,297.2
PoorHouseholds Surveyed 4
G Household Livestock Net Margin (Rs) 20,000 1,970.0 35,000 3,920.0 3,000 1,950.0 G Household Livestock Net Margin (Rs) 14,560 70.0 21,990 3,510.0 1,486 3,440.0 M Household Livestock Net Margin (Rs) 7,000 20.0 25,825 2,715.0 3,765 2,695.0 R Household Livestock Net Margin (Rs) 10,950 1,348 21,100 1,890 2,030 542.0
Average 25% 13,128 852.0 25,979 3,008.8 2,570 2,156.8
ModerateHouseholds Surveyed 2
G Household Livestock Net Margin (Rs) 19,200 260.0 38,800 1,400.0 3,920 1,140.0 M Household Livestock Net Margin (Rs) 7,850 7,810.3 15,240 9,099.0 1,478 1,288.8
Average 25% 13,525 4,035.1 27,020 5,249.5 2,699 1,214.4
Better OffHouseholds Surveyed 3
G Household Livestock Net Margin (Rs) 21,000 (6,505.0) 56,400 (1,550.0) 7,080 4,955.0 M Household Livestock Net Margin (Rs) 5,800 5,040.0 38,900 5,480.0 6,620 440.0 R Household Livestock Net Margin (Rs) 11,300 (880.0) 30,320 3,790.0 3,804 4,670.0
Average 25% 12,700 (781.7) 41,873 2,573.3 5,835 3,355.0
Phase II - WBR Weighted Data 100% 11,277 1,063.7 26,461 3,069.5 3,037 2,005.8 Household Livestock Net Margin (Rs)
Source: Study of Impact of WIRFP on Net Incomes of Target Households, Jan 2004.\1 Herd value increment averaged over five years.
WBR = GVT Well Being Ranking
Before / Without Project After / With Project Increment \1
WIRFP - Phase II - Cost Benefit Analysis Study
Tables AN11.0 Incremental Benefits
Tables AN11.2 Net Income Study Crop and Livestock Net Margin Data: Phase 1 - Madhya Pradesh - Village Naganwat Choti
Table AN11.2.1 Madhya Pradesh - Village Naganwat Choti: Weighted Crop Net Margin Summary (Economic).Table AN11.2.2 Madhya Pradesh - Village Naganwat Choti: Weighted Livestock Net Margin Summary (Economic).Table AN11.2.3 A. Madhya Pradesh - Village Naganwat Choti: Summary of Crop Net Margin per Household and Area.
B. Madhya Pradesh - Village Naganwat Choti: Crop Net Margin per Household and Area - WBR - Very Poor (1).C. Madhya Pradesh - Village Naganwat Choti: Crop Net Margin per Household and Area - WBR - Very Poor (2).D. Madhya Pradesh - Village Naganwat Choti: Crop Net Margin per Household and Area - WBR - Poor (1).E. Madhya Pradesh - Village Naganwat Choti: Crop Net Margin per Household and Area - WBR - Poor (2).F. Madhya Pradesh - Village Naganwat Choti: Crop Net Margin per Household and Area - WBR - Moderate.G. Madhya Pradesh - Village Naganwat Choti: Crop Net Margin per Household and Area - WBR - Better Off.
Table AN11.2.4 Madhya Pradesh - Village Naganwat Choti: Individual Household Detailed Data: WBR - Very Poor (1).Table AN11.2.5 Madhya Pradesh - Village Naganwat Choti: Individual Household Detailed Data: WBR - Very Poor (2).Table AN11.2.6 Madhya Pradesh - Village Naganwat Choti: Individual Household Detailed Data: WBR - Poor (1).Table AN11.2.7 Madhya Pradesh - Village Naganwat Choti: Individual Household Detailed Data: WBR - Poor (2).Table AN11.2.8 Madhya Pradesh - Village Naganwat Choti: Individual Household Detailed Data: WBR - Moderate.Table AN11.2.9 Madhya Pradesh - Village Naganwat Choti: Individual Household Detailed Data: WBR - Better Off.
Table AN11.2.10 Madhya Pradesh - Village Naganwat Choti: Individual Household Livestock Detailed Data: WBR - Very Poor (1).Table AN11.2.11 Madhya Pradesh - Village Naganwat Choti: Individual Household Livestock Detailed Data: WBR - Very Poor (2).Table AN11.2.12 Madhya Pradesh - Village Naganwat Choti: Individual Household Livestock Detailed Data: WBR - Poor (1).Table AN11.2.13 Madhya Pradesh - Village Naganwat Choti: Individual Household Livestock Detailed Data: WBR - Poor (2).Table AN11.2.14 Madhya Pradesh - Village Naganwat Choti: Individual Household Livestock Detailed Data: WBR - Moderate.Table AN11.2.15 Madhya Pradesh - Village Naganwat Choti: Individual Household Livestock Detailed Data: WBR - Better Off.

Table AN11.2.1 Madhya Pradesh - Village Naganwat Choti: Weighted Crop Net Margin Summary (Economic).
ItemKhalif Rabi Total Khalif Rabi Total Khalif Rabi Total
Household and Unit Area Analysis
WBR - Very Poor 1 12.5%Household Crop Net Margin (Rs) 968 535 1,503 4,093 2,149 6,242 3,125 1,614 4,739 Area Planted (bigha) 3.0 2.0 5.0 3.0 3.0 6.0 - 1.0 1.0 Crop Net Margin / bigha 323 178 501 1,364 716 2,081 1,042 538 1,580 Crop Net Margin / hectare \2 1,613 892 2,505 6,822 3,582 10,403 5,208 2,690 7,898
WBR - Very Poor 2 12.5%Household Crop Net Margin (Rs) (96) - (96) 3,640 1,189 4,829 3,736 1,189 4,924 Area Planted (bigha) 3.0 - 3.0 3.0 3.0 6.0 - 3.0 3.0 Crop Net Margin / bigha (32) - (32) 1,213 396 1,610 1,245 396 1,641 Crop Net Margin / hectare \2 (159) - (159) 6,067 1,981 8,048 6,226 1,981 8,207
WBR - Poor 1 12.5%Household Crop Net Margin (Rs) 199 1,005 1,204 13,152 7,092 20,244 12,953 6,087 19,040 Area Planted (bigha) 10.0 5.0 15.0 10.0 10.0 20.0 - 5.0 5.0 Crop Net Margin / bigha 20 201 221 1,315 709 2,024 1,295 508 1,803 Crop Net Margin / hectare \2 100 1,005 1,105 6,576 3,546 10,122 6,477 2,541 9,017
WBR - Poor 2 12.5%Household Crop Net Margin (Rs) 773 310 1,083 7,120 4,289 11,409 6,348 3,979 10,327 Area Planted (bigha) 5.0 1.0 6.0 5.0 3.0 8.0 - 2.0 2.0 Crop Net Margin / bigha 155 62 217 1,424 858 2,282 1,270 796 2,065 Crop Net Margin / hectare \2 773 310 1,083 7,120 4,289 11,409 6,348 3,979 10,327
WBR - Moderate 25%Household Crop Net Margin (Rs) 986 3,385 4,371 9,458 5,195 14,653 8,471 1,810 10,281 Area Planted (bigha) 6.0 4.0 10.0 9.0 4.0 13.0 3.0 - 3.0 Crop Net Margin / bigha 164 846 1,011 1,051 1,299 2,350 886 453 1,339 Crop Net Margin / hectare \2 822 4,231 5,053 5,254 6,494 11,748 4,432 2,263 6,695
WBR - Better Off 25%Household Crop Net Margin (Rs) 2,778 937 3,715 4,915 9,560 14,475 2,137 8,623 10,760 Area Planted (bigha) 5 3 8 5 5 10 - 2 2 Crop Net Margin / bigha 556 312 868 983 1,912 2,895 427 1,600 2,027 Crop Net Margin / hectare \2 2,778 1,562 4,340 4,915 9,560 14,475 2,137 7,998 10,135
WBR - WeightedHousehold Crop Net Margin (Rs) 1,172 1,312 2,483 7,094 5,529 12,622 5,922 4,217 10,139 Crop Net Margin / bigha 238 345 583 1,173 1,138 2,311 935 793 1,728 Crop Net Margin / hectare \2 1,191 1,724 2,915 5,865 5,688 11,553 4,675 3,964 8,639
Source: Study of Impact of WIRFP on Net Incomes of Target Households, Jan 2004.\1 One hectare equivalent to bigha = 5.0
Before / Without Project After / With Project Increment

Table AN11.2.2 Madhya Pradesh - Village Naganwat Choti: Weighted Livestock Net Margin Summary (Economic).
Item WBR(%) Herd Net Margin Herd Net Margin Herd \1 Net Margin
Household Livestock Analysis
Well Being Ranking - Very Poor (1) 12.5%Household L'stock Net Margin (financial) (Rs) 1,160 (70.0) 5,900 770.0 948 840.0 Labour Input / Year (person days) 12.0 36.0 24.0 Labour Input (Rs) /2 300.0 900.0 600.0 Household L'stock Net Margin (economic) (Rs) (370.0) (130.0) 240.0
Well Being Ranking - Very Poor (2) 12.5%Household L'stock Net Margin (financial) (Rs) - - 5,400 1,855.0 - 1,855.0 Labour Input / Year (person days) - 36.0 36.0 Labour Input (Rs) /2 - 900.0 900.0 Household L'stock Net Margin (economic) (Rs) - 955.0 955.0
Well Being Ranking - Poor (1) 12.5%Household L'stock Net Margin (financial) (Rs) - - 5,900 2,527.0 1,180 2,527.0 Labour Input / Year (person days) - 48.0 48.0 Labour Input (Rs) /2 - 1,200.0 1,200.0 Household L'stock Net Margin (economic) (Rs) - 1,327.0 1,327.0
Well Being Ranking - Poor (2) 12.5%Household L'stock Net Margin (financial) (Rs) 4,700 2,265.0 10,600 4,155.0 1,180 1,890.0 Labour Input / Year (person days) 12.0 48.0 36.0 Labour Input (Rs) /2 300.0 1,200.0 900.0 Household L'stock Net Margin (economic) (Rs) 1,965.0 2,955.0 990.0
Well Being Ranking - Moderate 25.0%Household L'stock Net Margin (financial) (Rs) 14,700 7,030.0 1,900 3,720.0 1,900 (3,310.0) Labour Input / Year (person days) 12.0 36.0 24.0 Labour Input (Rs) /2 300.0 900.0 600.0 Household L'stock Net Margin (economic) (Rs) 6,730.0 2,820.0 (3,910.0)
Well Being Ranking - Better Off 25.0%Household L'stock Net Margin (financial) (Rs) 15,580 3,600.0 14,600 12,590.0 (196) 8,990.0 Labour Input / Year (person days) 24.0 72.0 48.0 Labour Input (Rs) /2 600.0 1,800.0 1,200.0 Household L'stock Net Margin (economic) (Rs) 3,000.0 10,790.0 7,790.0
Well Being Ranking - Weighted 100%Household L'stock Net Margin (financial) (Rs) 8,303 2,931.9 7,600 5,240.9 840 2,309.0 Household L'stock Net Margin (economic) (Rs) 2,631.9 4,040.9 1,409.0
Source: Study of Impact of WIRFP on Net Incomes of Target Households, Jan 2004.\1 Herd value increment averaged over five years.\2 Average annual daily value of family labour assumed = Rs/d 25.0
Before / Without Project After / With Project Increment

Table AN11.2.3 A. Madhya Pradesh - Village Naganwat Choti: Summary of Crop Net Margin per Household and Area.
Item Very Poor (1) Very Poor (2) Poor (1) Poor (2) Moderate Better OffIncrement Increment Increment Increment Increment Increment
Total Total Total Total Total Total
Household Analysis:Crop Revenvue
Crop 5,670 8,828 21,470 11,805 11,750 16,530 Residue 2,300 1,995 2,608 1,525 1,835 2,010
Total Crop Revenue 7,970 10,823 24,078 13,330 13,585 18,540
Production CostsVariable Costs 2,161 3,771 3,418 2,374 1,774 5,210
Gross Margin (Financial) 5,809 7,052 20,660 10,957 11,811 13,330 Labour Input (person days) (5) 31 9 8 37 12
Return per Person Day (Rs/p/day) (1,162) 231 2,296 1,370 319 1,111
Labour Costs (Economic) 1,070 2,128 1,620 630 1,530 2,570 Total Productioon Costs 3,231 5,899 5,038 3,004 3,304 7,780
Net Margin (Economic) \1 4,739 4,924 19,040 10,327 10,281 10,760
Area planted (bigha) 1 3.0 5.0 2 3.0 2.0 Cropping Intensity (percent)
Unit Area Analysis (Economic):Net Margin / bigha 1,580 1,641 1,803 2,065 1,339 2,027 Net Margin / hectare \2 7,898 8,207 9,017 10,327 6,695 10,135
Source: Study of Impact of WIRFP on Net Incomes of Target Households, Jan 2004.
Well Being Ranking

Table AN11.2.3
Item
Household Analysis:Crop Revenvue
CropResidue
Total Crop Revenue
Production CostsVariable Costs
Gross Margin (Financial)Labour Input (person days)
Return per Person Day (Rs/p/day)
Labour Costs (Economic)Total Productioon Costs
Net Margin (Economic) \1
Area planted (bigha)Cropping Intensity (percent)
Unit Area Analysis (Economic):Net Margin / bighaNet Margin / hectare \2
Source: \1 Adjusted for labour costs.\2 One hectare equivalent to bigha =
B. Madhya Pradesh - Village Naganwat Choti: Crop Net Margin per Household and Area - WBR - Very Poor (1)
Khalif Rabi Total Khalif Rabi Total Khalif Rabi Total
1,890 1,500 3,390 4,560 4,500 9,060 2,670 3,000 5,670 360 90 450 2,150 600 2,750 1,790 510 2,300
2,250 1,590 3,840 6,710 5,100 11,810 4,460 3,510 7,970
772 635 1,407 1,507 2,061 3,568 735 1,426 2,161 1,478 955 2,433 5,203 3,039 8,242 3,725 2,084 5,809
32 21 53 29 19 48 (3) (2) (5)
46 45 46 179 160 172 (1,242) (1,042) (1,162)
510 420 930 1,110 890 2,000 600 470 1,070 1,282 1,055 2,337 2,617 2,951 5,568 1,335 1,896 3,231
968 535 1,503 4,093 2,149 6,242 3,125 1,614 4,739
3.0 2.0 5.0 3.0 3.0 6.0 - 1.0 1.0 100% 67% 167% 100% 100% 200% 0% 50% 33%
323 178 501 1,364 716 2,081 1,042 538 1,580 1,613 892 2,505 6,822 3,582 10,403 5,208 2,690 7,898
Study of Impact of WIRFP on Net Incomes of Target Households, Jan 2004.
5.0
Well Being Ranking - Very Poor (1)Before / Without Project After / With Project Increment

Table AN11.2.3
Item
Household Analysis:Crop Revenvue
CropResidue
Total Crop Revenue
Production CostsVariable Costs
Gross Margin (Financial)Labour Input (person days)
Return per Person Day (Rs/p/day)
Labour Costs (Economic)Total Productioon Costs
Net Margin (Economic) \1
Area planted (bigha)Cropping Intensity (percent)
Unit Area Analysis (Economic):Net Margin / bighaNet Margin / hectare \2
Source: \1 Adjusted for labour costs.
C. Madhya Pradesh - Village Naganwat Choti: Crop Net Margin per Household and Area - WBR - Very Poor (2).
Khalif Rabi Total Khalif Rabi Total Khalif Rabi Total
613 - 613 5,040 4,400 9,440 4,428 4,400 8,828 120 - 120 1,440 675 2,115 1,320 675 1,995 733 - 733 6,480 5,075 11,555 5,748 5,075 10,823
418 - 418 1,615 2,574 4,189 1,197 2,574 3,771 315 - 315 4,865 2,501 7,366 4,551 2,501 7,052 26 - 26 30 27 57 4 27 31
12 - 12 162 94 130 1,138 94 231
410 - 410 1,225 1,313 2,538 815 1,313 2,128 828 - 828 2,840 3,887 6,727 2,012 3,887 5,899
(96) - (96) 3,640 1,189 4,829 3,736 1,189 4,924
3.0 - 3.0 3.0 3.0 6.0 - 3.0 3.0 100% 0% 100% 100% 100% 200% 0% #DIV/0! 100%
(32) - (32) 1,213 396 1,610 1,245 396 1,641 (159) - (159) 6,067 1,981 8,048 6,226 1,981 8,207
Study of Impact of WIRFP on Net Incomes of Target Households, Jan 2004.Gini Curve
Well Being Ranking - Very Poor (2)Before / Without Project After / With Project Increment

Table AN11.2.3
Item
Household Analysis:Crop Revenvue
CropResidue
Total Crop Revenue
Production CostsVariable Costs
Gross Margin (Financial)Labour Input (person days)
Return per Person Day (Rs/p/day)
Labour Costs (Economic)Total Productioon Costs
Net Margin (Economic) \1
Area planted (bigha)Cropping Intensity (percent)
Unit Area Analysis (Economic):Net Margin / bighaNet Margin / hectare \2
Source:
D. Madhya Pradesh - Village Naganwat Choti: Crop Net Margin per Household and Area - WBR - Poor (1).
Khalif Rabi Total Khalif Rabi Total Khalif Rabi Total
1,330 2,100 3,430 14,700 10,200 24,900 13,370 8,100 21,470 225 280 505 2,500 613 3,113 2,275 333 2,608
1,555 2,380 3,935 17,200 10,813 28,013 15,645 8,433 24,078
656 815 1,471 2,528 2,361 4,889 1,872 1,546 3,418 899 1,565 2,464 14,672 8,452 23,124 13,773 6,887 20,660 39 28 67 42 34 76 3 6 9
23 56 37 349 249 304 4,591 1,148 2,296
700 560 1,260 1,520 1,360 2,880 820 800 1,620 1,356 1,375 2,731 4,048 3,721 7,769 2,692 2,346 5,038
199 1,005 1,204 13,152 7,092 20,244 12,953 6,087 19,040
10.0 5.0 15.0 10.0 10.0 20.0 - 5.0 5.0 100% 50% 150% 100% 100% 200% 167%
20 201 221 1,315 709 2,024 1,295 508 1,803 100 1,005 1,105 6,576 3,546 10,122 6,477 2,541 9,017
Study of Impact of WIRFP on Net Incomes of Target Households, Jan 2004.
After / With Project IncrementBefore / Without ProjectWell Being Ranking - Poor (1)

Table AN11.2.3
Item
Household Analysis:Crop Revenvue
CropResidue
Total Crop Revenue
Production CostsVariable Costs
Gross Margin (Financial)Labour Input (person days)
Return per Person Day (Rs/p/day)
Labour Costs (Economic)Total Productioon Costs
Net Margin (Economic) \1
Area planted (bigha)Cropping Intensity (percent)
Unit Area Analysis (Economic):Net Margin / bighaNet Margin / hectare \2
Source:
E. Madhya Pradesh - Village Naganwat Choti: Crop Net Margin per Household and Area - WBR - Poor (2).
Khalif Rabi Total Khalif Rabi Total Khalif Rabi Total
1,750 750 2,500 8,680 5,625 14,305 6,930 4,875 11,805 300 75 375 1,500 400 1,900 1,200 325 1,525
2,050 825 2,875 10,180 6,025 16,205 8,130 5,200 13,330
758 255 1,013 2,220 1,166 3,386 1,463 911 2,374 1,293 570 1,863 7,960 4,859 12,819 6,668 4,289 10,957
32 13 45 34 19 53 2 6 8
40 44 41 234 256 242 3,334 715 1,370
520 260 780 840 570 1,410 320 310 630 1,278 515 1,793 3,060 1,736 4,796 1,783 1,221 3,004
773 310.0 1,083 7,120 4,289 11,409 6,348 3,979 10,327
5.0 1.0 6.0 5.0 3.0 8.0 - 2.0 2.0 100% 20% 120% 100% 60% 160% 67%
155 62 217 1,424 858 2,282 1,270 796 2,065 773 310 1,083 7,120 4,289 11,409 6,348 3,979 10,327
Study of Impact of WIRFP on Net Incomes of Target Households, Jan 2004.
Well Being Ranking - Poor (2)Before / Without Project After / With Project Increment
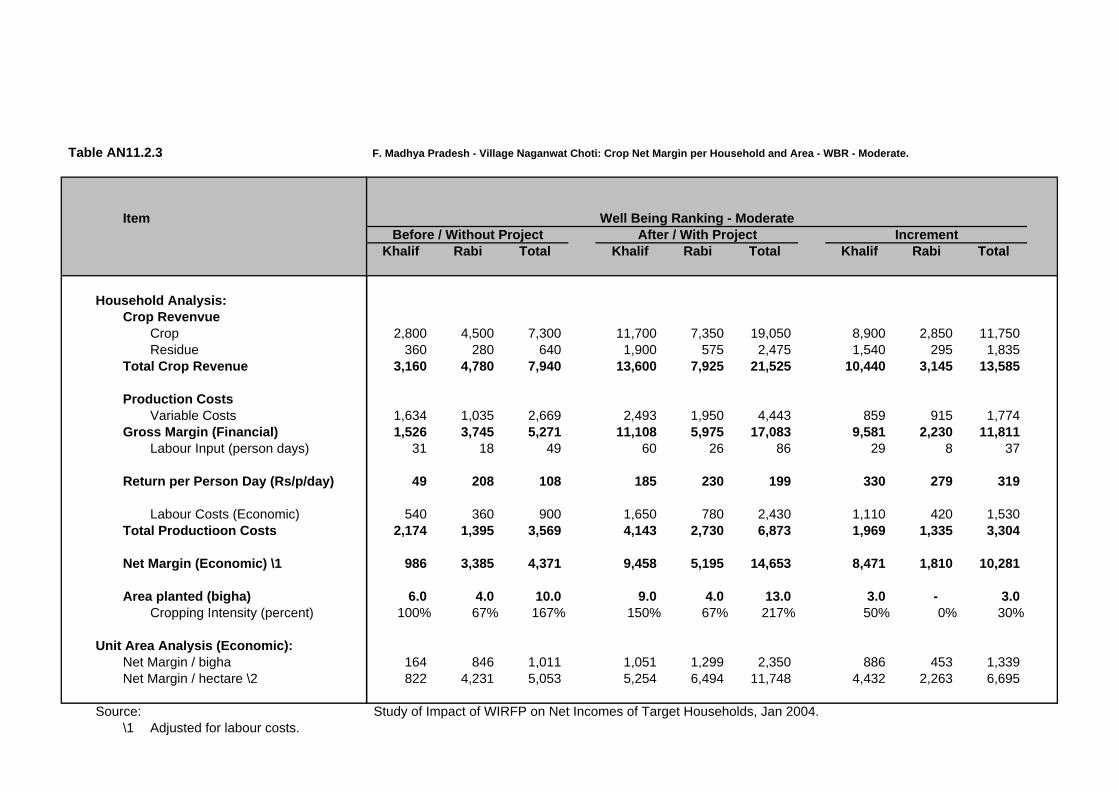
Table AN11.2.3
Item
Household Analysis:Crop Revenvue
CropResidue
Total Crop Revenue
Production CostsVariable Costs
Gross Margin (Financial)Labour Input (person days)
Return per Person Day (Rs/p/day)
Labour Costs (Economic)Total Productioon Costs
Net Margin (Economic) \1
Area planted (bigha)Cropping Intensity (percent)
Unit Area Analysis (Economic):Net Margin / bighaNet Margin / hectare \2
Source: \1 Adjusted for labour costs.
F. Madhya Pradesh - Village Naganwat Choti: Crop Net Margin per Household and Area - WBR - Moderate.
Khalif Rabi Total Khalif Rabi Total Khalif Rabi Total
2,800 4,500 7,300 11,700 7,350 19,050 8,900 2,850 11,750 360 280 640 1,900 575 2,475 1,540 295 1,835
3,160 4,780 7,940 13,600 7,925 21,525 10,440 3,145 13,585
1,634 1,035 2,669 2,493 1,950 4,443 859 915 1,774 1,526 3,745 5,271 11,108 5,975 17,083 9,581 2,230 11,811
31 18 49 60 26 86 29 8 37
49 208 108 185 230 199 330 279 319
540 360 900 1,650 780 2,430 1,110 420 1,530 2,174 1,395 3,569 4,143 2,730 6,873 1,969 1,335 3,304
986 3,385 4,371 9,458 5,195 14,653 8,471 1,810 10,281
6.0 4.0 10.0 9.0 4.0 13.0 3.0 - 3.0 100% 67% 167% 150% 67% 217% 50% 0% 30%
164 846 1,011 1,051 1,299 2,350 886 453 1,339 822 4,231 5,053 5,254 6,494 11,748 4,432 2,263 6,695
Study of Impact of WIRFP on Net Incomes of Target Households, Jan 2004.
Before / Without ProjectWell Being Ranking - Moderate
IncrementAfter / With Project

Table AN11.2.3
Item
Household Analysis:Crop Revenvue
CropResidue
Total Crop Revenue
Production CostsVariable Costs
Gross Margin (Financial)Labour Input (person days)
Return per Person Day (Rs/p/day)
Labour Costs (Economic)Total Productioon Costs
Net Margin (Economic) \1
Area planted (bigha)Cropping Intensity (percent)
Unit Area Analysis (Economic):Net Margin / bighaNet Margin / hectare \2
Source:
G. Madhya Pradesh - Village Naganwat Choti: Crop Net Margin per Household and Area - WBR - Better Off.
Khalif Rabi Total Khalif Rabi Total Khalif Rabi Total
5,520 2,000 7,520 12,150 11,900 24,050 6,630 9,900 16,530 570 220 790 - 2,800 2,800 (570) 2,580 2,010
6,090 2,220 8,310 12,150 14,700 26,850 6,060 12,480 18,540
2,452 763 3,215 4,885 3,540 8,425 2,433 2,777 5,210 3,638 1,457 5,095 7,265 11,160 18,425 3,627 9,703 13,330
51 26 77 57 32 89 6 6 12
71 56 66 127 349 207 605 1,617 1,111
860 520 1,380 2,350 1,600 3,950 1,490 1,080 2,570 3,312 1,283 4,595 7,235 5,140 12,375 3,923 3,857 7,780
2,778 937 3,715 4,915 9,560 14,475 2,137 8,623 10,760
5.0 3.0 8.0 5.0 5.0 10.0 - 2.0 2.0 100% 60% 160% 100% 100% 200% 67%
556 312 868 983 1,912 2,895 427 1,600 2,027 2,778 1,562 4,340 4,915 9,560 14,475 2,137 7,998 10,135
Study of Impact of WIRFP on Net Incomes of Target Households, Jan 2004.
IncrementWell Being Ranking - Better Off
Before / Without Project After / With Project

Table AN11.2.4 Madhya Pradesh - Village Naganwat Choti: Individual Household Detailed Data: WBR - Very Poor (1).
Unit Area Qty Price Value Area Qty Price Value Area Qty Price Value Area Qty Price Value
By Economic Class: VP1 Crop: Maize\Tuar Crop: Maize\Tuar Crop: Chick Pea Crop: Chick Pea
RevenueCrop CropA. Maize bigha 3 300 3.5 1,050 3 600 6.0 3,600 Chick Pea 2 100 15.0 1,500 3 300 15.0 4,500 B. Tuar bigha - 120 7.0 840 - 80 12.0 960 - - - - - - - - By product By productA. Maize Sum - 2.3 120 270 - 6.0 300 1,800 Chick Pea - 0.50 180 90 - 1.5 400 600 B. Tuar Sum - 1 90 90 - 1.8 200 350 - - - - - - - -
Total Revenue 2,250 6,710 1,590 5,100
Variable CostsSeedA. Maize kg 10 3.5 35 10 6.0 60 - - - - - - B. Tuar kg 2 3.0 6 2 10.0 20 - - - - - - C. Chick Pea kg - - - - - - 30 10.0 300 40 18.0 720 D. kg - - - - - - - - - - - - FertiliserA. Urea kg - - - 50 5.0 250 - - - - - - B. DAP kg - - - - - - - - - - - - C. FYM Load 1 150.0 150 1 400.0 400 - - - - - - Pesticide kg 5 4.0 20 10 13.0 130 - - - 3 12.0 36 Irrigation Rounds - - - - - - - - - 2 200.0 400 Subtotal 211 860 300 1,156
Draught Days 3 80.0 240 3 200.0 600 4 80.0 320 4 200.0 800 Repairs Sum 1 15.0 15 1 35.0 35 1 15.0 15 1 35.0 35 Thrashing Rate - - - - - - - - - 1 60.0 60 Storage Sum 1 6.0 6 1 12.0 12 - - - - - - Transport Sum - - - - - - - - - 1 10.0 10 Credit Rs 500 60% 300 - - - - - - - - -
Total Variable Costs 772 1,507 635 2,061
Labour Costs P/daysLand Prep 4 20 80 4 50 200 7 20 140 7 50 350 Sowing 4 20 80 4 50 200 4 20 80 4 50 200 Weeding 13 10 130 13 25 325 - - - - - - Fert App - - - 1 25 25 - - - - - - Pest App 1 20 20 1 50 50 - - - 1 50 50 Irrigation - - - - - - - - - 1 50 50 Harvest 5 20 100 4 50 200 4 20 80 4 35 140 Storage 5 20 100 2 55 110 6 20 120 2 50 100
Total Labour Costs 32 510 29 1,110 21 420 19 890
Total Production Costs 1,282 2,617 1,055 2,951
Net Margin / Household (Economic) 968 4,093 535 2,149
Return per Person Day (Financial) 46 179 45 160
Source: Study of Impact of WIRFP on Net Incomes of Target Households, Jan 2004.Economic class VP = Very poor, P = Poor, M = Moderate, BO = Better off.
Kharif: Rabi:With projectWithout project Without Project With Project

Table AN11.2.5 Madhya Pradesh - Village Naganwat Choti: Individual Household Detailed Data: WBR - Very Poor (2).
Unit Area Qty Price Value Area Qty Price Value Area Qty Price Value Area Qty Price Value
BY ECONOMIC CLASS: VP2 Crop: Maize Crop: Maize Crop: Crop: Chick PeaTuar Wheat
RevenueCrop Crop
A. Maize bigha 3 175 3.5 613 2 600 6.0 3600 Chick Pea 0 1.5 200 15.0 3,000 B. Tuar bigha 0 0 1 120 12.0 1440 Wheat 0 1.5 200 7.0 1,400
By product By productA. Maize Sum 1 120 120 3.0 400 1200 Chick Pea 0 0.75 400 300 B. Tuar um 0 1.2 200 240 Wheat 0 1.5 250 375
Total Revenue 733 6480 0 5,075
Variable CostsSeed
A. Maize kg 10 3.5 35 10 6.0 60 Chick Pea 0 30 18 540 B. Tuar kg 0 0 2 10.0 20 Wheat 0 15 10 150
FertiliserA. Urea kg 0 0 50 5.0 250 0 20 5 100 B. DAP kg 0 0 5 10 50 C. FYM Load 0 0 1 400.0 400 0 0 -
Pesticide kg 0 0 20 12.0 240 0 2 12 24 Irrigation Rounds 0 0 0 0.0 0 0 4 250 1,000 Storage Sum 1 8 8 1 10.0 10 0 1 9 9 Transport Sum 0 0 0 1 6 6 Subtotal 43 980 0 1,879
Draught Days 6 60 360 6 100.0 600 0 6 100 600 Repairs Sum 1 15 15 1 35.0 35 0 1 35 35 Thrashing Rate 0 4 15.0 60
Total Variable Costs 418 1615 0 2,574
Labour Costs P/daysLand Prep 5 20 100 6 50.0 300 0 11 50 550 Sowing 4 20 80 4 50.0 200 0 4 50 200 Weeding 11 10 110 10 25.0 250 0 0 - Fert App 0 0 0 1 50.0 50 0 1 50 50 Pest App 0 0 0 1 25.0 25 0 0.5 25 13 Irrigation 0 0 0 0 0.0 0 0 4 50 200 Harvest 4 20 80 4 50.0 200 0 4 50 200 Storage 2 20 40 4 50.0 200 0 2 50 100
Total Labour Costs 26 410 30 1225 0 26.5 1,313
Total Production Costs 828 2840 0 3,887
Net Margin / Household (Economic) -96 3640 0 1,189
Return per Person Day (Financial) 12 162 94
Source: Study of Impact of WIRFP on Net Incomes of Target Households, Jan 2004.Economic class VP = Very poor, P = Poor, M = Moderate, BO = Better off.
Kharif: Rabi:With projectWithout project Without Project With Project
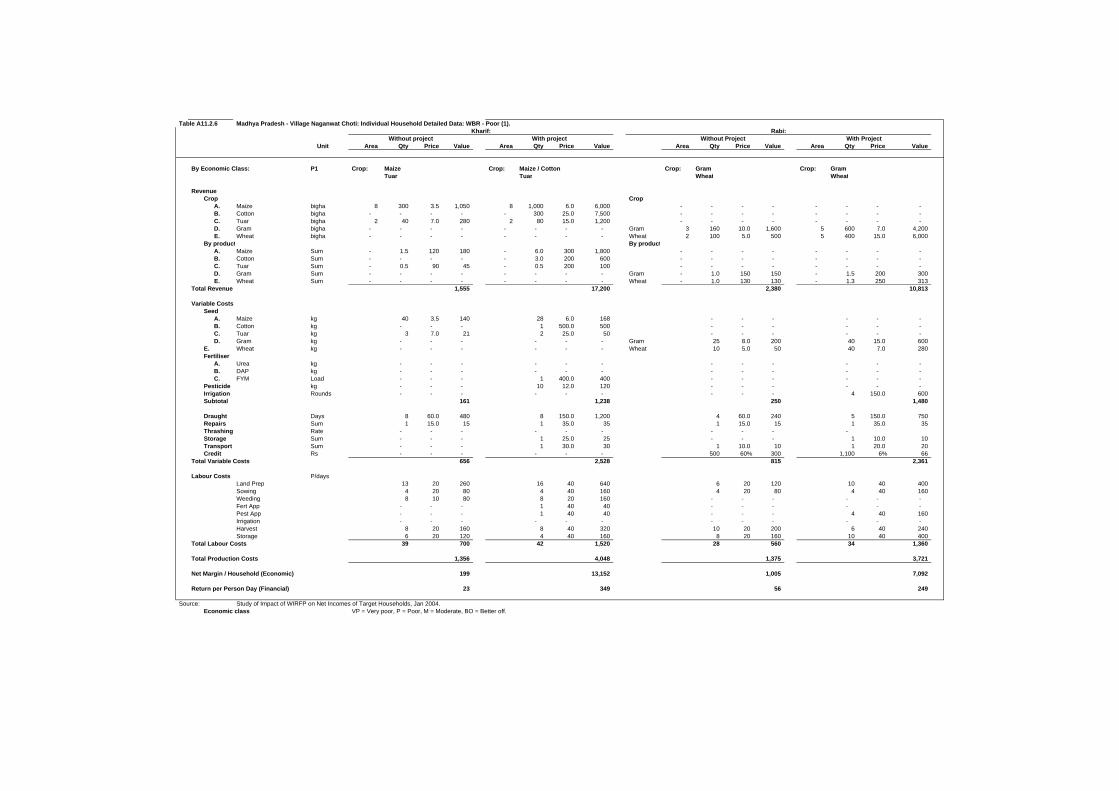
Table A11.2.6 Madhya Pradesh - Village Naganwat Choti: Individual Household Detailed Data: WBR - Poor (1).
Unit Area Qty Price Value Area Qty Price Value Area Qty Price Value Area Qty Price Value
By Economic Class: P1 Crop: Maize Crop: Maize / Cotton Crop: Gram Crop: GramTuar Tuar Wheat Wheat
RevenueCrop Crop
A. Maize bigha 8 300 3.5 1,050 8 1,000 6.0 6,000 - - - - - - - - B. Cotton bigha - - - - - 300 25.0 7,500 - - - - - - - - C. Tuar bigha 2 40 7.0 280 2 80 15.0 1,200 - - - - - - - - D. Gram bigha - - - - - - - - Gram 3 160 10.0 1,600 5 600 7.0 4,200 E. Wheat bigha - - - - - - - - Wheat 2 100 5.0 500 5 400 15.0 6,000
By product By productA. Maize Sum - 1.5 120 180 - 6.0 300 1,800 - - - - - - - - B. Cotton Sum - - - - - 3.0 200 600 - - - - - - - - C. Tuar Sum - 0.5 90 45 - 0.5 200 100 - - - - - - - - D. Gram Sum - - - - - - - - Gram - 1.0 150 150 - 1.5 200 300 E. Wheat Sum - - - - - - - - Wheat - 1.0 130 130 - 1.3 250 313
Total Revenue 1,555 17,200 2,380 10,813
Variable CostsSeed
A. Maize kg 40 3.5 140 28 6.0 168 - - - - - - B. Cotton kg - - - 1 500.0 500 - - - - - - C. Tuar kg 3 7.0 21 2 25.0 50 - - - - - - D. Gram kg - - - - - - Gram 25 8.0 200 40 15.0 600
E. Wheat kg - - - - - - Wheat 10 5.0 50 40 7.0 280 Fertiliser
A. Urea kg - - - - - - - - - - - - B. DAP kg - - - - - - - - - - - - C. FYM Load - - - 1 400.0 400 - - - - - -
Pesticide kg - - - 10 12.0 120 - - - - - - Irrigation Rounds - - - - - - - - - 4 150.0 600 Subtotal 161 1,238 250 1,480
Draught Days 8 60.0 480 8 150.0 1,200 4 60.0 240 5 150.0 750 Repairs Sum 1 15.0 15 1 35.0 35 1 15.0 15 1 35.0 35 Thrashing Rate - - - - - - - - - - Storage Sum - - - 1 25.0 25 - - - 1 10.0 10 Transport Sum - - - 1 30.0 30 1 10.0 10 1 20.0 20 Credit Rs - - - - - - 500 60% 300 1,100 6% 66
Total Variable Costs 656 2,528 815 2,361
Labour Costs P/daysLand Prep 13 20 260 16 40 640 6 20 120 10 40 400 Sowing 4 20 80 4 40 160 4 20 80 4 40 160 Weeding 8 10 80 8 20 160 - - - - - - Fert App - - - 1 40 40 - - - - - - Pest App - - - 1 40 40 - - - 4 40 160 Irrigation - - - - - - - - - - - - Harvest 8 20 160 8 40 320 10 20 200 6 40 240 Storage 6 20 120 4 40 160 8 20 160 10 40 400
Total Labour Costs 39 700 42 1,520 28 560 34 1,360
Total Production Costs 1,356 4,048 1,375 3,721
Net Margin / Household (Economic) 199 13,152 1,005 7,092
Return per Person Day (Financial) 23 349 56 249
Source: Study of Impact of WIRFP on Net Incomes of Target Households, Jan 2004.Economic class VP = Very poor, P = Poor, M = Moderate, BO = Better off.
Kharif: Rabi:With projectWithout project Without Project With Project

Table A11.2.7 Madhya Pradesh - Village Naganwat Choti: Individual Household Detailed Data: WBR - Poor (2).
Unit Area Qty Price Value Area Qty Price Value Area Qty Price Value Area Qty Price Value
By Economic Class: P2 Crop: Maize Crop: Maize\Cotton\Tuar Crop: Gram Crop: Gram
RevenueCrop Crop
A. Maize bigha 5 500 3.5 1,750 5 800 6.0 4,800 Gram 1 75 10.0 750 3 375 15.0 5,625 B. Cotton bigha - - - - - 120 25.0 3,000 - - - - - - - - C. Tuar bigha - - - - - 100 8.8 880 - - - - - - - -
By product By productA. Maize Sum - 2.5 120 300 - 4.0 300 1,200 Gram - 0.5 150 75 - 2.0 200 400 B. Cotton Sum - - - - - 1.0 200 200 - - - - - - - - C. Tuar Sum - - - - - 0.5 200 100 - - - - - - - -
Total Revenue 2,050 10,180 825 6,025
Variable CostsSeed
A. Maize kg 15 3.5 53 15 6.0 90 Gram 10 8.0 80 40 15.0 600 B. Cotton kg - - - 25 10.0 250 - - - - - - C. Tuar kg - - - 1 10.0 10 - - - - - - D. Urad kg - - - - - - - - - - - -
FertiliserA. Urea kg - - - 50 5.0 250 - - - - - - B. DAP kg - - - - - - - - - - - - C. FYM Load 3 150.0 450 2 400.0 800 - - - - - -
Pesticide kg - - - 10 16.0 160 - - - - - - Irrigation Rounds - - - - - - - - - 1 125.0 125 Subtotal 503 1,560 80 725
Draught Days 3 80.0 240 3 200.0 600 2 80.0 160 2 200.0 400 Repairs Sum 1 15.0 15 1 35.0 35 1 15.0 15 1 35.0 35 Thrashing Rate - - - - - - - - - - Storage Sum - - - 1 25.0 25 - - - - - - Transport Sum - - - - - - - - - 1 6.0 6 Credit Rs - - - - - - - - - - - -
Total Variable Costs 758 2,220 255 1,166
Labour Costs P/daysLand Prep 4 20 80 4 30 120 4 20 80 2 30 60 Sowing 2 20 40 4 30 120 1 20 20 4 30 120 Weeding 12 10 120 12 15 180 - - - - - - Fert App 2 20 40 2 30 60 - - - - - - Pest App - - - - - - - - - - - - Irrigation - - - - - - - - - 1 30 30 Harvest 8 20 160 8 30 240 6 20 120 8 30 240 Storage 4 20 80 4 30 120 2 20 40 4 30 120
Total Labour Costs 32 520 34 840 13 260 19 570
Total Production Costs 1,278 3,060 515 1,736
Gross Margin / Household (Economic) 773 7,120 310 4,289
Return per Person Day (Financial) 40 234 44 256
Source: Study of Impact of WIRFP on Net Incomes of Target Households, Jan 2004.Economic class VP = Very poor, P = Poor, M = Moderate, BO = Better off.
Kharif: Rabi:With projectWithout project Without Project With Project

Table A11.2.8 Madhya Pradesh - Village Naganwat Choti: Individual Household Detailed Data: WBR - Moderate.
Unit Area Qty Price Value Area Qty Price Value Area Qty Price Value Area Qty Price Value
BY INCOME CLASS: M Crop: Maize Crop: Maize Crop: Gram Crop: Gram Tuar Wheat Wheat
RevenueCrop Crop
A. Maize bigha 6 800 3.5 2,800 4 1,200 6.0 7,200 Gram 3 400 10.0 4,000 1 200 12.3 2,450 B. Tuar bigha - - - - 5 300 15.0 4,500 Wheat 1 100 5.0 500 3 700 7.0 4,900 C. bigha - - - - - - - - - - - - - - - - D. bigha - - - - - - - - - - - - - - - -
By product By productA. Maize Sum - 3 120 360 - 5 300 1,500 Gram - 1 150 150 - 1.0 200 200 B. Tuar Sum - - - - - 2 200 400 Wheat - 1 130 130 - 1.5 250 375 C. - Sum - - - - - - - - - - - - - - - - D. - Sum - - - - - - - - - - - - - - - -
Total Revenue 3,160 13,600 4,780 7,925
Variable CostsSeed
A. Maize kg 20 3.5 70 25 12.0 300 Gram 45 8 360 20 16 320 B. Tuar kg - - - 5 10.0 50 Wheat 20 5 100 40 7 280 C. kg - - - - - - - - - - - - D. kg - - - - - - - - - - - -
FertiliserA. Urea kg 50 3.0 150 100 5.0 500 - - - 50 5 250 B. DAP kg - - - - - - - - - - - - C. FYM Load 2 150.0 300 2 400.0 800 - - - - - -
Pesticide kg - - - 15 10.0 150 - - - - - - Irrigation Rounds - - - - - - - - - 2 200 400 Subtotal 520 1,800 460 1,250
Draught Days 6 80.0 480 3 200.0 600 2 80 160 2 200 400 Repairs Sum 1 15.0 15 1 35.0 35 1 15 15 1 35 35 Thrashing Rate - - - - - - - - - 35 7 245 Storage Sum 1 18.8 19 1 37.5 38 - - - 1 10 10 Transport Sum - - - 1 20.0 20 - - - 1 10 10 Credit Rs 1,000 60% 600 - - - 1,000 40% 400 - - -
Total Variable Costs 1,634 2,493 1,035 1,950
Labour Costs P/daysLand Prep 6 20 120 12 30 360 4 20 80 4 30 120 Sowing 4 20 80 6 30 180 2 20 40 4 30 120 Weeding 8 10 80 10 15 150 - - - - - - Fert App 1 20 20 2 30 60 - - - 2 30 60 Pest App - - - 2 30 60 - - - - - - Irrigation - - - - - - - - - 2 30 60 Harvest 8 20 160 20 30 600 8 20 160 10 30 300 Storage 4 20 80 8 30 240 4 20 80 4 30 120
Total Labour Costs 31 540 60 1,650 18 360 26 780
Total Production Cost 2,174 4,143 1,395 2,730
Net Margin / Household (Economic) 986 9,458 3,385 5,195
Return per Person Day (Financial) 49 185 208 230
Source: Study of Impact of WIRFP on Net Incomes of Target Households, Jan 2004.Economic class VP = Very poor, P = Poor, M = Moderate, BO = Better off.
Rabi:Kharif:With projectWithout project Without Project With Project
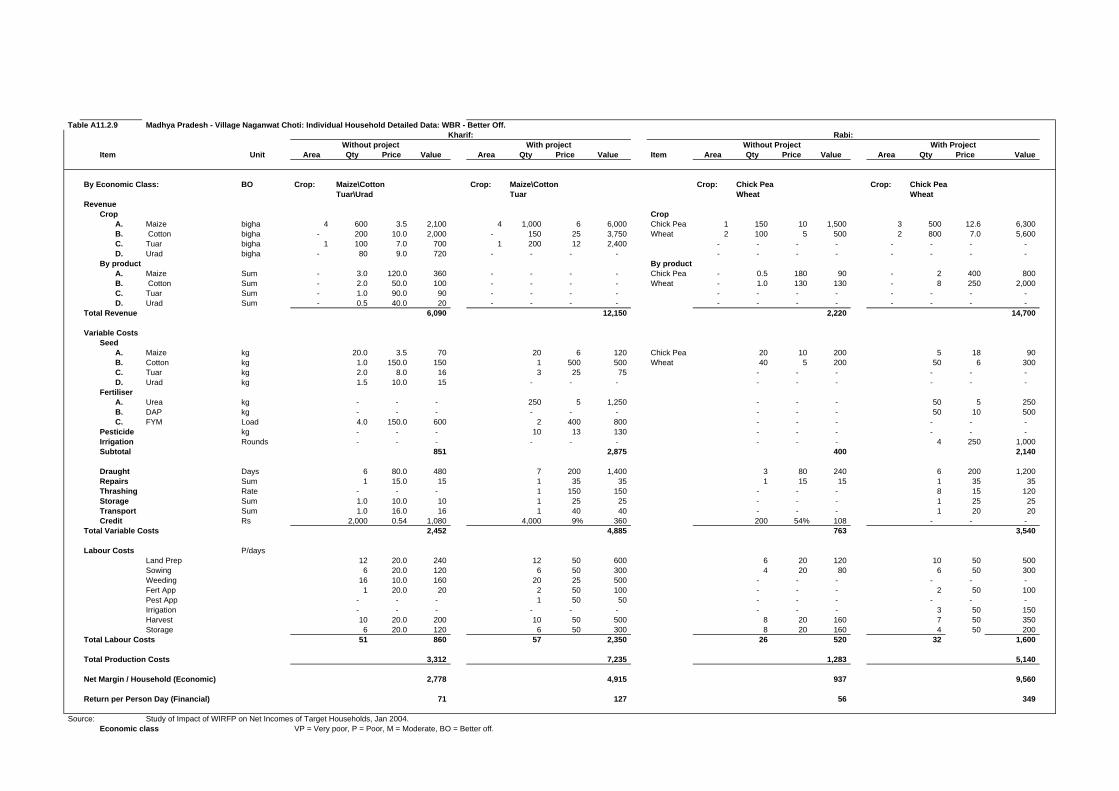
Table A11.2.9 Madhya Pradesh - Village Naganwat Choti: Individual Household Detailed Data: WBR - Better Off.
Item Unit Area Qty Price Value Area Qty Price Value Item Area Qty Price Value Area Qty Price Value
By Economic Class: BO Crop: Maize\Cotton Crop: Maize\Cotton Crop: Chick Pea Crop: Chick PeaTuar\Urad Tuar Wheat Wheat
RevenueCrop Crop
A. Maize bigha 4 600 3.5 2,100 4 1,000 6 6,000 Chick Pea 1 150 10 1,500 3 500 12.6 6,300 B. Cotton bigha - 200 10.0 2,000 - 150 25 3,750 Wheat 2 100 5 500 2 800 7.0 5,600 C. Tuar bigha 1 100 7.0 700 1 200 12 2,400 - - - - - - - - D. Urad bigha - 80 9.0 720 - - - - - - - - - - - -
By product By productA. Maize Sum - 3.0 120.0 360 - - - - Chick Pea - 0.5 180 90 - 2 400 800 B. Cotton Sum - 2.0 50.0 100 - - - - Wheat - 1.0 130 130 - 8 250 2,000 C. Tuar Sum - 1.0 90.0 90 - - - - - - - - - - - - D. Urad Sum - 0.5 40.0 20 - - - - - - - - - - - -
Total Revenue 6,090 12,150 2,220 14,700
Variable CostsSeed
A. Maize kg 20.0 3.5 70 20 6 120 Chick Pea 20 10 200 5 18 90 B. Cotton kg 1.0 150.0 150 1 500 500 Wheat 40 5 200 50 6 300 C. Tuar kg 2.0 8.0 16 3 25 75 - - - - - - D. Urad kg 1.5 10.0 15 - - - - - - - - -
FertiliserA. Urea kg - - - 250 5 1,250 - - - 50 5 250 B. DAP kg - - - - - - - - - 50 10 500 C. FYM Load 4.0 150.0 600 2 400 800 - - - - - -
Pesticide kg - - - 10 13 130 - - - - - - Irrigation Rounds - - - - - - - - - 4 250 1,000 Subtotal 851 2,875 400 2,140
Draught Days 6 80.0 480 7 200 1,400 3 80 240 6 200 1,200 Repairs Sum 1 15.0 15 1 35 35 1 15 15 1 35 35 Thrashing Rate - - - 1 150 150 - - - 8 15 120 Storage Sum 1.0 10.0 10 1 25 25 - - - 1 25 25 Transport Sum 1.0 16.0 16 1 40 40 - - - 1 20 20 Credit Rs 2,000 0.54 1,080 4,000 9% 360 200 54% 108 - - -
Total Variable Costs 2,452 4,885 763 3,540
Labour Costs P/daysLand Prep 12 20.0 240 12 50 600 6 20 120 10 50 500 Sowing 6 20.0 120 6 50 300 4 20 80 6 50 300 Weeding 16 10.0 160 20 25 500 - - - - - - Fert App 1 20.0 20 2 50 100 - - - 2 50 100 Pest App - - - 1 50 50 - - - - - - Irrigation - - - - - - - - - 3 50 150 Harvest 10 20.0 200 10 50 500 8 20 160 7 50 350 Storage 6 20.0 120 6 50 300 8 20 160 4 50 200
Total Labour Costs 51 860 57 2,350 26 520 32 1,600
Total Production Costs 3,312 7,235 1,283 5,140
Net Margin / Household (Economic) 2,778 4,915 937 9,560
Return per Person Day (Financial) 71 127 56 349
Source: Study of Impact of WIRFP on Net Incomes of Target Households, Jan 2004.Economic class VP = Very poor, P = Poor, M = Moderate, BO = Better off.
Kharif: Rabi:With projectWithout project Without Project With Project

Table A11.2.10 Madhya Pradesh - Village Naganwat Choti: Individual Household Livestock Detailed Data: WBR - Very Poor (1).
Item Units PeriodQuantity Unit Price Value Quantity Unit Price Value
(No) (Rs) (Rs/Period) (No) (Rs) (Rs/Period)
Livestock Asset ValueCow
Male head 2 400.0 800 2 1,500.0 3,000 Female head - - - 1 1,200.0 1,200 Losses head - - - - - -
BuffaloMale head - - - - - - Female head - - - - - - Losses head - - - - - -
GoatMale head - - - - - - Female head 1 200.0 200 - - - Losses head - - - 2 800.0 1,600
PoultryNot Specified head 2 80.0 160 1 100.0 100 Losses head - - - - - -
Total Livestock Assets 1,160 5,900
Annual Increase in Livestock Assets year 5 - 948
Sales IncomeCow and Buffalo
Milk litres year - - - 90 14.0 1,260 Dung cart year 1.0 100.0 100 1 400.0 400 Draught days year 7 80.0 560 7 200.0 1,400 Transport days year - - - - - - Sales no year - - - - - -
GoatMilk litres year - - - 15 8.0 120 Dung sum year - - - - - - Other - - - - - - - - Sales no year - - - - - -
PoultrySales no year - - - 10 3.0 30 Other - - - - - 12 50.0 600
Total Sales Income 660 3,810
ExpenditureDirect CostsCow and Buffalo
Feeding (grazing) sum year - - - - - - Feeding (roughage) sum year 1.0 360.0 360 1.0 2,400.0 2,400 Feeding (concentrate) sum year 1.0 120.0 120 1.0 420.0 420 Vet and Med sum year 1.0 120.0 120 1.0 100.0 100 Other sum year 1.0 20.0 20 1.0 60.0 60
GoatFeeding sum year - - - - - - Vet and Med sum year - - - - - - Other sum year - - - - - -
PoultryOther sum year 1.0 110.0 110 1.0 60.0 60
Total Direct Costs 730 3,040
Overhead CostsEquipment repairs sum year - - - - - - Total Overhead Costs - -
Total Expenditure 730 3,040
Net Margin (70) 770
Family Labour Input Days Month - - - - - -
Return to Family Labour
Combined Net Margin and Asset Increase (70) 1,718
Source: Study of Impact of WIRFP on Net Incomes of Target Households, Jan 2004.
Before / Without Project Situation After / With Project Situation
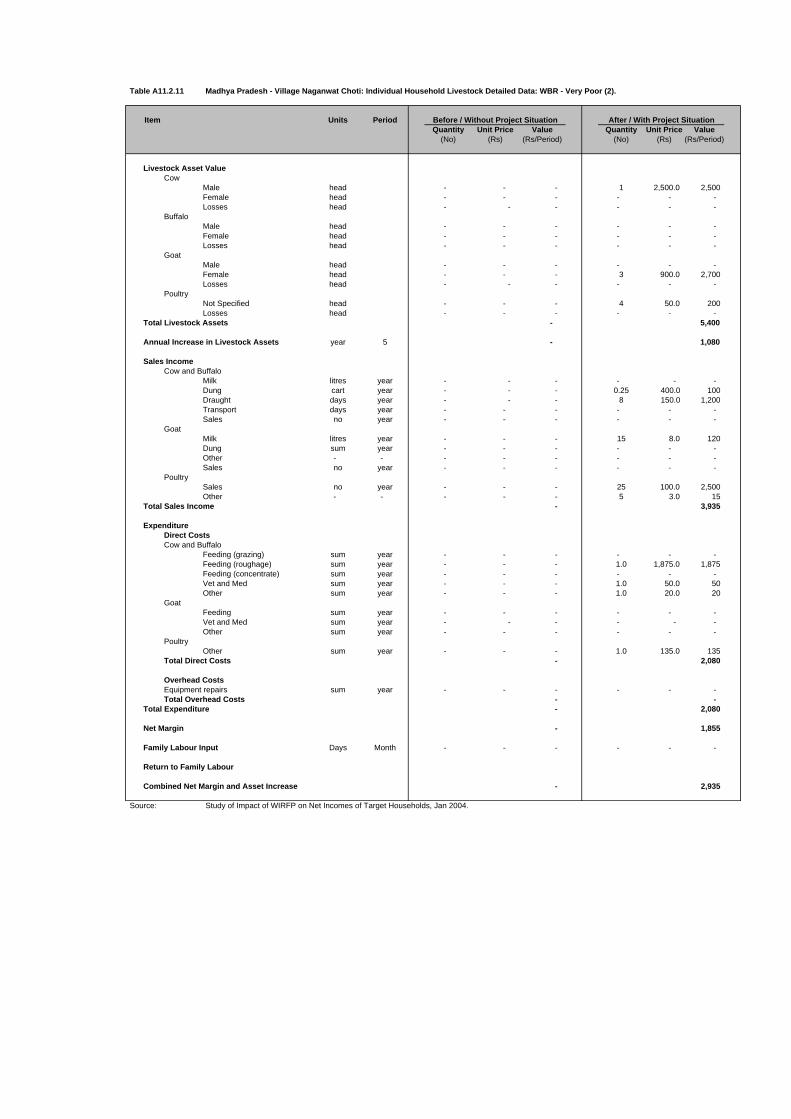
Table A11.2.11 Madhya Pradesh - Village Naganwat Choti: Individual Household Livestock Detailed Data: WBR - Very Poor (2).
Item Units PeriodQuantity Unit Price Value Quantity Unit Price Value
(No) (Rs) (Rs/Period) (No) (Rs) (Rs/Period)
Livestock Asset ValueCow
Male head - - - 1 2,500.0 2,500 Female head - - - - - - Losses head - - - - - -
BuffaloMale head - - - - - - Female head - - - - - - Losses head - - - - - -
GoatMale head - - - - - - Female head - - - 3 900.0 2,700 Losses head - - - - - -
PoultryNot Specified head - - - 4 50.0 200 Losses head - - - - - -
Total Livestock Assets - 5,400
Annual Increase in Livestock Assets year 5 - 1,080
Sales IncomeCow and Buffalo
Milk litres year - - - - - - Dung cart year - - - 0.25 400.0 100 Draught days year - - - 8 150.0 1,200 Transport days year - - - - - - Sales no year - - - - - -
GoatMilk litres year - - - 15 8.0 120 Dung sum year - - - - - - Other - - - - - - - - Sales no year - - - - - -
PoultrySales no year - - - 25 100.0 2,500 Other - - - - - 5 3.0 15
Total Sales Income - 3,935
ExpenditureDirect CostsCow and Buffalo
Feeding (grazing) sum year - - - - - - Feeding (roughage) sum year - - - 1.0 1,875.0 1,875 Feeding (concentrate) sum year - - - - - - Vet and Med sum year - - - 1.0 50.0 50 Other sum year - - - 1.0 20.0 20
GoatFeeding sum year - - - - - - Vet and Med sum year - - - - - - Other sum year - - - - - -
PoultryOther sum year - - - 1.0 135.0 135
Total Direct Costs - 2,080
Overhead CostsEquipment repairs sum year - - - - - - Total Overhead Costs - -
Total Expenditure - 2,080
Net Margin - 1,855
Family Labour Input Days Month - - - - - -
Return to Family Labour
Combined Net Margin and Asset Increase - 2,935
Source: Study of Impact of WIRFP on Net Incomes of Target Households, Jan 2004.
Before / Without Project Situation After / With Project Situation

Table A11.1.12 Madhya Pradesh - Village Naganwat Choti: Individual Household Livestock Detailed Data: WBR - Very Poor (1)
Item Units PeriodQuantity Unit Price Value Quantity Unit Price Value
(No) (Rs) (Rs/Period) (No) (Rs) (Rs/Period)
Livestock Asset ValueCow
Male head - - - - - - Female head - - - 2 2,500.0 5,000 Losses head - - - - - -
BuffaloMale head - - - - - - Female head - - - - - - Losses head - - - - - -
GoatMale head - - - - - - Female head - - - - - - Losses head - - - - - -
Poultry
Not Specified head - - - 6 150.0 900 Losses head - - - - - -
Total Livestock Assets - 5,900
Annual Increase in Livestock Assets year 5 - 1,180
Sales IncomeCow and Buffalo
Milk litres year - - - 240 14.0 3,360 Dung cart year - - - 1 400.0 400 Draught days year - - - - - - Transport days year - - - - - - Sales no year - - - - - -
GoatMilk litres year - - - - - - Dung sum year - - - - - - Other - - - - - - - - Sales no year - - - - - -
PoultrySales no year - - - 90 3.0 270 Other - - - - - 20 50.0 1,000
Total Sales Income - 5,030
ExpenditureDirect CostsCow and Buffalo
Feeding (grazing) sum year - - - - - - Feeding (roughage) sum year - - - 1.0 2,113.0 2,113 Feeding (concentrate) sum year - - - - - - Vet and Med sum year - - - 1.0 100.0 100 Other sum year - - - 1.0 20.0 20
GoatFeeding sum year - - - - - - Vet and Med sum year - - - - - - Other sum year - - - - - -
PoultryOther sum year - - - 6.0 45.0 270
Total Direct Costs - 2,503
Overhead CostsEquipment repairs sum year - - - - - - Total Overhead Costs - -
Total Expenditure - 2,503
Net Margin - 2,527
Family Labour Input Days Month - - - - - -
Return to Family Labour
Combined Net Margin and Asset Increase - 3,707
Source: Study of Impact of WIRFP on Net Incomes of Target Households, Jan 2004.
Before / Without Project Situation After / With Project Situation

Table A11.2.13 Madhya Pradesh - Village Naganwat Choti: Individual Household Livestock Detailed Data: WBR - Poor (2).
Item Units PeriodQuantity Unit Price Value Quantity Unit Price Value
(No) (Rs) (Rs/Period) (No) (Rs) (Rs/Period)
Livestock Asset ValueCow
Male head 2 700.0 1,400 2 2,500.0 5,000 Female head 5 500.0 2,500 3 1,800.0 5,400 Losses head - - - - - -
BuffaloMale head - - - - - - Female head - - - - - - Losses head - - - - - -
GoatMale head - - - - - - Female head 3 200.0 600 - - - Losses head - - - - - -
PoultryNot Specified head 5 40.0 200 2 100.0 200 Losses head - - - - - -
Total Livestock Assets 4,700 10,600
Annual Increase in Livestock Assets year 5 - 1,180
Sales IncomeCow and Buffalo
Milk litres year 200 6.0 1,200 180 14.0 2,520 Dung cart year 3.0 150.0 450 2 400.0 800 Draught days year 5 80.0 400 10 100.0 1,000 Transport days year - - - - - - Sales no year - - - - - -
GoatMilk litres year - - - - - - Dung sum year - - - - - - Other - - - - - - - - Sales no year - - - - - -
PoultrySales no year 40 20.0 800 30 50.0 1,500 Other - - - - - - - -
Total Sales Income 2,850 5,820
ExpenditureDirect CostsCow and Buffalo
Feeding (grazing) sum year - - - - - - Feeding (roughage) sum year 1.0 375.0 375 1.0 1,300.0 1,300 Feeding (concentrate) sum year 30.0 4.0 120 1.0 210.0 210 Vet and Med sum year - - - 1.0 100.0 100 Other sum year - - - - - -
GoatFeeding sum year - - - - - - Vet and Med sum year - - - - - - Other sum year - - - - - -
PoultryOther sum year 1.0 90.0 90 1.0 55.0 55
Total Direct Costs 585 1,665
Overhead CostsEquipment repairs sum year - - - - - - Total Overhead Costs - -
Total Expenditure 585 1,665
Net Margin 2,265 4,155
Family Labour Input Days Month - - - - - -
Return to Family Labour
Combined Net Margin and Asset Increase 2,265 5,335
Source: Study of Impact of WIRFP on Net Incomes of Target Households, Jan 2004.
Before / Without Project Situation After / With Project Situation

Table A11.2.14 Madhya Pradesh - Village Naganwat Choti: Individual Household Livestock Detailed Data: WBR - Moderate.
Item Units PeriodQuantity Unit Price Value Quantity Unit Price Value
(No) (Rs) (Rs/Period) (No) (Rs) (Rs/Period)
Livestock Asset ValueCow
Male head 2 2,500.0 5,000 - - - Female head 1 2,000.0 2,000 - - - Losses head - - - - - -
BuffaloMale head - - - - - - Female head 1 5,000.0 5,000 - - - Losses head - - - - - -
GoatMale head 2 300.0 600 2 400.0 800 Female head 7 200.0 1,400 3 300.0 900 Losses head - - - - - -
PoultryNot Specified head 7 100.0 700 2 100.0 200 Losses head - - - - - -
Total Livestock Assets 14,700 1,900
Annual Increase in Livestock Assets year 5 - (2,560)
Sales IncomeCow and Buffalo
Milk litres year 180 8.0 1,440 - - - Dung cart year 2 150.0 300 - - - Draught days year 20 100.0 2,000 - - - Transport days year - - - - - - Sales no year - - - - - -
GoatMilk litres year - - - - - - Dung sum year - - - - - - Other - - - - - - - - Sales no year 5 200.0 1,000 3 400.0 1,200
PoultrySales no year 2 60.0 120 2 150.0 300 Other - - 75 40.0 3,000 25 100.0 2,500
Total Sales Income 7,860 4,000
ExpenditureDirect CostsCow and Buffalo
Feeding (grazing) sum year - - - - - - Feeding (roughage) sum year 1.0 640.0 640 - - - Feeding (concentrate) sum year - - - - - - Vet and Med sum year 1.0 60.0 60 - - - Other sum year 1.0 30.0 30 - - -
GoatFeeding sum year - - - - - - Vet and Med sum year - - - 1.0 200.0 200 Other sum year - - - - - -
PoultryOther sum year 1.0 100.0 100 1.0 80.0 80
Total Direct Costs 830 280
Overhead CostsEquipment repairs sum year - - - - - - Total Overhead Costs - -
Total Expenditure 830 280
Net Margin 7,030 3,720
Family Labour Input Days Month - - - - - -
Return to Family Labour
Combined Net Margin and Asset Increase 7,030 1,160
Source: Study of Impact of WIRFP on Net Incomes of Target Households, Jan 2004.
Before / Without Project Situation After / With Project Situation

Table A11.2.15 Madhya Pradesh - Village Naganwat Choti: Individual Household Livestock Detailed Data: WBR - Better Off.
Item Units PeriodQuantity Unit Price Value Quantity Unit Price Value
(No) (Rs) (Rs/Period) (No) (Rs) (Rs/Period)
Livestock Asset ValueCow
Male head 2 1,000.0 2,000 2 3,000.0 6,000 Female head 7 800.0 5,600 2 2,000.0 4,000 Losses head - - - - - -
BuffaloMale head - - - - - - Female head - - - - - - Losses head - - - - - -
GoatMale head - - - 1 700.0 700 Female head 15 500.0 7,500 5 600.0 3,000 Losses head - - - - - -
PoultryNot Specified head 4 120.0 480 6 150.0 900 Losses head - - - - - -
Total Livestock Assets 15,580 14,600
Annual Increase in Livestock Assets year 5 - (196)
Sales IncomeCow and Buffalo
Milk litres year 180 6.0 1,080 180 12.0 2,160 Dung cart year 4.0 150.0 600 2 400.0 800 Draught days year 9 80.0 720 13 200.0 2,600 Transport days year - - - - - - Sales no year - - - - - -
GoatMilk litres year 80 4.0 320 90 4.0 360 Dung sum year - - - - - - Other - - - - - - - - Sales no year 2 200.0 400 - - -
PoultrySales no year 90 30.0 2,700 135 100.0 13,500 Other - - - - - - - -
Total Sales Income 5,820 19,420
ExpenditureDirect CostsCow and Buffalo
Feeding (grazing) sum year - - - - - - Feeding (roughage) sum year 1.0 600.0 600 1.0 4,700.0 4,700 Feeding (concentrate) sum year 1.0 540.0 540 1.0 1,260.0 1,260 Vet and Med sum year 1.0 900.0 900 1.0 500.0 500 Other sum year 1.0 90.0 90 1.0 80.0 80
GoatFeeding sum year - - - - - - Vet and Med sum year 1.0 - - - - - Other sum year - - - - - -
PoultryOther sum year 1.0 90.0 90 1.0 290.0 290
Total Direct Costs 2,220 6,830
Overhead CostsEquipment repairs sum year - - - - - - Total Overhead Costs - -
Total Expenditure 2,220 6,830
Net Margin 3,600 12,590
Family Labour Input Days Month - - - - - -
Return to Family Labour
Combined Net Margin and Asset Increase 3,600 12,394
Source: Study of Impact of WIRFP on Net Incomes of Target Households, Jan 2004.
Before / Without Project Situation After / With Project Situation

WIRFP - Phase II - Cost Benefit Analysis
Tables AN11.0 Incremental Benefits
Tables AN11.3 Net Income Study Crop and Livestock Net Margin Data: Phase II State Gujarat - Village Lakhana
Table AN11.3.1 Gujarat - Village Lakhana: Weighted Household Crop Net Margin Summary.Table AN11.3.2 Gujarat - Village Lakhana: Weighted Household Livestock Net Margin Summary.Table AN11.3.3 A. Gujarat - Village Lakhana: Summary of Crop Net Margin per Household and Area (WBR - All Types).
B. Gujarat - Village Lakhana: Crop Net Margin per Household and Area - WBR - Very Poor (1).C. Gujarat - Village Lakhana: Crop Net Margin per Household and Area - WBR - Very Poor (2).D. Gujarat - Village Lakhana: Crop Net Margin per Household and Area - WBR - Poor (1).E. Gujarat - Village Lakhana: Crop Net Margin per Household and Area - WBR - Poor (2).F. Gujarat - Village Lakhana: Crop Net Margin per Household and Area - WBR - Moderate.G. Gujarat - Village Lakhana: Crop Net Margin per Household and Area - WBR - Better Off.
Table AN11.3.4 Gujarat - Village Lakhana: Individual Household Crop Detailed Data: WBR - Very Poor (1).Table AN11.3.5 Gujarat - Village Lakhana: Individual Household Crop Detailed Data: WBR - Very Poor (2).Table AN11.3.6 Gujarat - Village Lakhana: Individual Household Crop Detailed Data: WBR - Poor (1).Table AN11.3.7 Gujarat - Village Lakhana: Individual Household Crop Detailed Data: WBR - Poor (2).Table AN11.3.8 Gujarat - Village Lakhana: Individual Household Crop Detailed Data: WBR - Moderate.Table AN11.3.9 Gujarat - Village Lakhana: Individual Household Crop Detailed Data: WBR - Better Off.
Table AN11.3.10 Gujarat - Village Lakhana: Individual Household Livestock Detailed Data: WBR - Very Poor (1).Table AN11.3.11 Gujarat - Village Lakhana: Individual Household Livestock Detailed Data: WBR - Very Poor (2).Table AN11.3.12 Gujarat - Village Lakhana: Individual Household Livestock Detailed Data: WBR - Poor (1).Table AN11.3.13 Gujarat - Village Lakhana: Individual Household Livestock Detailed Data: WBR - Poor (2).Table AN11.3.14 Gujarat - Village Lakhana: Individual Household Livestock Detailed Data: WBR - Moderate.Table AN11.3.15 Gujarat - Village Lakhana: Individual Household Livestock Detailed Data: WBR - Better Off.

Table AN11.3.1 Gujarat - Village Lakhana: Weighted Household Crop Net Margin Summary.
Item WBR(%) Khalif Rabi Total Khalif Rabi Total Khalif Rabi Total
Household and Unit Area Analysis (Economic):
Well Being Ranking - Very Poor (1) 12.5%Household Crop Net Margin (Rs) 936 - 936 3,160 1,157 4,316 2,224 1,157 3,380 Area Planted (bigha) 4.5 - 4.5 5.0 1.0 6.0 0.5 1.0 1.5 Crop Net Margin (Rs) / bigha 208 - 208 702 231 863 494 231 725 Crop Net Margin / hectare \2 1,040 - 1,040 3,511 1,157 4,316 2,471 1,157 3,276
Well Being Ranking - Very Poor (2) 12.5%Household Crop Net Margin (Rs) 3,306 - 3,306 2,757 - 2,757 (549) - (549) Area Planted (bigha) 2.5 - 2.5 2.5 - 2.5 - - - Crop Net Margin / bigha 1,322 - 1,322 1,103 - 1,103 (219) - (219) Crop Net Margin / hectare \2 6,611 - 6,611 5,514 - 5,514 (1,097) - (1,097)
Well Being Ranking - Poor (1) 0.0%Household Crop Net Margin (Rs) 14,565 5,990 20,555 6,400 8,251 14,651 (8,165) 2,261 (5,904) Area Planted (bigha) 5.0 2.0 7.0 7.0 5.0 12.0 2.0 3.0 5.0 Crop Net Margin / bigha 2,913 2,995 5,908 914 1,650 2,564 (1,999) (1,345) (3,344) Crop Net Margin / hectare \2 14,565 14,975 29,540 4,571 8,251 12,822 (9,994) (6,724) (16,718)
Well Being Ranking - Poor (2) 25.0%Household Crop Net Margin (Rs) 2,810 - 2,810 9,167 610 9,777 6,357 610 6,967 Area Planted (bigha) 4.0 - 4.0 7.0 0.5 7.5 3.0 0.5 3.5 Crop Net Margin / bigha 703 - 703 2,292 153 2,444 1,589 153 1,742 Crop Net Margin / hectare \2 3,513 - 3,513 11,459 763 12,221 7,946 763 8,709
Well Being Ranking - Moderate 25.0%Household Crop Net Margin (Rs) 1,953 179 2,132 3,778 3,309 7,087 1,825 3,130 4,955 Area Planted (bigha) 5.0 1.0 6.0 5.0 1.5 6.5 - 0.5 0.5 Crop Net Margin / bigha 488 45 533 945 827 1,772 456 783 1,239 Crop Net Margin / hectare \2 2,441 223 2,664 4,723 4,136 8,858 2,282 3,913 6,194
Well Being Ranking - Better Off 25.0%Household Crop Net Margin (Rs) 7,892 5,270 13,162 19,403 6,118 25,521 11,511 848 12,359 Area Planted (bigha) 4.0 3.5 7.5 10.0 4.0 14.0 6.0 0.5 6.5 Crop Net Margin / bigha 1,973 1,318 3,291 4,851 1,530 6,380 2,878 212 3,090 Crop Net Margin / hectare \2 9,865 6,588 16,453 24,253 7,648 31,901 14,388 1,060 15,448
WBR - Weighted 100%Household Crop Net Margin (Rs) 3,694 1,362 5,056 8,826 2,654 11,480 5,133 1,292 6,424 Crop Net Margin / bigha 982 341 1,323 2,247 656 2,895 1,265 316 1,581 Crop Net Margin / hectare \2 4,911 1,703 6,614 11,237 3,281 14,474 6,326 1,578 7,860
Source: Study of Impact of WIRFP on Net Incomes of Target Households, Jan 2004.WBR = GVT Well Being Ranking\1 One hectare equivalent to bigha = 5.0
Before / Without Project After / With Project Increment

Table AN11.3.2 Gujarat - Village Lakhana: Weighted Household Livestock Net Margin Summary.
Item WBR(%) Herd Value Net Margin Herd Value Net Margin Herd Value Net Margin
Household Livestock Analysis
Well Being Ranking - Very Poor (1) 12.5%Household Livestock Net Margin (Rs) - financial 3,400 (844.0) 24,300 2,372.0 4,180 3,216.0 Labour (person days) 12.0 48.0 36.0 Labour Value (Rs) - economic \2 300.0 1,200.0 900.0 Household Livestock Net Margin (Rs) - economic (1,144.0) 1,172.0 2,316.0
Well Being Ranking - Very Poor (2) 12.5%Household Livestock Net Margin (Rs) - financial 880 165.0 2,400 1,260.0 304 1,095.0 Labour (person days) 12.0 24.0 12.0 Labour Value (Rs) - economic \2 300.0 600.0 300.0 Household Livestock Net Margin (Rs) - economic (135.0) 660.0 795.0
Well Being Ranking - Poor (1) 12.5%Household Livestock Net Margin (Rs) - financial 20,000 2,870.0 35,000 5,720.0 3,000 2,850.0 Labour (person days) 36.0 72.0 36.0 Labour Value (Rs) - economic \2 900.0 1,800.0 900.0 Household Livestock Net Margin (Rs) - economic 1,970.0 3,920.0 1,950.0
Well Being Ranking - Poor (2) 12.5%Household Livestock Net Margin (Rs) - financial 14,560 370.0 21,990 5,310.0 1,486 4,940.0 Labour (person days) 12.0 72.0 60.0 Labour Value (Rs) - economic \2 300.0 1,800.0 1,500.0 Household Livestock Net Margin (Rs) - economic 70.0 3,510.0 3,440.0
Well Being Ranking - Moderate 25.0%Household Livestock Net Margin (Rs) - financial 19,200 860.0 38,800 2,600.0 3,920 1,740.0 Labour (person days) 24.0 48.0 24.0 Labour Value (Rs) - economic \2 600.0 1,200.0 600.0 Household Livestock Net Margin (Rs) - economic 260.0 1,400.0 1,140.0
Well Being Ranking - Better Off 25.0%Household Livestock Net Margin (Rs) - financial 21,000 (6,205.0) 56,400 (950.0) 7,080 5,255.0 Labour (person days) 12.0 24.0 12.0 Labour Value (Rs) - economic \2 300.0 600.0 300.0 Household Livestock Net Margin (Rs) - economic (6,505.0) (1,550.0) 4,955.0
Well Being Ranking - Weighted 100%Household Livestock Net Margin (Rs) - financial 14,905 (1,016.1) 34,261 2,245.3 3,261.4 Labour (person days) 18.0 45.0 27.0 Labour Value (Rs) - economic \2 450.0 1,125.0 675.0 Household Livestock Net Margin (Rs) - economic (1,466.1) 1,120.3 2,586.4
Source: Study of Impact of WIRFP on Net Incomes of Target Households, Jan 2004.
\1 Study of Impact of WIRFP on Net Incomes of Target Households, Jan 2004.Average annual daily value of family labour assumed = Rs/day 25.0
Before / Without Project After / With Project Increment \1

Table AN11.3.3 A. Gujarat - Village Lakhana: Summary of Crop Net Margin per Household and Area (WBR - All Types).
ItemVery Poor (1) Very Poor (2) Poor (1) Poor (2) Moderate Better Off
Increment Increment Increment Increment Increment Increment
Household Analysis:Crop Revenue (Rs/bigha)
Crop 3,230 (570) (5,590) 6,250 4,810 11,840 Residue 1,750 200 443 2,800 2,910 6,500
Total Crop Revenue 4,980 (370) (5,148) 9,050 7,720 18,340
Production Costs (Rs/bigha)Variable Costs 309 (945) 383 488 1,669 4,572
Net Margin - Financial 4,671 575 (5,530) 8,562 6,052 13,769 Labour Input (person days) 31 3 (36) 66 38 85
Return per Person Day (Rs/p/day) 151 192 153 130 159 162
Labour Costs - Economic \1 1,291 60 374 1,595 1,096 1,410 Total Production Costs (Rs/bigha) 1,600 (885) 757 2,083 2,765 5,982
Net Margin (Rs/bigha) - Economic 3,380 (549) (5,904) 6,967 4,955 12,359
Area planted (bigha) 1.5 - 5.0 3.5 0.5 6.5 Cropping Intensity (percent)
Unit Area Analysis (Rs/unit) - Economic:Net Margin / bigha 725 (219) (3,344) 1,742 1,239 3,090 Net Margin / hectare \2 3,276 (1,097) (16,718) 8,709 6,194 15,448
Source: Study of Impact of WIRFP on Net Incomes of Target Households, Jan 2004.\1 Adjusted for labour costs.\2 One hectare equivalent to bigha =
Well Being Ranking

Table AN11.3.3
Item
Household Analysis:Crop Revenue (Rs/bigha)
CropResidue
Total Crop Revenue
Production Costs (Rs/bigha)Variable Costs
Net Margin - FinancialLabour Input (person days)
Return per Person Day (Rs/p/day)
Labour Costs - Economic \1Total Production Costs (Rs/bigha)
Net Margin (Rs/bigha) - Economic
Area planted (bigha)Cropping Intensity (percent)
Unit Area Analysis (Rs/unit) - Economic:Net Margin / bighaNet Margin / hectare \2
Source: \1 Adjusted for labour costs.\2 One hectare equivalent to bigha =
B. Gujarat - Village Lakhana: Crop Net Margin per Household and Area - WBR - Very Poor (1).
Khalif Rabi Total Khalif Rabi Total Khalif Rabi Total
2,770 - 2,770 5,000 1,000 6,000 2,230 1,000 3,230 1,250 - 1,250 2,400 600 3,000 1,150 600 1,750 4,020 - 4,020 7,400 1,600 9,000 3,380 1,600 4,980
1,224 - 1,224 1,465 68 1,533 241 68 309 2,796 - 2,796 5,935 1,532 7,467 3,139 1,532 4,671
78 - 78 98 11 109 20 11 31
36 - 36 61 139 69 157 139 151
1,860 - 1,860 2,776 375 3,151 916 375 1,291 3,084 - 3,084 4,241 443 4,684 1,157 443 1,600
936 - 936 3,160 1,157 4,316 2,224 1,157 3,380
4.5 - 4.5 5.0 1.0 6.0 0.5 1.0 1.5 100% 0% 100% 111% 22% 133% 60%
208 - 208 702 231 863 494 231 725 1,040 - 1,040 3,511 1,157 4,316 2,471 1,157 3,276
Study of Impact of WIRFP on Net Incomes of Target Households, Jan 2004.
5.0
Well Being Ranking - Very Poor (1)Before / Without Project After / With Project Increment

Table AN11.3.3
Item
Household Analysis:Crop Revenue (Rs/bigha)
CropResidue
Total Crop Revenue
Production Costs (Rs/bigha)Variable Costs
Net Margin - FinancialLabour Input (person days)
Return per Person Day (Rs/p/day)
Labour Costs - Economic \1Total Production Costs (Rs/bigha)
Net Margin (Rs/bigha) - Economic
Area planted (bigha)Cropping Intensity (percent)
Unit Area Analysis (Rs/unit) - Economic:Net Margin / bighaNet Margin / hectare \2
Source: \1 Adjusted for labour costs.\2 One hectare equivalent to bigha =
C. Gujarat - Village Lakhana: Crop Net Margin per Household and Area - WBR - Very Poor (2).
Khalif Rabi Total Khalif Rabi Total Khalif Rabi Total
3,670 - 3,670 3,100 - 3,100 (570) - (570) 1,300 - 1,300 1,500 - 1,500 200 - 200 4,970 - 4,970 4,600 - 4,600 (370) - (370)
945 - 945 - - - (945) - (945) 4,026 - 4,026 4,600 - 4,600 575 - 575
36 - 36 39 - 39 3 - 3
112 - 112 118 - 118 192 - 192
720 - 720 780 - 780 60 - 60 1,665 - 1,665 1,843 - 1,843 (885) - (885)
3,306 - 3,306 2,757 - 2,757 (549) - (549)
2.5 - 2.5 2.5 - 2.5 - - - 100% 0% 100% 100% 0% 100% 0%
1,322 - 1,322 1,103 - 1,103 (219) - (219) 6,611 - 6,611 5,514 - 5,514 (1,097) - (1,097)
Study of Impact of WIRFP on Net Incomes of Target Households, Jan 2004.
Well Being Ranking - Very Poor (2)Before / Without Project After / With Project Increment

Table AN11.3.3
Item
Household Analysis:Crop Revenue (Rs/bigha)
CropResidue
Total Crop Revenue
Production Costs (Rs/bigha)Variable Costs
Net Margin - FinancialLabour Input (person days)
Return per Person Day (Rs/p/day)
Labour Costs - Economic \1Total Production Costs (Rs/bigha)
Net Margin (Rs/bigha) - Economic
Area planted (bigha)Cropping Intensity (percent)
Unit Area Analysis (Rs/unit) - Economic:Net Margin / bighaNet Margin / hectare \2
Source: \1 Adjusted for labour costs.\2 One hectare equivalent to bigha =
D. Gujarat - Village Lakhana: Crop Net Margin per Household and Area - WBR - Poor (1).
Khalif Rabi Total Khalif Rabi Total Khalif Rabi Total
16,780 6,400 23,180 8,990 8,600 17,590 (7,790) 2,200 (5,590) 1,650 980 2,630 1,998 1,075 3,073 348 95 443
18,430 7,380 25,810 10,988 9,675 20,663 (7,443) 2,295 (5,148)
2,285 190 2,475 2,528 330 2,858 243 140 383 16,145 7,190 23,335 8,460 9,345 17,805 (7,685) 2,155 (5,530)
79 48 127 62 29 91 (17) (19) (36)
204 150 184 136 324 196 452 (112) 153
1,580 1,200 2,780 2,060 1,094 3,154 480 (106) 374 3,865 1,390 5,255 4,588 1,424 6,012 723 34 757
14,565 5,990 20,555 6,400 8,251 14,651 (8,165) 2,261 (5,904)
5.0 2.0 7.0 7.0 5.0 12.0 2.0 3.0 5.0 100% 40% 140% 140% 100% 171% 200%
2,913 2,995 5,908 914 1,650 2,564 (1,999) (1,345) (3,344) 14,565 14,975 29,540 4,571 8,251 12,822 (9,994) (6,724) (16,718)
Study of Impact of WIRFP on Net Incomes of Target Households, Jan 2004.
After / With Project IncrementBefore / Without Project Well Being Ranking - Poor (1)
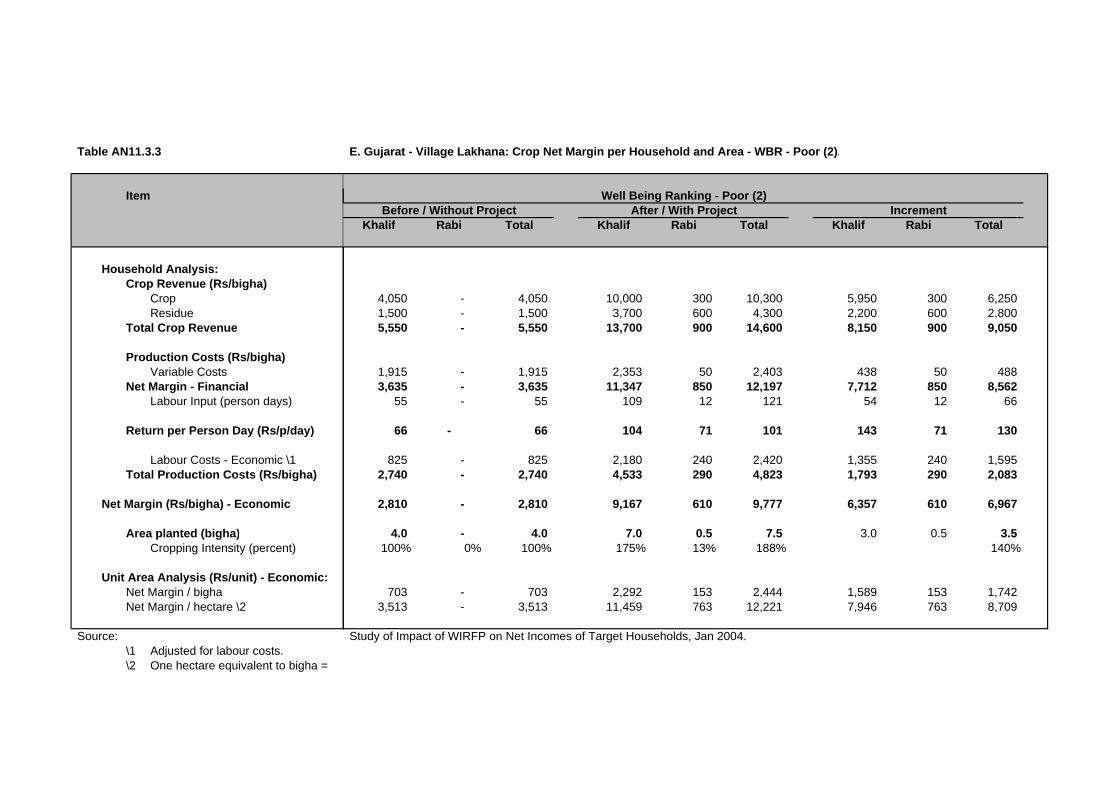
Table AN11.3.3
Item
Household Analysis:Crop Revenue (Rs/bigha)
CropResidue
Total Crop Revenue
Production Costs (Rs/bigha)Variable Costs
Net Margin - FinancialLabour Input (person days)
Return per Person Day (Rs/p/day)
Labour Costs - Economic \1Total Production Costs (Rs/bigha)
Net Margin (Rs/bigha) - Economic
Area planted (bigha)Cropping Intensity (percent)
Unit Area Analysis (Rs/unit) - Economic:Net Margin / bighaNet Margin / hectare \2
Source: \1 Adjusted for labour costs.\2 One hectare equivalent to bigha =
E. Gujarat - Village Lakhana: Crop Net Margin per Household and Area - WBR - Poor (2).
Khalif Rabi Total Khalif Rabi Total Khalif Rabi Total
4,050 - 4,050 10,000 300 10,300 5,950 300 6,250 1,500 - 1,500 3,700 600 4,300 2,200 600 2,800 5,550 - 5,550 13,700 900 14,600 8,150 900 9,050
1,915 - 1,915 2,353 50 2,403 438 50 488 3,635 - 3,635 11,347 850 12,197 7,712 850 8,562
55 - 55 109 12 121 54 12 66
66 - 66 104 71 101 143 71 130
825 - 825 2,180 240 2,420 1,355 240 1,595 2,740 - 2,740 4,533 290 4,823 1,793 290 2,083
2,810 - 2,810 9,167 610 9,777 6,357 610 6,967
4.0 - 4.0 7.0 0.5 7.5 3.0 0.5 3.5 100% 0% 100% 175% 13% 188% 140%
703 - 703 2,292 153 2,444 1,589 153 1,742 3,513 - 3,513 11,459 763 12,221 7,946 763 8,709
Study of Impact of WIRFP on Net Incomes of Target Households, Jan 2004.
Well Being Ranking - Poor (2)Before / Without Project After / With Project Increment

Table AN11.3.3
Item
Household Analysis:Crop Revenue (Rs/bigha)
CropResidue
Total Crop Revenue
Production Costs (Rs/bigha)Variable Costs
Net Margin - FinancialLabour Input (person days)
Return per Person Day (Rs/p/day)
Labour Costs - Economic \1Total Production Costs (Rs/bigha)
Net Margin (Rs/bigha) - Economic
Area planted (bigha)Cropping Intensity (percent)
Unit Area Analysis (Rs/unit) - Economic:Net Margin / bighaNet Margin / hectare \2
Source: \1 Adjusted for labour costs.\2 One hectare equivalent to bigha =
F. Gujarat - Village Lakhana: Crop Net Margin per Household and Area - WBR - Moderate.
Khalif Rabi Total Khalif Rabi Total Khalif Rabi Total
2,160 800 2,960 4,290 3,480 7,770 2,130 2,680 4,810 1,670 40 1,710 3,370 1,250 4,620 1,700 1,210 2,910 3,830 840 4,670 7,660 4,730 12,390 3,830 3,890 7,720
845 210 1,055 2,162 562 2,723 1,317 352 1,669 2,985 631 3,616 5,499 4,169 9,667 2,514 3,538 6,052
52 18 70 71 37 108 19 19 38
57 35 52 77 113 90 132 186 159
1,032 452 1,484 1,720 860 2,580 688 408 1,096 1,877 662 2,539 3,882 1,422 5,303 2,005 760 2,765
1,953 179 2,132 3,778 3,309 7,087 1,825 3,130 4,955
5.0 1.0 6.0 5.0 1.5 6.5 - 0.5 0.5 100% 20% 120% 100% 38% 163% 20%
488 45 533 945 827 1,772 456 783 1,239 2,441 223 2,664 4,723 4,136 8,858 2,282 3,913 6,194
Study of Impact of WIRFP on Net Incomes of Target Households, Jan 2004.
Well Being Ranking - ModerateBefore / Without Project After / With Project Increment

Table AN11.3.3
Item
Household Analysis:Crop Revenue (Rs/bigha)
CropResidue
Total Crop Revenue
Production Costs (Rs/bigha)Variable Costs
Net Margin - FinancialLabour Input (person days)
Return per Person Day (Rs/p/day)
Labour Costs - Economic \1Total Production Costs (Rs/bigha)
Net Margin (Rs/bigha) - Economic
Area planted (bigha)Cropping Intensity (percent)
Unit Area Analysis (Rs/unit) - Economic:Net Margin / bighaNet Margin / hectare \2
Source: \1 Adjusted for labour costs.\2 One hectare equivalent to bigha =
G. Gujarat - Village Lakhana: Crop Net Margin per Household and Area - WBR - Better Off.
Khalif Rabi Total Khalif Rabi Total Khalif Rabi Total
7,400 4,250 11,650 16,440 7,050 23,490 9,040 2,800 11,840 3,400 3,300 6,700 10,800 2,400 13,200 7,400 (900) 6,500
10,800 7,550 18,350 27,240 9,450 36,690 16,440 1,900 18,340
2,108 1,740 3,848 6,068 2,352 8,420 3,960 612 4,572 8,692 5,810 14,502 21,173 7,098 28,271 12,481 1,288 13,769
35 27 62 98 49 147 63 22 85
248 215 234 216 145 192 198 59 162
800 540 1,340 1,770 980 2,750 970 440 1,410 2,908 2,280 5,188 7,838 3,332 11,170 4,930 1,052 5,982
7,892 5,270 13,162 19,403 6,118 25,521 11,511 848 12,359
4.0 3.5 7.5 10.0 4.0 14.0 6.0 0.5 6.5 100% 88% 188% 250% 100% 350% 163%
1,973 1,318 3,291 4,851 1,530 6,380 2,878 212 3,090 9,865 6,588 16,453 24,253 7,648 31,901 14,388 1,060 15,448
Study of Impact of WIRFP on Net Incomes of Target Households, Jan 2004.
Well Being Ranking - Better OffBefore / Without Project After / With Project Increment
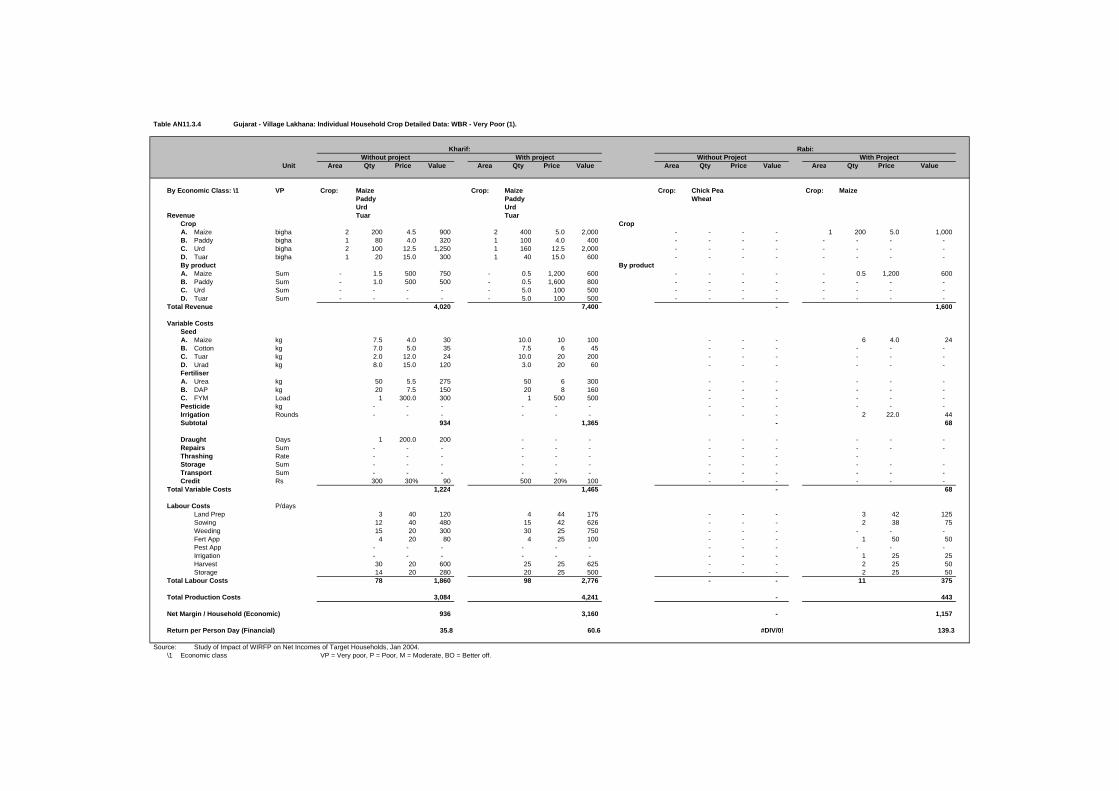
Table AN11.3.4 Gujarat - Village Lakhana: Individual Household Crop Detailed Data: WBR - Very Poor (1).
Unit Area Qty Price Value Area Qty Price Value Area Qty Price Value Area Qty Price Value
By Economic Class: \1 VP Crop: Maize Crop: Maize Crop: Chick Pea Crop: MaizePaddy Paddy WheatUrd Urd
Revenue Tuar TuarCrop CropA. Maize bigha 2 200 4.5 900 2 400 5.0 2,000 - - - - 1 200 5.0 1,000 B. Paddy bigha 1 80 4.0 320 1 100 4.0 400 - - - - - - - - C. Urd bigha 2 100 12.5 1,250 1 160 12.5 2,000 - - - - - - - - D. Tuar bigha 1 20 15.0 300 1 40 15.0 600 - - - - - - - - By product By productA. Maize Sum - 1.5 500 750 - 0.5 1,200 600 - - - - - 0.5 1,200 600 B. Paddy Sum - 1.0 500 500 - 0.5 1,600 800 - - - - - - - - C. Urd Sum - - - - - 5.0 100 500 - - - - - - - - D. Tuar Sum - - - - - 5.0 100 500 - - - - - - - -
Total Revenue 4,020 7,400 - 1,600
Variable CostsSeedA. Maize kg 7.5 4.0 30 10.0 10 100 - - - 6 4.0 24 B. Cotton kg 7.0 5.0 35 7.5 6 45 - - - - - - C. Tuar kg 2.0 12.0 24 10.0 20 200 - - - - - - D. Urad kg 8.0 15.0 120 3.0 20 60 - - - - - - FertiliserA. Urea kg 50 5.5 275 50 6 300 - - - - - - B. DAP kg 20 7.5 150 20 8 160 - - - - - - C. FYM Load 1 300.0 300 1 500 500 - - - - - - Pesticide kg - - - - - - - - - - - - Irrigation Rounds - - - - - - - - - 2 22.0 44 Subtotal 934 1,365 - 68
Draught Days 1 200.0 200 - - - - - - - - - Repairs Sum - - - - - - - - - - - - Thrashing Rate - - - - - - - - - - Storage Sum - - - - - - - - - - - - Transport Sum - - - - - - - - - - - - Credit Rs 300 30% 90 500 20% 100 - - - - - -
Total Variable Costs 1,224 1,465 - 68
Labour Costs P/daysLand Prep 3 40 120 4 44 175 - - - 3 42 125 Sowing 12 40 480 15 42 626 - - - 2 38 75 Weeding 15 20 300 30 25 750 - - - - - - Fert App 4 20 80 4 25 100 - - - 1 50 50 Pest App - - - - - - - - - - - - Irrigation - - - - - - - - - 1 25 25 Harvest 30 20 600 25 25 625 - - - 2 25 50 Storage 14 20 280 20 25 500 - - - 2 25 50
Total Labour Costs 78 1,860 98 2,776 - - 11 375
Total Production Costs 3,084 4,241 - 443
Net Margin / Household (Economic) 936 3,160 - 1,157
Return per Person Day (Financial) 35.8 60.6 #DIV/0! 139.3
Source: Study of Impact of WIRFP on Net Incomes of Target Households, Jan 2004.\1 Economic class VP = Very poor, P = Poor, M = Moderate, BO = Better off.
Kharif: Rabi:With projectWithout project Without Project With Project

Table AN11.3.5 Gujarat - Village Lakhana: Individual Household Crop Detailed Data: WBR - Very Poor (2).
Unit Area Qty Price Value Area Qty Price Value Area Qty Price Value Area Qty Price Value
By Economic Class: VP Crop: Maize Crop: Maize Crop: Chick Pea Crop:Paddy Paddy WheatUrad
Revenue TuarCrop CropA. Maize bigha 1.50 300 4.5 1,350 1.25 500 5.0 2,500 - - - - - - - - B. Paddy bigha 0.50 100 4.0 400 1.25 150 4.0 600 - - - - - - - - C. Urad bigha 0.50 60 12.0 720 - - - - - - - - - - - - D. Tuar bigha - 80 15.0 1,200 - - - - - - - - - - - - By product By productA. Maize Sum - 0.5 1,000 500 - 1.0 1,200 1,200 - - - - - - - - B. Paddy Sum - 1.0 200 200 - 0.5 600 300 - - - - - - - - C. Urad Sum - 0.5 1,200 600 - - - - - - - - - - - - D. Tuar Sum - - - - - - - - - - - - - - - -
Total Revenue 4,970 4,600 - -
Variable CostsSeedA. Maize kg 8.0 4.0 32 9.0 7.0 63 - - - - - - B. Paddy kg 10.0 4.0 40 12.5 4.0 50 - - - - - - C. Urad kg 2.0 20.0 40 - - - - - - - - - D. Tuar kg 2.5 13.0 33 - - - - - - - - - FertiliserA. Urea kg 10 4.0 40 100 5.6 560 - - - - - - B. DAP kg 2.5 8.0 20 10 9.0 90 - - - - - - C. FYM Load 0.5 400.0 200 - - - - - - - - - Pesticide kg - - - - - - - - - - - - Irrigation Rounds - - - - - - - - - - - - Subtotal 405 763 - -
Draught Days - - - - - - - - - - - - Repairs Sum - - - - - - - - - - - - Thrashing Rate 15 10.0 150 - - - - - - - Storage Sum - - - - - - - - - - - - Transport Sum 1 150.0 150 1 200.0 200 - - - - - - Credit Rs 800 30% 240 500 20% 100 - - - - - -
Total Variable Costs 945 1,063 - -
Labour Costs P/daysLand Prep 2 20 40 - - - - - - - - - Sowing 5 20 100 2 20 40 - - - - - - Weeding 13 20 260 11 20 220 - - - - - - Fert App 4 20 80 4 20 80 - - - - - - Pest App - - - - - - - - - - - - Irrigation - - - - - - - - - - - - Harvest 12 20 240 20 20 400 - - - - - - Storage - - - 2 20 40 - - - - - -
Total Labour Costs 36 720 39 780 - - - -
Total Production Costs 1,665 1,843 - -
Net Margin / Household (Economic) 3,306 2,757 - -
Return per Person Day (Financial) 111.8 90.7 #DIV/0! #DIV/0!
Source: Study of Impact of WIRFP on Net Incomes of Target Households, Jan 2004.Economic class VP = Very poor, P = Poor, M = Moderate, BO = Better off.
Kharif: Rabi:With projectWithout project Without Project With Project

Table AN11.3.6 Gujarat - Village Lakhana: Individual Household Crop Detailed Data: WBR - Poor (1).
Unit Area Qty Price Value Area Qty Price Value Area Qty Price Value Area Qty Price Value
By Economic Class: P Crop: Maize Crop: Crop: Maize Crop:Paddy WheatBlack Gram Gram
Revenue Pigeon PeaCrop CropA. Maize bigha 1 1,000 4.0 4,000 2 300 4.5 1,350 Maize 1.0 500 5.0 2,500 3 1,460 5.0 7,300 B. Paddy bigha 1 800 3.0 2,400 1 160 8.0 1,280 Wheat 0.5 300 7.0 2,100 1 100 7.0 700 C. Black Gram bigha 2 300 15.0 4,500 2 240 13.0 3,120 Gram 0.5 120 15.0 1,800 1 40 15.0 600 D. Pigeon Pea bigha 1 420 14.0 5,880 2 360 9.0 3,240 - - - - - - - - - By product By productA. Maize Sum - 2.5 400 1,000 - 8.5 235 1,998 Maize - - - - - 1 700 700 B. Paddy Sum - - - - - - - - Wheat - 1 480 480 - 1 300 300 C. Black Gram Sum - 10.0 15 150 - - - - Gram - 1 500 500 - 5 15 75 D. Pigeon Pea Sum - 1.0 500 500 - - - - - - - - - - - - -
Total Revenue 18,430 10,988 7,380 9,675
Variable CostsSeedA. Maize kg 25.0 4.0 100 25.0 5.0 125 Maize 10 4.0 40 15 6.0 90 B. Paddy kg 30.0 3.5 105 20.0 7.5 150 Wheat 10 5.0 50 15 8.0 120 C. Black Gram kg 12.5 32.0 400 12.5 15.0 188 Gram 10 10.0 100 15 8.0 120 D. Pigeon Pea kg 2.5 12.0 30 17.5 10.0 175 - - - - - - - FertiliserA. Urea kg 100 4.5 450 100 5.0 500 - - - - - - B. DAP kg 25 8.0 200 50 9.0 450 - - - - - - C. FYM Load 2 400.0 800 1.5 500.0 750 - - - - - - Pesticide kg - - - - - - - - - - - - Irrigation Rounds - - - - - - - - - - - - Subtotal 2,085 2,338 190 330
Draught Days - - - - - - - - - - - - Repairs Sum - - - - - - - - - - - - Thrashing Rate 1 80.0 80 - - - - - - - Storage Sum - - - - - - - - - - - - Transport Sum - - - 1 40.0 40 - - - - - - Credit Rs 600 20% 120 500 30% 150 - - - - - -
Total Variable Costs 2,285 2,528 190 330
Labour Costs P/daysLand Prep 10 20 200 10 50 500 - - - 8 38 319 Sowing 9 20 180 - - - - - - 2 38 91 Weeding - - - - - - - - - - - - Fert App 5 20 100 - - - - - - 5 38 182 Pest App - - - - - - - - - - - - Irrigation - - - - - - - - - 4 38 137 Harvest 25 20 500 26 30 780 - - - 10 38 365 Storage 30 20 600 26 30 780 48 25 1,200 - - -
Total Labour Costs 79 1,580 62 2,060 48 1,200 29 1,094
Total Production Costs 3,865 4,588 1,390 1,424
Net Margin / Household (Economic) 14,565 6,400 5,990 8,251
Return per Person Day (Financial) 204.4 136.5 149.8 324.5
Source: Study of Impact of WIRFP on Net Incomes of Target Households, Jan 2004.Economic class VP = Very poor, P = Poor, M = Moderate, BO = Better off.
Kharif: Rabi:With projectWithout project Without Project With Project

Table AN11.3.7 Gujarat - Village Lakhana: Individual Household Crop Detailed Data: WBR - Poor (2).
Unit Area Qty Price Value Area Qty Price Value Area Qty Price Value Area Qty Price Value
Economic Class: \1 P Crop: Maize Crop: Crop: Crop: GramPaddyBlack Gram
Revenue Pigeon PeaCrop CropA. Maize bigha 1.0 150 4.5 675 2.0 500 5.0 2,500 Gram - - - - 0.5 30 10.0 300 B. Paddy bigha 1.0 - - - 2.0 500 4.0 2,000 - - - - - - - - - C. Black Gram bigha 1.0 150 12.5 1,875 1.5 200 12.5 2,500 - - - - - - - - - D. Pigeon Pea bigha 1.0 100 15.0 1,500 1.5 200 15.0 3,000 - - - - - - - - - By product By productA. Maize Sum - 1.0 1,200 1,200 - 1 1,200 1,200 Gram - - - - - 0.5 1,200 600 B. Paddy Sum - 0.5 600 300 - 1 1,500 1,500 - - - - - - - - - C. Black Gram Sum - - - - - 100 5 500 - - - - - - - - - D. Pigeon Pea Sum - - - - - 100 5 500 - - - - - - - - -
Total Revenue 5,550 13,700 - 900
Variable CostsSeedA. Maize kg 7.0 5.0 35 12 4.0 48 Gram - - - 5.0 10.0 50 B. Paddy kg 20.0 4.0 80 30 4.0 120 - - - - - - - C. Black Gram kg 8.0 15.0 120 10 20.0 200 - - - - - - - D. Pigeon Pea kg 2.0 20.0 40 2 20.0 40 - - - - - - - FertiliserA. Urea kg 50 5.2 260 100 5.4 540 - - - - - - B. DAP kg 50 8.0 400 30 6.0 180 - - - - - - C. FYM Load 1 400.0 400 1 500.0 500 - - - - - - Pesticide kg - - - - - - - - - - - - Irrigation Rounds - - - - - - - - - - - - Subtotal 1,335 1,628 - 50
Draught Days 3 123.3 370 3 116.7 350 - - - - - - Repairs Sum - - - - - - - - - - - - Thrashing Rate - - - - - - - - - - Storage Sum - - - - - - - - - - - - Transport Sum - - - - - - - - - - - - Credit Rs 3,500 6% 210 5,000 8% 375 - 0% - - - -
Total Variable Costs 1,915 2,353 - 50
Labour Costs P/daysLand Prep 7 15 105 14 20 280 - - - 7 20 140 Sowing 6 15 90 11 20 220 - - - 3 20 60 Weeding 6 15 90 18 20 360 - - - - - - Fert App 1 15 15 2 20 40 - - - - - - Pest App - - - - - - - - - - - - Irrigation - - - - - - - - - - - - Harvest 18 15 270 36 20 720 - - - 2 20 40 Storage 17 15 255 28 20 560 - - - - - -
Total Labour Costs 55 825 109 2,180 - - 12 240
Total Production Costs 2,740 4,533 - 290
Net Margin / Household (Economic) 2,810 9,167 - 610
Return per Person Day (Financial) 66.1 104.1 #DIV/0! 70.8
Source: Study of Impact of WIRFP on Net Incomes of Target Households, Jan 2004.\1 Economic class VP = Very poor, P = Poor, M = Moderate, BO = Better off.
Kharif: Rabi:With projectWithout project Without Project With Project

Table AN11.3.8 Gujarat - Village Lakhana: Individual Household Crop Detailed Data: WBR - Moderate.
Unit Area Qty Price Value Area Qty Price Value Area Qty Price Value Area Qty Price Value
Economic Class: /1 M Crop: Maize Crop: Crop: Chick Pea Crop: Chick PeaPaddy MaizeUrad
Revenue TuarCrop CropA. Maize bigha 1.0 240 4.5 1,080 1 500 4.5 2,250 Chick Pea 1 80 10.0 800 0.5 200 12.0 2,400 B. Paddy bigha 1.5 100 5.0 500 1 200 6.0 1,200 Maize - - - - 1.0 240 4.5 1,080 C. Urad bigha 2.5 60 7.5 450 3 60 9.0 540 - - - - - - - - - D. Tuar bigha - 10 13.0 130 - 20 15.0 300 - - - - - - - - - By product By productA. Maize Sum 1.0 950 950 - 1.5 1,200 1,800 Chick Pea 4.0 10 40 5.0 10 50 B. Paddy Sum 0.5 1,300 650 - 1.0 1,500 1,500 Maize - - - 1.0 1,200 1,200 C. Urad Sum 2.0 10 20 - 3.0 10 30 - - - - - - - D. Tuar Sum 5.0 10 50 - 4.0 10 40 - - - - - - -
Total Revenue 3,830 7,660 840 4,730
Variable CostsSeedA. Maize kg 10.0 5.0 50 6 5.0 30 Chick Pea 15.0 12.50 188 15.0 12.0 180 B. Paddy kg 30.0 4.0 120 20 6.0 120 Maize - - - 10.0 5.0 50 C. Urad kg 7.5 10.0 75 10 12.0 120 - - - - - - - D. Tuar kg 2.0 25.0 50 2 12.0 24 - - - - - - - FertiliserA. Urea kg 50 5.0 250 105 5.6 588 - - - 20.0 5.4 108 B. DAP kg - - - 25 9.5 238 - - - 2.5 9.4 24 C. FYM Load 1 100.0 100 1 500.0 500 - - - - - - Pesticide kg - - - - - - - - - - - - Irrigation Rounds - - - 4 23.0 92 1 22.00 22 5 30.0 150 Subtotal 645 1,712 210 512
Draught Days - - - - - - - - - - - - Repairs Sum - - - - - - - - - - - - Thrashing Rate - - - - - - - - - - Storage Sum - - - 1 150.0 150 - - - 1 50.0 50 Transport Sum - - - - - - - - - - - - Credit Rs 1,000 20% 200 1,500 20% 300 - 0% - - 0% -
Total Variable Costs 845 2,162 210 562
Labour Costs P/daysLand Prep 6 18 108 10 20 200 5 31 154 10 20 200 Sowing 16 24 384 13 43 560 4 34 136 6 40 240 Weeding 15 18 270 20 20 400 2 18 36 5 20 100 Fert App - - - 4 20 80 - - - 1 20 20 Pest App - - - - - - - - - - - - Irrigation - - - 3 20 60 1 18 18 5 20 100 Harvest 15 18 270 21 20 420 6 18 108 10 20 200 Storage - - - - - - - - - - - -
Total Labour Costs 52 1,032 71 1,720 18 452 37 860
Total Production Costs 1,877 3,882 662 1,422
Net Margin / Household (Economic) 1,953 3,778 179 3,309
Return per Person Day (Financial) 57.4 77.4 35.0 112.7
Source: Study of Impact of WIRFP on Net Incomes of Target Households, Jan 2004.\1 Economic class VP = Very poor, P = Poor, M = Moderate, BO = Better off.
Kharif: Rabi:With projectWithout project Without Project With Project

Table AN11.3.9 Gujarat - Village Lakhana: Individual Household Crop Detailed Data: WBR - Better Off.
Unit Area Qty Price Value Area Qty Price Value Area Qty Price Value Area Qty Price Value
Economic Class: \1 BO Crop: Maize Crop: Crop: Maize Crop: MaizePaddy Black Gram Black GramTuar Wheat
Revenue UradCrop CropA. Maize bigha 2.0 400 3.0 1,200 3.0 800 4.5 3,600 Maize 2.0 500 4.5 2,250 1.5 200 4.5 900 B. Paddy bigha 1.0 500 5.0 2,500 3.0 1,000 4.0 4,000 Black Gram 1.5 200 10.0 2,000 1.0 300 12.5 3,750 C. Tuar bigha 1.0 100 13.0 1,300 4.0 200 12.4 2,480 Wheat - - - - 1.5 400 6.0 2,400 D. Urad bigha - 200 12.0 2,400 - 530 12.0 6,360 - - - - - - - - - By product By productA. Maize Sum 2.0 950 1,900 3.0 1,200 3,600 Maize 2.0 1,500 3,000 1.0 1,500 1,500 B. Paddy Sum 1.0 1,200 1,200 4.0 1,500 6,000 Black Gram 0.5 600 300 0.5 600 300 C. Tuar Sum 0.5 600 300 1.0 600 600 Wheat - - - 1.0 600 600 D. Urad Sum - - - 1.0 600 600 - - - - - - -
Total Revenue 10,800 27,240 7,550 9,450
Variable CostsSeedA. Maize kg 10.0 6.0 60 10.0 30.0 300 Maize 10.0 5.0 50 7.0 6.0 42 B. Paddy kg 20.0 10.0 200 50.0 7.0 350 Black Gram 60.0 15.0 900 40.0 20.0 800 C. Tuar kg 5.0 15.0 75 30.0 20.0 600 Wheat - - - 30.0 10.0 300 D. Urad kg 15.0 15.0 225 72.5 15.0 1,088 - - - - - - - FertiliserA. Urea kg 100 5.4 540 250 5.2 1,300 50 5.0 250 50 5.4 270 B. DAP kg 30 9.6 288 50 10.0 500 30 8.0 240 30 9.0 270 C. FYM Load 1 400.0 400 2 500.0 1,000 - - - - - - Pesticide kg - - - - - - - - - - - - Irrigation Rounds - - - 2 150.0 300 - - - 4 30.0 120 Subtotal 1,788 5,438 1,440 1,802
Draught Days 3 106.7 320 4.5 100.0 450 3 100.0 300 5 110.0 550 Repairs Sum - - - - - - - - - - - - Thrashing Rate - - - - - - - - - - Storage Sum - - - - - - - - - - - - Transport Sum - - - 4 20.0 80 - - - - - - Credit Rs - 0% - 500 20% 100 - 0% - - 0% -
Total Variable Costs 2,108 6,068 1,740 2,352
Labour Costs P/daysLand Prep 10 30 300 60 20 1,200 4 20 80 20 20 400 Sowing 10 20 200 4 15 60 15 20 300 3 20 60 Weeding - - - 10 15 150 - - - 2 20 40 Fert App - - - 6 15 90 2 20 40 2 20 40 Pest App - - - - - - - - - - - - Irrigation - - - 3 15 45 - - - 18 20 360 Harvest 15 20 300 15 15 225 6 20 120 2 20 40 Storage - - - - - - - - - 2 20 40
Total Labour Costs 35 800 98 1,770 27 540 49 980
Total Production Costs 2,908 7,838 2,280 3,332
Net Margin / Household (Economic) 7,892 19,403 5,270 6,118
Return per Person Day (Financial) 248.3 216.0 215.2 144.9
Source: Study of Impact of WIRFP on Net Incomes of Target Households, Jan 2004.\1 Economic class VP = Very poor, P = Poor, M = Moderate, BO = Better off.
Kharif: Rabi:With projectWithout project Without Project With Project

Table AN11.3.10 Gujarat - Village Lakhana: Individual Household Livestock Detailed Data: WBR - Very Poor (1).
Item Units PeriodQuantity Unit Price Value Quantity Unit Price Value
(No) (Rs) (Rs/Period) (No) (Rs) (Rs/Period)
Livestock Asset ValueCow
Male head 1 2,000.0 2,000 1 3,500.0 3,500 Female head - - - 1 2,000.0 2,000 Losses head - - - - - -
BuffaloMale head - - - - - - Female head - - - 2 7,000.0 14,000 Losses head - - - - - -
GoatMale head - - - 2 1,000.0 2,000 Female head 2 600.0 1,200 4 700.0 2,800 Losses head - - - - - -
PoultryNot Specified head 5 40.0 200 Losses head - - - - - -
Total Livestock Assets 3,400 24,300
Annual Increase in Livestock Assets year 5 - 4,180
Sales IncomeCow and Buffalo
Milk litres year - - - 480 10.0 4,800 Dung cart year 0.8 400.0 300 1 500.0 500 Draught days year - - - - - - Transport days year - - - - - - Sales no year - - - - - -
GoatMilk litres year - - - - - - Dung sum year - - - - - - Other - - - - - - - - Sales no year - - - - - -
PoultrySales no year - - - - - -
Total Sales Income 300 5,300
ExpenditureDirect CostsCow and Buffalo
Feeding (grazing) sum year 1.0 144.0 144 1.0 168.0 168 Feeding (roughage) sum year 1.0 800.0 800 1.0 2,500.0 2,500 Feeding (concentrate) sum year 1.0 200.0 200 1.0 260.0 260 Vet and Med sum year - - - - - - Other sum year - - - - - -
GoatFeeding sum year - - - - - - Vet and Med sum year - - - - - - Other sum year - - - - - -
PoultrySales sum year - - - - - - Other sum year - - - - - -
Total Direct Costs 1,144 2,928
Overhead CostsEquipment repairs sum year - - - - - - Total Overhead Costs - -
Total Expenditure 1,144 2,928
Net Margin (844) 2,372
Family Labour Input Days Month - - - - - -
Return to Family Labour
Combined Net MarginCash Flow and Asset (844) 6,552
Source: Study of Impact of WIRFP on Net Incomes of Target Households, Jan 2004.
Before / Without Project Situation After / With Project Situation

Table AN11.3.11 Gujarat - Village Lakhana: Individual Household Livestock Detailed Data: WBR - Very Poor (2).
Item Units PeriodQuantity Unit Price Value Quantity Unit Price Value
(No) (Rs) (Rs/Period) (No) (Rs) (Rs/Period)
Livestock Asset ValueCow
Male head - - - - - - Female head - - - - - - Losses head - - - - - -
BuffaloMale head - - - - - - Female head - - - - - - Losses head - - - - - -
GoatMale head - - - - - - Female head 1 800.0 800 3 800.0 2,400 Losses head - - - - - -
PoultryNot Specified head 2 40.0 80 2 40.0 Losses head - - - - - -
Total Livestock Assets 880 2,400
Annual Increase in Livestock Assets year 5 304
Sales IncomeCow and Buffalo
Milk litres year - - - - - - Dung cart year - - - - - - Draught days year - - - - - - Transport days year - - - - - - Sales no year - - - - - -
GoatMilk litres year - - - - - - Dung sum year - - - - - - Other - - - - - - - - Sales no year - - - 1 750.0 750
PoultrySales no year 30 0.5 15 - - - Other - - 1 750.0 750 1 1,450.0 1,450
Total Sales Income 765 2,200
ExpenditureDirect CostsCow and Buffalo
Feeding (grazing) sum year - - - - - - Feeding (concentrate) sum year - - - - - - Vet and Med sum year - - - - - - Other sum year - - - - - -
GoatFeeding sum year - - - - - - Vet and Med sum year - - - 1.0 40.0 40 Other sum year - - - - - -
PoultrySales sum year 1.0 300.0 300 1.0 450.0 450 Other sum year 1.0 300.0 300 1.0 450.0 450
Total Direct Costs 600 940
Overhead CostsEquipment repairs sum year - - - - - - Total Overhead Costs - -
Total Expenditure 600 940
Net Margin 165 1,260
Family Labour Input Days Month - - - - - -
Return to Family Labour
Combined Asset and Cash Value 165 1,564
Source: Study of Impact of WIRFP on Net Incomes of Target Households, Jan 2004.
Before / Without Project Situation After / With Project Situation
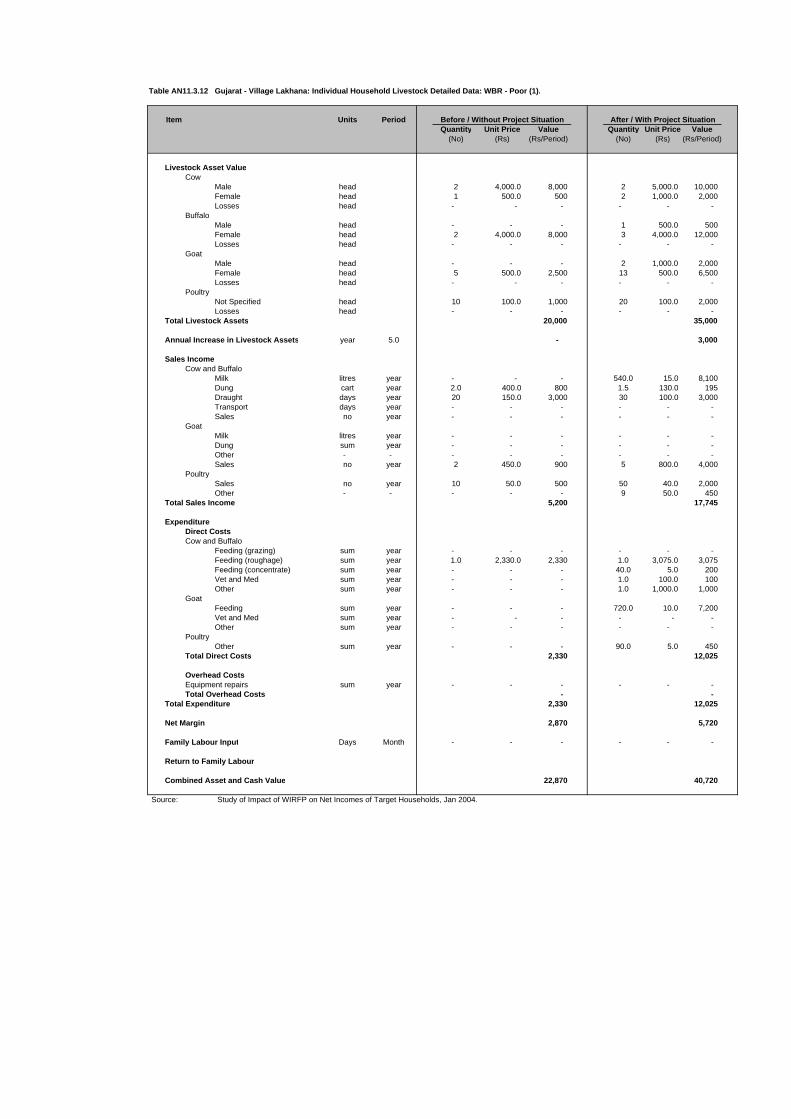
Table AN11.3.12 Gujarat - Village Lakhana: Individual Household Livestock Detailed Data: WBR - Poor (1).
Item Units PeriodQuantity Unit Price Value Quantity Unit Price Value
(No) (Rs) (Rs/Period) (No) (Rs) (Rs/Period)
Livestock Asset ValueCow
Male head 2 4,000.0 8,000 2 5,000.0 10,000 Female head 1 500.0 500 2 1,000.0 2,000 Losses head - - - - - -
BuffaloMale head - - - 1 500.0 500 Female head 2 4,000.0 8,000 3 4,000.0 12,000 Losses head - - - - - -
GoatMale head - - - 2 1,000.0 2,000 Female head 5 500.0 2,500 13 500.0 6,500 Losses head - - - - - -
PoultryNot Specified head 10 100.0 1,000 20 100.0 2,000 Losses head - - - - - -
Total Livestock Assets 20,000 35,000
Annual Increase in Livestock Assets year 5.0 - 3,000
Sales IncomeCow and Buffalo
Milk litres year - - - 540.0 15.0 8,100 Dung cart year 2.0 400.0 800 1.5 130.0 195 Draught days year 20 150.0 3,000 30 100.0 3,000 Transport days year - - - - - - Sales no year - - - - - -
GoatMilk litres year - - - - - - Dung sum year - - - - - - Other - - - - - - - - Sales no year 2 450.0 900 5 800.0 4,000
PoultrySales no year 10 50.0 500 50 40.0 2,000 Other - - - - - 9 50.0 450
Total Sales Income 5,200 17,745
ExpenditureDirect CostsCow and Buffalo
Feeding (grazing) sum year - - - - - - Feeding (roughage) sum year 1.0 2,330.0 2,330 1.0 3,075.0 3,075 Feeding (concentrate) sum year - - - 40.0 5.0 200 Vet and Med sum year - - - 1.0 100.0 100 Other sum year - - - 1.0 1,000.0 1,000
GoatFeeding sum year - - - 720.0 10.0 7,200 Vet and Med sum year - - - - - - Other sum year - - - - - -
PoultryOther sum year - - - 90.0 5.0 450
Total Direct Costs 2,330 12,025
Overhead CostsEquipment repairs sum year - - - - - - Total Overhead Costs - -
Total Expenditure 2,330 12,025
Net Margin 2,870 5,720
Family Labour Input Days Month - - - - - -
Return to Family Labour
Combined Asset and Cash Value 22,870 40,720
Source: Study of Impact of WIRFP on Net Incomes of Target Households, Jan 2004.
Before / Without Project Situation After / With Project Situation

Table AN11.3.13 Gujarat - Village Lakhana: Individual Household Livestock Detailed Data: WBR - Poor (2).
Item Units PeriodQuantity Unit Price Value Quantity Unit Price Value
(No) (Rs) (Rs/Period) (No) (Rs) (Rs/Period)
Livestock Asset ValueCow
Male head 2 3,080.0 6,160 3 4,000.0 12,000 Female head - - - 1 2,000.0 2,000 Losses head - - - - - -
BuffaloMale head - - - - - - Female head 1 5,000.0 5,000 4 7,500.0 - Losses head - - - - - -
GoatMale head 2 600.0 1,200 4 900.0 3,600 Female head 4 500.0 2,000 5 750.0 3,750 Losses head - - - - - -
PoultryNot Specified head 5 40.0 200 8 80.0 640 Losses head - - - - - -
Total Livestock Assets 14,560 21,990
Annual Increase in Assets year 5 - 1,486
Sales IncomeCow and Buffalo
Milk litres year - - - 550 10.0 5,500 Dung cart year 1.0 400.0 400 1 500.0 500 Draught days year - - - - - - Transport days year - - - - - - Sales no year - - - - - -
GoatMilk litres year 90 6.0 540 180 8.0 1,440 Dung sum year - - - 1 400.0 400 Other - - - - - - - - Sales no year 2 500.0 1,000 2 1,000.0 2,000
PoultrySales no year - - - - - - Other - - - - - - - -
Total Sales Income 1,940 9,840
ExpenditureDirect CostsCow and Buffalo
Feeding (grazing) sum year - - - - - - Feeding (roughage) sum year 1.0 1,500.0 1,500 1.0 4,300.0 4,300 Feeding (concentrate) sum year - - - - - - Vet and Med sum year 1.0 70.0 70 1.0 230.0 230 Other sum year - - - - - -
GoatFeeding sum year - - - - - - Vet and Med sum year - - - - - - Other sum year - - - - - -
PoultryOther sum year - - - - - -
Total Direct Costs 1,570 4,530
Overhead CostsEquipment repairs sum year - - - - - - Total Overhead Costs - -
Total Expenditure 1,570 4,530
Net Margin 370 5,310
Family Labour Input Days Month - - - - - -
Return to Family Labour
Combined Net Margin and Asset 14,930 27,300
Source: Study of Impact of WIRFP on Net Incomes of Target Households, Jan 2004.
Before / Without Project Situation After / With Project Situation

Table AN11.3.14 Gujarat - Village Lakhana: Individual Household Livestock Detailed Data: WBR - Moderate.
Item Units PeriodQuantity Unit Price Value Quantity Unit Price Value
(No) (Rs) (Rs/Period) (No) (Rs) (Rs/Period)
Livestock Asset ValueCow
Male head 2 5,000.0 10,000 2 7,500.0 15,000 Female head - - - 1 5,500.0 5,500 Losses head - - - - - -
BuffaloMale head 1 8,000.0 8,000 - - - Female head - - - 2 9,000.0 18,000 Losses head - - - - - -
GoatMale head - - - 1 1,200.0 Female head 2 600.0 1,200 1 800.0 Losses head - - - - - -
PoultryNot Specified head - - - Losses head - - - 4 75.0 300
Total Livestock Assets 19,200 38,800
Annual Increase in Assets year 5 - 3920
Sales IncomeCow and Buffalo
Milk litres year 250 10.0 2,500 560 12.0 6,720 Dung cart year 1.0 100.0 100 1 500.0 500 Draught days year - - - - - - Transport days year - - - - - - Sales no year - - - - - -
GoatMilk litres year - - - - - - Dung sum year 1 50.0 50 1 100.0 100 Other - - - - - - - - Sales no year - - - - - -
PoultrySales no year - - - - - - Other - - - - - - - -
Total Sales Income 2,650 7,320
ExpenditureDirect CostsCow and Buffalo
Feeding (grazing) sum year - - - - - - Feeding (roughage) sum year 1.0 1,710.0 1,710 1.0 4,620.0 4,620 Feeding (concentrate) sum year - - - - - - Vet and Med sum year - - - - - - Other sum year - - - - - -
GoatFeeding sum year 1.0 80.0 80 1.0 100.0 100 Vet and Med sum year - - - - - - Other sum year - - - - - -
PoultryOther sum year - - - - - -
Total Direct Costs 1,790 4,720
Overhead CostsEquipment repairs sum year - - - - - - Total Overhead Costs - -
Total Expenditure 1,790 4,720
Net Margin 860 2,600
Family Labour Input Days Month - - - - - -
Return to Family Labour
Combined Net Margin and Asset 20,060 41,400
Source: Study of Impact of WIRFP on Net Incomes of Target Households, Jan 2004.
Before / Without Project Situation After / With Project Situation

Table AN11.3.15 Gujarat - Village Lakhana: Individual Household Livestock Detailed Data: WBR - Better Off.
Item Units PeriodQuantity Unit Price Value Quantity Unit Price Value
(No) (Rs) (Rs/Period) (No) (Rs) (Rs/Period)
Livestock Asset ValueCow
Male head 2 7,500.0 15,000 2 10,000.0 20,000 Female head - - - - - - Losses head - - - - - -
BuffaloMale head 1 1,000.0 1,000 1 1,500.0 1,500 Female head 1 5,000.0 5,000 2 15,000.0 30,000 Losses head - - - - - -
GoatMale head - - - - - Female head - - - 7 700.0 4,900 Losses head - - - - - -
PoultryNot Specified head - - - Losses head - - - - - -
Total Livestock Assets 21,000 56,400
Annual Increase in Assets year 5 - 7,080
Sales IncomeCow and Buffalo
Milk litres year - - - 1,150 10.0 11,500 Dung cart year 1.0 400.0 400 2 500.0 1,000 Draught days year - - - - - - Transport days year - - - - - - Sales no year - - - - - -
GoatMilk litres year 35 7.0 245 50 8.0 400 Dung sum year - - - - - - Other - - - - - - - - Sales no year - - - - - -
PoultrySales no year - - - - - - Other - - - - - - - -
Total Sales Income 645 12,900
ExpenditureDirect CostsCow and Buffalo
Feeding (grazing) sum year - - - - - - Feeding (roughage) sum year 1.0 6,700.0 6,700 1.0 13,600.0 13,600 Feeding (concentrate) sum year - - - - - - Vet and Med sum year 3.0 50.0 150 - - Other sum year - - - - - -
GoatFeeding sum year - - - 1.0 150.0 150 Vet and Med sum year - - - 1.0 100.0 100 Other sum year - - - - - -
PoultryOther sum year - - - - - -
Total Direct Costs 6,850 13,850
Overhead CostsEquipment repairs sum year - - - - - - Total Overhead Costs - -
Total Expenditure 6,850 13,850
Net Margin (6,205) (950)
Family Labour Input Days Month - - - - - -
Return to Family Labour
Combined Net Margin and Asset 14,795 55,450
Source: Study of Impact of WIRFP on Net Incomes of Target Households, Jan 2004.
Before / Without Project Situation After / With Project Situation

WIRFP - Phase II - Cost Benefit Analysis
Tables AN11.0 Incremental Benefits
Tables AN11.4 Net Income Study Net Margin Data: Phase II - Madhya Pradesh (MP) - Village Bagoli
Table AN11.4.1 Madhya Pradesh (MP) - Village Bagoli: Weighted Household Crop Net Margin Summary.Table AN11.4.2 Madhya Pradesh (MP) - Village Bagoli: Weighted Household Livestock Net Margin Summary.Table AN11.4.3 A. Madhya Pradesh (MP) - Village Bagoli: Summary of Net Margin per Household and Area (WBR - All Types).
B. Madhya Pradesh (MP) - Village Bagoli: Net Margin per Household and Area - WBR - Very Poor.C. Madhya Pradesh (MP) - Village Bagoli: Net Margin per Household and Area - WBR - Poor.D. Madhya Pradesh (MP) - Village Bagoli: Net Margin per Household and Area - WBR - Moderate.E. Madhya Pradesh (MP) - Village Bagoli: Net Margin per Household and Area - WBR - Better Off.
Table AN11.4.4 Madhya Pradesh (MP) - Village Bagoli: Individual Household Crop Detailed Data: WBR - Very Poor.Table AN11.4.5 Madhya Pradesh (MP) - Village Bagoli: Individual Household Crop Detailed Data: WBR - Poor.Table AN11.4.6 Madhya Pradesh (MP) - Village Bagoli: Individual Household Crop Detailed Data: WBR - Moderate.Table AN11.4.7 Madhya Pradesh (MP) - Village Bagoli: Individual Household Crop Detailed Data: WBR - Better Off.
Table AN11.4.8 Madhya Pradesh (MP) - Village Bagoli: Individual Household Livestock Detailed Data: WBR - Very Poor.Table AN11.4.9 Madhya Pradesh (MP) - Village Bagoli: Individual Household Livestock Detailed Data: WBR - Poor.Table AN11.4.10 Madhya Pradesh (MP) - Village Bagoli: Individual Household Livestock Detailed Data: WBR - Moderate.Table AN11.4.11 Madhya Pradesh (MP) - Village Bagoli: Individual Household Livestock Detailed Data: WBR - Better Off.

Table AN11.4.1 Madhya Pradesh (MP) - Village Bagoli: Weighted Household Crop Net Margin Summary.
Item WBR(%) Khalif Rabi Total Khalif Rabi Total Khalif Rabi Total
Unit Area Analysis (Economic):
WBR - Very Poor 25%Household Crop Net Margin (Rs) 240 - 240 2,673 - 2,673 2,434 - 2,434 Area Planted (bigha) 3.0 - 3.0 3.0 - 3.0 - - - Crop Net Margin / bigha (Rs) 80 - 80 891 - 891 811 - 811 Crop Net Margin / hectare (RS) \1 399 - 399 4,455 - 4,455 4,056 - 4,056
WBR - Poor 25%Household Crop Net Margin (Rs) 128 - 128 2,952 - 2,952 2,824 - 2,824 Area Planted (bigha) 5.5 - 5.5 5.5 - 5.5 - - - Crop Net Margin / bigha (Rs) 23 - 23 537 - 537 513 - 513 Crop Net Margin / hectare (RS) \1 116 - 116 2,684 - 2,684 2,567 - 2,567
WBR - Moderate 25%Household Crop Net Margin (Rs) 35 - 35 3,645 1,708 5,353 3,610 1,708 5,318 Area Planted (bigha) 5.0 - 5.0 5.0 5.0 10.0 - 5.0 5.0 Crop Net Margin / bigha (Rs) 7 - 7 729 342 1,071 722 342 1,064 Crop Net Margin / hectare (RS) \1 35 - 35 3,645 1,708 5,353 3,610 1,708 5,318
WBR - Better Off 25%Household Crop Net Margin (Rs) 4,485 - 4,485 21,093 - 21,093 16,608 - 16,608 Area Planted (bigha) 8 - 8 8 - 8 - - - Crop Net Margin / bigha (Rs) 561 - 561 2,637 - 2,637 2,076 - 2,076 Crop Net Margin / hectare (RS) \1 2,803 - 2,803 13,183 - 13,183 10,380 - 10,380
WBR - Weighted 100%Household Crop Net Margin (Rs) 1,222 - 1,222 7,591 427 8,018 6,369 427 6,796 Crop Net Margin / bigha (Rs) 168 - 168 1,198 85 1,284 1,031 85 1,116 Crop Net Margin / hectare (RS) \1 838 - 838 5,992 427 6,419 5,153 427 5,580
Source: Study of Impact of WIRFP on Net Incomes of Target Households, Jan 2004.WBR = GVT Well Being Ranking.\1 One hectare equivalent to bigha = 5.0
Before / Without Project After / With Project Increment

Table AN11.4.2 Madhya Pradesh (MP) - Village Bagoli: Weighted Household Livestock Net Margin Summary.
Item WBR(%) Herd Value Net Margin Herd Value Net Margin Herd Value Net Margin
Household Livestock Analysis
Well Being Ranking - Very Poor 25%Household Net Margin (Rs) - financial 5,200 125.0 5,650 3,910.0 90 3,785.0 Labour (person days) 12 36 24 Labour Value (Rs) - economic \1 300 900 600 Household Net Margin (Rs) - economic (175.0) 3,010.0 3,185.0
Well Being Ranking - Poor 25%Household Net Margin (Rs) - financial 7,000 320.0 25,825 3,615.0 3,765 3,295.0 Labour (person days) 12 36 24 Labour Value (Rs) - economic \1 300 900 600 Household Net Margin (Rs) - economic 20.0 2,715.0 2,695.0
Well Being Ranking - Moderate 25%Household Net Margin (Rs) - financial 7,850 8,710.3 15,240 10,299.0 1,478 1,588.8 Labour (person days) 36 48 12 Labour Value (Rs) - economic \1 900 1,200 300 Household Net Margin (Rs) - economic 7,810.3 9,099.0 1,288.8
Well Being Ranking - Better Off 25%Household Net Margin (Rs) - financial 5,800 5,640.0 38,900 6,380.0 6,620 740.0 Labour (person days) 24 36 12 Labour Value (Rs) - economic \1 600 900 300 Household Net Margin (Rs) - economic 5,040.0 5,480.0 440.0
Well Being Ranking - Weighted 100%Household Net Margin (Rs) - financial 6,463 3,698.8 21,404 6,051.0 2,988 2,352.2 Household Net Margin (Rs) - economic 3,173.8 5,076.0 1,902.2
Source: Study of Impact of WIRFP on Net Incomes of Target Households, Jan 2004.
\1 Herd value increment averaged over five years.\2 Average annual daily value of family labour assumed = Rs/day 25.0 WBR = GVT Well Being Ranking.
Before / Without Project After / With Project Increment \1

Table AN11.4.3 A. Madhya Pradesh (MP) - Village Bagoli: Summary of Net Margin per Household and Area (WBR - All Types).
ItemVery Poor Poor Moderate Better OffIncrement Increment Increment Increment
Household (HH) Analysis:Crop Revenvue (Rs/HH)
Crop 2,800 4,025 9,110 18,860 Residue 551 875 2,173 2,655
Total Crop Revenue 3,351 4,900 11,283 21,515
Production Costs (Rs/HH)Variable Costs 947 (4) 4,585 1,822
Gross Margin - Financial 2,404 4,904 6,698 19,693 Labour Input (person days) (2) (114) 48 58
Return per Person Day (Rs/p/day) (1,202) (43) 140 340
Labour Costs - Economic \1 (30) 2,080 1,380 3,085 Total Productioon Costs (Rs/HH) 917 2,076 5,965 4,907
Net Margin (Rs/HH) - Economic 2,434 2,824 5,318 16,608
Area planted (bigha) - - 5.0 - Cropping Intensity (percent)
Unit Area Analysis - Economic:Net Margin (Rs/bigha) 811 513 1,064 2,076 Net Margin (Rs/hectare) \2 4,056 2,567 5,318 10,380
Source: Study of Impact of WIRFP on Net Incomes of Target Households, Jan 2004.\1 Adjusted for labour costs.\2 One hectare equivalent to bigha =
Well Being Ranking

Table AN11.4.3
Item
Household (HH) Analysis:Crop Revenvue (Rs/HH)
CropResidue
Total Crop Revenue
Production Costs (Rs/HH)Variable Costs
Gross Margin - FinancialLabour Input (person days)
Return per Person Day (Rs/p/day)
Labour Costs - Economic \1Total Productioon Costs (Rs/HH)
Net Margin (Rs/HH) - Economic
Area planted (bigha)Cropping Intensity (percent)
Unit Area Analysis - Economic:Net Margin (Rs/bigha)Net Margin (Rs/hectare) \2
Source: \1 Adjusted for labour costs.\2 One hectare equivalent to bigha =
B. Madhya Pradesh (MP) - Village Bagoli: Net Margin per Household and Area - WBR - Very Poor.
Khalif Rabi Total Khalif Rabi Total Khalif Rabi Total
4,000 - 4,000 6,800 - 6,800 2,800 - 2,800 550 - 550 1,100 - 1,100 551 - 551
4,550 - 4,550 7,900 - 7,900 3,351 - 3,351
2,555 - 2,555 3,502 - 3,502 947 - 947 1,995 - 1,995 4,398 - 4,398 2,404 - 2,404
72 - 72 70 - 70 (2) - (2)
28 - 28 63 - 63 (1,202) - (1,202)
1,755 - 1,755 1,725 - 1,725 (30) - (30) 4,310 - 4,310 5,227 - 5,227 917 - 917
240 - 240 2,673 - 2,673 2,434 - 2,434
3.0 - 3.0 3.0 - 3.0 - - - 100% 0% 100% 100% 0% 100% 0% #DIV/0! 0%
80 - 80 891 - 891 811 - 811 399 - 399 4,455 - 4,455 4,056 - 4,056
Study of Impact of WIRFP on Net Incomes of Target Households, Jan 2004.
5.0
Well Being Ranking - Very PoorBefore / Without Project After / With Project Increment

Table AN11.4.3
Item
Household (HH) Analysis:Crop Revenvue (Rs/HH)
CropResidue
Total Crop Revenue
Production Costs (Rs/HH)Variable Costs
Gross Margin - FinancialLabour Input (person days)
Return per Person Day (Rs/p/day)
Labour Costs - Economic \1Total Productioon Costs (Rs/HH)
Net Margin (Rs/HH) - Economic
Area planted (bigha)Cropping Intensity (percent)
Unit Area Analysis - Economic:Net Margin (Rs/bigha)Net Margin (Rs/hectare) \2
Source: \1 Adjusted for labour costs.\2 One hectare equivalent to bigha =
C. Madhya Pradesh (MP) - Village Bagoli: Net Margin per Household and Area - WBR - Poor.
Khalif Rabi Total Khalif Rabi Total Khalif Rabi Total
4,800 - 4,800 8,825 - 8,825 4,025 - 4,025 1,075 - 1,075 1,950 - 1,950 875 - 875 5,875 - 5,875 10,775 - 10,775 4,900 - 4,900
3,077 - 3,077 3,073 - 3,073 (4) - (4) 2,798 - 2,798 7,702 - 7,702 4,904 - 4,904
114 - 114 - - - (114) - (114)
25 - 25 - - - (43) - (43)
2,670 - 2,670 4,750 - 4,750 2,080 - 2,080 5,747 - 5,747 7,823 - 7,823 2,076 - 2,076
128 - 128 2,952 - 2,952 2,824 - 2,824
5.5 - 5.5 5.5 - 5.5 - - - 100% 0% 100% 100% 0% 100% 0% #DIV/0! 0%
23 - 23 537 - 537 513 - 513 116 - 116 2,684 - 2,684 2,567 - 2,567
Study of Impact of WIRFP on Net Incomes of Target Households, Jan 2004.Gini Curve
Well Being Ranking - PoorBefore / Without Project After / With Project Increment

Table AN11.4.3
Item
Household (HH) Analysis:Crop Revenvue (Rs/HH)
CropResidue
Total Crop Revenue
Production Costs (Rs/HH)Variable Costs
Gross Margin - FinancialLabour Input (person days)
Return per Person Day (Rs/p/day)
Labour Costs - Economic \1Total Productioon Costs (Rs/HH)
Net Margin (Rs/HH) - Economic
Area planted (bigha)Cropping Intensity (percent)
Unit Area Analysis - Economic:Net Margin (Rs/bigha)Net Margin (Rs/hectare) \2
Source: \1 Adjusted for labour costs.\2 One hectare equivalent to bigha =
D. Madhya Pradesh (MP) - Village Bagoli: Net Margin per Household and Area - WBR - Moderate.
Khalif Rabi Total Khalif Rabi Total Khalif Rabi Total
3,590 - 3,590 8,500 4,200 12,700 4,910 4,200 9,110 790 - 790 1,463 1,500 2,963 673 1,500 2,173
4,380 - 4,380 9,963 5,700 15,663 5,583 5,700 11,283
2,650 - 2,650 4,143 3,092 7,235 1,493 3,092 4,585 1,730 - 1,730 5,820 2,608 8,428 4,090 2,608 6,698
62 - 62 80 30 110 18 30 48
28 - 28 73 87 77 227 87 140
1,695 - 1,695 2,175 900 3,075 480 900 1,380 4,345 - 4,345 6,318 3,992 10,310 1,973 3,992 5,965
35 - 35 3,645 1,708 5,353 3,610 1,708 5,318
5.0 - 5.0 5.0 5.0 10.0 - 5.0 5.0 100% 0% 100% 100% 100% 200% 91%
7 - 7 729 342 1,071 722 342 1,064 35 - 35 3,645 1,708 5,353 3,610 1,708 5,318
Study of Impact of WIRFP on Net Incomes of Target Households, Jan 2004.
After / With Project IncrementBefore / Without ProjectWell Being Ranking - Moderate

Table AN11.4.3
Item
Household (HH) Analysis:Crop Revenvue (Rs/HH)
CropResidue
Total Crop Revenue
Production Costs (Rs/HH)Variable Costs
Gross Margin - FinancialLabour Input (person days)
Return per Person Day (Rs/p/day)
Labour Costs - Economic \1Total Productioon Costs (Rs/HH)
Net Margin (Rs/HH) - Economic
Area planted (bigha)Cropping Intensity (percent)
Unit Area Analysis - Economic:Net Margin (Rs/bigha)Net Margin (Rs/hectare) \2
Source: \1 Adjusted for labour costs.\2 One hectare equivalent to bigha =
E. Madhya Pradesh (MP) - Village Bagoli: Net Margin per Household and Area - WBR - Better Off.
Khalif Rabi Total Khalif Rabi Total Khalif Rabi Total
8,800 - 8,800 27,660 - 27,660 18,860 - 18,860 1,620 - 1,620 4,275 - 4,275 2,655 - 2,655
10,420 - 10,420 31,935 - 31,935 21,515 - 21,515
3,100 - 3,100 4,922 - 4,922 1,822 - 1,822 7,320 - 7,320 27,013 - 27,013 19,693 - 19,693
110 - 110 168 - 168 58 - 58
67 - 67 161 - 161 340 - 340
2,835 - 2,835 5,920 - 5,920 3,085 - 3,085 5,935 - 5,935 10,842 - 10,842 4,907 - 4,907
4,485 - 4,485 21,093 - 21,093 16,608 - 16,608
8.0 - 8.0 8.0 - 8.0 - - - 100% 0% 100% 100% 0% 100% 0%
561 - 561 2,637 - 2,637 2,076 - 2,076 2,803 - 2,803 13,183 - 13,183 10,380 - 10,380
Study of Impact of WIRFP on Net Incomes of Target Households, Jan 2004.
Well Being Ranking - Better OffBefore / Without Project After / With Project Increment

Table AN11.4.4 Madhya Pradesh (MP) - Village Bagoli: Individual Household Crop Detailed Data: WBR - Very Poor.
Unit Area Qty Price Value Area Qty Price Value Area Qty Price Value Area Qty Price Value
By Economic Class: \1 VP Crop: Maize\Cotton Crop: Crop: Crop:Jower
RevenueCrop CropA. Maize bigha 2 250 6.0 1,500 1.5 400 7.0 2,800 - - - - - - - - B. Cotton bigha - 100 22.0 2,200 - 100 20.0 2,000 - - - - - - - - C. Jower bigha 1 60 5.0 300 1.5 80 25.0 2,000 - - - - - - - - D. - bigha - - - - - - - - - - - - - - - - By product By productA. Maize Sum - 1.3 250 313 - 2.0 300 600 - - - - - - - - B. Cotton Sum - 1.0 180 180 - 1.0 250 250 - - - - - - - - C. Jower Sum - 0.3 190 57 - 1.0 250 250 - - - - - - - - D. - Sum - - - - - - - - - - - - - - - -
Total Revenue 4,550 7,900 - -
Variable CostsSeedA. Maize kg 10 6.0 60 7.5 18.0 135 - - - - - - B. Cotton kg - - - - - - - - - - - - C. Jower kg 5 5.0 25 10 15.0 150 - - - - - - D. - kg - - - - - - - - - - - - FertiliserA. Urea kg 100 5.0 500 100 5.0 500 - - - - - - B. DAP kg - - - - - - - - - - - - C. FYM Load 2 100.0 200 1 300.0 300 - - - - - - Pesticide kg - - - - - - - - - - - - Irrigation Rounds - - - - - - - - - - - - Subtotal 785 1,085 - -
Draught Days 12 100.0 1,200 12 100.0 1,200 - - - - - - Repairs Sum 1 30.0 30 1 55.0 55 - - - - - - Thrashing Rate - - - 4 20.0 80 - - - - Storage Sum 1 40.0 40 1 50.0 50 - - - - - - Transport Sum 1 20.0 20 1 24.0 24 - - - - - - Credit Rs 600 80% 480 2,400 42% 1,008 - - - - - -
Total Variable Costs 2,555 3,502 - -
Labour Costs P/daysLand Prep 15 30 450 13 30 390 - - - - - - Sowing 10 30 300 8 30 240 - - - - - - Weeding 27 15 405 25 15 375 - - - - - - Fert App 2 30 60 2 30 60 - - - - - - Pest App - - - 8 30 240 - - - - - - Irrigation - - - - - - - - - - - - Harvest 12 30 360 10 30 300 - - - - - - Storage 6 30 180 4 30 120 - - - - - -
Total Labour Costs 72 1,755 70 1,725 - - - -
Total Production Costs 4,310 5,227 - -
Net Margin / Household (Economic) 240 2,673 - -
Return per Person Day (Financial) 27.7 62.8 #DIV/0! #DIV/0!
Source: Study of Impact of WIRFP on Net Incomes of Target Households, Jan 2004.\1 Economic class VP = Very poor, P = Poor, M = Moderate, BO = Better off.
Kharif: Rabi:With projectWithout project Without Project With Project

Table A11.3.5 Madhya Pradesh (MP) - Village Bagoli: Individual Household Crop Detailed Data: WBR - Poor.
Unit Area Qty Price Value Area Qty Price Value Area Qty Price Value Area Qty Price Value
By Economic Class: \1 P Crop: Maize\Cotton Crop: Maize\Cotton Crop: Chick Pea Crop:Tuar Tuar WheatMixed Crops Mixed
RevenueCrop CropA. Maize bigha 3.0 500 6.0 3,000 3.0 600 7.0 4,200 - - - - - - - - B. Cotton bigha - 150 12.0 1,800 - 150 20.0 3,000 - - - - - - - - C. Tuar bigha 2.0 100 - - 2.0 150 5.0 750 - - - - - - - - D. Mixed bigha 0.5 - - - 0.5 35 25.0 875 - - - - - - - - By product By productA. Maize Sum - 2.0 300 600 - 4.0 300 1,200 - - - - - - - - B. Cotton Sum - 1.5 250 375 - 1.5 250 375 - - - - - - - - C. Tuar Sum - 0.5 200 100 - 1.5 250 375 - - - - - - - - D. Mixed Sum - - - - - - - - - - - - - - - -
Total Revenue 5,875 10,775 - -
Variable CostsSeedA. Maize kg 10 3.0 30 10 6.0 60 - - - - - - B. Cotton kg 5 8.0 40 5 10.0 50 - - - - - - C. Tuar kg 2 2.0 4 2 5.0 10 - - - - - - D. Mixed kg 2 19.0 38 2 25.0 50 - - - - - - FertiliserA. Urea kg 100 3.0 300 100 5.0 500 - - - - - - B. DAP kg - - - - - - - - - - - - C. FYM Load 2 100.0 200 - - - - - - - - - Pesticide kg - - - 1 300.0 300 - - - - - - Irrigation Rounds - - - - - - - - - - - - Subtotal 612 970 - -
Draught Days 20 100.0 2,000 15 100.0 1,500 - - - - - - Repairs Sum 1 25.0 25 1 55.0 55 - - - - - - Thrashing Rate - - - 6 20.0 120 - - - - Storage Sum 1 40.0 40 1 200.0 200 - - - - - - Transport Sum - - - 1 100.0 100 - - - - - - Credit Rs 500 80% 400 800 16% 128 - - - - - -
Total Variable Costs 3,077 3,073 - -
Labour Costs P/daysLand Prep 28 30 840 20 50 1,000 - - - - - - Sowing 12 30 360 8 50 400 - - - - - - Weeding 50 15 750 20 25 500 - - - - - - Fert App 2 30 60 6 50 300 - - - - - - Pest App - - - 1 50 50 - - - - - - Irrigation - - - - - - - - - - - - Harvest 16 30 480 40 50 2,000 - - - - - - Storage 6 30 180 10 50 500 - - - - - -
Total Labour Costs 114 2,670 105 4,750 - - - -
Total Production Costs 5,747 7,823 - -
Net Margin / Household (Economic) 128 2,952 - -
Return per Person Day (Financial) 24.5 73.4 #DIV/0! #DIV/0!
Source: Study of Impact of WIRFP on Net Incomes of Target Households, Jan 2004.\1 Economic class VP = Very poor, P = Poor, M = Moderate, BO = Better off.
Kharif: Rabi:With projectWithout project Without Project With Project

Table AN11.4.6 Madhya Pradesh (MP) - Village Bagoli: Individual Household Crop Detailed Data: WBR - Moderate.
Unit Area Qty Price Value Area Qty Price Value Area Qty Price Value Area Qty Price Value
By Economic Class: \1 Crop: Maize\Cotton Crop: Maize\Cotton Crop: Chick Pea Crop:Maize Maize WheatTuar Tuar
RevenueCrop CropA. Maize bigha 1 450 5.0 2,250 1 600 7.0 4,200 Wheat - - - - 5 600 7.0 4,200 B. Cotton bigha - 100 12.0 1,200 - 200 20.0 4,000 - - - - - - - - C. Maize bigha 2 - - - 2 - - - - - - - - - - - D. Tuar bigha 2 35 4.0 140 2 60 5.0 300 - - - - - - - - By product By productA. Maize Sum - 2.25 250 563 - 3.00 300 900 Wheat - - - - - 6.0 250 1,500 B. Cotton Sum - 1.00 180 180 - 2.00 250 500 - - - - - - - - C. Maize Sum - - - - - - - - - - - - - - - - D. Tuar Sum - 0.25 190 48 - 0.25 250 63 - - - - - - - -
Total Revenue 4,380 9,963 - 5,700
Variable CostsSeedA. Maize kg 10 3.0 30 3 6.0 18 Wheat - - - 100 9.0 900 B. Cotton kg 3 4.0 12 10 8.0 80 - - - - - - C. Maize kg 10 3.0 30 10 6.0 60 - - - - - - D. Tuar kg 5 2.0 10 5 5.0 25 - - - - - - FertiliserA. Urea kg 200 5.2 1,040 200 5.2 1,040 - - - 50 4.0 200 B. DAP kg - - - - - - - - - 50 3.2 160 C. FYM Load - - - - - - - - - - - - Pesticide kg - - - 2 300.0 600 - - - - - - Irrigation Rounds - - - - - - - - - 1 1,000.0 1,000 Subtotal 1,122 1,823 - 2,260
Draught Days 15 100.0 1,500 20 100.0 2,000 - - - 6 100.0 600 Repairs Sum 1 25.0 25 1 60.0 60 - - - 1 60.0 60 Thrashing Rate - - - - - - - - - 6 12.0 72 Storage Sum 1 3.0 3 1 20.0 20 - - - 1 100.0 100 Transport Sum - - - 1 120.0 120 - - - - - - Credit \1 Rs - 0.0% - 750 16% 120 - - - - - -
Total Variable Costs 2,650 4,143 - 3,092
Labour Costs P/daysLand Prep 23 30 690 23 30 690 - - - 10 30 300 Sowing 10 30 300 10 30 300 - - - 2 30 60 Weeding 11 15 165 15 15 225 - - - - - - Fert App 1 30 30 2 30 60 - - - 1 30 30 Pest App - - - 12 30 360 - - - - - - Irrigation - - - - - - - - - 5 30 150 Harvest 11 30 330 12 30 360 - - - 8 30 240 Storage 6 30 180 6 30 180 - - - 4 30 120
Total Labour Costs 62 1,695 80 2,175 - - 30 900
Total Production Costs 4,345 6,318 - 3,992
Net Margin / Household (Economic) 35 3,645 - 1,708
Return per Person Day (Financial) 27.9 72.7 #DIV/0! 86.9
Source: Study of Impact of WIRFP on Net Incomes of Target Households, Jan 2004.\1 Economic class VP = Very poor, P = Poor, M = Moderate, BO = Better off.
\1 Credit costs adjusted.
Kharif: Rabi:With projectWithout project Without Project With Project
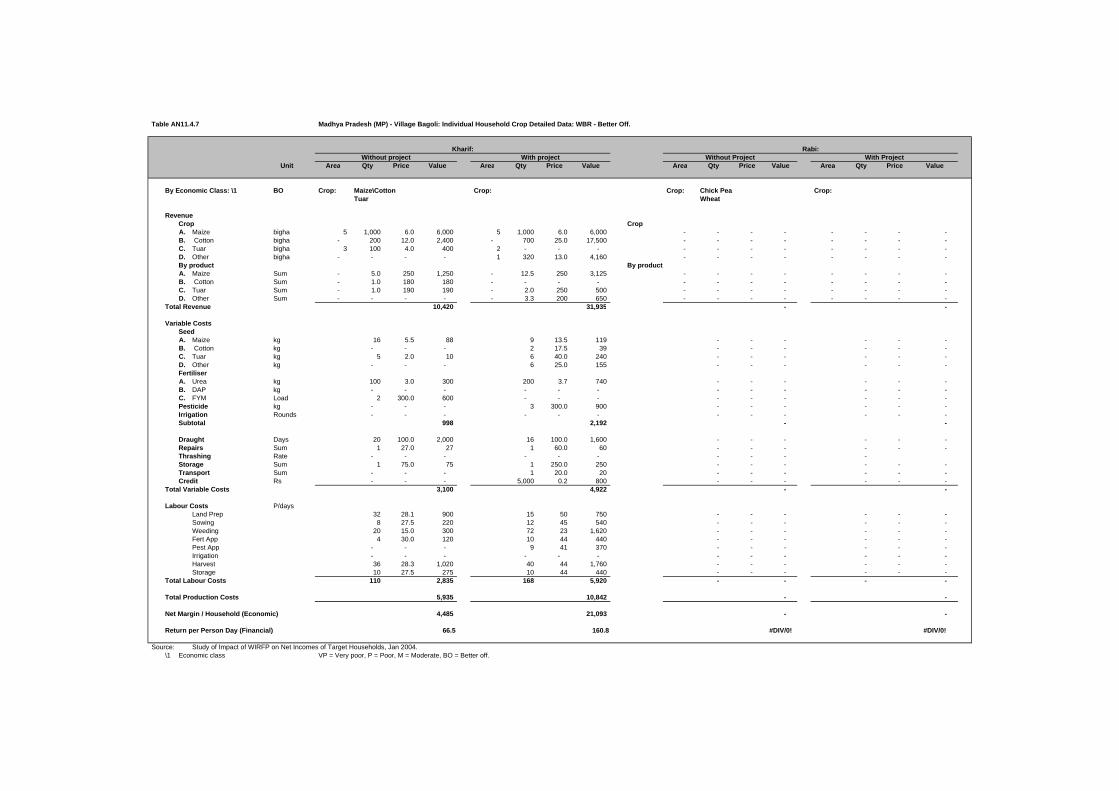
Table AN11.4.7 Madhya Pradesh (MP) - Village Bagoli: Individual Household Crop Detailed Data: WBR - Better Off.
Unit Area Qty Price Value Area Qty Price Value Area Qty Price Value Area Qty Price Value
By Economic Class: \1 BO Crop: Maize\Cotton Crop: Crop: Chick Pea Crop:Tuar Wheat
RevenueCrop CropA. Maize bigha 5 1,000 6.0 6,000 5 1,000 6.0 6,000 - - - - - - - - B. Cotton bigha - 200 12.0 2,400 - 700 25.0 17,500 - - - - - - - - C. Tuar bigha 3 100 4.0 400 2 - - - - - - - - - - - D. Other bigha - - - - 1 320 13.0 4,160 - - - - - - - - By product By productA. Maize Sum - 5.0 250 1,250 - 12.5 250 3,125 - - - - - - - - B. Cotton Sum - 1.0 180 180 - - - - - - - - - - - - C. Tuar Sum - 1.0 190 190 - 2.0 250 500 - - - - - - - - D. Other Sum - - - - - 3.3 200 650 - - - - - - - -
Total Revenue 10,420 31,935 - -
Variable CostsSeedA. Maize kg 16 5.5 88 9 13.5 119 - - - - - - B. Cotton kg - - - 2 17.5 39 - - - - - - C. Tuar kg 5 2.0 10 6 40.0 240 - - - - - - D. Other kg - - - 6 25.0 155 - - - - - - FertiliserA. Urea kg 100 3.0 300 200 3.7 740 - - - - - - B. DAP kg - - - - - - - - - - - - C. FYM Load 2 300.0 600 - - - - - - - - - Pesticide kg - - - 3 300.0 900 - - - - - - Irrigation Rounds - - - - - - - - - - - - Subtotal 998 2,192 - -
Draught Days 20 100.0 2,000 16 100.0 1,600 - - - - - - Repairs Sum 1 27.0 27 1 60.0 60 - - - - - - Thrashing Rate - - - - - - - - - - Storage Sum 1 75.0 75 1 250.0 250 - - - - - - Transport Sum - - - 1 20.0 20 - - - - - - Credit Rs - - - 5,000 0.2 800 - - - - - -
Total Variable Costs 3,100 4,922 - -
Labour Costs P/daysLand Prep 32 28.1 900 15 50 750 - - - - - - Sowing 8 27.5 220 12 45 540 - - - - - - Weeding 20 15.0 300 72 23 1,620 - - - - - - Fert App 4 30.0 120 10 44 440 - - - - - - Pest App - - - 9 41 370 - - - - - - Irrigation - - - - - - - - - - - - Harvest 36 28.3 1,020 40 44 1,760 - - - - - - Storage 10 27.5 275 10 44 440 - - - - - -
Total Labour Costs 110 2,835 168 5,920 - - - -
Total Production Costs 5,935 10,842 - -
Net Margin / Household (Economic) 4,485 21,093 - -
Return per Person Day (Financial) 66.5 160.8 #DIV/0! #DIV/0!
Source: Study of Impact of WIRFP on Net Incomes of Target Households, Jan 2004.\1 Economic class VP = Very poor, P = Poor, M = Moderate, BO = Better off.
Kharif: Rabi:With projectWithout project Without Project With Project

Table AN11.4.8 Madhya Pradesh (MP) - Village Bagoli: Individual Household Livestock Detailed Data: WBR - Very Poor
Item Units PeriodQuantity Unit Price Value Quantity Unit Price Value
(No) (Rs) (Rs/Period) (No) (Rs) (Rs/Period)
Livestock Asset ValueCow
Male head 2 2,500.0 5,000 1 2,500.0 2,500 Female head - - - - - - Losses head - - - - - -
BuffaloMale head - - - - - - Female head - - - - - - Losses head - - - - - -
GoatMale head - - - 3 650.0 1,950 Female head - - - - - - Losses head - - - - - -
PoultryNot Specified head 2 100.0 200 10 120.0 1,200 Losses head - - - - - -
Total Livestock Assets 5,200 5,650
Annual Increase in Livestock Assets years 5 90
Sales IncomeCow and Buffalo
Milk litres year - - - - - - Dung cart year - - - 1 300.0 300 Draught days year 12 100.0 1,200 12 100.0 1,200 Transport days year - - - - - - Sales no year - - - - - -
GoatMilk litres year - - - - - - Dung sum year - - - - - - Other - - - - - 1 50.0 50 Sales no year - - - - - -
PoultrySales no year - - - 75 50.0 3,750 Other no year - - - 1 200.0 200
Total Sales Income 1,200 5,500
ExpenditureDirect CostsCow and Buffalo
Feeding (grazing) sum month - - - - - - Feeding (roughage) sum month 1 550.0 550 1.0 1,100.0 1,100 Feeding (concentrate) sum month - - - - - Vet and Med sum year 1 400.0 400 1.0 50.0 50 Other sum year - - - - - -
GoatFeeding sum year - - - - - - Vet and Med sum year - - - - - - Other sum year - - - - - -
PoultryOther sum year 1.0 125.0 125 1.0 440.0 440
Total Direct Costs 1,075 1,590
Overhead CostsEquipment repairs sum year - - - - - - Total Overhead Costs - -
Total Expenditure 1,075 1,590
Net Margin 125 3,910
Family Labour Input Days Month - - - - - -
Return to Family Labour
Combined Net Margin and Assets 125 4,000
Source: Study of Impact of WIRFP on Net Incomes of Target Households, Jan 2004.
After / With Project SituationBefore / Without Project Situation
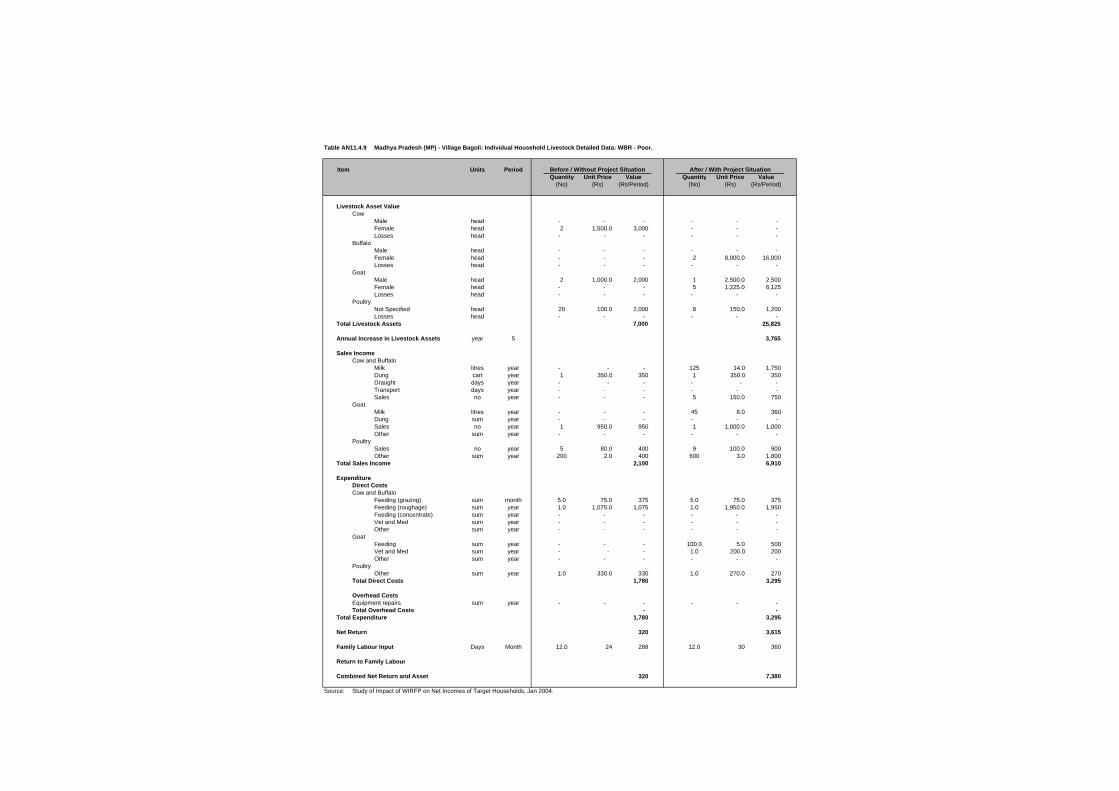
Table AN11.4.9 Madhya Pradesh (MP) - Village Bagoli: Individual Household Livestock Detailed Data: WBR - Poor.
Item Units PeriodQuantity Unit Price Value Quantity Unit Price Value
(No) (Rs) (Rs/Period) (No) (Rs) (Rs/Period)
Livestock Asset ValueCow
Male head - - - - - - Female head 2 1,500.0 3,000 - - - Losses head - - - - - -
BuffaloMale head - - - - - - Female head - - - 2 8,000.0 16,000 Losses head - - - - - -
GoatMale head 2 1,000.0 2,000 1 2,500.0 2,500 Female head - - - 5 1,225.0 6,125 Losses head - - - - - -
PoultryNot Specified head 20 100.0 2,000 8 150.0 1,200 Losses head - - - - - -
Total Livestock Assets 7,000 25,825
Annual Increase in Livestock Assets year 5 3,765
Sales IncomeCow and Buffalo
Milk litres year - - - 125 14.0 1,750 Dung cart year 1 350.0 350 1 350.0 350 Draught days year - - - - - - Transport days year - - - - - - Sales no year - - - 5 150.0 750
GoatMilk litres year - - - 45 8.0 360 Dung sum year - - - - - - Sales no year 1 950.0 950 1 1,000.0 1,000 Other sum year - - - - - -
PoultrySales no year 5 80.0 400 9 100.0 900 Other sum year 200 2.0 400 600 3.0 1,800
Total Sales Income 2,100 6,910
ExpenditureDirect CostsCow and Buffalo
Feeding (grazing) sum month 5.0 75.0 375 5.0 75.0 375 Feeding (roughage) sum year 1.0 1,075.0 1,075 1.0 1,950.0 1,950 Feeding (concentrate) sum year - - - - - - Vet and Med sum year - - - - - - Other sum year - - - - - -
GoatFeeding sum year - - - 100.0 5.0 500 Vet and Med sum year - - - 1.0 200.0 200 Other sum year - - - - - -
PoultryOther sum year 1.0 330.0 330 1.0 270.0 270
Total Direct Costs 1,780 3,295
Overhead CostsEquipment repairs sum year - - - - - - Total Overhead Costs - -
Total Expenditure 1,780 3,295
Net Return 320 3,615
Family Labour Input Days Month 12.0 24 288 12.0 30 360
Return to Family Labour
Combined Net Return and Asset 320 7,380
Source: Study of Impact of WIRFP on Net Incomes of Target Households, Jan 2004.
Before / Without Project Situation After / With Project Situation

Table AN11.4.10 Madhya Pradesh (MP) - Village Bagoli: Individual Household Livestock Detailed Data: WBR - Moderate.
Item Units PeriodQuantity Unit Price Value Quantity Unit Price Value
(No) (Rs) (Rs/Period) (No) (Rs) (Rs/Period)
Livestock Asset ValueCow -
Male head 2 2,000.0 4,000 4 1,500.0 6,000 Female head 3 300.0 900 1 1,000.0 1,000 Losses head - - - - - -
BuffaloMale head - - - - - - Female head - - - 1 2,000.0 2,000 Losses head - - - - - -
GoatMale head 1 400.0 400 1 600.0 600 Female head 9 250.0 2,250 6 700.0 4,200 Losses head - - - - - -
PoultryNot Specified head 3 100.0 300 12 120.0 1,440 Losses head - - - - - -
Total Livestock Assets 7,850 15,240
Annual Increase in Livestock Assets year 5 1,478
Sales IncomeCow and Buffalo
Milk litres year 420 10.0 4,200 180 14.5 2,610 Dung cart year 0.75 275.0 206 1 450.0 450 Draught days year 24 100.0 2,400 30 100.0 3,000 Transport days year - - - 25 100.0 2,500 Sales no year - - - - - -
Goat - - - Milk litres year - - - 11 10.0 110 Dung sum year 1 150.0 150 1 150.0 150 Sales no year 2 750.0 1,500 - - - Other sum year - - - - - -
PoultrySales no year 30 50.0 1,500 85 50.0 4,250 Other sum year 1 135.0 135 1 1,700.0 1,700
Total Sales Income 10,091 14,770
ExpenditureDirect CostsCow and Buffalo
Feeding (grazing) sum year - - - - - - Feeding (roughage) sum year 1.0 750.0 750 1.0 3,000.0 3,000 Feeding (concentrate) sum year - - - - - - Vet and Med sum year 1.0 500.0 500 1.0 100.0 100 Other sum year 1.0 50.0 50 1.0 125.0 125
GoatFeeding sum year 1.0 - - - - - Vet and Med sum year 1.0 6.0 6 1.0 6.0 6 Other sum year - - - - - -
PoultryOther sum year 1.0 75.0 75 1.0 1,000.0 1,000
Total Direct Costs 1,381 4,231
Overhead CostsEquipment repairs sum year - - - 1.0 240.0 240 Total Overhead Costs - 240
Total Expenditure 1,381 4,471
Net Margin 8,710 10,299
Family Labour Input Days Month 12.0 25 300 12.0 29 350
Return to Family Labour
Combined Net Margin and Asset 8,710 11,777
Source: Study of Impact of WIRFP on Net Incomes of Target Households, Jan 2004.
Before / Without Project Situation After / With Project Situation

Table AN11.4.11 Madhya Pradesh (MP) - Village Bagoli: Individual Household Livestock Detailed Data: WBR - Better Off.
Item Units PeriodQuantity Unit Price Value Quantity Unit Price Value
(No) (Rs) (Rs/Period) (No) (Rs) (Rs/Period)
Livestock Asset ValueCow
Male head - - - 1 5,000.0 5,000 Female head 2 1,500.0 3,000 6 2,000.0 12,000 Losses head - - - - - -
BuffaloMale head - - - - - - Female head - - - - - - Losses head - - - - - -
GoatMale head - - 4 1,200.0 4,800 Female head 1 1,000.0 1,000 11 1,500.0 16,500 Losses head - - - - - -
PoultryNot Specified head 15 120.0 1,800 5 120.0 600 Losses head - - - - - -
Total Livestock Assets 5,800 38,900
Annual Increase in Livestock Assets years 5 6,620
Sales IncomeCow and Buffalo
Milk litres year 240 10.0 2,400 480 14.0 6,720 Dung cart year 1.5 300.0 450 3.0 300.0 900 Draught days year 20 100.0 2,000 30 100.0 3,000 Transport days year - - - - - - Sales no year - - - - - -
Goat - - Milk litres year - - - - - - Dung sum year - - - - - - Sales no year 2 750.0 1,500 - - - Other - - - - - - - -
PoultrySales - - 13 70.0 910 15 50.0 750 Other - - - - - - - -
Total Sales Income 7,260 11,370
ExpenditureDirect CostsCow and Buffalo
Feeding (grazing) sum year - - - - - - Feeding (roughage) sum month 1.0 1,620.0 1,620 2.0 2,140.0 4,280 Feeding (concentrate) sum year - - - - - - Vet and Med sum year - - - 1.0 100.0 100 Other sum year - - - - - -
GoatFeeding sum year - - - - - - Vet and Med sum year - - - 1.0 150.0 150 Other sum year - - - - - -
PoultryOther sum year - - - 1.0 460.0 460
Total Direct Costs 1,620 4,990
Overhead CostsEquipment repairs sum year - - - - - - Total Overhead Costs - -
Total Expenditure 1,620 4,990
Net Margin 5,640 6,380
Family Labour Input Days Month 12.0 40 480 12.0 40 480
Return to Family Labour
Combined Net Margin and Asset 5,640 13,000
Source: Study of Impact of WIRFP on Net Incomes of Target Households, Jan 2004.
Before / Without Project Situation After / With Project Situation

WIRFP - Phase II - Cost Benefit Analysis
Tables AN11.0 Incremental Benefits
Tables AN11.5 Net Income Study Crop and Livestock Gross Margin Data: Phase II - State Rajasthan - Village Merana
Table AN11.5.1 Phase II Rajasthan - Village Merana: Weighted Crop Net Margin Summary.Table AN11.5.2 Phase II Rajasthan - Village Merana: Weighted Livestock Net Margin Summary.
Table AN11.5.3 A. Phase II Rajasthan - Village Merana: Summary of Crop Net Margin per Household and Area (WBR - All Types).B. Phase II Rajasthan - Village Merana: Crop Net Margin per Household and Area - WBR - Very Poor (1).C. Phase II Rajasthan - Village Merana: Crop Net Margin per Household and Area - WBR - Very Poor (2).D. Phase II Rajasthan - Village Merana: Crop Net Margin per Household and Area - WBR - Poor.E. Phase II Rajasthan - Village Merana: Crop Net Margin per Household and Area - WBR - Better Off.
Table AN11.5.4 Phase II Rajasthan - Village Merana: Individual Household Detailed Data: WBR - Very Poor (1).Table AN11.5.5 Phase II Rajasthan - Village Merana: Individual Household Detailed Data: WBR - Very Poor (2).Table AN11.5.6 Phase II Rajasthan - Village Merana: Individual Household Detailed Data: WBR - Poor.Table AN11.5.7 Phase II Rajasthan - Village Merana: Individual Household Detailed Data: WBR - Better Off.
Table AN11.5.8 Phase II Rajasthan - Village Merana: Individual Household Livestock Detailed Data: WBR - Very Poor (1).Table AN11.5.9 Phase II Rajasthan - Village Merana: Individual Household Livestock Detailed Data: WBR - Very Poor (2).Table AN11.5.10 Phase II Rajasthan - Village Merana: Individual Household Livestock Detailed Data: WBR - Poor.Table AN11.5.11 Phase II Rajasthan - Village Merana: Individual Household Livestock Detailed Data: WBR - Better Off.
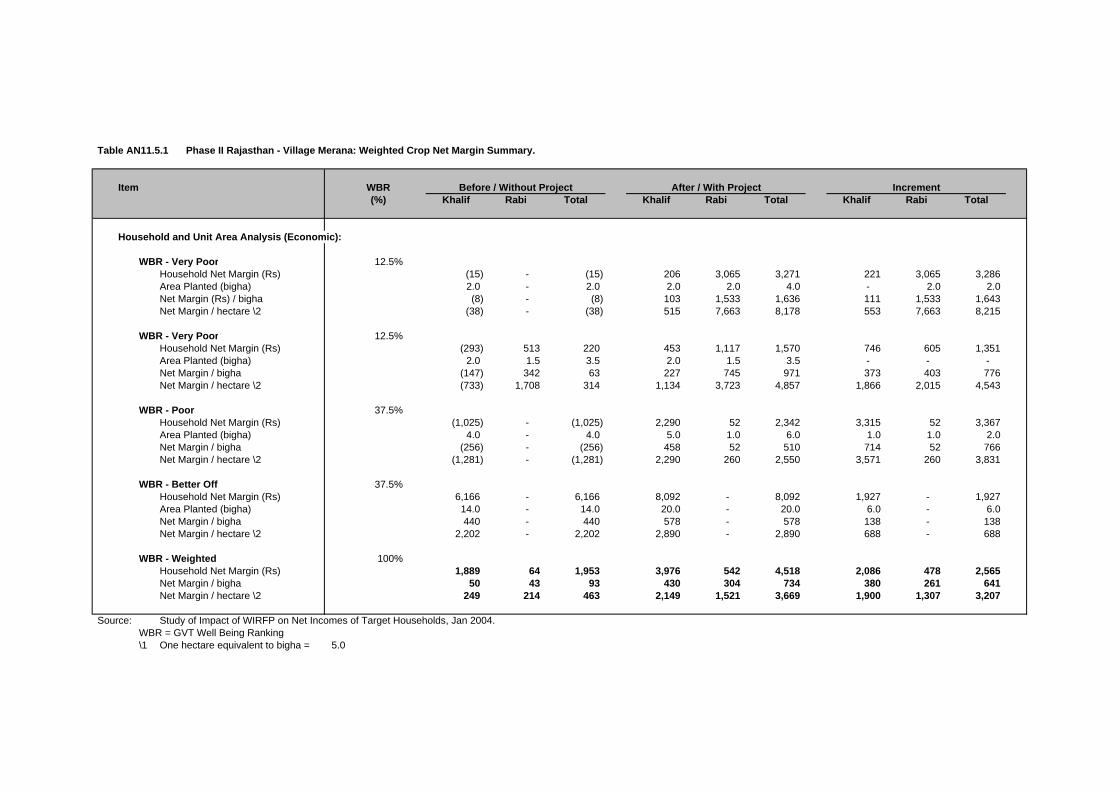
Table AN11.5.1 Phase II Rajasthan - Village Merana: Weighted Crop Net Margin Summary.
Item WBR(%) Khalif Rabi Total Khalif Rabi Total Khalif Rabi Total
Household and Unit Area Analysis (Economic):
WBR - Very Poor 12.5%Household Net Margin (Rs) (15) - (15) 206 3,065 3,271 221 3,065 3,286 Area Planted (bigha) 2.0 - 2.0 2.0 2.0 4.0 - 2.0 2.0 Net Margin (Rs) / bigha (8) - (8) 103 1,533 1,636 111 1,533 1,643 Net Margin / hectare \2 (38) - (38) 515 7,663 8,178 553 7,663 8,215
WBR - Very Poor 12.5%Household Net Margin (Rs) (293) 513 220 453 1,117 1,570 746 605 1,351 Area Planted (bigha) 2.0 1.5 3.5 2.0 1.5 3.5 - - - Net Margin / bigha (147) 342 63 227 745 971 373 403 776 Net Margin / hectare \2 (733) 1,708 314 1,134 3,723 4,857 1,866 2,015 4,543
WBR - Poor 37.5%Household Net Margin (Rs) (1,025) - (1,025) 2,290 52 2,342 3,315 52 3,367 Area Planted (bigha) 4.0 - 4.0 5.0 1.0 6.0 1.0 1.0 2.0 Net Margin / bigha (256) - (256) 458 52 510 714 52 766 Net Margin / hectare \2 (1,281) - (1,281) 2,290 260 2,550 3,571 260 3,831
WBR - Better Off 37.5%Household Net Margin (Rs) 6,166 - 6,166 8,092 - 8,092 1,927 - 1,927 Area Planted (bigha) 14.0 - 14.0 20.0 - 20.0 6.0 - 6.0 Net Margin / bigha 440 - 440 578 - 578 138 - 138 Net Margin / hectare \2 2,202 - 2,202 2,890 - 2,890 688 - 688
WBR - Weighted 100%Household Net Margin (Rs) 1,889 64 1,953 3,976 542 4,518 2,086 478 2,565 Net Margin / bigha 50 43 93 430 304 734 380 261 641 Net Margin / hectare \2 249 214 463 2,149 1,521 3,669 1,900 1,307 3,207
Source: Study of Impact of WIRFP on Net Incomes of Target Households, Jan 2004.WBR = GVT Well Being Ranking\1 One hectare equivalent to bigha = 5.0
Before / Without Project After / With Project Increment

Table AN11.5.2 Phase II Rajasthan - Village Merana: Weighted Livestock Net Margin Summary.
Item WBR(%) Herd Value Net Margin Herd Value Net Margin Herd Value Net Margin
Household Livestock Analysis
Well Being Ranking - Very Poor (1) 12.5%Household Livestock Net Margin (Rs) - financial 15,000 2,865.0 11,000 1,840.0 (800) (1,025.0) Labour (person days) 12 24 12 Labour Value (Rs) - economic \1 300 600 300 Household Livestock Net Margin (Rs) - economic 2,565.0 1,240.0 (1,325.0)
Well Being Ranking - Very Poor (2) 12.5%Household Livestock Net Margin (Rs) - financial 4,300 (65.0) 11,500 1,750.0 1,440 1,815.0 Labour (person days) 12 24 12 Labour Value (Rs) - economic \1 300 600 300 Household Livestock Net Margin (Rs) - economic (365.0) 1,150.0 1,515.0
Well Being Ranking - Poor 37.5%Household Livestock Net Margin (Rs) - financial 10,950 1,648.0 21,100 2,490.0 2,030 842.0 Labour (person days) 12 24 12 Labour Value (Rs) - economic \1 300 600 300 Household Livestock Net Margin (Rs) - economic 1,348.0 1,890.0 542.0
Well Being Ranking - Better Off 37.5%Household Livestock Net Margin (Rs) - financial 11,300 (580.0) 30,320 4,390.0 3,804 4,970.0 Labour (person days) 12 24 12 Labour Value (Rs) - economic \1 300 600 300 Household Livestock Net Margin (Rs) - economic (880.0) 3,790.0 4,670.0
Well Being Ranking - Weighted 100%Household Livestock Net Margin (Rs) - financial 10,756 750.5 22,095 3,028.8 2,268 2,278.3 Household Livestock Net Margin (Rs) - economic 450.5 2,428.8 1,978.3
Source: Study of Impact of WIRFP on Net Incomes of Target Households, Jan 2004.
\1 Herd value increment averaged over five years.\2 Average annual daily value of family labour assumed = Rs/day 25.0
Before / Without Project After / With Project Increment \1

Table AN11.5.3 A. Phase II Rajasthan - Village Merana: Summary of Crop Net Margin per Household and Area (WBR - All Types).
ItemVery Poor (1) Very Poor (2) Poor Better Off
Increment Increment Increment Increment
Household Analysis:Crop Revenvue (Rs/bigha)
Crop 4,950 3,040 4,200 6,540 Residue 1,450 288 1,680 -
Total Crop Revenue 6,400 3,328 5,880 6,540
Production Costs (Rs/bigha)Variable Costs 1,245 1,170 270 2,838
Gross Margin - Financial 5,155 2,158 5,610 3,703 Labour Input (person days) 26 (1) 29 37
Return per Person Day (Rs/p/day) 198 (2,158) 193 100
Labour Costs - Economic \1 1,869 807 2,243 1,776 Total Productioon Costs (Rs/bigha) 3,114 1,977 2,513 4,614
Gross Margin (Rs/bigha) - Economic 3,286 1,351 3,367 1,927
Area planted (bigha) 2 - 2.0 6 Cropping Intensity (percent)
Unit Area Analysis (Rs/unit) - Economic:Gross Margin / bigha 1,643 776 766 138 Gross Margin / hectare \2 8,215 4,543 3,831 688
Source: Study of Impact of WIRFP on Net Incomes of Target Households, Jan 2004.\1 Adjusted for labour costs.\2 One hectare equivalent to bigha =
Well Being Ranking

Table AN11.5.3
Item
Household Analysis:Crop Revenvue (Rs/bigha)
CropResidue
Total Crop Revenue
Production Costs (Rs/bigha)Variable Costs
Gross Margin - FinancialLabour Input (person days)
Return per Person Day (Rs/p/day)
Labour Costs - Economic \1Total Productioon Costs (Rs/bigha)
Gross Margin (Rs/bigha) - Economic
Area planted (bigha)Cropping Intensity (percent)
Unit Area Analysis (Rs/unit) - Economic:Gross Margin / bighaGross Margin / hectare \2
Source:\1 Adjusted for labour costs.\2 One hectare equivalent to bigha =
B. Phase II Rajasthan - Village Merana: Crop Net Margin per Household and Area - WBR - Very Poor (1).
Khalif Rabi Total Khalif Rabi Total Khalif Rabi Total
650 - 650 1,600 4,000 5,600 950 4,000 4,950 550 - 550 1,200 800 2,000 650 800 1,450
1,200 - 1,200 2,800 4,800 7,600 1,600 4,800 6,400
540 - 540 1,010 775 1,785 470 775 1,245 660 - 660 1,790 4,025 5,815 1,130 4,025 5,155 27 - 27 33 20 53 6 20 26
24 - 24 54 201 110 188 201 198
675 - 675 1,584 960 2,544 909 960 1,869 1,215 - 1,215 2,594 1,735 4,329 1,379 1,735 3,114
(15) - (15) 206 3,065 3,271 221 3,065 3,286
2.0 - 2.0 2.0 2.0 4.0 - 2.0 2.0 100% 0% 100% 100% 100% 200% 0% #DIV/0! 100%
(8) - (8) 103 1,533 1,636 111 1,533 1,643 (38) - (38) 515 7,663 8,178 553 7,663 8,215
Study of Impact of WIRFP on Net Incomes of Target Households, Jan 2004.
5.0
Well Being Ranking - Very Poor (1)Before / Without Project After / With Project Increment

Table AN11.5.3
Item
Household Analysis:Crop Revenvue (Rs/bigha)
CropResidue
Total Crop Revenue
Production Costs (Rs/bigha)Variable Costs
Gross Margin - FinancialLabour Input (person days)
Return per Person Day (Rs/p/day)
Labour Costs - Economic \1Total Productioon Costs (Rs/bigha)
Gross Margin (Rs/bigha) - Economic
Area planted (bigha)Cropping Intensity (percent)
Unit Area Analysis (Rs/unit) - Economic:Gross Margin / bighaGross Margin / hectare \2
Source:\1 Adjusted for labour costs.\2 One hectare equivalent to bigha =
C. Phase II Rajasthan - Village Merana: Crop Net Margin per Household and Area - WBR - Very Poor (2).
Khalif Rabi Total Khalif Rabi Total Khalif Rabi Total
480 1,100 1,580 2,750 1,870 4,620 2,270 770 3,040 150 113 263 300 250 550 150 138 288 630 1,213 1,843 3,050 2,120 5,170 2,420 908 3,328
498 300 798 1,733 235 1,968 1,235 (65) 1,170 132 913 1,045 1,317 1,885 3,202 1,185 973 2,158 17 16 33 16 16 32 (1) - (1)
8 57 32 82 118 100 (1,185) - (2,158)
425 400 825 864 768 1,632 439 368 807 923 700 1,623 2,597 1,003 3,600 1,674 303 1,977
(293) 513 220 453 1,117 1,570 746 605 1,351
2.0 1.5 3.5 2.0 1.5 3.5 - - - 100% 75% 175% 100% 75% 175% 0% 0% 0%
(147) 342 63 227 745 971 373 403 776 (733) 1,708.3 314 1,134 3,723 4,857 1,866 2,015 4,543
Study of Impact of WIRFP on Net Incomes of Target Households, Jan 2004.
Well Being Ranking - Very Poor (2)Before / Without Project After / With Project Increment

Table AN11.5.3
Item
Household Analysis:Crop Revenvue (Rs/bigha)
CropResidue
Total Crop Revenue
Production Costs (Rs/bigha)Variable Costs
Gross Margin - FinancialLabour Input (person days)
Return per Person Day (Rs/p/day)
Labour Costs - Economic \1Total Productioon Costs (Rs/bigha)
Gross Margin (Rs/bigha) - Economic
Area planted (bigha)Cropping Intensity (percent)
Unit Area Analysis (Rs/unit) - Economic:Gross Margin / bighaGross Margin / hectare \2
Source:\1 Adjusted for labour costs.\2 One hectare equivalent to bigha =
D. Phase II Rajasthan - Village Merana: Crop Net Margin per Household and Area - WBR - Poor.
Khalif Rabi Total Khalif Rabi Total Khalif Rabi Total
600 - 600 3,500 1,300 4,800 2,900 1,300 4,200 100 - 100 1,600 180 1,780 1,500 180 1,680 700 - 700 5,100 1,480 6,580 4,400 1,480 5,880
800 - 800 650 420 1,070 (150) 420 270 (100) - (100) 4,450 1,060 5,510 4,550 1,060 5,610
37 - 37 45 21 66 8 21 29
(3) - (3) 99 50 83 569 50 193
925 - 925 2,160 1,008 3,168 1,235 1,008 2,243 1,725 - 1,725 2,810 1,428 4,238 1,085 1,428 2,513
(1,025) - (1,025) 2,290 52 2,342 3,315 52 3,367
4.0 - 4.0 5.0 1.0 6.0 1.0 1.0 2.0 100% 0% 100% 100% 20% 120% 100%
(256) - (256) 458 52 510 714 52 766 (1,281) - (1,281) 2,290 260 2,550 3,571 260 3,831
Study of Impact of WIRFP on Net Incomes of Target Households, Jan 2004.
Before / Without Project Well Being Ranking - Poor
After / With Project Increment

Table AN11.5.3
Item
Household Analysis:Crop Revenvue (Rs/bigha)
CropResidue
Total Crop Revenue
Production Costs (Rs/bigha)Variable Costs
Gross Margin - FinancialLabour Input (person days)
Return per Person Day (Rs/p/day)
Labour Costs - Economic \1Total Productioon Costs (Rs/bigha)
Gross Margin (Rs/bigha) - Economic
Area planted (bigha)Cropping Intensity (percent)
Unit Area Analysis (Rs/unit) - Economic:Gross Margin / bighaGross Margin / hectare \2
Source:\1 Adjusted for labour costs.\2 One hectare equivalent to bigha =
E. Phase II Rajasthan - Village Merana: Crop Net Margin per Household and Area - WBR - Better Off.
Khalif Rabi Total Khalif Rabi Total Khalif Rabi Total
7,460 - 7,460 14,000 - 14,000 6,540 - 6,540 2,700 - 2,700 2,700 - 2,700 - - -
10,160 - 10,160 16,700 - 16,700 6,540 - 6,540
923 - 923 3,760 - 3,760 2,838 - 2,838 9,238 - 9,238 12,940 - 12,940 3,703 - 3,703
64 - 64 101 - 101 37 - 37
144 - 144 128 - 128 100 - 100
3,072 - 3,072 4,848 - 4,848 1,776 - 1,776 3,995 - 3,995 8,608 - 8,608 4,614 - 4,614
6,166 - 6,166 8,092 - 8,092 1,927 - 1,927
14.0 - 14.0 20.0 - 20.0 6.0 - 6.0 100% 0% 100% 143% 0% 143% 300%
440 - 440 578 - 578 138 - 138 2,202 - 2,202 2,890 - 2,890 688 - 688
Study of Impact of WIRFP on Net Incomes of Target Households, Jan 2004.
Well Being Ranking - Better OffBefore / Without Project After / With Project Increment

Table AN11.5.4 Phase II Rajasthan - Village Merana: Individual Household Detailed Data: WBR - Very Poor (1).
Unit Area Qty Price Value Area Qty Price Value Area Qty Price Value Area Qty Price Value
By Economic Class: /1 VP (1) Crop: Maize Crop: Maize Crop: Crop: Chick PeaPaddy Paddy Wheat
RevenueCrop CropA. Maize bigha 1 100 4.0 400 1 200 5.0 1,000 Chick Pea - - - - 0.5 80 15.0 1,200 B. Paddy bigha 1 50 5.0 250 1 100 6.0 600 Wheat - - - - 1.0 300 7.0 2,100 C. - bigha - - - - - - - - Other - - - - 0.5 100 7.0 700 D. - bigha - - - - - - - - - - - - - - - - By product By productA. Maize Sum - 1.0 250.0 250 - 1.0 600.0 600 Chick Pea - - - - - 0.5 100 50 B. Paddy Sum - 1.0 300.0 300 - 1.0 600.0 600 Wheat - - - - - 1.0 500 500 C. - Sum - - - - - - - - Other - - - - - 1.0 250 250 D. - Sum - - - - - - - - - - - - - - - -
Total Revenue 1,200 2,800 - 4,800
Variable CostsSeedA. Maize kg 10 4.0 40 12 5.0 60 Chick Pea - - - 20 20.0 400 B. Paddy kg 20 5.0 100 20 10.0 200 Wheat - - - 30 7.0 210 C. - kg - - - - - - Other - - - 20 7.0 140 D. - kg - - - - - - - - - - - - FertiliserA. Urea kg - - - 50 5.0 250 - - - - - - B. DAP kg - - - - - - - - - - - - C. FYM Load 1 400.0 400 1 500.0 500 - - - - - - Pesticide kg - - - - - - - - - - - - Irrigation Rounds - - - - - - - - - - - - Subtotal 540 1,010 - 750
Draught Days - - - - - - - - - - - - Repairs Sum - - - - - - - - - - - - Thrashing Rate - - - - - - - - - - Storage Sum - - - - - - - - - 1 25.0 25 Transport Sum - - - - - - - - - - - - Credit Rs - - - - - - - - - - - -
Total Variable Costs 540 1,010 - 775
Labour Costs P/daysLand Prep 3 25.0 75 4 48.0 192 - - - 4 48 192 Sowing 4 25.0 100 4 48.0 192 - - - 4 48 192 Weeding 8 25.0 200 10 48.0 480 - - - - - - Fert App 2 25.0 50 3 48.0 144 - - - - - - Pest App - - - - - - - - - - - - Irrigation - - - - - - - - - - - - Harvest 8 25.0 200 10 48.0 480 - - - 8 48 384 Storage 2 25.0 50 2 48.0 96 - - - 4 48 192
Total Labour Costs 27 675 33 1,584 - - 20 960
Total Production Costs 1,215 2,594 - 1,735
Net Margin / Household (Economic) (15) 206 - 3,065
Return per Person Day (Financial) 24.4 54.2 #DIV/0! 201.25
Source: Study of Impact of WIRFP on Net Incomes of Target Households, Jan 2004.\1 Economic class VP = Very poor, P = Poor, M = Moderate, BO = Better off.
Kharif: Rabi:With projectWithout project Without Project With Project

Table AN11.5.5 Phase II Rajasthan - Village Merana: Individual Household Detailed Data: WBR - Very Poor (2).
Unit Area Qty Price Value Area Qty Price Value Area Qty Price Value Area Qty Price Value
By Economic Class: \1 P Crop: Maize Crop: Maize Crop: Chick Pea Crop: Chick PeaPigeon Pea Pigeon Pea Wheat Wheat
RevenueCrop CropA. Maize bigha 1.5 100 4.0 400 1.5 250 5.0 1,250 Chick Pea 0.5 50 10.0 500 0.5 50 15.0 750 B. Pigeon Pea bigha 0.5 10 8.0 80 0.5 150 10.0 1,500 Wheat 1.0 100 6.0 600 1.0 160 7.0 1,120 C. - bigha - - - - - - - - - - - - - - - - D. - bigha - - - - - - - - - - - - - - - - By product By productA. Maize Sum - 1.0 150 150 - 1.0 150 150 Chick Pea - 0.75 150.0 113 - 1.0 50 50 B. Pigeon Pea Sum - - - - - 1.0 150 150 Wheat - - - - - 1.0 200 200 C. - Sum - - - - - - - - - - - - - - - - D. - Sum - - - - - - - - - - - - - - - -
Total Revenue 630 3,050 1,213 2,120
Variable CostsSeedA. Maize kg 10 4.0 40 12 5.0 60 Chick Pea 10 10.0 100 10 12.5 125 B. Pigeon Pea kg 1 8.0 8 1 13.0 13 Wheat 10 5.0 50 10 5.0 50 C. - kg - - - - - - - - - - - - D. - kg - - - - - - - - - - - - FertiliserA. Urea kg - - - 50 5.0 250 - - - - - - B. DAP kg - - - - - - - - - - - - C. FYM Load 0.5 400.0 200 1 500.0 500 - - - - - - Pesticide kg - - - - - - - - - - - - Irrigation Rounds - - - - - - - - - - - - Subtotal 248 823 150 175
Draught Days - - - - - - - - - - - - Repairs Sum - - - - - - - - - - - - Thrashing Rate - - - - - - - - - - Storage Sum - - - 1 200.0 200 - - - - - - Transport Sum - - - - - - - - - - - - Credit Rs 5,000 5% 250 1,600 44% 710 500 30% 150 200 30% 60
Total Variable Costs 498 1,733 300 235
Labour Costs P/daysLand Prep 4 25 100 4 48 192 4 25 100 4 48 192 Sowing 2 25 50 2 48 96 2 25 50 2 48 96 Weeding 2 25 50 2 48 96 2 25 50 2 48 96 Fert App 1 25 25 2 48 96 - - - - - - Pest App - - - - - - - - - - - - Irrigation - - - - - - - - - - - - Harvest 6 25 150 6 48 288 6 25 150 6 48 288 Storage 2 25 50 2 48 96 2 25 50 2 48 96
Total Labour Costs 17 425 18 864 16 400 16 768
Total Production Costs 923 2,597 700 1,003
Net Margin / Household (Economic) (293) 453 513 1,117
Return per Person Day (Financial) 7.8 73.2 57.0 117.8
Source: Study of Impact of WIRFP on Net Incomes of Target Households, Jan 2004.\1 Economic class VP = Very poor, P = Poor, M = Moderate, BO = Better off.
Kharif: Rabi:With projectWithout project Without Project With Project

Table AN11.5.6 Phase II Rajasthan - Village Merana: Individual Household Detailed Data: WBR - Poor.
Unit Area Qty Price Value Area Qty Price Value Area Qty Price Value Area Qty Price Value
By Economic Class: \1 P (1) Crop: Maize Crop: Maize Crop: - Crop: Chick PeaPaddy Paddy - Wheat
- OtherRevenue
Crop CropA. Maize bigha 3.0 100 4.0 400 3.0 500 5.0 2,500 Chick Pea - - - - 0.5 40 12.5 500 B. Paddy bigha 1.0 40 5.0 200 1.0 100 6.0 600 Wheat - - - - 0.5 100 8.0 800 C. Other bigha - - - - 1.0 100 4.0 400 - - - - - - - - D. - bigha - - - - - - - - - - - - - - - - By product By productA. Maize Sum - 0.50 100 50 - 2.00 500 1,000 Chick Pea - - - - - 4.00 20 80 B. Paddy Sum - 0.50 100 50 - 1.00 300 300 Wheat - - - - - 5.00 20 100 C. Other Sum - - - - - 1.00 300 300 - - - - - - - - D. - Sum - - - - - - - - - - - - - - - -
Total Revenue 700 5,100 - 1,480
Variable CostsSeedA. Maize kg 25 4.0 100 25 5.0 125 Chick Pea - - - 5 20.0 100 B. Paddy kg 20 5.0 100 20 10.0 200 Wheat - - - 10 7.0 70 C. Other kg - - - 5 5.0 25 - - - - - - D. - kg - - - - - - - - - - - - FertiliserA. Urea kg - - - 60 5.0 300 - - - - - - B. DAP kg - - - - - - - - - - - - C. FYM Load 1 400.0 400 - - - - - - 0.5 500.0 250 Pesticide kg - - - - - - - - - - - - Irrigation Rounds - - - - - - - - - - - - Subtotal 600 650 - 420
Draught Days - - - - - - - - - - - - Repairs Sum - - - - - - - - - - - - Thrashing Rate - - - - - - - - - - - - Storage Sum - - - - - - - - - - - - Transport Sum - - - - - - - - - - - - Credit \2 Rs 500 40.0% 200 - 0.0% - - 0.0% - - 0.0% -
Total Variable Costs 800 650 - 420
Labour Costs P/daysLand Prep 8 25 200 10 48 480 - - - 4 48 192 Sowing 4 25 100 4 48 192 - - - 4 48 192 Weeding 12 25 300 15 48 720 - - - - - - Fert App 1 25 25 2 48 96 - - - 1 48 48 Pest App - - - - - - - - - - - - Irrigation - - - - - - - - - - - - Harvest 8 25 200 10 48 480 - - - 8 48 384 Storage 4 25 100 4 48 192 - - - 4 48 192
Total Labour Costs 37 925 45 2,160 - - 21 1,008
Total Production Costs 1,725 2,810 - 1,428
Net Margin / Household (Economic) (1,025) 2,290 - 52
Return per Person Day (Financial) (2.7) 98.9 #DIV/0! 50.5
Source: Study of Impact of WIRFP on Net Incomes of Target Households, Jan 2004.\1 Economic class VP = Very poor, P = Poor, M = Moderate, BO = Better off.\2 Credit costs adjusted.
Kharif: Rabi:With projectWithout project Without Project With Project

Table AN11.5.7 Phase II Rajasthan - Village Merana: Individual Household Detailed Data: WBR - Better Off.
Unit Area Qty Price Value Area Qty Price Value Area Qty Price Value Area Qty Price Value
By Economic Class: \1 BO Crop: Maize Crop: Crop: Chick Pea Crop:Pigeon Pea WheatBlack Gram
Revenue OtherCrop CropA. Maize bigha 8 1,500 4.0 6,000 10.0 1,600 6.0 9,600 - - - - - - - - B. Pigeon Pea bigha 2 100 8.0 800 5.0 140 10.0 1,400 - - - - - - - - C. Black Gram bigha 2 110 6.0 660 - - - - - - - - - - - D. Other bigha 2 - - - 5.0 600 5.0 3,000 - - - - - - - - By product By productA. Maize Sum - 5.0 200.0 1,000 - 2 500.0 1,000 - - - - - - - - B. Pigeon Pea Sum - 3.0 300.0 900 - 2 250.0 500 - - - - - - - - C. Black Gram Sum - 2.0 400.0 800 - - - - - - - - - - - - D. Other Sum - - - - - 2 600.0 1,200 - - - - - - - -
Total Revenue 10,160 16,700 - -
Variable CostsSeedA. Maize kg 40 3.5 140 75 6.0 450 - - - - - - B. Pigeon Pea kg 7 7.0 46 10 10.0 100 - - - - - - C. Black Gram kg 5 7.0 35 3 20.0 60 - - - - - - D. Other kg 1 2.0 2 - - - - - - - - - FertiliserA. Urea kg - - - 150 5.0 750 - - - - - - B. DAP kg - - - - - - - - - - - - C. FYM Load 2 150.0 300 4 400.0 1,600 - - - - - - Pesticide kg - - - - - - - - - - - - Irrigation Rounds - - - - - - - - - - - - Subtotal 523 2,960 - -
Draught Days - - - - - - - - - - - - Repairs Sum - - - - - 800 - - - - - - Thrashing Rate - - - - - - - - - - Storage Sum - - - - - - - - - - - - Transport Sum - - - - - - - - - - - - Credit Rs 2,000 20% 400 - - - - - - - - -
Total Variable Costs 923 3,760 - -
Labour Costs P/daysLand Prep 11 48.0 528 10 48 480 - - - - - - Sowing 6 48.0 288 15 48 720 - - - - - - Weeding 28 48.0 1,344 35 48 1,680 - - - - - - Fert App 4 48.0 192 6 48 288 - - - - - - Pest App - - - - - - - - - - - - Irrigation - - - - - - - - - - - - Harvest 11 48.0 528 23 48 1,104 - - - - - - Storage 4 48.0 192 12 48 576 - - - - - -
Total Labour Costs 64 3,072 101 4,848 - - - -
Total Production Costs 3,995 8,608 - -
Net Margin / Household (Economic) 6,166 8,092 - -
Return per Person Day (Financial) 144.3 128.1 #DIV/0! #DIV/0!
Source: Study of Impact of WIRFP on Net Incomes of Target Households, Jan 2004.\1 Economic class VP = Very poor, P = Poor, M = Moderate, BO = Better off.
Kharif: Rabi:With projectWithout project Without Project With Project

Table AN11.5.8 Phase II Rajasthan - Village Merana: Individual Household Livestock Detailed Data: WBR - Very Poor (1).
Item Units PeriodQuantity Unit Price Value Quantity Unit Price Value
(No) (Rs) (Rs) (No) (Rs) (Rs)
Livestock Asset ValueA Cow
Male head 2 1,500.0 3,000 2 2,000.0 4,000 Female head 1 1,500.0 1,500 - - - Losses head - - - - - -
B BuffaloMale head - - - 1 2,000.0 2,000 Female head 1 5,000.0 5,000 1 5,000.0 5,000 Losses head - - - - - -
C GoatMale head 1 1,000.0 1,000 - - - Female head 5 800.0 4,000 - - - Losses head - - - - - -
D PoultryNot specified head 10 50.0 500 - - Losses head - - -
Total Livestock Assets 15,000 11,000
Annual Increase in Livestock Assets year 5 (800)
Sales IncomeA Cow and Buffalo
Milk litres year 300 7.0 2,100 360 10.0 3,600 Dung cart year 1 400.0 400 1 500.0 500 Draught days year - - - - - - Transport days year - - - - - - Sales no year - - - - - -
C GoatMilk litres year 120 7.0 840 - - - Dung sum year - - - - - - Sales no year - - - - - - Other - - - - - - - -
D PoultrySales no year 75 1.0 75 - - - Other no year - - - - - -
Total Sales Income 3,415 4,100
ExpenditureDirect CostsCow and Buffalo
Feeding (grazing) sum year - - - - - - Feeding (roughage) sum year 1.0 550.0 550 1.0 2,000.0 2,000 Feeding (concentrate) kg year - - - 50.0 5.0 250 Vet and Med sum year - - - 1.0 10.0 10 Other sum year - - - - - -
GoatFeeding sum year - - - - - - Vet and Med sum year - - - - - - Other sum year - - - - - -
PoultryOther sum year - - - - - -
Total Direct Costs 550 2,260
Overhead CostsEquipment repairs sum year - - - - - - Total Overhead Costs - -
Total Expenditure 550 2,260
Net Margin 2,865 1,840
Family Labour Input Days Month 12.0 5 60 12.0 5 60
Return to Family Labour
Combined Net Margin and Asset 2,865 1,040
Source: Study of Impact of WIRFP on Net Incomes of Target Households, Jan 2004.
Before / Without Project Situation After / With Project Situation

Table AN11.5.9 Phase II Rajasthan - Village Merana: Individual Household Livestock Detailed Data: WBR - Very Poor (2).
Item Units PeriodQuantity Unit Price Value Quantity Unit Price Value
(No) (Rs) (Rs/Period) (No) (Rs) (Rs/Period)
Livestock Asset ValueCow
Male head 1 1,500.0 1,500 2 5,000.0 10,000 Female head - - - 1 1,500.0 1,500 Losses head - - - - - -
BuffaloMale head - - - - - - Female head - - - - - - Losses head - - - - - -
GoatMale head 2 900.0 1,800 - - Female head - - - - - Losses head - - - - - -
PoultryNot Specified head 10 100.0 1,000 Losses head - - - - - -
Total Livestock Assets 4,300 11,500
Annual Increase in Livestock Assets year 5 1,440
Sales IncomeCow and Buffalo
Milk litres year - - - 180 10.0 1,800 Dung cart year 0.5 400.0 200 1 500.0 500 Draught days year - - - - - - Transport days year - - - - - - Sales no year - - - - - -
GoatMilk litres year - - - - - - Dung sum year - - - - - - Sales no year - - - - - - Other - - - - - - - -
PoultrySales no year - - - - - - Other no year - - - - - -
Total Sales Income 200 2,300
ExpenditureDirect CostsCow and Buffalo
Feeding (grazing) sum year - - - - - - Feeding (roughage) sum year 1.0 265.0 265 12.0 45.0 540 Feeding (concentrate) sum year - - - - - - Vet and Med sum year - - - 1.0 10.0 10 Other sum year - - - - - -
GoatFeeding sum year - - - - - - Vet and Med sum year - - - - - - Other sum year - - - - - -
PoultryOther sum year - - - - - -
Total Direct Costs 265 550
Overhead CostsEquipment repairs sum year - - - - - - Total Overhead Costs - -
Total Expenditure 265 550
Net Margin (65) 1,750
Family Labour Input Days Month 12.0 5 60 12.0 5 60
Return to Family Labour
Combined Net Margin and Asset 4,235 13,250
Source: Study of Impact of WIRFP on Net Incomes of Target Households, Jan 2004.
Before / Without Project Situation After / With Project Situation

Table AN11.5.10 Phase II Rajasthan - Village Merana: Individual Household Livestock Detailed Data: WBR - Poor.
Item Units PeriodQuantity Unit Price Value Quantity Unit Price Value
(No) (Rs) (Rs/Period) (No) (Rs) (Rs/Period)
Livestock Asset ValueCow
Male head 2 4,000.0 8,000 3 5,000.0 15,000 Female head 1 2,000.0 2,000 2 2,000.0 4,000 Losses head - - - - - -
BuffaloMale head - - - - - - Female head - - - - - - Losses head - - - - - -
GoatMale head - - - - - - Female head 1 800.0 800 2 1,000.0 2,000 Losses head - - - - - -
PoultryNot Specified head 2 75.0 150 1.0 100.0 100 Losses head - - - - - -
Total Livestock Assets 10,950 21,100
Annual Increase in Livestock Assets year 5 2,030
Sales IncomeCow and Buffalo
Milk litres year 180 7.0 1,260 270 10.0 2,700 Dung cart year 1 400.0 400 1.5 500.0 750 Draught days year - - - - - - Transport days year - - - - - - Sales no year - - - - - -
GoatMilk litres year 24 7.0 168 48 10.0 480 Dung sum year - - - - - - Sales no year - - - 1 500.0 500 Other - - - - - - - -
PoultrySales no year - - - - - - Other - - - - - - - -
Total Sales Income 1,828 4,430
ExpenditureDirect CostsCow and Buffalo
Feeding (grazing) sum year - - - - - - Feeding (roughage) sum year 1.0 100.0 100 1.0 1,780.0 1,780 Feeding (concentrate) sum year - - - - - - Vet and Med sum year - - - 1.0 10.0 10 Other sum year - - - - - -
GoatFeeding sum year 10.0 4.0 40 20.0 5.0 100 Vet and Med sum year - - - - - - Other sum year - - - - - -
PoultryOther sum year 1.0 40.0 40 1.0 50.0 50
Total Direct Costs 180 1,940
Overhead CostsEquipment repairs sum year - - - - - - Total Overhead Costs - -
Total Expenditure 180 1,940
Net Margin 1,648 2,490
Family Labour Input Days Month 12.0 20 240 12.0 40 480
Return to Family Labour
Combined Net Margin and Asset 1,648 4,520
Source: Study of Impact of WIRFP on Net Incomes of Target Households, Jan 2004.
Before / Without Project Situation After / With Project Situation

Table AN11.5.11 Phase II Rajasthan - Village Merana: Individual Household Livestock Detailed Data: WBR - Better Off.
Item Units PeriodQuantity Unit Price Value Quantity Unit Price Value
(No) (Rs) (Rs/Period) (No) (Rs) (Rs/Period)
Livestock Asset ValueCow
Male head 2 1,500.0 3,000 4 2,000.0 8,000 Female head 1 2,000.0 2,000 5 1,500.0 7,500 Losses head - - - - - -
BuffaloMale head - - - 1 2,500.0 2,500 Female head - - - 2 4,000.0 8,000 Losses head - - - - - -
GoatMale head - - - - - - Female head 9 700.0 6,300 4 1,000.0 4,000 Losses head - - - - - -
PoultryNot Specified head - - - 4.0 80.0 320 Losses head - - - - - -
Total Livestock Assets 11,300 30,320
Annual Increase in Livestock Assets year 5 3,804
Sales IncomeCow and Buffalo
Milk litres year 10 8.0 80 240 10.0 2,400 Dung cart year 1 250.0 250 4 500.0 2,000 Draught days year - - - - - - Transport days year - - - - - - Sales no year - - - - - -
GoatMilk litres year 20 7.0 140 120 10.0 1,200 Dung sum year - - - - - - Sales no year - - - - - - Other - - - - - - - -
PoultrySales no year - - - 45 2.0 90 Other no year - - - - - -
Total Sales Income 470 5,690
ExpenditureDirect CostsCow and Buffalo
Feeding (grazing) sum year - - - - - - Feeding (roughage) sum year - - - - - - Feeding (concentrate) sum year 1.0 1,000.0 1,000 1.0 1,200.0 1,200 Vet and Med sum year 1.0 50.0 50 4.0 25.0 100 Other sum year - - - - - -
GoatFeeding sum year - - - - - - Vet and Med sum year - - - - - - Other sum year - - - - - -
PoultryOther sum year - - - - - -
Total Direct Costs 1,050 1,300
Overhead CostsEquipment repairs sum year - - - - - - Total Overhead Costs - -
Total Expenditure 1,050 1,300
Net Return (580) 4,390
Family Labour Input Days Month 12.0 20 240 12.0 20 240
Return to Family Labour
Combined Net Return and Asset (580) 8,194
Source: Study of Impact of WIRFP on Net Incomes of Target Households, Jan 2004.WBR = Well Being Ranking.
Before / Without Project Situation After / With Project Situation

DFID / India: Western India Rainfed Farming Project / Final Report / October 2005
Economic Analysis

DFID / India: Western India Rainfed Farming Project / Final Report / October 2005
Village Cost Benefit Analysis
AN12

Village Cost Benefit Analysis
AN12-1
DFID / India: Western India Rainfed Farming Project / Final Report / October 2005
Village Cost Benefit Analysis
AN12
Introduction
Investment administration and development costs over the seven-year implementation period together with the projected recurrent cost stream over the 20-year analysis period have been identified for each of the 20 sample villages. Estimates of the associated incremental benefit streams have been quantified for each of the development activities by individual village. The resulting net incremental benefit stream for each village, over the analysis period, has been discounted to determine the economic internal rate of return (EIRR) and net present value (NPV) at 12 percent, which has been taken as the opportunity cost of capital for rural development projects in India. A description of the development activities and associated benefit assumptions is given below.
Description of Development Activity Costs and Associated Benefits
Participatory Planning and Group Formation
The participatory planning and group formation (PPGF) activity costs identified under this development activity are related to the participatory planning process adopted by the implementing agencies following village identification and entry. These costs include the preliminary rural appraisal (PRA) of the selected village resources, the community problem analysis (CPA) and the identification and prioritisation of development options all leading to the preparation of the village work plan. All stages of the process include the active participation of the village community. Within the village, paraprofessionals or jankars are identified, by the individual groups established within the community. to implement the process at the village level. For this involvement, a payment is made through the project to the jankars as an incentive to off set against time that otherwise might have been devoted to agricultural production and to cover any incurred travel and accommodation expenses. The average investment costs for PPGF account for one and two percent respectively of GVT and IFFDC development activity expenditure.
No direct quantified benefits are attributed to this participatory planning and group formation process.
Village Organisation and Development (VOD)
Village organisation and development activity costs include village mobilisation into effective SHGs operating savings and credit schemes, adult and child literacy support programmes, the introduction of drudgery reduction initiatives (ball bearings for cereal grinding, energy efficient stoves (chulas), fibre glass sky light tiles, and solar energy systems), group grain bank storage programmes, material support for the less advantaged households and seed capital to SHGs for both individual and

Village Cost Benefit Analysis
AN12-2
DFID / India: Western India Rainfed Farming Project / Final Report / October 2005
group IGA initiatives. The average investment costs, in VOD, account for 12 and eight percent respectively of GVT and IFFDC development activity expenditure.
Direct quantifiable benefits from the VOD development activities are calculated on terms of time savings from drudgery reduction initiatives (including reduced time in domestic water carrying) and as potential membership interest income from SHG deposits on-lent to members for production and consumption loans.
Drudgery Reduction
Quantified benefits, resulting from drudgery reduction for household activities (ball bearings, and access to water), are measured as hours / days savings per household / village valued at the economic shadow wage rate. This assumes that such time saved will be gainfully employed in alternative productive activities. Potential productive drudgery reduction benefits per household are assessed an average of one hour per day per household for 200 days per year assuming an average eight hour day (the equivalent of 25 days per year per household) valued at a shadow wage rate of Rs 25 per day to reflect that only 50 percent of the time saved will be devoted to economically productive activities.
Interest Income for Self Help Groups
Individual IGAs appear attractive but very limited in scope for duplication. However group IGAs are generally less financially viable. Loan repayment terms (monthly interest rate, capital grace periods, the period for capital repayment, etc) remain ill defined. Individual IGAs can justify an interest rate of two percent per month (24 percent per year) but repayment of principle is more problematic owing to the seasonality of crop production and migration income.
Potential interest income is assessed on the percentage of individual / group deposits held by the individual SHG / village that it is onlent for IGAs to individual members of an SHG. Interest income charges are highly variable between SHGs and are reported to vary from 12 to 24 percent per year (equivalent to one to two percent per month) with penalties applied for non-payment. In quantifying the benefits, namely the interest income derived from the volume of deposits onlent to members, use has been made of both field verification data and implementing agency SHG records.
Crop Technology, Soil and Water Conservation (SWC), and Water Resource Development (WRD) Programmes
Investment costs associated with the crop technology component include the costs of village demonstration plots for improved crop husbandry, the distribution of superior seed varieties and fertiliser, and the allocation of farming implements to households. The average investment costs, in crop technology, account for seven and five percent respectively of GVT and IFFDC development activity expenditure.
SWC investment costs relate to expenditure on the construction and / or repair of earthen dams and storage ponds, watershed management structures including field bunds, contour bunds and trenches, nala plugs and vegetative conservation measures. The average investment costs, in SWC, account for 41 and nine percent respectively of GVT and IFFDC development activity expenditure.

Village Cost Benefit Analysis
AN12-3
DFID / India: Western India Rainfed Farming Project / Final Report / October 2005
WRD investment costs include the construction and / or repair of check dams (anicuts), the construction and / or deepening of wells, the construction of lift irrigation schemes, the installation of ‘drip’ irrigation schemes, the installation of hand pumps for both domestic and livestock water supply and the supply of irrigation pumps and pipes. The average investment costs, in WRD, account for 21 and 69 percent respectively of GVT and IFFDC development activity expenditure.
Overall average investment costs in crop technology, WSC and WRD, accounts for 70 and 83 percent respectively of GVT and IFFDC development activity expenditure.
As discussed previously, the incremental benefits to these three development activities are not differentiated and are based on incremental net crop margins, weighted by the village WBR type, and derived from data recorded for the Net Income Study. The underlying assumption is that the Net Income Study sample by well being ranking type, is representative of the integrated benefits of these three activities and that all participating households village have benefited from the interventions.
Livestock Programme
The livestock investment programme includes the development of a village livestock centre incorporating a twice yearly vaccination and disease control programme, a breed improvement / adoption schemes for cattle, goats and poultry supported by seed capital financing for livestock IGAs administered through SHGs. The average investment costs, in the livestock programme, account for five and three percent respectively of GVT and IFFDC development activity expenditure.
The incremental benefits to the livestock development activity are based on incremental net crop margins, weighted by the village WBR type, and derived from data recorded for the Net Income Study. Again the underlying assumption is that the Net Income Study sample, adjusted by well being ranking type, is representative of the integrated benefits of the activity and that all participating households village have benefited from the intervention.
Forestry Programme
The forestry investment programmes includes the promotion of existing and the establishment of new, joint forestry management (JFM) schemes on common property resource land, in association with the forestry department. Other initiatives comprise the purchase and distribution of young fruit tree seedlings in association with the establishment of a village nursery programme using both grafting and budding skills. The average investment costs, in the forestry programme, account for four percent respectively of both GVT and IFFDC development activity expenditure.
The quantified benefits of the forestry programme are measured in terms of the potential incremental household net margin derived from primarily fruit production to obtain a positive NPV. For the sample villages, this net margin ranged from Rs 200 to 600 per household and falls within the levels identified in the Net Income Study. No significant expenditure was identified for JFM development in the sample villages.

Village Cost Benefit Analysis
AN12-4
DFID / India: Western India Rainfed Farming Project / Final Report / October 2005
Migration Labour Support Programme
The migration labour support programme (MLSP) is a relatively new development activity being limited to budget allocations for GVT operations in Gujarat and Madhya Pradesh. The programme is the subject of ongoing studies in these states. As such, the average investment costs, in the MLSP programme, account for one and zero percent respectively of GVT and IFFDC development activity expenditure. The current emphasis of the programme is an awareness campaign, at the village levels, of the necessary requirements for, and rights of, household members when seeking employment as individuals or through work placement agencies, in urban centres. Expenditure at Jadha village, Gujarat, includes the construction of offices to accommodate trained staff to implement the programme in both the core and adjoining prasaar villages.
The quantified benefits of the MLSP programme are measured in terms of the potential incremental household income from migration labour both from the core village and in the case of Jadha village, Gujarat, prasaar villages. These benefits result from the incremental household income derived from migration labour, for both the ‘before’ and ‘after’ project situation and are based on estimates of: (a) the average increase in the daily wage rate secured, (b) the increase in the average number of days of work obtained, and (c) the number of households, within the village, engaged in migration labour. These initial estimates are set at levels to obtain a positive NPV. They are based on limited discussions during the field verification process and will need to be further adjusted as a result of the ongoing field survey and when projected investment expenditure is more clearly identified.
Sample Village Results
Details of the economic costs and associated benefits for the 20 sample villages are given in Annex 12.1 to 12.20 and results of the base case individual village cost benefit analysis, in terms of the EIRR and NPV assessed at 12 percent, and analysed over a 20 year period, are summarised in Table A12.1. The analysis indicates that six villages (Gujarat two, Madhya Pradesh two and Rajastan two) achieved EIRRs equal to or in excess of 12 percent. There is a strong correlation between the six villages with EIRRs at or above 12 percent and the number of participating households in these same villages. This reflects the cost benefit analysis methodology in that the unit cost, of PPGF and VOD development activities per participating household, does not vary greatly between those villages with a smaller number of households when compared with those villages with a larger number of households. This is in contrast to the benefits from the crop technology, SWC and WRD development activities, where it is assumed that the benefit are directly proportional to the number of participating households in the individual village.
The result of the overall project sample, together with a sensitivity analysis of key variables for individual villages, is given in Annex 13.

Village Cost Benefit Analysis
AN12-5
DFID / India: Western India Rainfed Farming Project / Final Report / October 2005
Table AN12.1: Cost Benefit Analysis – Individual Village Results
Implementing Agency HHs Economic Costs Cost Benefit Analysis District / State Admin Dev Total NPV EIRR Village Sample Village (No) (Rs M) (Rs M) (%) (No) 1/ Gramin Vikas Trust (GVT) Dahod – Gujarat 2.3 2.2 2.5 6.5 23% 2 1 Jadha 363 2.3 5.3 7.6 4.4 28% * 2 Kasotia 193 2.3 2.3 4.6 2.3 27% * 3 Poyali 120 2.3 2.9 5.2 (0.2) 11% Jhabua - M Pradesh 1.5 1.5 3.0 (3.9) 6% 2 1 Bagoli 86 1.5 2.9 4.4 (1.4) 3% 2 Borwa 36 1.5 1.0 2.5 (0.5) 5% 3 Chamjar 79 1.5 2.7 4.2 (1.9) N/A 4 Chenpura 160 1.5 2.9 4.4 1.0 18% * 5 Kadwapada 86 1.5 1.9 3.4 0.2 14% * 6 Padabanda 37 1.5 2.1 3.6 (1.6) N/A Banswara - Rajasthan 1.5 1.9 3.4 1.5 15% 2 1 Bakaner 90 1.5 2.6 4.1 (0.9) 4% 2 Bhuripada 160 1.5 2.8 4.3 0 3 14% * 3 Gara 120 1,5 4.2 5.7 (0.6) 4% 4 Merana 147 1,5 1.8 3.3 2.9 32% * 5 Sundripada 80 1.5 2.2 3.7 (0.1) 11% Indian Farm Forestry Development Cooperative (IFFDC) Pratapgarh – Rajastan 2.2 1.4 3.6 (8.8) -1% 0 1 Chhayan 60 2.2 2.7 4.9 (2.4) N/A 2 Chhota Mayanga 49 2.2 1.7 3.9 (1.6) N/A 3 Dharis Kheri 80 2.2 1.7 3.9 (1.1) 1% 4 Kachotia 108 2.2 2.2 4.4 (0.5) 8% 5 Moti Kheri 112 2.2 3.6 5.8 (1.5) 2% 6 S Ka Khera 42 2.2 1.5 3.7 (1.5) N/A Overall Cost Benefit (4.6) 10% 6
Source: Cost Benefit Analysis Study, January 2005. 1/ Number of individual villages achieving an EIRR in excess of 12 percent (the opportunity cost of capital
for rural development projects in India) EIRR = Economic Internal Rate of Return, NPV = Net Present Value at 12% interest HHs = Participating households per sample village, N/A = Not analysed as EIRR negative.

WIRFP - Phase II - Cost Benefit Analysis Study
Tables AN12.0 Individual Village Cost Benefit Analysis
Tables AN12.1 GVT - Gujarat - Dahod: Village Jadha
Table AN12.1.1 GVT - Gujarat - Dahod: Village Jadha: Village Profile.
Table AN12.1.2 GVT - Gujarat - Dahod: Village Jadha - Cost Benefit Analysis Summary (Rs'000).Table AN12.1.3 GVT - Gujarat - Dahod: Village Jadha - Cost Benefit Analysis Development Activity Summary A (Rs'000).Table AN12.1.4 GVT - Gujarat - Dahod: Village Jadha - Cost Benefit Analysis Development Activity Summary B (Rs'000).
Table AN12.1.5 GVT - Gujarat - Dahod: Village Jadha: Costs - Financial (Rs'000).GVT - Gujarat - Dahod: Village Jadha: Costs - Economic (Rs'000).
Table AN12.1.6 GVT - Gujarat - Dahod: Village Jadha: VOD Household Assumptions.GVT - Gujarat - Dahod: Village Jadha: Incremental VOD Benefit Stream (Rs'000).
Table AN12.1.7 GVT - Gujarat - Dahod: Village Jadha: Household Crop Net Margin Assumptions.GVT - Gujarat - Dahod: Village Jadha: Incremental Crop Benefit Stream (Rs'000).
Table AN12.1.8 GVT - Gujarat - Dahod: Village Jadha: Household Livestock Net Margin Assumptions.GVT - Gujarat - Dahod: Village Jadha: Incremental Livestock Benefit Stream (Rs'000).
Table AN12.1.9 GVT - Gujarat - Dahod: Village Jadha: Forestry Benefit Assumptions.GVT - Gujarat - Dahod: Village Jadha: Incremental Forestry Benefit Stream (Rs'000).
Table AN12.1.10 GVT - Gujarat - Dahod: Village Jadha: Migration Support Benefit Assumptions.GVT - Gujarat - Dahod: Village Jadha: Incremental Migration Support Benefit Stream (Rs'000).
Table AN12.1.11 GVT - Gujarat - Dahod: Village Jadha: Weighted Household Crop Net Margin Summary (Rs/Household).Table AN12.1.12 GVT - Gujarat - Dahod: Village Jadha: Weighted Household Crop Net Margin Sensitivity Analysis (Rs/Household).
Table AN12.1.13 GVT - Gujarat - Dahod: Village Jadha: Weighted Household Livestock Net Margin Summary (Rs/Household).

Table AN12.1.1 GVT - Gujarat - Dahod: Village Jadha: Village Profile.
Village Profile \1
A. Background F. Land Resource (ha)Village Name Jadha Total Area 1,185 District Dahod Revenue Land (unused) 872 State Gujarat Forest Area - Revenue 50
Pasture Land 2 B. Participatory Planning Process (PPP) Arable Land 261
Village entry Nov-99PRA Jul-00CPA Jan-01 G. Livestock
C. InfrastructureHand Pumps (no) 9 Wells (no) 24 Linked by Road 5 KmsElectrification YesSchool 1 - 7 H. Self Help Groups (No Households)
1 Group 1 20 D. Demographic Data 2 Group 2 19
Households (no) 383 3 Group 3 20 Participating Households 363 4 Group 4 19 Population 1,197 5 Group 5 20
Adults: 6 Group 6 20 Male 549 7 Group 7 20 Female 648 8 Group 8 20 Children: 9 Group 9 19 Boys N/A 10 Group 10 20 Girls N/A 11 Group 11 18
12 Group 12 20 E. Well Being Ranking (No Households) 13 Group 13 20
Very Poor 58 16.0% 14 Group 14 18 Poor 227 62.5% 15 Group 15 20 Moderate 67 18.5% 16 Group 16 19 Better Off 11 3.0% 17 Group 17 20 Total 363 100% 18 Group 18 20
19 Group 19 11 Total 363
Source: GVT Dahod Coordination Office - Gujarat.\1 Subject to final adjustment following consolidation exercise prior to Annual Review Meeting (ARM) in Feb 2005.

Table AN12.1.2 GVT - Gujarat - Dahod: Village Jadha - Cost Benefit Analysis Summary (Rs'000).
Administration Costs / Development Activity EIRR \1 Year 1 Year 2 Year 3 Year 4 Year 5 Year 6 Year 7 Year 8 Year 9 Year 10(10%) (%) 1999/00 2000/01 2001/02 2002/03 2003/04 2004/05 2005/06 2006/07 2007/08 2008/09
A. Administration CostsTotal A N/A (1,503) -34% 35.9 454.8 335.6 294.3 302.5 488.0 354.9 35.5 35.5 35.5
B. Development Activity Component A 1. PPGF
Net Incremental Benefits N/A (200) -5% - (3.4) (68.3) (66.6) (54.7) (56.0) (57.3) (7.3) (7.3) (7.3)
2. VODNet Incremental Benefits 114% 1,231 28% - (48.3) (62.1) 121.5 259.0 261.3 274.0 280.9 284.4 288.0
3/5.Crop Technology, SWC and WRDNet Incremental Benefits 29% 2,260 51% - (111.2) (619.7) (826.5) (811.1) 760.8 908.7 1,025.2 1,025.2 1,025.2
6. LivestockNet Incremental Benefits 88% 2,350 53% - (62.5) (52.7) (68.1) 130.0 386.7 641.7 661.1 661.1 661.1
7. ForestryNet Incremental Benefits 26% 75 2% - (20.1) (36.4) 19.6 (36.0) 0.5 37.2 37.2 37.2 37.2
8. Migration SupportNet Incremental Benefits 50% 226 5% - - - (90.0) 20.0 36.8 48.3 79.7 79.7 79.7
SummaryNet Incremental Benefits 28% 4,440 100% (35.9) (700.3) (1,174.8) (1,204.4) (795.2) 902.1 1,497.7 2,041.4 2,044.9 2,048.5
Sensitivity AnalysisAnalysis Period
12 Years 23% 1,828 20 Years (Base Year) 28% 4,440 25 Years 29% 5,205 30 Years 29% 5,639
Costs - AdministrationInvestment Costs Decreased by 20 percent 30% 4,740
Costs - Administration and DevelopmentRecurrent Costs Increased by 20 percent 27% 3,931
Benefits - Crop, SWC and WRD and LivestockCrop Benefits Increased by 20 percent 31% 5,348 Livestock Benefits Decreased by 20 percent 31% 5,265
Source: Cost Benefit Analysis (CBA) Study Estimate Jan 2005.\1 EIRR = Economic Internal Rate of Return (rate at which NPV equal to zero).\2 NPV = Net Present Value of net incremental benefits at 12% (indicative opportunity cost of capital for rural development projects in India).
N/A = Not analysed as EIRR negative.
NPV \2

Table AN12.1.3 GVT - Gujarat - Dahod: Village Jadha - Cost Benefit Analysis Development Activity Summary A (Rs'000).
Administration Costs / Development Activity EIRR \1 Year 1 Year 2 Year 3 Year 4 Year 5 Year 6 Year 7 Year 8 Year 9 Year 10(10%) (%) 1999/00 2000/01 2001/02 2002/03 2003/04 2004/05 2005/06 2006/07 2007/08 2008/09
A. Administration CostsInvestment 35.9 454.8 335.6 294.3 302.5 488.0 354.9 - - - Recurrent - Projected - - - - - - - 35.5 35.5 35.5
Total A N/A (1,503) -34% 35.9 454.8 335.6 294.3 302.5 488.0 354.9 35.5 35.5 35.5
B. Development Activity Component A 1. PPGF
Cost StreamInvestment - 3.4 68.2 64.8 51.3 51.3 51.3 - - - Recurrent - - 0.1 1.8 3.4 4.7 6.0 7.3 7.3 7.3 Total Costs - 3.4 68.3 66.6 54.7 56.0 57.3 7.3 7.3 7.3
Benefit StreamBefore / Without Project - - - - - - - - - - After / With Project - - - - - - - - - - Incremental Benefits - - - - - - - - - -
Net Incremental Benefits N/A (200) -5% - (3.4) (68.3) (66.6) (54.7) (56.0) (57.3) (7.3) (7.3) (7.3)
2. VODCost Stream
Investment - 48.3 62.1 140.6 18.8 28.3 3.8 - - - Recurrent - - - - - - 14.9 15.1 15.1 15.1 Total Costs - 48.3 62.1 140.6 18.8 28.3 18.7 15.1 15.1 15.1
Benefit StreamBefore / Without Project - - - - - - - - - - After / With Project - - - 262.2 277.8 289.6 292.7 296.0 299.5 303.1 Incremental Benefits - - - 262.2 277.8 289.6 292.7 296.0 299.5 303.1
Net Incremental Benefits 114% 1,231 28% - (48.3) (62.1) 121.5 259.0 261.3 274.0 280.9 284.4 288.0
3/5.Crop Technology, SWC and WRDCost Stream
InvestmentCrop Tecnology - 35.7 90.3 47.6 38.2 11.6 9.0 - - - Soil Water Conservation - 23.6 498.9 664.3 667.6 106.2 66.7 - - - Water Resource Development - 51.9 18.9 35.5 1,502.5 208.8 58.0 - - -
RecurrentCrop Tecnology - - 0.9 3.2 4.3 5.3 5.6 5.8 5.8 5.8 Soil Water Conservation - - 3.0 65.3 148.3 231.8 245.1 253.4 253.4 253.4 Water Resource Development - 7.8 10.6 15.9 241.3 272.6 281.3 281.3 281.3
Total Costs - 111.2 619.7 826.5 2,376.9 805.0 657.1 540.6 540.6 540.6 Benefit Stream
Before / Without Project - - - - 357.5 357.5 357.5 357.5 357.5 357.5 After / With Project - - - - 1,923.3 1,923.3 1,923.3 1,923.3 1,923.3 1,923.3 Incremental Benefits - - - - 1,565.8 1,565.8 1,565.8 1,565.8 1,565.8 1,565.8
Net Incremental Benefits 29% 2,260 51% - (111.2) (619.7) (826.5) (811.1) 760.8 908.7 1,025.2 1,025.2 1,025.2
Source: Cost Benefit Analysis (CBA) Study Estimate Jan 2005.\1 EIRR = Economic Internal Rate of Return (rate at which NPV equal to zero).\2 NPV = Net Present Value of net incremental benefits at 12% (indicative opportunity cost of capital for rural development projects in India).
N/A = Not analysed as EIRR negative.
NPV \2

Table AN12.1.4 GVT - Gujarat - Dahod: Village Jadha - Cost Benefit Analysis Development Activity Summary B (Rs'000).
Administration Costs / Development Activity EIRR \1 Year 1 Year 2 Year 3 Year 4 Year 5 Year 6 Year 7 Year 8 Year 9 Year 10(10%) (%) 1999/00 2000/01 2001/02 2002/03 2003/04 2004/05 2005/06 2006/07 2007/08 2008/09
6. LivestockCost Stream
Investment - 62.5 46.5 57.2 23.4 21.6 21.6 - - - Recurrent - 6.2 10.9 16.6 19.0 21.1 23.3 23.3 23.3 Total Costs - 62.5 52.7 68.1 40.0 40.6 42.7 23.3 23.3 23.3
Benefit StreamBefore / Without Project - - - - 458.7 458.7 458.7 458.7 458.7 458.7 After / With Project - - - - 628.7 885.9 1,143.1 1,143.1 1,143.1 1,143.1 Incremental Benefits - - - - 170.0 427.2 684.4 684.4 684.4 684.4
Net Incremental Benefits 88% 2,350 53% - (62.5) (52.7) (68.1) 130.0 386.7 641.7 661.1 661.1 661.1
7. ForestryCost Stream
Investment - 20.1 34.3 5.0 72.5 40.8 - - - - Recurrent - 2.0 5.4 5.9 13.2 17.3 17.3 17.3 17.3 Total Costs - 20.1 36.4 10.4 78.5 54.0 17.3 17.3 17.3 17.3
Benefit StreamBefore / Without Project - - - - - - - - - - After / With Project - - - 29.9 42.5 54.5 54.5 54.5 54.5 54.5 Incremental Benefits - - - 29.9 42.5 54.5 54.5 54.5 54.5 54.5
Net Incremental Benefits 26% 75 2% - (20.1) (36.4) 19.6 (36.0) 0.5 37.2 37.2 37.2 37.2
8. Migration SupportCost Stream
Investment - - - 90.0 51.8 34.9 34.9 - - - Recurrent - - - 9.0 14.2 17.7 21.2 21.2 21.2 Total Costs - - - 90.0 60.8 49.1 52.5 21.2 21.2 21.2
Benefit StreamBefore / Without Project - - - - 326.7 326.7 326.7 326.7 326.7 326.7 After / With Project - - - - 407.5 412.5 427.5 427.5 427.5 427.5 Incremental Benefits - - - - 80.8 85.8 100.8 100.8 100.8 100.8
Net Incremental Benefits 50% 226 5% - - - (90.0) 20.0 36.8 48.3 79.7 79.7 79.7
SummaryCost Stream
Investment 35.9 700.3 1,154.9 1,399.3 2,728.6 991.4 600.3 - - - Recurrent - - 20.0 97.2 203.6 529.4 600.2 660.1 660.1 660.1 Total Costs 35.9 700.3 1,174.8 1,496.5 2,932.2 1,520.8 1,200.5 660.1 660.1 660.1
Benefit StreamBefore / Without Project - - - - 1,142.9 1,142.9 1,142.9 1,142.9 1,142.9 1,142.9 After / With Project - - - 292.1 3,279.8 3,565.8 3,841.1 3,844.4 3,847.9 3,851.5 Incremental Benefits - - - 292.1 2,137.0 2,422.9 2,698.3 2,701.5 2,705.0 2,708.6
Net Incremental Benefits 28% 4,440 100% (35.9) (700.3) (1,174.8) (1,204.4) (795.2) 902.1 1,497.7 2,041.4 2,044.9 2,048.5
Source: Cost Benefit Analysis (CBA) Study Estimate Jan 2005.\1 EIRR = Economic Internal Rate of Return (rate at which NPV equal to zero).\2 NPV = Net Present Value of net incremental benefits at 12% (indicative opportunity cost of capital for rural development projects in India).
N/A = Not analysed as EIRR negative.
NPV \2
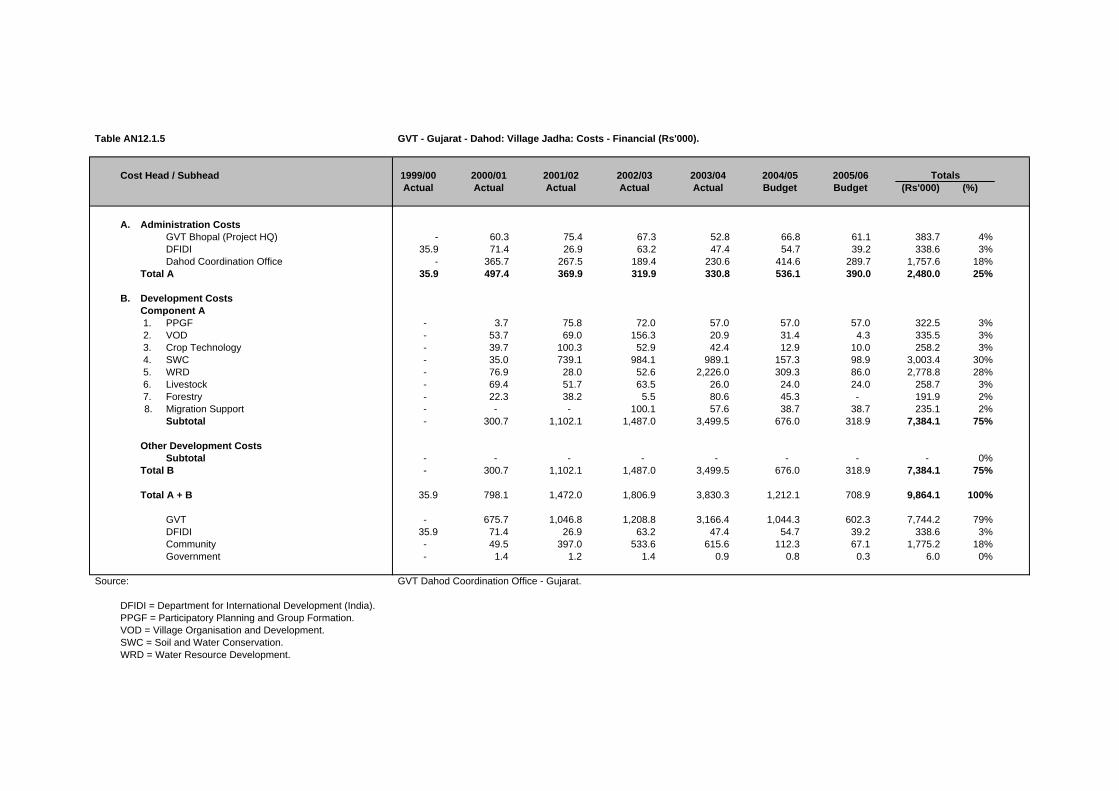
Table AN12.1.5 GVT - Gujarat - Dahod: Village Jadha: Costs - Financial (Rs'000).
Cost Head / Subhead 1999/00 2000/01 2001/02 2002/03 2003/04 2004/05 2005/06Actual Actual Actual Actual Actual Budget Budget (Rs'000) (%)
A. Administration CostsGVT Bhopal (Project HQ) - 60.3 75.4 67.3 52.8 66.8 61.1 383.7 4%DFIDI 35.9 71.4 26.9 63.2 47.4 54.7 39.2 338.6 3%Dahod Coordination Office - 365.7 267.5 189.4 230.6 414.6 289.7 1,757.6 18%
Total A 35.9 497.4 369.9 319.9 330.8 536.1 390.0 2,480.0 25%
B. Development CostsComponent A 1. PPGF - 3.7 75.8 72.0 57.0 57.0 57.0 322.5 3% 2. VOD - 53.7 69.0 156.3 20.9 31.4 4.3 335.5 3% 3. Crop Technology - 39.7 100.3 52.9 42.4 12.9 10.0 258.2 3% 4. SWC - 35.0 739.1 984.1 989.1 157.3 98.9 3,003.4 30% 5. WRD - 76.9 28.0 52.6 2,226.0 309.3 86.0 2,778.8 28% 6. Livestock - 69.4 51.7 63.5 26.0 24.0 24.0 258.7 3% 7. Forestry - 22.3 38.2 5.5 80.6 45.3 - 191.9 2%8. Migration Support - - - 100.1 57.6 38.7 38.7 235.1 2%
Subtotal - 300.7 1,102.1 1,487.0 3,499.5 676.0 318.9 7,384.1 75%
Other Development CostsSubtotal - - - - - - - - 0%
Total B - 300.7 1,102.1 1,487.0 3,499.5 676.0 318.9 7,384.1 75%
Total A + B 35.9 798.1 1,472.0 1,806.9 3,830.3 1,212.1 708.9 9,864.1 100%
GVT - 675.7 1,046.8 1,208.8 3,166.4 1,044.3 602.3 7,744.2 79%DFIDI 35.9 71.4 26.9 63.2 47.4 54.7 39.2 338.6 3%Community - 49.5 397.0 533.6 615.6 112.3 67.1 1,775.2 18%Government - 1.4 1.2 1.4 0.9 0.8 0.3 6.0 0%
Source: GVT Dahod Coordination Office - Gujarat.
DFIDI = Department for International Development (India).PPGF = Participatory Planning and Group Formation.VOD = Village Organisation and Development.SWC = Soil and Water Conservation.WRD = Water Resource Development.
Totals

Table AN12.1.5
Cost Head / Subhead
A. Administration CostsGVT Bhopal (Project HQ)DFIDIDahod Coordination Office
Total A
B. Development CostsComponent A 1. PPGF 2. VOD 3. Crop Technology 4. SWC 5. WRD 6. Livestock 7. Forestry8. Migration Support
Subtotal
Other Development CostsSubtotal
Total B
Total A + B
GVTDFIDICommunityGovernment
Source:
DFIDI = Department for International Development (India).PPGF = Participatory Planning and Group Formation.VOD = Village Organisation and Development.SWC = Soil and Water Conservation.WRD = Water Resource Development.
GVT - Gujarat - Dahod: Village Jadha: Costs - Economic (Rs'000).
1999/00 2000/01 2001/02 2002/03 2003/04 2004/05 2005/06CF SCF Actual Actual Actual Actual Actual Budget Budget (Rs'000) (%)
0.90 1.00 - 54.2 67.9 60.6 47.5 60.1 55.0 345.4 5%1.00 1.00 35.9 71.4 26.9 63.2 47.4 54.7 39.2 338.6 4%0.90 1.00 - 329.2 240.8 170.5 207.5 373.1 260.7 1,581.8 21%
35.9 454.8 335.6 294.3 302.5 488.0 354.9 2,265.8 30%
0.90 1.00 - 3.4 68.2 64.8 51.3 51.3 51.3 290.3 4%0.90 1.00 - 48.3 62.1 140.6 18.8 28.3 3.8 301.9 4%0.90 1.00 - 35.7 90.3 47.6 38.2 11.6 9.0 232.4 3%0.90 0.75 - 23.6 498.9 664.3 667.6 106.2 66.7 2,027.3 27%0.90 0.75 - 51.9 18.9 35.5 1,502.5 208.8 58.0 1,875.7 25%0.90 1.00 - 62.5 46.5 57.2 23.4 21.6 21.6 232.8 3%0.90 1.00 - 20.1 34.3 5.0 72.5 40.8 - 172.7 2%0.90 1.00 - - - 90.0 51.8 34.9 34.9 211.6 3%
- 245.5 819.3 1,105.0 2,426.1 503.4 245.4 5,344.7 70%
0.90 1.00 - - - - - - - - 0% - 245.5 819.3 1,105.0 2,426.1 503.4 245.4 5,344.7 70%
35.9 700.3 1,154.9 1,399.3 2,728.6 991.4 600.3 7,610.5 100%
- - - - - - - N/A- - - - - - - N/A- - - - - - - N/A- - - - - - - N/A
Cost Benefit Analysis (CBA) Study - field verification.
TotalsConversion Factors

Table AN12.1.6 GVT - Gujarat - Dahod: Village Jadha: VOD Household Assumptions.
Without \ With Project UnitsYear 1 Year 2 Year 3(Rs) (Rs) (Rs)
Development Activity:Village Organisation and Development
Before / Without Project Situation:
A. Self Help Groups (SHGs)Assumption Sum Zero Zero Zero - - -
B. Drudgery ReductionAssumption Sum Zero Zero Zero
Total Without Project Benefits - - -
After / With Project Situation:
A. Self Help Groups (SHGs)Assumptions
Average Savings / Household Rs 1,600 900.0 1,300.0 1,600.0 Households / Village No 363 Present Group Savings Rs'000 580.8 326.7 471.9 580.8 Annual Savings Increase % 5%Deposits on Loan to Members % 60%SHG Interest Income % / Year 18%Assumed Benefit Rs'000 35.3 51.0 62.7
B. Drudgery ReductionAssumptions
Hours Saved / Day / Household No 1.0 Number of Days / Year / Household No 200 Days / Year / Household (8hrs/day) No 25.0 Households / Village No 363 Day Equivalent / Village No 9,075 Economic Value per Day (Rs/day) 25 Assumed Benefit Rs'000 226.9 226.9 226.9
Total With Project Benefits Rs'000 262.2 277.8 289.6
Incremental Benefits Rs'000 262.2 277.8 289.6
Source: Cost Benefit Analysis (CBA) Study Estimate Jan 2005.VOD = Village Organisation and Development.Households per village: Jadha 363
Assumptions Benefits

Table AN12.1.6
Without \ With Project
Development Activity:Village Organisation and Development
Before / Without Project Situation:
A. Self Help Groups (SHGs)Assumption
B. Drudgery ReductionAssumption
Total Without Project Benefits
After / With Project Situation:
A. Self Help Groups (SHGs)Assumptions
Average Savings / HouseholdHouseholds / VillagePresent Group SavingsAnnual Savings IncreaseDeposits on Loan to MembersSHG Interest Income Assumed Benefit
B. Drudgery ReductionAssumptions
Hours Saved / Day / HouseholdNumber of Days / Year / HouseholdDays / Year / Household (8hrs/day)Households / VillageDay Equivalent / VillageEconomic Value per DayAssumed Benefit
Total With Project Benefits
Incremental Benefits
Source:VOD = Village Organisation and Development.Households per village: Jadha
GVT - Gujarat - Dahod: Village Jadha: Incremental VOD Benefit Stream (Rs'000).
Year 1 Year 2 Year 3 Year 4 Year 5 Year 6 Year 7 Year 8 Year 9 Year 101999/00 2000/01 2001/02 2002/03 2003/04 2004/05 2005/06 2006/07 2007/08 2008/09
- - - - - - - - - -
- - - 326.7 471.9 580.8 609.8 640.3 672.3 706.0
- - - 35.3 51.0 62.7 65.9 69.2 72.6 76.2
- - - 226.9 226.9 226.9 226.9 226.9 226.9 226.9
- - - 262.2 277.8 289.6 292.7 296.0 299.5 303.1
- - - 262.2 277.8 289.6 292.7 296.0 299.5 303.1
Cost Benefit Analysis (CBA) Study Estimate Jan 2005.
Benefit Streams (Rs '000)

Table AN12.1.7 GVT - Gujarat - Dahod: Village Jadha: Household Crop Net Margin Assumptions.
Without \ With Project UnitsYear 1 Year 2 Year 3(Rs) (Rs) (Rs)
Development Activity:Crop Technology, SWC and WRD
Before / Without Project Situation:AssumptionsHouseholds (HHs) No 363 Crop Adoption Assumptions Percent 100% 100% 100%Kharif Crop Net Margin Rs/HH 900 900 900
Rabi Crop Net Margin 85 85 85 Total Without Project Benefits Rs/HH 985 985 985
After / With Project Situation:Assumptions
Households (HHs) No 363 Crop Adoption Assumptions 100% 100% 100%
Kharif Crop Net Margin Rs/HH 4,475.8 4,475.8 4,475.8
Rabi Crop Net Margin Rs/HH 822.5 822.5 822.5 Total With Project Benefits Rs/HH 5,298.3 5,298.3 5,298.3
Incremental Benefits Rs/HH 4,313.5 4,313.5 4,313.5
Source: Cost Benefit Analysis (CBA) Study Estimate Jan 2005.
BenefitsAssumptions

Table AN12.1.7
Without \ With Project
Development Activity:Crop Technology, SWC and WRD
Before / Without Project Situation:AssumptionsHouseholds (HHs)Crop Adoption AssumptionsKharif Crop Net Margin
Rabi Crop Net MarginTotal Without Project Benefits
After / With Project Situation:Assumptions
Households (HHs)Crop Adoption Assumptions
Kharif Crop Net Margin
Rabi Crop Net MarginTotal With Project Benefits
Incremental Benefits
Source:
GVT - Gujarat - Dahod: Village Jadha: Incremental Crop Benefit Stream (Rs'000).
Year 1 Year 2 Year 3 Year 4 Year 5 Year 6 Year 7 Year 8 Year 9 Year 101999/00 2000/01 2001/02 2002/03 2003/04 2004/05 2005/06 2006/07 2007/08 2008/09
- - - - 326.6 326.6 326.6 326.6 326.6 326.6
- - - - 30.9 30.9 30.9 30.9 30.9 30.9 - - - - 357.5 357.5 357.5 357.5 357.5 357.5
- - - - 1,624.7 1,624.7 1,624.7 1,624.7 1,624.7 1,624.7 -
- - - - 298.6 298.6 298.6 298.6 298.6 298.6 - - - - 1,923.3 1,923.3 1,923.3 1,923.3 1,923.3 1,923.3
- - - - 1,565.8 1,565.8 1,565.8 1,565.8 1,565.8 1,565.8
Cost Benefit Analysis (CBA) Study Estimate Jan 2005.
Benefit Streams (Rs '000)
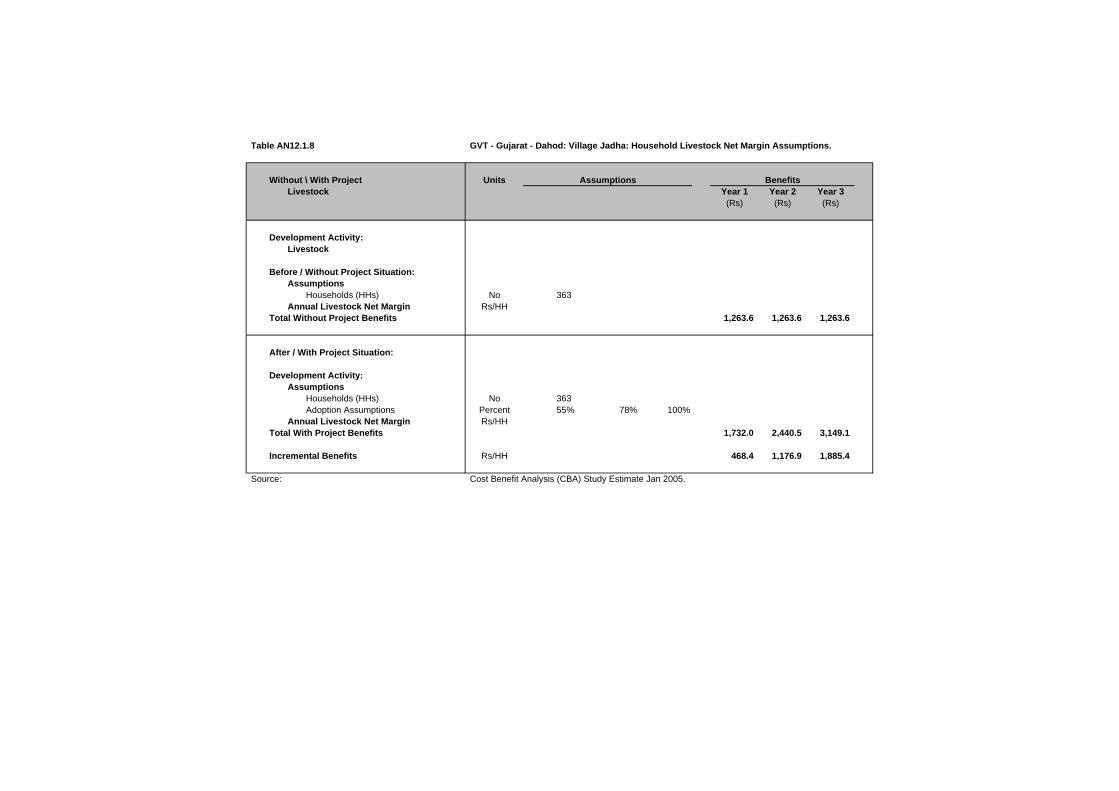
Table AN12.1.8 GVT - Gujarat - Dahod: Village Jadha: Household Livestock Net Margin Assumptions.
Without \ With Project UnitsLivestock Year 1 Year 2 Year 3
(Rs) (Rs) (Rs)
Development Activity:Livestock
Before / Without Project Situation:Assumptions
Households (HHs) No 363 Annual Livestock Net Margin Rs/HH
Total Without Project Benefits 1,263.6 1,263.6 1,263.6
After / With Project Situation:
Development Activity:Assumptions
Households (HHs) No 363 Adoption Assumptions Percent 55% 78% 100%
Annual Livestock Net Margin Rs/HHTotal With Project Benefits 1,732.0 2,440.5 3,149.1
Incremental Benefits Rs/HH 468.4 1,176.9 1,885.4
Source: Cost Benefit Analysis (CBA) Study Estimate Jan 2005.
BenefitsAssumptions

Table AN12.1.8
Without \ With ProjectLivestock
Development Activity:Livestock
Before / Without Project Situation:Assumptions
Households (HHs)Annual Livestock Net Margin
Total Without Project Benefits
After / With Project Situation:
Development Activity:Assumptions
Households (HHs)Adoption Assumptions
Annual Livestock Net MarginTotal With Project Benefits
Incremental Benefits
Source:
GVT - Gujarat - Dahod: Village Jadha: Incremental Livestock Benefit Stream (Rs'000).
Year 1 Year 2 Year 3 Year 4 Year 5 Year 6 Year 7 Year 8 Year 9 Year 101999/00 2000/01 2001/02 2002/03 2003/04 2004/05 2005/06 2006/07 2007/08 2008/09
- - - - 458.7 458.7 458.7 458.7 458.7 458.7
- - - - 628.7 885.9 1,143.1 1,143.1 1,143.1 1,143.1
- - - - 170.0 427.2 684.4 684.4 684.4 684.4
Cost Benefit Analysis (CBA) Study Estimate Jan 2005.
Benefit Streams (Rs '000)

Table AN12.1.9 GVT - Gujarat - Dahod: Village Jadha: Forestry Benefit Assumptions.
Without \ With Project UnitsForestry Year 1 Year 2 Year 3
(Rs) (Rs) (Rs)
Development Activity:Forestry
Before / Without Project Situation:AssumptionsHouseholds (HHs) No 363 Annual Forestry Net Margin Rs/HH
Total Without Project Benefits - - -
After / With Project Situation:AssumptionsHouseholds (HHs) No 363 Adoption Assumptions Percent 55% 78% 100%Annual Forestry Net Margin Rs/HH
Total With Project Benefits 82.5 117.0 150.0
Incremental Benefits Rs/HH 82.5 117.0 150.0
Source: Cost Benefit Analysis (CBA) Study Estimate Jan 2005.
BenefitsAssumptions

Table AN12.1.9
Without \ With ProjectForestry
Development Activity:Forestry
Before / Without Project Situation:AssumptionsHouseholds (HHs)Annual Forestry Net Margin
Total Without Project Benefits
After / With Project Situation:AssumptionsHouseholds (HHs)Adoption AssumptionsAnnual Forestry Net Margin
Total With Project Benefits
Incremental Benefits
Source:
GVT - Gujarat - Dahod: Village Jadha: Incremental Forestry Benefit Stream (Rs'000).
Year 1 Year 2 Year 3 Year 4 Year 5 Year 6 Year 7 Year 8 Year 9 Year 101999/00 2000/01 2001/02 2002/03 2003/04 2004/05 2005/06 2006/07 2007/08 2008/09
- - - - - - - - - -
- - - 29.9 42.5 54.5 54.5 54.5 54.5 54.5
- - - 29.9 42.5 54.5 54.5 54.5 54.5 54.5
Cost Benefit Analysis (CBA) Study Estimate Jan 2005.
Benefit Streams (Rs '000)

Table AN12.1.10 GVT - Gujarat - Dahod: Village Jadha: Migration Support Benefit Assumptions.
Without \ With ProjectYear 1 Year 2 Year 3(Rs) (Rs) (Rs)
Development Activity:Migration Support
Before / Without Project Situation:Assumptions
Economic Value per Day Rs/day 25.0 Days / Month / Household No 18 Economic Value per Month Rs/month 450.0 Months Migration / Year Months 4.0 Economic Value per Household Rs/HH 1,800.0 Households per Village No 363 Households per Village Migrating Percent 50%
Total Without Project Benefits Rs/Village 326.7 326.7 326.7
After / With Project Situation:Assumptions
Economic Value per Day \1 Rs/day 25.0 25% 31.3 Days / Month / Household No 18 30% 24.0 Economic Value per Month Rs/month 450.0 750.0 Months Migration / Year Months 4.0 -25% 3.0 Economic Value per Household Rs/HH 1,800.0 2,250.0 Households per Village No 363 363.0 Households per Village Migrating Percent 50% -10% 45%
Subtotal Migration Benefits Rs/Village 367.5 367.5 367.5
Other Income Sum (Rs'000) 40.0 45.0 60.0 40.0 45.0 60.0
Total With Project Benefits Rs/Village 407.5 412.5 427.5
Incremental Benefits Rs/Village 80.8 85.8 100.8
Source: Cost Benefit Analysis (CBA) Study Estimate Jan 2005.
1\ Financial Wages (Rs/day):Skill Labour - Rs 160
Casual Labour :Male - Rs 40Female - Rs 30
BenefitsAssumptions

Table AN12.1.10
Without \ With Project
Development Activity:Migration Support
Before / Without Project Situation:Assumptions
Economic Value per Day Days / Month / Household Economic Value per Month Months Migration / Year Economic Value per Household Households per Village Households per Village Migrating
Total Without Project Benefits
After / With Project Situation:Assumptions
Economic Value per Day \1Days / Month / Household Economic Value per Month Months Migration / Year Economic Value per Household Households per Village Households per Village Migrating
Subtotal Migration Benefits
Other Income
Total With Project Benefits
Incremental Benefits
Source:
1\ Financial Wages (Rs/day):Skill Labour - Rs 160
Casual Labour :Male - Rs 40Female - Rs 30
GVT - Gujarat - Dahod: Village Jadha: Incremental Migration Support Benefit Stream (Rs'000).
Year 1 Year 2 Year 3 Year 4 Year 5 Year 6 Year 7 Year 8 Year 9 Year 101999/00 2000/01 2001/02 2002/03 2003/04 2004/05 2005/06 2006/07 2007/08 2008/09
- - - - 326.7 326.7 326.7 326.7 326.7 326.7
- - - - 367.5 367.5 367.5 367.5 367.5 367.5
- - - - 40.0 45.0 60.0 60.0 60.0 60.0
- - - - 407.5 412.5 427.5 427.5 427.5 427.5
- - - - 80.8 85.8 100.8 100.8 100.8 100.8
Cost Benefit Analysis (CBA) Study Estimate Jan 2005.
Benefit Streams (Rs '000)

Table AN12.1.11 GVT - Gujarat - Dahod: Village Jadha: Weighted Household Crop Net Margin Summary (Rs/Household).
Item WBR(%) Khalif Rabi Total Khalif Rabi Total Khalif Rabi Total
Phase II Well Being Ranking - Very Poor
Household Net Margin (Rs) 16.0% 834.6 102.5 937.1 1,849.8 1,067.8 2,917.6 1,015.2 965.3 1,980.5 Well Being Ranking - Poor
Household Net Margin (Rs) 63.0% 637.7 - 637.7 4,803.0 220.7 5,023.7 4,019.3 204.0 4,223.3 Well Being Ranking - Moderate
Household Net Margin (Rs) 18.0% 994.0 89.3 1,083.3 3,711.4 2,508.3 6,219.6 2,717.4 2,419.0 5,136.4 Well Being Ranking - Better Off
Household Net Margin (Rs) 3.0% 6,180.9 1,756.7 7,937.5 16,195.9 2,039.3 18,235.2 10,015.0 282.7 10,297.7 Well Being Ranking - Weighted
Household Net Margin (Rs) 100.0% 899.6 85.2 984.8 4,475.8 822.5 5,298.3 3,484.2 726.9 4,211.0
Phase I \1Well Being Ranking - Very Poor
Household Net Margin (Rs) 16.0% 727.1 445.8 1,172.9 6,444.2 2,781.3 9,225.4 5,717.1 2,335.4 8,052.5 Well Being Ranking - Poor
Household Net Margin (Rs) 63.0% 485.8 657.5 1,143.3 10,136.0 5,690.3 15,826.3 9,650.3 5,032.8 14,683.0 Well Being Ranking - Moderate
Household Net Margin (Rs) 18.0% 986.3 3,385.0 4,371.3 9,457.5 5,195.0 14,652.5 8,471.3 1,810.0 10,281.3 Well Being Ranking - Better Off
Household Net Margin (Rs) 3.0% 2,778.0 937.0 3,715.0 4,915.0 9,560.0 14,475.0 2,137.0 8,623.0 10,760.0 Well Being Ranking - Weighted
Household Net Margin (Rs) 100.0% 683.2 1,123.0 1,806.2 9,266.5 5,251.8 14,518.3 8,583.3 4,128.8 12,712.1
Source: Study of Impact of WIRFP on Net Incomes of Target Households, Jan 2004.WBR = GVT Household Well Being Ranking. Survey figures adjusted to Village Profile WBR.\1 GVT - Madhya Pradesh - Phase I: Village Naganwat Choti: Weighted Household Crop Net Margin Summary.
Before / Without Project After / With Project Increment

Table AN12.1.12 GVT - Gujarat - Dahod: Village Jadha: Weighted Household Crop Net Margin Sensitivity Analysis (Rs/Household).
Item EIRRKhalif Rabi Total Khalif Rabi Total Khalif Rabi Total
Development Activity:Crop Technology, SWC and WRD
Weighted Net Margin (Phase II)Household Net Margin (Rs) 899.6 85.2 984.8 4,475.8 822.5 5,298.3 3,576.2 737.4 4,313.5 Incremental Benefit (Phase II / Phase I) 34%
Base Case AssumptionsHousehold Net Margin (Rs) 899.6 85.2 984.8 4,475.8 822.5 5,298.3 3,576.2 737.4 4,313.5 Incremental Benefit (Phase II / Phase I) 34%Sensitivity Increase (%) 0%Development Activity 29%Overall Village 28%
Sensitivity AssumptionsHousehold Net Margin (Rs) 899.6 85.2 984.8 4,475.8 822.5 5,298.3 3,576.2 737.4 4,313.5 Incremental Benefit (Phase II / Phase I) 34%Sensitivity Increase (%) 0%Development Activity 29%Overall Village 28%
Weighted Net Margin (Phase I)Household Net Margin (Rs) 683.2 1,123.0 1,806.2 9,266.5 5,251.8 14,518.3 8,583.3 4,128.8 12,712.1
Source: Study of Impact of WIRFP on Net Incomes of Target Households, Jan 2004.EIRR = Economic Internal Rate of Return (rate at which NPV equal to zero).N/A = Not analysed as EIRR negative.
Before / Without Project After / With Project Increment

Table AN12.1.13 GVT - Gujarat - Dahod: Village Jadha: Weighted Household Livestock Net Margin Summary (Rs/Household).
Well Being Ranking Weight(%) Herd Value Net Margin Herd Value Net Margin Herd Value Net Margin
Phase I - Well Being Ranking (WBR) \1Madhya Pradesh - WBR Weighted DataVery Poor 16.0%
Average 580 (185.0) 5,650 412.5 474 597.5 Poor 63.0%
Average 2,350 982.5 8,250 2,141.0 1,180 1,158.5 Moderate 18.0%
Average 14,700 6,730.0 1,900 2,820.0 1,900 (3,910.0)Better Off 3.0%
Average 15,580 3,000.0 14,600 10,790.0 (196) 7,790.0
Phase I - WBR Weighted Data 100.0% 4,687 1,890.8 6,882 2,246.1 1,155 355.4
Phase II - Well Being Ranking (WBR)
Very Poor 16.0%Average 5,756 149.2 10,970 1,446.4 1,043 1,297.2
Poor 63.0%Average 13,128 852.2 25,979 3,008.8 2,570 2,156.8
Moderate 18.0%Average 13,525 4,035.1 27,020 5,249.5 2,699 1,214.4
Better Off 3.0%Average 12,700 (781.7) 41,873 2,573.3 5,835 3,355.0
Phase II - WBR Weighted Data 100.0% 12,007 1,263.6 24,242 3,149.1 2,447 1,885.6
Source: Study of Impact of WIRFP on Net Incomes of Target Households, Jan 2004.WBR = GVT Household Well Being Ranking. Survey figures adjusted to Village Profile WBR.
\1 GVT - Madhya Pradesh - Phase I: Village Naganwat Choti: Weighted Household Livestock Net Margin Summary.
Before / Without Project After / With Project Increment \1

WIRFP - Phase II - Cost Benefit Analysis Study
Tables AN12.0 Individual Village Cost Benefit Analysis
Tables AN12.2 GVT Gujarat - Dahod: Village Kasotya
Table AN12.2.1 GVT - Gujarat - Dahod: Village Kasotya: Village Profile.
Table AN12.2.2 GVT - Gujarat - Dahod: Village Kasotya: Cost Benefit Analysis Summary (Rs'000).Table AN12.2.3 GVT - Gujarat - Dahod: Village Kasotya: Cost Benefit Analysis Development Activity Summary A (Rs'000).Table AN12.2.4 GVT - Gujarat - Dahod: Village Kasotya: Cost Benefit Analysis Development Activity Summary B (Rs'000).
Table AN12.2.5 GVT - Gujarat - Dahod: Village Kasotiya: Costs - Financial (Rs'000).GVT - Gujarat - Dahod: Village Kasotiya: Costs - Economic (Rs'000).
Table AN12.2.6 GVT - Gujarat - Dahod: Village Kasotya: VOD Household Assumptions.GVT - Gujarat - Dahod: Village Kasotya: Incremental VOD Benefit Stream (Rs'000).
Table AN12.2.7 GVT - Gujarat - Dahod: Village Kasotya: Household Crop Net Margin Assumptions.GVT - Gujarat - Dahod: Village Kasotya: Incremental Crop Benefit Stream (Rs'000).
Table AN12.2.8 GVT - Gujarat - Dahod: Village Kasotya: Household Livestock Net Margin Assumptions.GVT - Gujarat - Dahod: Village Kasotya: Incremental Livestock Benefit Stream (Rs'000).
Table AN12.2.9 GVT - Gujarat - Dahod: Village Kasotya: Forestry Benefit Assumptions.GVT - Gujarat - Dahod: Village Kasotya: Incremental Forestry Benefit Stream (Rs'000).
Table AN12.2.10 GVT - Gujarat - Dahod: Village Kasotya: Migration Support Benefit Assumptions.GVT - Gujarat - Dahod: Village Kasotya: Incremental Migration Support Benefit Stream (Rs'000).
Table AN12.2.11 GVT - Gujarat - Dahod: Village Kasotya: Weighted Household Crop Net Margin Summary (Rs/Household).Table AN12.2.12 GVT - Gujarat - Dahod: Village Kasotya: Weighted Household Crop Net Margin Sensitivity Analysis (Rs/Household).
Table AN12.2.13 GVT - Gujarat - Dahod: Village Kasotya: Weighted Household Livestock Net Margin Summary (Rs/Household).

Table AN12.2.1 GVT - Gujarat - Dahod: Village Kasotya: Village Profile.
Village Profile \1
A. Background F. Land Resource (ha)Village Name Kasotya Total Area 1,137 District Dahod Revenue Land (unused) 367 State Gujarat Forest Area - Revenue 5
Pasture Land 468 B. Participatory Planning Process (PPP) Arable Land 468
Village entry Apr-00PRA Jan-01CPA Jan-01 G. Livestock
C. InfrastructureHand Pumps (no) 31 Wells (no) 59 Linked by Road 4 KmsElectrification YesSchool 1 - 7 H. Self Help Groups (No Households)
1 Group 1 19 D. Demographic Data 2 Group 2 19
Households (no) 372 3 Group 3 17 Participating Households 190 4 Group 4 19 Population (Adults): 1,624 5 Group 5 16
Adults: 6 Group 6 16 Male 871 7 Group 7 19 Female 753 8 Group 8 13 Children: 9 Group 9 13 Boys N/A 10 Group 10 13 Girls N/A 11 Group 11 10
12 Group 12 19 E. Well Being Ranking (No Households) 13 Group 13 -
Very Poor 34 17.6% 14 Group 14 - Poor 122 63.2% 15 Group 15 - Moderate 37 19.2% 16 Group 16 - Better Off - 0.0% 17 Group 17 - Total 193 100% 18 Group 18 -
19 Group 19 - Total 193
Source: GVT Dahod Coordination Office - Gujarat.\1 Subject to final adjustment following consolidation exercise prior to Annual Review Meeting (ARM) in Feb 2005.

Table AN12.2.2 GVT - Gujarat - Dahod: Village Kasotya: Cost Benefit Analysis Summary (Rs'000).
Administration Cost / Development Activity EIRR \1 Year 1 Year 2 Year 3 Year 4 Year 5 Year 6 Year 7 Year 8 Year 9 Year 10(10%) (%) 1999/00 2000/01 2001/02 2002/03 2003/04 2004/05 2005/06 2006/07 2007/08 2008/09
A. Administration CostsTotal A N/A (1,503) -66% 35.9 454.8 335.6 294.3 302.5 488.0 354.9 35.5 35.5 35.5
B. Development Activity Component A 1. PPGF
Net Incremental Benefits N/A (107) -5% - (33.6) (35.4) (19.5) (19.9) (22.5) (20.9) (3.5) (3.5) (3.5)
2. VODNet Incremental Benefits 40% 454 20% - (144.6) (78.7) 87.1 127.3 99.0 125.4 133.2 134.0 134.9
3/5.Crop Technology, SWC and WRDNet Incremental Benefits 67% 1,995 88% - (73.8) (142.2) (140.0) 459.8 106.1 345.3 610.1 610.1 610.1
6. LivestockNet Incremental Benefits 121% 1,304 58% - (40.3) (21.5) 62.2 192.3 218.7 288.5 330.8 330.8 330.8
7. ForestryNet Incremental Benefits 69% 54 2% - (3.1) (3.1) (2.4) 15.4 (1.6) 15.5 15.5 15.5 15.5
8. Migration SupportNet Incremental Benefits 89% 69 3% - - - - - (7.8) (16.3) 27.7 27.7 27.7
SummaryNet Incremental Benefits 27% 2,266 100% (35.9) (750.2) (616.4) (306.9) 472.4 (96.0) 382.6 1,078.3 1,079.1 1,080.0
Sensitivity AnalysisAnalysis Period
12 Years 22% 889 20 Years (Base Case) 27% 2,266 25 Years 27% 2,669 30 Years 27% 2,898
Costs - AdministrationInvestment Costs Decreased by 20 percent. 31% 2,566
Costs - Administration and DevelopmentRecurrent Costs Increased by 20 percent. 26% 2,090
Benefits - Crop, SWC and WRD and LivestockCrop Benefits Increased by 20 percent. 30% 2,945 Livestock Benefits Increased by 20 percent. 30% 2,771
Source: GVT Dahod Coordination Office - Gujarat.\1 EIRR = Economic Internal Rate of Return (rate at which NPV equal to zero).\2 NPV = Net Present Value of net incremental benefits at 12% (indicative opportunity cost of capital for rural development projects in India).
N/A = Not analysed as EIRR negative.
NPV \2

Table AN12.2.3 GVT - Gujarat - Dahod: Village Kasotya: Cost Benefit Analysis Development Activity Summary A (Rs'000).
Administration Cost / Development Activity EIRR \1 Year 1 Year 2 Year 3 Year 4 Year 5 Year 6 Year 7 Year 8 Year 9 Year 10(10%) (%) 1999/00 2000/01 2001/02 2002/03 2003/04 2004/05 2005/06 2006/07 2007/08 2008/09
A. Administration CostsInvestment 35.9 454.8 335.6 294.3 302.5 488.0 354.9 - - - Projected - - - - - - - 35.5 35.5 35.5
Total A N/A (1,503.0) -66% 35.9 454.8 335.6 294.3 302.5 488.0 354.9 35.5 35.5 35.5
B. Development Activity Component A 1. PPGF
Cost StreamInvestment - 33.6 34.5 17.8 17.8 19.9 17.8 - - - Recurrent - - 0.8 1.7 2.1 2.6 3.1 3.5 3.5 3.5 Total Costs - 33.6 35.4 19.5 19.9 22.5 20.9 3.5 3.5 3.5
Benefit StreamBefore / Without Project - - - - - - - - - - After / With Project - - - - - - - - - - Incremental Benefits - - - - - - - - - -
Net Incremental Benefits N/A (106.8) -5% - (33.6) (35.4) (19.5) (19.9) (22.5) (20.9) (3.5) (3.5) (3.5)
2. VODCost Stream
Investment - 144.6 71.5 47.7 5.9 34.7 7.3 - - - Recurrent - - 7.2 10.8 13.2 13.5 15.2 15.6 15.6 15.6 Total Costs - 144.6 78.7 58.5 19.1 48.1 22.5 15.6 15.6 15.6
Benefit StreamBefore / Without Project - - - - - - - - - - After / With Project - - - 145.6 146.4 147.2 148.0 148.8 149.6 150.5 Incremental Benefits - - - 145.6 146.4 147.2 148.0 148.8 149.6 150.5
Net Incremental Benefits 40% 454.3 20% - (144.6) (78.7) 87.1 127.3 99.0 125.4 133.2 134.0 134.9
3/5.Crop Technology, SWC and WRDCost Stream
InvestmentCrop Tecnology - 28.1 64.5 52.2 11.0 13.3 12.7 - - - Soil Water Conservation - - - - 288.4 576.9 288.5 - - - Water Resource Development - 45.7 70.2 68.1 - 26.6 - - - -
RecurrentCrop Tecnology - - 0.7 2.3 3.6 3.9 4.2 4.5 4.5 4.5 Soil Water Conservation - - - - - 36.0 108.2 144.2 144.2 144.2 Water Resource Development - 6.9 17.4 27.6 27.6 31.6 31.6 31.6 31.6
Total Costs - 73.8 142.2 140.0 330.6 684.3 445.1 180.3 180.3 180.3 Benefit Stream
Before / Without Project - - - - 149.8 149.8 149.8 149.8 149.8 149.8 After / With Project - - - - 940.3 940.3 940.3 940.3 940.3 940.3 Incremental Benefits - - - - 790.4 790.4 790.4 790.4 790.4 790.4
Net Incremental Benefits 67% 1,994.6 88% - (73.8) (142.2) (140.0) 459.8 106.1 345.3 610.1 610.1 610.1
Source: GVT Dahod Coordination Office - Gujarat.\1 EIRR = Economic Internal Rate of Return (rate at which NPV equal to zero).\2 NPV = Net Present Value of net incremental benefits at 12% (indicative opportunity cost of capital for rural development projects in India).
N/A = Not analysed as EIRR negative.
NPV \2

Table AN12.2.4 GVT - Gujarat - Dahod: Village Kasotya: Cost Benefit Analysis Development Activity Summary B (Rs'000).
Administration Cost / Development Activity EIRR \1 Year 1 Year 2 Year 3 Year 4 Year 5 Year 6 Year 7 Year 8 Year 9 Year 10(10%) (%) 1999/00 2000/01 2001/02 2002/03 2003/04 2004/05 2005/06 2006/07 2007/08 2008/09
6. LivestockCost Stream
Investment - 40.3 16.9 4.2 4.2 114.8 42.3 - - - Recurrent - 4.6 11.6 18.4 18.4 21.1 21.1 21.1 21.1 Total Costs - 40.3 21.5 15.8 22.6 133.2 63.3 21.1 21.1 21.1
Benefit StreamBefore / Without Project - - - 256.7 256.7 256.7 256.7 256.7 256.7 256.7 After / With Project - - - 334.7 471.7 608.6 608.6 608.6 608.6 608.6 Incremental Benefits - - - 78.0 214.9 351.8 351.8 351.8 351.8 351.8
Net Incremental Benefits 121% 1,303.6 58% - (40.3) (21.5) 62.2 192.3 218.7 288.5 330.8 330.8 330.8
7. ForestryCost Stream
Investment - 3.1 2.8 12.4 1.1 19.0 - - - - Recurrent - 0.3 0.6 1.8 1.9 3.8 3.8 3.8 3.8 Total Costs - 3.1 3.1 13.0 2.9 20.9 3.8 3.8 3.8 3.8
Benefit StreamBefore / Without Project - - - - - - - - - - After / With Project - - - 10.6 18.3 19.3 19.3 19.3 19.3 19.3 Incremental Benefits - - - 10.6 18.3 19.3 19.3 19.3 19.3 19.3
Net Incremental Benefits 69% 53.6 2% - (3.1) (3.1) (2.4) 15.4 (1.6) 15.5 15.5 15.5 15.5
8. Migration SupportCost Stream
Investment - - - - - 7.8 15.6 - - - Recurrent - - - - - 0.8 2.3 2.3 2.3 Total Costs - - - - - 7.8 16.3 2.3 2.3 2.3
Benefit StreamBefore / Without Project - - - - - - - 126.7 126.7 126.7 After / With Project - - - - - - - 156.7 156.7 156.7 Incremental Benefits - - - - - - - 30.1 30.1 30.1
Net Incremental Benefits 89% 69.3 3% - - - - - (7.8) (16.3) 27.7 27.7 27.7 EIRR
SummaryCost Stream
Investment 35.9 750.2 595.9 496.7 630.9 1,300.8 739.0 - - - Recurrent - - 20.5 44.4 66.8 104.0 188.0 262.2 262.2 262.2 Total Costs 35.9 750.2 616.4 541.1 697.7 1,404.7 927.0 262.2 262.2 262.2
Benefit StreamBefore / Without Project - - - 256.7 406.6 406.6 406.6 533.2 533.2 533.2 After / With Project - - - 491.0 1,576.6 1,715.3 1,716.1 1,873.7 1,874.5 1,875.4 Incremental Benefits - - - 234.2 1,170.1 1,308.7 1,309.5 1,340.4 1,341.3 1,342.2
Net Incremental Benefits 27% 2,265.7 100% (35.9) (750.2) (616.4) (306.9) 472.4 (96.0) 382.6 1,078.3 1,079.1 1,080.0
Source: GVT Dahod Coordination Office - Gujarat.\1 EIRR = Economic Internal Rate of Return (rate at which NPV equal to zero).\2 NPV = Net Present Value of net incremental benefits at 12% (indicative opportunity cost of capital for rural development projects in India).
N/A = Not analysed as EIRR negative.
NPV \2

Table AN12.2.5 GVT - Gujarat - Dahod: Village Kasotiya: Costs - Financial (Rs'000).
Cost Head / Subhead 1999/00 2000/01 2001/02 2002/03 2003/04 2004/05 2005/06Actual Actual Actual Actual Actual Budget Budget (Rs'000) (%)
A. Administration CostsGVT Bhopal (PHQ) - 60.3 75.4 67.3 52.8 66.8 61.1 383.7 7%DFIDI 35.9 71.4 26.9 63.2 47.4 54.7 39.2 338.6 6%Dahod Coordination Office - 365.7 267.5 189.4 230.6 414.6 289.7 1,757.6 32%
Total A 35.9 497.4 369.9 319.9 330.8 536.1 390.0 2,480.0 45%
B. Development CostsComponent A 1. PPGF - 37.3 38.4 19.8 19.8 22.1 19.8 157.1 3% 2. VOT - 160.6 79.4 53.0 6.6 38.5 8.1 346.2 6% 3. Crop Technology - 31.2 71.6 58.0 12.3 14.7 14.1 202.0 4% 4. SWC - - - - 427.2 854.7 427.4 1,709.2 31% 5. WRD - 67.7 104.0 100.9 - 39.4 - 312.0 6% 6. Livestock - 44.8 18.8 4.7 4.7 127.5 47.0 247.5 4% 7. Forestry - 3.5 3.1 13.8 1.2 21.1 - 42.7 1%8. Migration Support - - - - - 8.6 17.3 25.9 0%
Subtotal - 345.1 315.3 250.2 471.7 1,126.6 533.6 3,042.5 55%
Other Development CostsSubtotal - - - - - - - - 0%
Total B - 345.1 315.3 250.2 471.7 1,126.6 533.6 3,042.5 55%
Total A + B 35.9 842.5 685.2 570.1 802.5 1,662.7 923.6 5,522.5 100%
GVT - 718.4 605.2 466.1 521.6 1,102.5 639.5 4,053.4 73%DFIDI 35.9 71.4 26.9 63.2 47.4 54.7 39.2 338.6 6%Community - 48.5 51.2 40.0 233.3 499.3 242.8 1,115.0 20%Government - 4.2 1.9 0.8 0.2 6.2 2.2 15.5 0%
Source: GVT Dahod Coordination Office - Gujarat.
DFIDI = Department for International Development (India).PPGF = Participatory Planning and Group Formation.VOD = Village Organisation and Development.SWC = Soil and Water Conservation.WRD = Water Resource Development.
Totals

Table AN12.2.5
Cost Head / Subhead
A. Administration CostsGVT Bhopal (PHQ)DFIDIDahod Coordination Office
Total A
B. Development CostsComponent A 1. PPGF 2. VOT 3. Crop Technology 4. SWC 5. WRD 6. Livestock 7. Forestry8. Migration Support
Subtotal
Other Development CostsSubtotal
Total B
Total A + B
GVTDFIDICommunityGovernment
Source:
DFIDI = Department for International Development (India).PPGF = Participatory Planning and Group Formation.VOD = Village Organisation and Development.SWC = Soil and Water Conservation.WRD = Water Resource Development.
GVT - Gujarat - Dahod: Village Kasotiya: Costs - Economic (Rs'000).
1999/00 2000/01 2001/02 2002/03 2003/04 2004/05 2005/06CF SCF Actual Actual Actual Actual Actual Budget Budget (Rs'000) (%)
0.90 1.00 - 54.2 67.9 60.6 47.5 60.1 55.0 345.4 8%1.00 1.00 35.9 71.4 26.9 63.2 47.4 54.7 39.2 338.6 7%0.90 1.00 - 329.2 240.8 170.5 207.5 373.1 260.7 1,581.8 35%
35.9 454.8 335.6 294.3 302.5 488.0 354.9 2,265.8 50%
0.90 1.00 - 33.6 34.5 17.8 17.8 19.9 17.8 141.4 3%0.90 1.00 - 144.6 71.5 47.7 5.9 34.7 7.3 311.6 7%0.90 1.00 - 28.1 64.5 52.2 11.0 13.3 12.7 181.8 4%0.90 0.75 - - - - 288.4 576.9 288.5 1,153.7 25%0.90 0.75 - 45.7 70.2 68.1 - 26.6 - 210.6 5%0.90 1.00 - 40.3 16.9 4.2 4.2 114.8 42.3 222.7 5%0.90 1.00 - 3.1 2.8 12.4 1.1 19.0 - 38.4 1%0.90 1.00 - - - - - 7.8 15.6 23.3 1%
- 295.4 260.4 202.5 328.4 812.8 384.1 2,283.5 50%
0.90 1.00 - - - - - - - - 0% - 295.4 260.4 202.5 328.4 812.8 384.1 2,283.5 50%
35.9 750.2 595.9 496.7 630.9 1,300.8 739.0 4,549.4 100%
- - - - - - - N/A- - - - - - - N/A- - - - - - - N/A- - - - - - - N/A
Cost Benefit Analysis (CBA) Study Estimate Jan 2005.
TotalsConversion Factors

Table AN12.2.6 GVT - Gujarat - Dahod: Village Kasotya: VOD Household Assumptions.
Without \ With Project UnitsYear 1 Year 2 Year 3(Rs) (Rs) (Rs)
Development Activity:Village Organisation and Development
Before / Without Project Situation:
A. Self Help Groups (SHGs)Assumption Sum Zero Zero Zero - - -
B. Drudgery ReductionAssumption Sum Zero Zero Zero
Total Without Project Benefits - - -
After / With Project Situation:
A. Self Help Groups (SHGs)Assumptions
Average Savings / Household Rs 1,200 Households / Village No 193 Present Group Savings Rs'000 231.6 231.6 238.5 245.7 Annual Savings Increase % 3%Deposits on Loan to Members % 60%SHG Interest Income % / Year 18%Assumed Benefit Rs'000 25.0 25.8 26.5
B. Drudgery ReductionAssumptions
Hours Saved / Day / Household No 1.0 Number of Days / Year / Household No 200 Days / Year / Household (8hrs/day) No 25.0 Households / Village No 193 Day Equivalent / Village No 4,825 Economic Value per Day (Rs/day) 25 Assumed Benefit Rs'000 120.6 120.6 120.6
Total With Project Benefits Rs'000 145.6 146.4 147.2
Incremental Benefits Rs'000 145.6 146.4 147.2
Source: GVT Dahod Coordination Office - Gujarat.PPGF = Participatory Planning and Group Formation.Households per village: Kasotya 193
Assumptions Benefits

Table AN12.2.6
Without \ With Project
Development Activity:Village Organisation and Development
Before / Without Project Situation:
A. Self Help Groups (SHGs)Assumption
B. Drudgery ReductionAssumption
Total Without Project Benefits
After / With Project Situation:
A. Self Help Groups (SHGs)Assumptions
Average Savings / HouseholdHouseholds / VillagePresent Group SavingsAnnual Savings IncreaseDeposits on Loan to MembersSHG Interest Income Assumed Benefit
B. Drudgery ReductionAssumptions
Hours Saved / Day / HouseholdNumber of Days / Year / HouseholdDays / Year / Household (8hrs/day)Households / VillageDay Equivalent / VillageEconomic Value per DayAssumed Benefit
Total With Project Benefits
Incremental Benefits
Source:PPGF = Participatory Planning and Group FormatiHouseholds per village: Kasotya
GVT - Gujarat - Dahod: Village Kasotya: Incremental VOD Benefit Stream (Rs'000).
Year 1 Year 2 Year 3 Year 4 Year 5 Year 6 Year 7 Year 8 Year 9 Year 101999/00 2000/01 2001/02 2002/03 2003/04 2004/05 2005/06 2006/07 2007/08 2008/09
- - - - - - - - - -
- - - 231.6 238.5 245.7 253.1 260.7 268.5 276.5
- 25.0 25.8 26.5 27.3 28.2 29.0 29.9
- - - 120.6 120.6 120.6 120.6 120.6 120.6 120.6
- - - 145.6 146.4 147.2 148.0 148.8 149.6 150.5
- - - 145.6 146.4 147.2 148.0 148.8 149.6 150.5
Cost Benefit Analysis (CBA) Study Estimate Jan 2005.
Benefit Streams (Rs '000)

Table AN12.2.7 GVT - Gujarat - Dahod: Village Kasotya: Household Crop Net Margin Assumptions.
Without \ With Project UnitsYear 1 Year 2 Year 3(Rs) (Rs) (Rs)
Development Activity:Crop Technology, SWC and WRD
Before / Without Project Situation:AssumptionsHouseholds (HHs) No 193 Crop Adoption Assumptions Percent 100% 100% 100%Kharif Crop Net Margin Rs/HH 741 741 741
Rabi Crop Net Margin 35 35 35 Total Without Project Benefits Rs/HH 776 776 776
After / With Project Situation:Assumptions
Households (HHs) No 193 Crop Adoption Assumptions 100% 100% 100%
Kharif Crop Net Margin Rs/HH 4,064.0 4,064.0 4,064.0
Rabi Crop Net Margin Rs/HH 807.8 807.8 807.8 Total With Project Benefits Rs/HH 4,871.8 4,871.8 4,871.8
Incremental Benefits Rs/HH 4,095.6 4,095.6 4,095.6
Source: GVT Dahod Coordination Office - Gujarat.
BenefitsAssumptions

Table AN12.2.7
Without \ With Project
Development Activity:Crop Technology, SWC and WRD
Before / Without Project Situation:AssumptionsHouseholds (HHs)Crop Adoption AssumptionsKharif Crop Net Margin
Rabi Crop Net MarginTotal Without Project Benefits
After / With Project Situation:Assumptions
Households (HHs)Crop Adoption Assumptions
Kharif Crop Net Margin
Rabi Crop Net MarginTotal With Project Benefits
Incremental Benefits
Source:
GVT - Gujarat - Dahod: Village Kasotya: Incremental Crop Benefit Stream (Rs'000).
Year 1 Year 2 Year 3 Year 4 Year 5 Year 6 Year 7 Year 8 Year 9 Year 101999/00 2000/01 2001/02 2002/03 2003/04 2004/05 2005/06 2006/07 2007/08 2008/09
- - - - 143.0 143.0 143.0 143.0 143.0 143.0
- - - - 6.8 6.8 6.8 6.8 6.8 6.8 - - - - 149.8 149.8 149.8 149.8 149.8 149.8
- - - - 784.4 784.4 784.4 784.4 784.4 784.4
- - - - 155.9 155.9 155.9 155.9 155.9 155.9 - - - - 940.3 940.3 940.3 940.3 940.3 940.3
- - - - 790.4 790.4 790.4 790.4 790.4 790.4
Cost Benefit Analysis (CBA) Study Estimate Jan 2005.
Benefit Streams (Rs '000)
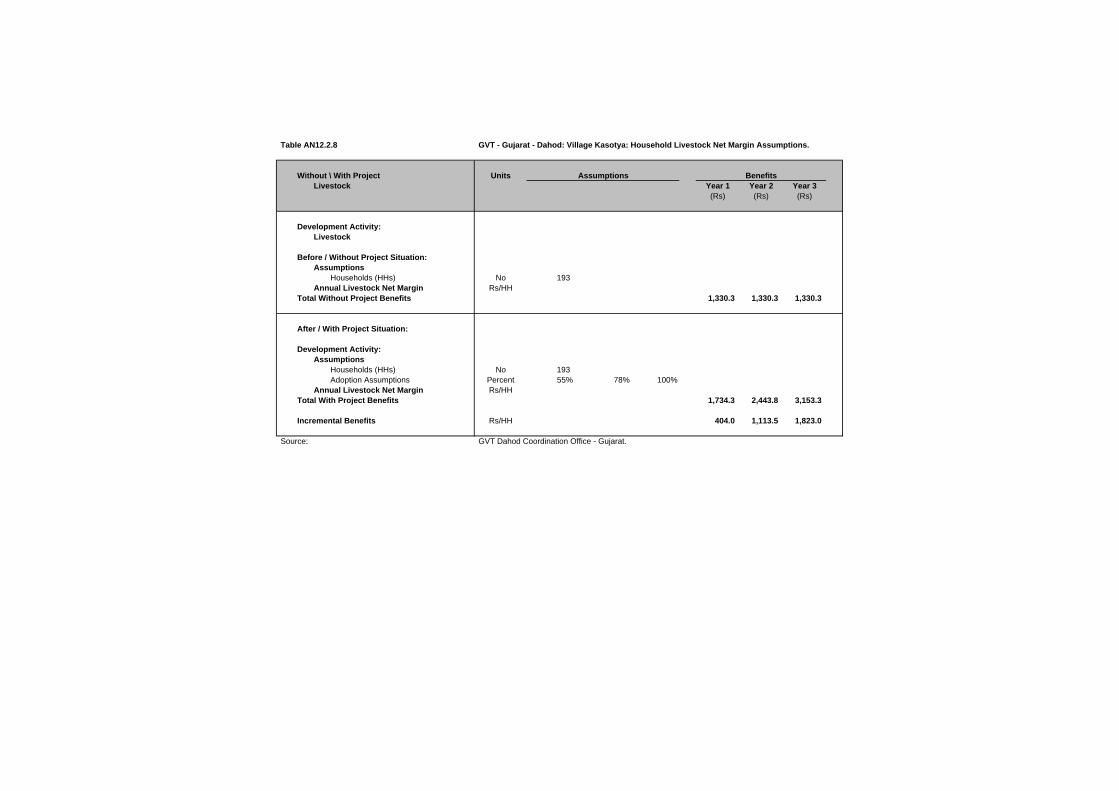
Table AN12.2.8 GVT - Gujarat - Dahod: Village Kasotya: Household Livestock Net Margin Assumptions.
Without \ With Project UnitsLivestock Year 1 Year 2 Year 3
(Rs) (Rs) (Rs)
Development Activity:Livestock
Before / Without Project Situation:Assumptions
Households (HHs) No 193 Annual Livestock Net Margin Rs/HH
Total Without Project Benefits 1,330.3 1,330.3 1,330.3
After / With Project Situation:
Development Activity:Assumptions
Households (HHs) No 193 Adoption Assumptions Percent 55% 78% 100%
Annual Livestock Net Margin Rs/HHTotal With Project Benefits 1,734.3 2,443.8 3,153.3
Incremental Benefits Rs/HH 404.0 1,113.5 1,823.0
Source: GVT Dahod Coordination Office - Gujarat.
BenefitsAssumptions

Table AN12.2.8
Without \ With ProjectLivestock
Development Activity:Livestock
Before / Without Project Situation:Assumptions
Households (HHs)Annual Livestock Net Margin
Total Without Project Benefits
After / With Project Situation:
Development Activity:Assumptions
Households (HHs)Adoption Assumptions
Annual Livestock Net MarginTotal With Project Benefits
Incremental Benefits
Source:
GVT - Gujarat - Dahod: Village Kasotya: Incremental Livestock Benefit Stream (Rs'000).
Year 1 Year 2 Year 3 Year 4 Year 5 Year 6 Year 7 Year 8 Year 9 Year 101999/00 2000/01 2001/02 2002/03 2003/04 2004/05 2005/06 2006/07 2007/08 2008/09
- - - 256.7 256.7 256.7 256.7 256.7 256.7 256.7
- - - 334.7 471.7 608.6 608.6 608.6 608.6 608.6
- - - 78.0 214.9 351.8 351.8 351.8 351.8 351.8
Cost Benefit Analysis (CBA) Study Estimate Jan 2005.
Benefit Streams (Rs '000)

Table AN12.2.9 GVT - Gujarat - Dahod: Village Kasotya: Forestry Benefit Assumptions.
Without \ With Project UnitsForestry Year 1 Year 2 Year 3
(Rs) (Rs) (Rs)
Development Activity:Forestry
Before / Without Project Situation:AssumptionsHouseholds (HHs) No 193 Annual Forestry Net Margin Rs/HH
Total Without Project Benefits - - -
After / With Project Situation:AssumptionsHouseholds (HHs) No 193 Adoption Assumptions Percent 55% 95% 100%Annual Forestry Net Margin Rs/HH
Total With Project Benefits 55.0 95.0 100.0
Incremental Benefits Rs/HH 55.0 95.0 100.0
Source: GVT Dahod Coordination Office - Gujarat.
BenefitsAssumptions

Table AN12.2.9
Without \ With ProjectForestry
Development Activity:Forestry
Before / Without Project Situation:AssumptionsHouseholds (HHs)Annual Forestry Net Margin
Total Without Project Benefits
After / With Project Situation:AssumptionsHouseholds (HHs)Adoption AssumptionsAnnual Forestry Net Margin
Total With Project Benefits
Incremental Benefits
Source:
GVT - Gujarat - Dahod: Village Kasotya: Incremental Forestry Benefit Stream (Rs'000).
Year 1 Year 2 Year 3 Year 4 Year 5 Year 6 Year 7 Year 8 Year 9 Year 101999/00 2000/01 2001/02 2002/03 2003/04 2004/05 2005/06 2006/07 2007/08 2008/09
- - - - - - - - - -
- - - 10.6 18.3 19.3 19.3 19.3 19.3 19.3
- - - 10.6 18.3 19.3 19.3 19.3 19.3 19.3
Cost Benefit Analysis (CBA) Study Estimate Jan 2005.
Benefit Streams (Rs '000)

Table AN12.2.10 GVT - Gujarat - Dahod: Village Kasotya: Migration Support Benefit Assumptions.
Without \ With ProjectYear 1 Year 2 Year 3(Rs) (Rs) (Rs)
Development Activity:Migration Support
Before / Without Project Situation:Assumptions
Economic Value per Day Rs/day 25.0 Days / Month / Household No 15 Economic Value per Month Rs/month 375.0 Months Migration / Year Months 3.5 Economic Value per Household Rs/HH 1,312.5 Households per Village No 193 Households per Village Migrating Percent 50%
Total Without Project Benefits Rs/Village 126.7 126.7 126.7
After / With Project Situation:Assumptions
Economic Value per Day \1 Rs/day 25.0 25% 31.3 Days / Month / Household No 15 45% 22.0 Economic Value per Month Rs/month 375.0 687.5 Months Migration / Year Months 3.5 -25% 2.6 Economic Value per Household Rs/HH 1,312.5 1,804.7 Households per Village No 193 193.0 Households per Village Migrating Percent 50% -10% 45%Adoption Assumptions Percent 75% 85% 100%
Subtotal Migration Benefits Rs/Village 117.6 133.2 156.7
Other Income Sum (Rs'000) - - - - - -
Total With Project Benefits Rs/Village 117.6 133.2 156.7
Incremental Benefits Rs/Village (9.1) 6.6 30.1
Source: GVT Dahod Coordination Office - Gujarat.
1\ Financial Wages (Rs/day):Skill Labour - Rs 160
Casual Labour :Male - Rs 40Female - Rs 30
BenefitsAssumptions

Table AN12.2.10
Without \ With Project
Development Activity:Migration Support
Before / Without Project Situation:Assumptions
Economic Value per Day Days / Month / Household Economic Value per Month Months Migration / Year Economic Value per Household Households per Village Households per Village Migrating
Total Without Project Benefits
After / With Project Situation:Assumptions
Economic Value per Day \1Days / Month / Household Economic Value per Month Months Migration / Year Economic Value per Household Households per Village Households per Village Migrating Adoption Assumptions
Subtotal Migration Benefits
Other Income
Total With Project Benefits
Incremental Benefits
Source:
1\ Financial Wages (Rs/day):Skill Labour - Rs 160
Casual Labour :Male - Rs 40Female - Rs 30
GVT - Gujarat - Dahod: Village Kasotya: Incremental Migration Support Benefit Stream (Rs'000).
Year 1 Year 2 Year 3 Year 4 Year 5 Year 6 Year 7 Year 8 Year 9 Year 101999/00 2000/01 2001/02 2002/03 2003/04 2004/05 2005/06 2006/07 2007/08 2008/09
- - - - - - - 126.7 126.7 126.7
- - - - - - - 156.7 156.7 156.7
- - - - - - - - - -
- - - - - - - 156.7 156.7 156.7
- - - - - - - 30.1 30.1 30.1
Cost Benefit Analysis (CBA) Study Estimate Jan 2005.
Benefit Streams (Rs '000)

Table AN12.2.11 GVT - Gujarat - Dahod: Village Kasotya: Weighted Household Crop Net Margin Summary (Rs/Household).
Item WBR(%) Khalif Rabi Total Khalif Rabi Total Khalif Rabi Total
Phase II VillagesWell Being Ranking - Very Poor
Household Net Margin (Rs) 18.0% 834.6 102.5 937.1 1,849.8 1,067.8 2,917.6 1,015.2 965.3 1,980.5 Well Being Ranking - Poor
Household Net Margin (Rs) 63.0% 637.7 - 637.7 4,803.0 220.7 5,023.7 4,165.3 220.7 4,386.0 Well Being Ranking - Moderate
Household Net Margin (Rs) 19.0% 994.0 89.3 1,083.3 3,711.4 2,508.3 6,219.6 2,717.4 2,419.0 5,136.4 Well Being Ranking - Better Off
Household Net Margin (Rs) 0.0% 6,180.9 1,756.7 7,937.5 16,195.9 2,039.3 18,235.2 10,015.0 282.7 10,297.7 Well Being Ranking - Weighted
Household Net Margin (Rs) 100.0% 740.8 35.4 776.2 4,064.0 807.8 4,871.8 3,323.2 772.4 4,095.6
Phase I Villages \1Well Being Ranking - Very Poor
Household Net Margin (Rs) 18.0% 436.3 267.5 703.8 3,866.5 1,668.8 5,535.3 3,430.3 1,401.3 4,831.5 Well Being Ranking - Poor
Household Net Margin (Rs) 63.0% 485.8 657.5 1,143.3 10,136.0 5,690.3 15,826.3 9,650.3 5,032.8 14,683.0 Well Being Ranking - Moderate
Household Net Margin (Rs) 19.0% 986.3 3,385.0 4,371.3 9,457.5 5,195.0 14,652.5 8,471.3 1,810.0 10,281.3 Well Being Ranking - Better Off
Household Net Margin (Rs) 0.0% 2,778.0 937.0 3,715.0 4,915.0 9,560.0 14,475.0 2,137.0 8,623.0 10,760.0 Well Being Ranking - Weighted
Household Net Margin (Rs) 100.0% 571.9 1,105.5 1,677.5 8,878.6 4,872.3 13,750.9 8,306.6 3,766.8 12,073.4
Source: Study of Impact of WIRFP on Net Incomes of Target Households, Jan 2004.WBR = GVT Household Well Being Ranking. Survey figures adjusted to Village Profile WBR.
\1 GVT - Madhya Pradesh - Phase I: Village Naganwat Choti: Weighted Household Crop Net Margin Summary.
Before / Without Project After / With Project Increment

Table AN12.2.12 GVT - Gujarat - Dahod: Village Kasotya: Weighted Household Crop Net Margin Sensitivity Analysis (Rs/Household).
Item EIRRKhalif Rabi Total Khalif Rabi Total Khalif Rabi Total
Development Activity:Crop Technology, SWC and WRD
Weighted Net Margin (Phase II)Household Net Margin (Rs) 740.8 35.4 776.2 4,064.0 807.8 4,871.8 3,323.2 772.4 4,095.6 Incremental Benefit (Phase II / Phase I) 34%
Base Case AssumptionsHousehold Net Margin (Rs) 740.8 35.4 776.2 4,064.0 807.8 4,871.8 3,323.2 772.4 4,095.6 Incremental Benefit (Phase II / Phase I) 34%Sensitivity Increase (%) 0%Development Activity 67%Overall Village 27%
Sensitivity AssumptionsHousehold Net Margin (Rs) 740.8 35.4 776.2 4,064.0 807.8 4,871.8 3,323.2 772.4 4,095.6 Incremental Benefit (Phase II / Phase I) 34%Sensitivity Increase (%) 0%Development Activity 67%Overall Village 27%
Weighted Net Margin (Phase I)Household Net Margin (Rs) 571.9 1,105.5 1,677.5 8,878.6 4,872.3 13,750.9 8,306.6 3,766.8 12,073.4
Source: Cost Benefit Analysis (CBA) Study Estimate Jan 2005.EIRR = Economic Internal Rate of Return (rate at which NPV equal to zero).
Before / Without Project After / With Project Increment

Table AN12.2.13 GVT - Gujarat - Dahod: Village Kasotya: Weighted Household Livestock Net Margin Summary (Rs/Household).
Well Being Ranking Weight(%) Herd Value Net Margin Herd Value Net Margin Herd Value Net Margin
Phase I - Well Being Ranking (WBR) \1Madhya Pradesh - WBR Weighted DataVery Poor 18.0%
Average 580 (185.0) 5,650 412.5 474 597.5 Poor 63.0%
Average 2,350 982.5 8,250 2,141.0 1,180 1,158.5 Moderate 19.0%
Average 14,700 6,730.0 1,900 2,820.0 1,900 (3,910.0)Better Off 0.0%
Average 15,580 3,000.0 14,600 10,790.0 (196) 7,790.0
Phase I - WBR Weighted Data 100.0% 4,378 1,864.4 6,576 1,958.9 1,190 94.5
Phase II - Well Being Ranking (WBR)
Very Poor 18.0%Average 5,756 149.2 10,970 1,446.4 1,043 1,297.2
Poor 63.0%Average 13,128 852.0 25,979 3,008.8 2,570 2,156.8
Moderate 19.0%Average 13,525 4,035.1 27,020 5,249.5 2,699 1,214.4
Better Off 0.0%Average 12,700 (781.7) 41,873 2,573.3 5,835 3,355.0
Phase II - WBR Weighted Data 100.0% 11,876 1,330.3 23,475 3,153.3 2,320 1,823.0
Source: Study of Impact of WIRFP on Net Incomes of Target Households, Jan 2004.WBR = GVT Household Well Being Ranking. Survey figures adjusted to Village Profile WBR.
\1 GVT - Madhya Pradesh - Phase I: Village Naganwat Choti: Weighted Household Crop Net Margin Summary.
Before / Without Project After / With Project Increment \1
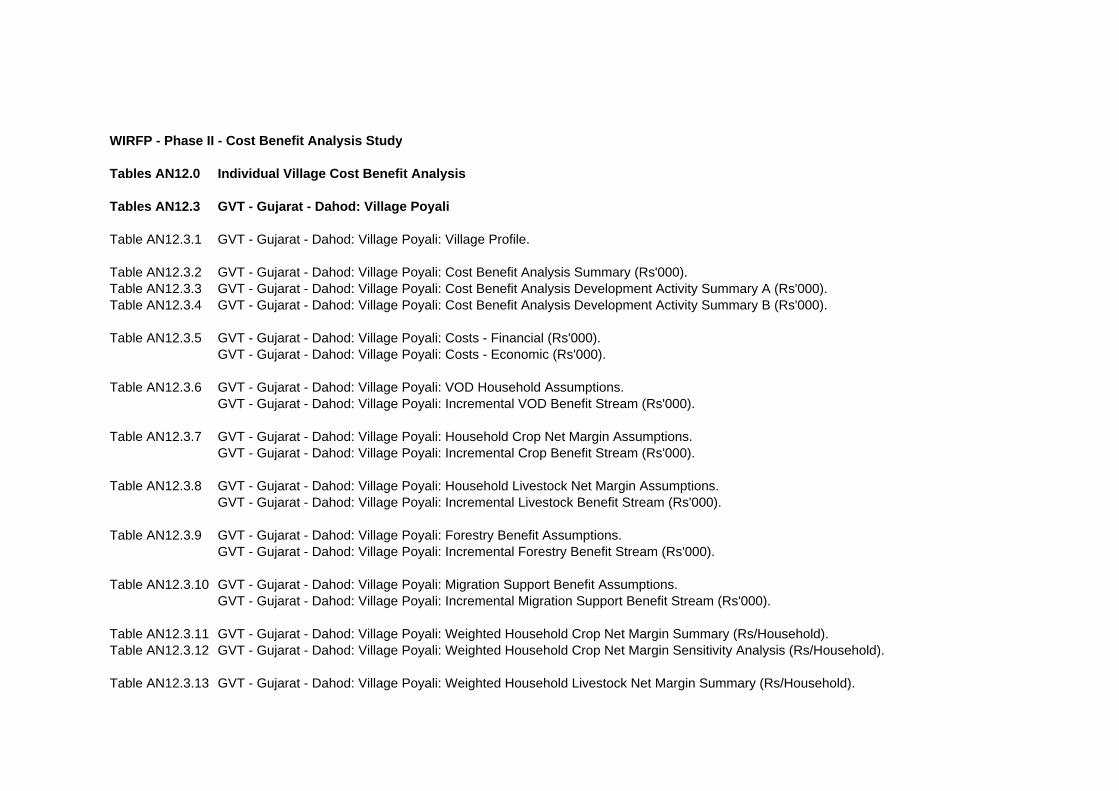
WIRFP - Phase II - Cost Benefit Analysis Study
Tables AN12.0 Individual Village Cost Benefit Analysis
Tables AN12.3 GVT - Gujarat - Dahod: Village Poyali
Table AN12.3.1 GVT - Gujarat - Dahod: Village Poyali: Village Profile.
Table AN12.3.2 GVT - Gujarat - Dahod: Village Poyali: Cost Benefit Analysis Summary (Rs'000).Table AN12.3.3 GVT - Gujarat - Dahod: Village Poyali: Cost Benefit Analysis Development Activity Summary A (Rs'000).Table AN12.3.4 GVT - Gujarat - Dahod: Village Poyali: Cost Benefit Analysis Development Activity Summary B (Rs'000).
Table AN12.3.5 GVT - Gujarat - Dahod: Village Poyali: Costs - Financial (Rs'000).GVT - Gujarat - Dahod: Village Poyali: Costs - Economic (Rs'000).
Table AN12.3.6 GVT - Gujarat - Dahod: Village Poyali: VOD Household Assumptions.GVT - Gujarat - Dahod: Village Poyali: Incremental VOD Benefit Stream (Rs'000).
Table AN12.3.7 GVT - Gujarat - Dahod: Village Poyali: Household Crop Net Margin Assumptions.GVT - Gujarat - Dahod: Village Poyali: Incremental Crop Benefit Stream (Rs'000).
Table AN12.3.8 GVT - Gujarat - Dahod: Village Poyali: Household Livestock Net Margin Assumptions.GVT - Gujarat - Dahod: Village Poyali: Incremental Livestock Benefit Stream (Rs'000).
Table AN12.3.9 GVT - Gujarat - Dahod: Village Poyali: Forestry Benefit Assumptions.GVT - Gujarat - Dahod: Village Poyali: Incremental Forestry Benefit Stream (Rs'000).
Table AN12.3.10 GVT - Gujarat - Dahod: Village Poyali: Migration Support Benefit Assumptions.GVT - Gujarat - Dahod: Village Poyali: Incremental Migration Support Benefit Stream (Rs'000).
Table AN12.3.11 GVT - Gujarat - Dahod: Village Poyali: Weighted Household Crop Net Margin Summary (Rs/Household).Table AN12.3.12 GVT - Gujarat - Dahod: Village Poyali: Weighted Household Crop Net Margin Sensitivity Analysis (Rs/Household).
Table AN12.3.13 GVT - Gujarat - Dahod: Village Poyali: Weighted Household Livestock Net Margin Summary (Rs/Household).

Table AN12.3.1 GVT - Gujarat - Dahod: Village Poyali: Village Profile.
Village Profile \1
A. Background F. Land Resource (ha)Village Name Poyali Total Area 200 District Dahod Revenue Land (unused) 38 State Gujarat Forest Area - Revenue 42
Pasture Land 8 B. Participatory Planning Process (PPP) Arable Land 112
Village entry Apr-00 200 PRA Dec-00CPA Dec-00 G. Livestock
C. InfrastructureHand Pumps (no) 11 Wells (no) 22 Linked by Road KmsElectrification YesSchool 1 - 7 H. Self Help Groups (Membership)
1 Group 1 18 D. Demographic Data 2 Group 2 16
Households (no) 115 3 Group 3 17 Participating Households 85 4 Group 4 15 Population (Adults) 750 5 Group 5 15
Adults: 6 Group 6 12 Male 390 7 Group 7 20 Female 360 8 Group 8 14 Children: 9 Group 9 16 Boys N/A 10 Group 10 14 Girls N/A 11 Group 11 -
12 Group 12 - E. Well Being Ranking (No Households) 13 Group 13 -
Very Poor 45 28.8% 14 Group 14 - Poor 40 25.6% 15 Group 15 - Moderate 48 30.8% 16 Group 16 - Better Off 23 14.7% 17 Group 17 - Total 156 100% 18 Group 18 -
19 Group 19 - Total 157
Source: GVT Dahod Coordination Office - Gujarat.\1 Subject to final adjustment following consolidation exercise prior to Annual Review Meeting (ARM) in Feb 2005.

Table AN12.3.2 GVT - Gujarat - Dahod: Village Poyali: Cost Benefit Analysis Summary (Rs'000).
Administration Cost / Development Activity EIRR \1 Year 1 Year 2 Year 3 Year 4 Year 5 Year 6 Year 7 Year 8 Year 9 Year 10(10%) (%) 1999/00 2000/01 2001/02 2002/03 2003/04 2004/05 2005/06 2006/07 2007/08 2008/09
A. Administration CostsTotal A N/A (1,503.0) 844% 35.9 454.8 335.6 294.3 302.5 488.0 354.9 35.5 35.5 35.5
B. Development Intervention Component A 1. PPGF
Net Incremental Benefits N/A (103) 58% - - (13.7) (1.6) (51.0) (52.3) (53.5) (4.2) (4.2) (4.2)
2. VODNet Incremental Benefits 39% 220 -124% - (14.6) (71.5) (23.9) 40.1 43.0 71.3 75.5 75.9 76.3
3/5.Crop Technology, SWC and WRDNet Incremental Benefits 22% 484 -272% - - (697.0) 78.1 (103.5) 28.0 186.1 306.7 306.7 306.7
6. LivestockNet Incremental Benefits 84% 605 -339% - - - (46.7) (25.9) 17.0 101.0 204.7 204.7 204.7
7. ForestryNet Incremental Benefits 30% 48 -27% - - - (0.4) (48.5) (17.3) 25.3 25.3 25.3 25.3
8. Migration SupportNet Incremental Benefits 43% 70 -39% - - - - (29.4) (7.4) (0.9) 31.1 31.1 31.1
SummaryNet Incremental Benefits 11% (178) 100% (35.9) (469.4) (1,117.7) (288.7) (520.6) (476.9) (25.7) 603.6 604.0 604.4
Sensitivity AnalysisAnalysis Period
12 Years 0% (949) 20 Years (Base Case) 11% (178) 25 Years 12% 48 30 Years 13% 176
Costs - AdministrationInvestment Costs Decreased by 20 percent 13% 122
Costs - Administration and DevelopmentRecurrent Costs Increased by 20 percent 9% (456)
Benefits - Crop, SWC and WRDCrop Benefits Increased by 20 percent. 15% 495 Livestock Benefits Increased by 20 percent. 12% 61
Source: Cost Benefit Analysis (CBA) Study Estimate Jan 2005.\1 EIRR = Economic Internal Rate of Return (rate at which NPV equal to zero).\2 NPV = Net Present Value of net incremental benefits at 12% (indicative opportunity cost of capital for rural development projects in India).
N/A = Not analysed as EIRR negative.
NPV \2

Table AN12.3.3 GVT - Gujarat - Dahod: Village Poyali: Cost Benefit Analysis Development Activity Summary A (Rs'000).
Administration Cost / Development Activity EIRR \1 Year 1 Year 2 Year 3 Year 4 Year 5 Year 6 Year 7 Year 8 Year 9 Year 10(10%) (%) 1999/00 2000/01 2001/02 2002/03 2003/04 2004/05 2005/06 2006/07 2007/08 2008/09
A. Administration CostsInvestment 35.9 454.8 335.6 294.3 302.5 488.0 354.9 - - - Recurrent - - - - - - - 35.5 35.5 35.5
Total A N/A (1,503) 844% 35.9 454.8 335.6 294.3 302.5 488.0 354.9 35.5 35.5 35.5
B. Development Intervention Component A 1. PPGF
Cost StreamInvestment - - 13.7 1.3 50.6 50.6 50.6 - - - Recurrent - - - 0.3 0.4 1.6 2.9 4.2 4.2 4.2 Total Costs - - 13.7 1.6 51.0 52.3 53.5 4.2 4.2 4.2
Benefit StreamBefore / Without Project - - - - - - - - - - After / With Project - - - - - - - - - - Incremental Benefits - - - - - - - - - -
Net Incremental Benefits N/A (103) 58% - - (13.7) (1.6) (51.0) (52.3) (53.5) (4.2) (4.2) (4.2)
2. VODCost Stream
Investment - 14.6 70.8 106.9 38.0 33.5 4.0 - - - Recurrent - - 0.7 4.3 9.6 11.5 13.2 13.4 13.4 13.4 Total Costs - 14.6 71.5 111.2 47.6 45.0 17.1 13.4 13.4 13.4
Benefit StreamBefore / Without Project - - - - - - - - - - After / With Project - - - 87.3 87.7 88.1 88.5 88.9 89.3 89.7 Incremental Benefits - - - 87.3 87.7 88.1 88.5 88.9 89.3 89.7
Net Incremental Benefits 39% 220 -124% - (14.6) (71.5) (23.9) 40.1 43.0 71.3 75.5 75.9 76.3
3/5.Crop Technology, SWC and WRDCost Stream
InvestmentCrop Tecnology - - 36.6 43.3 40.7 10.5 9.8 - - - Soil Water Conservation - - 632.5 281.8 252.6 102.7 64.5 - - - Water Resource Development - - 27.8 89.6 253.1 231.3 64.3 - - -
RecurrentCrop Tecnology - - - 0.9 2.0 3.0 3.3 3.5 3.5 3.5 Soil Water Conservation - - - 79.1 114.3 145.9 158.7 166.8 166.8 166.8 Water Resource Development - - 4.2 17.6 55.6 90.3 99.9 99.9 99.9
Total Costs - - 697.0 498.8 680.4 549.0 390.9 270.2 270.2 270.2 Benefit Stream
Before / Without Project - - - 234.9 234.9 234.9 234.9 234.9 234.9 234.9 After / With Project - - - 811.8 811.8 811.8 811.8 811.8 811.8 811.8 Incremental Benefits - - - 576.9 576.9 576.9 576.9 576.9 576.9 576.9
Net Incremental Benefits 22% 484 -272% - - (697.0) 78.1 (103.5) 28.0 186.1 306.7 306.7 306.7
Source: Cost Benefit Analysis (CBA) Study Estimate Jan 2005.\1 EIRR = Economic Internal Rate of Return (rate at which NPV equal to zero).\2 NPV = Net Present Value of net incremental benefits at 12% (indicative opportunity cost of capital for rural development projects in India).
N/A = Not analysed as EIRR negative.
NPV \2

Table AN12.3.4 GVT - Gujarat - Dahod: Village Poyali: Cost Benefit Analysis Development Activity Summary B (Rs'000).
Administration Cost / Development Activity Year 1 Year 2 Year 3 Year 4 Year 5 Year 6 Year 7 Year 8 Year 9 Year 101999/00 2000/01 2001/02 2002/03 2003/04 2004/05 2005/06 2006/07 2007/08 2008/09
6. LivestockCost Stream
Investment - - - 46.7 21.3 19.6 19.6 - - - Recurrent - - - 4.7 6.8 8.8 10.7 10.7 10.7 Total Costs - - - 46.7 25.9 26.4 28.4 10.7 10.7 10.7
Benefit StreamBefore / Without Project - - - - - 166.8 166.8 166.8 166.8 166.8 After / With Project - - - - - 210.2 296.2 382.2 382.2 382.2 Incremental Benefits - - - - - 43.4 129.4 215.4 215.4 215.4
Net Incremental Benefits 84% 605 -339% - - - (46.7) (25.9) 17.0 101.0 204.7 204.7 204.7
7. ForestryCost Stream
Investment - - - 0.4 68.3 38.5 - - - - Recurrent - - - 0.0 6.9 10.7 10.7 10.7 10.7 Total Costs - - - 0.4 68.3 45.4 10.7 10.7 10.7 10.7
Benefit StreamBefore / Without Project - - - - - - - - - - After / With Project - - - - 19.8 28.1 36.0 36.0 36.0 36.0 Incremental Benefits - - - - 19.8 28.1 36.0 36.0 36.0 36.0
Net Incremental Benefits 30% 48 -27% - - - (0.4) (48.5) (17.3) 25.3 25.3 25.3 25.3
8. Migration SupportCost Stream
Investment - - - - 52.9 35.6 35.6 - - - Recurrent - - - - 5.3 8.8 12.4 12.4 12.4 Total Costs - - - - 52.9 40.9 44.4 12.4 12.4 12.4
Benefit StreamBefore / Without Project - - - - 108.0 108.0 108.0 108.0 108.0 108.0 After / With Project - - - - 131.5 141.5 151.5 151.5 151.5 151.5 Incremental Benefits - - - - 23.5 33.5 43.5 43.5 43.5 43.5
Net Incremental Benefits 43% 70 -39% - - - - (29.4) (7.4) (0.9) 31.1 31.1 31.1
SummaryCost Stream
Investment 35.9 469.4 1,117.0 864.2 1,079.9 1,010.3 603.3 - - - Recurrent - - 0.7 88.8 148.6 236.6 296.7 357.1 357.1 357.1 Total Costs 35.9 469.4 1,117.7 953.0 1,228.5 1,246.9 900.0 357.1 357.1 357.1
Benefit StreamBefore / Without Project - - - 234.9 342.9 509.7 509.7 509.7 509.7 509.7 After / With Project - - - 899.2 1,050.8 1,279.7 1,384.0 1,470.4 1,470.8 1,471.2 Incremental Benefits - - - 664.2 707.9 770.0 874.3 960.7 961.1 961.5
Net Incremental Benefits 11% (178) 100% (35.9) (469.4) (1,117.7) (288.7) (520.6) (476.9) (25.7) 603.6 604.0 604.4
Source: Cost Benefit Analysis (CBA) Study Estimate Jan 2005.\1 EIRR = Economic Internal Rate of Return (rate at which NPV equal to zero).\2 NPV = Net Present Value of net incremental benefits at 12% (indicative opportunity cost of capital for rural development projects in India).
N/A = Not analysed as EIRR negative.

Table AN12.3.5 GVT - Gujarat - Dahod: Village Poyali: Costs - Financial (Rs'000).
Cost Head / Subhead 1999/00 2000/01 2001/02 2002/03 2003/04 2004/05 2005/06Actual Actual Actual Actual Actual Budget Budget (Rs'000) (%)
A. Administration CostsGVT Bhopal (PHQ) - 60.3 75.4 67.3 52.8 66.8 61.1 383.7 6%DFIDI 35.9 71.4 26.9 63.2 47.4 54.7 39.2 338.6 5%Dahod Coordination Office - 365.7 267.5 189.4 230.6 414.6 289.7 1,757.6 27%
Total A 35.9 497.4 369.9 319.9 330.8 536.1 390.0 2,480.0 38%
B. Development CostsComponent A 1. PPGF - - 15.2 1.4 56.2 56.2 56.2 185.4 3% 2. VOT - 16.2 78.6 118.8 42.2 37.3 4.4 297.5 5% 3. Crop Technology - - 40.7 48.1 45.3 11.7 10.9 156.6 2% 4. SWC - - 937.1 417.5 374.3 152.1 95.6 1,976.6 31% 5. WRD - - 41.2 132.7 375.0 342.7 95.3 986.9 15% 6. Livestock - - - 51.9 23.6 21.8 21.8 119.2 2% 7. Forestry - - - 0.5 75.9 42.8 - 119.1 2%
8. Migration Support - - - - 58.7 39.5 39.5 137.8 2%Subtotal - 16.2 1,112.8 770.8 1,051.2 704.1 323.7 3,978.9 62%
Other Development CostsSubtotal - - - - - - - - 0%
Total B - 16.2 1,112.8 770.8 1,051.2 704.1 323.7 3,978.9 62%
Total A + B 35.9 513.6 1,482.7 1,090.8 1,382.0 1,240.2 713.7 6,458.8 100%
GVT - 441.0 988.0 779.0 1,081.2 1,047.1 602.3 4,938.6 76%DFIDI 35.9 71.4 26.9 63.2 47.4 54.7 39.2 338.6 5%Community - 1.2 467.4 247.8 253.3 138.3 72.2 1,180.1 18%Government - 0.0 0.4 0.7 0.2 0.2 0.0 1.5 0%
Source: GVT Dahod Coordination Office - Gujarat.
DFIDI = Department for International Development (India).PPGF = Participatory Planning and Group Formation.VOD = Village Organisation and Development.SWC = Soil and Water Conservation.WRD = Water Resource Development.
Totals

Table AN12.3.5
Cost Head / Subhead
A. Administration CostsGVT Bhopal (PHQ)DFIDIDahod Coordination Office
Total A
B. Development CostsComponent A 1. PPGF 2. VOT 3. Crop Technology 4. SWC 5. WRD 6. Livestock 7. Forestry
8. Migration SupportSubtotal
Other Development CostsSubtotal
Total B
Total A + B
GVTDFIDICommunityGovernment
Source:
DFIDI = Department for International Development (India).PPGF = Participatory Planning and Group Formation.VOD = Village Organisation and Development.SWC = Soil and Water Conservation.WRD = Water Resource Development.
GVT - Gujarat - Dahod: Village Poyali: Costs - Economic (Rs'000).
1999/00 2000/01 2001/02 2002/03 2003/04 2004/05 2005/06CF SCF Actual Actual Actual Actual Actual Budget Budget (Rs'000) (%)
0.90 1.00 - 54.2 67.9 60.6 47.5 60.1 55.0 345.4 7%1.00 1.00 35.9 71.4 26.9 63.2 47.4 54.7 39.2 338.6 7%0.90 1.00 - 329.2 240.8 170.5 207.5 373.1 260.7 1,581.8 31%
35.9 454.8 335.6 294.3 302.5 488.0 354.9 2,265.8 44%
0.90 1.00 - - 13.7 1.3 50.6 50.6 50.6 166.8 3%0.90 1.00 - 14.6 70.8 106.9 38.0 33.5 4.0 267.7 5%0.90 1.00 - - 36.6 43.3 40.7 10.5 9.8 140.9 3%0.90 0.75 - - 632.5 281.8 252.6 102.7 64.5 1,334.2 26%0.90 0.75 - - 27.8 89.6 253.1 231.3 64.3 666.1 13%0.90 1.00 - - - 46.7 21.3 19.6 19.6 107.2 2%0.90 1.00 - - - 0.4 68.3 38.5 - 107.2 2%0.90 1.00 - - - - 52.9 35.6 35.6 124.0 2%
- 14.6 781.4 570.0 777.5 522.4 248.4 2,914.2 56%
0.90 1.00 - - - - - - - - 0% - 14.6 781.4 570.0 777.5 522.4 248.4 2,914.2 56%
35.9 469.4 1,117.0 864.2 1,079.9 1,010.3 603.3 5,180.0 100%
- - - - - - - N/A- - - - - - - N/A- - - - - - - N/A- - - - - - - N/A
Cost Benefit Analysis (CBA) Study Estimate Jan 2005.
TotalsConversion Factors

Table AN12.3.6 GVT - Gujarat - Dahod: Village Poyali: VOD Household Assumptions.
Without \ With Project UnitsYear 1 Year 2 Year 3(Rs) (Rs) (Rs)
Development Activity:Village Organisation and Development
Before / Without Project Situation:
A. Self Help Groups (SHGs)Assumption Sum Zero Zero Zero - - -
B. Drudgery ReductionAssumption Sum Zero Zero Zero
Total Without Project Benefits - - -
After / With Project Situation:
A. Self Help Groups (SHGs)Assumptions
Average Savings / Household Rs 950 Households / Village No 120 Present Group Savings Rs'000 114.0 114.0 117.4 120.9 Annual Savings Increase % 3%Deposits on Loan to Members % 60%SHG Interest Income % / Year 18%Assumed Benefit Rs'000 12.3 12.7 13.1
B. Drudgery ReductionAssumptions
Hours Saved / Day / Household No 1.0 Number of Days / Year / Household No 200 Days / Year / Household (8hrs/day) No 25.0 Households / Village No 120 Day Equivalent / Village No 3,000 Economic Value per Day (Rs/day) 25 Assumed Benefit Rs'000 75.0 75.0 75.0
Total With Project Benefits Rs'000 87.3 87.7 88.1
Incremental Benefits Rs'000 87.3 87.7 88.1
Source: Cost Benefit Analysis (CBA) Study Estimate Jan 2005.VOD = Village Organisation and Development.Households per village: Poyali 120
Assumptions Benefits
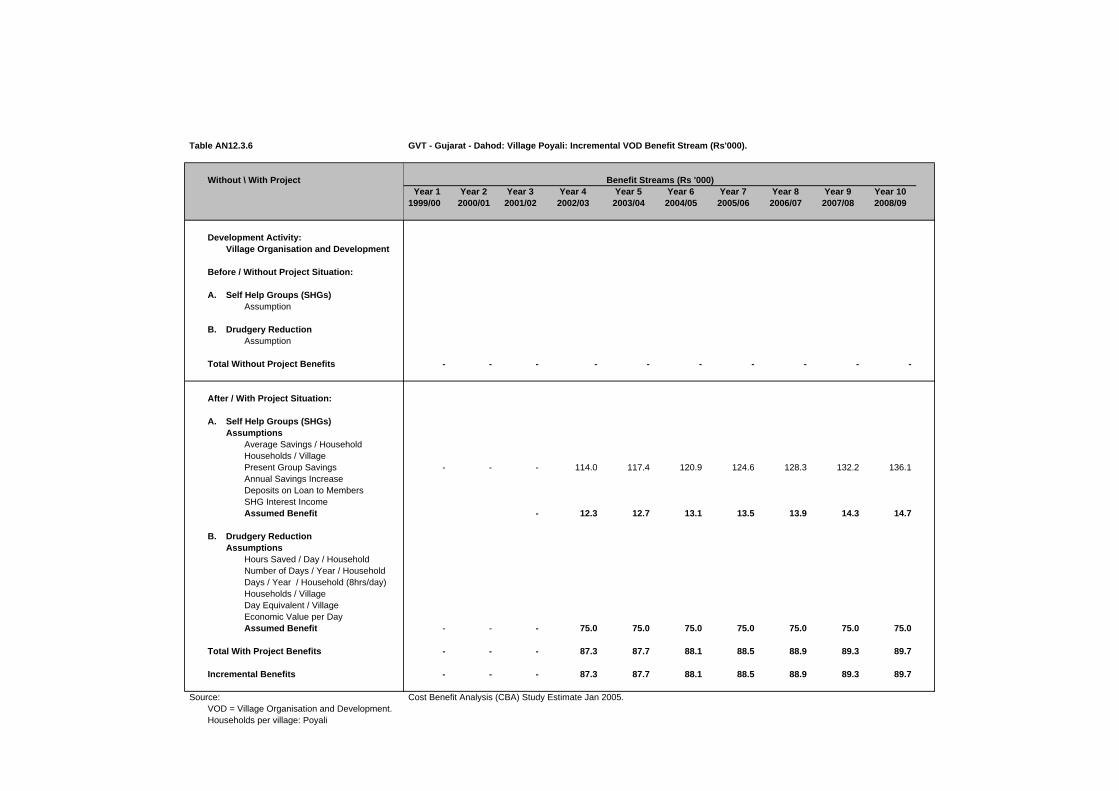
Table AN12.3.6
Without \ With Project
Development Activity:Village Organisation and Development
Before / Without Project Situation:
A. Self Help Groups (SHGs)Assumption
B. Drudgery ReductionAssumption
Total Without Project Benefits
After / With Project Situation:
A. Self Help Groups (SHGs)Assumptions
Average Savings / HouseholdHouseholds / VillagePresent Group SavingsAnnual Savings IncreaseDeposits on Loan to MembersSHG Interest Income Assumed Benefit
B. Drudgery ReductionAssumptions
Hours Saved / Day / HouseholdNumber of Days / Year / HouseholdDays / Year / Household (8hrs/day)Households / VillageDay Equivalent / VillageEconomic Value per DayAssumed Benefit
Total With Project Benefits
Incremental Benefits
Source:VOD = Village Organisation and Development.Households per village: Poyali
GVT - Gujarat - Dahod: Village Poyali: Incremental VOD Benefit Stream (Rs'000).
Year 1 Year 2 Year 3 Year 4 Year 5 Year 6 Year 7 Year 8 Year 9 Year 101999/00 2000/01 2001/02 2002/03 2003/04 2004/05 2005/06 2006/07 2007/08 2008/09
- - - - - - - - - -
- - - 114.0 117.4 120.9 124.6 128.3 132.2 136.1
- 12.3 12.7 13.1 13.5 13.9 14.3 14.7
- - - 75.0 75.0 75.0 75.0 75.0 75.0 75.0
- - - 87.3 87.7 88.1 88.5 88.9 89.3 89.7
- - - 87.3 87.7 88.1 88.5 88.9 89.3 89.7
Cost Benefit Analysis (CBA) Study Estimate Jan 2005.
Benefit Streams (Rs '000)

Table AN12.3.7 GVT - Gujarat - Dahod: Village Poyali: Household Crop Net Margin Assumptions.
Without \ With Project UnitsYear 1 Year 2 Year 3(Rs) (Rs) (Rs)
Development Activity:Crop Technology, SWC and WRD
Before / Without Project Situation:AssumptionsHouseholds (HHs) No 120 Crop Adoption Assumptions Percent 100% 100% 100%Kharif Crop Net Margin Rs/HH 1,637 1,637 1,637
Rabi Crop Net Margin 321 321 321 Total Without Project Benefits Rs/HH 1,958 1,958 1,958
After / With Project Situation:Assumptions
Households (HHs) No 120 Crop Adoption Assumptions 100% 100% 100%
Kharif Crop Net Margin Rs/HH 5,317.1 5,317.1 5,317.1
Rabi Crop Net Margin Rs/HH 1,448.3 1,448.3 1,448.3 Total With Project Benefits Rs/HH 6,765.4 6,765.4 6,765.4
Incremental Benefits Rs/HH 4,807.8 4,807.8 4,807.8
Source: Cost Benefit Analysis (CBA) Study Estimate Jan 2005.
BenefitsAssumptions

Table AN12.3.7
Without \ With Project
Development Activity:Crop Technology, SWC and WRD
Before / Without Project Situation:AssumptionsHouseholds (HHs)Crop Adoption AssumptionsKharif Crop Net Margin
Rabi Crop Net MarginTotal Without Project Benefits
After / With Project Situation:Assumptions
Households (HHs)Crop Adoption Assumptions
Kharif Crop Net Margin
Rabi Crop Net MarginTotal With Project Benefits
Incremental Benefits
Source:
GVT - Gujarat - Dahod: Village Poyali: Incremental Crop Benefit Stream (Rs'000).
Year 1 Year 2 Year 3 Year 4 Year 5 Year 6 Year 7 Year 8 Year 9 Year 101999/00 2000/01 2001/02 2002/03 2003/04 2004/05 2005/06 2006/07 2007/08 2008/09
- - - 196.4 196.4 196.4 196.4 196.4 196.4 196.4
- - - 38.5 38.5 38.5 38.5 38.5 38.5 38.5 - - - 234.9 234.9 234.9 234.9 234.9 234.9 234.9
- - - 638.1 638.1 638.1 638.1 638.1 638.1 638.1
- - - 173.8 173.8 173.8 173.8 173.8 173.8 173.8 - - - 811.8 811.8 811.8 811.8 811.8 811.8 811.8
- - - 576.9 576.9 576.9 576.9 576.9 576.9 576.9
Cost Benefit Analysis (CBA) Study Estimate Jan 2005.
Benefit Streams (Rs '000)

Table AN12.3.8 GVT - Gujarat - Dahod: Village Poyali: Household Livestock Net Margin Assumptions.
Without \ With Project UnitsLivestock Year 1 Year 2 Year 3
(Rs) (Rs) (Rs)
Development Activity:Livestock
Before / Without Project Situation:Assumptions
Households (HHs) No 120 Annual Livestock Net Margin Rs/HH
Total Without Project Benefits 1,390.0 1,390.0 1,390.0
After / With Project Situation:
Development Activity:Assumptions
Households (HHs) No 120 Adoption Assumptions Percent 55% 78% 100%
Annual Livestock Net Margin Rs/HHTotal With Project Benefits 1,751.8 2,468.4 3,185.0
Incremental Benefits Rs/HH 361.8 1,078.4 1,795.0
Source: Cost Benefit Analysis (CBA) Study Estimate Jan 2005.
BenefitsAssumptions

Table AN12.3.8
Without \ With ProjectLivestock
Development Activity:Livestock
Before / Without Project Situation:Assumptions
Households (HHs)Annual Livestock Net Margin
Total Without Project Benefits
After / With Project Situation:
Development Activity:Assumptions
Households (HHs)Adoption Assumptions
Annual Livestock Net MarginTotal With Project Benefits
Incremental Benefits
Source:
GVT - Gujarat - Dahod: Village Poyali: Incremental Livestock Benefit Stream (Rs'000).
Year 1 Year 2 Year 3 Year 4 Year 5 Year 6 Year 7 Year 8 Year 9 Year 101999/00 2000/01 2001/02 2002/03 2003/04 2004/05 2005/06 2006/07 2007/08 2008/09
- - - - - 166.8 166.8 166.8 166.8 166.8
- - - - - 210.2 296.2 382.2 382.2 382.2
- - - - - 43.4 129.4 215.4 215.4 215.4
Cost Benefit Analysis (CBA) Study Estimate Jan 2005.
Benefit Streams (Rs '000)

Table AN12.3.9 GVT - Gujarat - Dahod: Village Poyali: Forestry Benefit Assumptions.
Without \ With Project UnitsForestry Year 1 Year 2 Year 3
(Rs) (Rs) (Rs)
Development Activity:Forestry
Before / Without Project Situation:AssumptionsHouseholds (HHs) No 120 Annual Forestry Net Margin Rs/HH
Total Without Project Benefits - - -
After / With Project Situation:AssumptionsHouseholds (HHs) No 120 Adoption Assumptions Percent 55% 78% 100%Annual Forestry Net Margin Rs/HH
Total With Project Benefits 165.0 234.0 300.0
Incremental Benefits Rs/HH 165.0 234.0 300.0
Source: Cost Benefit Analysis (CBA) Study Estimate Jan 2005.
BenefitsAssumptions

Table AN12.3.9
Without \ With ProjectForestry
Development Activity:Forestry
Before / Without Project Situation:AssumptionsHouseholds (HHs)Annual Forestry Net Margin
Total Without Project Benefits
After / With Project Situation:AssumptionsHouseholds (HHs)Adoption AssumptionsAnnual Forestry Net Margin
Total With Project Benefits
Incremental Benefits
Source:
GVT - Gujarat - Dahod: Village Poyali: Incremental Forestry Benefit Stream (Rs'000).
Year 1 Year 2 Year 3 Year 4 Year 5 Year 6 Year 7 Year 8 Year 9 Year 101999/00 2000/01 2001/02 2002/03 2003/04 2004/05 2005/06 2006/07 2007/08 2008/09
- - - - - - - - - -
- - - - 19.8 28.1 36.0 36.0 36.0 36.0
- - - 19.8 28.1 36.0 36.0 36.0 36.0 36.0
Cost Benefit Analysis (CBA) Study Estimate Jan 2005.
Benefit Streams (Rs '000)
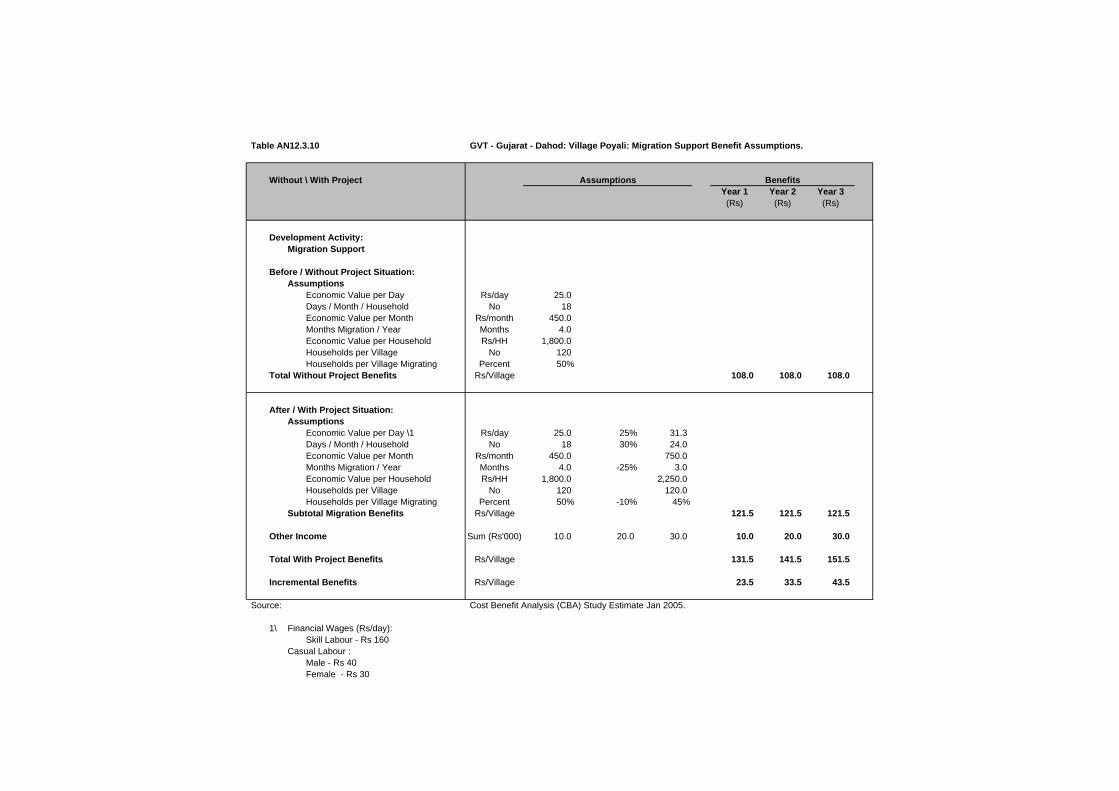
Table AN12.3.10 GVT - Gujarat - Dahod: Village Poyali: Migration Support Benefit Assumptions.
Without \ With ProjectYear 1 Year 2 Year 3(Rs) (Rs) (Rs)
Development Activity:Migration Support
Before / Without Project Situation:Assumptions
Economic Value per Day Rs/day 25.0 Days / Month / Household No 18 Economic Value per Month Rs/month 450.0 Months Migration / Year Months 4.0 Economic Value per Household Rs/HH 1,800.0 Households per Village No 120 Households per Village Migrating Percent 50%
Total Without Project Benefits Rs/Village 108.0 108.0 108.0
After / With Project Situation:Assumptions
Economic Value per Day \1 Rs/day 25.0 25% 31.3 Days / Month / Household No 18 30% 24.0 Economic Value per Month Rs/month 450.0 750.0 Months Migration / Year Months 4.0 -25% 3.0 Economic Value per Household Rs/HH 1,800.0 2,250.0 Households per Village No 120 120.0 Households per Village Migrating Percent 50% -10% 45%
Subtotal Migration Benefits Rs/Village 121.5 121.5 121.5
Other Income Sum (Rs'000) 10.0 20.0 30.0 10.0 20.0 30.0
Total With Project Benefits Rs/Village 131.5 141.5 151.5
Incremental Benefits Rs/Village 23.5 33.5 43.5
Source: Cost Benefit Analysis (CBA) Study Estimate Jan 2005.
1\ Financial Wages (Rs/day):Skill Labour - Rs 160
Casual Labour :Male - Rs 40Female - Rs 30
BenefitsAssumptions

Table AN12.3.10
Without \ With Project
Development Activity:Migration Support
Before / Without Project Situation:Assumptions
Economic Value per Day Days / Month / Household Economic Value per Month Months Migration / Year Economic Value per Household Households per Village Households per Village Migrating
Total Without Project Benefits
After / With Project Situation:Assumptions
Economic Value per Day \1Days / Month / Household Economic Value per Month Months Migration / Year Economic Value per Household Households per Village Households per Village Migrating
Subtotal Migration Benefits
Other Income
Total With Project Benefits
Incremental Benefits
Source:
1\ Financial Wages (Rs/day):Skill Labour - Rs 160
Casual Labour :Male - Rs 40Female - Rs 30
GVT - Gujarat - Dahod: Village Poyali: Incremental Migration Support Benefit Stream (Rs'000).
Year 1 Year 2 Year 3 Year 4 Year 5 Year 6 Year 7 Year 8 Year 9 Year 101999/00 2000/01 2001/02 2002/03 2003/04 2004/05 2005/06 2006/07 2007/08 2008/09
- - - - 108.0 108.0 108.0 108.0 108.0 108.0
- - - - 121.5 121.5 121.5 121.5 121.5 121.5
- - - - 10.0 20.0 30.0 30.0 30.0 30.0
- - - - 131.5 141.5 151.5 151.5 151.5 151.5
- - - - 23.5 33.5 43.5 43.5 43.5 43.5
Cost Benefit Analysis (CBA) Study Estimate Jan 2005.
Benefit Streams (Rs '000)

Table AN12.3.11 GVT - Gujarat - Dahod: Village Poyali: Weighted Household Crop Net Margin Summary (Rs/Household).
Item WBR(%) Khalif Rabi Total Khalif Rabi Total Khalif Rabi Total
Phase IIWell Being Ranking - Very Poor
Household Net Margin (Rs) 29.0% 834.6 102.5 937.1 1,849.8 1,067.8 2,917.6 1,015.2 965.3 1,980.5 Well Being Ranking - Poor
Household Net Margin (Rs) 25.0% 637.7 - 637.7 4,803.0 220.7 5,023.7 4,165.3 220.7 4,386.0 Well Being Ranking - Moderate
Household Net Margin (Rs) 31.0% 994.0 89.3 1,083.3 3,711.4 2,508.3 6,219.6 2,717.4 2,419.0 5,136.4 Well Being Ranking - Better Off
Household Net Margin (Rs) 15.0% 6,180.9 1,756.7 7,937.5 16,195.9 2,039.3 18,235.2 10,015.0 282.7 10,297.7
Well Being Ranking - WeightedHousehold Net Margin (Rs) 100.0% 1,636.7 320.9 1,957.6 5,317.1 1,448.3 6,765.4 3,680.4 1,127.4 4,807.8
Phase I \1Well Being Ranking - Very Poor
Household Net Margin (Rs) 29.0% 436.3 267.5 703.8 3,866.5 1,668.8 5,535.3 3,430.3 1,401.3 4,831.5 Well Being Ranking - Poor
Household Net Margin (Rs) 25.0% 485.8 657.5 1,143.3 10,136.0 5,690.3 15,826.3 9,650.3 5,032.8 14,683.0 Well Being Ranking - Moderate
Household Net Margin (Rs) 31.0% 986.3 3,385.0 4,371.3 9,457.5 5,195.0 14,652.5 8,471.3 1,810.0 10,281.3 Well Being Ranking - Better Off
Household Net Margin (Rs) 15.0% 2,778.0 937.0 3,715.0 4,915.0 9,560.0 14,475.0 2,137.0 8,623.0 10,760.0
Well Being Ranking - WeightedHousehold Net Margin (Rs) 100.0% 970.4 1,431.9 2,402.2 7,324.4 4,951.0 12,275.3 6,354.0 3,519.1 9,873.1
Source: Study of Impact of WIRFP on Net Incomes of Target Households, Jan 2004.WBR = GVT Household Well Being Ranking. Survey figures adjusted to Village Profile WBR.
\1 GVT - Madhya Pradesh - Phase I: Village Naganwat Choti: Weighted Household Crop Net Margin Summary.
Before / Without Project After / With Project Increment

Table AN12.3.12 GVT - Gujarat - Dahod: Village Poyali: Weighted Household Crop Net Margin Sensitivity Analysis (Rs/Household).
Item EIRRKhalif Rabi Total Khalif Rabi Total Khalif Rabi Total
Development Activity:Crop Technology, SWC and WRD
Weighted Net Margin (Phase II)Household Net Margin (Rs) 1,636.7 320.9 1,957.6 5,317.1 1,448.3 6,765.4 3,680.4 1,127.4 4,807.8 Incremental Benefit (Phase II / Phase I) 49%
Base Case AssumptionsHousehold Net Margin (Rs) 1,636.7 320.9 1,957.6 5,317.1 1,448.3 6,765.4 3,680.4 1,127.4 4,807.8 Incremental Benefit (Phase II / Phase I) 49%Sensitivity Increase (%) 0%Development Activity EIRR 22%Overall Village EIRR 11%
Sensitivity AssumptionsHousehold Net Margin (Rs) 1,636.7 320.9 1,957.6 5,582.9 1,520.7 7,103.6 3,946.2 1,199.8 5,146.0 Incremental Benefit (Phase II / Phase I) 52%Sensitivity Increase (%) 0%Development Activity EIRR 24%Overall Village EIRR 12%
Weighted Net Margin (Phase I) 970.4 1,431.9 2,402.2 7,324.4 4,951.0 12,275.3 6,354.0 3,519.1 9,873.1 Household Net Margin (Rs)
Source: Cost Benefit Analysis (CBA) Study Estimate Jan 2005.EIRR = Economic Internal Rate of Return (rate at which NPV equal to zero).
Before / Without Project After / With Project Increment

Table AN12.3.13 GVT - Gujarat - Dahod: Village Poyali: Weighted Household Livestock Net Margin Summary (Rs/Household).
Well Being Ranking Weight(%) Herd Value Net Margin Herd Value Net Margin Herd Value Net Margin
Phase I - Well Being Ranking (WBR) \1Madhya Pradesh - WBR Weighted DataVery Poor 29.0%
Average 580 (185.0) 5,650 412.5 474 597.5 Poor 25.0%
Average 2,350 982.5 8,250 2,141.0 1,180 1,158.5 Moderate 31.0%
Average 14,700 6,730.0 1,900 2,820.0 1,900 (3,910.0)Better Off 15.0%
Average 15,580 3,000.0 14,600 10,790.0 (196) 7,790.0
Phase I - WBR Weighted Data 100.0% 7,650 2,728.3 6,480 3,147.6 992 419.3
Phase II - Well Being Ranking (WBR)
Very Poor 29.0%Average 5,756 149.2 10,970 1,446.4 1,043 1,297.2
Poor 25.0%Average 13,128 852.2 25,979 3,008.8 2,570 2,156.8
Moderate 31.0%Average 13,525 4,035.1 27,020 5,249.5 2,699 1,214.4
Better Off 15.0%Average 12,700 (781.7) 41,873 2,573.3 5,835 3,355.0
Phase II - WBR Weighted Data 100.0% 11,049 1,390.0 24,333 3,185.0 2,657 1,795.1
Source: Study of Impact of WIRFP on Net Incomes of Target Households, Jan 2004.WBR = GVT Household Well Being Ranking. Survey figures adjusted to Village Profile WBR.
\1 GVT - Madhya Pradesh - Phase I: Village Naganwat Choti: Weighted Household Livestock Net Margin Summary.
Before / Without Project After / With Project Increment \1

WIRFP - Phase II - Cost Benefit Analysis Study
Table AN12.0 Individual Village Cost Benefit Analysis
Table AN12.4 GVT - Madhya Pradesh - Jhabua: Village Bagoli
Table AN12.4.1 GVT - M Pradesh - Jhabua: Village Bagoli: Village Profile.
Table AN12.4.2 GVT - M Pradesh - Jhabua: Village Bagoli: Cost Benefit Analysis Summary (Rs'000).Table AN12.4.3 GVT - M Pradesh - Jhabua: Village Bagoli: Cost Benefit Analysis Development Activity Summary A (Rs'000).Table AN12.4.4 GVT - M Pradesh - Jhabua: Village Bagoli: Cost Benefit Analysis Development Activity Summary B (Rs'000).
Table AN12.4.5 GVT - M Pradesh - Jhabua: Village Bagoli: Costs - Financial (Rs'000).GVT - M Pradesh - Jhabua: Village Bagoli: Costs - Economic (Rs'000).
Table AN12.4.6 GVT - M Pradesh - Jhabua: Village Bagoli: VOD Household Assumptions.GVT - M Pradesh - Jhabua: Village Bagoli: Incremental VOD Benefit Stream (Rs'000).
Table AN12.4.7 GVT - M Pradesh - Jhabua: Village Bagoli: Household Crop Net Margin Assumptions.GVT - M Pradesh - Jhabua: Village Bagoli: Incremental Crop Benefit Stream (Rs'000).
Table AN12.4.8 GVT - M Pradesh - Jhabua: Village Bagoli: Household Livestock Net Margin Assumptions.GVT - M Pradesh - Jhabua: Village Bagoli: Incremental Livestock Benefit Stream (Rs'000).
Table AN12.4.9 GVT - M Pradesh - Jhabua: Village Bagoli: Forestry Benefit Assumptions.GVT - M Pradesh - Jhabua: Village Bagoli: Incremental Forestry Benefit Stream (Rs'000).
Table AN12.4.10 GVT - M Pradesh - Jhabua: Village Bagoli: Migration Support Benefit Assumptions.GVT - M Pradesh - Jhabua: Village Bagoli: Incremental Migration Support Benefit Stream (Rs'000).
Table AN12.4.11 GVT - M Pradesh - Jhabua: Village Bagoli: Weighted Household Crop Net Margin Summary.Table AN12.4.12 GVT - M Pradesh - Jhabua: Village Bagoli: Weighted Household Crop Net Margin Sensitivity Analysis (Rs/Household).
Table AN12.4.13 GVT - M Pradesh - Jhabua: Village Bagoli: Weighted Household Livestock Net Margin Summary.
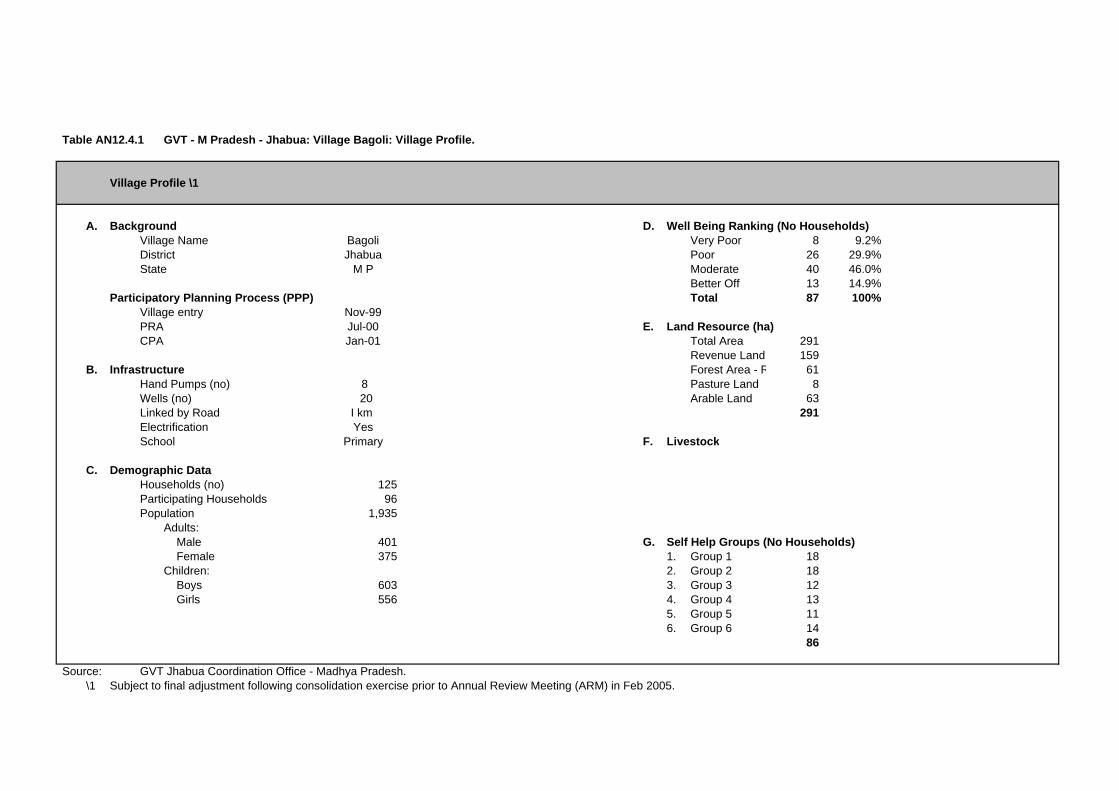
Table AN12.4.1 GVT - M Pradesh - Jhabua: Village Bagoli: Village Profile.
Village Profile \1
A. Background D. Well Being Ranking (No Households)Village Name Bagoli Very Poor 8 9.2%District Jhabua Poor 26 29.9%State M P Moderate 40 46.0%
Better Off 13 14.9%Participatory Planning Process (PPP) Total 87 100%
Village entry Nov-99PRA Jul-00 E. Land Resource (ha)CPA Jan-01 Total Area 291
Revenue Land 159 B. Infrastructure Forest Area - R 61
Hand Pumps (no) 8 Pasture Land 8 Wells (no) 20 Arable Land 63 Linked by Road I km 291 Electrification YesSchool Primary F. Livestock
C. Demographic DataHouseholds (no) 125 Participating Households 96 Population 1,935
Adults: Male 401 G. Self Help Groups (No Households) Female 375 1. Group 1 18 Children: 2. Group 2 18 Boys 603 3. Group 3 12 Girls 556 4. Group 4 13
5. Group 5 11 6. Group 6 14
86
Source: GVT Jhabua Coordination Office - Madhya Pradesh.\1 Subject to final adjustment following consolidation exercise prior to Annual Review Meeting (ARM) in Feb 2005.

Table AN12.4.2 GVT - M Pradesh - Jhabua: Village Bagoli: Cost Benefit Analysis Summary (Rs'000).
Administration Costs / Development Activities EIRR \1 Year 1 Year 2 Year 3 Year 4 Year 5 Year 6 Year 7 Year 8 Year 9 Year 10(10%) (%) 1999/00 2000/01 2001/02 2002/03 2003/04 2004/05 2005/06 2006/07 2007/08 2008/09
A. Administration CostsTotal A N/A (985) (0.9) 35.9 227.2 236.8 235.6 317.7 236.8 206.7 20.7 20.7 20.7
B. Development Intervention Component A 1. PPGF
Net Incremental Benefits N/A (46) (0.0) - (15.8) (8.3) (16.4) (6.5) (7.0) (12.1) (1.5) (1.5) (1.5)
2. VODNet Incremental Benefits 4% (103) -10% - (31.3) (42.0) (161.8) (142.2) 18.0 27.1 38.4 38.8 39.3
3/5.Crop Technology, SWC and WRDNet Incremental Benefits 9% (166) -16% - (201.4) (751.1) (118.9) (297.8) 176.1 185.3 206.9 206.9 206.9
6. LivestockNet Incremental Benefits 49% 220 21% - - (23.8) (53.6) (1.8) 57.2 70.1 72.7 72.7 72.7
7. ForestryNet Incremental Benefits 23% 34 3% - (15.0) (30.7) (5.8) 16.0 17.2 12.3 16.7 16.7 16.7
8. Migration SupportNet Incremental Benefits N/A - 0% - - - - - - - - - -
SummaryNet Incremental Benefits 3% (1,046) 100% (35.9) (490.6) (1,092.7) (592.1) (749.8) 24.7 76.0 312.5 312.9 313.3
Sensitivity AnalysisAnalysis Period
12 Years -9% (1,445)20 Years (Base Case) 3% (1,046)25 Years 6% (929)30 Years 7% (862)
Costs - AdministrationInvestment Costs Decreased by 20 percent. 5% (849)
Costs - Administration and DevelopmentRecurrent Costs Increased by 20 percent. 1% (1,327)
Benefits - Crop, SWC and WRDCrop Benefits Increased by 20 percent. 8% (520)Livestock Benefits Increased by 20 percent. 3% (1,046)
Source: Cost Benefit Analysis (CBA) Study Estimate Jan 2005.\1 EIRR = Economic Internal Rate of Return (rate at which NPV equal to zero).\2 NPV = Net Present Value of net incremental benefits at 12% (indicative opportunity cost of capital for rural development projects in India).
N/A = Not analysed as EIRR negative.
NPV \2

Table AN12.4.3 GVT - M Pradesh - Jhabua: Village Bagoli: Cost Benefit Analysis Development Activity Summary A (Rs'000).
Administration Costs / Development Activities EIRR \1 Year 1 Year 2 Year 3 Year 4 Year 5 Year 6 Year 7 Year 8 Year 9 Year 10(10%) (%) 1999/00 2000/01 2001/02 2002/03 2003/04 2004/05 2005/06 2006/07 2007/08 2008/09
A. Administration CostsInvestment 35.9 227.2 236.8 235.6 317.7 236.8 206.7 - - - Recurrent - - - - - - - 20.7 20.7 20.7
Total (A) N/A (985) -94% 35.9 227.2 236.8 235.6 317.7 236.8 206.7 20.7 20.7 20.7
B. Development Intervention Component A 1. PPGF
Cost StreamInvestment - 15.8 7.9 15.8 5.5 5.9 10.8 - - - Recurrent - - 0.4 0.6 1.0 1.1 1.3 1.5 1.5 1.5 Total Costs - 15.8 8.3 16.4 6.5 7.0 12.1 1.5 1.5 1.5
Benefit StreamBefore / Without Project - - - - - - - - - - After / With Project - - - - - - - - - - Incremental Benefits - - - - - - - - - -
Net Incremental Benefits N/A (46) -4% - (15.8) (8.3) (16.4) (6.5) (7.0) (12.1) (1.5) (1.5) (1.5)
2. VODCost Stream
Investment - 31.3 106.0 220.9 190.6 21.3 11.5 - - - Recurrent - - 1.6 6.9 17.9 27.4 28.5 29.1 29.1 29.1 Total Costs - 31.3 107.6 227.8 208.5 48.7 40.0 29.1 29.1 29.1
Benefit StreamBefore / Without Project - - - - - - - - - - After / With Project - - 65.6 66.0 66.3 66.7 67.1 67.5 67.9 68.3 Incremental Benefits - - 65.6 66.0 66.3 66.7 67.1 67.5 67.9 68.3
Net Incremental Benefits 4% (103) -10% - (31.3) (42.0) (161.8) (142.2) 18.0 27.1 38.4 38.8 39.3
3/5.Crop Technology, SWC and WRDCost Stream
InvestmentCrop Tecnology - 10.6 37.3 52.8 89.0 - 9.0 - - - Soil Water Conservation - 190.9 626.5 146.0 46.3 - - - - - Water Resource Development - - 63.2 271.7 453.8 39.1 15.1 - - -
RecurrentCrop Tecnology - - 0.3 1.2 2.5 4.7 4.7 5.0 5.0 5.0 Soil Water Conservation - - 23.9 102.2 120.4 126.2 126.2 126.2 126.2 126.2 Water Resource Development - - 9.5 50.2 118.3 124.2 126.4 126.4 126.4
Total Costs - 201.4 751.1 583.4 762.3 288.4 279.2 257.6 257.6 257.6 Benefit Stream
Before / Without Project - - - 169.0 169.0 169.0 169.0 169.0 169.0 169.0 After / With Project - - - 633.5 633.5 633.5 633.5 633.5 633.5 633.5 Incremental Benefits - - - 464.5 464.5 464.5 464.5 464.5 464.5 464.5
Net Incremental Benefits 9% (166) -16% - (201.4) (751.1) (118.9) (297.8) 176.1 185.3 206.9 206.9 206.9
Source: Cost Benefit Analysis (CBA) Study Estimate Jan 2005.\1 EIRR = Economic Internal Rate of Return (rate at which NPV equal to zero).\2 NPV = Net Present Value of net incremental benefits at 12% (indicative opportunity cost of capital for rural development projects in India).
N/A = Not analysed as EIRR negative.
NPV \2
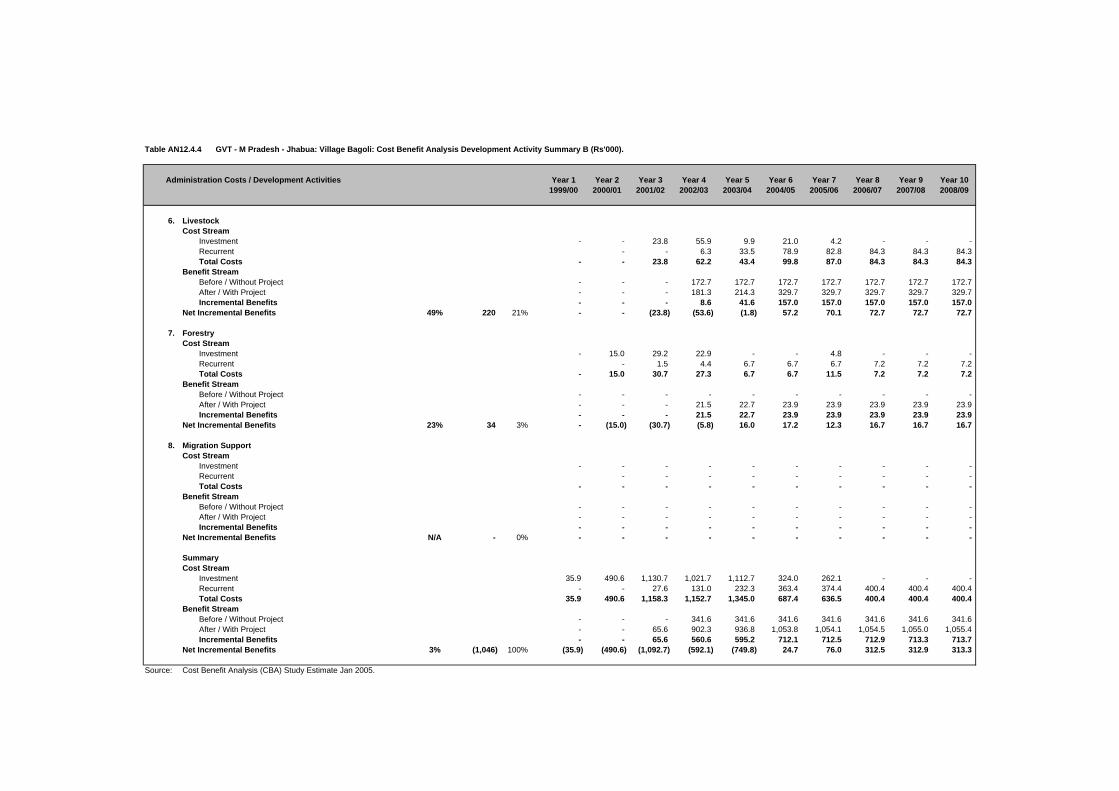
Table AN12.4.4 GVT - M Pradesh - Jhabua: Village Bagoli: Cost Benefit Analysis Development Activity Summary B (Rs'000).
Administration Costs / Development Activities Year 1 Year 2 Year 3 Year 4 Year 5 Year 6 Year 7 Year 8 Year 9 Year 101999/00 2000/01 2001/02 2002/03 2003/04 2004/05 2005/06 2006/07 2007/08 2008/09
6. LivestockCost Stream
Investment - - 23.8 55.9 9.9 21.0 4.2 - - - Recurrent - - 6.3 33.5 78.9 82.8 84.3 84.3 84.3 Total Costs - - 23.8 62.2 43.4 99.8 87.0 84.3 84.3 84.3
Benefit StreamBefore / Without Project - - - 172.7 172.7 172.7 172.7 172.7 172.7 172.7 After / With Project - - - 181.3 214.3 329.7 329.7 329.7 329.7 329.7 Incremental Benefits - - - 8.6 41.6 157.0 157.0 157.0 157.0 157.0
Net Incremental Benefits 49% 220 21% - - (23.8) (53.6) (1.8) 57.2 70.1 72.7 72.7 72.7
7. ForestryCost Stream
Investment - 15.0 29.2 22.9 - - 4.8 - - - Recurrent - 1.5 4.4 6.7 6.7 6.7 7.2 7.2 7.2 Total Costs - 15.0 30.7 27.3 6.7 6.7 11.5 7.2 7.2 7.2
Benefit StreamBefore / Without Project - - - - - - - - - - After / With Project - - - 21.5 22.7 23.9 23.9 23.9 23.9 23.9 Incremental Benefits - - - 21.5 22.7 23.9 23.9 23.9 23.9 23.9
Net Incremental Benefits 23% 34 3% - (15.0) (30.7) (5.8) 16.0 17.2 12.3 16.7 16.7 16.7
8. Migration SupportCost Stream
Investment - - - - - - - - - - Recurrent - - - - - - - - - Total Costs - - - - - - - - - -
Benefit StreamBefore / Without Project - - - - - - - - - - After / With Project - - - - - - - - - - Incremental Benefits - - - - - - - - - -
Net Incremental Benefits N/A - 0% - - - - - - - - - -
SummaryCost Stream
Investment 35.9 490.6 1,130.7 1,021.7 1,112.7 324.0 262.1 - - - Recurrent - - 27.6 131.0 232.3 363.4 374.4 400.4 400.4 400.4 Total Costs 35.9 490.6 1,158.3 1,152.7 1,345.0 687.4 636.5 400.4 400.4 400.4
Benefit StreamBefore / Without Project - - - 341.6 341.6 341.6 341.6 341.6 341.6 341.6 After / With Project - - 65.6 902.3 936.8 1,053.8 1,054.1 1,054.5 1,055.0 1,055.4 Incremental Benefits - - 65.6 560.6 595.2 712.1 712.5 712.9 713.3 713.7
Net Incremental Benefits 3% (1,046) 100% (35.9) (490.6) (1,092.7) (592.1) (749.8) 24.7 76.0 312.5 312.9 313.3
Source: Cost Benefit Analysis (CBA) Study Estimate Jan 2005.

Table AN12.4.5 GVT - M Pradesh - Jhabua: Village Bagoli: Costs - Financial (Rs'000).
Cost Head / Subhead 1999/00 2000/01 2001/02 2002/03 2003/04 2004/05 2005/06Actual Actual Actual Actual Actual Budget Budget (Rs'000) (%)
A. Administration CostsGVT Bhopal (PHQ) - 60.3 75.4 67.3 52.8 66.8 61.1 383.7 7%DFIDI Consultancy 35.9 71.4 26.9 63.2 47.4 54.7 39.2 338.6 6%Jhabua Coordination Office - 112.9 157.8 124.3 247.5 135.5 125.0 903.0 16%
Total A 35.9 244.5 260.2 254.8 347.7 257.0 225.3 1,625.4 29%
B. Development CostsComponent A 1. PPGF - 17.5 8.8 17.6 6.1 6.5 12.0 68.4 1% 2. VOD - 34.7 117.8 245.5 211.8 23.6 12.8 646.2 12% 3. Crop Technology - 11.7 41.4 58.7 98.8 - 10.0 220.7 4% 4. SWC - 282.8 928.2 216.3 68.7 - - 1,495.9 27% 5. WRD - - 93.7 402.6 672.3 57.9 22.3 1,248.8 23% 6. Livestock - - 26.4 62.1 11.0 23.3 4.6 127.4 2% 7. Forestry - 16.6 32.4 25.4 - - 5.4 79.8 1%8. Migration Support - - - - - - - - 0%
Subtotal - 363.4 1,248.6 1,028.1 1,068.6 111.3 67.2 3,887.2 71%
Other Development CostsSubtotal - - - - - - - - 0%
Total B - 363.4 1,248.6 1,028.1 1,068.6 111.3 67.2 3,887.2 71%
Total A + B 35.9 607.9 1,508.8 1,282.9 1,416.3 368.4 292.5 5,512.6 100%
GVT - 390.7 991.4 1,095.4 1,309.0 308.6 249.2 4,344.2 79%DFIDI 35.9 71.4 26.9 63.2 47.4 54.7 39.2 338.6 6%Community - 145.3 485.6 119.5 41.4 3.8 3.2 798.7 14%Government - 0.6 4.9 4.8 18.6 1.3 1.0 31.1 1%
Source: GVT Jhabua Coordination Office - Madhya Pradesh.
DFIDI = Department for International Development (India).PPGF = Participatory Planning and Group Formation.VOD = Village Organisation and Development.SWC = Soil and Water Conservation.WRD = Water Resource Development.
Totals

Table AN12.4.5
Cost Head / Subhead
A. Administration CostsGVT Bhopal (PHQ)DFIDI ConsultancyJhabua Coordination Office
Total A
B. Development CostsComponent A 1. PPGF 2. VOD 3. Crop Technology 4. SWC 5. WRD 6. Livestock 7. Forestry8. Migration Support
Subtotal
Other Development CostsSubtotal
Total B
Total A + B
GVTDFIDICommunityGovernment
Source:
DFIDI = Department for International Development (India).PPGF = Participatory Planning and Group Formation.VOD = Village Organisation and Development.SWC = Soil and Water Conservation.WRD = Water Resource Development.
GVT - M Pradesh - Jhabua: Village Bagoli: Costs - Economic (Rs'000).
1999/00 2000/01 2001/02 2002/03 2003/04 2004/05 2005/06CF SCF Actual Actual Actual Actual Actual Budget Budget (Rs'000) (%)
0.90 1.00 - 54.2 67.9 60.6 47.5 60.1 55.0 345.4 8%1.00 1.00 35.9 71.4 26.9 63.2 47.4 54.7 39.2 338.6 8%0.90 1.00 - 101.6 142.0 111.9 222.7 122.0 112.5 812.7 19%
35.9 227.2 236.8 235.6 317.7 236.8 206.7 1,496.7 34%
0.90 1.00 - 15.8 7.9 15.8 5.5 5.9 10.8 61.5 1%0.90 1.00 - 31.3 106.0 220.9 190.6 21.3 11.5 581.5 13%0.90 1.00 - 10.6 37.3 52.8 89.0 - 9.0 198.6 5%0.90 0.75 - 190.9 626.5 146.0 46.3 - - 1,009.7 23%0.90 0.75 - - 63.2 271.7 453.8 39.1 15.1 843.0 19%0.90 1.00 - - 23.8 55.9 9.9 21.0 4.2 114.7 3%0.90 1.00 - 15.0 29.2 22.9 - - 4.8 71.9 2%0.90 1.00 - - - - - - - - 0%
- 263.4 893.8 786.0 795.1 87.2 55.4 2,880.9 66%
0.90 1.00 - - - - - - - - 0% - 263.4 893.8 786.0 795.1 87.2 55.4 2,880.9 66%
35.9 490.6 1,130.7 1,021.7 1,112.7 324.0 262.1 4,377.6 100%
- - - - - - - N/A - - - - - - - N/A - - - - - - - N/A - - - - - - - N/A
Cost Benefit Analysis (CBA) Study Estimate Jan 2005.
TotalsConversion Factors

Table AN12.4.6 GVT - M Pradesh - Jhabua: Village Bagoli: VOD Household Assumptions.
Without \ With Project UnitsVillage Organisation and Development Year 1 Year 2 Year 3
(Rs) (Rs) (Rs)
Development Activity:Village Organisation and Development
Before / Without Project Situation:
A. Self Help Groups (SHGs)Assumption Sum Zero Zero Zero - - -
B. Drudgery ReductionAssumption Sum Zero Zero Zero
Total Without Project Benefits - - -
After / With Project Situation:
A. Self Help Groups (SHGs)Assumptions
Average Saving / Household Rs 1,531 Households / Village No 86 Present Group Deposits Rs'000 131.7 131.7 135.7 139.7 Annual Savings Increase % 3%Deposits on Loan to Members % 60%SHG Interest Income % / Year 15%Assumed Benefit Rs'000 11.9 12.2 12.6
B. Drudgery ReductionAssumptions
Hours Saved / Day / Household No 1.0 Number of Days / Year / Household No 200 Days / Year / Household (8hrs/day) No 25.0 Households / Village No 86 Day Equivalent / Village No 2,150 Economic Value per Day (Rs/day) 25 Assumed Benefit Rs'000 53.8 53.8 53.8
Total With Project Benefits Rs'000 65.6 66.0 66.3
Incremental Benefits Rs'000 65.6 66.0 66.3
Source: Cost Benefit Analysis (CBA) Study Estimate Jan 2005.VOD = Village Organisation and Development.Households per village: Bagoli 86
Assumptions Benefits

Table AN12.4.6
Without \ With ProjectVillage Organisation and Development
Development Activity:Village Organisation and Development
Before / Without Project Situation:
A. Self Help Groups (SHGs)Assumption
B. Drudgery ReductionAssumption
Total Without Project Benefits
After / With Project Situation:
A. Self Help Groups (SHGs)Assumptions
Average Saving / HouseholdHouseholds / VillagePresent Group DepositsAnnual Savings IncreaseDeposits on Loan to MembersSHG Interest Income Assumed Benefit
B. Drudgery ReductionAssumptions
Hours Saved / Day / HouseholdNumber of Days / Year / HouseholdDays / Year / Household (8hrs/day)Households / VillageDay Equivalent / VillageEconomic Value per DayAssumed Benefit
Total With Project Benefits
Incremental Benefits
Source:VOD = Village Organisation and Development.Households per village: Bagoli
GVT - M Pradesh - Jhabua: Village Bagoli: Incremental VOD Benefit Stream (Rs'000).
Year 1 Year 2 Year 3 Year 4 Year 5 Year 6 Year 7 Year 8 Year 9 Year 101999/00 2000/01 2001/02 2002/03 2003/04 2004/05 2005/06 2006/07 2007/08 2008/09
- - - - - - - - - -
- - 131.7 135.7 139.7 143.9 148.2 152.7 157.3 162.0
- - 11.9 12.2 12.6 13.0 13.3 13.7 14.2 14.6
- - 53.8 53.8 53.8 53.8 53.8 53.8 53.8 53.8
- - 65.6 66.0 66.3 66.7 67.1 67.5 67.9 68.3
- - 65.6 66.0 66.3 66.7 67.1 67.5 67.9 68.3
Cost Benefit Analysis (CBA) Study Estimate Jan 2005.
Benefit Streams (Rs '000)

Table AN12.4.7 GVT - M Pradesh - Jhabua: Village Bagoli: Household Crop Net Margin Assumptions.
Without \ With Project UnitsCrop Technology, SWC and WRD Year 1 Year 2 Year 3
(Rs/HH) (Rs/HH) (Rs/HH)
Development Activity:Crop Technology, SWC and WRD
Before / Without Project Situation:Assumptions
Households (HHs) No 86 Crop Adoption Assumptions 100% 100% 100%
Kharif Crop Net Margin Rs/HH 1,650.8 1,650.8 1,650.8
Rabi Crop Net Margin Rs/HH 314 313.8 313.8 Total Without Project Benefits Rs/HH 1,964.6 1,964.6 1,964.6
After / With Project Situation:Assumptions
Households (HHs) No 86 Crop Adoption Assumptions 100% 100% 100%
Kharif Crop Net Margin Rs/HH 5,744.0 5,744.0 5,744.0
Rabi Crop Net Margin Rs/HH 1,622.0 1,622.0 1,622.0 Total With Project Benefits Rs/HH 7,366.0 7,366.0 7,366.0
Incremental Benefits Rs/HH 5,401.4 5,401.4 5,401.4
Source: Cost Benefit Analysis (CBA) Study Estimate Jan 2005.
Assumptions Benefits

Table AN12.4.7
Without \ With ProjectCrop Technology, SWC and WRD
Development Activity:Crop Technology, SWC and WRD
Before / Without Project Situation:Assumptions
Households (HHs)Crop Adoption Assumptions
Kharif Crop Net Margin
Rabi Crop Net MarginTotal Without Project Benefits
After / With Project Situation:Assumptions
Households (HHs)Crop Adoption Assumptions
Kharif Crop Net Margin
Rabi Crop Net MarginTotal With Project Benefits
Incremental Benefits
Source:
GVT - M Pradesh - Jhabua: Village Bagoli: Incremental Crop Benefit Stream (Rs'000).
Year 1 Year 2 Year 3 Year 4 Year 5 Year 6 Year 7 Year 8 Year 9 Year 101999/00 2000/01 2001/02 2002/03 2003/04 2004/05 2005/06 2006/07 2007/08 2008/09
- - - 142.0 142.0 142.0 142.0 142.0 142.0 142.0
- - - 27.0 27.0 27.0 27.0 27.0 27.0 27.0 - - - 169.0 169.0 169.0 169.0 169.0 169.0 169.0
- - - 494.0 494.0 494.0 494.0 494.0 494.0 494.0
- - - 139.5 139.5 139.5 139.5 139.5 139.5 139.5 - - - 633.5 633.5 633.5 633.5 633.5 633.5 633.5
- - - 464.5 464.5 464.5 464.5 464.5 464.5 464.5
Cost Benefit Analysis (CBA) Study Estimate Jan 2005.
Benefit Streams (Rs '000)

Table AN12.4.8 GVT - M Pradesh - Jhabua: Village Bagoli: Household Livestock Net Margin Assumptions.
Without \ With Project UnitsLivestock Year 1 Year 2 Year 3
(Rs) (Rs) (Rs)
Development Activity:Livestock
Before / Without Project Situation:Assumptions
Households (HHs) No 86 Annual Livestock Net Margin Rs/HH
Total Without Project Benefits 2,008.0 2,008.0 2,008.0
After / With Project Situation:
Development Activity:Assumptions
Households (HHs) No 86 Adoption Assumptions Percent 55% 65% 100%
Annual Livestock Net Margin Rs/HHTotal With Project Benefits 2,108.5 2,491.8 3,833.6
Incremental Benefits Rs/HH 100.5 483.8 1,825.6
Source: Cost Benefit Analysis (CBA) Study Estimate Jan 2005.
Assumptions Benefits

Table AN12.4.8
Without \ With ProjectLivestock
Development Activity:Livestock
Before / Without Project Situation:Assumptions
Households (HHs)Annual Livestock Net Margin
Total Without Project Benefits
After / With Project Situation:
Development Activity:Assumptions
Households (HHs)Adoption Assumptions
Annual Livestock Net MarginTotal With Project Benefits
Incremental Benefits
Source:
GVT - M Pradesh - Jhabua: Village Bagoli: Incremental Livestock Benefit Stream (Rs'000).
Year 1 Year 2 Year 3 Year 4 Year 5 Year 6 Year 7 Year 8 Year 9 Year 101999/00 2000/01 2001/02 2002/03 2003/04 2004/05 2005/06 2006/07 2007/08 2008/09
- - - 172.7 172.7 172.7 172.7 172.7 172.7 172.7
- - - 181.3 214.3 329.7 329.7 329.7 329.7 329.7
- - - 8.6 41.6 157.0 157.0 157.0 157.0 157.0
Cost Benefit Analysis (CBA) Study Estimate Jan 2005.
Benefit Streams (Rs '000)

Table AN12.4.9 GVT - M Pradesh - Jhabua: Village Bagoli: Forestry Benefit Assumptions.
Without \ With Project UnitsForestry Year 1 Year 2 Year 3
(Rs) (Rs) (Rs)
Development Activity:Forestry
Before / Without Project Situation:AssumptionsHouseholds (HHs) No 86 Annual Forestry Net Margin Rs/HH
Total Without Project Benefits - - -
After / With Project Situation:AssumptionsHouseholds (HHs) No 86 Adoption Assumptions Percent 90% 95% 100%Annual Forestry Net Margin Rs/HH
Total With Project Benefits 250.0 263.9 277.8
Incremental Benefits Rs/HH 250.0 263.9 277.8
Source: Cost Benefit Analysis (CBA) Study Estimate Jan 2005.
Assumptions Benefits

Table AN12.4.9
Without \ With ProjectForestry
Development Activity:Forestry
Before / Without Project Situation:AssumptionsHouseholds (HHs)Annual Forestry Net Margin
Total Without Project Benefits
After / With Project Situation:AssumptionsHouseholds (HHs)Adoption AssumptionsAnnual Forestry Net Margin
Total With Project Benefits
Incremental Benefits
Source:
GVT - M Pradesh - Jhabua: Village Bagoli: Incremental Forestry Benefit Stream (Rs'000).
Year 1 Year 2 Year 3 Year 4 Year 5 Year 6 Year 7 Year 8 Year 9 Year 101999/00 2000/01 2001/02 2002/03 2003/04 2004/05 2005/06 2006/07 2007/08 2008/09
- - - - - - - - - -
- - - 21.5 22.7 23.9 23.9 23.9 23.9 23.9
- - - 21.5 22.7 23.9 23.9 23.9 23.9 23.9
Cost Benefit Analysis (CBA) Study Estimate Jan 2005.
Benefit Streams (Rs '000)

Table AN12.4.10 GVT - M Pradesh - Jhabua: Village Bagoli: Migration Support Benefit Assumptions.
Without \ With ProjectMigration Support Year 1 Year 2 Year 3
(Rs) (Rs) (Rs)
Development Activity:Migration Support
Before / Without Project Situation:Assumptions
Economic Value per Day Rs/day - Days / Month / Household No - Economic Value per Month Rs/month - Months Migration / Year Months - Economic Value per Household Rs/HH - Households per Village No 86 Households per Village Migrating Percent 0%
Total Without Project Benefits Rs/Village - - -
After / With Project Situation:Assumptions
Economic Value per Day \1 Rs/day - 60% - Days / Month / Household No - 30% - Economic Value per Month Rs/month - - Months Migration / Year Months - -20% - Economic Value per Household Rs/HH - - Households per Village No 86 80.0 Households per Village Migrating Percent 0% -20% 0%
Subtotal Migration Income Rs/Village - - -
Other Income Sum (Rs) - - - - - -
Total With Project Benefits Rs/Village - - -
Incremental Benefits Rs/Village - - -
Source: Cost Benefit Analysis (CBA) Study Estimate Jan 2005.
1\ Financial Wages (Rs/day):Skill Labour - Rs 160
Casual Labour :Male - Rs 40Female - Rs 30
Assumptions Benefits

Table AN12.4.10
Without \ With ProjectMigration Support
Development Activity:Migration Support
Before / Without Project Situation:Assumptions
Economic Value per Day Days / Month / Household Economic Value per Month Months Migration / Year Economic Value per Household Households per Village Households per Village Migrating
Total Without Project Benefits
After / With Project Situation:Assumptions
Economic Value per Day \1Days / Month / Household Economic Value per Month Months Migration / Year Economic Value per Household Households per Village Households per Village Migrating
Subtotal Migration Income
Other Income
Total With Project Benefits
Incremental Benefits
Source:
1\ Financial Wages (Rs/day):Skill Labour - Rs 160
Casual Labour :Male - Rs 40Female - Rs 30
GVT - M Pradesh - Jhabua: Village Bagoli: Incremental Migration Support Benefit Stream (Rs'000).
Year 1 Year 2 Year 3 Year 4 Year 5 Year 6 Year 7 Year 8 Year 9 Year 101999/00 2000/01 2001/02 2002/03 2003/04 2004/05 2005/06 2006/07 2007/08 2008/09
- - - - - - - - - -
- - - - - - - - - -
- - - - - - - - - -
- - - - - - - - - -
- - - - - - - - - -
Cost Benefit Analysis (CBA) Study Estimate Jan 2005.
Benefit Streams (Rs '000)

Table AN12.4.11 GVT - M Pradesh - Jhabua: Village Bagoli: Weighted Household Crop Net Margin Summary.
Item WBR(%) Khalif Rabi Total Khalif Rabi Total Khalif Rabi Total
Phase IIWell Being Ranking - Very Poor
Household Net Margin (Rs) 9.0% 834.6 102.5 937.1 1,849.8 1,067.8 2,917.6 1,015.2 965.3 1,980.5 Well Being Ranking - Poor
Household Net Margin (Rs) 30.0% 637.7 - 637.7 4,803.0 220.7 5,023.7 4,165.3 220.7 4,386.0 Well Being Ranking - Moderate
Household Net Margin (Rs) 46.0% 994.0 89.3 1,083.3 3,711.4 2,508.3 6,219.6 2,717.4 2,419.0 5,136.4 Well Being Ranking - Better Off
Household Net Margin (Rs) 15.0% 6,180.9 1,756.7 7,937.5 16,195.9 2,039.3 18,235.2 10,015.0 282.7 10,297.7
Well Being Ranking - WeightedHousehold Net Margin (Rs) 100.0% 1,650.8 313.8 1,964.6 5,744.0 1,622.0 7,366.0 4,093.2 1,308.2 5,401.4
Phase I \1Well Being Ranking - Very Poor
Household Net Margin (Rs) 9.0% 436.3 267.5 703.8 3,866.5 1,668.8 5,535.3 3,430.3 1,401.3 4,831.5 Well Being Ranking - Poor
Household Net Margin (Rs) 30.0% 485.8 657.5 1,143.3 10,136.0 5,690.3 15,826.3 9,650.3 5,032.8 14,683.0 Well Being Ranking - Moderate
Household Net Margin (Rs) 46.0% 986.3 3,385.0 4,371.3 9,457.5 5,195.0 14,652.5 8,471.3 1,810.0 10,281.3 Well Being Ranking - Better Off
Household Net Margin (Rs) 15.0% 2,778.0 937.0 3,715.0 4,915.0 9,560.0 14,475.0 2,137.0 8,623.0 10,760.0
Well Being Ranking - WeightedHousehold Net Margin (Rs) 100.0% 1,055.4 1,919.0 2,974.3 8,476.5 5,681.0 14,157.4 7,421.1 3,762.0 11,183.1
Source: Study of Impact of WIRFP on Net Incomes of Target Households, Jan 2004.WBR = GVT Household Well Being Ranking. Survey figures adjusted to Village Profile WBR.\1 GVT - Madhya Pradesh - Phase I: Village Naganwat Choti: Weighted Household Crop Net Margin Summary.
Before / Without Project After / With Project Increment

Table AN12.4.12 GVT - M Pradesh - Jhabua: Village Bagoli: Weighted Household Crop Net Margin Sensitivity Analysis (Rs/Household).
Item EIRRKhalif Rabi Total Khalif Rabi Total Khalif Rabi Total
Development Activity:Crop Technology, SWC and WRD
Weighted Net Margin (Phase II)Household Net Margin (Rs) 1,650.8 313.8 1,964.6 5,744.0 1,622.0 7,366.0 4,093.2 1,308.2 5,401.4 Incremental Benefit (Phase II / Phase I) 48%
Base Case AssumptionsHousehold Net Margin (Rs) 1,650.8 313.8 1,964.6 5,744.0 1,622.0 7,366.0 4,093.2 1,308.2 5,401.4 Incremental Benefit (Phase II / Phase I) 48%Sensitivity Increase (%) 0%Development Activity 9%Overall Village 3%
Sensitivity AssumptionsHousehold Net Margin (Rs) 1,650.8 313.8 1,964.6 8,041.6 2,270.8 10,312.4 6,390.8 1,957.0 8,347.8 Incremental Benefit (Phase II / Phase I) 75%Sensitivity Increase (%) 0%Development Activity 23%Overall Village 12%
Weighted Net Margin (Phase I) 1,055.4 1,919.0 2,974.3 8,476.5 5,681.0 14,157.4 7,421.1 3,762.0 11,183.1 Household Net Margin (Rs)
Source: Study of Impact of WIRFP on Net Incomes of Target Households, Jan 2004.EIRR = Economic Internal Rate of Return (rate at which NPV equal to zero).
Before / Without Project After / With Project Increment
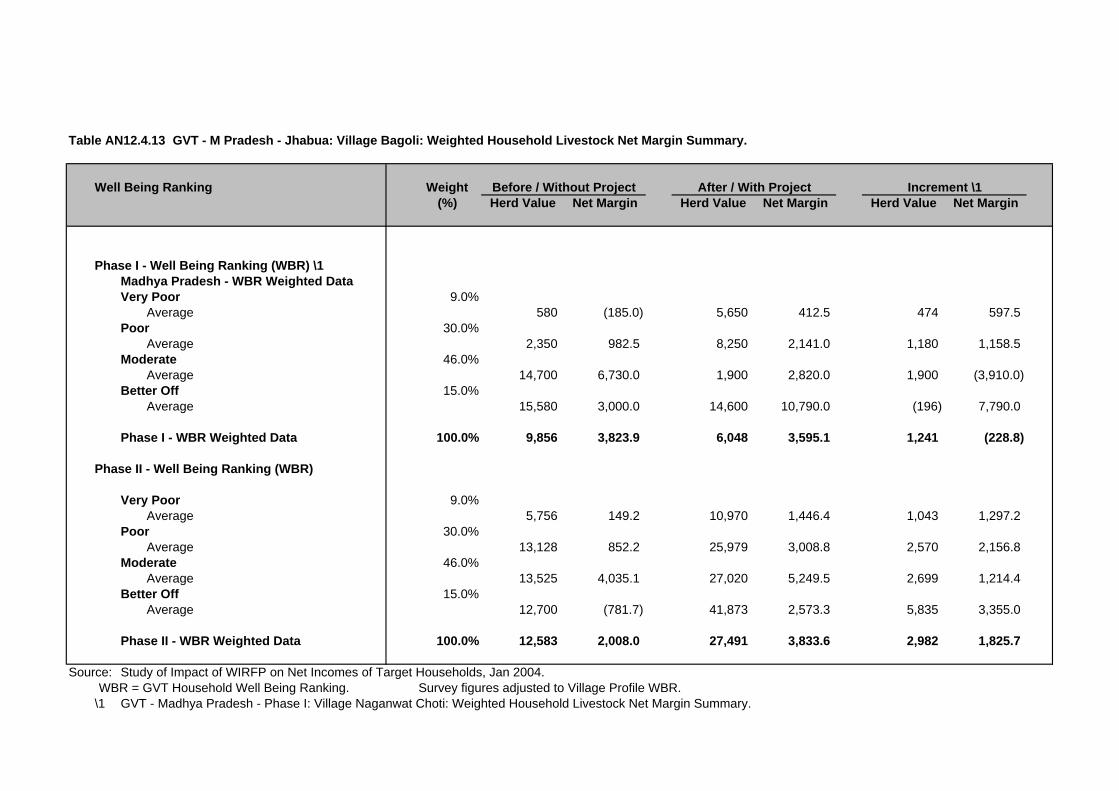
Table AN12.4.13 GVT - M Pradesh - Jhabua: Village Bagoli: Weighted Household Livestock Net Margin Summary.
Well Being Ranking Weight(%) Herd Value Net Margin Herd Value Net Margin Herd Value Net Margin
Phase I - Well Being Ranking (WBR) \1Madhya Pradesh - WBR Weighted DataVery Poor 9.0%
Average 580 (185.0) 5,650 412.5 474 597.5 Poor 30.0%
Average 2,350 982.5 8,250 2,141.0 1,180 1,158.5 Moderate 46.0%
Average 14,700 6,730.0 1,900 2,820.0 1,900 (3,910.0)Better Off 15.0%
Average 15,580 3,000.0 14,600 10,790.0 (196) 7,790.0
Phase I - WBR Weighted Data 100.0% 9,856 3,823.9 6,048 3,595.1 1,241 (228.8)
Phase II - Well Being Ranking (WBR)
Very Poor 9.0%Average 5,756 149.2 10,970 1,446.4 1,043 1,297.2
Poor 30.0%Average 13,128 852.2 25,979 3,008.8 2,570 2,156.8
Moderate 46.0%Average 13,525 4,035.1 27,020 5,249.5 2,699 1,214.4
Better Off 15.0%Average 12,700 (781.7) 41,873 2,573.3 5,835 3,355.0
Phase II - WBR Weighted Data 100.0% 12,583 2,008.0 27,491 3,833.6 2,982 1,825.7
Source: Study of Impact of WIRFP on Net Incomes of Target Households, Jan 2004.WBR = GVT Household Well Being Ranking. Survey figures adjusted to Village Profile WBR.
\1 GVT - Madhya Pradesh - Phase I: Village Naganwat Choti: Weighted Household Livestock Net Margin Summary.
Before / Without Project After / With Project Increment \1
WIRFP - Phase II - Cost Benefit Analysis Study
Tables AN12.0 Individual Village Cost Benefit Analysis
Tables AN12.5 GVT Madhya Pradesh - Jhabua: Village Borwa
Table AN12.5.1 GVT - M Pradesh - Jhabua: Village Borwa: Village Profile.
Table AN12.5.2 GVT - M Pradesh - Jhabua: Village Borwa: Cost Benefit Analysis Summary (Rs'000).Table AN12.5.3 GVT - M Pradesh - Jhabua: Village Borwa: Cost Benefit Analysis Development Activity Summary A (Rs'000).Table AN12.5.4 GVT - M Pradesh - Jhabua: Village Borwa: Cost Benefit Analysis Development Activity Summary B (Rs'000).
Table AN12.5.5 GVT - M Pradesh - Jhabua: Village Borwa: Costs - Financial (Rs'000).GVT - M Pradesh - Jhabua: Village Borwa: Costs - Economic (Rs'000).
Table AN12.5.6 GVT - M Pradesh - Jhabua: Village Borwa: VOD Household Assumptions.GVT - M Pradesh - Jhabua: Village Borwa: Incremental VOD Benefit Stream (Rs'000).
Table AN12.5.7 GVT - M Pradesh - Jhabua: Village Borwa: Household Crop Net Margin Assumptions.GVT - M Pradesh - Jhabua: Village Borwa: Incremental Crop Benefit Stream (Rs'000).
Table AN12.5.8 GVT - M Pradesh - Jhabua: Village Borwa: Household Livestock Net Margin Assumptions.GVT - M Pradesh - Jhabua: Village Borwa: Incremental Livestock Benefit Stream (Rs'000).
Table AN12.5.9 GVT - M Pradesh - Jhabua: Village Borwa: Forestry Benefit Assumptions.GVT - M Pradesh - Jhabua: Village Borwa: Incremental Forestry Benefit Stream (Rs'000).
Table AN12.5.10 GVT - M Pradesh - Jhabua: Village Borwa: Migration Support Benefit Assumptions.GVT - M Pradesh - Jhabua: Village Borwa: Incremental Migration Support Benefit Stream (Rs'000).
Table AN12.5.11 GVT - M Pradesh - Jhabua: Village Borwa: Weighted Household Crop Net Margin Summary (Rs/Household).Table AN12.5.12 GVT - M Pradesh - Jhabua: Village Borwa: Weighted Household Crop Net Margin Sensitivity Analysis (Rs/Household).
Table AN12.5.13 GVT - M Pradesh - Jhabua: Village Borwa: Weighted Household Livestock Net Margin Summary (Rs/Household).

Table AN12.5.1 GVT - M Pradesh - Jhabua: Village Borwa: Village Profile.
Village Profile \1
A. Background E. Well Being Ranking (No Households)Village Name Borwa Very Poor 3 7.7%District Jhabua Poor 12 30.8%State M Pradesh Moderate 11 28.2%
Better Off 13 33.3%B. Participatory Planning Process (PPP) Total 39 100%
Village entry Jan-01PRA Feb-01 F. Land Resource (ha)CPA Jan-01 Total Area 290
Revenue Land (unused) 151 C. Infrastructure Forest Area - Revenue -
Hand Pumps (no) 5 Pasture Land 12 Wells (no) 33 Arable Land 127 Linked by Road 5 km 290 Electrification YesSchool Primary G. Livestock
D. Demographic DataHouseholds (no) 109 Participating Households 39 Population (Adults) 470
Adults: Male 270 H. Self Help Groups (No Households) Female 200 1. Group 1 15 Children: 2. Group 2 5 Boys 225 3. Group 3 10 Girls 212 4. Group 4 -
5. Group 5 - 6. Group 6 -
30
Source: Cost Benefit Analysis (CBA) Study Estimate Jan 2005.\1 Subject to final adjustment following consolidation exercise prior to Annual Review Meeting (ARM) in Feb 2005.

Table AN12.5.2 GVT - M Pradesh - Jhabua: Village Borwa: Cost Benefit Analysis Summary (Rs'000).
Administration Costs / Development Activities EIRR \1 Year 1 Year 2 Year 3 Year 4 Year 5 Year 6 Year 7 Year 8 Year 9 Year 10(10%) (%) 1999/00 2000/01 2001/02 2002/03 2003/04 2004/05 2005/06 2006/07 2007/08 2008/09
A. Administration CostsTotal A N/A (985) 191% 35.9 227.2 236.8 235.6 317.7 236.8 206.7 20.7 20.7 20.7
B. Development Intervention Component A 1. PPGF
Net Incremental Benefits N/A (40) 8% - - (8.6) (21.4) (12.0) (6.9) (12.0) (1.4) (1.4) (1.4)
2. VODNet Incremental Benefits 8% (13) 3% - - 16.2 (33.4) (48.5) (13.4) (20.6) 13.9 13.9 13.9
3/5.Crop Technology, SWC and WRDNet Incremental Benefits 34% 334 -65% - - (33.4) (100.4) (109.8) 156.6 (131.8) 159.7 159.7 159.7
6. LivestockNet Incremental Benefits 75% 152 -29% - - - (13.5) (11.4) 14.0 11.8 53.1 53.1 53.1
7. ForestryNet Incremental Benefits 21% 8 -2% - - - (4.5) (12.9) 6.1 (9.5) 6.7 6.7 6.7
8. Migration SupportNet Incremental Benefits 122% 28 -5% - - - - - - (9.0) 11.0 11.0 11.0
SummaryNet Incremental Benefits 5% (516) 7% (35.9) (227.2) (262.6) (408.9) (512.2) (80.4) (377.7) 222.3 222.3 222.4
Sensitivity AnalysisAnalysis Period
12 Years 5% (800)20 Years (Base Case) 5% (516)25 Years 7% (433)30 Years 8% (386)
Costs - AdministrationInvestment Costs Decreased by 20 percent 7% (319)
Costs - Administration and DevelopmentRecurrent Costs 3% (586)
Benefits - Crop, SWC and WRDCrop Benefits Increased by 20 percent 9% (250)Livestock Benefits Increased by 20 percent 6% (440)
Source: Cost Benefit Analysis (CBA) Study Estimate Jan 2005.\1 EIRR = Economic Internal Rate of Return (rate at which NPV equal to zero).\2 NPV = Net Present Value of net incremental benefits at 12% (indicative opportunity cost of capital for rural development projects in India).
N/A = Not analysed as EIRR negative.
NPV \2
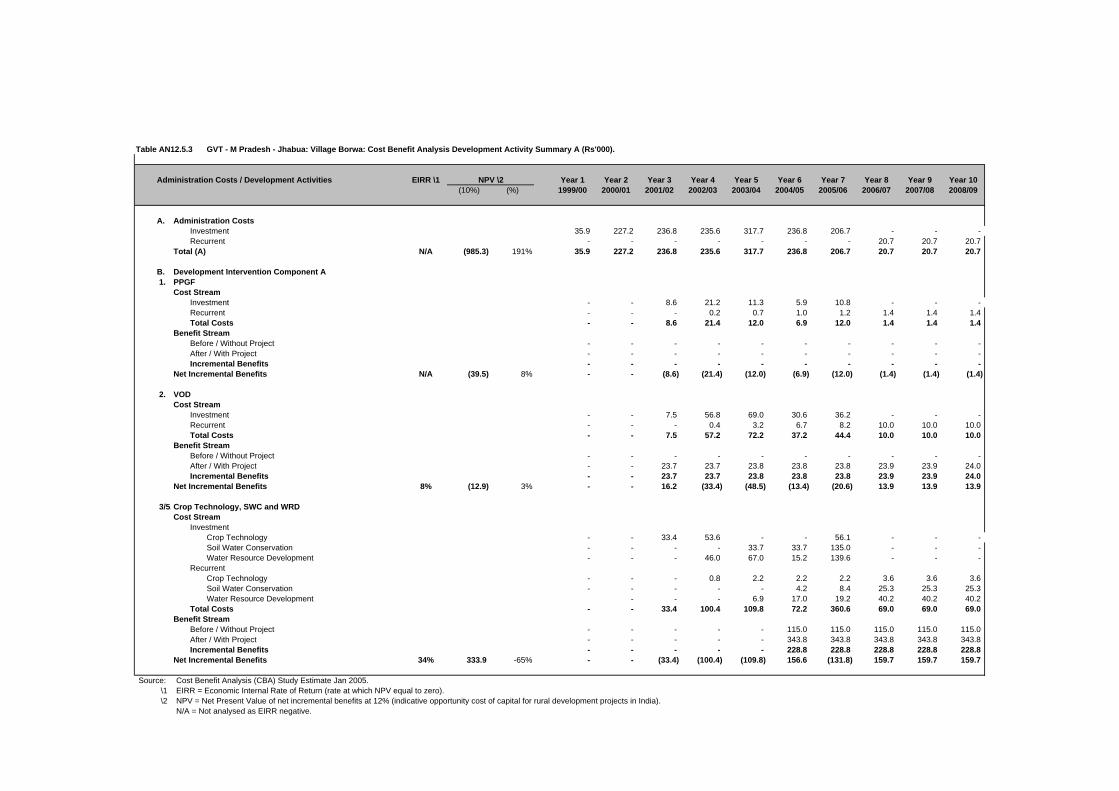
Table AN12.5.3 GVT - M Pradesh - Jhabua: Village Borwa: Cost Benefit Analysis Development Activity Summary A (Rs'000).
Administration Costs / Development Activities EIRR \1 Year 1 Year 2 Year 3 Year 4 Year 5 Year 6 Year 7 Year 8 Year 9 Year 10(10%) (%) 1999/00 2000/01 2001/02 2002/03 2003/04 2004/05 2005/06 2006/07 2007/08 2008/09
A. Administration CostsInvestment 35.9 227.2 236.8 235.6 317.7 236.8 206.7 - - - Recurrent - - - - - - - 20.7 20.7 20.7
Total (A) N/A (985.3) 191% 35.9 227.2 236.8 235.6 317.7 236.8 206.7 20.7 20.7 20.7
B. Development Intervention Component A 1. PPGF
Cost StreamInvestment - - 8.6 21.2 11.3 5.9 10.8 - - - Recurrent - - - 0.2 0.7 1.0 1.2 1.4 1.4 1.4 Total Costs - - 8.6 21.4 12.0 6.9 12.0 1.4 1.4 1.4
Benefit StreamBefore / Without Project - - - - - - - - - - After / With Project - - - - - - - - - - Incremental Benefits - - - - - - - - - -
Net Incremental Benefits N/A (39.5) 8% - - (8.6) (21.4) (12.0) (6.9) (12.0) (1.4) (1.4) (1.4)
2. VODCost Stream
Investment - - 7.5 56.8 69.0 30.6 36.2 - - - Recurrent - - - 0.4 3.2 6.7 8.2 10.0 10.0 10.0 Total Costs - - 7.5 57.2 72.2 37.2 44.4 10.0 10.0 10.0
Benefit StreamBefore / Without Project - - - - - - - - - - After / With Project - - 23.7 23.7 23.8 23.8 23.8 23.9 23.9 24.0 Incremental Benefits - - 23.7 23.7 23.8 23.8 23.8 23.9 23.9 24.0
Net Incremental Benefits 8% (12.9) 3% - - 16.2 (33.4) (48.5) (13.4) (20.6) 13.9 13.9 13.9
3/5.Crop Technology, SWC and WRDCost Stream
InvestmentCrop Technology - - 33.4 53.6 - - 56.1 - - - Soil Water Conservation - - - - 33.7 33.7 135.0 - - - Water Resource Development - - - 46.0 67.0 15.2 139.6 - - -
RecurrentCrop Technology - - - 0.8 2.2 2.2 2.2 3.6 3.6 3.6 Soil Water Conservation - - - - - 4.2 8.4 25.3 25.3 25.3 Water Resource Development - - - 6.9 17.0 19.2 40.2 40.2 40.2
Total Costs - - 33.4 100.4 109.8 72.2 360.6 69.0 69.0 69.0 Benefit Stream
Before / Without Project - - - - - 115.0 115.0 115.0 115.0 115.0 After / With Project - - - - - 343.8 343.8 343.8 343.8 343.8 Incremental Benefits - - - - - 228.8 228.8 228.8 228.8 228.8
Net Incremental Benefits 34% 333.9 -65% - - (33.4) (100.4) (109.8) 156.6 (131.8) 159.7 159.7 159.7
Source: Cost Benefit Analysis (CBA) Study Estimate Jan 2005.\1 EIRR = Economic Internal Rate of Return (rate at which NPV equal to zero).\2 NPV = Net Present Value of net incremental benefits at 12% (indicative opportunity cost of capital for rural development projects in India).
N/A = Not analysed as EIRR negative.
NPV \2

Table AN12.5.4 GVT - M Pradesh - Jhabua: Village Borwa: Cost Benefit Analysis Development Activity Summary B (Rs'000).
Administration Costs / Development Activities EIRR \1 Year 1 Year 2 Year 3 Year 4 Year 5 Year 6 Year 7 Year 8 Year 9 Year 10(10%) (%) 1999/00 2000/01 2001/02 2002/03 2003/04 2004/05 2005/06 2006/07 2007/08 2008/09
6. LivestockCost Stream
Investment - - - 13.5 6.8 - 28.0 - - - Recurrent - - - 4.6 11.3 12.8 26.8 26.8 26.8 Total Costs - - - 13.5 11.4 11.3 40.8 26.8 26.8 26.8
Benefit StreamBefore / Without Project - - - - - 41.3 41.3 41.3 41.3 41.3 After / With Project - - - - - 66.7 94.0 121.2 121.2 121.2 Incremental Benefits - - - - - 25.3 52.6 79.9 79.9 79.9
Net Incremental Benefits 75% 151.8 -29% - - - (13.5) (11.4) 14.0 11.8 53.1 53.1 53.1
7. ForestryCost Stream
Investment - - - 4.5 18.3 - 18.0 - - - Recurrent - - - 0.5 2.3 2.3 4.1 4.1 4.1 Total Costs - - - 4.5 18.8 2.3 20.3 4.1 4.1 4.1
Benefit StreamBefore / Without Project - - - - - - - - - - After / With Project - - - - 5.9 8.4 10.8 10.8 10.8 10.8 Incremental Benefits - - - - 5.9 8.4 10.8 10.8 10.8 10.8
Net Incremental Benefits 21% 8.2 -2% - - - (4.5) (12.9) 6.1 (9.5) 6.7 6.7 6.7
8. Migration SupportCost Stream
Investment - - - - - - 9.0 - - - Recurrent - - - - - - 0.9 0.9 0.9 Total Costs - - - - - - 9.0 0.9 0.9 0.9
Benefit StreamBefore / Without Project - - - - - - - 8.3 8.3 8.3 After / With Project - - - - - - - 20.2 20.2 20.2 Incremental Benefits - - - - - - - 11.9 11.9 11.9
Net Incremental Benefits 122% 27.9 -5% - - - - - - (9.0) 11.0 11.0 11.0
SummaryCost Stream
Investment 35.9 227.2 286.3 431.2 523.8 322.1 639.4 - - - Recurrent - - - 1.4 18.1 44.6 54.3 132.9 132.9 132.9 Total Costs 35.9 227.2 286.3 432.6 541.9 366.7 693.7 132.9 132.9 132.9
Benefit StreamBefore / Without Project - - - - - 156.4 156.4 164.7 164.7 164.7 After / With Project - - 23.7 23.7 29.7 442.7 472.4 519.9 519.9 520.0 Incremental Benefits - - 23.7 23.7 29.7 286.3 316.0 355.2 355.3 355.3
Net Incremental Benefits 5% (516.0) 100% (35.9) (227.2) (262.6) (408.9) (512.2) (80.4) (377.7) 222.3 222.3 222.4
Source: Cost Benefit Analysis (CBA) Study Estimate Jan 2005.
NPV \2

Table AN12.5.5 GVT - M Pradesh - Jhabua: Village Borwa: Costs - Financial (Rs'000).
Cost Head / Subhead 1999/00 2000/01 2001/02 2002/03 2003/04 2004/05 2005/06Actual Actual Actual Actual Actual Budget Budget (Rs'000) (%)
A. Administration CostsGVT Bhopal (PHQ) - 60.3 75.4 67.3 52.8 66.8 61.1 383.7 13%DFIDI Consultancy 35.9 71.4 26.9 63.2 47.4 54.7 39.2 338.6 12%Jhabua Coordination Office - 112.9 157.8 124.3 247.5 135.5 125.0 903.0 31%
Total A 35.9 244.5 260.2 254.8 347.7 257.0 225.3 1,625.4 57%
B. Development Costs 80% 60%Component A 1. PPGF - - - - 9.5 - 23.5 - 12.5 6.5 12.0 64.0 2% 2. VOD - - - - 8.4 - 63.1 - 76.7 34.0 40.2 222.4 8% 3. Crop Technology - - - - 37.1 - 59.6 - - - 62.4 159.0 6% 4. SWC - - - - - - - - 49.9 49.9 200.0 299.8 10% 5. WRD - - - - - - 68.1 - 99.3 22.5 206.8 396.8 14% 6. Livestock - - - - - - 15.0 - 7.5 - 31.1 53.6 2% 7. Forestry - - - - - - 5.0 - 20.4 - 20.0 45.4 2%8. Migration Support - - - - - - - - - - 10.0 10.0 0%
Subtotal - - 54.9 234.3 266.3 112.9 582.5 1,250.9 43%
Other Development CostsSubtotal - - - - - - - -
Total B - - 54.9 234.3 266.3 112.9 582.5 1,250.9 43%
Total A + B 35.9 244.5 315.1 489.1 614.0 369.9 807.8 2,876.3 100%
GVT - 173.1 280.2 413.3 561.1 311.7 758.2 2,497.7 87%DFIDI 35.9 71.4 26.9 63.2 47.4 54.7 39.2 338.6 12%Community - - 6.9 11.2 4.7 2.5 9.7 34.9 1%Government - - 1.0 1.4 0.8 1.0 0.8 5.0 0%
Source: Cost Benefit Analysis (CBA) Study Estimate Jan 2005.
DFIDI = Department for International Development (India).PPGF = Participatory Planning and Group Formation.VOD = Village Organisation and Development.SWC = Soil and Water Conservation.WRD = Water Resource Development.
Totals

Table AN12.5.5
Cost Head / Subhead
A. Administration CostsGVT Bhopal (PHQ)DFIDI ConsultancyJhabua Coordination Office
Total A
B. Development CostsComponent A 1. PPGF 2. VOD 3. Crop Technology 4. SWC 5. WRD 6. Livestock 7. Forestry8. Migration Support
Subtotal
Other Development CostsSubtotal
Total B
Total A + B
GVTDFIDICommunityGovernment
Source:
DFIDI = Department for International Development (India).PPGF = Participatory Planning and Group Formation.VOD = Village Organisation and Development.SWC = Soil and Water Conservation.WRD = Water Resource Development.
GVT - M Pradesh - Jhabua: Village Borwa: Costs - Economic (Rs'000).
1999/00 2000/01 2001/02 2002/03 2003/04 2004/05 2005/06CF SCF Actual Actual Actual Actual Actual Budget Budget (Rs'000) (%)
0.90 1.00 - 54.2 67.9 60.6 47.5 60.1 55.0 345.4 14%1.00 1.00 35.9 71.4 26.9 63.2 47.4 54.7 39.2 338.6 14%0.90 1.00 - 101.6 142.0 111.9 222.7 122.0 112.5 812.7 33%
35.9 227.2 236.8 235.6 317.7 236.8 206.7 1,496.7 61%
0.90 1.00 - - 8.6 21.2 11.3 5.9 10.8 57.6 2%0.90 1.00 - - 7.5 56.8 69.0 30.6 36.2 200.1 8%0.90 1.00 - - 33.4 53.6 - - 56.1 143.1 6%0.90 0.75 - - - - 33.7 33.7 135.0 202.4 8%0.90 0.75 - - - 46.0 67.0 15.2 139.6 267.8 11%0.90 1.00 - - - 13.5 6.8 - 28.0 48.2 2%0.90 1.00 - - - 4.5 18.3 - 18.0 40.8 2%0.90 1.00 - - - - - - 9.0 9.0 0%
- - 49.4 195.5 206.1 85.3 432.7 969.1 39%
0.90 1.00 - - - - - - - - 0% - - 49.4 195.5 206.1 85.3 432.7 969.1 39%
35.9 227.2 286.3 431.2 523.8 322.1 639.4 2,465.8 100%
- - - - - - - N/A - - - - - - - N/A - - - - - - - N/A - - - - - - - N/A
Cost Benefit Analysis (CBA) Study - field verification.
TotalsConversion Factors

Table AN12.5.6 GVT - M Pradesh - Jhabua: Village Borwa: VOD Household Assumptions.
Without \ With Project UnitsVillage Organisation and Development Year 1 Year 2 Year 3
(Rs) (Rs) (Rs)
Development Activity:Village Organisation and Development
Before / Without Project Situation:
A. Self Help Groups (SHGs)Assumption Sum Zero Zero Zero - - -
B. Drudgery ReductionAssumption Sum Zero Zero Zero
Total Without Project Benefits - - -
After / With Project Situation:
A. Self Help Groups (SHGs)Assumptions
Average Saving / Household Rs 292 Households / Village No 36 Present Group Deposits Rs'000 10.5 10.5 10.8 11.1 Annual Savings Increase % 3%Deposits on Loan Savings % 75%SHG Interest Income % / Year 15%Assumed Benefit Rs'000 1.2 1.2 1.3
B. Drudgery ReductionAssumptions
Hours Saved / Day / Household No 1.0 Number of Days / Year / Household No 200 Days / Year / Household (8hrs/day) No 25.0 Households / Village No 36 Day Equivalent / Village No 900 Economic Value per Day (Rs/day) 25 Assumed Benefit Rs'000 22.5 22.5 22.5
Total With Project Benefits Rs'000 23.7 23.7 23.8
Incremental Benefits Rs'000 23.7 23.7 23.8
Source: Cost Benefit Analysis (CBA) Study Estimate Jan 2005.SWC = Soil and Water Conservation.Participating households per village: Borwa 36
Assumptions Benefits

Table AN12.5.6
Without \ With ProjectVillage Organisation and Development
Development Activity:Village Organisation and Development
Before / Without Project Situation:
A. Self Help Groups (SHGs)Assumption
B. Drudgery ReductionAssumption
Total Without Project Benefits
After / With Project Situation:
A. Self Help Groups (SHGs)Assumptions
Average Saving / HouseholdHouseholds / VillagePresent Group Deposits Annual Savings IncreaseDeposits on Loan SavingsSHG Interest Income Assumed Benefit
B. Drudgery ReductionAssumptions
Hours Saved / Day / HouseholdNumber of Days / Year / HouseholdDays / Year / Household (8hrs/day)Households / VillageDay Equivalent / VillageEconomic Value per DayAssumed Benefit
Total With Project Benefits
Incremental Benefits
Source:SWC = Soil and Water Conservation.Participating households per village: Borwa
GVT - M Pradesh - Jhabua: Village Borwa: Incremental VOD Benefit Stream (Rs'000).
Year 1 Year 2 Year 3 Year 4 Year 5 Year 6 Year 7 Year 8 Year 9 Year 101999/00 2000/01 2001/02 2002/03 2003/04 2004/05 2005/06 2006/07 2007/08 2008/09
- - - - - - - - - -
- - 10.5 10.8 11.1 11.5 11.8 12.2 12.5 12.9
- - 1.2 1.2 1.3 1.3 1.3 1.4 1.4 1.5
- - 22.5 22.5 22.5 22.5 22.5 22.5 22.5 22.5
- - 23.7 23.7 23.8 23.8 23.8 23.9 23.9 24.0
- - 23.7 23.7 23.8 23.8 23.8 23.9 23.9 24.0
Cost Benefit Analysis (CBA) Study Estimate Jan 2005.
Benefit Streams (Rs '000)
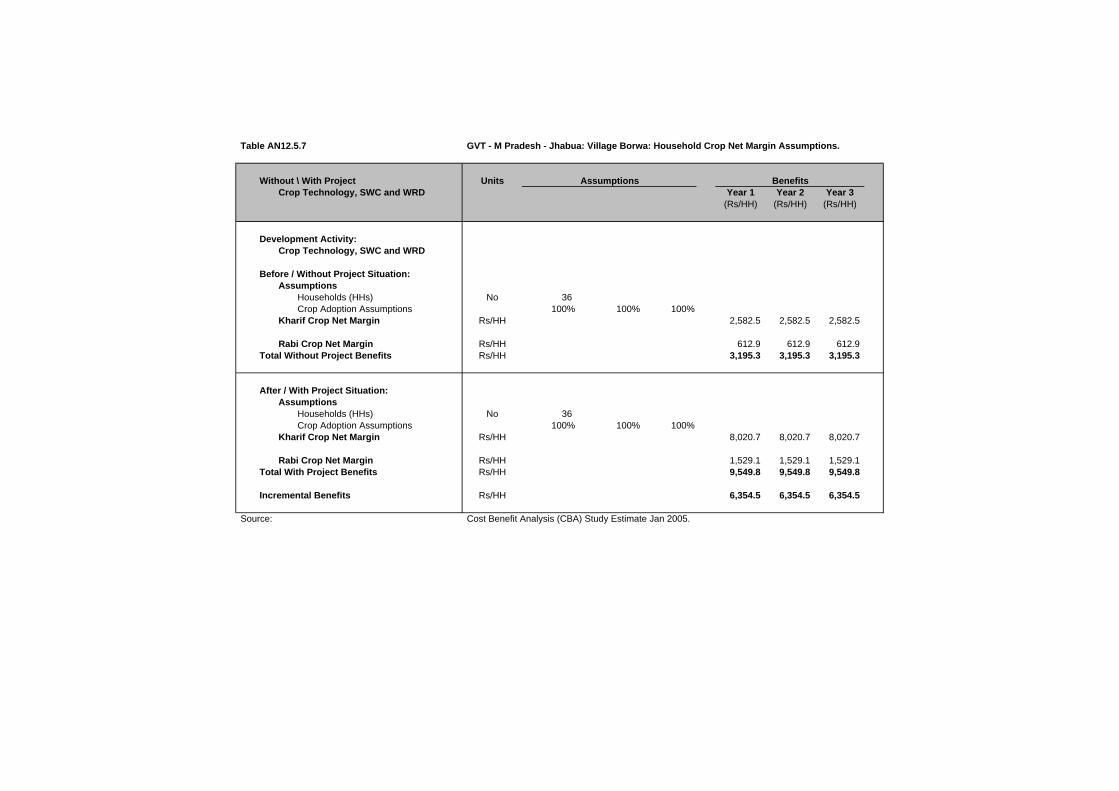
Table AN12.5.7 GVT - M Pradesh - Jhabua: Village Borwa: Household Crop Net Margin Assumptions.
Without \ With Project UnitsCrop Technology, SWC and WRD Year 1 Year 2 Year 3
(Rs/HH) (Rs/HH) (Rs/HH)
Development Activity:Crop Technology, SWC and WRD
Before / Without Project Situation:Assumptions
Households (HHs) No 36 Crop Adoption Assumptions 100% 100% 100%
Kharif Crop Net Margin Rs/HH 2,582.5 2,582.5 2,582.5
Rabi Crop Net Margin Rs/HH 612.9 612.9 612.9 Total Without Project Benefits Rs/HH 3,195.3 3,195.3 3,195.3
After / With Project Situation:Assumptions
Households (HHs) No 36 Crop Adoption Assumptions 100% 100% 100%
Kharif Crop Net Margin Rs/HH 8,020.7 8,020.7 8,020.7
Rabi Crop Net Margin Rs/HH 1,529.1 1,529.1 1,529.1 Total With Project Benefits Rs/HH 9,549.8 9,549.8 9,549.8
Incremental Benefits Rs/HH 6,354.5 6,354.5 6,354.5
Source: Cost Benefit Analysis (CBA) Study Estimate Jan 2005.
BenefitsAssumptions

Table AN12.5.7
Without \ With ProjectCrop Technology, SWC and WRD
Development Activity:Crop Technology, SWC and WRD
Before / Without Project Situation:Assumptions
Households (HHs)Crop Adoption Assumptions
Kharif Crop Net Margin
Rabi Crop Net MarginTotal Without Project Benefits
After / With Project Situation:Assumptions
Households (HHs)Crop Adoption Assumptions
Kharif Crop Net Margin
Rabi Crop Net MarginTotal With Project Benefits
Incremental Benefits
Source:
GVT - M Pradesh - Jhabua: Village Borwa: Incremental Crop Benefit Stream (Rs'000).
Year 1 Year 2 Year 3 Year 4 Year 5 Year 6 Year 7 Year 8 Year 9 Year 101999/00 2000/01 2001/02 2002/03 2003/04 2004/05 2005/06 2006/07 2007/08 2008/09
- - - - - 93.0 93.0 93.0 93.0 93.0
- - - - - 22.1 22.1 22.1 22.1 22.1 - - - - - 115.0 115.0 115.0 115.0 115.0
- - - - - 288.7 288.7 288.7 288.7 288.7
- - - - - 55.0 55.0 55.0 55.0 55.0 - - - - - 343.8 343.8 343.8 343.8 343.8
- - - - - 228.8 228.8 228.8 228.8 228.8
Cost Benefit Analysis (CBA) Study Estimate Jan 2005.
Benefit Streams (Rs '000)

Table AN12.5.8 GVT - M Pradesh - Jhabua: Village Borwa: Household Livestock Net Margin Assumptions.
Without \ With Project UnitsKharif \ Rabi Year 1 Year 2 Year 3
Livestock (Rs) (Rs) (Rs)
Development Activity:Livestock
Before / Without Project Situation:Assumptions
Households (HHs) No 36 Annual Livestock Net Margin Rs/HH
Total Without Project Benefits 1,148.0 1,148.0 1,148.0
After / With Project Situation:
Development Activity:Assumptions
Households (HHs) No 36 Adoption Assumptions Percent 55% 78% 100%
Annual Livestock Net Margin Rs/HHTotal With Project Benefits 1,852.1 2,609.8 3,367.5
Incremental Benefits Rs/HH 704.1 1,461.8 2,219.5
Source: Cost Benefit Analysis (CBA) Study Estimate Jan 2005.
BenefitsAssumptions

Table AN12.5.8
Without \ With ProjectKharif \ Rabi
Livestock
Development Activity:Livestock
Before / Without Project Situation:Assumptions
Households (HHs)Annual Livestock Net Margin
Total Without Project Benefits
After / With Project Situation:
Development Activity:Assumptions
Households (HHs)Adoption Assumptions
Annual Livestock Net MarginTotal With Project Benefits
Incremental Benefits
Source:
GVT - M Pradesh - Jhabua: Village Borwa: Incremental Livestock Benefit Stream (Rs'000).
Year 1 Year 2 Year 3 Year 4 Year 5 Year 6 Year 7 Year 8 Year 9 Year 101999/00 2000/01 2001/02 2002/03 2003/04 2004/05 2005/06 2006/07 2007/08 2008/09
- - - - - 41.3 41.3 41.3 41.3 41.3
- - - - - 66.7 94.0 121.2 121.2 121.2
- - - - - 25.3 52.6 79.9 79.9 79.9
Cost Benefit Analysis (CBA) Study Estimate Jan 2005.
Benefit Streams (Rs '000)

Table AN12.5.9 GVT - M Pradesh - Jhabua: Village Borwa: Forestry Benefit Assumptions.
Without \ With Project UnitsKharif \ Rabi Year 1 Year 2 Year 3
Forestry (Rs) (Rs) (Rs)
Development Activity:Forestry
Before / Without Project Situation:AssumptionsHouseholds (HHs) No 36 Annual Forestry Net Margin Rs/HH
Total Without Project Benefits - - -
After / With Project Situation:AssumptionsHouseholds (HHs) No 36 Adoption Assumptions Percent 55% 78% 100%Annual Forestry Net Margin Rs/HH
Total With Project Benefits 165.0 234.0 300.0
Incremental Benefits Rs/HH 165.0 234.0 300.0
Source: Cost Benefit Analysis (CBA) Study Estimate Jan 2005.
BenefitsAssumptions

Table AN12.5.9
Without \ With ProjectKharif \ Rabi
Forestry
Development Activity:Forestry
Before / Without Project Situation:AssumptionsHouseholds (HHs)Annual Forestry Net Margin
Total Without Project Benefits
After / With Project Situation:AssumptionsHouseholds (HHs)Adoption AssumptionsAnnual Forestry Net Margin
Total With Project Benefits
Incremental Benefits
Source:
GVT - M Pradesh - Jhabua: Village Borwa: Incremental Forestry Benefit Stream (Rs'000).
Year 1 Year 2 Year 3 Year 4 Year 5 Year 6 Year 7 Year 8 Year 9 Year 101999/00 2000/01 2001/02 2002/03 2003/04 2004/05 2005/06 2006/07 2007/08 2008/09
- - - - - - - - - -
- - - - 5.9 8.4 10.8 10.8 10.8 10.8
- - - 5.9 8.4 10.8 10.8 10.8 10.8 10.8
Cost Benefit Analysis (CBA) Study Estimate Jan 2005.
Benefit Streams (Rs '000)
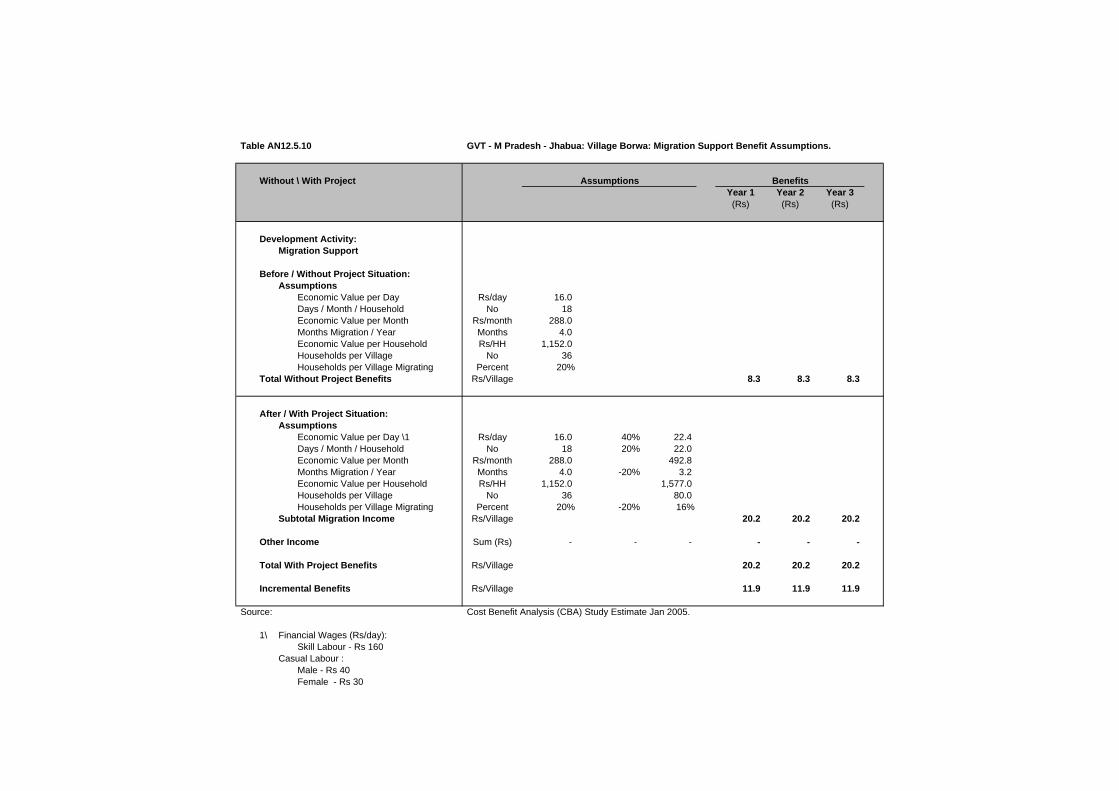
Table AN12.5.10 GVT - M Pradesh - Jhabua: Village Borwa: Migration Support Benefit Assumptions.
Without \ With ProjectYear 1 Year 2 Year 3(Rs) (Rs) (Rs)
Development Activity:Migration Support
Before / Without Project Situation:Assumptions
Economic Value per Day Rs/day 16.0 Days / Month / Household No 18 Economic Value per Month Rs/month 288.0 Months Migration / Year Months 4.0 Economic Value per Household Rs/HH 1,152.0 Households per Village No 36 Households per Village Migrating Percent 20%
Total Without Project Benefits Rs/Village 8.3 8.3 8.3
After / With Project Situation:Assumptions
Economic Value per Day \1 Rs/day 16.0 40% 22.4 Days / Month / Household No 18 20% 22.0 Economic Value per Month Rs/month 288.0 492.8 Months Migration / Year Months 4.0 -20% 3.2 Economic Value per Household Rs/HH 1,152.0 1,577.0 Households per Village No 36 80.0 Households per Village Migrating Percent 20% -20% 16%
Subtotal Migration Income Rs/Village 20.2 20.2 20.2
Other Income Sum (Rs) - - - - - -
Total With Project Benefits Rs/Village 20.2 20.2 20.2
Incremental Benefits Rs/Village 11.9 11.9 11.9
Source: Cost Benefit Analysis (CBA) Study Estimate Jan 2005.
1\ Financial Wages (Rs/day):Skill Labour - Rs 160
Casual Labour :Male - Rs 40Female - Rs 30
BenefitsAssumptions

Table AN12.5.10
Without \ With Project
Development Activity:Migration Support
Before / Without Project Situation:Assumptions
Economic Value per Day Days / Month / Household Economic Value per Month Months Migration / Year Economic Value per Household Households per Village Households per Village Migrating
Total Without Project Benefits
After / With Project Situation:Assumptions
Economic Value per Day \1Days / Month / Household Economic Value per Month Months Migration / Year Economic Value per Household Households per Village Households per Village Migrating
Subtotal Migration Income
Other Income
Total With Project Benefits
Incremental Benefits
Source:
1\ Financial Wages (Rs/day):Skill Labour - Rs 160
Casual Labour :Male - Rs 40Female - Rs 30
GVT - M Pradesh - Jhabua: Village Borwa: Incremental Migration Support Benefit Stream (Rs'000).
Year 1 Year 2 Year 3 Year 4 Year 5 Year 6 Year 7 Year 8 Year 9 Year 101999/00 2000/01 2001/02 2002/03 2003/04 2004/05 2005/06 2006/07 2007/08 2008/09
- - - - - - - 8.3 8.3 8.3
- - - - - - - 20.2 20.2 20.2
- - - - - - - - - -
- - - - - - - 20.2 20.2 20.2
- - - - - - - 11.9 11.9 11.9
Cost Benefit Analysis (CBA) Study Estimate Jan 2005.
Benefit Streams (Rs '000)

Table AN12.5.11 GVT - M Pradesh - Jhabua: Village Borwa: Weighted Household Crop Net Margin Summary (Rs/Household).
Item WBR(%) Khalif Rabi Total Khalif Rabi Total Khalif Rabi Total
Phase IIWell Being Ranking - Very Poor
Household Net Margin (Rs) 8.0% 834.6 102.5 937.1 1,849.8 1,067.8 2,917.6 1,015.2 965.3 1,980.5 Well Being Ranking - Poor
Household Net Margin (Rs) 31.0% 637.7 - 637.7 4,803.0 220.7 5,023.7 4,165.3 220.7 4,386.0 Well Being Ranking - Moderate
Household Net Margin (Rs) 28.0% 994.0 89.3 1,083.3 3,711.4 2,508.3 6,219.6 2,717.4 2,419.0 5,136.4 Well Being Ranking - Better Off
Household Net Margin (Rs) 33.0% 6,180.9 1,756.7 7,937.5 16,195.9 2,039.3 18,235.2 10,015.0 282.7 10,297.7
Well Being Ranking - WeightedHousehold Net Margin (Rs) 100.0% 2,582.5 612.9 3,195.3 8,020.7 1,529.1 9,549.8 5,438.3 916.2 6,354.5
Phase I \1Well Being Ranking - Very Poor
Household Net Margin (Rs) 8.0% 436.3 267.5 703.8 3,866.5 1,668.8 5,535.3 3,430.3 1,401.3 4,831.5 Well Being Ranking - Poor
Household Net Margin (Rs) 31.0% 485.8 657.5 1,143.3 10,136.0 5,690.3 15,826.3 9,650.3 5,032.8 14,683.0 Well Being Ranking - Moderate
Household Net Margin (Rs) 28.0% 986.3 3,385.0 4,371.3 9,457.5 5,195.0 14,652.5 8,471.3 1,810.0 10,281.3 Well Being Ranking - Better Off
Household Net Margin (Rs) 33.0% 2,778.0 937.0 3,715.0 4,915.0 9,560.0 14,475.0 2,137.0 8,623.0 10,760.0
Well Being Ranking - WeightedHousehold Net Margin (Rs) 100.0% 1,378.4 1,482.2 2,860.6 7,721.5 6,506.9 14,228.4 6,343.2 5,024.6 11,367.8
Source: Study of Impact of WIRFP on Net Incomes of Target Households, Jan 2004.WBR = GVT Household Well Being Ranking. Survey figures adjusted to Village Profile WBR.\1 GVT - Madhya Pradesh - Phase I: Village Naganwat Choti: Weighted Household Livestock Net Margin Summary.
Before / Without Project After / With Project Increment

Table AN12.5.12 GVT - M Pradesh - Jhabua: Village Borwa: Weighted Household Crop Net Margin Sensitivity Analysis (Rs/Household).
Item EIRRKhalif Rabi Total Khalif Rabi Total Khalif Rabi Total
Development Activity:Crop Technology, SWC and WRD
Weighted Net Margin (Phase II)Household Net Margin (Rs) 2,582.5 612.9 3,195.3 8,020.7 1,529.1 9,549.8 5,438.3 916.2 6,354.5 Incremental Benefit (Phase II / Phase I) 56%
Base Case AssumptionsHousehold Net Margin (Rs) 2,582.5 612.9 3,195.3 8,020.7 1,529.1 9,549.8 5,438.3 916.2 6,354.5 Incremental Benefit (Phase II / Phase I) 56%Sensitivity Increase (%) 0%Development Activity 34%Overall Village 5%
Sensitivity AssumptionsHousehold Net Margin (Rs) 2,582.5 612.9 3,195.3 11,229.0 2,140.8 13,369.8 8,646.6 1,527.9 10,174.4 Incremental Benefit (Phase II / Phase I) 90%Sensitivity Increase (%) 0%Development Activity 63%Overall Village 12%
Weighted Net Margin (Phase I) 1,378.4 1,482.2 2,860.6 7,721.5 6,506.9 14,228.4 6,343.2 5,024.6 11,367.8 Household Net Margin (Rs)
Source: Study of Impact of WIRFP on Net Incomes of Target Households, Jan 2004.EIRR = Economic Internal Rate of Return (rate at which NPV equal to zero).
Before / Without Project After / With Project Increment

Table AN12.5.13 GVT - M Pradesh - Jhabua: Village Borwa: Weighted Household Livestock Net Margin Summary (Rs/Household).
Well Being Ranking Weight(%) Herd Value Net Margin Herd Value Net Margin Herd Value Net Margin
Phase I - Well Being Ranking (WBR) \1Madhya Pradesh - WBR Weighted DataVery Poor 8.0%
Average 580 (185.0) 5,650 412.5 474 597.5 Poor 31.0%
Average 2,350 982.5 8,250 2,141.0 1,180 1,158.5 Moderate 28.0%
Average 14,700 6,730.0 1,900 2,820.0 1,900 (3,910.0)Better Off 33.0%
Average 15,580 3,000.0 14,600 10,790.0 (196) 7,790.0
Phase I - WBR Weighted Data 100.0% 10,032 3,164.2 8,360 5,047.0 871 1,882.8
Phase II - Well Being Ranking (WBR)
Very Poor 8.0%Average 5,756 149.2 10,970 1,446.4 1,043 1,297.2
Poor 31.0%Average 13,128 852.2 25,979 3,008.8 2,570 2,156.8
Moderate 28.0%Average 13,525 4,035.1 27,020 5,249.5 2,699 1,214.4
Better Off 33.0%Average 12,700 (781.7) 41,873 2,573.3 5,835 3,355.0
Phase II - WBR Weighted Data 100.0% 12,508 1,148.0 30,315 3,367.5 3,561 2,219.6
Source: Study of Impact of WIRFP on Net Incomes of Target Households, Jan 2004.WBR = GVT Household Well Being Ranking. Survey figures adjusted to Village Profile WBR.
\1 GVT - Madhya Pradesh - Phase I: Village Naganwat Choti: Weighted Household Livestock Net Margin Summary.
Before / Without Project After / With Project Increment \1

WIRFP - Phase II - Cost Benefit Analysis Study
Tables AN12.0 Individual Village Cost Benefit Analysis
Tables AN12.6 GVT - Madhya Pradesh - Jhabua: Village Chamjhar: Village Profile.
Table AN12.6.1 GVT - M Pradesh - Jhabua: Village Chamjhar: Village Profile.
Table AN12.6.2 GVT - M Pradesh - Jhabua: Village Chamjhar: Cost Benefit Analysis Summary (Rs'000).Table AN12.6.3 GVT - M Pradesh - Jhabua: Village Chamjhar: Cost Benefit Analysis Development Activity Summary A (Rs'000).Table AN12.6.4 GVT - M Pradesh - Jhabua: Village Chamjhar: Cost Benefit Analysis Development Activity Summary B (Rs'000).
Table AN12.6.5 GVT - M Pradesh - Jhabua: Village Chemjhar - Costs - Financial (Rs'000).GVT - M Pradesh - Jhabua: Village Chemjhar - Costs - Economic (Rs'000).
Table AN12.6.6 GVT - M Pradesh - Jhabua: Village Chamjhar: VOD Household Assumptions.GVT - M Pradesh - Jhabua: Village Chamjhar: Incremental VOD Benefit Stream (Rs'000).
Table AN12.6.7 GVT - M Pradesh - Jhabua: Village Chamjhar: Household Crop Net Margin Assumptions.GVT - M Pradesh - Jhabua: Village Chamjhar: Incremental Crop Benefit Stream (Rs'000).
Table AN12.6.8 GVT - M Pradesh - Jhabua: Village Chamjhar: Household Livestock Net Margin Assumptions.GVT - M Pradesh - Jhabua: Village Chamjhar: Incremental Livestock Benefit Stream (Rs'000).
Table AN12.6.9 GVT - M Pradesh - Jhabua: Village Chamjhar: Forestry Benefit Assumptions.GVT - M Pradesh - Jhabua: Village Chamjhar: Incremental Forestry Benefit Stream (Rs'000).
Table AN12.6.10 GVT - M Pradesh - Jhabua: Village Chamjhar: Migration Support Benefit Assumptions.GVT - M Pradesh - Jhabua: Village Chamjhar: Incremental Migration Support Benefit Stream (Rs'000).
Table AN12.6.11 GVT - M Pradesh - Jhabua: Village Chamjhar: Weighted Household Crop Net Margin Summary (Rs/Household).Table AN12.6.12 GVT - M Pradesh - Jhabua: Village Chamjhar: Weighted Household Crop Net Margin Sensitivity Analysis (Rs/Household).
Table AN12.6.13 GVT - M Pradesh - Jhabua: Village Chamjhar: Weighted Household Livestock Net Margin Summary (Rs/Household).

Table AN12.6.1 GVT - M Pradesh - Jhabua: Village Chamjhar: Village Profile.
Village Profile \1
A. Background E. Well Being Ranking (No Households)Village Name Chamjhar Very Poor 13 25.0%District Jhabua Poor 13 25.0%State M P Moderate 16 30.8%
Better Off 10 19.2%B. Participatory Planning Process (PPP) Total 52 100%
Village entry Apr-00PRA Nov-00 F. Land Resource (ha)CPA Dec-00 Total Area 291
Revenue Land 159 C. Infrastructure Forest Area - R 61
Hand Pumps (no) 8 Pasture Land 8 Wells (no) 7 Arable Land 63 Linked by Road 5 km 291 Electrification YesSchool Primary G. Livestock
D. Demographic DataHouseholds (no) 94 Participating Households 49 Population (Adults) 623
Adults: Male 322 H. Self Help Groups (No Households) Female 301 1. Group 1 22 Children: 2. Group 2 16 Boys N/A 3. Group 3 11 Girls N/A 4. Group 4 20
5. Group 5 10 6. Group 6 -
79
Source: GVT Jhabua Coordination Office - Madhya Pradesh.\1 Subject to final adjustment following consolidation exercise prior to Annual Review Meeting (ARM) in Feb 2005.

Table AN12.6.2 GVT - M Pradesh - Jhabua: Village Chamjhar: Cost Benefit Analysis Summary (Rs'000).
Administration Costs / Development Activity EIRR \1 Year 1 Year 2 Year 3 Year 4 Year 5 Year 6 Year 7 Year 8 Year 9 Year 10(10%) (%) 1999/00 2000/01 2001/02 2002/03 2003/04 2004/05 2005/06 2006/07 2007/08 2008/09
A. Administration CostsTotal A N/A (985) 52% 35.9 227.2 236.8 235.6 317.7 236.8 206.7 20.7 20.7 20.7
B. Development Intervention Component A 1. PPGF
Net Incremental Benefits N/A (40) 2% - (13.5) (12.5) (11.4) (2.5) (4.1) (11.8) (1.3) (1.3) (1.3)
2. VODNet Incremental Benefits 19% 49 -3% - (14.6) (28.7) (73.7) 2.0 25.7 16.5 36.6 36.6 36.6
3/5.Crop Technology, SWC and WRDNet Incremental Benefits N/A (1,348) 71% - (108.8) (713.0) (303.1) (21.8) (732.8) (98.9) (45.9) (45.9) (45.9)
6. LivestockNet Incremental Benefits 61% 408 -22% - - (27.2) (28.0) (18.1) 30.5 68.4 140.6 140.6 140.6
7. ForestryNet Incremental Benefits 37% 30 -2% - - (2.8) (21.5) 7.9 12.4 3.1 11.5 11.5 11.5
8. Migration SupportNet Incremental Benefits N/A (2) 0% - - - - - (1.9) (0.2) (0.2) (0.2) (0.2)
SummaryNet Incremental Benefits N/A (1,888) 100% (35.9) (364.1) (1,021.0) (673.4) (350.1) (907.0) (229.6) 120.6 120.7 120.7
Sensitivity AnalysisAnalysis Period
12 Years N/A (2,042)20 Years (Base Case) N/A (1,888)25 Years -4% (1,843)30 Years -2% (1,818)
Costs - AdministrationInvestment Costs Decreased by 20 percent N/A (1,691)
Costs - Administration and DevelopmentRecurrent Costs Decreased by 20 percent N/A (2,167)
Benefits Crop, SWC and WRDCrop Benefits Increased by 20 percent -2% (1,478)Livestock Benefits Increased by 20 percent -5% (1,732)
Source: Cost Benefit Analysis (CBA) Study Estimate Jan 2005.\1 EIRR = Economic Internal Rate of Return (rate at which NPV equal to zero).\2 NPV = Net Present Value of net incremental benefits at 12% (indicative opportunity cost of capital for rural development projects in India).
N/A = Not analysed as EIRR negative.
NPV \2

Table AN12.6.3 GVT - M Pradesh - Jhabua: Village Chamjhar: Cost Benefit Analysis Development Activity Summary A (Rs'000).
Administration Costs / Development Activity EIRR \1 Year 1 Year 2 Year 3 Year 4 Year 5 Year 6 Year 7 Year 8 Year 9 Year 10(10%) (%) 1999/00 2000/01 2001/02 2002/03 2003/04 2004/05 2005/06 2006/07 2007/08 2008/09
A. Administration CostsInvestment 35.9 227.2 236.8 235.6 317.7 236.8 206.7 - - - Recurrent - - - - - - - 20.7 20.7 20.7
Total (A) N/A (985) 52% 35.9 227.2 236.8 235.6 317.7 236.8 206.7 20.7 20.7 20.7
B. Development Intervention Component A 1. PPGF
Cost StreamInvestment - 13.5 12.2 10.8 1.6 3.2 10.8 - - - Recurrent - - 0.3 0.6 0.9 1.0 1.0 1.3 1.3 1.3 Total Costs - 13.5 12.5 11.4 2.5 4.1 11.8 1.3 1.3 1.3
Benefit StreamBefore / Without Project - - - - - - - - - - After / With Project - - - - - - - - - - Incremental Benefits - - - - - - - - - -
Net Incremental Benefits N/A (40) 2% - (13.5) (12.5) (11.4) (2.5) (4.1) (11.8) (1.3) (1.3) (1.3)
2. VODCost Stream
Investment - 14.6 78.5 119.7 38.0 12.4 21.1 - - - Recurrent - - 0.7 4.7 10.6 12.5 13.2 14.2 14.2 14.2 Total Costs - 14.6 79.2 124.3 48.6 24.9 34.2 14.2 14.2 14.2
Benefit StreamBefore / Without Project - - - - - - - - - - After / With Project - - 50.6 50.6 50.6 50.7 50.7 50.8 50.8 50.9 Incremental Benefits - - 50.6 50.6 50.6 50.7 50.7 50.8 50.8 50.9
Net Incremental Benefits 19% 49 -3% - (14.6) (28.7) (73.7) 2.0 25.7 16.5 36.6 36.6 36.6
3/5.Crop Technology, SWC and WRDCost Stream
InvestmentCrop Technology - - 29.6 53.4 27.3 8.2 9.4 - - - Soil Water Conservation - 108.8 432.8 296.9 - 68.9 41.8 - - - Water Resource Development - - 237.1 100.4 88.5 735.8 8.6 - - -
RecurrentCrop Technology - - - 0.7 2.1 2.8 3.0 3.2 3.2 3.2 Soil Water Conservation - - 13.6 67.7 104.8 104.8 113.4 118.6 118.6 118.6 Water Resource Development - - 35.6 50.6 63.9 174.3 175.5 175.5 175.5
Total Costs - 108.8 713.0 554.7 273.3 984.3 350.4 297.4 297.4 297.4 Benefit Stream
Before / Without Project - - - 243.2 243.2 243.2 243.2 243.2 243.2 243.2 After / With Project - - - 494.7 494.7 494.7 494.7 494.7 494.7 494.7 Incremental Benefits - - - 251.5 251.5 251.5 251.5 251.5 251.5 251.5
Net Incremental Benefits N/A (1,348) 71% - (108.8) (713.0) (303.1) (21.8) (732.8) (98.9) (45.9) (45.9) (45.9)
Source: Cost Benefit Analysis (CBA) Study Estimate Jan 2005.\1 EIRR = Economic Internal Rate of Return (rate at which NPV equal to zero).\2 NPV = Net Present Value of net incremental benefits at 12% (indicative opportunity cost of capital for rural development projects in India).
N/A = Not analysed as EIRR negative.
NPV \2
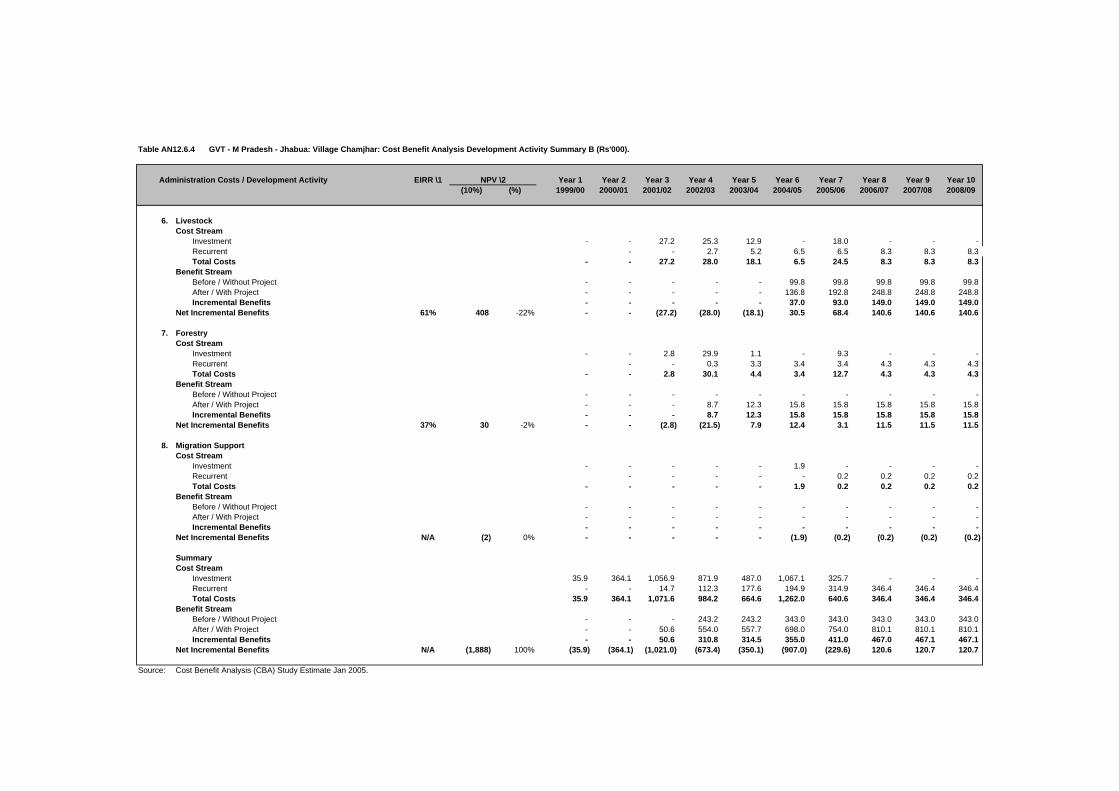
Table AN12.6.4 GVT - M Pradesh - Jhabua: Village Chamjhar: Cost Benefit Analysis Development Activity Summary B (Rs'000).
Administration Costs / Development Activity EIRR \1 Year 1 Year 2 Year 3 Year 4 Year 5 Year 6 Year 7 Year 8 Year 9 Year 10(10%) (%) 1999/00 2000/01 2001/02 2002/03 2003/04 2004/05 2005/06 2006/07 2007/08 2008/09
6. LivestockCost Stream
Investment - - 27.2 25.3 12.9 - 18.0 - - - Recurrent - - 2.7 5.2 6.5 6.5 8.3 8.3 8.3 Total Costs - - 27.2 28.0 18.1 6.5 24.5 8.3 8.3 8.3
Benefit StreamBefore / Without Project - - - - - 99.8 99.8 99.8 99.8 99.8 After / With Project - - - - - 136.8 192.8 248.8 248.8 248.8 Incremental Benefits - - - - - 37.0 93.0 149.0 149.0 149.0
Net Incremental Benefits 61% 408 -22% - - (27.2) (28.0) (18.1) 30.5 68.4 140.6 140.6 140.6
7. ForestryCost Stream
Investment - - 2.8 29.9 1.1 - 9.3 - - - Recurrent - - 0.3 3.3 3.4 3.4 4.3 4.3 4.3 Total Costs - - 2.8 30.1 4.4 3.4 12.7 4.3 4.3 4.3
Benefit StreamBefore / Without Project - - - - - - - - - - After / With Project - - - 8.7 12.3 15.8 15.8 15.8 15.8 15.8 Incremental Benefits - - - 8.7 12.3 15.8 15.8 15.8 15.8 15.8
Net Incremental Benefits 37% 30 -2% - - (2.8) (21.5) 7.9 12.4 3.1 11.5 11.5 11.5
8. Migration SupportCost Stream
Investment - - - - - 1.9 - - - - Recurrent - - - - - 0.2 0.2 0.2 0.2 Total Costs - - - - - 1.9 0.2 0.2 0.2 0.2
Benefit StreamBefore / Without Project - - - - - - - - - - After / With Project - - - - - - - - - - Incremental Benefits - - - - - - - - - -
Net Incremental Benefits N/A (2) 0% - - - - - (1.9) (0.2) (0.2) (0.2) (0.2)
SummaryCost Stream
Investment 35.9 364.1 1,056.9 871.9 487.0 1,067.1 325.7 - - - Recurrent - - 14.7 112.3 177.6 194.9 314.9 346.4 346.4 346.4 Total Costs 35.9 364.1 1,071.6 984.2 664.6 1,262.0 640.6 346.4 346.4 346.4
Benefit StreamBefore / Without Project - - - 243.2 243.2 343.0 343.0 343.0 343.0 343.0 After / With Project - - 50.6 554.0 557.7 698.0 754.0 810.1 810.1 810.1 Incremental Benefits - - 50.6 310.8 314.5 355.0 411.0 467.0 467.1 467.1
Net Incremental Benefits N/A (1,888) 100% (35.9) (364.1) (1,021.0) (673.4) (350.1) (907.0) (229.6) 120.6 120.7 120.7
Source: Cost Benefit Analysis (CBA) Study Estimate Jan 2005.
NPV \2

Table AN12.6.5 GVT - M Pradesh - Jhabua: Village Chemjhar - Costs - Financial (Rs'000).
Cost Head / Subhead 1999/00 2000/01 2001/02 2002/03 2003/04 2004/05 2005/06Actual Actual Actual Actual Actual Budget Budget (Rs'000) (%)
A. Administration CostsGVT Bhopal (PHQ) - 60.3 75.4 67.3 52.8 66.8 61.1 383.7 7%DFIDI Consultancy 35.9 71.4 26.9 63.2 47.4 54.7 39.2 338.6 6%Jhabua Coordination Office - 112.9 157.8 124.3 247.5 135.5 125.0 903.0 17%
Total A 35.9 244.5 260.2 254.8 347.7 257.0 225.3 1,625.4 30%
B. Development CostsComponent A 1. PPGF - 15.0 13.5 12.0 1.8 3.5 12.0 57.8 1% 2. VOD - 16.3 87.2 133.0 42.2 13.8 23.4 315.9 6% 3. Crop Technology - - 32.8 59.3 30.4 9.1 10.4 142.1 3% 4. SWC - 161.2 641.2 439.9 - 102.0 62.0 1,406.2 26% 5. WRD - - 351.3 148.7 131.1 1,090.1 12.7 1,733.8 32% 6. Livestock - - 30.2 28.1 14.3 - 20.0 92.6 2% 7. Forestry - - 3.1 33.2 1.2 - 10.3 47.9 1%8. Migration Support - - - - - 2.1 - 2.1 0%
Subtotal - 192.4 1,159.3 854.1 221.0 1,220.6 150.9 3,798.3 70%
Other Development CostsSubtotal - - - - - - - -
Total B - 192.4 1,159.3 854.1 221.0 1,220.6 150.9 3,798.3 70%
Total A + B 35.9 437.0 1,419.5 1,108.9 568.6 1,477.6 376.2 5,423.7 100%
GVT - 314.2 1,058.8 838.0 521.0 1,316.2 312.7 4,360.9 80%DFIDI 35.9 71.4 26.9 63.2 47.4 54.7 39.2 338.6 6%Community - 80.8 361.9 225.5 15.2 123.9 26.5 833.7 15%Government - 0.6 1.9 6.2 3.0 0.8 0.9 13.4 0%
Source: GVT Jhabua Coordination Office - Madhya Pradesh.
DFIDI = Department for International Development (India).PPGF = Participatory Planning and Group Formation.VOD = Village Organisation and Development.SWC = Soil and Water Conservation.WRD = Water Resource Development.
Totals
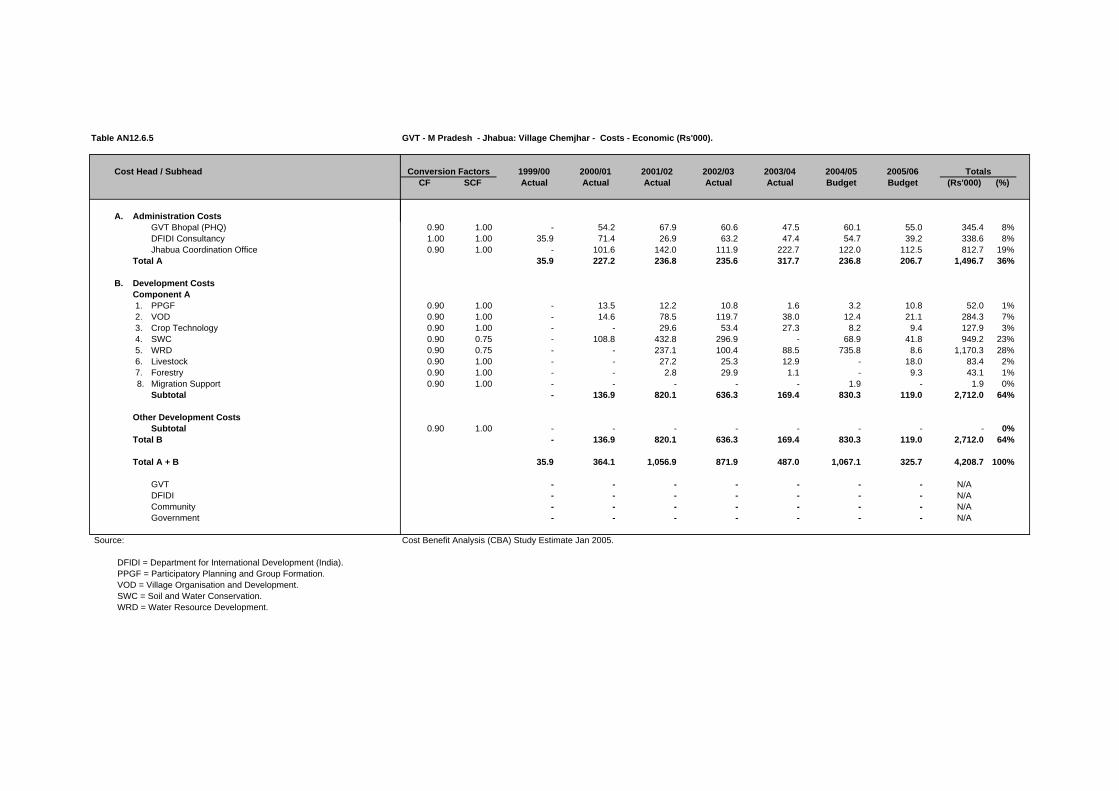
Table AN12.6.5
Cost Head / Subhead
A. Administration CostsGVT Bhopal (PHQ)DFIDI ConsultancyJhabua Coordination Office
Total A
B. Development CostsComponent A 1. PPGF 2. VOD 3. Crop Technology 4. SWC 5. WRD 6. Livestock 7. Forestry8. Migration Support
Subtotal
Other Development CostsSubtotal
Total B
Total A + B
GVTDFIDICommunityGovernment
Source:
DFIDI = Department for International Development (India).PPGF = Participatory Planning and Group Formation.VOD = Village Organisation and Development.SWC = Soil and Water Conservation.WRD = Water Resource Development.
GVT - M Pradesh - Jhabua: Village Chemjhar - Costs - Economic (Rs'000).
1999/00 2000/01 2001/02 2002/03 2003/04 2004/05 2005/06CF SCF Actual Actual Actual Actual Actual Budget Budget (Rs'000) (%)
0.90 1.00 - 54.2 67.9 60.6 47.5 60.1 55.0 345.4 8%1.00 1.00 35.9 71.4 26.9 63.2 47.4 54.7 39.2 338.6 8%0.90 1.00 - 101.6 142.0 111.9 222.7 122.0 112.5 812.7 19%
35.9 227.2 236.8 235.6 317.7 236.8 206.7 1,496.7 36%
0.90 1.00 - 13.5 12.2 10.8 1.6 3.2 10.8 52.0 1%0.90 1.00 - 14.6 78.5 119.7 38.0 12.4 21.1 284.3 7%0.90 1.00 - - 29.6 53.4 27.3 8.2 9.4 127.9 3%0.90 0.75 - 108.8 432.8 296.9 - 68.9 41.8 949.2 23%0.90 0.75 - - 237.1 100.4 88.5 735.8 8.6 1,170.3 28%0.90 1.00 - - 27.2 25.3 12.9 - 18.0 83.4 2%0.90 1.00 - - 2.8 29.9 1.1 - 9.3 43.1 1%0.90 1.00 - - - - - 1.9 - 1.9 0%
- 136.9 820.1 636.3 169.4 830.3 119.0 2,712.0 64%
0.90 1.00 - - - - - - - - 0% - 136.9 820.1 636.3 169.4 830.3 119.0 2,712.0 64%
35.9 364.1 1,056.9 871.9 487.0 1,067.1 325.7 4,208.7 100%
- - - - - - - N/A - - - - - - - N/A - - - - - - - N/A - - - - - - - N/A
Cost Benefit Analysis (CBA) Study Estimate Jan 2005.
TotalsConversion Factors

Table AN12.6.6 GVT - M Pradesh - Jhabua: Village Chamjhar: VOD Household Assumptions.
Without \ With Project UnitsVillage Organisation and Development Year 1 Year 2 Year 3
(Rs) (Rs) (Rs)
Development Activity:Village Organisation and Development
Before / Without Project Situation:
A. Self Help Groups (SHGs)Assumption Sum Zero Zero Zero - - -
B. Drudgery ReductionAssumption Sum Zero Zero Zero
Total Without Project Benefits - - -
After / With Project Situation:
A. Self Help Groups (SHGs)Assumptions
Average Saving / Household Rs 506 Households / Village No 79 Present Group Deposits Rs'000 40.0 40.0 41.2 42.4 Annual Savings Increase % 3%Deposits on Loan to Members % 20%SHG Interest Income % / Year 15%Assumed Benefit Rs'000 1.2 1.2 1.3
B. Drudgery ReductionAssumptions
Hours Saved / Day / Household No 1.0 Number of Days / Year / Household No 200 Days / Year / Household (8hrs/day) No 25.0 Households / Village No 79 Day Equivalent / Village No 1,975 Economic Value per Day (Rs/day) 25 Assumed Benefit Rs'000 49.4 49.4 49.4
Total With Project Benefits Rs'000 50.6 50.6 50.6
Incremental Benefits Rs'000 50.6 50.6 50.6
Source: Cost Benefit Analysis (CBA) Study Estimate Jan 2005.VOD = Village Organisation and Development.Households per village: Chamjhar 79
Assumptions Benefits

Table AN12.6.6
Without \ With ProjectVillage Organisation and Development
Development Activity:Village Organisation and Development
Before / Without Project Situation:
A. Self Help Groups (SHGs)Assumption
B. Drudgery ReductionAssumption
Total Without Project Benefits
After / With Project Situation:
A. Self Help Groups (SHGs)Assumptions
Average Saving / HouseholdHouseholds / VillagePresent Group DepositsAnnual Savings IncreaseDeposits on Loan to MembersSHG Interest Income Assumed Benefit
B. Drudgery ReductionAssumptions
Hours Saved / Day / HouseholdNumber of Days / Year / HouseholdDays / Year / Household (8hrs/day)Households / VillageDay Equivalent / VillageEconomic Value per DayAssumed Benefit
Total With Project Benefits
Incremental Benefits
Source:VOD = Village Organisation and Development.Households per village: Chamjhar
GVT - M Pradesh - Jhabua: Village Chamjhar: Incremental VOD Benefit Stream (Rs'000).
Year 1 Year 2 Year 3 Year 4 Year 5 Year 6 Year 7 Year 8 Year 9 Year 101999/00 2000/01 2001/02 2002/03 2003/04 2004/05 2005/06 2006/07 2007/08 2008/09
- - - - - - - - - -
- - 40.0 41.2 42.4 43.7 45.0 46.4 47.8 49.2
- - 1.2 1.2 1.3 1.3 1.4 1.4 1.4 1.5
- - 49.4 49.4 49.4 49.4 49.4 49.4 49.4 49.4
- - 50.6 50.6 50.6 50.7 50.7 50.8 50.8 50.9
- - 50.6 50.6 50.6 50.7 50.7 50.8 50.8 50.9
Cost Benefit Analysis (CBA) Study Estimate Jan 2005.
Benefit Streams (Rs '000)

Table AN12.6.7 GVT - M Pradesh - Jhabua: Village Chamjhar: Household Crop Net Margin Assumptions.
Without \ With Project UnitsCrop Technology, SWC and WRD Year 1 Year 2 Year 3
(Rs/HH) (Rs/HH) (Rs/HH)
Development Activity:Crop Technology, SWC and WRD
Before / Without Project Situation:Assumptions
Households (HHs) No 79 Crop Adoption Assumptions 100% 100% 100%
Kharif Crop Net Margin Rs/HH 1,850.6 1,850.6 1,850.6
Rabi Crop Net Margin Rs/HH 1,228 1,227.7 1,227.7 Total Without Project Benefits Rs/HH 3,078.2 3,078.2 3,078.2
After / With Project Situation:Assumptions
Households (HHs) No 79 Crop Adoption Assumptions 100% 100% 100%
Kharif Crop Net Margin Rs/HH 3,988.1 3,988.1 3,988.1
Rabi Crop Net Margin Rs/HH 2,274.0 2,274.0 2,274.0 Total With Project Benefits Rs/HH 6,262.1 6,262.1 6,262.1
Incremental Benefits Rs/HH 3,183.9 3,183.9 3,183.9
Source: Cost Benefit Analysis (CBA) Study Estimate Jan 2005.
BenefitsAssumptions

Table AN12.6.7
Without \ With ProjectCrop Technology, SWC and WRD
Development Activity:Crop Technology, SWC and WRD
Before / Without Project Situation:Assumptions
Households (HHs)Crop Adoption Assumptions
Kharif Crop Net Margin
Rabi Crop Net MarginTotal Without Project Benefits
After / With Project Situation:Assumptions
Households (HHs)Crop Adoption Assumptions
Kharif Crop Net Margin
Rabi Crop Net MarginTotal With Project Benefits
Incremental Benefits
Source:
GVT - M Pradesh - Jhabua: Village Chamjhar: Incremental Crop Benefit Stream (Rs'000).
Year 1 Year 2 Year 3 Year 4 Year 5 Year 6 Year 7 Year 8 Year 9 Year 101999/00 2000/01 2001/02 2002/03 2003/04 2004/05 2005/06 2006/07 2007/08 2008/09
- - - 146.2 146.2 146.2 146.2 146.2 146.2 146.2
- - - 97.0 97.0 97.0 97.0 97.0 97.0 97.0 - - - 243.2 243.2 243.2 243.2 243.2 243.2 243.2
- - - 315.1 315.1 315.1 315.1 315.1 315.1 315.1
- - - 179.6 179.6 179.6 179.6 179.6 179.6 179.6 - - - 494.7 494.7 494.7 494.7 494.7 494.7 494.7
- - - 251.5 251.5 251.5 251.5 251.5 251.5 251.5
Cost Benefit Analysis (CBA) Study Estimate Jan 2005.
Benefit Streams (Rs '000)

Table AN12.6.8 GVT - M Pradesh - Jhabua: Village Chamjhar: Household Livestock Net Margin Assumptions.
Without \ With Project UnitsLivestock Year 1 Year 2 Year 3
(Rs) (Rs) (Rs)
Development Activity:Livestock
Before / Without Project Situation:Assumptions
Households (HHs) No 79 Annual Livestock Net Margin Rs/HH
Total Without Project Benefits 1,263.6 1,263.6 1,263.6
After / With Project Situation:
Development Activity:Assumptions
Households (HHs) No 79 Adoption Assumptions Percent 55% 78% 100%
Annual Livestock Net Margin Rs/HHTotal With Project Benefits 1,732.0 2,440.5 3,149.1
Incremental Benefits Rs/HH 468.4 1,176.9 1,885.4
Source: Cost Benefit Analysis (CBA) Study Estimate Jan 2005.
BenefitsAssumptions

Table AN12.6.8
Without \ With ProjectLivestock
Development Activity:Livestock
Before / Without Project Situation:Assumptions
Households (HHs)Annual Livestock Net Margin
Total Without Project Benefits
After / With Project Situation:
Development Activity:Assumptions
Households (HHs)Adoption Assumptions
Annual Livestock Net MarginTotal With Project Benefits
Incremental Benefits
Source:
GVT - M Pradesh - Jhabua: Village Chamjhar: Incremental Livestock Benefit Stream (Rs'000).
Year 1 Year 2 Year 3 Year 4 Year 5 Year 6 Year 7 Year 8 Year 9 Year 101999/00 2000/01 2001/02 2002/03 2003/04 2004/05 2005/06 2006/07 2007/08 2008/09
- - - - - 99.8 99.8 99.8 99.8 99.8
- - - - - 136.8 192.8 248.8 248.8 248.8
- - - - - 37.0 93.0 149.0 149.0 149.0
Cost Benefit Analysis (CBA) Study Estimate Jan 2005.
Benefit Streams (Rs '000)

Table AN12.6.9 GVT - M Pradesh - Jhabua: Village Chamjhar: Forestry Benefit Assumptions.
Without \ With Project UnitsForestry Year 1 Year 2 Year 3
(Rs) (Rs) (Rs)
Development Activity:Forestry
Before / Without Project Situation:AssumptionsHouseholds (HHs) No 79 Annual Forestry Net Margin Rs/HH
Total Without Project Benefits - - -
After / With Project Situation:AssumptionsHouseholds (HHs) No 79 Adoption Assumptions Percent 55% 78% 100%Annual Forestry Net Margin Rs/HH
Total With Project Benefits 110.0 156.0 200.0
Incremental Benefits Rs/HH 110.0 156.0 200.0
Source: Cost Benefit Analysis (CBA) Study Estimate Jan 2005.
BenefitsAssumptions

Table AN12.6.9
Without \ With ProjectForestry
Development Activity:Forestry
Before / Without Project Situation:AssumptionsHouseholds (HHs)Annual Forestry Net Margin
Total Without Project Benefits
After / With Project Situation:AssumptionsHouseholds (HHs)Adoption AssumptionsAnnual Forestry Net Margin
Total With Project Benefits
Incremental Benefits
Source:
GVT - M Pradesh - Jhabua: Village Chamjhar: Incremental Forestry Benefit Stream (Rs'000).
Year 1 Year 2 Year 3 Year 4 Year 5 Year 6 Year 7 Year 8 Year 9 Year 101999/00 2000/01 2001/02 2002/03 2003/04 2004/05 2005/06 2006/07 2007/08 2008/09
- - - - - - - - - -
- - - 8.7 12.3 15.8 15.8 15.8 15.8 15.8
- - - 8.7 12.3 15.8 15.8 15.8 15.8 15.8
Cost Benefit Analysis (CBA) Study Estimate Jan 2005.
Benefit Streams (Rs '000)

Table AN12.6.10 GVT - M Pradesh - Jhabua: Village Chamjhar: Migration Support Benefit Assumptions.
Without \ With ProjectYear 1 Year 2 Year 3(Rs) (Rs) (Rs)
Development Activity:Migration Support
Before / Without Project Situation:Assumptions
Economic Value per Day Rs/day - Days / Month / Household No - Economic Value per Month Rs/month - Months Migration / Year Months - Economic Value per Household Rs/HH - Households per Village No 79 Households per Village Migrating Percent 0%
Total Without Project Benefits Rs/Village - - -
After / With Project Situation:Assumptions
Economic Value per Day \1 Rs/day - 60% - Days / Month / Household No - 30% - Economic Value per Month Rs/month - - Months Migration / Year Months - -20% - Economic Value per Household Rs/HH - - Households per Village No 79 80.0 Households per Village Migrating Percent 0% -20% 0%
Subtotal Migration Income Rs/Village - - -
Other Income Sum (Rs) - - - - - -
Total With Project Benefits Rs/Village - - -
Incremental Benefits Rs/Village - - -
Source: Cost Benefit Analysis (CBA) Study Estimate Jan 2005.
1\ Financial Wages (Rs/day):Skill Labour - Rs 160
Casual Labour :Male - Rs 40Female - Rs 30
BenefitsAssumptions
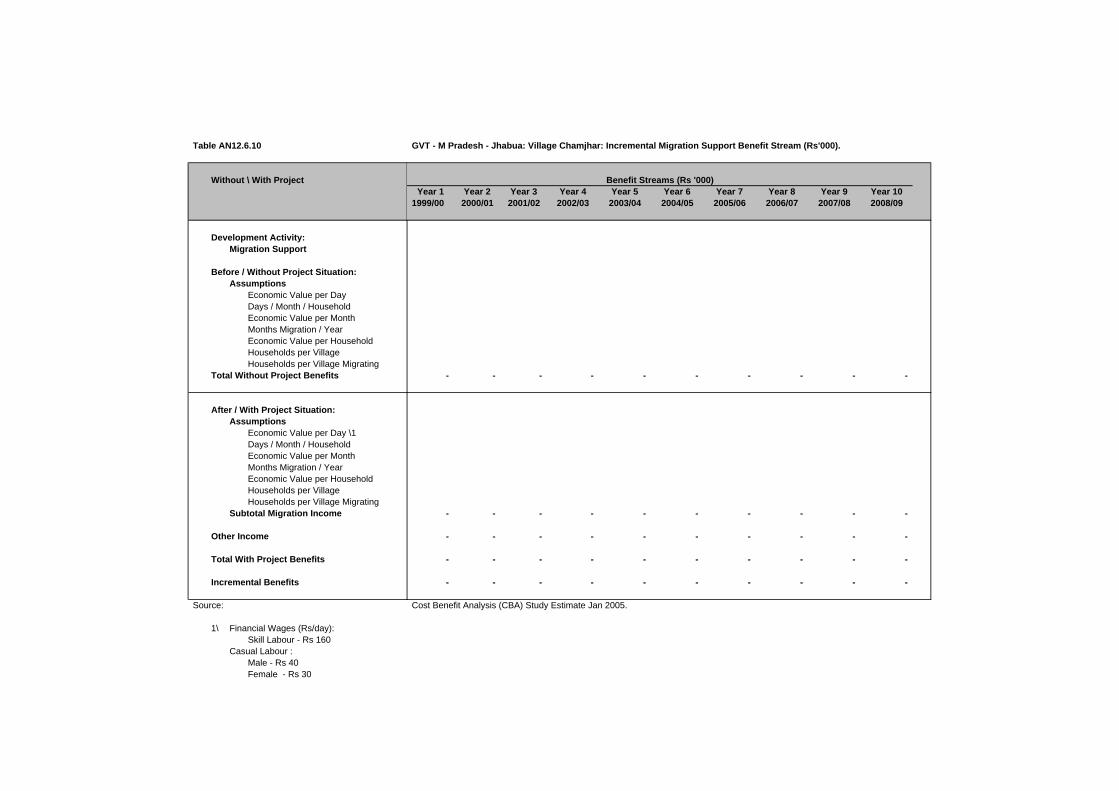
Table AN12.6.10
Without \ With Project
Development Activity:Migration Support
Before / Without Project Situation:Assumptions
Economic Value per Day Days / Month / Household Economic Value per Month Months Migration / Year Economic Value per Household Households per Village Households per Village Migrating
Total Without Project Benefits
After / With Project Situation:Assumptions
Economic Value per Day \1Days / Month / Household Economic Value per Month Months Migration / Year Economic Value per Household Households per Village Households per Village Migrating
Subtotal Migration Income
Other Income
Total With Project Benefits
Incremental Benefits
Source:
1\ Financial Wages (Rs/day):Skill Labour - Rs 160
Casual Labour :Male - Rs 40Female - Rs 30
GVT - M Pradesh - Jhabua: Village Chamjhar: Incremental Migration Support Benefit Stream (Rs'000).
Year 1 Year 2 Year 3 Year 4 Year 5 Year 6 Year 7 Year 8 Year 9 Year 101999/00 2000/01 2001/02 2002/03 2003/04 2004/05 2005/06 2006/07 2007/08 2008/09
- - - - - - - - - -
- - - - - - - - - -
- - - - - - - - - -
- - - - - - - - - -
- - - - - - - - - -
Cost Benefit Analysis (CBA) Study Estimate Jan 2005.
Benefit Streams (Rs '000)

Table AN12.6.11 GVT - M Pradesh - Jhabua: Village Chamjhar: Weighted Household Crop Net Margin Summary (Rs/Household).
Item WBR(%) Khalif Rabi Total Khalif Rabi Total Khalif Rabi Total
Phase IIWell Being Ranking - Very Poor
Household Net Margin (Rs) 25.0% 834.6 102.5 937.1 1,849.8 1,067.8 2,917.6 1,015.2 965.3 1,980.5 Well Being Ranking - Poor
Household Net Margin (Rs) 25.0% 637.7 - 637.7 4,803.0 220.7 5,023.7 4,165.3 220.7 4,386.0 Well Being Ranking - Moderate
Household Net Margin (Rs) 31.0% 994.0 89.3 1,083.3 3,711.4 2,508.3 6,219.6 2,717.4 2,419.0 5,136.4 Well Being Ranking - Better Off
Household Net Margin (Rs) 19.0% 6,180.9 6,180.9 6,180.9 6,180.9 6,180.9 6,180.9 6,180.9 6,180.9 6,180.9
Well Being Ranking - WeightedHousehold Net Margin (Rs) 100.0% 1,850.6 1,227.7 3,078.2 3,988.1 2,274.0 6,262.1 2,137.5 1,046.4 3,183.9
Phase I \1Well Being Ranking - Very Poor
Household Net Margin (Rs) 25.0% 436.3 267.5 703.8 3,866.5 1,668.8 5,535.3 3,430.3 1,401.3 4,831.5 Well Being Ranking - Poor
Household Net Margin (Rs) 25.0% 485.8 657.5 1,143.3 10,136.0 5,690.3 15,826.3 9,650.3 5,032.8 14,683.0 Well Being Ranking - Moderate
Household Net Margin (Rs) 31.0% 986.3 986.3 986.3 986.3 986.3 986.3 986.3 986.3 986.3 Well Being Ranking - Better Off
Household Net Margin (Rs) 19.0% 2,778.0 937.0 3,715.0 4,915.0 9,560.0 14,475.0 2,137.0 8,623.0 10,760.0
Well Being Ranking - WeightedHousehold Net Margin (Rs) 100.0% 1,064.1 715.0 1,473.3 4,740.2 3,961.9 8,396.4 3,981.9 3,552.6 7,228.8
Source: Study of Impact of WIRFP on Net Incomes of Target Households, Jan 2004.WBR = GVT Household Well Being Ranking. Survey figures adjusted to Village Profile WBR.\1 GVT - Madhya Pradesh - Phase I: Village Naganwat Choti: Weighted Household Crop Net Margin Summary.
Before / Without Project After / With Project Increment

Table A12.6.12 GVT - M Pradesh - Jhabua: Village Chamjhar: Weighted Household Crop Net Margin Sensitivity Analysis (Rs/Household).
Item EIRR \1Khalif Rabi Total Khalif Rabi Total Khalif Rabi Total
Development Activity:Crop Technology, SWC and WRD
Weighted Net Margin (Phase II)Household Net Margin (Rs) 1,850.6 1,227.7 3,078.2 3,988.1 2,274.0 6,262.1 2,137.5 1,046.4 3,183.9 Incremental Benefit (Phase II / Phase I) 44%
Base Case AssumptionsHousehold Net Margin (Rs) 1,850.6 1,227.7 3,078.2 3,988.1 2,274.0 6,262.1 2,137.5 1,046.4 3,183.9 Incremental Benefit (Phase II / Phase I) 44%Sensitivity Increase (%) 0%Development Activity N/AOverall Village N/A
Sensitivity AssumptionsHousehold Net Margin (Rs) 1,850.6 1,227.7 3,078.2 7,577.4 4,320.7 11,898.0 5,726.8 3,093.0 8,819.8 Incremental Benefit (Phase II / Phase I) 122%Sensitivity Increase (%) 0%Development Activity 19%Overall Village 12%
Weighted Net Margin (Phase I) 1,064.1 715.0 1,473.3 4,740.2 3,961.9 8,396.4 3,981.9 3,552.6 7,228.8 Household Net Margin (Rs)
Source: Study of Impact of WIRFP on Net Incomes of Target Households, Jan 2004.\1 EIRR = Economic Internal Rate of Return (rate at which NPV equal to zero).
N/A = Not analysed as EIRR negative.
Before / Without Project After / With Project Increment

Table AN12.6.13 GVT - M Pradesh - Jhabua: Village Chamjhar: Weighted Household Livestock Net Margin Summary (Rs/Household).
Well Being Ranking Weight(%) Herd Value Net Margin Herd Value Net Margin Herd Value Net Margin
Phase I - Well Being Ranking (WBR) \1Madhya Pradesh - WBR Weighted DataVery Poor 16.0%
Average 580 (185.0) 5,650 412.5 474 597.5 Poor 63.0%
Average 2,350 982.5 8,250 2,141.0 1,180 1,158.5 Moderate 18.0%
Average 14,700 6,730.0 1,900 2,820.0 1,900 (3,910.0)Better Off 3.0%
Average 15,580 3,000.0 14,600 10,790.0 (196) 7,790.0
Phase I - WBR Weighted Data 100.0% 4,687 1,890.8 6,882 2,246.1 1,155 355.4
Phase II - Well Being Ranking (WBR)
Very Poor 16.0%Average 5,756 149.2 10,970 1,446.4 1,043 1,297.2
Poor 63.0%Average 13,128 852.2 25,979 3,008.8 2,570 2,156.8
Moderate 18.0%Average 13,525 4,035.1 27,020 5,249.5 2,699 1,214.4
Better Off 3.0%Average 12,700 (781.7) 41,873 2,573.3 5,835 3,355.0
Phase II - WBR Weighted Data 100.0% 12,007 1,263.6 24,242 3,149.1 2,447 1,885.6
Source: Study of Impact of WIRFP on Net Incomes of Target Households, Jan 2004.WBR = GVT Household Well Being Ranking. Survey figures adjusted to Village Profile WBR.
\1 GVT - Madhya Pradesh - Phase I: Village Naganwat Choti: Weighted Household Livestock Net Margin Summary.
Before / Without Project After / With Project Increment \1

WIRFP - Phase II - Cost Benefit Analysis Study
Tables AN12.0 Individual Village Cost Benefit Analysis
Tables AN12.7 GVT - Madhya Pradesh - Jhabua: Village Chenpura.
Table AN12.7.1 GVT - M Pradesh - Jhabua: Village Chenpura: Village Profile.
Table AN12.7.2 GVT - M Pradesh - Jhabua: Village Chenpura: Cost Benefit Analysis Summary (Rs'000).Table AN12.7.3 GVT - M Pradesh - Jhabua: Village Chenpura: Cost Benefit Analysis Development Activity Summary A (Rs'000).Table AN12.7.4 GVT - M Pradesh - Jhabua: Village Chenpura: Cost Benefit Analysis Development Activity Summary B (Rs'000).
Table AN12.7.5 GVT - M Pradesh - Jhabua: Village Chenpura: Costs - Financial (Rs'000).GVT - M Pradesh - Jhabua: Village Chenpura: Costs - Economic (Rs'000).
Table AN12.7.6 GVT - M Pradesh - Jhabua: Village Chenpura: VOD Household Assumptions.GVT - M Pradesh - Jhabua: Village Chenpura: Incremental VOD Benefit Stream (Rs'000).
Table AN12.7.7 GVT - M Pradesh - Jhabua: Village Chenpura: Household Crop Net Margin Assumptions.GVT - M Pradesh - Jhabua: Village Chenpura: Incremental Crop Benefit Stream (Rs'000).
Table AN12.7.8 GVT - M Pradesh - Jhabua: Village Chenpura: Household Livestock Net Margin Assumptions.GVT - M Pradesh - Jhabua: Village Chenpura: Incremental Livestock Benefit Stream (Rs'000).
Table AN12.7.9 GVT - M Pradesh - Jhabua: Village Chenpura: Forestry Benefit Assumptions.GVT - M Pradesh - Jhabua: Village Chenpura: Incremental Forestry Benefit Stream (Rs'000).
Table AN12.7.10 GVT - M Pradesh - Jhabua: Village Chenpura: Migration Support Benefit Assumptions.GVT - M Pradesh - Jhabua: Village Chenpura: Incremental Migration Support Benefit Stream (Rs'000).
Table AN12.7.11 GVT - M Pradesh - Jhabua: Village Chenpura: Weighted Household Crop Net Margin Summary (Rs/Household).Table AN12.7.12 GVT - M Pradesh - Jhabua: Village Chenpura: Weighted Household Crop Net Margin Sensitivity Analysis (Rs/Household).
Table AN12.7.13 GVT - M Pradesh - Jhabua: Village Chenpura: Weighted Household Livestock Net Margin Summary (Rs/Household).

Table AN12.7.1 GVT - M Pradesh - Jhabua: Village Chenpura: Village Profile.
Village Profile \1
A. Background F. Land Resource (ha)Village Name Chenpura Total Area - District Jhabua Revenue Land (unused) - State M Pradesh Forest Area - Revenue -
Pasture Land - B. Participatory Planning Process (PPP) Arable Land -
Village entry Jan-00 - PRA Aug-00CPA Sep-00 G. Livestock
OxenC. Infrastructure Cows
Hand Pumps (no) 7 BuffaloWells (no) 6 GoatsLinked by Road No PoultryElectrification YesSchool Primary H. Self Help Groups (No Households)
1 Group 1 11 D. Demographic Data 2 Group 2 17
Households (no) 265 3 Group 3 10 Participating Households 160 4 Group 4 14 Population (Adults) 1,500 5 Group 5 15
Adults: 6 Group 6 10 Male 700 7 Group 7 12 Female 800 8 Group 8 10 Children: 9 Group 9 11 Boys N/A 10 Group 10 10 Girls N/A 11 Group 11 15
12 Group 12 16 E. Well Being Ranking (No Households) 13 Group 13 10
Very Poor 21 28.4% 14 Group 14 12 Poor 37 50.0% 15 Group 15 10 Moderate 11 14.9% 16 Group 16 10 Better Off 5 6.8% Total Memberhip 193 Total 74 100%
Source: GVT Jhabua Coordination Office - Madhya Pradesh.\1 Subject to final adjustment following consolidation exercise prior to Annual Review Meeting (ARM) in Feb 2005.

Table AN12.7.2 GVT - M Pradesh - Jhabua: Village Chenpura: Cost Benefit Analysis Summary (Rs'000).
Administration Costs / Development Activity EIRR \1 Year 1 Year 2 Year 3 Year 4 Year 5 Year 6 Year 7 Year 8 Year 9 Year 10(10%) (%) 1999/00 2000/01 2001/02 2002/03 2003/04 2004/05 2005/06 2006/07 2007/08 2008/09
A. Administration CostsTotal A N/A (985) -103% 35.9 227.2 236.8 235.6 317.7 236.8 206.7 20.7 20.7 20.7
B. Development Activities Component A1. PPGF
Net Incremental Benefits N/A (63) -7% - (15.8) (16.3) (27.9) (11.1) (9.1) (10.0) (2.1) (2.1) (2.1)
2. VODNet Incremental Benefits 33% 207 22% - (19.5) (2.8) (95.7) (55.8) 69.4 71.3 85.3 85.7 86.0
3/5.Crop Technology, SWC and WRDNet Incremental Benefits 23% 748 78% - - (210.6) (616.9) (739.0) 247.8 460.7 473.3 473.3 473.3
6. LivestockNet Incremental Benefits 108% 1,020 107% - - (31.5) (68.5) 63.8 182.4 281.7 285.6 285.6 285.6
7. ForestryNet Incremental Benefits 14% 26 3% - - (195.4) (123.0) 3.9 64.2 54.6 63.3 63.3 63.3
8. Migration SupportNet Incremental Benefits 26% 4 0% - - - (1.8) (4.7) 0.3 2.3 2.3 2.3 2.3
SummaryNet Incremental Benefits 18% 956 100% (35.9) (262.5) (693.4) (1,169.4) (1,060.4) 318.2 654.0 887.0 887.3 887.7
Sensitivity AnalysisAnalysis Period
12 Years 10% (176)20 Years (Base Case) 18% 956 25 Years 19% 1,288 30 Years 19% 1,476
Costs - AdministrationInvestment Costs Decreased by 20 percent 19% 1,116
Costs - Adsministration and DevelopmentRecurrent Costs Increased by 20 percent 16% 677
Benefits - Crop, SWC and WRDCrop Benefits Increased by 20 percent 20% 1,474 Livestock Benefits Increased by 20 percent 19% 1,251
Source: Cost Benefit Analysis (CBA) Study Estimate Jan 2005.\1 EIRR = Economic Internal Rate of Return (rate at which NPV equal to zero).\2 NPV = Net Present Value of net incremental benefits at 12% (indicative opportunity cost of capital for rural development projects in India).
N/A = Not analysed as EIRR negative.
NPV \2
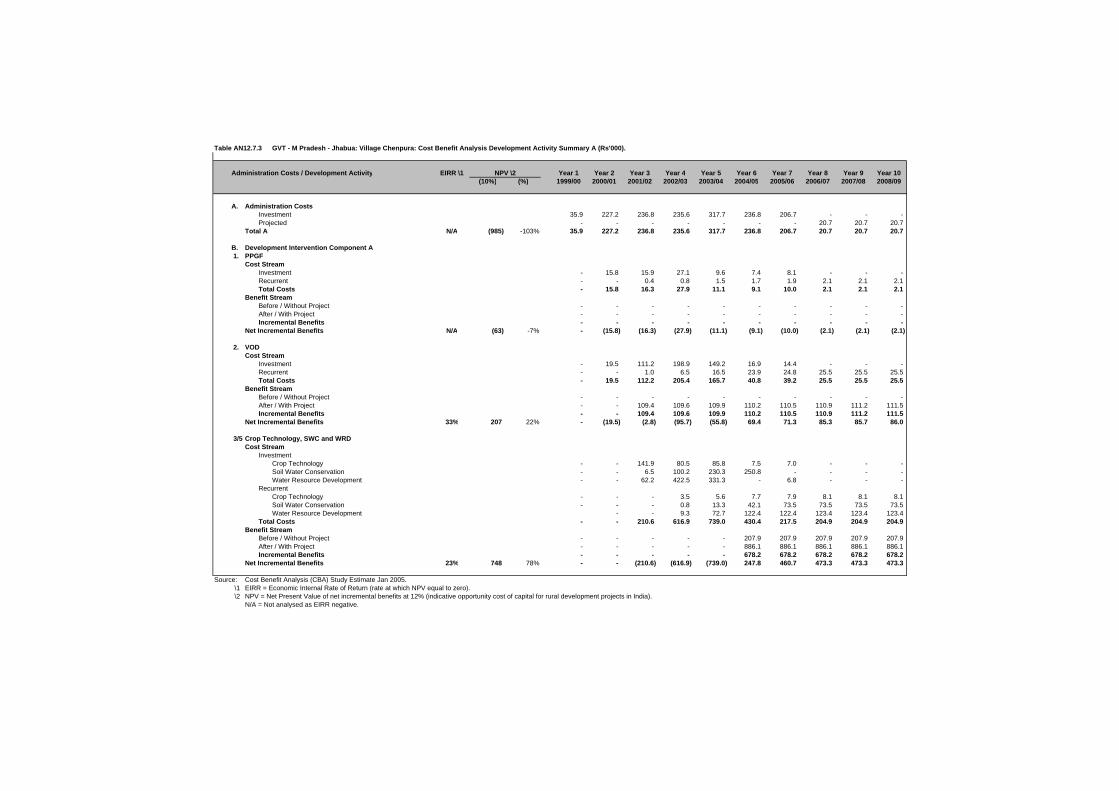
Table AN12.7.3 GVT - M Pradesh - Jhabua: Village Chenpura: Cost Benefit Analysis Development Activity Summary A (Rs'000).
Administration Costs / Development Activity EIRR \1 Year 1 Year 2 Year 3 Year 4 Year 5 Year 6 Year 7 Year 8 Year 9 Year 10(10%) (%) 1999/00 2000/01 2001/02 2002/03 2003/04 2004/05 2005/06 2006/07 2007/08 2008/09
A. Administration CostsInvestment 35.9 227.2 236.8 235.6 317.7 236.8 206.7 - - - Projected - - - - - - - 20.7 20.7 20.7
Total A N/A (985) -103% 35.9 227.2 236.8 235.6 317.7 236.8 206.7 20.7 20.7 20.7
B. Development Intervention Component A1. PPGF
Cost StreamInvestment - 15.8 15.9 27.1 9.6 7.4 8.1 - - - Recurrent - - 0.4 0.8 1.5 1.7 1.9 2.1 2.1 2.1 Total Costs - 15.8 16.3 27.9 11.1 9.1 10.0 2.1 2.1 2.1
Benefit StreamBefore / Without Project - - - - - - - - - - After / With Project - - - - - - - - - - Incremental Benefits - - - - - - - - - -
Net Incremental Benefits N/A (63) -7% - (15.8) (16.3) (27.9) (11.1) (9.1) (10.0) (2.1) (2.1) (2.1)
2. VODCost Stream
Investment - 19.5 111.2 198.9 149.2 16.9 14.4 - - - Recurrent - - 1.0 6.5 16.5 23.9 24.8 25.5 25.5 25.5 Total Costs - 19.5 112.2 205.4 165.7 40.8 39.2 25.5 25.5 25.5
Benefit StreamBefore / Without Project - - - - - - - - - - After / With Project - - 109.4 109.6 109.9 110.2 110.5 110.9 111.2 111.5 Incremental Benefits - - 109.4 109.6 109.9 110.2 110.5 110.9 111.2 111.5
Net Incremental Benefits 33% 207 22% - (19.5) (2.8) (95.7) (55.8) 69.4 71.3 85.3 85.7 86.0
3/5.Crop Technology, SWC and WRDCost Stream
InvestmentCrop Technology - - 141.9 80.5 85.8 7.5 7.0 - - - Soil Water Conservation - - 6.5 100.2 230.3 250.8 - - - - Water Resource Development - - 62.2 422.5 331.3 - 6.8 - - -
RecurrentCrop Technology - - - 3.5 5.6 7.7 7.9 8.1 8.1 8.1 Soil Water Conservation - - - 0.8 13.3 42.1 73.5 73.5 73.5 73.5 Water Resource Development - - 9.3 72.7 122.4 122.4 123.4 123.4 123.4
Total Costs - - 210.6 616.9 739.0 430.4 217.5 204.9 204.9 204.9 Benefit Stream
Before / Without Project - - - - - 207.9 207.9 207.9 207.9 207.9 After / With Project - - - - - 886.1 886.1 886.1 886.1 886.1 Incremental Benefits - - - - - 678.2 678.2 678.2 678.2 678.2
Net Incremental Benefits 23% 748 78% - - (210.6) (616.9) (739.0) 247.8 460.7 473.3 473.3 473.3
Source: Cost Benefit Analysis (CBA) Study Estimate Jan 2005.\1 EIRR = Economic Internal Rate of Return (rate at which NPV equal to zero).\2 NPV = Net Present Value of net incremental benefits at 12% (indicative opportunity cost of capital for rural development projects in India).
N/A = Not analysed as EIRR negative.
NPV \2

Table AN12.7.4 GVT - M Pradesh - Jhabua: Village Chenpura: Cost Benefit Analysis Development Activity Summary B (Rs'000).
Administration Costs / Development Activity EIRR \1 Year 1 Year 2 Year 3 Year 4 Year 5 Year 6 Year 7 Year 8 Year 9 Year 10(10%) (%) 1999/00 2000/01 2001/02 2002/03 2003/04 2004/05 2005/06 2006/07 2007/08 2008/09
6. LivestockCost Stream
Investment - - 31.5 65.3 16.7 - 4.3 - - - Recurrent - - 3.2 9.7 11.4 11.4 11.8 11.8 11.8 Total Costs - - 31.5 68.5 26.4 11.4 15.7 11.8 11.8 11.8
Benefit StreamBefore / Without Project - - - - 162.9 162.9 162.9 162.9 162.9 162.9 After / With Project - - - - 253.2 356.7 460.3 460.3 460.3 460.3 Incremental Benefits - - - - 90.2 193.8 297.4 297.4 297.4 297.4
Net Incremental Benefits 108% 1,020 107% - - (31.5) (68.5) 63.8 182.4 281.7 285.6 285.6 285.6
7. ForestryCost Stream
Investment - - 195.4 160.7 41.6 - 9.6 - - - Recurrent - - 19.5 35.6 39.8 39.8 40.7 40.7 40.7 Total Costs - - 195.4 180.2 77.2 39.8 49.4 40.7 40.7 40.7
Benefit StreamBefore / Without Project - - - - - - - - - - After / With Project - - - 57.2 81.1 104.0 104.0 104.0 104.0 104.0 Incremental Benefits - - - 57.2 81.1 104.0 104.0 104.0 104.0 104.0
Net Incremental Benefits 14% 26 3% - - (195.4) (123.0) 3.9 64.2 54.6 63.3 63.3 63.3
8. Migration SupportCost Stream
Investment - - - 1.8 4.5 2.3 - - - - Recurrent - - - 0.2 0.6 0.9 0.9 0.9 0.9 Total Costs - - - 1.8 4.7 2.9 0.9 0.9 0.9 0.9
Benefit StreamBefore / Without Project - - - - - 28.8 28.8 28.8 28.8 28.8 After / With Project - - - - - 31.9 31.9 31.9 31.9 31.9 Incremental Benefits - - - - - 3.1 3.1 3.1 3.1 3.1
Net Incremental Benefits 26% 4 0% - - - (1.8) (4.7) 0.3 2.3 2.3 2.3 2.3
SummaryCost Stream
Investment 35.9 262.5 801.4 1,292.5 1,186.7 521.5 256.9 - - - Recurrent - - 1.4 43.7 155.0 249.6 282.4 306.6 306.6 306.6 Total Costs 35.9 262.5 802.8 1,336.2 1,341.7 771.2 539.3 306.6 306.6 306.6
Benefit StreamBefore / Without Project - - - - 162.9 399.6 399.6 399.6 399.6 399.6 After / With Project - - 109.4 166.8 444.2 1,489.0 1,592.9 1,593.2 1,593.5 1,593.9 Incremental Benefits - - 109.4 166.8 281.3 1,089.4 1,193.3 1,193.6 1,193.9 1,194.2
Net Incremental Benefits 18% 956 100% (35.9) (262.5) (693.4) (1,169.4) (1,060.4) 318.2 654.0 887.0 887.3 887.7
Source: Cost Benefit Analysis (CBA) Study Estimate Jan 2005.
NPV \2

Table AN12.7.5 GVT - M Pradesh - Jhabua: Village Chenpura: Costs - Financial (Rs'000).
Cost Head / Subhead 1999/00 2000/01 2001/02 2002/03 2003/04 2004/05 2005/06Actual Actual Actual Actual Actual Budget Budget (Rs'000) (%)
A. Administration CostsGVT Bhopal (PHQ) - 60.3 75.4 67.3 52.8 66.8 61.1 383.7 7%DFIDI Consultancy 35.9 71.4 26.9 63.2 47.4 54.7 39.2 338.6 6%Jhabua Coordination Office - 112.9 157.8 124.3 247.5 135.5 125.0 903.0 17%
Total A 35.9 244.5 260.2 254.8 347.7 257.0 225.3 1,625.4 31%
B. Development CostsComponent A 1. PPGF - 17.5 17.7 30.1 10.7 8.2 9.0 93.2 2% 2. VOD - 21.7 123.5 221.0 165.8 18.8 16.0 566.8 11% 3. Crop Technology - - 157.6 89.4 95.3 8.3 7.7 358.4 7% 4. SWC - - 9.6 148.5 341.2 371.5 - 870.8 16% 5. WRD - - 92.2 625.9 490.8 - 10.0 1,218.9 23% 6. Livestock - - 35.0 72.6 18.6 - 4.8 130.9 2% 7. Forestry - - 217.1 178.5 46.2 - 10.7 452.5 8%8. Migration Support - - - 2.0 5.0 2.5 - 9.5 0%
Subtotal - 39.2 652.8 1,367.9 1,173.6 409.3 58.2 3,700.9 69%
Other Development CostsSubtotal - - - - - - - - 0%
Total B - 39.2 652.8 1,367.9 1,173.6 409.3 58.2 3,700.9 69%
Total A + B 35.9 283.7 912.9 1,622.7 1,521.3 666.3 283.5 5,326.3 100%
GVT - 212.1 791.4 1,382.1 1,284.4 553.3 239.2 4,462.5 84%DFIDI 35.9 71.4 26.9 63.2 47.4 54.7 39.2 338.6 6%Community - - 78.8 172.2 178.3 57.7 3.1 490.2 9%Government - 0.2 15.8 5.1 11.1 0.6 2.1 35.0 1%
Source: GVT Jhabua Coordination Office - Madhya Pradesh.
DFIDI = Department for International Development (India).PPGF = Participatory Planning and Group Formation.VOD = Village Organisation and Development.SWC = Soil and Water Conservation.WRD = Water Resource Development.
Totals

Table AN12.7.5
Cost Head / Subhead
A. Administration CostsGVT Bhopal (PHQ)DFIDI ConsultancyJhabua Coordination Office
Total A
B. Development CostsComponent A 1. PPGF 2. VOD 3. Crop Technology 4. SWC 5. WRD 6. Livestock 7. Forestry8. Migration Support
Subtotal
Other Development CostsSubtotal
Total B
Total A + B
GVTDFIDICommunityGovernment
Source:
DFIDI = Department for International Development (India).PPGF = Participatory Planning and Group Formation.VOD = Village Organisation and Development.SWC = Soil and Water Conservation.WRD = Water Resource Development.
GVT - M Pradesh - Jhabua: Village Chenpura: Costs - Economic (Rs'000).
1999/00 2000/01 2001/02 2002/03 2003/04 2004/05 2005/06CF SCF Actual Actual Actual Actual Actual Budget Budget (Rs'000) (%)
0.90 1.00 - 54.2 67.9 60.6 47.5 60.1 55.0 345.4 8%1.00 1.00 35.9 71.4 26.9 63.2 47.4 54.7 39.2 338.6 8%0.90 1.00 - 101.6 142.0 111.9 222.7 122.0 112.5 812.7 19%
35.9 227.2 236.8 235.6 317.7 236.8 206.7 1,496.7 34%
0.90 1.00 - 15.8 15.9 27.1 9.6 7.4 8.1 83.9 2%0.90 1.00 - 19.5 111.2 198.9 149.2 16.9 14.4 510.1 12%0.90 1.00 - - 141.9 80.5 85.8 7.5 7.0 322.6 7%0.90 0.75 - - 6.5 100.2 230.3 250.8 - 587.8 13%0.90 0.75 - - 62.2 422.5 331.3 - 6.8 822.7 19%0.90 1.00 - - 31.5 65.3 16.7 - 4.3 117.8 3%0.90 1.00 - - 195.4 160.7 41.6 - 9.6 407.2 9%0.90 1.00 - - - 1.8 4.5 2.3 - 8.6 0%
- 35.3 564.6 1,056.9 869.0 284.7 50.1 2,860.7 66%
0.90 1.00 - - - - - - - - 0% - 35.3 564.6 1,056.9 869.0 284.7 50.1 2,860.7 66%
35.9 262.5 801.4 1,292.5 1,186.7 521.5 256.9 4,357.4 100%
- - - - - - - N/A - - - - - - - N/A - - - - - - - N/A - - - - - - - N/A
Cost Benefit Analysis (CBA) Study Estimate Jan 2005.
TotalsConversion Factors

Table AN12.7.6 GVT - M Pradesh - Jhabua: Village Chenpura: VOD Household Assumptions.
Without \ With Project UnitsVillage Organisation and Development Year 1 Year 2 Year 3
(Rs) (Rs) (Rs)
Development Activity:Village Organisation and Development
Before / Without Project Situation:
A. Self Help Groups (SHGs)Assumption Sum Zero Zero Zero - - -
B. Drudgery ReductionAssumption Sum Zero Zero Zero
Total Without Project Benefits - - -
After / With Project Situation:
A. Self Help Groups (SHGs)Assumptions
Average Saving / Household Rs 1,951 Households / Village No 160 Present Group Deposits Rs'000 312.1 312.1 321.5 331.1 Annual Savings Increase % 3%Deposits on Loan to Members % 20%SHG Interest Income % / Year 15%Assumed Benefit Rs'000 9.4 9.6 9.9
B. Drudgery ReductionAssumptions
Hours Saved / Day / Household No 1.0 Number of Days / Year / Household No 200 Days / Year / Household (8hrs/day) No 25.0 Households / Village No 160 Day Equivalent / Village No 4,000 Economic Value per Day (Rs/day) 25 Assumed Benefit Rs'000 100.0 100.0 100.0
Total With Project Benefits Rs'000 109.4 109.6 109.9
Incremental Benefits Rs'000 109.4 109.6 109.9
Source: Cost Benefit Analysis (CBA) Study Estimate Jan 2005.SWC = Soil and Water Conservation.Participating households per village: Chenpura 160
Assumptions Benefits

Table AN12.7.6
Without \ With ProjectVillage Organisation and Development
Development Activity:Village Organisation and Development
Before / Without Project Situation:
A. Self Help Groups (SHGs)Assumption
B. Drudgery ReductionAssumption
Total Without Project Benefits
After / With Project Situation:
A. Self Help Groups (SHGs)Assumptions
Average Saving / HouseholdHouseholds / VillagePresent Group DepositsAnnual Savings IncreaseDeposits on Loan to MembersSHG Interest Income Assumed Benefit
B. Drudgery ReductionAssumptions
Hours Saved / Day / HouseholdNumber of Days / Year / HouseholdDays / Year / Household (8hrs/day)Households / VillageDay Equivalent / VillageEconomic Value per DayAssumed Benefit
Total With Project Benefits
Incremental Benefits
Source:SWC = Soil and Water Conservation.Participating households per village: Chenpura
GVT - M Pradesh - Jhabua: Village Chenpura: Incremental VOD Benefit Stream (Rs'000).
Year 1 Year 2 Year 3 Year 4 Year 5 Year 6 Year 7 Year 8 Year 9 Year 101999/00 2000/01 2001/02 2002/03 2003/04 2004/05 2005/06 2006/07 2007/08 2008/09
- - - - - - - - - -
- - 312.1 321.5 331.1 341.0 351.3 361.8 372.7 383.8
- - 9.4 9.6 9.9 10.2 10.5 10.9 11.2 11.5
- - 100.0 100.0 100.0 100.0 100.0 100.0 100.0 100.0
- - 109.4 109.6 109.9 110.2 110.5 110.9 111.2 111.5
- - 109.4 109.6 109.9 110.2 110.5 110.9 111.2 111.5
Cost Benefit Analysis (CBA) Study Estimate Jan 2005.
Benefit Streams (Rs '000)

Table AN12.7.7 GVT - M Pradesh - Jhabua: Village Chenpura: Household Crop Net Margin Assumptions.
Without \ With Project UnitsCrop Technology, SWC and WRD Year 1 Year 2 Year 3
(Rs/HH) (Rs/HH) (Rs/HH)
Development Activity:Crop Technology, SWC and WRD
Before / Without Project Situation:Assumptions
Households (HHs) No 160 Crop Adoption Assumptions 100% 100% 100%
Kharif Crop Net Margin Rs/HH 1,134.3 1,134.3 1,134.3
Rabi Crop Net Margin Rs/HH 165.1 165.1 165.1 Total Without Project Benefits Rs/HH 1,299.3 1,299.3 1,299.3
After / With Project Situation:Assumptions
Households (HHs) No 160 Crop Adoption Assumptions 100% 100% 100%
Kharif Crop Net Margin Rs/HH 4,609.9 4,609.9 4,609.9
Rabi Crop Net Margin Rs/HH 928.3 928.3 928.3 Total With Project Benefits Rs/HH 5,538.2 5,538.2 5,538.2
Incremental Benefits Rs/HH 4,238.8 4,238.8 4,238.8
Source: Cost Benefit Analysis (CBA) Study Estimate Jan 2005.
BenefitsAssumptions

Table AN12.7.7
Without \ With ProjectCrop Technology, SWC and WRD
Development Activity:Crop Technology, SWC and WRD
Before / Without Project Situation:Assumptions
Households (HHs)Crop Adoption Assumptions
Kharif Crop Net Margin
Rabi Crop Net MarginTotal Without Project Benefits
After / With Project Situation:Assumptions
Households (HHs)Crop Adoption Assumptions
Kharif Crop Net Margin
Rabi Crop Net MarginTotal With Project Benefits
Incremental Benefits
Source:
GVT - M Pradesh - Jhabua: Village Chenpura: Incremental Crop Benefit Stream (Rs'000).
Year 1 Year 2 Year 3 Year 4 Year 5 Year 6 Year 7 Year 8 Year 9 Year 101999/00 2000/01 2001/02 2002/03 2003/04 2004/05 2005/06 2006/07 2007/08 2008/09
- - - - - 181.5 181.5 181.5 181.5 181.5
- - - - - 26.4 26.4 26.4 26.4 26.4 - - - - - 207.9 207.9 207.9 207.9 207.9
- - - - - 737.6 737.6 737.6 737.6 737.6
- - - - - 148.5 148.5 148.5 148.5 148.5 - - - - - 886.1 886.1 886.1 886.1 886.1
- - - - - 678.2 678.2 678.2 678.2 678.2
Cost Benefit Analysis (CBA) Study Estimate Jan 2005.
Benefit Streams (Rs '000)

Table AN12.7.8 GVT - M Pradesh - Jhabua: Village Chenpura: Household Livestock Net Margin Assumptions.
Without \ With Project UnitsLivestock Year 1 Year 2 Year 3
(Rs) (Rs) (Rs)
Development Activity:Livestock
Before / Without Project Situation:Assumptions
Households (HHs) No 160 Annual Livestock Net Margin Rs/HH
Total Without Project Benefits 1,018.4 1,018.4 1,018.4
After / With Project Situation:
Development Activity:Assumptions
Households (HHs) No 160 Adoption Assumptions Percent 55% 78% 100%
Annual Livestock Net Margin Rs/HHTotal With Project Benefits 1,582.3 2,229.6 2,877.0
Incremental Benefits Rs/HH 563.9 1,211.2 1,858.5
Source: Cost Benefit Analysis (CBA) Study Estimate Jan 2005.
BenefitsAssumptions

Table AN12.7.8
Without \ With ProjectLivestock
Development Activity:Livestock
Before / Without Project Situation:Assumptions
Households (HHs)Annual Livestock Net Margin
Total Without Project Benefits
After / With Project Situation:
Development Activity:Assumptions
Households (HHs)Adoption Assumptions
Annual Livestock Net MarginTotal With Project Benefits
Incremental Benefits
Source:
GVT - M Pradesh - Jhabua: Village Chenpura: Incremental Livestock Benefit Stream (Rs'000).
Year 1 Year 2 Year 3 Year 4 Year 5 Year 6 Year 7 Year 8 Year 9 Year 101999/00 2000/01 2001/02 2002/03 2003/04 2004/05 2005/06 2006/07 2007/08 2008/09
- - - - 162.9 162.9 162.9 162.9 162.9 162.9
- - - - 253.2 356.7 460.3 460.3 460.3 460.3
- - - - 90.2 193.8 297.4 297.4 297.4 297.4
Cost Benefit Analysis (CBA) Study Estimate Jan 2005.
Benefit Streams (Rs '000)

Table AN12.7.9 GVT - M Pradesh - Jhabua: Village Chenpura: Forestry Benefit Assumptions.
Without \ With Project UnitsForestry Year 1 Year 2 Year 3
(Rs) (Rs) (Rs)
Development Activity:Forestry
Before / Without Project Situation:AssumptionsHouseholds (HHs) No 160 Annual Forestry Net Margin Rs/HH
Total Without Project Benefits - - -
After / With Project Situation:AssumptionsHouseholds (HHs) No 160 Adoption Assumptions Percent 55% 78% 100%Annual Forestry Net Margin Rs/HH
Total With Project Benefits 357.5 507.0 650.0
Incremental Benefits Rs/HH 357.5 507.0 650.0
Source: Cost Benefit Analysis (CBA) Study Estimate Jan 2005.
BenefitsAssumptions

Table AN12.7.9
Without \ With ProjectForestry
Development Activity:Forestry
Before / Without Project Situation:AssumptionsHouseholds (HHs)Annual Forestry Net Margin
Total Without Project Benefits
After / With Project Situation:AssumptionsHouseholds (HHs)Adoption AssumptionsAnnual Forestry Net Margin
Total With Project Benefits
Incremental Benefits
Source:
GVT - M Pradesh - Jhabua: Village Chenpura: Incremental Forestry Benefit Stream (Rs'000).
Year 1 Year 2 Year 3 Year 4 Year 5 Year 6 Year 7 Year 8 Year 9 Year 101999/00 2000/01 2001/02 2002/03 2003/04 2004/05 2005/06 2006/07 2007/08 2008/09
- - - - - - - - - -
- - - 57.2 81.1 104.0 104.0 104.0 104.0 104.0
- - - 57.2 81.1 104.0 104.0 104.0 104.0 104.0
Cost Benefit Analysis (CBA) Study Estimate Jan 2005.
Benefit Streams (Rs '000)

Table AN12.7.10 GVT - M Pradesh - Jhabua: Village Chenpura: Migration Support Benefit Assumptions.
Without \ With ProjectMigration Support Year 1 Year 2 Year 3
(Rs) (Rs) (Rs)
Development Activity:Migration Support
Before / Without Project Situation:Assumptions
Economic Value per Day Rs/day 25.0 Days / Month / Household No 18 Economic Value per Month Rs/month 450.0 Months Migration / Year Months 4.0 Economic Value per Household Rs/HH 1,800.0 Households per Village No 160 Households per Village Migrating Percent 10%
Total Without Project Benefits Rs/Village 28.8 28.8 28.8
After / With Project Situation:Assumptions
Economic Value per Day \1 Rs/day 25.0 30% 32.5 Days / Month / Household No 18 30% 24.0 Economic Value per Month Rs/month 450.0 780.0 Months Migration / Year Months 4.0 -20% 3.2 Economic Value per Household Rs/HH 1,800.0 2,496.0 Households per Village No 160 160 Households per Village Migrating Percent 10% -20% 8%
Subtotal Migration Income Rs/Village 31.9 31.9 31.9
Other Income Sum (Rs) - - - - - -
Total With Project Benefits Rs/Village 31.9 31.9 31.9
Incremental Benefits Rs/Village 3.1 3.1 3.1
Source: Cost Benefit Analysis (CBA) Study Estimate Jan 2005.
1\ Financial Wages (Rs/day):Skill Labour - Rs 160
Casual Labour :Male - Rs 40Female - Rs 30
BenefitsAssumptions

Table AN12.7.10
Without \ With ProjectMigration Support
Development Activity:Migration Support
Before / Without Project Situation:Assumptions
Economic Value per Day Days / Month / Household Economic Value per Month Months Migration / Year Economic Value per Household Households per Village Households per Village Migrating
Total Without Project Benefits
After / With Project Situation:Assumptions
Economic Value per Day \1Days / Month / Household Economic Value per Month Months Migration / Year Economic Value per Household Households per Village Households per Village Migrating
Subtotal Migration Income
Other Income
Total With Project Benefits
Incremental Benefits
Source:
1\ Financial Wages (Rs/day):Skill Labour - Rs 160
Casual Labour :Male - Rs 40Female - Rs 30
GVT - M Pradesh - Jhabua: Village Chenpura: Incremental Migration Support Benefit Stream (Rs'000).
Year 1 Year 2 Year 3 Year 4 Year 5 Year 6 Year 7 Year 8 Year 9 Year 101999/00 2000/01 2001/02 2002/03 2003/04 2004/05 2005/06 2006/07 2007/08 2008/09
- - - - - 28.8 28.8 28.8 28.8 28.8
- - - - - 31.9 31.9 31.9 31.9 31.9
- - - - - - - - - -
- - - - - 31.9 31.9 31.9 31.9 31.9
- - - - - 3.1 3.1 3.1 3.1 3.1
Cost Benefit Analysis (CBA) Study Estimate Jan 2005.
Benefit Streams (Rs '000)
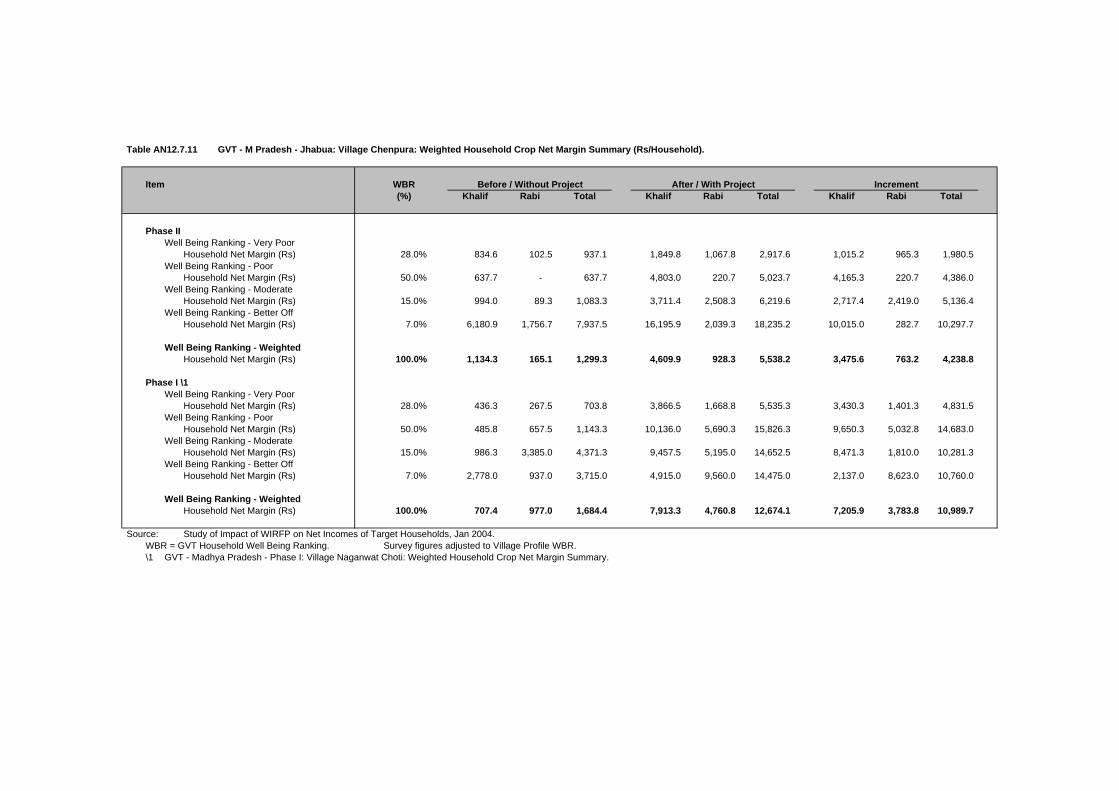
Table AN12.7.11 GVT - M Pradesh - Jhabua: Village Chenpura: Weighted Household Crop Net Margin Summary (Rs/Household).
Item WBR(%) Khalif Rabi Total Khalif Rabi Total Khalif Rabi Total
Phase IIWell Being Ranking - Very Poor
Household Net Margin (Rs) 28.0% 834.6 102.5 937.1 1,849.8 1,067.8 2,917.6 1,015.2 965.3 1,980.5 Well Being Ranking - Poor
Household Net Margin (Rs) 50.0% 637.7 - 637.7 4,803.0 220.7 5,023.7 4,165.3 220.7 4,386.0 Well Being Ranking - Moderate
Household Net Margin (Rs) 15.0% 994.0 89.3 1,083.3 3,711.4 2,508.3 6,219.6 2,717.4 2,419.0 5,136.4 Well Being Ranking - Better Off
Household Net Margin (Rs) 7.0% 6,180.9 1,756.7 7,937.5 16,195.9 2,039.3 18,235.2 10,015.0 282.7 10,297.7
Well Being Ranking - WeightedHousehold Net Margin (Rs) 100.0% 1,134.3 165.1 1,299.3 4,609.9 928.3 5,538.2 3,475.6 763.2 4,238.8
Phase I \1Well Being Ranking - Very Poor
Household Net Margin (Rs) 28.0% 436.3 267.5 703.8 3,866.5 1,668.8 5,535.3 3,430.3 1,401.3 4,831.5 Well Being Ranking - Poor
Household Net Margin (Rs) 50.0% 485.8 657.5 1,143.3 10,136.0 5,690.3 15,826.3 9,650.3 5,032.8 14,683.0 Well Being Ranking - Moderate
Household Net Margin (Rs) 15.0% 986.3 3,385.0 4,371.3 9,457.5 5,195.0 14,652.5 8,471.3 1,810.0 10,281.3 Well Being Ranking - Better Off
Household Net Margin (Rs) 7.0% 2,778.0 937.0 3,715.0 4,915.0 9,560.0 14,475.0 2,137.0 8,623.0 10,760.0
Well Being Ranking - WeightedHousehold Net Margin (Rs) 100.0% 707.4 977.0 1,684.4 7,913.3 4,760.8 12,674.1 7,205.9 3,783.8 10,989.7
Source: Study of Impact of WIRFP on Net Incomes of Target Households, Jan 2004.WBR = GVT Household Well Being Ranking. Survey figures adjusted to Village Profile WBR.\1 GVT - Madhya Pradesh - Phase I: Village Naganwat Choti: Weighted Household Crop Net Margin Summary.
Before / Without Project After / With Project Increment

Table AN12.7.12 GVT - M Pradesh - Jhabua: Village Chenpura: Weighted Household Crop Net Margin Sensitivity Analysis (Rs/Household).
Item EIRRKhalif Rabi Total Khalif Rabi Total Khalif Rabi Total
Development Activity:Crop Technology, SWC and WRD
Weighted Net Margin (Phase II)Household Net Margin (Rs) 1,134.3 165.1 1,299.3 4,609.9 928.3 5,538.2 3,475.6 763.2 4,238.8 Incremental Benefit (Phase II / Phase I) 39%
Base Case AssumptionsHousehold Net Margin (Rs) 1,134.3 165.1 1,299.3 4,609.9 928.3 5,538.2 3,475.6 763.2 4,238.8 Incremental Benefit (Phase II / Phase I) 39%Sensitivity Increase (%) 0%Development Activity 23%Overall Village 18%
Sensitivity AssumptionsHousehold Net Margin (Rs) 1,134.3 165.1 1,299.3 4,609.9 928.3 5,538.2 3,475.6 763.2 4,238.8 Incremental Benefit (Phase II / Phase I) 39%Sensitivity Increase (%) 0%Development Activity 23%Overall Village 18%
Weighted Net Margin (Phase I)Household Net Margin (Rs) 707.4 977.0 1,684.4 7,913.3 4,760.8 12,674.1 7,205.9 3,783.8 10,989.7
Source: Study of Impact of WIRFP on Net Incomes of Target Households, Jan 2004.EIRR = Economic Internal Rate of Return (rate at which NPV equal to zero).
Before / Without Project After / With Project Increment

Table AN12.7.13 GVT - M Pradesh - Jhabua: Village Chenpura: Weighted Household Livestock Net Margin Summary (Rs/Household).
Well Being Ranking Weight(%) Herd Value Net Margin Herd Value Net Margin Herd Value Net Margin
Phase I - Well Being Ranking (WBR) \1Madhya Pradesh - WBR Weighted DataVery Poor 28.0%
Average 580 (185.0) 5,650 412.5 474 597.5 Poor 50.0%
Average 2,350 982.5 8,250 2,141.0 1,180 1,158.5 Moderate 15.0%
Average 14,700 6,730.0 1,900 2,820.0 1,900 (3,910.0)Better Off 7.0%
Average 15,580 3,000.0 14,600 10,790.0 (196) 7,790.0
Phase I - WBR Weighted Data 100.0% 4,633 1,659.0 7,014 2,364.3 994 705.4
Phase II - Well Being Ranking (WBR)
Very Poor 28.0%Average 5,756 149.2 10,970 1,446.4 1,043 1,297.2
Poor 50.0%Average 13,128 852.2 25,979 3,008.8 2,570 2,156.8
Moderate 15.0%Average 13,525 4,035.1 27,020 5,249.5 2,699 1,214.4
Better Off 7.0%Average 12,700 (781.7) 41,873 2,573.3 5,835 3,355.0
Phase II - WBR Weighted Data 100.0% 11,093 1,018.4 23,045 2,877.0 2,390 1,858.6
Source: Study of Impact of WIRFP on Net Incomes of Target Households, Jan 2004.WBR = GVT Household Well Being Ranking. Survey figures adjusted to Village Profile WBR.
\1 GVT - Madhya Pradesh - Phase I: Village Naganwat Choti: Weighted Household Livestock Net Margin Summary.
Before / Without Project After / With Project Increment \1
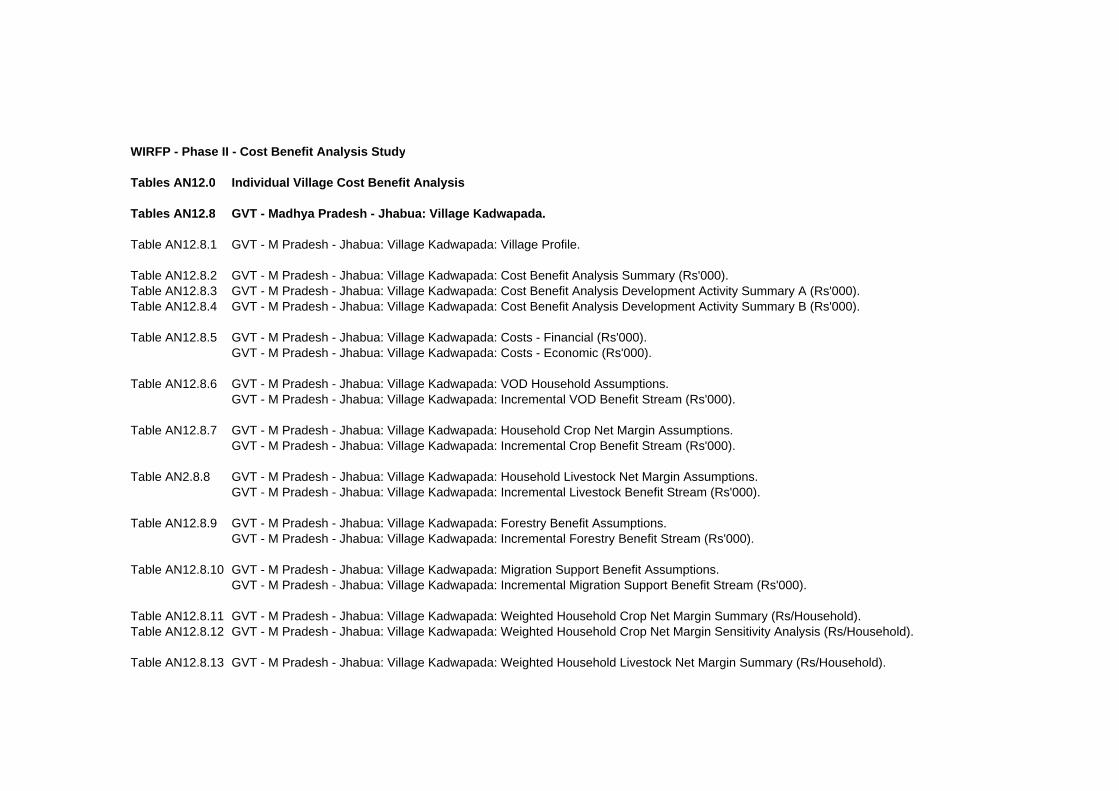
WIRFP - Phase II - Cost Benefit Analysis Study
Tables AN12.0 Individual Village Cost Benefit Analysis
Tables AN12.8 GVT - Madhya Pradesh - Jhabua: Village Kadwapada.
Table AN12.8.1 GVT - M Pradesh - Jhabua: Village Kadwapada: Village Profile.
Table AN12.8.2 GVT - M Pradesh - Jhabua: Village Kadwapada: Cost Benefit Analysis Summary (Rs'000).Table AN12.8.3 GVT - M Pradesh - Jhabua: Village Kadwapada: Cost Benefit Analysis Development Activity Summary A (Rs'000).Table AN12.8.4 GVT - M Pradesh - Jhabua: Village Kadwapada: Cost Benefit Analysis Development Activity Summary B (Rs'000).
Table AN12.8.5 GVT - M Pradesh - Jhabua: Village Kadwapada: Costs - Financial (Rs'000).GVT - M Pradesh - Jhabua: Village Kadwapada: Costs - Economic (Rs'000).
Table AN12.8.6 GVT - M Pradesh - Jhabua: Village Kadwapada: VOD Household Assumptions.GVT - M Pradesh - Jhabua: Village Kadwapada: Incremental VOD Benefit Stream (Rs'000).
Table AN12.8.7 GVT - M Pradesh - Jhabua: Village Kadwapada: Household Crop Net Margin Assumptions.GVT - M Pradesh - Jhabua: Village Kadwapada: Incremental Crop Benefit Stream (Rs'000).
Table AN2.8.8 GVT - M Pradesh - Jhabua: Village Kadwapada: Household Livestock Net Margin Assumptions.GVT - M Pradesh - Jhabua: Village Kadwapada: Incremental Livestock Benefit Stream (Rs'000).
Table AN12.8.9 GVT - M Pradesh - Jhabua: Village Kadwapada: Forestry Benefit Assumptions.GVT - M Pradesh - Jhabua: Village Kadwapada: Incremental Forestry Benefit Stream (Rs'000).
Table AN12.8.10 GVT - M Pradesh - Jhabua: Village Kadwapada: Migration Support Benefit Assumptions.GVT - M Pradesh - Jhabua: Village Kadwapada: Incremental Migration Support Benefit Stream (Rs'000).
Table AN12.8.11 GVT - M Pradesh - Jhabua: Village Kadwapada: Weighted Household Crop Net Margin Summary (Rs/Household).Table AN12.8.12 GVT - M Pradesh - Jhabua: Village Kadwapada: Weighted Household Crop Net Margin Sensitivity Analysis (Rs/Household).
Table AN12.8.13 GVT - M Pradesh - Jhabua: Village Kadwapada: Weighted Household Livestock Net Margin Summary (Rs/Household).

Table AN12.8.1 GVT - M Pradesh - Jhabua: Village Kadwapada: Village Profile.
Village Profile
A. Background D. Well Being Ranking (No Households)Village Name Kadwapada Very Poor 8 9.2%District Jhabua Poor 26 29.9%State M P Moderate 40 46.0%
Better Off 13 14.9%Participatory Planning Process (PPP) Total 87 100%
Village entry Nov-99PRA Jul-00 E. Land Resource (ha)CPA Jan-01 Total Area 291
Revenue Land 159 B. Infrastructure Forest Area - R 61
Hand Pumps (no) 8 Pasture Land 8 Wells (no) 20 Arable Land 63 Linked by Road I km 291 Electrification YesSchool Primary F. Livestock
C. Demographic DataHouseholds (no) 125 Participating Households 96 Population 1,935
Adults: Male 401 G. Self Help Groups (No Households) Female 375 1. Group 1 18 Children: 2. Group 2 18 Boys 603 3. Group 3 12 Girls 556 4. Group 4 13
5. Group 5 11 6. Group 6 14
86
Source: GVT Jhabua Coordination Office - Madhya Pradesh.

Table AN12.8.2 GVT - M Pradesh - Jhabua: Village Kadwapada: Cost Benefit Analysis Summary (Rs'000).
Administration Costs / Development Activity EIRR \1 Year 1 Year 2 Year 3 Year 4 Year 5 Year 6 Year 7 Year 8 Year 9 Year 10 Year 11 Year 12 Year 13 Year 14 Year 15 Year 16 Year 17 Year 18 Year 19 Year 20 Year 21 Year 22 Year 23 Year 24 Year 25(10%) (%) 1999/00 2000/01 2001/02 2002/03 2003/04 2004/05 2005/06 2006/07 2007/08 2008/09 2009/10 2010/11 2011/12
A. Administration CostsTotal A N/A (985) -564% 35.9 227.2 236.8 235.6 317.7 236.8 206.7 20.7 20.7 20.7 20.7 20.7 20.7 20.7 20.7 20.7 20.7 20.7 20.7 20.7 20.7 20.7 20.7 20.7 20.7
B. Development Intervention Component A 1. PPGF
Net Incremental Benefits N/A (85) -49% - (12.2) (17.9) (34.0) (38.7) (13.8) (8.2) (2.9) (2.9) (2.9) (2.9) (2.9) (2.9) (2.9) (2.9) (2.9) (2.9) (2.9) (2.9) (2.9) (2.9) (2.9) (2.9) (2.9) (2.9)
2. VODNet Incremental Benefits 47% 175 101% - (15.4) (13.5) (17.8) 8.7 37.2 31.5 57.9 58.4 59.0 59.0 59.0 59.0 59.0 59.0 59.0 59.0 59.0 59.0 59.0 59.0 59.0 59.0 59.0 59.0
3/5.Crop Technology, SWC and WRDNet Incremental Benefits 32% 708 406% - (27.7) (173.6) (344.8) 58.1 112.8 264.4 297.1 297.1 297.1 297.1 297.1 297.1 297.1 297.1 297.1 297.1 297.1 297.1 297.1 297.1 297.1 297.1 297.1 297.1
6. LivestockNet Incremental Benefits 37% 290 166% - (4.5) (36.4) (70.6) (57.8) 18.3 111.7 116.0 116.0 116.0 116.0 116.0 116.0 116.0 116.0 116.0 116.0 116.0 116.0 116.0 116.0 116.0 116.0 116.0 116.0
7. ForestryNet Incremental Benefits 31% 62 35% - - (24.7) (15.5) (5.2) 3.9 25.5 27.1 27.1 27.1 27.1 27.1 27.1 27.1 27.1 27.1 27.1 27.1 27.1 27.1 27.1 27.1 27.1 27.1 27.1
8. Migration SupportNet Incremental Benefits 17% 10 5% - - - - (31.5) (24.6) 0.5 13.6 13.6 13.6 13.6 13.6 13.6 13.6 13.6 13.6 13.6 13.6 13.6 13.6 13.6 13.6 13.6 13.6 13.6
SummaryNet Incremental Benefits 14% 175 100% (35.9) (287.0) (502.9) (718.2) (384.1) (103.1) 218.7 488.2 488.7 489.3 489.3 489.3 489.3 489.3 489.3 489.3 489.3 489.3 489.3 489.3 489.3 489.3 489.3 489.3 489.3
Sensitivity AnalysisAnalysis Period - Sustainability
12 Years 5% (449)20 Years (Base Case) 14% 175 25 Years 15% 357 30 Years 15% 461
Costs - AdministrationInvestment Costs Decreased by 20 percent 17% 372
Costs - Administration and DevelopmentRecurrent Costs Increased by 20 percent 14% 47
Benefits - Crop, SWC and WRDCrop Benefits Increased by 20 percent 18% 572 Livestock Benefits Increased by 20 percent 16% 382
Source: Cost Benefit Analysis (CBA) Study Estimate Jan 2005.\1 EIRR = Economic Internal Rate of Return (rate at which NPV equal to zero).\2 NPV = Net Present Value of net incremental benefits at 12% (indicative opportunity cost of capital for rural development projects in India).
N/A = Not analysed as EIRR negative.
NPV \2

Table AN12.8.3 GVT - M Pradesh - Jhabua: Village Kadwapada: Cost Benefit Analysis Development Activity Summary A (Rs'000).
Administration Costs / Development Activity EIRR \1 Year 1 Year 2 Year 3 Year 4 Year 5 Year 6 Year 7 Year 8 Year 9 Year 10 Year 11 Year 12 Year 13 Year 14 Year 15 Year 16 Year 17 Year 18 Year 19 Year 20 Year 21 Year 22 Year 23 Year 24 Year 25(10%) (%) 1999/00 2000/01 2001/02 2002/03 2003/04 2004/05 2005/06 2006/07 2007/08 2008/09 2009/10 2010/11 2011/12
A. Administration CostsInvestment 35.9 227.2 236.8 235.6 317.7 236.8 206.7 - - - - - - - - - - - - - - - - - - Recurrent - - - - - - - 20.7 20.7 20.7 20.7 20.7 20.7 20.7 20.7 20.7 20.7 20.7 20.7 20.7 20.7 20.7 20.7 20.7 20.7
Total (A) N/A (985.3) -564% 35.9 227.2 236.8 235.6 317.7 236.8 206.7 20.7 20.7 20.7 20.7 20.7 20.7 20.7 20.7 20.7 20.7 20.7 20.7 20.7 20.7 20.7 20.7 20.7 20.7
B. Development Intervention Component A 1. PPGF
Cost StreamInvestment - 12.2 17.6 33.3 37.1 11.3 5.4 - - - - - - - - - - - - - - - - - - Recurrent - - 0.3 0.7 1.6 2.5 2.8 2.9 2.9 2.9 2.9 2.9 2.9 2.9 2.9 2.9 2.9 2.9 2.9 2.9 2.9 2.9 2.9 2.9 2.9 Total Costs - 12.2 17.9 34.0 38.7 13.8 8.2 2.9 2.9 2.9 2.9 2.9 2.9 2.9 2.9 2.9 2.9 2.9 2.9 2.9 2.9 2.9 2.9 2.9 2.9
Benefit StreamBefore / Without Project - - - - - - - - - - After / With Project - - - - - - - - - - Incremental Benefits - - - - - - - - - -
Net Incremental Benefits N/A (85.1) -49% - (12.2) (17.9) (34.0) (38.7) (13.8) (8.2) (2.9) (2.9) (2.9) (2.9) (2.9) (2.9) (2.9) (2.9) (2.9) (2.9) (2.9) (2.9) (2.9) (2.9) (2.9) (2.9) (2.9) (2.9)
2. VODCost Stream
Investment - 15.4 82.2 82.9 52.8 22.1 27.2 - - - - - - - - - - - - - - - - - - Recurrent - - 0.8 4.9 9.0 11.7 12.8 14.1 14.1 14.1 14.1 14.1 14.1 14.1 14.1 14.1 14.1 14.1 14.1 14.1 14.1 14.1 14.1 14.1 14.1 Total Costs - 15.4 83.0 87.7 61.8 33.8 40.0 14.1 14.1 14.1 14.1 14.1 14.1 14.1 14.1 14.1 14.1 14.1 14.1 14.1 14.1 14.1 14.1 14.1 14.1
Benefit StreamBefore / Without Project - - - - - - - - - - - - - - - - - - - - - - - - - After / With Project - - 69.5 70.0 70.4 71.0 71.5 72.0 72.5 73.1 73.1 73.1 73.1 73.1 73.1 73.1 73.1 73.1 73.1 73.1 73.1 73.1 73.1 73.1 73.1 Incremental Benefits - - 69.5 70.0 70.4 71.0 71.5 72.0 72.5 73.1 73.1 73.1 73.1 73.1 73.1 73.1 73.1 73.1 73.1 73.1 73.1 73.1 73.1 73.1 73.1
Net Incremental Benefits 47% 175.5 101% - (15.4) (13.5) (17.8) 8.7 37.2 31.5 57.9 58.4 59.0 59.0 59.0 59.0 59.0 59.0 59.0 59.0 59.0 59.0 59.0 59.0 59.0 59.0 59.0 59.0
3/5.Crop Technology, SWC and WRDCost Stream
InvestmentCrop Technology - 27.7 102.1 111.8 45.7 81.3 5.4 - - - - - - - - - - - - - - - - - - Soil Water Conservation - - 70.8 144.0 65.5 78.1 - - - - - - - - - - - - - - - - - - - Water Resource Development - - - 76.8 189.9 49.1 32.3 - - - - - - - - - - - - - - - - - -
RecurrentCrop Technology - - 0.7 3.2 6.0 7.2 9.2 9.4 9.4 9.4 9.4 9.4 9.4 9.4 9.4 9.4 9.4 9.4 9.4 9.4 9.4 9.4 9.4 9.4 9.4 Soil Water Conservation - - - 8.8 26.9 35.0 44.8 44.8 44.8 44.8 44.8 44.8 44.8 44.8 44.8 44.8 44.8 44.8 44.8 44.8 44.8 44.8 44.8 44.8 44.8 Water Resource Development - - - 11.5 40.0 47.4 52.2 52.2 52.2 52.2 52.2 52.2 52.2 52.2 52.2 52.2 52.2 52.2 52.2 52.2 52.2 52.2 52.2 52.2
Total Costs - 27.7 173.6 344.8 345.5 290.8 139.1 106.4 106.4 106.4 106.4 106.4 106.4 106.4 106.4 106.4 106.4 106.4 106.4 106.4 106.4 106.4 106.4 106.4 106.4 Benefit Stream
Before / Without Project - - - - 146.7 146.7 146.7 146.7 146.7 146.7 146.7 146.7 146.7 146.7 146.7 146.7 146.7 146.7 146.7 146.7 146.7 146.7 146.7 146.7 146.7 After / With Project - - - - 550.2 550.2 550.2 550.2 550.2 550.2 550.2 550.2 550.2 550.2 550.2 550.2 550.2 550.2 550.2 550.2 550.2 550.2 550.2 550.2 550.2 Incremental Benefits - - - - 403.5 403.5 403.5 403.5 403.5 403.5 403.5 403.5 403.5 403.5 403.5 403.5 403.5 403.5 403.5 403.5 403.5 403.5 403.5 403.5 403.5
Net Incremental Benefits 32% 708.3 406% - (27.7) (173.6) (344.8) 58.1 112.8 264.4 297.1 297.1 297.1 297.1 297.1 297.1 297.1 297.1 297.1 297.1 297.1 297.1 297.1 297.1 297.1 297.1 297.1 297.1
Source: Cost Benefit Analysis (CBA) Study Estimate Jan 2005.\1 EIRR = Economic Internal Rate of Return (rate at which NPV equal to zero).\2 NPV = Net Present Value of net incremental benefits at 12% (indicative opportunity cost of capital for rural development projects in India).
N/A = Not analysed as EIRR negative.
NPV \2

Table AN12.8.4 GVT - M Pradesh - Jhabua: Village Kadwapada: Cost Benefit Analysis Development Activity Summary B (Rs'000).
Administration Costs / Development Activity EIRR \1 Year 1 Year 2 Year 3 Year 4 Year 5 Year 6 Year 7 Year 8 Year 9 Year 10 Year 11 Year 12 Year 13 Year 14 Year 15 Year 16 Year 17 Year 18 Year 19 Year 20 Year 21 Year 22 Year 23 Year 24 Year 25(10%) (%) 1999/00 2000/01 2001/02 2002/03 2003/04 2004/05 2005/06 2006/07 2007/08 2008/09 2009/10 2010/11 2011/12
6. LivestockCost Stream
Investment - 4.5 36.0 66.5 54.6 37.5 4.8 - - - - - - - - - - - - - - - - - - Recurrent - 0.5 4.0 10.7 16.2 19.9 20.4 20.4 20.4 20.4 20.4 20.4 20.4 20.4 20.4 20.4 20.4 20.4 20.4 20.4 20.4 20.4 20.4 20.4 Total Costs - 4.5 36.4 70.6 65.3 53.7 24.7 20.4 20.4 20.4 20.4 20.4 20.4 20.4 20.4 20.4 20.4 20.4 20.4 20.4 20.4 20.4 20.4 20.4 20.4
Benefit StreamBefore / Without Project - - - - 150.2 150.2 150.2 150.2 150.2 150.2 150.2 150.2 150.2 150.2 150.2 150.2 150.2 150.2 150.2 150.2 150.2 150.2 150.2 150.2 150.2 After / With Project - - - - 157.6 222.1 286.6 286.6 286.6 286.6 286.6 286.6 286.6 286.6 286.6 286.6 286.6 286.6 286.6 286.6 286.6 286.6 286.6 286.6 286.6 Incremental Benefits - - - - 7.5 71.9 136.4 136.4 136.4 136.4 136.4 136.4 136.4 136.4 136.4 136.4 136.4 136.4 136.4 136.4 136.4 136.4 136.4 136.4 136.4
Net Incremental Benefits 37% 289.8 166% - (4.5) (36.4) (70.6) (57.8) 18.3 111.7 116.0 116.0 116.0 116.0 116.0 116.0 116.0 116.0 116.0 116.0 116.0 116.0 116.0 116.0 116.0 116.0 116.0 116.0
7. ForestryCost Stream
Investment - - 24.7 34.3 29.4 26.0 1.8 - - - - - - - - - - - - - - - - - - Recurrent - - 2.5 5.9 8.8 11.4 11.6 11.6 11.6 11.6 11.6 11.6 11.6 11.6 11.6 11.6 11.6 11.6 11.6 11.6 11.6 11.6 11.6 11.6 Total Costs - - 24.7 36.7 35.3 34.8 13.2 11.6 11.6 11.6 11.6 11.6 11.6 11.6 11.6 11.6 11.6 11.6 11.6 11.6 11.6 11.6 11.6 11.6 11.6
Benefit StreamBefore / Without Project - - - - - - - - - - - - - - - - - - - - - - - - - After / With Project - - - 21.3 30.2 38.7 38.7 38.7 38.7 38.7 38.7 38.7 38.7 38.7 38.7 38.7 38.7 38.7 38.7 38.7 38.7 38.7 38.7 38.7 38.7 Incremental Benefits - - - 21.3 30.2 38.7 38.7 38.7 38.7 38.7 38.7 38.7 38.7 38.7 38.7 38.7 38.7 38.7 38.7 38.7 38.7 38.7 38.7 38.7 38.7
Net Incremental Benefits 31% 61.8 35% - - (24.7) (15.5) (5.2) 3.9 25.5 27.1 27.1 27.1 27.1 27.1 27.1 27.1 27.1 27.1 27.1 27.1 27.1 27.1 27.1 27.1 27.1 27.1 27.1
8. Migration SupportCost Stream
Investment - - - - 31.5 32.4 9.0 - - - - - - - - - - - - - - - - - - Recurrent - - - - 3.2 6.4 7.3 7.3 7.3 7.3 7.3 7.3 7.3 7.3 7.3 7.3 7.3 7.3 7.3 7.3 7.3 7.3 7.3 7.3 Total Costs - - - - 31.5 35.6 15.4 7.3 7.3 7.3 7.3 7.3 7.3 7.3 7.3 7.3 7.3 7.3 7.3 7.3 7.3 7.3 7.3 7.3 7.3
Benefit StreamBefore / Without Project - - - - - 54.2 54.2 54.2 54.2 54.2 54.2 54.2 54.2 54.2 54.2 54.2 54.2 54.2 54.2 54.2 54.2 54.2 54.2 54.2 54.2 After / With Project - - - - - 65.1 70.1 75.1 75.1 75.1 75.1 75.1 75.1 75.1 75.1 75.1 75.1 75.1 75.1 75.1 75.1 75.1 75.1 75.1 75.1 Incremental Benefits - - - - - 10.9 15.9 20.9 20.9 20.9 20.9 20.9 20.9 20.9 20.9 20.9 20.9 20.9 20.9 20.9 20.9 20.9 20.9 20.9 20.9
Net Incremental Benefits 17% 9.5 5% - - - - (31.5) (24.6) 0.5 13.6 13.6 13.6 13.6 13.6 13.6 13.6 13.6 13.6 13.6 13.6 13.6 13.6 13.6 13.6 13.6 13.6 13.6
SummaryCost Stream
Investment 35.9 287.0 570.2 785.2 824.1 574.6 292.6 - - - - - - - - - - - - - - - - - - Recurrent - - 2.2 24.2 71.6 124.5 154.7 183.4 183.4 183.4 183.4 183.4 183.4 183.4 183.4 183.4 183.4 183.4 183.4 183.4 183.4 183.4 183.4 183.4 183.4 Total Costs 35.9 287.0 572.4 809.5 895.7 699.1 447.3 183.4 183.4 183.4 183.4 183.4 183.4 183.4 183.4 183.4 183.4 183.4 183.4 183.4 183.4 183.4 183.4 183.4 183.4
Benefit StreamBefore / Without Project - - - - 296.9 351.0 351.0 351.0 351.0 351.0 351.0 351.0 351.0 351.0 351.0 351.0 351.0 351.0 351.0 351.0 351.0 351.0 351.0 351.0 351.0 After / With Project - - 69.5 91.2 808.5 947.1 1,017.1 1,022.6 1,023.2 1,023.7 1,023.7 1,023.7 1,023.7 1,023.7 1,023.7 1,023.7 1,023.7 1,023.7 1,023.7 1,023.7 1,023.7 1,023.7 1,023.7 1,023.7 1,023.7 Incremental Benefits - - 69.5 91.2 511.6 596.0 666.0 671.6 672.1 672.7 672.7 672.7 672.7 672.7 672.7 672.7 672.7 672.7 672.7 672.7 672.7 672.7 672.7 672.7 672.7
Net Incremental Benefits 14% 174.6 100% (35.9) (287.0) (502.9) (718.2) (384.1) (103.1) 218.7 488.2 488.7 489.3 489.3 489.3 489.3 489.3 489.3 489.3 489.3 489.3 489.3 489.3 489.3 489.3 489.3 489.3 489.3
Source: Cost Benefit Analysis (CBA) Study Estimate Jan 2005.\1 EIRR = Economic Internal Rate of Return (rate at which NPV equal to zero).\2 NPV = Net Present Value of net incremental benefits at 12% (indicative opportunity cost of capital for rural development projects in India).
N/A = Not analysed as EIRR negative.
NPV \2

Table AN12.8.5 GVT - M Pradesh - Jhabua: Village Kadwapada: Costs - Financial (Rs'000).
Cost Head / Subhead 1999/00 2000/01 2001/02 2002/03 2003/04 2004/05 2005/06Actual Actual Actual Actual Actual Budget Budget (Rs'000) (%)
A. Administration CostsGVT Bhopal (PHQ) - 60.3 75.4 67.3 52.8 66.8 61.1 383.7 10%DFIDI Consultancy 35.9 71.4 26.9 63.2 47.4 54.7 39.2 338.6 9%Jhabua Coordination Office - 112.9 157.8 124.3 247.5 135.5 125.0 903.0 23%
Total A 35.9 244.5 260.2 254.8 347.7 257.0 225.3 1,625.4 41%
B. Development CostsComponent A 1. PPGF - 13.5 19.5 37.0 41.2 12.5 6.0 129.7 3% 2. VOD - 17.2 91.4 92.1 58.6 24.6 30.2 314.0 8% 3. Crop Technology - 30.8 113.4 124.3 50.7 90.4 6.0 415.6 10% 4. SWC - - 104.9 213.4 97.1 115.8 - 531.1 13% 5. WRD - - - 113.8 281.3 72.7 47.8 515.6 13% 6. Livestock - 5.0 40.0 73.9 60.7 41.7 5.3 226.6 6% 7. Forestry - - 27.4 38.1 32.7 28.9 2.0 129.1 3%8. Migration Support - - - - 35.0 36.0 10.0 81.0 2%
Subtotal - 66.5 396.6 692.5 657.3 422.4 107.4 2,342.7 59%
Other Development CostsSubtotal - - - - - - - - 0%
Total B - 66.5 396.6 692.5 657.3 422.4 107.4 2,342.7 59%
Total A + B 35.9 311.0 656.8 947.3 1,005.0 679.5 332.7 3,968.1 100%
GVT - 233.6 594.7 810.8 874.8 586.6 282.2 3,382.7 85%DFIDI 35.9 71.4 26.9 63.2 47.4 54.7 39.2 338.6 9%Community - 5.8 33.8 72.1 81.5 36.8 9.6 239.6 6%Government - 0.2 1.4 1.2 1.3 1.3 1.8 7.1 0%
Source: GVT Jhabua Coordination Office - Madhya Pradesh.
DFIDI = Department for International Development (India).PPGF = Participatory Planning and Group Formation.VOD = Village Organisation and Development.SWC = Soil and Water Conservation.WRD = Water Resource Development.
Totals
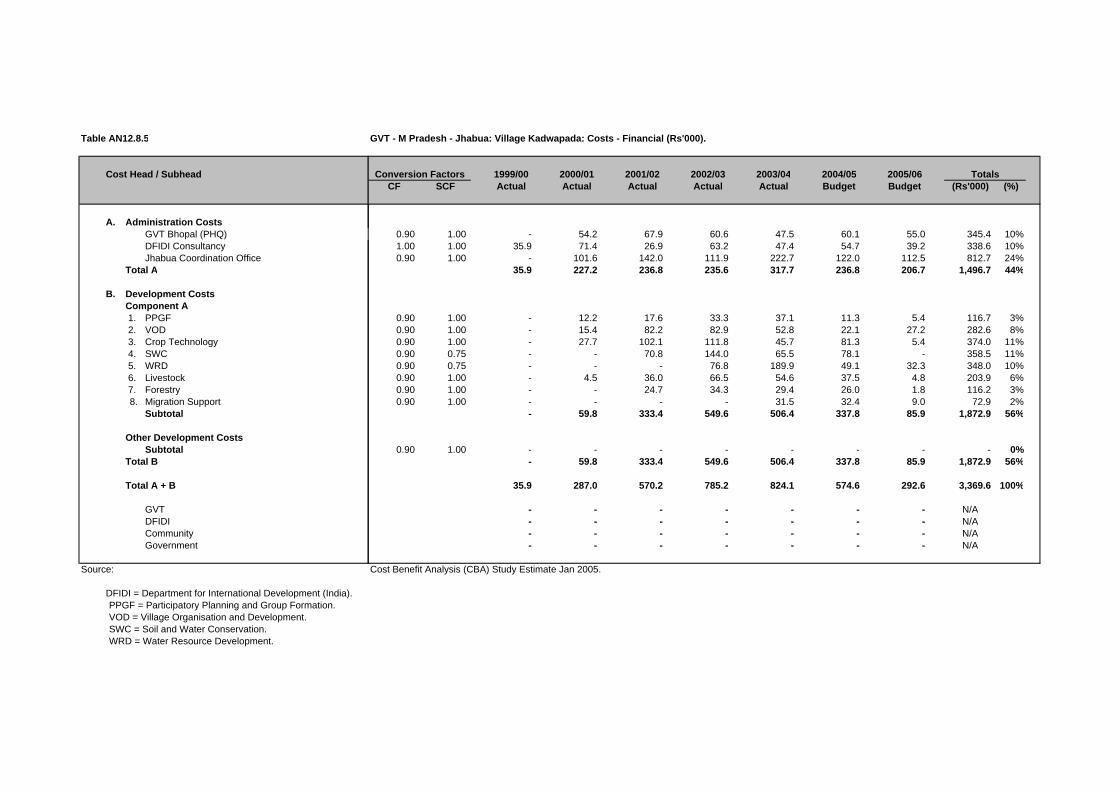
Table AN12.8.5
Cost Head / Subhead
A. Administration CostsGVT Bhopal (PHQ)DFIDI ConsultancyJhabua Coordination Office
Total A
B. Development CostsComponent A 1. PPGF 2. VOD 3. Crop Technology 4. SWC 5. WRD 6. Livestock 7. Forestry8. Migration Support
Subtotal
Other Development CostsSubtotal
Total B
Total A + B
GVTDFIDICommunityGovernment
Source:
DFIDI = Department for International Development (India).PPGF = Participatory Planning and Group Formation.VOD = Village Organisation and Development.SWC = Soil and Water Conservation.WRD = Water Resource Development.
GVT - M Pradesh - Jhabua: Village Kadwapada: Costs - Financial (Rs'000).
1999/00 2000/01 2001/02 2002/03 2003/04 2004/05 2005/06CF SCF Actual Actual Actual Actual Actual Budget Budget (Rs'000) (%)
0.90 1.00 - 54.2 67.9 60.6 47.5 60.1 55.0 345.4 10%1.00 1.00 35.9 71.4 26.9 63.2 47.4 54.7 39.2 338.6 10%0.90 1.00 - 101.6 142.0 111.9 222.7 122.0 112.5 812.7 24%
35.9 227.2 236.8 235.6 317.7 236.8 206.7 1,496.7 44%
0.90 1.00 - 12.2 17.6 33.3 37.1 11.3 5.4 116.7 3%0.90 1.00 - 15.4 82.2 82.9 52.8 22.1 27.2 282.6 8%0.90 1.00 - 27.7 102.1 111.8 45.7 81.3 5.4 374.0 11%0.90 0.75 - - 70.8 144.0 65.5 78.1 - 358.5 11%0.90 0.75 - - - 76.8 189.9 49.1 32.3 348.0 10%0.90 1.00 - 4.5 36.0 66.5 54.6 37.5 4.8 203.9 6%0.90 1.00 - - 24.7 34.3 29.4 26.0 1.8 116.2 3%0.90 1.00 - - - - 31.5 32.4 9.0 72.9 2%
- 59.8 333.4 549.6 506.4 337.8 85.9 1,872.9 56%
0.90 1.00 - - - - - - - - 0%- 59.8 333.4 549.6 506.4 337.8 85.9 1,872.9 56%
35.9 287.0 570.2 785.2 824.1 574.6 292.6 3,369.6 100%
- - - - - - - N/A- - - - - - - N/A- - - - - - - N/A- - - - - - - N/A
Cost Benefit Analysis (CBA) Study Estimate Jan 2005.
TotalsConversion Factors
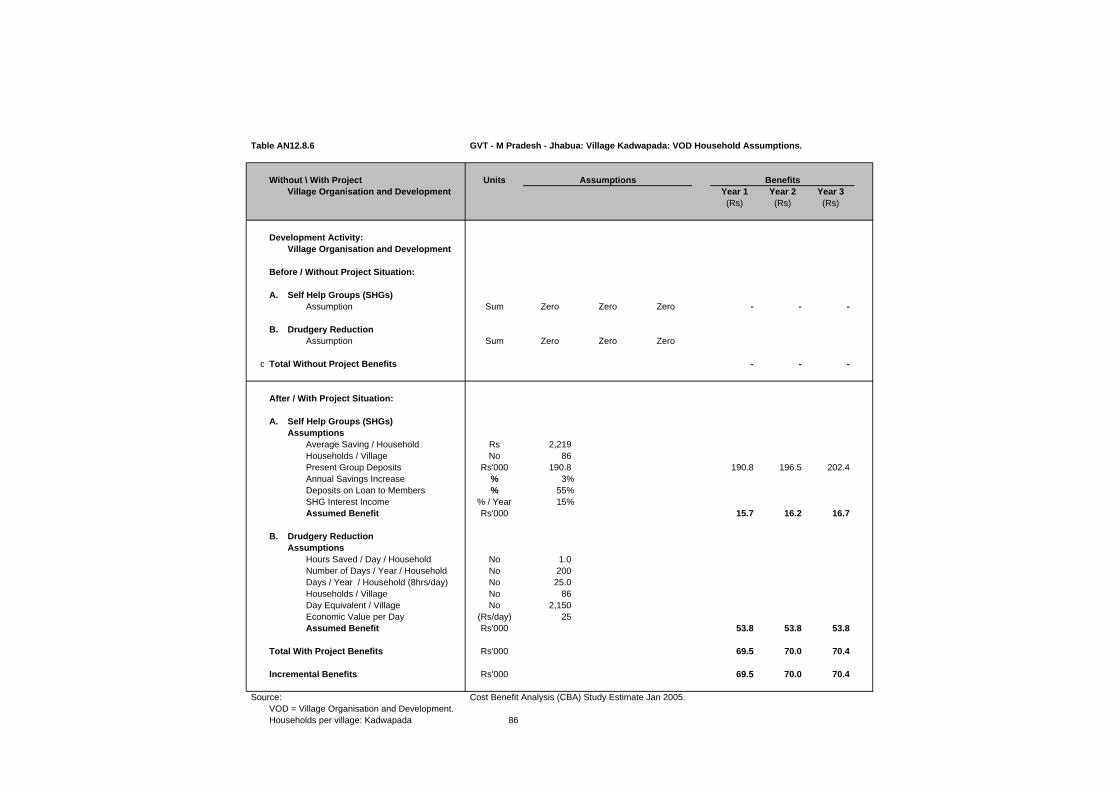
Table AN12.8.6 GVT - M Pradesh - Jhabua: Village Kadwapada: VOD Household Assumptions.
Without \ With Project UnitsVillage Organisation and Development Year 1 Year 2 Year 3
(Rs) (Rs) (Rs)
Development Activity:Village Organisation and Development
Before / Without Project Situation:
A. Self Help Groups (SHGs)Assumption Sum Zero Zero Zero - - -
B. Drudgery ReductionAssumption Sum Zero Zero Zero
c Total Without Project Benefits - - -
After / With Project Situation:
A. Self Help Groups (SHGs)Assumptions
Average Saving / Household Rs 2,219 Households / Village No 86 Present Group Deposits Rs'000 190.8 190.8 196.5 202.4 Annual Savings Increase % 3%Deposits on Loan to Members % 55%SHG Interest Income % / Year 15%Assumed Benefit Rs'000 15.7 16.2 16.7
B. Drudgery ReductionAssumptions
Hours Saved / Day / Household No 1.0 Number of Days / Year / Household No 200 Days / Year / Household (8hrs/day) No 25.0 Households / Village No 86 Day Equivalent / Village No 2,150 Economic Value per Day (Rs/day) 25 Assumed Benefit Rs'000 53.8 53.8 53.8
Total With Project Benefits Rs'000 69.5 70.0 70.4
Incremental Benefits Rs'000 69.5 70.0 70.4
Source: Cost Benefit Analysis (CBA) Study Estimate Jan 2005.VOD = Village Organisation and Development.Households per village: Kadwapada 86
Assumptions Benefits

Table AN12.8.6
Without \ With ProjectVillage Organisation and Development
Development Activity:Village Organisation and Development
Before / Without Project Situation:
A. Self Help Groups (SHGs)Assumption
B. Drudgery ReductionAssumption
c Total Without Project Benefits
After / With Project Situation:
A. Self Help Groups (SHGs)Assumptions
Average Saving / HouseholdHouseholds / VillagePresent Group DepositsAnnual Savings IncreaseDeposits on Loan to MembersSHG Interest Income Assumed Benefit
B. Drudgery ReductionAssumptions
Hours Saved / Day / HouseholdNumber of Days / Year / HouseholdDays / Year / Household (8hrs/day)Households / VillageDay Equivalent / VillageEconomic Value per DayAssumed Benefit
Total With Project Benefits
Incremental Benefits
Source:VOD = Village Organisation and Development.Households per village: Kadwapada
GVT - M Pradesh - Jhabua: Village Kadwapada: Incremental VOD Benefit Stream (Rs'000).
Year 1 Year 2 Year 3 Year 4 Year 5 Year 6 Year 7 Year 8 Year 9 Year 101999/00 2000/01 2001/02 2002/03 2003/04 2004/05 2005/06 2006/07 2007/08 2008/09
- - - - - - - - - -
- - 190.8 196.5 202.4 208.5 214.7 221.2 227.8 234.7
- - 15.7 16.2 16.7 17.2 17.7 18.2 18.8 19.4
- - 53.8 53.8 53.8 53.8 53.8 53.8 53.8 53.8
- - 69.5 70.0 70.4 71.0 71.5 72.0 72.5 73.1
- - 69.5 70.0 70.4 71.0 71.5 72.0 72.5 73.1
Cost Benefit Analysis (CBA) Study Estimate Jan 2005.
Benefit Streams (Rs '000)

Table AN12.8.7 GVT - M Pradesh - Jhabua: Village Kadwapada: Household Crop Net Margin Assumptions.
Without \ With Project UnitsCrop Technology, SWC and WRD Year 1 Year 2 Year 3
(Rs/HH) (Rs/HH) (Rs/HH)
Development Activity:Crop Technology, SWC and WRD
Before / Without Project Situation:Assumptions
Households (HHs) No 86 Crop Adoption Assumptions 100% 100% 100%
Kharif Crop Net Margin Rs/HH 1,433.7 1,433.7 1,433.7
Rabi Crop Net Margin Rs/HH 272 272.3 272.3 Total Without Project Benefits Rs/HH 1,705.9 1,705.9 1,705.9
After / With Project Situation:Assumptions
Households (HHs) No 86 Crop Adoption Assumptions 100% 100% 100%
Kharif Crop Net Margin Rs/HH 4,986.8 4,986.8 4,986.8
Rabi Crop Net Margin Rs/HH 1,411.2 1,411.2 1,411.2 Total With Project Benefits Rs/HH 6,398.0 6,398.0 6,398.0
Incremental Benefits Rs/HH 4,692.0 4,692.0 4,692.0
Source: Cost Benefit Analysis (CBA) Study Estimate Jan 2005.
BenefitsAssumptions

Table AN12.8.7
Without \ With ProjectCrop Technology, SWC and WRD
Development Activity:Crop Technology, SWC and WRD
Before / Without Project Situation:Assumptions
Households (HHs)Crop Adoption Assumptions
Kharif Crop Net Margin
Rabi Crop Net MarginTotal Without Project Benefits
After / With Project Situation:Assumptions
Households (HHs)Crop Adoption Assumptions
Kharif Crop Net Margin
Rabi Crop Net MarginTotal With Project Benefits
Incremental Benefits
Source:
GVT - M Pradesh - Jhabua: Village Kadwapada: Incremental Crop Benefit Stream (Rs'000).
Year 1 Year 2 Year 3 Year 4 Year 5 Year 6 Year 7 Year 8 Year 9 Year 101999/00 2000/01 2001/02 2002/03 2003/04 2004/05 2005/06 2006/07 2007/08 2008/09
- - - - 123.3 123.3 123.3 123.3 123.3 123.3
- - - - 23.4 23.4 23.4 23.4 23.4 23.4 - - - - 146.7 146.7 146.7 146.7 146.7 146.7
- - - - 428.9 428.9 428.9 428.9 428.9 428.9
- - - - 121.4 121.4 121.4 121.4 121.4 121.4 - - - - 550.2 550.2 550.2 550.2 550.2 550.2
- - - - 403.5 403.5 403.5 403.5 403.5 403.5
Cost Benefit Analysis (CBA) Study Estimate Jan 2005.
Benefit Streams (Rs '000)

Table AN2.8.8 GVT - M Pradesh - Jhabua: Village Kadwapada: Household Livestock Net Margin Assumptions.
Without \ With Project UnitsLivestock Year 1 Year 2 Year 3
(Rs) (Rs) (Rs)
Development Activity:Livestock
Before / Without Project Situation:Assumptions
Households (HHs) No 86 Annual Livestock Net Margin Rs/HH
Total Without Project Benefits 1,745.9 1,745.9 1,745.9
After / With Project Situation:
Development Activity:Assumptions
Households (HHs) No 86 Adoption Assumptions Percent 55% 78% 100%
Annual Livestock Net Margin Rs/HHTotal With Project Benefits 1,832.8 2,582.6 3,332.3
Incremental Benefits Rs/HH 86.8 836.6 1,586.4
Source: Cost Benefit Analysis (CBA) Study Estimate Jan 2005.
BenefitsAssumptions

Table AN2.8.8
Without \ With ProjectLivestock
Development Activity:Livestock
Before / Without Project Situation:Assumptions
Households (HHs)Annual Livestock Net Margin
Total Without Project Benefits
After / With Project Situation:
Development Activity:Assumptions
Households (HHs)Adoption Assumptions
Annual Livestock Net MarginTotal With Project Benefits
Incremental Benefits
Source:
GVT - M Pradesh - Jhabua: Village Kadwapada: Incremental Livestock Benefit Stream (Rs'000).
Year 1 Year 2 Year 3 Year 4 Year 5 Year 6 Year 7 Year 8 Year 9 Year 101999/00 2000/01 2001/02 2002/03 2003/04 2004/05 2005/06 2006/07 2007/08 2008/09
- - - - 150.2 150.2 150.2 150.2 150.2 150.2
- - - - 157.6 222.1 286.6 286.6 286.6 286.6
- - - - 7.5 71.9 136.4 136.4 136.4 136.4
Cost Benefit Analysis (CBA) Study Estimate Jan 2005.
Benefit Streams (Rs '000)

Table AN12.8.9 GVT - M Pradesh - Jhabua: Village Kadwapada: Forestry Benefit Assumptions.
Without \ With Project UnitsForestry Year 1 Year 2 Year 3
(Rs) (Rs) (Rs)
Development Activity:Forestry
Before / Without Project Situation:AssumptionsHouseholds (HHs) No 86 Annual Forestry Net Margin Rs/HH
Total Without Project Benefits - - -
After / With Project Situation:AssumptionsHouseholds (HHs) No 86 Adoption Assumptions Percent 55% 78% 100%Annual Forestry Net Margin Rs/HH
Total With Project Benefits 247.5 351.0 450.0
Incremental Benefits Rs/HH 247.5 351.0 450.0
Source: Cost Benefit Analysis (CBA) Study Estimate Jan 2005.
BenefitsAssumptions

Table AN12.8.9
Without \ With ProjectForestry
Development Activity:Forestry
Before / Without Project Situation:AssumptionsHouseholds (HHs)Annual Forestry Net Margin
Total Without Project Benefits
After / With Project Situation:AssumptionsHouseholds (HHs)Adoption AssumptionsAnnual Forestry Net Margin
Total With Project Benefits
Incremental Benefits
Source:
GVT - M Pradesh - Jhabua: Village Kadwapada: Incremental Forestry Benefit Stream (Rs'000).
Year 1 Year 2 Year 3 Year 4 Year 5 Year 6 Year 7 Year 8 Year 9 Year 101999/00 2000/01 2001/02 2002/03 2003/04 2004/05 2005/06 2006/07 2007/08 2008/09
- - - - - - - - - -
- - - 21.3 30.2 38.7 38.7 38.7 38.7 38.7
- - - 21.3 30.2 38.7 38.7 38.7 38.7 38.7
Cost Benefit Analysis (CBA) Study Estimate Jan 2005.
Benefit Streams (Rs '000)

Table AN12.8.10 GVT - M Pradesh - Jhabua: Village Kadwapada: Migration Support Benefit Assumptions.
Without \ With ProjectYear 1 Year 2 Year 3(Rs) (Rs) (Rs)
Development Activity:Migration Support
Before / Without Project Situation:Assumptions
Economic Value per Day Rs/day 25.0 Days / Month / Household No 18 Economic Value per Month Rs/month 450.0 Months Migration / Year Months 4.0 Economic Value per Household Rs/HH 1,800.0 Households per Village No 86 Households per Village Migrating Percent 35%
Total Without Project Benefits Rs/Village 54.2 54.2 54.2
After / With Project Situation:Assumptions
Economic Value per Day \1 Rs/day 25.0 30% 32.5 Days / Month / Household No 18 30% 24.0 Economic Value per Month Rs/month 450.0 780.0 Months Migration / Year Months 4.0 -20% 3.2 Economic Value per Household Rs/HH 1,800.0 2,496.0 Households per Village No 86 86 Households per Village Migrating Percent 35% -20% 28%
Subtotal Migration Income Rs/Village 60.1 60.1 60.1
Other Income Sum (Rs'000) 5.0 10.0 15.0 5.0 10.0 15.0
Total With Project Benefits Rs/Village 65.1 70.1 75.1
Incremental Benefits Rs/Village 10.9 15.9 20.9
Source: Cost Benefit Analysis (CBA) Study Estimate Jan 2005.
1\ Financial Wages (Rs/day):Skill Labour - Rs 160
Casual Labour :Male - Rs 40Female - Rs 30
BenefitsAssumptions

Table AN12.8.10
Without \ With Project
Development Activity:Migration Support
Before / Without Project Situation:Assumptions
Economic Value per Day Days / Month / Household Economic Value per Month Months Migration / Year Economic Value per Household Households per Village Households per Village Migrating
Total Without Project Benefits
After / With Project Situation:Assumptions
Economic Value per Day \1Days / Month / Household Economic Value per Month Months Migration / Year Economic Value per Household Households per Village Households per Village Migrating
Subtotal Migration Income
Other Income
Total With Project Benefits
Incremental Benefits
Source:
1\ Financial Wages (Rs/day):Skill Labour - Rs 160
Casual Labour :Male - Rs 40Female - Rs 30
GVT - M Pradesh - Jhabua: Village Kadwapada: Incremental Migration Support Benefit Stream (Rs'000).
Year 1 Year 2 Year 3 Year 4 Year 5 Year 6 Year 7 Year 8 Year 9 Year 101999/00 2000/01 2001/02 2002/03 2003/04 2004/05 2005/06 2006/07 2007/08 2008/09
- - - - - 54.2 54.2 54.2 54.2 54.2
- - - - - 60.1 60.1 60.1 60.1 60.1
- - - - - 5.0 10.0 15.0 15.0 15.0
- - - - - 65.1 70.1 75.1 75.1 75.1
- - - - - 10.9 15.9 20.9 20.9 20.9
Cost Benefit Analysis (CBA) Study Estimate Jan 2005.
Benefit Streams (Rs '000)

Table AN12.8.11 GVT - M Pradesh - Jhabua: Village Kadwapada: Weighted Household Crop Net Margin Summary (Rs/Household).
Item WBR(%) Khalif Rabi Total Khalif Rabi Total Khalif Rabi Total
Phase IIWell Being Ranking - Very Poor
Household Net Margin (Rs) 8.0% 834.6 102.5 937.1 1,849.8 1,067.8 2,917.6 1,015.2 965.3 1,980.5 Well Being Ranking - Poor
Household Net Margin (Rs) 26.0% 637.7 - 637.7 4,803.0 220.7 5,023.7 4,165.3 220.7 4,386.0 Well Being Ranking - Moderate
Household Net Margin (Rs) 40.0% 994.0 89.3 1,083.3 3,711.4 2,508.3 6,219.6 2,717.4 2,419.0 5,136.4 Well Being Ranking - Better Off
Household Net Margin (Rs) 13.0% 6,180.9 1,756.7 7,937.5 16,195.9 2,039.3 18,235.2 10,015.0 282.7 10,297.7
Well Being Ranking - WeightedHousehold Net Margin (Rs) 87.0% 1,433.7 272.3 1,705.9 4,986.8 1,411.2 6,398.0 3,553.1 1,138.9 4,692.0
Phase I \1Well Being Ranking - Very Poor
Household Net Margin (Rs) 8.0% 436.3 267.5 703.8 3,866.5 1,668.8 5,535.3 3,430.3 1,401.3 4,831.5 Well Being Ranking - Poor
Household Net Margin (Rs) 26.0% 485.8 657.5 1,143.3 10,136.0 5,690.3 15,826.3 9,650.3 5,032.8 14,683.0 Well Being Ranking - Moderate
Household Net Margin (Rs) 40.0% 986.3 3,385.0 4,371.3 9,457.5 5,195.0 14,652.5 8,471.3 1,810.0 10,281.3 Well Being Ranking - Better Off
Household Net Margin (Rs) 13.0% 2,778.0 937.0 3,715.0 4,915.0 9,560.0 14,475.0 2,137.0 8,623.0 10,760.0
Well Being Ranking - WeightedHousehold Net Margin (Rs) 87.0% 916.8 1,668.2 2,585.0 7,366.6 4,933.8 12,300.4 6,449.8 3,265.6 9,715.4
Source: Study of Impact of WIRFP on Net Incomes of Target Households, Jan 2004.WBR = GVT Household Well Being Ranking. Survey figures adjusted to Village Profile WBR.\1 GVT - Madhya Pradesh - Phase I: Village Naganwat Choti: Weighted Household Crop Net Margin Summary.
Before / Without Project After / With Project Increment

Table AN12.8.12 GVT - M Pradesh - Jhabua: Village Kadwapada: Weighted Household Crop Net Margin Sensitivity Analysis (Rs/Household).
Item EIRRKhalif Rabi Total Khalif Rabi Total Khalif Rabi Total
Development Activity:Crop Technology, SWC and WRD
Weighted Net Margin (Phase II)Household Net Margin (Rs) 1,433.7 272.3 1,705.9 4,986.8 1,411.2 6,398.0 3,553.1 1,138.9 4,692.0 Incremental Benefit (Phase II / Phase I) 48%
Base Case AssumptionsHousehold Net Margin (Rs) 1,433.7 272.3 1,705.9 4,986.8 1,411.2 6,398.0 3,553.1 1,138.9 4,692.0 Incremental Benefit (Phase II / Phase I) 48%Sensitivity Increase (%) 0%Development Activity (EIRR) 32%Overall Village (EIRR) 14%
Sensitivity AssumptionsHousehold Net Margin (Rs) 1,433.7 272.3 1,705.9 4,986.8 1,411.2 6,398.0 3,553.1 1,138.9 4,692.0 Incremental Benefit (Phase II / Phase I) 48%Sensitivity Increase (%) 0%Development Activity (EIRR) 32%Overall Village (EIRR) 14%
Weighted Net Margin (Phase I) 916.8 1,668.2 2,585.0 7,366.6 4,933.8 12,300.4 6,449.8 3,265.6 9,715.4 Household Net Margin (Rs)
Source: Study of Impact of WIRFP on Net Incomes of Target Households, Jan 2004.EIRR = Economic Internal Rate of Return (rate at which NPV equal to zero).
Before / Without Project After / With Project Increment

Table AN12.8.13 GVT - M Pradesh - Jhabua: Village Kadwapada: Weighted Household Livestock Net Margin Summary (Rs/Household).
Well Being Ranking Weight(%) Herd Value Net Margin Herd Value Net Margin Herd Value Net Margin
Phase I - Well Being Ranking (WBR) \1Madhya Pradesh - WBR Weighted DataVery Poor 8.0%
Average 580 (185.0) 5,650 412.5 474 597.5 Poor 26.0%
Average 2,350 982.5 8,250 2,141.0 1,180 1,158.5 Moderate 40.0%
Average 14,700 6,730.0 1,900 2,820.0 1,900 (3,910.0)Better Off 13.0%
Average 15,580 3,000.0 14,600 10,790.0 (196) 7,790.0
Phase I - WBR Weighted Data 87.0% 8,563 3,322.7 5,255 3,120.4 1,079 (202.3)
Phase II - Well Being Ranking (WBR)
Very Poor 8.0%Average 5,756 149.2 10,970 1,446.4 1,043 1,297.2
Poor 26.0%Average 13,128 852.2 25,979 3,008.8 2,570 2,156.8
Moderate 40.0%Average 13,525 4,035.1 27,020 5,249.5 2,699 1,214.4
Better Off 13.0%Average 12,700 (781.7) 41,873 2,573.3 5,835 3,355.0
Phase II - WBR Weighted Data 87.0% 10,935 1,745.9 23,884 3,332.3 2,590 1,586.4
Source: Study of Impact of WIRFP on Net Incomes of Target Households, Jan 2004.WBR = GVT Household Well Being Ranking. Survey figures adjusted to Village Profile WBR.
\1 GVT - Madhya Pradesh - Phase I: Village Naganwat Choti: Weighted Household Livestock Net Margin Summary.
Before / Without Project After / With Project Increment \1

WIRFP - Phase II - Cost Benefit Analysis Study
Tables AN12.0 Individual Village Cost Benefit Analysis
Tables AN12.9 GVT - Madhya Pradesh - Jhabua: Village Padabanda.
Table AN12.9.1 GVT - M Pradesh - Jhabua: Village Padabanda: Village Profile.
Table AN12.9.2 GVT - M Pradesh - Jhabua: Village Padabanda: Cost Benefit Analysis Summary (Rs'000).Table AN12.9.3 GVT - M Pradesh - Jhabua: Village Padabanda: Cost Benefit Analysis Development Activity Summary A (Rs'000).Table AN12.9.4 GVT - M Pradesh - Jhabua: Village Padabanda: Cost Benefit Analysis Development Activity Summary B (Rs'000).
Table AN12.9.5 GVT - M Pradesh - Jhabua: Village Padabanda: Costs - Financial (Rs'000).GVT - M Pradesh - Jhabua: Village Padabanda: Costs - Economic (Rs'000).
Table AN12.9.6 GVT - M Pradesh - Jhabua: Village Padabanda: VOD Household Assumptions.GVT - M Pradesh - Jhabua: Village Padabanda: Incremental VOD Benefit Stream (Rs'000).
Table AN12.9.7 GVT - M Pradesh - Jhabua: Village Padabanda: Household Crop Net Margin Assumptions.GVT - M Pradesh - Jhabua: Village Padabanda: Incremental Crop Benefit Stream (Rs'000).
Table AN12.9.8 GVT - M Pradesh - Jhabua: Village Padabanda: Household Livestock Net Margin Assumptions.GVT - M Pradesh - Jhabua: Village Padabanda: Incremental Livestock Benefit Stream (Rs'000).
Table AN12.9.9 GVT - M Pradesh - Jhabua: Village Padabanda: Forestry Benefit Assumptions.GVT - M Pradesh - Jhabua: Village Padabanda: Incremental Forestry Benefit Stream (Rs'000).
Table AN12.9.10 GVT - M Pradesh - Jhabua: Village Padabanda: Migration Support Benefit Assumptions.GVT - M Pradesh - Jhabua: Village Padabanda: Incremental Migration Support Benefit Stream (Rs'000).
Table AN12.9.11 GVT - M Pradesh - Jhabua: Village Padabanda: Weighted Household Crop Net Margin Summary (Rs/Household).Table AN12.9.12 GVT - M Pradesh - Jhabua: Village Padabanda: Weighted Household Crop Net Margin Sensitivity Analysis (Rs/Household).
Table AN12.9.13 GVT - M Pradesh - Jhabua: Village Padabanda: Weighted Household Livestock Net Margin Summary (Rs/Household).

Table AN12.9.1 GVT - M Pradesh - Jhabua: Village Padabanda: Village Profile.
Village Profile \1
A. Background D. Well Being Ranking (No Households)Village Name Padabanda Very Poor 4 10.8%District Jhabua Poor 11 29.7%State M P Moderate 11 29.7%
Better Off 11 29.7%B. Participatory Planning Process (PPP) Total 37 100%
Village entry Jan-00PRA Sep-00 E. Land Resource (ha)CPA Sep-00 Total Area N/A
Revenue Land (unused) N/AC. Infrastructure Forest Area - Revenue N/A
Hand Pumps (no) 4 Pasture Land N/AWells (no) 11 Arable Land N/ALinked by Road 5 km - Electrification YesSchool Primary F. Livestock
D. Demographic DataHouseholds (no) 40 Participating Households 37 Population (Adults) 295
Adults: Male 183 G. Self Help Groups (No Households) Female 112 1. Group 1 17 Children: 2. Group 2 10 Boys N/A 3. Group 3 10 Girls N/A 4. Group 4 -
5. Group 5 - 6. Group 6 -
37
Source: GVT Jhabua Coordination Office - Madhya Pradesh.\1 Subject to final adjustment following consolidation exercise prior to Annual Review Meeting (ARM) in Feb 2005.

Table AN12.9.2 GVT - M Pradesh - Jhabua: Village Padabanda: Cost Benefit Analysis Summary (Rs'000).
Administration Costs / Development Activity EIRR \1 Year 1 Year 2 Year 3 Year 4 Year 5 Year 6 Year 7 Year 8 Year 9 Year 10(10%) (%) 1999/00 2000/01 2001/02 2002/03 2003/04 2004/05 2005/06 2006/07 2007/08 2008/09
A. Administration CostsTotal A N/A -985 62% 35.9 227.2 236.8 235.6 317.7 236.8 206.7 20.7 20.7 20.7
B. Development Intervention Component A 1. PPGF
Net Incremental Benefits N/A -50 3% - (13.1) (15.4) (17.0) (5.6) (9.3) (10.4) (1.7) (1.7) (1.7)
2. VODNet Incremental Benefits -4% -106 7% - (16.6) (62.6) (92.4) (23.7) (3.3) (8.0) 10.0 10.1 10.1
3/5.Crop Technology, SWC and WRDNet Incremental Benefits N/A -710 45% - - (272.8) (449.9) (16.9) (569.3) 0.6 23.3 23.3 23.3
6. LivestockNet Incremental Benefits 61% 227 -14% - - (24.6) (36.2) 12.4 68.3 63.8 67.8 67.8 67.8
7. ForestryNet Incremental Benefits 36% 19 -1% - - (1.8) (13.3) 4.8 8.8 (2.1) 7.7 7.7 7.7
8. Migration SupportNet Incremental Benefits N/A 12 -1% - - - - - 2.2 3.2 3.2 3.2 3.2
SummaryNet Incremental Benefits N/A (1,593) 100% (35.9) (256.9) (614.1) (844.4) (346.7) (739.4) (159.7) 89.7 89.7 89.7
Sensitivity AnalysisAnalysis Period
12 Years N/A (1,708)20 Years (Base Case) N/A (1,593)25 Years N/A (1,560)30 Years -2% (1,541)
Costs - AdministrationInvestment Costs Decreased by 20 percent N/A (1,396)
Costs - Administration and DevelopmentRecurrent Costs Increased by 20 percent N/A (1,783)
Benefits - Crop, SWC and WRDCrop Benefits Increased by 20 percent -3% (1,349)Livestock Benefits Increased by 20 percent N/A (1,489)
Source: Cost Benefit Analysis (CBA) Study Estimate Jan 2005.\1 EIRR = Economic Internal Rate of Return (rate at which NPV equal to zero).\2 NPV = Net Present Value of net incremental benefits at 12% (indicative opportunity cost of capital for rural development projects in India).
N/A = Not analysed as EIRR negative.
NPV \2

Table AN12.9.3 GVT - M Pradesh - Jhabua: Village Padabanda: Cost Benefit Analysis Development Activity Summary A (Rs'000).
Administration Costs / Development Activity EIRR \1 Year 1 Year 2 Year 3 Year 4 Year 5 Year 6 Year 7 Year 8 Year 9 Year 10(10%) (%) 1999/00 2000/01 2001/02 2002/03 2003/04 2004/05 2005/06 2006/07 2007/08 2008/09
A. Administration CostsInvestment 35.9 227.2 236.8 235.6 317.7 236.8 206.7 - - - Recurrent - - - - - - - 20.7 20.7 20.7
Total (A) N/A (985.3) 62% 35.9 227.2 236.8 235.6 317.7 236.8 206.7 20.7 20.7 20.7
B. Development Intervention Component A 1. PPGF
Cost StreamInvestment - 13.1 15.1 16.3 4.5 8.1 9.0 - - - Recurrent - - 0.3 0.7 1.1 1.2 1.4 1.7 1.7 1.7 Total Costs - 13.1 15.4 17.0 5.6 9.3 10.4 1.7 1.7 1.7
Benefit StreamBefore / Without Project - - - - - - - - - - After / With Project - - - - - - - - - - Incremental Benefits - - - - - - - - - -
Net Incremental Benefits N/A (49.6) 3% - (13.1) (15.4) (17.0) (5.6) (9.3) (10.4) (1.7) (1.7) (1.7)
2. VODCost Stream
Investment - 16.6 85.9 111.4 37.2 15.0 18.9 - - - Recurrent - - 0.8 5.1 10.7 12.6 13.3 14.3 14.3 14.3 Total Costs - 16.6 86.7 116.6 47.9 27.5 32.2 14.3 14.3 14.3
Benefit StreamBefore / Without Project - - - - - - - - - - After / With Project - - 24.1 24.1 24.2 24.2 24.2 24.3 24.3 24.3 Incremental Benefits - - 24.1 24.1 24.2 24.2 24.2 24.3 24.3 24.3
Net Incremental Benefits -4% (106.0) 7% - (16.6) (62.6) (92.4) (23.7) (3.3) (8.0) 10.0 10.1 10.1
3/5.Crop Technology, SWC and WRDCost Stream
InvestmentCrop Technology - - 32.1 62.2 24.2 12.6 9.5 - - - Soil Water Conservation - - 168.7 285.9 63.1 69.7 - - - - Water Resource Development - - 72.0 69.0 76.6 614.0 15.8 - - -
RecurrentCrop Technology - - - 0.8 2.4 3.0 3.3 3.5 3.5 3.5 Soil Water Conservation - - - 21.1 56.8 64.7 73.4 73.4 73.4 73.4 Water Resource Development - - - 10.8 21.2 32.6 124.8 127.1 127.1 127.1
Total Costs - - 272.8 449.9 244.2 796.6 226.7 204.1 204.1 204.1 Benefit Stream
Before / Without Project - - - - 110.7 110.7 110.7 110.7 110.7 110.7 After / With Project - - - - 338.0 338.0 338.0 338.0 338.0 338.0 Incremental Benefits - - - - 227.3 227.3 227.3 227.3 227.3 227.3
Net Incremental Benefits N/A (710.2) 45% - - (272.8) (449.9) (16.9) (569.3) 0.6 23.3 23.3 23.3
Source: Cost Benefit Analysis (CBA) Study Estimate Jan 2005.\1 EIRR = Economic Internal Rate of Return (rate at which NPV equal to zero).\2 NPV = Net Present Value of net incremental benefits at 12% (indicative opportunity cost of capital for rural development projects in India).
N/A = Not analysed as EIRR negative.
NPV \2
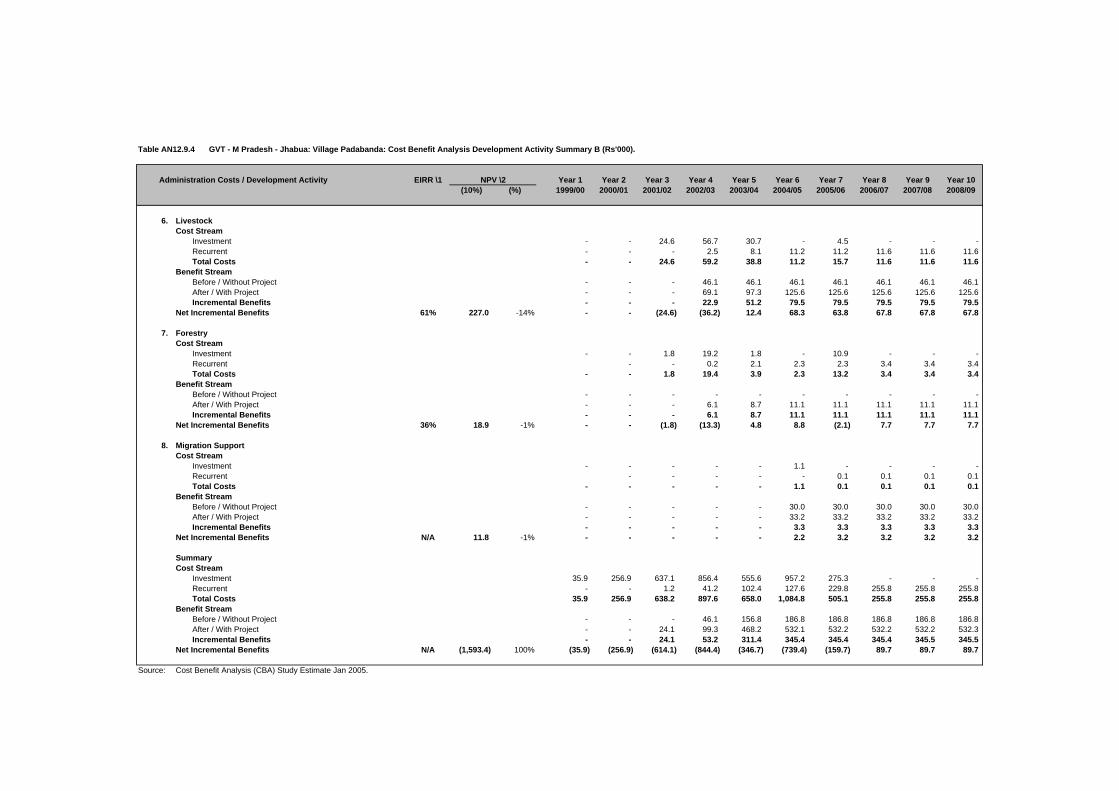
Table AN12.9.4 GVT - M Pradesh - Jhabua: Village Padabanda: Cost Benefit Analysis Development Activity Summary B (Rs'000).
Administration Costs / Development Activity EIRR \1 Year 1 Year 2 Year 3 Year 4 Year 5 Year 6 Year 7 Year 8 Year 9 Year 10(10%) (%) 1999/00 2000/01 2001/02 2002/03 2003/04 2004/05 2005/06 2006/07 2007/08 2008/09
6. LivestockCost Stream
Investment - - 24.6 56.7 30.7 - 4.5 - - - Recurrent - - - 2.5 8.1 11.2 11.2 11.6 11.6 11.6 Total Costs - - 24.6 59.2 38.8 11.2 15.7 11.6 11.6 11.6
Benefit StreamBefore / Without Project - - - 46.1 46.1 46.1 46.1 46.1 46.1 46.1 After / With Project - - - 69.1 97.3 125.6 125.6 125.6 125.6 125.6 Incremental Benefits - - - 22.9 51.2 79.5 79.5 79.5 79.5 79.5
Net Incremental Benefits 61% 227.0 -14% - - (24.6) (36.2) 12.4 68.3 63.8 67.8 67.8 67.8
7. ForestryCost Stream
Investment - - 1.8 19.2 1.8 - 10.9 - - - Recurrent - - 0.2 2.1 2.3 2.3 3.4 3.4 3.4 Total Costs - - 1.8 19.4 3.9 2.3 13.2 3.4 3.4 3.4
Benefit StreamBefore / Without Project - - - - - - - - - - After / With Project - - - 6.1 8.7 11.1 11.1 11.1 11.1 11.1 Incremental Benefits - - - 6.1 8.7 11.1 11.1 11.1 11.1 11.1
Net Incremental Benefits 36% 18.9 -1% - - (1.8) (13.3) 4.8 8.8 (2.1) 7.7 7.7 7.7
8. Migration SupportCost Stream
Investment - - - - - 1.1 - - - - Recurrent - - - - - 0.1 0.1 0.1 0.1 Total Costs - - - - - 1.1 0.1 0.1 0.1 0.1
Benefit StreamBefore / Without Project - - - - - 30.0 30.0 30.0 30.0 30.0 After / With Project - - - - - 33.2 33.2 33.2 33.2 33.2 Incremental Benefits - - - - - 3.3 3.3 3.3 3.3 3.3
Net Incremental Benefits N/A 11.8 -1% - - - - - 2.2 3.2 3.2 3.2 3.2
SummaryCost Stream
Investment 35.9 256.9 637.1 856.4 555.6 957.2 275.3 - - - Recurrent - - 1.2 41.2 102.4 127.6 229.8 255.8 255.8 255.8 Total Costs 35.9 256.9 638.2 897.6 658.0 1,084.8 505.1 255.8 255.8 255.8
Benefit StreamBefore / Without Project - - - 46.1 156.8 186.8 186.8 186.8 186.8 186.8 After / With Project - - 24.1 99.3 468.2 532.1 532.2 532.2 532.2 532.3 Incremental Benefits - - 24.1 53.2 311.4 345.4 345.4 345.4 345.5 345.5
Net Incremental Benefits N/A (1,593.4) 100% (35.9) (256.9) (614.1) (844.4) (346.7) (739.4) (159.7) 89.7 89.7 89.7
Source: Cost Benefit Analysis (CBA) Study Estimate Jan 2005.
NPV \2

Table AN12.9.5 GVT - M Pradesh - Jhabua: Village Padabanda: Costs - Financial (Rs'000).
Cost Head / Subhead 1999/00 2000/01 2001/02 2002/03 2003/04 2004/05 2005/06Actual Actual Actual Actual Actual Budget Budget (Rs'000) (%)
A. Administration CostsGVT Bhopal (PHQ) - 60.3 75.4 67.3 52.8 66.8 61.1 383.7 9%DFIDI Consultancy 35.9 71.4 26.9 63.2 47.4 54.7 39.2 338.6 8%Jhabua Coordination Office - 112.9 157.8 124.3 247.5 135.5 125.0 903.0 20%
Total A 35.9 244.5 260.2 254.8 347.7 257.0 225.3 1,625.4 36%
B. Development CostsComponent A 1. PPGF - 14.5 16.8 18.1 5.0 9.0 10.0 73.4 2% 2. VOD - 18.5 95.4 123.8 41.3 16.6 21.0 316.7 7% 3. Crop Technology - - 35.6 69.1 26.9 14.0 10.5 156.1 3% 4. SWC - - 250.0 423.6 93.5 103.2 - 870.2 19% 5. WRD - - 106.7 102.3 113.5 909.7 23.4 1,255.5 28% 6. Livestock - - 27.4 63.0 34.1 - 5.0 129.4 3% 7. Forestry - - 2.0 21.3 2.0 - 12.2 37.5 1%8. Migration Support - - - - - 1.2 - 1.2 0%
Subtotal - 33.0 533.8 821.2 316.2 1,053.7 82.1 2,840.0 64%
Other Development CostsSubtotal - - - - - - - - 0%
Total B - 33.0 533.8 821.2 316.2 1,053.7 82.1 2,840.0 64%
Total A + B 35.9 277.5 794.0 1,076.0 663.9 1,310.7 307.4 4,465.4 100%
GVT - 205.6 625.8 790.3 567.7 1,096.8 262.2 3,548.4 79%DFIDI 35.9 71.4 26.9 63.2 47.4 54.7 39.2 338.6 8%Community - 0.1 139.9 216.3 46.3 158.6 4.6 565.9 13%Government - 0.4 1.3 6.2 2.4 0.6 1.5 12.5 0%
Source: GVT Jhabua Coordination Office - Madhya Pradesh.
DFIDI = Department for International Development (India).PPGF = Participatory Planning and Group Formation.VOD = Village Organisation and Development.SWC = Soil and Water Conservation.WRD = Water Resource Development.
Totals

Table AN12.9.5
Cost Head / Subhead
A. Administration CostsGVT Bhopal (PHQ)DFIDI ConsultancyJhabua Coordination Office
Total A
B. Development CostsComponent A 1. PPGF 2. VOD 3. Crop Technology 4. SWC 5. WRD 6. Livestock 7. Forestry8. Migration Support
Subtotal
Other Development CostsSubtotal
Total B
Total A + B
GVTDFIDICommunityGovernment
Source:
DFIDI = Department for International Development (India).PPGF = Participatory Planning and Group Formation.VOD = Village Organisation and Development.SWC = Soil and Water Conservation.WRD = Water Resource Development.
GVT - M Pradesh - Jhabua: Village Padabanda: Costs - Economic (Rs'000).
1999/00 2000/01 2001/02 2002/03 2003/04 2004/05 2005/06CF SCF Actual Actual Actual Actual Actual Budget Budget (Rs'000) (%)
0.90 1.00 - 54.2 67.9 60.6 47.5 60.1 55.0 345.4 10%1.00 1.00 35.9 71.4 26.9 63.2 47.4 54.7 39.2 338.6 9%0.90 1.00 - 101.6 142.0 111.9 222.7 122.0 112.5 812.7 23%
35.9 227.2 236.8 235.6 317.7 236.8 206.7 1,496.7 42%
0.90 1.00 - 13.1 15.1 16.3 4.5 8.1 9.0 66.0 2%0.90 1.00 - 16.6 85.9 111.4 37.2 15.0 18.9 285.0 8%0.90 1.00 - - 32.1 62.2 24.2 12.6 9.5 140.5 4%0.90 0.75 - - 168.7 285.9 63.1 69.7 - 587.4 16%0.90 0.75 - - 72.0 69.0 76.6 614.0 15.8 847.5 24%0.90 1.00 - - 24.6 56.7 30.7 - 4.5 116.4 3%0.90 1.00 - - 1.8 19.2 1.8 - 10.9 33.8 1%0.90 1.00 - - - - - 1.1 - 1.1 0%
- 29.7 400.2 620.8 238.0 720.4 68.6 2,077.7 58%
0.90 1.00 - - - - - - - - 0%- 29.7 400.2 620.8 238.0 720.4 68.6 2,077.7 58%
35.9 256.9 637.1 856.4 555.6 957.2 275.3 3,574.4 100%
- - - - - - - N/A- - - - - - - N/A- - - - - - - N/A- - - - - - - N/A
Cost Benefit Analysis (CBA) Study Estimate Jan 2005.
Totalsonversion Factors

Table AN12.9.6 GVT - M Pradesh - Jhabua: Village Padabanda: VOD Household Assumptions.
Without \ With Project UnitsVillage Organisation and Development Year 1 Year 2 Year 3
(Rs) (Rs) (Rs)
Development Activity:Village Organisation and Development
Before / Without Project Situation:
A. Self Help Groups (SHGs)Assumption Sum Zero Zero Zero - - -
B. Drudgery ReductionAssumption Sum Zero Zero Zero
Total Without Project Benefits - - -
After / With Project Situation:
A. Self Help Groups (SHGs)Assumptions
Average Saving / Household Rs 889 Households / Village No 37 Group Savings Deposits Rs'000 32.9 32.9 33.9 34.9 Annual Savings Increase % 3%Deposits on Loan to Members % 20%SHG Interest Income % / Year 15%Assumed Benefit Rs'000 1.0 1.0 1.0
B. Drudgery ReductionAssumptions
Hours Saved / Day / Household No 1.0 Number of Days / Year / Household No 200 Days / Year / Household (8hrs/day) No 25.0 Households / Village No 37 Day Equivalent / Village No 925 Economic Value per Day (Rs/day) 25 Assumed Benefit Rs'000 23.1 23.1 23.1
Total With Project Benefits Rs'000 24.1 24.1 24.2
Incremental Benefits Rs'000 24.1 24.1 24.2
Source: Cost Benefit Analysis (CBA) Study Estimate Jan 2005.VOD = Village Organisation and Development.Participating households per village: Padabanda 37
Assumptions Benefits

Table AN12.9.6
Without \ With ProjectVillage Organisation and Development
Development Activity:Village Organisation and Development
Before / Without Project Situation:
A. Self Help Groups (SHGs)Assumption
B. Drudgery ReductionAssumption
Total Without Project Benefits
After / With Project Situation:
A. Self Help Groups (SHGs)Assumptions
Average Saving / HouseholdHouseholds / VillageGroup Savings DepositsAnnual Savings IncreaseDeposits on Loan to MembersSHG Interest Income Assumed Benefit
B. Drudgery ReductionAssumptions
Hours Saved / Day / HouseholdNumber of Days / Year / HouseholdDays / Year / Household (8hrs/day)Households / VillageDay Equivalent / VillageEconomic Value per DayAssumed Benefit
Total With Project Benefits
Incremental Benefits
Source:VOD = Village Organisation and Development.Participating households per village: Padabanda
GVT - M Pradesh - Jhabua: Village Padabanda: Incremental VOD Benefit Stream (Rs'000).
Year 1 Year 2 Year 3 Year 4 Year 5 Year 6 Year 7 Year 8 Year 9 Year 101999/00 2000/01 2001/02 2002/03 2003/04 2004/05 2005/06 2006/07 2007/08 2008/09
- - - - - - - - - -
- - 32.9 33.9 34.9 36.0 37.0 38.1 39.3 40.5
- - 1.0 1.0 1.0 1.1 1.1 1.1 1.2 1.2
- - 23.1 23.1 23.1 23.1 23.1 23.1 23.1 23.1
- - 24.1 24.1 24.2 24.2 24.2 24.3 24.3 24.3
- - 24.1 24.1 24.2 24.2 24.2 24.3 24.3 24.3
Cost Benefit Analysis (CBA) Study Estimate Jan 2005.
Benefit Streams (Rs '000)

Table AN12.9.7 GVT - M Pradesh - Jhabua: Village Padabanda: Household Crop Net Margin Assumptions.
Without \ With Project UnitsCrop Technology, SWC and WRD Year 1 Year 2 Year 3
(Rs/HH) (Rs/HH) (Rs/HH)
Development Activity:Crop Technology, SWC and WRD
Before / Without Project Situation:Assumptions
Households (HHs) No 37 Crop Adoption Assumptions 100% 100% 100%
Kharif Crop Net Margin Rs/HH 2,427.2 2,427.2 2,427.2
Rabi Crop Net Margin Rs/HH 564 564.0 564.0 Total Without Project Benefits Rs/HH 2,991.2 2,991.2 2,991.2
After / With Project Situation:Assumptions
Households (HHs) No 37 Crop Adoption Assumptions 100% 100% 100%
Kharif Crop Net Margin Rs/HH 7,598.0 7,598.0 7,598.0
Rabi Crop Net Margin Rs/HH 1,537.3 1,537.3 1,537.3 Total With Project Benefits Rs/HH 9,135.3 9,135.3 9,135.3
Incremental Benefits Rs/HH 6,144.0 6,144.0 6,144.0
Source: Cost Benefit Analysis (CBA) Study Estimate Jan 2005.
Assumptions Benefits

Table AN12.9.7
Without \ With ProjectCrop Technology, SWC and WRD
Development Activity:Crop Technology, SWC and WRD
Before / Without Project Situation:Assumptions
Households (HHs)Crop Adoption Assumptions
Kharif Crop Net Margin
Rabi Crop Net MarginTotal Without Project Benefits
After / With Project Situation:Assumptions
Households (HHs)Crop Adoption Assumptions
Kharif Crop Net Margin
Rabi Crop Net MarginTotal With Project Benefits
Incremental Benefits
Source:
GVT - M Pradesh - Jhabua: Village Padabanda: Incremental Crop Benefit Stream (Rs'000).
Year 1 Year 2 Year 3 Year 4 Year 5 Year 6 Year 7 Year 8 Year 9 Year 101999/00 2000/01 2001/02 2002/03 2003/04 2004/05 2005/06 2006/07 2007/08 2008/09
- - - - 89.8 89.8 89.8 89.8 89.8 89.8
- - - - 20.9 20.9 20.9 20.9 20.9 20.9 - - - - 110.7 110.7 110.7 110.7 110.7 110.7
- - - - 281.1 281.1 281.1 281.1 281.1 281.1
- - - - 56.9 56.9 56.9 56.9 56.9 56.9 - - - - 338.0 338.0 338.0 338.0 338.0 338.0
- - - - 227.3 227.3 227.3 227.3 227.3 227.3
Cost Benefit Analysis (CBA) Study Estimate Jan 2005.
Benefit Streams (Rs '000)

Table AN12.9.8 GVT - M Pradesh - Jhabua: Village Padabanda: Household Livestock Net Margin Assumptions.
Without \ With Project UnitsLivestock Year 1 Year 2 Year 3
(Rs) (Rs) (Rs)
Development Activity:Livestock
Before / Without Project Situation:Assumptions
Households (HHs) No 37 Annual Livestock Net Margin Rs/HH
Total Without Project Benefits 1,246.6 1,246.6 1,246.6
After / With Project Situation:
Development Activity:Assumptions
Households (HHs) No 37 Adoption Assumptions Percent 55% 78% 100%
Annual Livestock Net Margin Rs/HHTotal With Project Benefits 1,866.8 2,630.5 3,394.1
Incremental Benefits Rs/HH 620.2 1,383.8 2,147.5
Source: Cost Benefit Analysis (CBA) Study Estimate Jan 2005.
Assumptions Benefits

Table AN12.9.8
Without \ With ProjectLivestock
Development Activity:Livestock
Before / Without Project Situation:Assumptions
Households (HHs)Annual Livestock Net Margin
Total Without Project Benefits
After / With Project Situation:
Development Activity:Assumptions
Households (HHs)Adoption Assumptions
Annual Livestock Net MarginTotal With Project Benefits
Incremental Benefits
Source:
GVT - M Pradesh - Jhabua: Village Padabanda: Incremental Livestock Benefit Stream (Rs'000).
Year 1 Year 2 Year 3 Year 4 Year 5 Year 6 Year 7 Year 8 Year 9 Year 101999/00 2000/01 2001/02 2002/03 2003/04 2004/05 2005/06 2006/07 2007/08 2008/09
- - - 46.1 46.1 46.1 46.1 46.1 46.1 46.1
- - - 69.1 97.3 125.6 125.6 125.6 125.6 125.6
- - - 22.9 51.2 79.5 79.5 79.5 79.5 79.5
Cost Benefit Analysis (CBA) Study Estimate Jan 2005.
Benefit Streams (Rs '000)

Table AN12.9.9 GVT - M Pradesh - Jhabua: Village Padabanda: Forestry Benefit Assumptions.
Without \ With Project UnitsForestry Year 1 Year 2 Year 3
(Rs) (Rs) (Rs)
Development Activity:Forestry
Before / Without Project Situation:AssumptionsHouseholds (HHs) No 37 Annual Forestry Net Margin Rs/HH
Total Without Project Benefits - - -
After / With Project Situation:AssumptionsHouseholds (HHs) No 37 Adoption Assumptions Percent 55% 78% 100%Annual Forestry Net Margin Rs/HH
Total With Project Benefits 165.0 234.0 300.0
Incremental Benefits Rs/HH 165.0 234.0 300.0
Source: Cost Benefit Analysis (CBA) Study Estimate Jan 2005.
Assumptions Benefits

Table AN12.9.9
Without \ With ProjectForestry
Development Activity:Forestry
Before / Without Project Situation:AssumptionsHouseholds (HHs)Annual Forestry Net Margin
Total Without Project Benefits
After / With Project Situation:AssumptionsHouseholds (HHs)Adoption AssumptionsAnnual Forestry Net Margin
Total With Project Benefits
Incremental Benefits
Source:
GVT - M Pradesh - Jhabua: Village Padabanda: Incremental Forestry Benefit Stream (Rs'000).
Year 1 Year 2 Year 3 Year 4 Year 5 Year 6 Year 7 Year 8 Year 9 Year 101999/00 2000/01 2001/02 2002/03 2003/04 2004/05 2005/06 2006/07 2007/08 2008/09
- - - - - - - - - -
- - - 6.1 8.7 11.1 11.1 11.1 11.1 11.1
- - - 6.1 8.7 11.1 11.1 11.1 11.1 11.1
Cost Benefit Analysis (CBA) Study Estimate Jan 2005.
Benefit Streams (Rs '000)

Table AN12.9.10 GVT - M Pradesh - Jhabua: Village Padabanda: Migration Support Benefit Assumptions.
Without \ With ProjectYear 1 Year 2 Year 3(Rs) (Rs) (Rs)
Development Activity:Migration Support
Before / Without Project Situation:Assumptions
Economic Value per Day Rs/day 25.0 Days / Month / Household No 18 Economic Value per Month Rs/month 450.0 Months Migration / Year Months 4.0 Economic Value per Household Rs/HH 1,800.0 Households per Village No 37 Households per Village Migrating Percent 45%
Total Without Project Benefits Rs/Village 30.0 30.0 30.0
After / With Project Situation:Assumptions
Economic Value per Day \1 Rs/day 25.0 30% 32.5 Days / Month / Household No 18 30% 24.0 Economic Value per Month Rs/month 450.0 780.0 Months Migration / Year Months 4.0 -20% 3.2 Economic Value per Household Rs/HH 1,800.0 2,496.0 Households per Village No 37 37 Households per Village Migrating Percent 45% -20% 36%
Subtotal Migration Income Rs/Village 33.2 33.2 33.2
Other Income Sum (Rs) - - - - - -
Total With Project Benefits Rs/Village 33.2 33.2 33.2
Incremental Benefits Rs/Village 3.3 3.3 3.3
Source: Cost Benefit Analysis (CBA) Study Estimate Jan 2005.
1\ Financial Wages (Rs/day):Skill Labour - Rs 160
Casual Labour :Male - Rs 40Female - Rs 30
Assumptions Benefits

Table AN12.9.10
Without \ With Project
Development Activity:Migration Support
Before / Without Project Situation:Assumptions
Economic Value per Day Days / Month / Household Economic Value per Month Months Migration / Year Economic Value per Household Households per Village Households per Village Migrating
Total Without Project Benefits
After / With Project Situation:Assumptions
Economic Value per Day \1Days / Month / Household Economic Value per Month Months Migration / Year Economic Value per Household Households per Village Households per Village Migrating
Subtotal Migration Income
Other Income
Total With Project Benefits
Incremental Benefits
Source:
1\ Financial Wages (Rs/day):Skill Labour - Rs 160
Casual Labour :Male - Rs 40Female - Rs 30
GVT - M Pradesh - Jhabua: Village Padabanda: Incremental Migration Support Benefit Stream (Rs'000).
Year 1 Year 2 Year 3 Year 4 Year 5 Year 6 Year 7 Year 8 Year 9 Year 101999/00 2000/01 2001/02 2002/03 2003/04 2004/05 2005/06 2006/07 2007/08 2008/09
- - - - - 30.0 30.0 30.0 30.0 30.0
- - - - - 33.2 33.2 33.2 33.2 33.2
- - - - - - - - - -
- - - - - 33.2 33.2 33.2 33.2 33.2
- - - - - 3.3 3.3 3.3 3.3 3.3
Cost Benefit Analysis (CBA) Study Estimate Jan 2005.
Benefit Streams (Rs '000)
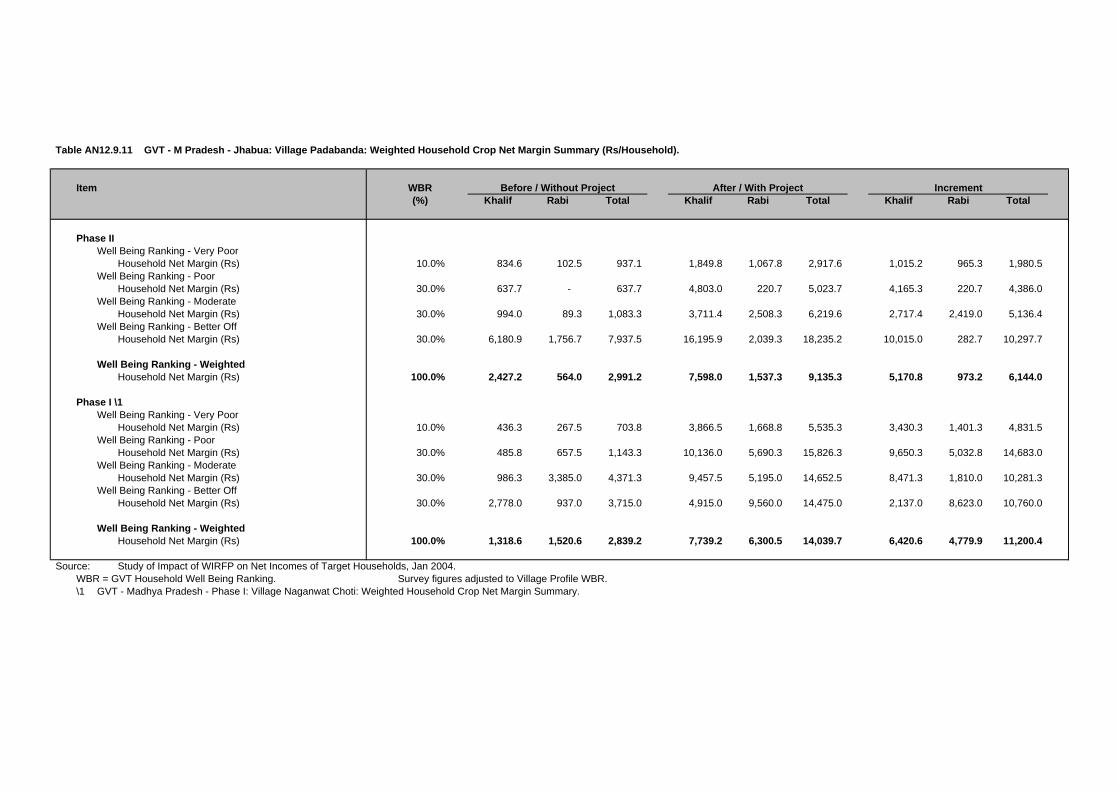
Table AN12.9.11 GVT - M Pradesh - Jhabua: Village Padabanda: Weighted Household Crop Net Margin Summary (Rs/Household).
Item WBR(%) Khalif Rabi Total Khalif Rabi Total Khalif Rabi Total
Phase IIWell Being Ranking - Very Poor
Household Net Margin (Rs) 10.0% 834.6 102.5 937.1 1,849.8 1,067.8 2,917.6 1,015.2 965.3 1,980.5 Well Being Ranking - Poor
Household Net Margin (Rs) 30.0% 637.7 - 637.7 4,803.0 220.7 5,023.7 4,165.3 220.7 4,386.0 Well Being Ranking - Moderate
Household Net Margin (Rs) 30.0% 994.0 89.3 1,083.3 3,711.4 2,508.3 6,219.6 2,717.4 2,419.0 5,136.4 Well Being Ranking - Better Off
Household Net Margin (Rs) 30.0% 6,180.9 1,756.7 7,937.5 16,195.9 2,039.3 18,235.2 10,015.0 282.7 10,297.7
Well Being Ranking - WeightedHousehold Net Margin (Rs) 100.0% 2,427.2 564.0 2,991.2 7,598.0 1,537.3 9,135.3 5,170.8 973.2 6,144.0
Phase I \1Well Being Ranking - Very Poor
Household Net Margin (Rs) 10.0% 436.3 267.5 703.8 3,866.5 1,668.8 5,535.3 3,430.3 1,401.3 4,831.5 Well Being Ranking - Poor
Household Net Margin (Rs) 30.0% 485.8 657.5 1,143.3 10,136.0 5,690.3 15,826.3 9,650.3 5,032.8 14,683.0 Well Being Ranking - Moderate
Household Net Margin (Rs) 30.0% 986.3 3,385.0 4,371.3 9,457.5 5,195.0 14,652.5 8,471.3 1,810.0 10,281.3 Well Being Ranking - Better Off
Household Net Margin (Rs) 30.0% 2,778.0 937.0 3,715.0 4,915.0 9,560.0 14,475.0 2,137.0 8,623.0 10,760.0
Well Being Ranking - WeightedHousehold Net Margin (Rs) 100.0% 1,318.6 1,520.6 2,839.2 7,739.2 6,300.5 14,039.7 6,420.6 4,779.9 11,200.4
Source: Study of Impact of WIRFP on Net Incomes of Target Households, Jan 2004.WBR = GVT Household Well Being Ranking. Survey figures adjusted to Village Profile WBR.\1 GVT - Madhya Pradesh - Phase I: Village Naganwat Choti: Weighted Household Crop Net Margin Summary.
Before / Without Project After / With Project Increment

Table AN12.9.12 GVT - M Pradesh - Jhabua: Village Padabanda: Weighted Household Crop Net Margin Sensitivity Analysis (Rs/Household).
Item EIRRKhalif Rabi Total Khalif Rabi Total Khalif Rabi Total
Development Activity:Crop Technology, SWC and WRD
Weighted Net Margin (Phase II)Household Net Margin (Rs) 2,427.2 564.0 2,991.2 7,598.0 1,537.3 9,135.3 5,170.8 973.2 6,144.0 Incremental Benefit (Phase II / Phase I) 55%
Base Case AssumptionsHousehold Net Margin (Rs) 2,427.2 564.0 2,991.2 7,598.0 1,537.3 9,135.3 5,170.8 973.2 6,144.0 Incremental Benefit (Phase II / Phase I) 55%Sensitivity Increase (%) 0%Development Activity N/AOverall Village N/A
Sensitivity AssumptionsHousehold Net Margin (Rs) 2,427.2 564.0 2,991.2 17,475.5 3,535.7 21,011.2 15,048.3 2,971.7 18,019.9 Incremental Benefit (Phase II / Phase I) 161%Sensitivity Increase (%) 0%Development Activity 27%Overall Village 12%
Weighted Net Margin (Phase I) 1,318.6 1,520.6 2,839.2 7,739.2 6,300.5 14,039.7 6,420.6 4,779.9 11,200.4 Household Net Margin (Rs)
Source: Study of Impact of WIRFP on Net Incomes of Target Households, Jan 2004.EIRR = Economic Internal Rate of Return (rate at which NPV equal to zero).N/A = Not analysed as EIRR negative.
Before / Without Project After / With Project Increment

Table AN12.9.13 GVT - M Pradesh - Jhabua: Village Padabanda: Weighted Household Livestock Net Margin Summary (Rs/Household).
Well Being Ranking Weight(%) Herd Value Net Margin Herd Value Net Margin Herd Value Net Margin
Phase I - Well Being Ranking (WBR) \1Madhya Pradesh - WBR Weighted DataVery Poor 10.0%
Average 580 (185.0) 5,650 412.5 474 597.5 Poor 30.0%
Average 2,350 982.5 8,250 2,141.0 1,180 1,158.5 Moderate 30.0%
Average 14,700 6,730.0 1,900 2,820.0 1,900 (3,910.0)Better Off 30.0%
Average 15,580 3,000.0 14,600 10,790.0 (196) 7,790.0
Phase I - WBR Weighted Data 100.0% 9,847 3,195.3 7,990 4,766.6 913 1,571.3
Phase II - Well Being Ranking (WBR)
Very Poor 10.0%Average 5,756 149.2 10,970 1,446.4 1,043 1,297.2
Poor 30.0%Average 13,128 852.2 25,979 3,008.8 2,570 2,156.8
Moderate 30.0%Average 13,525 4,035.1 27,020 5,249.5 2,699 1,214.4
Better Off 30.0%Average 12,700 (781.7) 41,873 2,573.3 5,835 3,355.0
Phase II - WBR Weighted Data 100.0% 12,382 1,246.6 29,559 3,394.1 3,435 2,147.6
Source: Study of Impact of WIRFP on Net Incomes of Target Households, Jan 2004.WBR = GVT Household Well Being Ranking. Survey figures adjusted to Village Profile WBR.
\1 GVT - Madhya Pradesh - Phase I: Village Naganwat Choti: Weighted Household Livestock Net Margin Summary.
Before / Without Project After / With Project Increment \1

WIRFP - Phase II - Cost Benefit Analysis Study
Tables AN12.0 Individual Village Cost Benefit Analysis
Tables AN12.10 GVT - Rajasthan - Banswara: Village Bakaner.
Table AN12.10.1 GVT - Rajasthan - Banswara: Village Bakaner: Village Profile.
Table AN12.10.2 GVT - Rajasthan - Banswara: Village Bakaner - Cost Benefit Analysis Summary (Rs'000).Table AN12.10.3 GVT - Rajasthan - Banswara: Village Bakaner - Cost Benefit Analysis Development Activity Summary A (Rs'000).Table AN12.10.4 GVT - Rajasthan - Banswara: Village Bakaner - Cost Benefit Analysis Development Activity Summary B (Rs'000).
Table AN12.10.5 GVT - Rajasthan - Banswara: Village Bakaner - Costs - Financial (Rs'000).GVT - Rajasthan - Banswara: Village Bakaner - Costs - Economic (Rs'000).
Table AN12.10.6 GVT - Rajasthan - Banswara: Village Bakaner: VOD Household Assumptions.GVT - Rajasthan - Banswara: Village Bakaner: Incremental VOD Benefit Stream (Rs'000).
Table AN12.10.7 GVT - Rajasthan - Banswara: Village Bakaner: Household Crop Net Margin Assumptions.GVT - Rajasthan - Banswara: Village Bakaner: Incremental Crop Benefit Stream (Rs'000).
Table AN12.10.8 GVT - Rajasthan - Banswara: Village Bakaner: Household Livestock Net Margin Assumptions.GVT - Rajasthan - Banswara: Village Bakaner: Incremental Livestock Benefit Stream (Rs'000).
Table AN12.10.9 GVT - Rajasthan - Banswara: Village Bakaner: Forestry Benefit Assumptions.GVT - Rajasthan - Banswara: Village Bakaner: Incremental Forestry Benefit Stream (Rs'000).
Table AN12.10.10 GVT - Rajasthan - Banswara: Village Bakaner: Migration Support Benefit Assumptions.GVT - Rajasthan - Banswara: Village Bakaner: Incremental Migration Support Benefit Stream (Rs'000).
Table AN12.10.11 GVT - Rajasthan - Banswara: Village Bakaner: Weighted Household Crop Net Margin Summary (Rs/Household).Table AN12.10.12 GVT - Rajasthan - Banswara: Village Bakaner: Household Crop Net Margin Sensitivity Analysis.
Table AN12.10.13 GVT - Rajasthan - Banswara: Village Bakaner: Weighted Household Livestock Net Margin Summary (Rs/Household).

Table AN12.10.1 GVT - Rajasthan - Banswara: Village Bakaner: Village Profile.
Village Profile \1
A. Background F. Land Resource (ha)Village Name Bakaner Total Area 215 District Banswara Revenue Land (unused) 15 State Rajasthan Forest Area - Revenue 78
Pasture Land 8 B. Participatory Planning Process (PPP) Arable Land 114
Village entry Aug-00PRA Jan-01CPA Jan-01 G. Livestock
Oxen 162 C. Infrastructure Cows 79
Hand Pumps (no) 6 Buffalo 81 Wells (no) 16 Goats 239 Linked by Road No Poultry N/AElectrification NoSchool Primary H. Self Help Groups (Membership)
1 Group 1 20 D. Demographic Data 2 Group 2 21
Households (no) 72 3 Group 3 13 Participating Households 70 4 Group 4 16 Population (Adults) 329 5 Group 5 15
Adults: 6 Group 6 20 Male 167 7 Group 7 12 Female 162 8 Group 8 21 Children: 9 Group 9 - Boys 103 10 Group 10 - Girls 94 11 Group 11 -
12 Group 12 - E. Well Being Ranking (No Households) 13 Group 13 -
Very Poor 15 22.7% Total Memberhip 138 Poor 18 27.3%Moderate 27 40.9%Better Off 6 9.1%Total 66 100%
Source: GVT Banswara Coordination Office - Rajasthan.\1 Subject to final adjustment following consolidation exercise prior to Annual Review Meeting (ARM) in Feb 2005.

Table AN12.10.2 GVT - Rajasthan - Banswara: Village Bakaner - Cost Benefit Analysis Summary (Rs'000).
Administration Costs / Development Activity EIRR \1 Year 1 Year 2 Year 3 Year 4 Year 5 Year 6 Year 7 Year 8 Year 9 Year 10(10%) (%) 1999/00 2000/01 2001/02 2002/03 2003/04 2004/05 2005/06 2006/07 2007/08 2008/09
A. Administration CostsTotal A N/A (972) 106% 35.9 241.3 227.1 238.6 249.5 250.3 223.6 22.4 22.4 22.4
B. Development Activity Component A 1. PPGF
Net Incremental Benefits N/A (141) 15% - (13.2) (34.0) (53.1) (47.6) (30.1) (35.2) (5.0) (5.0) (5.0)
2. VODNet Incremental Benefits 18% 70 -8% - (46.5) (103.8) (29.2) 7.6 35.5 31.2 55.3 55.8 56.3
3/5.Crop Technology, SWC and WRDNet Incremental Benefits 9% (174) 19% - (5.8) (364.4) (757.7) (226.7) 136.3 108.4 200.3 200.3 200.3
6. LivestockNet Incremental Benefits 41% 269 -29% - - (27.3) (42.4) (52.3) 59.6 (32.9) 113.4 113.4 113.4
7. ForestryNet Incremental Benefits 39% 30 -3% - (5.2) (5.0) (1.5) 3.9 6.8 6.8 10.4 10.4 10.4
8. Migration SupportNet Incremental Benefits N/A - 0% - - - - - - - - - -
SummaryNet Incremental Benefits 4% (918) 100% (35.9) (312.1) (761.6) (1,122.5) (564.5) (42.1) (145.3) 352.0 352.5 353.0
Sensitivity AnalysisAnalysis Period
12 Years -8% (1,368)20 Years (Base Case) 4% (918)25 Years 7% (786)30 Years 8% (712)
Costs - AdministrationInvestment Costs Decreased by 20 percent. 6% (724)
Costs - Administration and DevelopmentRecurrent Costs Increased by 20 percent. 2% (1,140)
Benefits - Crop, SWC and WRDCrop Benefits Increased by 20 percent. 8% (514)Livestock Benefits Increased by 20 percent. 7% (689)
Source: Cost Benefit Analysis (CBA) Study Estimate Jan 2005.\1 EIRR = Economic Internal Rate of Return (rate at which NPV equal to zero).\2 NPV = Net Present Value of net incremental benefits at 12% (indicative opportunity cost of capital for rural development projects in India).
N/A = Not analysed as EIRR negative.
NPV \2

Table AN12.10.3 GVT - Rajasthan - Banswara: Village Bakaner - Cost Benefit Analysis Development Activity Summary A (Rs'000).
Administration Costs / Development Activity EIRR \1 Year 1 Year 2 Year 3 Year 4 Year 5 Year 6 Year 7 Year 8 Year 9 Year 10(10%) (%) 1999/00 2000/01 2001/02 2002/03 2003/04 2004/05 2005/06 2006/07 2007/08 2008/09
A. Administration CostsInvestment 35.9 241.3 227.1 238.6 249.5 250.3 223.6 - - - Projected - - - - - - - 22.4 22.4 22.4
Total A N/A (972) 106% 35.9 241.3 227.1 238.6 249.5 250.3 223.6 22.4 22.4 22.4
B. Development Intervention Component A 1. PPGF
Cost StreamInvestment - 13.2 33.7 51.9 45.1 26.5 30.9 - - - Recurrent - - 0.3 1.2 2.5 3.6 4.3 5.0 5.0 5.0 Total Costs - 13.2 34.0 53.1 47.6 30.1 35.2 5.0 5.0 5.0
Benefit StreamBefore / Without Project - - - - - - - - - - After / With Project - - - - - - - - - - Incremental Benefits - - - - - - - - - -
Net Incremental Benefits N/A (141) 15% - (13.2) (34.0) (53.1) (47.6) (30.1) (35.2) (5.0) (5.0) (5.0)
2. VODCost Stream
Investment - 46.5 101.4 92.2 51.2 21.2 24.9 - - - Recurrent - - 2.3 7.4 12.0 14.6 15.6 16.9 16.9 16.9 Total Costs - 46.5 103.8 99.6 63.2 35.8 40.5 16.9 16.9 16.9
Benefit StreamBefore / Without Project - - - - - - - - - - After / With Project - - - 70.4 70.9 71.3 71.7 72.2 72.7 73.2 Incremental Benefits - - - 70.4 70.9 71.3 71.7 72.2 72.7 73.2
Net Incremental Benefits 18% 70 -8% - (46.5) (103.8) (29.2) 7.6 35.5 31.2 55.3 55.8 56.3
3/5.Crop Technology, SWC and WRDCost Stream
InvestmentCrop Tecnology - 5.8 45.6 38.9 31.0 11.5 9.4 - - - Soil Water Conservation - - 278.7 545.6 454.8 - - - - - Water Resource Development - - 40.0 131.1 30.5 79.5 97.4 - - -
RecurrentCrop Tecnology - - 0.1 1.3 2.3 3.0 3.3 3.6 3.6 3.6 Soil Water Conservation - - - 34.8 103.0 159.9 159.9 159.9 159.9 159.9 Water Resource Development - - 6.0 25.7 30.2 42.2 56.8 56.8 56.8
Total Costs - 5.8 364.4 757.7 647.2 284.2 312.2 220.2 220.2 220.2 Benefit Stream
Before / Without Project - - - - 139.2 139.2 139.2 139.2 139.2 139.2 After / With Project - - - - 559.7 559.7 559.7 559.7 559.7 559.7 Incremental Benefits - - - - 420.5 420.5 420.5 420.5 420.5 420.5
Net Incremental Benefits 9% (174) 19% - (5.8) (364.4) (757.7) (226.7) 136.3 108.4 200.3 200.3 200.3
Source: Cost Benefit Analysis (CBA) Study Estimate Jan 2005.\1 EIRR = Economic Internal Rate of Return (rate at which NPV equal to zero).\2 NPV = Net Present Value of net incremental benefits at 12% (indicative opportunity cost of capital for rural development projects in India).
N/A = Not analysed as EIRR negative.
NPV \2
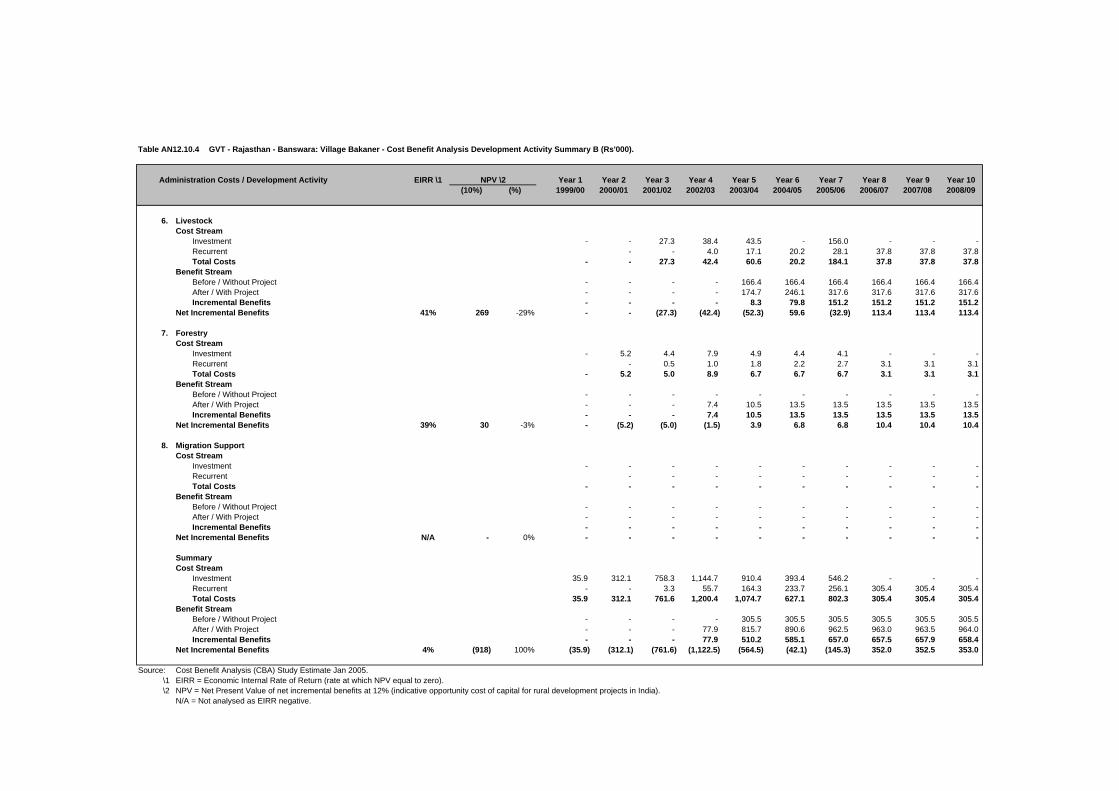
Table AN12.10.4 GVT - Rajasthan - Banswara: Village Bakaner - Cost Benefit Analysis Development Activity Summary B (Rs'000).
Administration Costs / Development Activity EIRR \1 Year 1 Year 2 Year 3 Year 4 Year 5 Year 6 Year 7 Year 8 Year 9 Year 10(10%) (%) 1999/00 2000/01 2001/02 2002/03 2003/04 2004/05 2005/06 2006/07 2007/08 2008/09
6. LivestockCost Stream
Investment - - 27.3 38.4 43.5 - 156.0 - - - Recurrent - - 4.0 17.1 20.2 28.1 37.8 37.8 37.8 Total Costs - - 27.3 42.4 60.6 20.2 184.1 37.8 37.8 37.8
Benefit StreamBefore / Without Project - - - - 166.4 166.4 166.4 166.4 166.4 166.4 After / With Project - - - - 174.7 246.1 317.6 317.6 317.6 317.6 Incremental Benefits - - - - 8.3 79.8 151.2 151.2 151.2 151.2
Net Incremental Benefits 41% 269 -29% - - (27.3) (42.4) (52.3) 59.6 (32.9) 113.4 113.4 113.4
7. ForestryCost Stream
Investment - 5.2 4.4 7.9 4.9 4.4 4.1 - - - Recurrent - 0.5 1.0 1.8 2.2 2.7 3.1 3.1 3.1 Total Costs - 5.2 5.0 8.9 6.7 6.7 6.7 3.1 3.1 3.1
Benefit StreamBefore / Without Project - - - - - - - - - - After / With Project - - - 7.4 10.5 13.5 13.5 13.5 13.5 13.5 Incremental Benefits - - - 7.4 10.5 13.5 13.5 13.5 13.5 13.5
Net Incremental Benefits 39% 30 -3% - (5.2) (5.0) (1.5) 3.9 6.8 6.8 10.4 10.4 10.4
8. Migration SupportCost Stream
Investment - - - - - - - - - - Recurrent - - - - - - - - - Total Costs - - - - - - - - - -
Benefit StreamBefore / Without Project - - - - - - - - - - After / With Project - - - - - - - - - - Incremental Benefits - - - - - - - - - -
Net Incremental Benefits N/A - 0% - - - - - - - - - -
SummaryCost Stream
Investment 35.9 312.1 758.3 1,144.7 910.4 393.4 546.2 - - - Recurrent - - 3.3 55.7 164.3 233.7 256.1 305.4 305.4 305.4 Total Costs 35.9 312.1 761.6 1,200.4 1,074.7 627.1 802.3 305.4 305.4 305.4
Benefit StreamBefore / Without Project - - - - 305.5 305.5 305.5 305.5 305.5 305.5 After / With Project - - - 77.9 815.7 890.6 962.5 963.0 963.5 964.0 Incremental Benefits - - - 77.9 510.2 585.1 657.0 657.5 657.9 658.4
Net Incremental Benefits 4% (918) 100% (35.9) (312.1) (761.6) (1,122.5) (564.5) (42.1) (145.3) 352.0 352.5 353.0
Source: Cost Benefit Analysis (CBA) Study Estimate Jan 2005.\1 EIRR = Economic Internal Rate of Return (rate at which NPV equal to zero).\2 NPV = Net Present Value of net incremental benefits at 12% (indicative opportunity cost of capital for rural development projects in India).
N/A = Not analysed as EIRR negative.
NPV \2

Table AN12.10.5 GVT - Rajasthan - Banswara: Village Bakaner - Costs - Financial (Rs'000).
Cost Head / Subhead 1999/00 2000/01 2001/02 2002/03 2003/04 2004/05 2005/06Actual Actual Actual Actual Actual Budget Budget (Rs'000) (%)
A. Administration CostsGVT Bhopal (PHQ) - 60.3 75.4 67.3 52.8 66.8 61.1 383.7 7%DFIDI Consultancy 35.9 71.4 26.9 63.2 47.4 54.7 39.2 338.6 7%Rajastan Coordination Office - 128.5 147.0 127.6 171.7 150.5 143.8 869.1 17%
Total A 35.9 260.2 249.4 258.1 271.9 272.0 244.1 1,591.5 31%
B. Development Costs 0% 0%Component A 1. PPGF - 14.7 37.4 57.7 50.1 29.5 34.3 223.7 4% 2. VOD - 51.7 112.7 102.5 56.9 23.5 27.7 375.0 7% 3. Crop Technology - 6.5 50.7 43.2 34.4 12.8 10.4 158.0 3% 4. SWC - - 412.8 808.4 673.8 - - 1,895.0 37% 5. WRD - - 59.3 194.2 45.2 117.8 144.3 560.7 11% 6. Livestock - - 30.3 42.7 48.3 - 173.4 294.6 6% 7. Forestry - 5.8 4.9 8.8 5.5 4.9 4.5 34.3 1%8. Migration Support - - - - - - - - 0%
Subtotal - 78.6 708.2 1,257.4 914.1 188.5 394.6 3,541.4 69%
Other Development CostsSubtotal - - - - - - - -
Total B - 78.6 708.2 1,257.4 914.1 188.5 394.6 3,541.4 69%
Total A + B 35.9 338.8 957.5 1,515.5 1,186.0 460.5 638.6 5,132.9 100%
GVT - 251.1 662.8 930.6 767.2 342.4 519.3 3,473.4 68%DFIDI 35.9 71.4 26.9 63.2 47.4 54.7 39.2 338.6 7%Community - 15.6 247.2 458.0 356.0 25.5 30.5 1,132.8 22%Government - 0.8 20.6 63.6 15.4 38.0 49.7 188.0 4%
Source: GVT Banswara Coordination Office - Rajasthan.
DFIDI = Department for International Development (India).PPGF = Participatory Planning and Group Formation.VOD = Village Organisation and Development.SWC = Soil and Water Conservation.WRD = Water Resource Development.
Totals

Table AN12.10.5
Cost Head / Subhead
A. Administration CostsGVT Bhopal (PHQ)DFIDI ConsultancyRajastan Coordination Office
Total A
B. Development CostsComponent A 1. PPGF 2. VOD 3. Crop Technology 4. SWC 5. WRD 6. Livestock 7. Forestry8. Migration Support
Subtotal
Other Development CostsSubtotal
Total B
Total A + B
GVTDFIDICommunity Government
Source:
DFIDI = Department for International Development (India).PPGF = Participatory Planning and Group Formation.VOD = Village Organisation and Development.SWC = Soil and Water Conservation.WRD = Water Resource Development.
GVT - Rajasthan - Banswara: Village Bakaner - Costs - Economic (Rs'000).
1999/00 2000/01 2001/02 2002/03 2003/04 2004/05 2005/06CF SCF Actual Actual Actual Actual Actual Budget Budget (Rs'000) (%)
0.90 1.00 - 54.2 67.9 60.6 47.5 60.1 55.0 345.4 8%1.00 1.00 35.9 71.4 26.9 63.2 47.4 54.7 39.2 338.6 8%0.90 1.00 - 115.7 132.3 114.8 154.5 135.5 129.4 782.2 19%
35.9 241.3 227.1 238.6 249.5 250.3 223.6 1,466.2 36%
0.90 1.00 - 13.2 33.7 51.9 45.1 26.5 30.9 201.4 5%0.90 1.00 - 46.5 101.4 92.2 51.2 21.2 24.9 337.5 8%0.90 1.00 - 5.8 45.6 38.9 31.0 11.5 9.4 142.2 3%0.90 0.75 - - 278.7 545.6 454.8 - - 1,279.1 31%0.90 0.75 - - 40.0 131.1 30.5 79.5 97.4 378.5 9%0.90 1.00 - - 27.3 38.4 43.5 - 156.0 265.2 6%0.90 1.00 - 5.2 4.4 7.9 4.9 4.4 4.1 30.9 1%0.90 1.00 - - - - - - - - 0%
- 70.8 531.1 906.1 660.9 143.1 322.7 2,634.7 64%
- - 0.90 1.00 - - - - - - - - 0%
- 70.8 531.1 906.1 660.9 143.1 322.7 2,634.7 64%
35.9 312.1 758.3 1,144.7 910.4 393.4 546.2 4,100.9 100%
- - - - - - - N/A- - - - - - - N/A- - - - - - - N/A- - - - - - - N/A
Cost Benefit Analysis (CBA) Study Estimate Jan 2005.
TotalsConversion Factors

Table AN12.10.6 GVT - Rajasthan - Banswara: Village Bakaner: VOD Household Assumptions.
Without \ With Project UnitsYear 1 Year 2 Year 3(Rs) (Rs) (Rs)
Development Activity:Village Organisation and Development
Before / Without Project Situation:
A. Self Help Groups (SHGs)Assumption Sum Zero Zero Zero - - -
B. Drudgery ReductionAssumption Sum Zero Zero Zero
Total Without Project Benefits - - -
After / With Project Situation:
A. Self Help Groups (SHGs)Assumptions
Average Household Savings Rs 3,365.6 Households (HHs) No 90 Present Group Savings Rs'000 302.9 Annual Savings Increase % 3% 302.9 312.0 321.3 Deposits on Loan to Members % 26%SHG Interest Income % / Year 18%Assumed Benefit Rs'000 14.2 14.6 15.0
B. Drudgery ReductionAssumptions
Hours Saved / Day / Household No 1.0 Number of Days / Year / Household No 200 Days / Year / Household (8hrs/day) No 25.0 Households / Village No 90 Day Equivalent / Village No 2,250 Economic Value per Day (Rs/day) 25 Assumed Benefit Rs'000 56.3 56.3 56.3
Total With Project Benefits Rs'000 70.4 70.9 71.3
Incremental Benefits Rs'000 70.4 70.9 71.3
Source: Cost Benefit Analysis (CBA) Study Estimate Jan 2005.VOD = Village Organisation and Development.Households per village: Bakaner 90
Assumptions Benefits
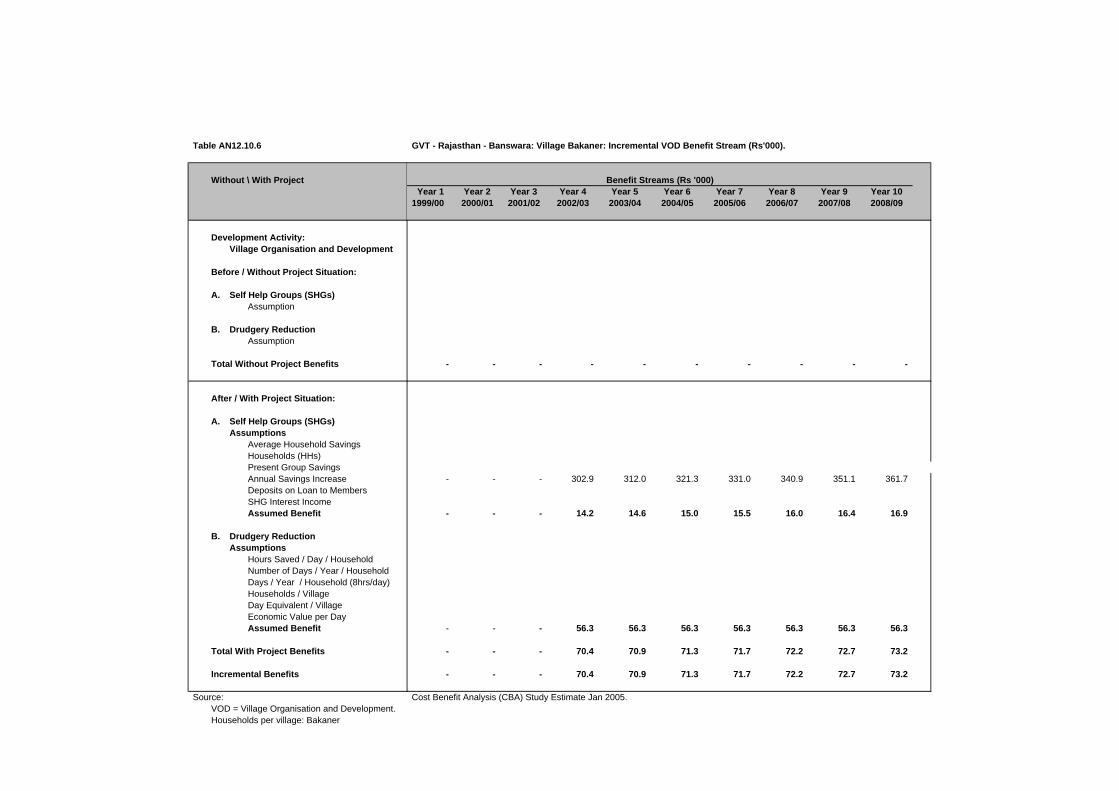
Table AN12.10.6
Without \ With Project
Development Activity:Village Organisation and Development
Before / Without Project Situation:
A. Self Help Groups (SHGs)Assumption
B. Drudgery ReductionAssumption
Total Without Project Benefits
After / With Project Situation:
A. Self Help Groups (SHGs)Assumptions
Average Household SavingsHouseholds (HHs)Present Group SavingsAnnual Savings IncreaseDeposits on Loan to MembersSHG Interest Income Assumed Benefit
B. Drudgery ReductionAssumptions
Hours Saved / Day / HouseholdNumber of Days / Year / HouseholdDays / Year / Household (8hrs/day)Households / VillageDay Equivalent / VillageEconomic Value per DayAssumed Benefit
Total With Project Benefits
Incremental Benefits
Source:VOD = Village Organisation and Development.Households per village: Bakaner
GVT - Rajasthan - Banswara: Village Bakaner: Incremental VOD Benefit Stream (Rs'000).
Year 1 Year 2 Year 3 Year 4 Year 5 Year 6 Year 7 Year 8 Year 9 Year 101999/00 2000/01 2001/02 2002/03 2003/04 2004/05 2005/06 2006/07 2007/08 2008/09
- - - - - - - - - -
- - - 302.9 312.0 321.3 331.0 340.9 351.1 361.7
- - - 14.2 14.6 15.0 15.5 16.0 16.4 16.9
- - - 56.3 56.3 56.3 56.3 56.3 56.3 56.3
- - - 70.4 70.9 71.3 71.7 72.2 72.7 73.2
- - - 70.4 70.9 71.3 71.7 72.2 72.7 73.2
Cost Benefit Analysis (CBA) Study Estimate Jan 2005.
Benefit Streams (Rs '000)

Table AN12.10.7 GVT - Rajasthan - Banswara: Village Bakaner: Household Crop Net Margin Assumptions.
Without \ With Project UnitsYear 1 Year 2 Year 3(Rs) (Rs) (Rs)
Development Activity:Crop Technology, SWC and WRD
Before / Without Project Situation:Assumptions
Households (HHs) No 90 Crop Adoption Assumptions 100% 100% 100%
Kharif Crop Net Margin Rs/HH 1,327.9 1,327.9 1,327.9
Rabi Crop Net Margin Rs/HH 218.3 218.3 218.3 Total Without Project Benefits Rs/HH 1,546.2 1,546.2 1,546.2
After / With Project Situation:Assumptions
Households (HHs) No 90 Crop Adoption Assumptions 100% 100% 100%
Kharif Crop Net Margin Rs/HH 4,701.5 4,701.5 4,701.5
Rabi Crop Net Margin Rs/HH 1,517.1 1,517.1 1,517.1 Total With Project Benefits Rs/HH 6,218.6 6,218.6 6,218.6
Incremental Benefits Rs/HH 4,672.4 4,672.4 4,672.4
Source: Cost Benefit Analysis (CBA) Study Estimate Jan 2005.
BenefitsAssumptions

Table AN12.10.7
Without \ With Project
Development Activity:Crop Technology, SWC and WRD
Before / Without Project Situation:Assumptions
Households (HHs)Crop Adoption Assumptions
Kharif Crop Net Margin
Rabi Crop Net MarginTotal Without Project Benefits
After / With Project Situation:Assumptions
Households (HHs)Crop Adoption Assumptions
Kharif Crop Net Margin
Rabi Crop Net MarginTotal With Project Benefits
Incremental Benefits
Source:
GVT - Rajasthan - Banswara: Village Bakaner: Incremental Crop Benefit Stream (Rs'000).
Year 1 Year 2 Year 3 Year 4 Year 5 Year 6 Year 7 Year 8 Year 9 Year 101999/00 2000/01 2001/02 2002/03 2003/04 2004/05 2005/06 2006/07 2007/08 2008/09
- - - - 119.5 119.5 119.5 119.5 119.5 119.5
- - - - 19.6 19.6 19.6 19.6 19.6 19.6 - - - - 139.2 139.2 139.2 139.2 139.2 139.2
- - - - 423.1 423.1 423.1 423.1 423.1 423.1
- - - - 136.5 136.5 136.5 136.5 136.5 136.5 - - - - 559.7 559.7 559.7 559.7 559.7 559.7
- - - - 420.5 420.5 420.5 420.5 420.5 420.5
Cost Benefit Analysis (CBA) Study Estimate Jan 2005.
Benefit Streams (Rs '000)

Table AN12.10.8 GVT - Rajasthan - Banswara: Village Bakaner: Household Livestock Net Margin Assumptions.
Without \ With Project UnitsLivestock Year 1 Year 2 Year 3
(Rs) (Rs) (Rs)
Development Activity:Livestock
Before / Without Project Situation:Assumptions
Households (HHs) No 90 Annual Livestock Net Margin Rs/HH
Total Without Project Benefits 1,848.5 1,848.5 1,848.5
After / With Project Situation:
Development Activity:Assumptions
Households (HHs) No 90 Adoption Assumptions Percent 55% 78% 100%
Annual Livestock Net Margin Rs/HHTotal With Project Benefits 1,940.9 2,734.9 3,528.9
Incremental Benefits Rs/HH 92.5 886.5 1,680.5
Source: Cost Benefit Analysis (CBA) Study Estimate Jan 2005.
BenefitsAssumptions

Table AN12.10.8
Without \ With ProjectLivestock
Development Activity:Livestock
Before / Without Project Situation:Assumptions
Households (HHs)Annual Livestock Net Margin
Total Without Project Benefits
After / With Project Situation:
Development Activity:Assumptions
Households (HHs)Adoption Assumptions
Annual Livestock Net MarginTotal With Project Benefits
Incremental Benefits
Source:
GVT - Rajasthan - Banswara: Village Bakaner: Incremental Livestock Benefit Stream (Rs'000).
Year 1 Year 2 Year 3 Year 4 Year 5 Year 6 Year 7 Year 8 Year 9 Year 101999/00 2000/01 2001/02 2002/03 2003/04 2004/05 2005/06 2006/07 2007/08 2008/09
- - - - 166.4 166.4 166.4 166.4 166.4 166.4
- - - - 174.7 246.1 317.6 317.6 317.6 317.6
- - - - 8.3 79.8 151.2 151.2 151.2 151.2
Cost Benefit Analysis (CBA) Study Estimate Jan 2005.
Benefit Streams (Rs '000)

Table AN12.10.9 GVT - Rajasthan - Banswara: Village Bakaner: Forestry Benefit Assumptions.
Without \ With Project UnitsForestry Year 1 Year 2 Year 3
(Rs) (Rs) (Rs)
Development Activity:Forestry
Before / Without Project Situation:AssumptionsHouseholds (HHs) No 90 Annual Forestry Net Margin Rs/HH
Total Without Project Benefits - - -
After / With Project Situation:AssumptionsHouseholds (HHs) No 90 Adoption Assumptions Percent 55% 78% 100%Annual Forestry Net Margin Rs/HH
Total With Project Benefits 82.5 117.0 150.0
Incremental Benefits Rs/HH 82.5 117.0 150.0
Source: Cost Benefit Analysis (CBA) Study Estimate Jan 2005.
BenefitsAssumptions

Table AN12.10.9
Without \ With ProjectForestry
Development Activity:Forestry
Before / Without Project Situation:AssumptionsHouseholds (HHs)Annual Forestry Net Margin
Total Without Project Benefits
After / With Project Situation:AssumptionsHouseholds (HHs)Adoption AssumptionsAnnual Forestry Net Margin
Total With Project Benefits
Incremental Benefits
Source:
GVT - Rajasthan - Banswara: Village Bakaner: Incremental Forestry Benefit Stream (Rs'000).
Year 1 Year 2 Year 3 Year 4 Year 5 Year 6 Year 7 Year 8 Year 9 Year 101999/00 2000/01 2001/02 2002/03 2003/04 2004/05 2005/06 2006/07 2007/08 2008/09
- - - - - - - - - -
- - - 7.4 10.5 13.5 13.5 13.5 13.5 13.5
- - - 7.4 10.5 13.5 13.5 13.5 13.5 13.5
Cost Benefit Analysis (CBA) Study Estimate Jan 2005.
Benefit Streams (Rs '000)

Table AN12.10.10 GVT - Rajasthan - Banswara: Village Bakaner: Migration Support Benefit Assumptions.
Without \ With ProjectMigration Support Year 1 Year 2 Year 3
(Rs) (Rs) (Rs)
Development Activity:Migration Support
Before / Without Project Situation:Assumptions
Economic Value per Day Rs/day 25.0 Days / Month / Household No 18 Economic Value per Month Rs/month 450.0 Months Migration / Year Months 4.0 Economic Value per Household Rs/HH 1,800.0 Households per Village No - Households per Village Migrating Percent 45%
Total Without Project Benefits Rs/Village - - -
After / With Project Situation:Assumptions
Economic Value per Day \1 Rs/day 25.0 25% 31.3 Days / Month / Household No 18 30% 24.0 Economic Value per Month Rs/month 450.0 750.0 Months Migration / Year Months 4.0 -25% 3.0 Economic Value per Household Rs/HH 1,800.0 2,250.0 Households per Village No - - Households per Village Migrating Percent 45% -10% 41%
Subtotal Migration Benefits Rs/Village - - -
Other Income Sum (Rs'000) - - - - - -
Total With Project Benefits Rs/Village - - -
Incremental Benefits Rs/Village - - -
Source: Cost Benefit Analysis (CBA) Study Estimate Jan 2005.
1\ Financial Wages (Rs/day):Skill Labour - Rs 160
Casual Labour :Male - Rs 40Female - Rs 30
BenefitsAssumptions

Table AN12.10.10
Without \ With ProjectMigration Support
Development Activity:Migration Support
Before / Without Project Situation:Assumptions
Economic Value per Day Days / Month / Household Economic Value per Month Months Migration / Year Economic Value per Household Households per Village Households per Village Migrating
Total Without Project Benefits
After / With Project Situation:Assumptions
Economic Value per Day \1Days / Month / Household Economic Value per Month Months Migration / Year Economic Value per Household Households per Village Households per Village Migrating
Subtotal Migration Benefits
Other Income
Total With Project Benefits
Incremental Benefits
Source:
1\ Financial Wages (Rs/day):Skill Labour - Rs 160
Casual Labour :Male - Rs 40Female - Rs 30
GVT - Rajasthan - Banswara: Village Bakaner: Incremental Migration Support Benefit Stream (Rs'000).
Year 1 Year 2 Year 3 Year 4 Year 5 Year 6 Year 7 Year 8 Year 9 Year 101999/00 2000/01 2001/02 2002/03 2003/04 2004/05 2005/06 2006/07 2007/08 2008/09
- - - - - - - - - -
- - - - - - - - - -
- - - - - - - - - -
- - - - - - - - - -
- - - - - - - - - -
Cost Benefit Analysis (CBA) Study Estimate Jan 2005.
Benefit Streams (Rs '000)

Table AN12.10.11 GVT - Rajasthan - Banswara: Village Bakaner: Weighted Household Crop Net Margin Summary (Rs/Household).
Item WBR(%) Khalif Rabi Total Khalif Rabi Total Khalif Rabi Total
Phase IIWBR - Very Poor
Household Net Margin (Rs) 23.0% 834.6 102.5 937.1 1,849.8 1,067.8 2,917.6 1,015.2 965.3 1,980.5 WBR - Poor
Household Net Margin (Rs) 27.0% 637.7 - 637.7 4,803.0 220.7 5,023.7 4,165.3 220.7 4,386.0 WBR - Moderate
Household Net Margin (Rs) 41.0% 994.0 89.3 1,083.3 3,711.4 2,508.3 6,219.6 2,717.4 2,419.0 5,136.4 WBR - Better Off
Household Net Margin (Rs) 9.0% 6,180.9 1,756.7 7,937.5 16,195.9 2,039.3 18,235.2 10,015.0 282.7 10,297.7 WBR - Weighted
Household Net Margin (Rs) 100% 1,327.9 218.3 1,546.2 4,701.5 1,517.1 6,218.6 3,373.6 1,298.8 4,672.4
Phase I \1WBR - Very Poor
Household Net Margin (Rs) 23.0% 436.3 267.5 703.8 3,866.5 1,668.8 5,535.3 3,430.3 1,401.3 4,831.5 WBR - Poor
Household Net Margin (Rs) 27.0% 485.8 657.5 1,143.3 10,136.0 5,690.3 15,826.3 9,650.3 5,032.8 14,683.0 WBR - Moderate
Household Net Margin (Rs) 41.0% 986.3 3,385.0 4,371.3 9,457.5 5,195.0 14,652.5 8,471.3 1,810.0 10,281.3 WBR - Better Off
Household Net Margin (Rs) 9.0% 2,778.0 937.0 3,715.0 4,915.0 9,560.0 14,475.0 2,137.0 8,623.0 10,760.0 WBR - Weighted
Household Net Margin (Rs) 100.0% 885.9 1,711.2 2,597.1 7,945.9 4,910.5 12,856.5 7,060.1 3,199.3 10,259.4
Source: Study of Impact of WIRFP on Net Incomes of Target Households, Jan 2004.WBR = GVT Household Well Being Ranking. Survey figures adjusted to Village Profile WBR.
\1 GVT - Madhya Pradesh - Phase I: Village Naganwat Choti: Weighted Household Crop Net Margin Summary.
Before / Without Project After / With Project Increment

Table AN12.10.12 GVT - Rajasthan - Banswara: Village Bakaner: Household Crop Net Margin Sensitivity Analysis.
Item EIRRKhalif Rabi Total Khalif Rabi Total Khalif Rabi Total
Development Activity:Crop Technology, SWC and WRD
Weighted Net Margin (Phase II)Household Net Margin (Rs) 1,327.9 218.3 1,546.2 4,701.5 1,517.1 6,218.6 3,373.6 1,298.8 4,672.4 Incremental Benefit (Phase II / Phase I) 46%
Base Case AssumptionsHousehold Net Margin (Rs) 1,327.9 218.3 1,546.2 4,701.5 1,517.1 6,218.6 3,373.6 1,298.8 4,672.4 Incremental Benefit (Phase II / Phase I) 46%Sensitivity Increase (%) 0%Development Acivity EIRR 9%Overall Village EIRR 4%
Sensitivity AssumptionsHousehold Net Margin (Rs) 1,327.9 218.3 1,546.2 6,817.2 2,199.8 9,017.0 5,489.3 1,981.5 7,470.8 Incremental Benefit (Phase II / Phase I) 73%Sensitivity Increase (%) 0%Development Acivity EIRR 22%Overall Village EIRR 12%
Weighted Net Margin (Phase I)Household Net Margin (Rs) 885.9 1,711.2 2,597.1 7,945.9 4,910.5 12,856.5 7,060.1 3,199.3 10,259.4
Source: Cost Benefit Analysis (CBA) Study Estimate Jan 2005.EIRR = Economic Internal Rate of Return (rate at which NPV equal to zero).
Before / Without Project After / With Project Increment

Table AN12.10.13 GVT - Rajasthan - Banswara: Village Bakaner: Weighted Household Livestock Net Margin Summary (Rs/Household).
Well Being Ranking Weight(%) Herd Value Net Margin Herd Value Net Margin Herd Value Net Margin
Phase I - Well Being Ranking (WBR) \1Madhya Pradesh - WBR Weighted DataVery Poor 23.0%
Average 580 (185.0) 5,650 412.5 474 597.5 Poor 27.0%
Average 2,350 982.5 8,250 2,141.0 1,180 1,158.5 Moderate 41.0%
Average 14,700 6,730.0 1,900 2,820.0 1,900 (3,910.0)Better Off 9.0%
Average 15,580 3,000.0 14,600 10,790.0 (196) 7,790.0
Phase I - WBR Weighted Data 100.0% 8,197 3,252.0 5,620 2,800.2 1,189 (451.8)
Phase II - Well Being Ranking (WBR)
Very Poor 23.0%Average 5,756 149.2 10,970 1,446.4 1,043 1,297.2
Poor 27.0%Average 13,128 852.2 25,979 3,008.8 2,570 2,156.8
Moderate 41.0%Average 13,525 4,035.1 27,020 5,249.5 2,699 1,214.4
Better Off 9.0%Average 12,700 (781.7) 41,873 2,573.3 5,835 3,355.0
Phase II - WBR Weighted Data 100.0% 11,557 1,848.5 24,384 3,528.9 2,565 1,680.5
Source: Study of Impact of WIRFP on Net Incomes of Target Households, Jan 2004.WBR = GVT Household Well Being Ranking. Survey figures adjusted to Village Profile WBR.
\1 GVT - Madhya Pradesh - Phase I: Village Naganwat Choti: Weighted Household Livestock Net Margin Summary.
Before / Without Project After / With Project Increment \1

WIRFP - Phase II - Cost Benefit Analysis Study
Tables AN12.0 Individual Village Cost Benefit Analysis
Tables AN12.11 GVT - Rajasthan - Banswara: Village Bhuripada.
Table AN12.11.1 GVT - Rajasthan - Banswara: Village Bhuripada: Village Profile.
Table AN12.11.2 GVT - Rajasthan - Banswara: Village Bhuripada: Cost Benefit Analysis Summary (Rs'000).Table AN12.11.3 GVT - Rajasthan - Banswara: Village Bhuripada: Cost Benefit Analysis Development Activity Summary A (Rs'000).Table AN12.11.4 GVT - Rajasthan - Banswara: Village Bhuripada: Cost Benefit Analysis Development Activity Summary B (Rs'000).
Table AN12.11.5 GVT - Rajasthan - Banswara: Village Bhuripada: Costs - Financial (Rs'000).GVT - Rajasthan - Banswara: Village Bhuripada: Costs - Economic (Rs'000).
Table AN12.11.6 GVT - Rajasthan - Banswara: Village Bhuripada: VOD Household Assumptions.GVT - Rajasthan - Banswara: Village Bhuripada: Incremental VOD Benefit Stream (Rs'000).
Table AN12.11.7 GVT - Rajasthan - Banswara: Village Bhuripada: Household Crop Net Margin Assumptions.GVT - Rajasthan - Banswara: Village Bhuripada: Incremental Crop Benefit Stream (Rs'000).
Table AN12.11.8 GVT - Rajasthan - Banswara: Village Bhuripada: Household Livestock Net Margin Assumptions.GVT - Rajasthan - Banswara: Village Bhuripada: Incremental Livestock Benefit Stream (Rs'000).
Table AN12.11.9 GVT - Rajasthan - Banswara: Village Bhuripada: Forestry Benefit Assumptions.GVT - Rajasthan - Banswara: Village Bhuripada: Incremental Forestry Benefit Stream (Rs'000).
Table AN12.11.10 GVT - Rajasthan - Banswara: Village Bhuripada: Migration Support Benefit Assumptions.GVT - Rajasthan - Banswara: Village Bhuripada: Incremental Migration Support Benefit Stream (Rs'000).
Table AN12.11.11 GVT - Rajasthan - Banswara: Village Bhuripada: Weighted Household Crop Net Margin Summary (Rs/Household).Table AN12.11.12 GVT - Rajasthan - Banswara: Village Bhuripada: Household Crop Net Margin Sensitivity Analysis.
Table AN12.11.13 GVT - Rajasthan - Banswara: Village Bhuripada: Weighted Household Livestock Net Margin Summary (Rs/Household).

Table AN12.11.1 GVT - Rajasthan - Banswara: Village Bhuripada: Village Profile.
Village Profile \1
A. Background F. Land Resource (ha)Village Name Bhuripada Total Area 532 District Banswara Revenue Land (unused) 41 State Rajasthan Forest Area - Revenue 175
Pasture Land 49 B. Participatory Planning Process (PPP) Arable Land 267
Village entry Jan-00PRA Aug-00CPA Sep-00 G. Livestock
Oxen N/AC. Infrastructure Cows N/A
Hand Pumps (no) 7 Buffalo N/AWells (no) 6 Goats N/ALinked by Road No Poultry N/AElectrification YesSchool Primary H. Self Help Groups (No Households)
1 Group 1 24 D. Demographic Data 2 Group 2 23
Households (no) 265 3 Group 3 21 Participating Households 160 4 Group 4 20 Population (Adults) 1,500 5 Group 5 19
Adults: 6 Group 6 21 Male 700 7 Group 7 19 Female 800 8 Group 8 23 Children: 9 Group 9 20 Boys N/A 10 Group 10 Girls N/A 11 Group 11
12 Group 12E. Well Being Ranking (No Households) 13 Group 13
Very Poor 21 28.4% Total Memberhip 190 Poor 37 50.0%Moderate 11 14.9%Better Off 5 6.8%Total 74 100%
Source: GVT Banswara Coordination Office - Rajasthan.\1 Subject to final adjustment following consolidation exercise prior to Annual Review Meeting (ARM) in Feb 2005.
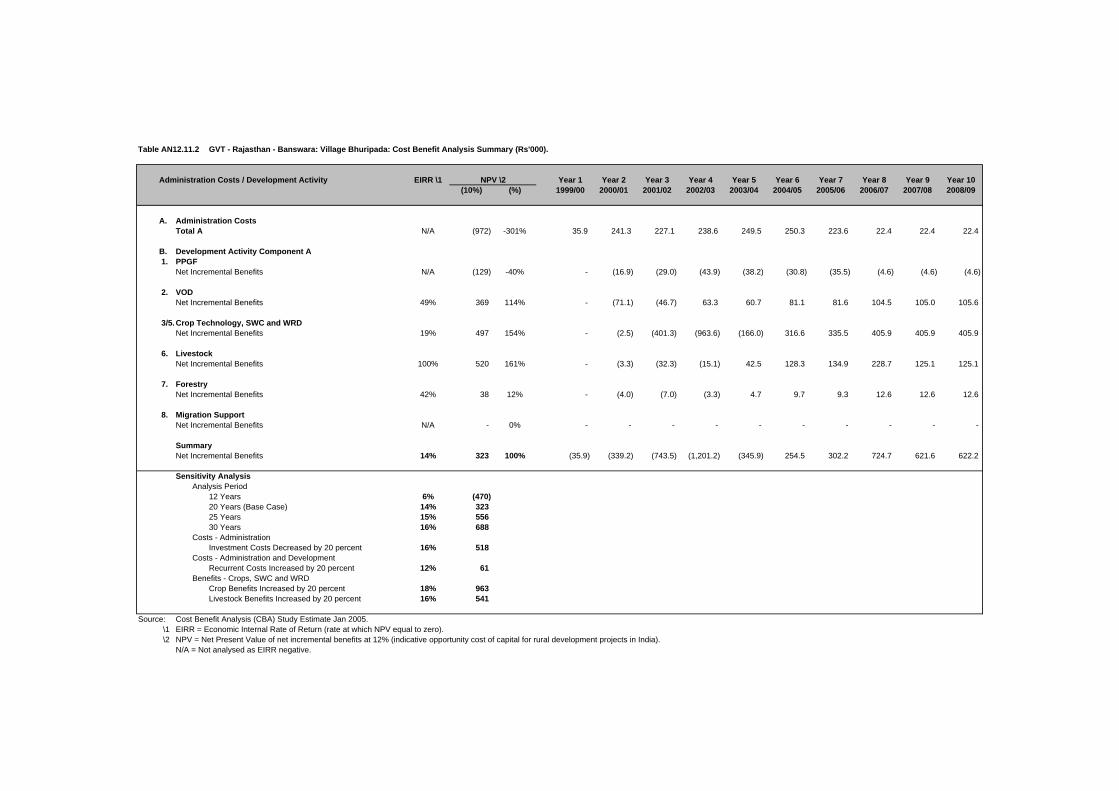
Table AN12.11.2 GVT - Rajasthan - Banswara: Village Bhuripada: Cost Benefit Analysis Summary (Rs'000).
Administration Costs / Development Activity EIRR \1 Year 1 Year 2 Year 3 Year 4 Year 5 Year 6 Year 7 Year 8 Year 9 Year 10(10%) (%) 1999/00 2000/01 2001/02 2002/03 2003/04 2004/05 2005/06 2006/07 2007/08 2008/09
A. Administration CostsTotal A N/A (972) -301% 35.9 241.3 227.1 238.6 249.5 250.3 223.6 22.4 22.4 22.4
B. Development Activity Component A 1. PPGF
Net Incremental Benefits N/A (129) -40% - (16.9) (29.0) (43.9) (38.2) (30.8) (35.5) (4.6) (4.6) (4.6)
2. VODNet Incremental Benefits 49% 369 114% - (71.1) (46.7) 63.3 60.7 81.1 81.6 104.5 105.0 105.6
3/5.Crop Technology, SWC and WRDNet Incremental Benefits 19% 497 154% - (2.5) (401.3) (963.6) (166.0) 316.6 335.5 405.9 405.9 405.9
6. LivestockNet Incremental Benefits 100% 520 161% - (3.3) (32.3) (15.1) 42.5 128.3 134.9 228.7 125.1 125.1
7. ForestryNet Incremental Benefits 42% 38 12% - (4.0) (7.0) (3.3) 4.7 9.7 9.3 12.6 12.6 12.6
8. Migration SupportNet Incremental Benefits N/A - 0% - - - - - - - - - -
SummaryNet Incremental Benefits 14% 323 100% (35.9) (339.2) (743.5) (1,201.2) (345.9) 254.5 302.2 724.7 621.6 622.2
Sensitivity AnalysisAnalysis Period
12 Years 6% (470)20 Years (Base Case) 14% 323 25 Years 15% 556 30 Years 16% 688
Costs - AdministrationInvestment Costs Decreased by 20 percent 16% 518
Costs - Administration and DevelopmentRecurrent Costs Increased by 20 percent 12% 61
Benefits - Crops, SWC and WRDCrop Benefits Increased by 20 percent 18% 963 Livestock Benefits Increased by 20 percent 16% 541
Source: Cost Benefit Analysis (CBA) Study Estimate Jan 2005.\1 EIRR = Economic Internal Rate of Return (rate at which NPV equal to zero).\2 NPV = Net Present Value of net incremental benefits at 12% (indicative opportunity cost of capital for rural development projects in India).
N/A = Not analysed as EIRR negative.
NPV \2

Table AN12.11.3 GVT - Rajasthan - Banswara: Village Bhuripada: Cost Benefit Analysis Development Activity Summary A (Rs'000).
Administration Costs / Development Activity EIRR \1 Year 1 Year 2 Year 3 Year 4 Year 5 Year 6 Year 7 Year 8 Year 9 Year 10(10%) (%) 1999/00 2000/01 2001/02 2002/03 2003/04 2004/05 2005/06 2006/07 2007/08 2008/09
A. Administration CostsInvestment 35.9 241.3 227.1 238.6 249.5 250.3 223.6 - - - Projected - - - - - - - 22.4 22.4 22.4
Total A N/A (972) -301% 35.9 241.3 227.1 238.6 249.5 250.3 223.6 22.4 22.4 22.4
B. Development Intervention Component A 1. PPGF
Cost StreamInvestment - 16.9 28.5 42.8 36.0 27.7 31.7 - - - Recurrent - - 0.4 1.1 2.2 3.1 3.8 4.6 4.6 4.6 Total Costs - 16.9 29.0 43.9 38.2 30.8 35.5 4.6 4.6 4.6
Benefit StreamBefore / Without Project - - - - - - - - - - After / With Project - - - - - - - - - - Incremental Benefits - - - - - - - - - -
Net Incremental Benefits N/A (129) -40% - (16.9) (29.0) (43.9) (38.2) (30.8) (35.5) (4.6) (4.6) (4.6)
2. VODCost Stream
Investment - 71.1 43.2 46.3 47.1 24.9 23.6 - - - Recurrent - - 3.6 5.7 8.0 10.4 11.6 12.8 12.8 12.8 Total Costs - 71.1 46.7 52.1 55.2 35.3 35.3 12.8 12.8 12.8
Benefit StreamBefore / Without Project - - - - - - - - - - After / With Project - - - 115.4 115.9 116.3 116.8 117.3 117.9 118.4 Incremental Benefits - - - 115.4 115.9 116.3 116.8 117.3 117.9 118.4
Net Incremental Benefits 49% 369 114% - (71.1) (46.7) 63.3 60.7 81.1 81.6 104.5 105.0 105.6
3/5.Crop Technology, SWC and WRDCost Stream
InvestmentCrop Tecnology - 2.5 49.6 68.1 20.8 29.1 23.8 - - - Soil Water Conservation - - 328.3 611.1 376.5 - - - - - Water Resource Development - - 23.3 238.6 287.2 82.1 55.4 - - -
RecurrentCrop Tecnology - - 0.1 1.3 3.0 3.5 4.3 4.8 4.8 4.8 Soil Water Conservation - - - 41.0 117.4 164.5 164.5 164.5 164.5 164.5 Water Resource Development - - 3.5 39.3 82.4 94.7 103.0 103.0 103.0
Total Costs - 2.5 401.3 963.6 844.2 361.6 342.7 272.3 272.3 272.3 Benefit Stream
Before / Without Project - - - - 207.9 207.9 207.9 207.9 207.9 207.9 After / With Project - - - - 886.1 886.1 886.1 886.1 886.1 886.1 Incremental Benefits - - - - 678.2 678.2 678.2 678.2 678.2 678.2
Net Incremental Benefits 19% 497 154% - (2.5) (401.3) (963.6) (166.0) 316.6 335.5 405.9 405.9 405.9
Source: Cost Benefit Analysis (CBA) Study Estimate Jan 2005.\1 EIRR = Economic Internal Rate of Return (rate at which NPV equal to zero).\2 NPV = Net Present Value of net incremental benefits at 12% (indicative opportunity cost of capital for rural development projects in India).
N/A = Not analysed as EIRR negative.
NPV \2
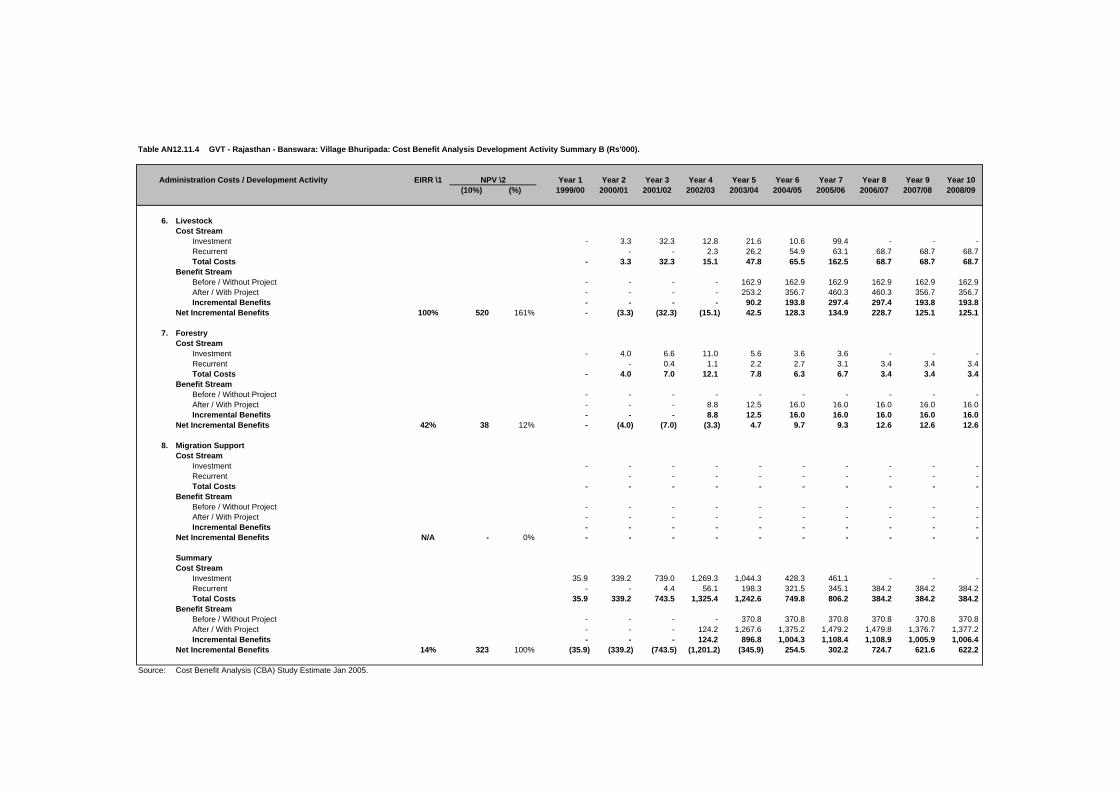
Table AN12.11.4 GVT - Rajasthan - Banswara: Village Bhuripada: Cost Benefit Analysis Development Activity Summary B (Rs'000).
Administration Costs / Development Activity EIRR \1 Year 1 Year 2 Year 3 Year 4 Year 5 Year 6 Year 7 Year 8 Year 9 Year 10(10%) (%) 1999/00 2000/01 2001/02 2002/03 2003/04 2004/05 2005/06 2006/07 2007/08 2008/09
6. LivestockCost Stream
Investment - 3.3 32.3 12.8 21.6 10.6 99.4 - - - Recurrent - - 2.3 26.2 54.9 63.1 68.7 68.7 68.7 Total Costs - 3.3 32.3 15.1 47.8 65.5 162.5 68.7 68.7 68.7
Benefit StreamBefore / Without Project - - - - 162.9 162.9 162.9 162.9 162.9 162.9 After / With Project - - - - 253.2 356.7 460.3 460.3 356.7 356.7 Incremental Benefits - - - - 90.2 193.8 297.4 297.4 193.8 193.8
Net Incremental Benefits 100% 520 161% - (3.3) (32.3) (15.1) 42.5 128.3 134.9 228.7 125.1 125.1
7. ForestryCost Stream
Investment - 4.0 6.6 11.0 5.6 3.6 3.6 - - - Recurrent - 0.4 1.1 2.2 2.7 3.1 3.4 3.4 3.4 Total Costs - 4.0 7.0 12.1 7.8 6.3 6.7 3.4 3.4 3.4
Benefit StreamBefore / Without Project - - - - - - - - - - After / With Project - - - 8.8 12.5 16.0 16.0 16.0 16.0 16.0 Incremental Benefits - - - 8.8 12.5 16.0 16.0 16.0 16.0 16.0
Net Incremental Benefits 42% 38 12% - (4.0) (7.0) (3.3) 4.7 9.7 9.3 12.6 12.6 12.6
8. Migration SupportCost Stream
Investment - - - - - - - - - - Recurrent - - - - - - - - - Total Costs - - - - - - - - - -
Benefit StreamBefore / Without Project - - - - - - - - - - After / With Project - - - - - - - - - - Incremental Benefits - - - - - - - - - -
Net Incremental Benefits N/A - 0% - - - - - - - - - -
SummaryCost Stream
Investment 35.9 339.2 739.0 1,269.3 1,044.3 428.3 461.1 - - - Recurrent - - 4.4 56.1 198.3 321.5 345.1 384.2 384.2 384.2 Total Costs 35.9 339.2 743.5 1,325.4 1,242.6 749.8 806.2 384.2 384.2 384.2
Benefit StreamBefore / Without Project - - - - 370.8 370.8 370.8 370.8 370.8 370.8 After / With Project - - - 124.2 1,267.6 1,375.2 1,479.2 1,479.8 1,376.7 1,377.2 Incremental Benefits - - - 124.2 896.8 1,004.3 1,108.4 1,108.9 1,005.9 1,006.4
Net Incremental Benefits 14% 323 100% (35.9) (339.2) (743.5) (1,201.2) (345.9) 254.5 302.2 724.7 621.6 622.2
Source: Cost Benefit Analysis (CBA) Study Estimate Jan 2005.
NPV \2

Table AN12.11.5 GVT - Rajasthan - Banswara: Village Bhuripada: Costs - Financial (Rs'000).
Cost Head / Subhead 1999/00 2000/01 2001/02 2002/03 2003/04 2004/05 2005/06Actual Actual Actual Actual Actual Budget Budget (Rs'000) (%)
A. Administration CostsGVT Bhopal (PHQ) - 60.3 75.4 67.3 52.8 66.8 61.1 383.7 7%DFIDI Consultancy 35.9 71.4 26.9 63.2 47.4 54.7 39.2 338.6 6%Rajastan Coordination Office - 128.5 147.0 127.6 171.7 150.5 143.8 869.1 16%
Total A 35.9 260.2 249.4 258.1 271.9 272.0 244.1 1,591.5 29%
B. Development CostsComponent A 1. PPGF - 18.8 31.7 47.5 40.0 30.8 35.2 204.1 4% 2. VOD - 79.0 48.0 51.5 52.4 27.7 26.2 284.8 5% 3. Crop Technology - 2.8 55.2 75.7 23.1 32.4 26.5 215.6 4% 4. SWC - - 486.4 905.3 557.8 - - 1,949.5 35% 5. WRD - - 34.5 353.4 425.5 121.6 82.1 1,017.3 18% 6. Livestock - 3.7 35.9 14.2 24.0 11.8 110.4 200.0 4% 7. Forestry - 4.5 7.3 12.3 6.2 4.0 4.0 38.3 1%8. Migration Support - - - - - - - - 0%
Subtotal - 108.7 699.0 1,459.9 1,129.0 228.2 284.5 3,909.4 71%
Other Development CostsSubtotal - - - - - - - - 0%
Total B - 108.7 699.0 1,459.9 1,129.0 228.2 284.5 3,909.4 71%
Total A + B 35.9 368.9 948.4 1,718.0 1,400.9 500.2 528.6 5,500.9 100%
GVT - 286.1 666.0 1,117.1 968.0 410.6 459.5 3,907.3 71%DFIDI 35.9 71.4 26.9 63.2 47.4 54.7 39.2 338.6 6%Community - 9.1 253.2 535.9 383.5 33.9 26.5 1,242.0 23%Government - 2.4 2.2 1.8 2.1 1.1 3.4 13.0 0%
Source: GVT Banswara Coordination Office - Rajasthan.
DFIDI = Department for International Development (India).PPGF = Participatory Planning and Group Formation.VOD = Village Organisation and Development.SWC = Soil and Water Conservation.WRD = Water Resource Development.
Total

Table AN12.11.5
Cost Head / Subhead
A. Administration CostsGVT Bhopal (PHQ)DFIDI ConsultancyRajastan Coordination Office
Total A
B. Development CostsComponent A 1. PPGF 2. VOD 3. Crop Technology 4. SWC 5. WRD 6. Livestock 7. Forestry8. Migration Support
Subtotal
Other Development CostsSubtotal
Total B
Total A + B
GVTDFIDICommunityGovernment
Source:
DFIDI = Department for International Development (India).PPGF = Participatory Planning and Group Formation.VOD = Village Organisation and Development.SWC = Soil and Water Conservation.WRD = Water Resource Development.
GVT - Rajasthan - Banswara: Village Bhuripada: Costs - Economic (Rs'000).
1999/00 2000/01 2001/02 2002/03 2003/04 2004/05 2005/06CF SCF Actual Actual Actual Actual Actual Budget Budget (Rs'000) (%)
0.90 1.00 - 54.2 67.9 60.6 47.5 60.1 55.0 345.4 8%1.00 1.00 35.9 71.4 26.9 63.2 47.4 54.7 39.2 338.6 8%0.90 1.00 - 115.7 132.3 114.8 154.5 135.5 129.4 782.2 18%
35.9 241.3 227.1 238.6 249.5 250.3 223.6 1,466.2 34%
0.90 1.00 - 16.9 28.5 42.8 36.0 27.7 31.7 183.7 4%0.90 1.00 - 71.1 43.2 46.3 47.1 24.9 23.6 256.3 6%0.90 1.00 - 2.5 49.6 68.1 20.8 29.1 23.8 194.0 4%0.90 0.75 - - 328.3 611.1 376.5 - - 1,315.9 30%0.90 0.75 - - 23.3 238.6 287.2 82.1 55.4 686.7 16%0.90 1.00 - 3.3 32.3 12.8 21.6 10.6 99.4 180.0 4%0.90 1.00 - 4.0 6.6 11.0 5.6 3.6 3.6 34.5 1%0.90 1.00 - - - - - - - - 0%
- 97.9 511.9 1,030.7 794.9 178.0 237.6 2,851.0 66%
0.90 1.00 - - - - - - - - 0%- 97.9 511.9 1,030.7 794.9 178.0 237.6 2,851.0 66%
35.9 339.2 739.0 1,269.3 1,044.3 428.3 461.1 4,317.2 100%
- - - - - - - N/A- - - - - - - N/A- - - - - - - N/A- - - - - - - N/A
Cost Benefit Analysis (CBA) Study Estimate Jan 2005.
TotalsConversion Factors

Table AN12.11.6 GVT - Rajasthan - Banswara: Village Bhuripada: VOD Household Assumptions.
Without \ With Project UnitsYear 1 Year 2 Year 3(Rs) (Rs) (Rs)
Development Activity:Village Organisation and Development
Before / Without Project Situation:
A. Self Help Groups (SHGs)Assumption Sum Zero Zero Zero - - -
B. Drudgery ReductionAssumption Sum Zero Zero Zero
Total Without Project Benefits - - -
After / With Project Situation:
A. Self Help Groups (SHGs)Assumptions
Average Household Savings Rs 1,162.5 Households (HHs) No 160 Present Group Deposits Rs'000 186.0 Annual Savings Increase % 3% 186.0 191.6 197.3 Deposits on Loan to Members % 46%SHG Interest Income % / Year 18%Assumed Benefit Rs'000 15.4 15.9 16.3
B. Drudgery ReductionAssumptions
Hours Saved / Day / Household No 1.0 Number of Days / Year / Household No 200 Days / Year / Household (8hrs/day) No 25.0 Households / Village No 160 Day Equivalent / Village No 4,000 Economic Value per Day (Rs/day) 25 Assumed Benefit Rs'000 100.0 100.0 100.0
Total With Project Benefits Rs'000 115.4 115.9 116.3
Incremental Benefits Rs'000 115.4 115.9 116.3
Source: Cost Benefit Analysis (CBA) Study Estimate Jan 2005.VOD = Village Organisation and Development.Households per village: Bhuripada 160
Assumptions Benefits

Table AN12.11.6
Without \ With Project
Development Activity:Village Organisation and Development
Before / Without Project Situation:
A. Self Help Groups (SHGs)Assumption
B. Drudgery ReductionAssumption
Total Without Project Benefits
After / With Project Situation:
A. Self Help Groups (SHGs)Assumptions
Average Household SavingsHouseholds (HHs)Present Group DepositsAnnual Savings IncreaseDeposits on Loan to MembersSHG Interest Income Assumed Benefit
B. Drudgery ReductionAssumptions
Hours Saved / Day / HouseholdNumber of Days / Year / HouseholdDays / Year / Household (8hrs/day)Households / VillageDay Equivalent / VillageEconomic Value per DayAssumed Benefit
Total With Project Benefits
Incremental Benefits
Source:VOD = Village Organisation and Development.Households per village: Bhuripada
GVT - Rajasthan - Banswara: Village Bhuripada: Incremental VOD Benefit Stream (Rs'000).
Year 1 Year 2 Year 3 Year 4 Year 5 Year 6 Year 7 Year 8 Year 9 Year 101999/00 2000/01 2001/02 2002/03 2003/04 2004/05 2005/06 2006/07 2007/08 2008/09
- - - - - - - - - -
- - - 186.0 191.6 197.3 203.2 209.3 215.6 222.1
- - - 15.4 15.9 16.3 16.8 17.3 17.9 18.4
- - - 100.0 100.0 100.0 100.0 100.0 100.0 100.0
- - - 115.4 115.9 116.3 116.8 117.3 117.9 118.4
- - - 115.4 115.9 116.3 116.8 117.3 117.9 118.4
Cost Benefit Analysis (CBA) Study Estimate Jan 2005.
Benefit Streams (Rs '000)

Table AN12.11.7 GVT - Rajasthan - Banswara: Village Bhuripada: Household Crop Net Margin Assumptions.
Without \ With Project UnitsYear 1 Year 2 Year 3(Rs) (Rs) (Rs)
Development Activity:Crop Technology, SWC and WRD
Before / Without Project Situation:Assumptions
Households (HHs) No 160 Crop Adoption Assumptions 100% 100% 100%
Kharif Crop Net Margin Rs/HH 1,134.3 1,134.3 1,134.3
Rabi Crop Net Margin Rs/HH 165.1 165.1 165.1 Total Without Project Benefits Rs/HH 1,299.3 1,299.3 1,299.3
After / With Project Situation:Assumptions
Households (HHs) No 160 Crop Adoption Assumptions 100% 100% 100%
Kharif Crop Net Margin Rs/HH 4,609.9 4,609.9 4,609.9
Rabi Crop Net Margin Rs/HH 928.3 928.3 928.3 Total With Project Benefits Rs/HH 5,538.2 5,538.2 5,538.2
Incremental Benefits Rs/HH 4,238.8 4,238.8 4,238.8
Source: Cost Benefit Analysis (CBA) Study Estimate Jan 2005.
Assumptions Benefits
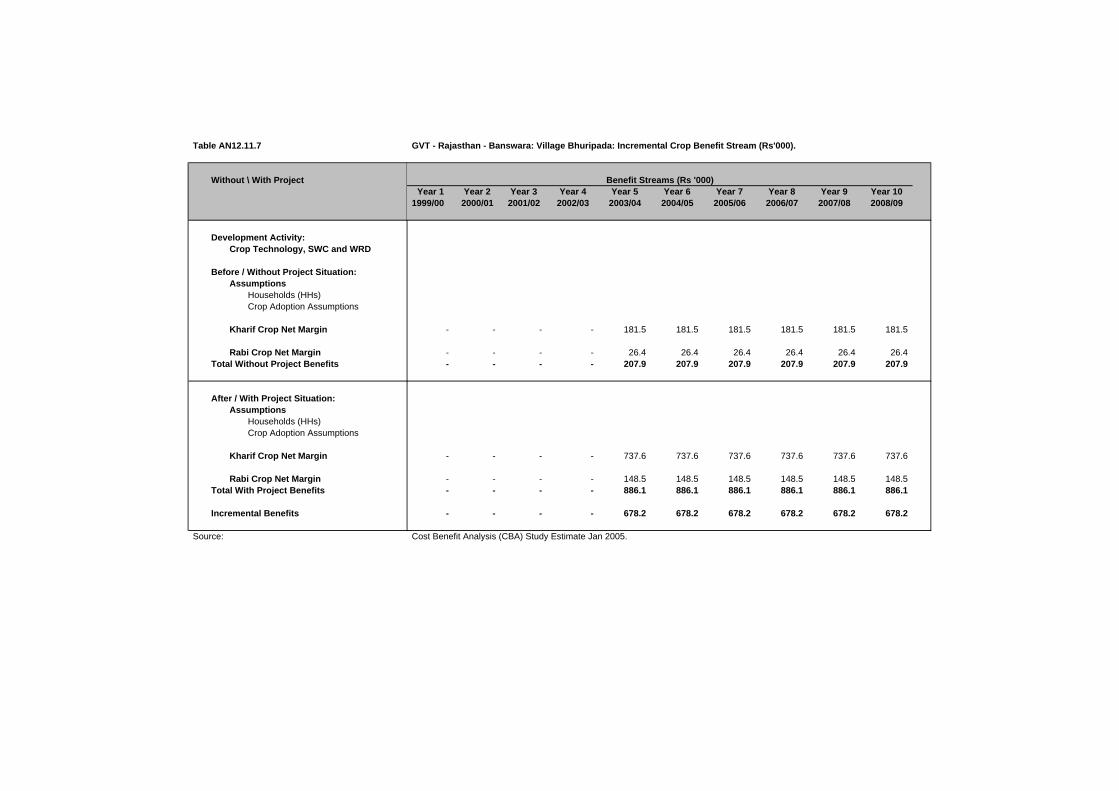
Table AN12.11.7
Without \ With Project
Development Activity:Crop Technology, SWC and WRD
Before / Without Project Situation:Assumptions
Households (HHs)Crop Adoption Assumptions
Kharif Crop Net Margin
Rabi Crop Net MarginTotal Without Project Benefits
After / With Project Situation:Assumptions
Households (HHs)Crop Adoption Assumptions
Kharif Crop Net Margin
Rabi Crop Net MarginTotal With Project Benefits
Incremental Benefits
Source:
GVT - Rajasthan - Banswara: Village Bhuripada: Incremental Crop Benefit Stream (Rs'000).
Year 1 Year 2 Year 3 Year 4 Year 5 Year 6 Year 7 Year 8 Year 9 Year 101999/00 2000/01 2001/02 2002/03 2003/04 2004/05 2005/06 2006/07 2007/08 2008/09
- - - - 181.5 181.5 181.5 181.5 181.5 181.5
- - - - 26.4 26.4 26.4 26.4 26.4 26.4 - - - - 207.9 207.9 207.9 207.9 207.9 207.9
- - - - 737.6 737.6 737.6 737.6 737.6 737.6
- - - - 148.5 148.5 148.5 148.5 148.5 148.5 - - - - 886.1 886.1 886.1 886.1 886.1 886.1
- - - - 678.2 678.2 678.2 678.2 678.2 678.2
Cost Benefit Analysis (CBA) Study Estimate Jan 2005.
Benefit Streams (Rs '000)

Table AN12.11.8 GVT - Rajasthan - Banswara: Village Bhuripada: Household Livestock Net Margin Assumptions
Without \ With Project UnitsLivestock Year 1 Year 2 Year 3
(Rs) (Rs) (Rs)
Development Activity:Livestock
Before / Without Project Situation:Assumptions
Households (HHs) No 160 Annual Livestock Net Margin Rs/HH
Total Without Project Benefits 1,018.4 1,018.4 1,018.4
After / With Project Situation:
Development Activity:Assumptions
Households (HHs) No 160 Adoption Assumptions Percent 55% 78% 100%
Annual Livestock Net Margin Rs/HHTotal With Project Benefits 1,582.3 2,229.6 2,877.0
Incremental Benefits Rs/HH 563.9 1,211.2 1,858.5
Source: Cost Benefit Analysis (CBA) Study Estimate Jan 2005.
Assumptions Benefits

Table AN12.11.8
Without \ With ProjectLivestock
Development Activity:Livestock
Before / Without Project Situation:Assumptions
Households (HHs)Annual Livestock Net Margin
Total Without Project Benefits
After / With Project Situation:
Development Activity:Assumptions
Households (HHs)Adoption Assumptions
Annual Livestock Net MarginTotal With Project Benefits
Incremental Benefits
Source:
GVT - Rajasthan - Banswara: Village Bhuripada: Incremental Livestock Benefit Stream (Rs'000).
Year 1 Year 2 Year 3 Year 4 Year 5 Year 6 Year 7 Year 8 Year 9 Year 101999/00 2000/01 2001/02 2002/03 2003/04 2004/05 2005/06 2006/07 2007/08 2008/09
- - - - 162.9 162.9 162.9 162.9 162.9 162.9
- - - - 253.2 356.7 460.3 460.3 356.7 356.7
- - - - 90.2 193.8 297.4 297.4 193.8 193.8
Cost Benefit Analysis (CBA) Study Estimate Jan 2005.
Benefit Streams (Rs '000)

Table AN12.11.9 GVT - Rajasthan - Banswara: Village Bhuripada: Forestry Benefit Assumptions.
Without \ With Project UnitsForestry Year 1 Year 2 Year 3
(Rs) (Rs) (Rs)
Development Activity:Forestry
Before / Without Project Situation:AssumptionsHouseholds (HHs) No 160 Annual Forestry Net Margin Rs/HH
Total Without Project Benefits - - -
After / With Project Situation:AssumptionsHouseholds (HHs) No 160 Adoption Assumptions Percent 55% 78% 100%Annual Forestry Net Margin Rs/HH
Total With Project Benefits 55.0 78.0 100.0
Incremental Benefits Rs/HH 55.0 78.0 100.0
Source: Cost Benefit Analysis (CBA) Study Estimate Jan 2005.
Assumptions Benefits

Table AN12.11.9
Without \ With ProjectForestry
Development Activity:Forestry
Before / Without Project Situation:AssumptionsHouseholds (HHs)Annual Forestry Net Margin
Total Without Project Benefits
After / With Project Situation:AssumptionsHouseholds (HHs)Adoption AssumptionsAnnual Forestry Net Margin
Total With Project Benefits
Incremental Benefits
Source:
GVT - Rajasthan - Banswara: Village Bhuripada: Incremental Forestry Benefit Stream (Rs'000).
Year 1 Year 2 Year 3 Year 4 Year 5 Year 6 Year 7 Year 8 Year 9 Year 101999/00 2000/01 2001/02 2002/03 2003/04 2004/05 2005/06 2006/07 2007/08 2008/09
- - - - - - - - - -
- - - 8.8 12.5 16.0 16.0 16.0 16.0 16.0
- - - 8.8 12.5 16.0 16.0 16.0 16.0 16.0
Cost Benefit Analysis (CBA) Study Estimate Jan 2005.
Benefit Streams (Rs '000)
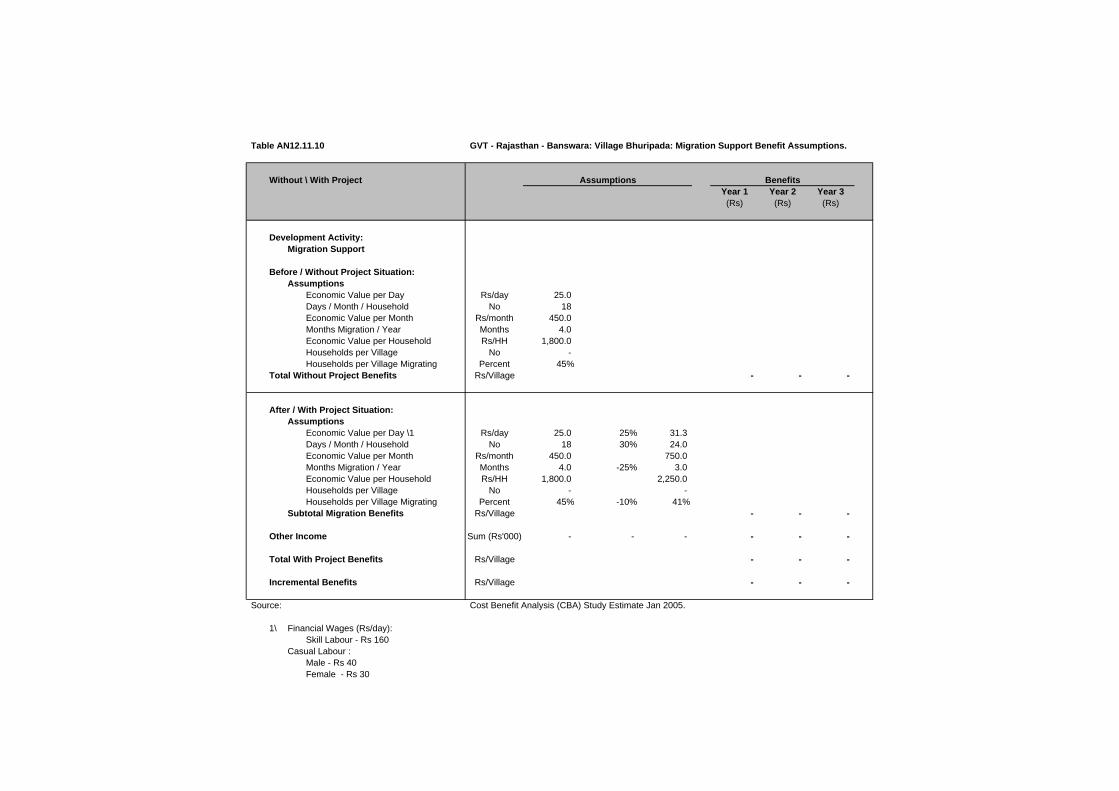
Table AN12.11.10 GVT - Rajasthan - Banswara: Village Bhuripada: Migration Support Benefit Assumptions.
Without \ With ProjectYear 1 Year 2 Year 3(Rs) (Rs) (Rs)
Development Activity:Migration Support
Before / Without Project Situation:Assumptions
Economic Value per Day Rs/day 25.0 Days / Month / Household No 18 Economic Value per Month Rs/month 450.0 Months Migration / Year Months 4.0 Economic Value per Household Rs/HH 1,800.0 Households per Village No - Households per Village Migrating Percent 45%
Total Without Project Benefits Rs/Village - - -
After / With Project Situation:Assumptions
Economic Value per Day \1 Rs/day 25.0 25% 31.3 Days / Month / Household No 18 30% 24.0 Economic Value per Month Rs/month 450.0 750.0 Months Migration / Year Months 4.0 -25% 3.0 Economic Value per Household Rs/HH 1,800.0 2,250.0 Households per Village No - - Households per Village Migrating Percent 45% -10% 41%
Subtotal Migration Benefits Rs/Village - - -
Other Income Sum (Rs'000) - - - - - -
Total With Project Benefits Rs/Village - - -
Incremental Benefits Rs/Village - - -
Source: Cost Benefit Analysis (CBA) Study Estimate Jan 2005.
1\ Financial Wages (Rs/day):Skill Labour - Rs 160
Casual Labour :Male - Rs 40Female - Rs 30
Assumptions Benefits

Table AN12.11.10
Without \ With Project
Development Activity:Migration Support
Before / Without Project Situation:Assumptions
Economic Value per Day Days / Month / Household Economic Value per Month Months Migration / Year Economic Value per Household Households per Village Households per Village Migrating
Total Without Project Benefits
After / With Project Situation:Assumptions
Economic Value per Day \1Days / Month / Household Economic Value per Month Months Migration / Year Economic Value per Household Households per Village Households per Village Migrating
Subtotal Migration Benefits
Other Income
Total With Project Benefits
Incremental Benefits
Source:
1\ Financial Wages (Rs/day):Skill Labour - Rs 160
Casual Labour :Male - Rs 40Female - Rs 30
GVT - Rajasthan - Banswara: Village Bhuripada: Incremental Migration Support Benefit Stream (Rs'000).
Year 1 Year 2 Year 3 Year 4 Year 5 Year 6 Year 7 Year 8 Year 9 Year 101999/00 2000/01 2001/02 2002/03 2003/04 2004/05 2005/06 2006/07 2007/08 2008/09
- - - - - - - - - -
- - - - - - - - - -
- - - - - - - - - -
- - - - - - - - - -
- - - - - - - - - -
Cost Benefit Analysis (CBA) Study Estimate Jan 2005.
Benefit Streams (Rs '000)

Table AN12.11.11 GVT - Rajasthan - Banswara: Village Bhuripada: Weighted Household Crop Net Margin Summary (Rs/Household).
Item WBR(%) Khalif Rabi Total Khalif Rabi Total Khalif Rabi Total
Phase IIWell Being Ranking - Very Poor
Household Net Margin (Rs) 28.0% 834.6 102.5 937.1 1,849.8 1,067.8 2,917.6 1,015.2 965.3 1,980.5 Well Being Ranking - Very Poor
Household Net Margin (Rs) 50.0% 637.7 - 637.7 4,803.0 220.7 5,023.7 4,165.3 220.7 4,386.0 Well Being Ranking - Poor
Household Net Margin (Rs) 15.0% 994.0 89.3 1,083.3 3,711.4 2,508.3 6,219.6 2,717.4 2,419.0 5,136.4 Well Being Ranking - Better Off
Household Net Margin (Rs) 7.0% 6,180.9 1,756.7 7,937.5 16,195.9 2,039.3 18,235.2 10,015.0 282.7 10,297.7
Well Being Ranking - WeightedHousehold Net Margin (Rs) 100.0% 1,134.3 165.1 1,299.3 4,609.9 928.3 5,538.2 3,475.6 763.2 4,238.8
Phase I \1Well Being Ranking - Very Poor
Household Net Margin (Rs) 28.0% 436.3 267.5 703.8 3,866.5 1,668.8 5,535.3 3,430.3 1,401.3 4,831.5 Well Being Ranking - Very Poor
Household Net Margin (Rs) 50.0% 485.8 657.5 1,143.3 10,136.0 5,690.3 15,826.3 9,650.3 5,032.8 14,683.0 Well Being Ranking - Poor
Household Net Margin (Rs) 15.0% 986.3 3,385.0 4,371.3 9,457.5 5,195.0 14,652.5 8,471.3 1,810.0 10,281.3 Well Being Ranking - Better Off
Household Net Margin (Rs) 7.0% 2,778.0 937.0 3,715.0 4,915.0 9,560.0 14,475.0 2,137.0 8,623.0 10,760.0
Well Being Ranking - WeightedHousehold Net Margin (Rs) 100.0% 707.4 977.0 1,684.4 7,913.3 4,760.8 12,674.1 7,205.9 3,783.8 10,989.7
Source: Study of Impact of WIRFP on Net Incomes of Target Households, Jan 2004.WBR = GVT Household Well Being Ranking. Survey figures adjusted to Village Profile WBR.
\1 GVT - Madhya Pradesh - Phase I: Village Naganwat Choti: Weighted Household Crop Net Margin Summary.
Before / Without Project After / With Project Increment

Table AN12.11.12 GVT - Rajasthan - Banswara: Village Bhuripada: Household Crop Net Margin Sensitivity Analysis.
Item EIRRKhalif Rabi Total Khalif Rabi Total Khalif Rabi Total
Development Activity:Crop Technology, SWC and WRD
Weighted Net Margin (Phase II)Household Net Margin (Rs) 1,134.3 165.1 1,299.3 4,609.9 928.3 5,538.2 3,475.6 763.2 4,238.8 Incremental Benefit (Phase II / Phase I) 39%
Base Case AssumptionsHousehold Net Margin (Rs) 1,134.3 165.1 1,299.3 4,609.9 928.3 5,538.2 3,475.6 763.2 4,238.8 Incremental Benefit (Phase II / Phase I) 39%Sensitivity Increase (%) 0%Development Acivity 19%Overall Village 14%
Sensitivity AssumptionsHousehold Net Margin (Rs) 1,134.3 165.1 1,299.3 4,609.9 928.3 5,538.2 3,475.6 763.2 4,238.8 Incremental Benefit (Phase II / Phase I) 39%Sensitivity Increase (%) 0%Development Acivity 19%Overall Village 14%
Weighted Net Margin (Phase I)Household Net Margin (Rs) 707.4 977.0 1,684.4 7,913.3 4,760.8 12,674.1 7,205.9 3,783.8 10,989.7
Source: Cost Benefit Analysis (CBA) Study Estimate Jan 2005.EIRR = Economic Internal Rate of Return (rate at which NPV equal to zero).
Before / Without Project After / With Project Increment

Table AN12.11.13 GVT - Rajasthan - Banswara: Village Bhuripada: Weighted Household Livestock Net Margin Summary (Rs/Household).
Well Being Ranking Weight(%) Herd Value Net Margin Herd Value Net Margin Herd Value Net Margin
Phase I - Well Being Ranking (WBR) \1Madhya Pradesh - WBR Weighted DataVery Poor 28.0%
Average 580 (185.0) 5,650 412.5 474 597.5 Poor 50.0%
Average 2,350 982.5 8,250 2,141.0 1,180 1,158.5 Moderate 15.0%
Average 14,700 6,730.0 1,900 2,820.0 1,900 (3,910.0)Better Off 7.0%
Average 15,580 3,000.0 14,600 10,790.0 (196) 7,790.0
Phase I - WBR Weighted Data 100.0% 4,633 1,659.0 7,014 2,364.3 994 705.4
Phase II - Well Being Ranking (WBR)
Very Poor 28.0%Average 5,756 149.2 10,970 1,446.4 1,043 1,297.2
Poor 50.0%Average 13,128 852.2 25,979 3,008.8 2,570 2,156.8
Moderate 15.0%Average 13,525 4,035.1 27,020 5,249.5 2,699 1,214.4
Better Off 7.0%Average 12,700 (781.7) 41,873 2,573.3 5,835 3,355.0
Phase II - WBR Weighted Data 100.0% 11,093 1,018.4 23,045 2,877.0 2,390 1,858.6
Source: Study of Impact of WIRFP on Net Incomes of Target Households, Jan 2004.WBR = GVT Household Well Being Ranking. Survey figures adjusted to Village Profile WBR.
\1 GVT - Madhya Pradesh - Phase I: Village Naganwat Choti: Weighted Household Livestock Net Margin Summary.
Before / Without Project After / With Project Increment \1

WIRFP - Phase II - Cost Benefit Analysis Study
Tables AN12.0 Individual Village Cost Benefit Analysis
Tables AN12.12 GVT - Rajasthan - Banswara: Village Gara.
Table AN12.12.1 GVT - Rajasthan - Banswara: Village Gara: Village Profile.
Table AN12.12.2 GVT - Rajasthan - Banswara: Village Gara - Cost Benefit Analysis Summary (Rs'000).Table AN12.12.3 GVT - Rajasthan - Banswara: Village Gara - Cost Benefit Analysis Development Activity Summary A (Rs'000).Table AN12.12.4 GVT - Rajasthan - Banswara: Village Gara - Cost Benefit Analysis Development Activity Summary B (Rs'000).
Table AN12.12.5 GVT - Rajasthan - Banswara: Village Gara - Costs - Financial (Rs'000).GVT - Rajasthan - Banswara: Village Gara - Costs - Economic (Rs'000).
Table AN12.12.6 GVT - Rajasthan - Banswara: Village Gara: VOD Household Assumptions.GVT - Rajasthan - Banswara: Village Gara: Incremental VOD Benefit Stream (Rs'000).
Table AN12.12.7 GVT - Rajasthan - Banswara: Village Gara: Household Crop Net Margin Assumptions.GVT - Rajasthan - Banswara: Village Gara: Incremental Crop Benefit Stream (Rs'000).
Table AN12.12.8 GVT - Rajasthan - Banswara: Village Gara: Household Livestock Net Margin Assumptions.GVT - Rajasthan - Banswara: Village Gara: Incremental Livestock Benefit Stream (Rs'000).
Table AN12.12.9 GVT - Rajasthan - Banswara: Village Gara: Forestry Benefit Assumptions.GVT - Rajasthan - Banswara: Village Gara: Incremental Forestry Benefit Stream (Rs'000).
Table AN12.12.10 GVT - Rajasthan - Banswara: Village Gara: Migration Support Benefit Assumptions.GVT - Rajasthan - Banswara: Village Gara: Incremental Migration Support Benefit Stream (Rs'000).
Table AN12.12.11 GVT - Rajasthan - Banswara: Village Gara: Weighted Household Crop Net Margin Summary (Rs/Household).Table AN12.12.12 GVT - Rajasthan - Banswara: Village Gara: Household Crop Net Margin Sensitivity Analysis.
Table AN12.12.13 GVT - Rajasthan - Banswara: Village Gara: Weighted Household Livestock Net Margin Summary (Rs/Household).

Table AN12.12.1 GVT - Rajasthan - Banswara: Village Gara: Village Profile.
Village Profile \1
A. Background F. Land Resource (ha)Village Name Gara Total Area 290 District Banswara Revenue Land (unused) 156 State Rajasthan Forest Area - Revenue 63
Pasture Land 8 B. Participatory Planning Process (PPP) Arable Land 63
Village entry Nov-99 290 PRA Jul-01CPA Jul-01 G. Livestock
C. InfrastructureHand Pumps (no) 11 Wells (no) 13 Linked by Road 9 KmsElectrification YesSchool 1 - 5 H. Self Help Groups (No Households)
1 Group 1 11 D. Demographic Data 2 Group 2 17
Households (no) 112 3 Group 3 18 Participating Households 80 4 Group 4 12 Population 667 5 Group 5 15
Adults: 6 Group 6 18 Male 338 7 Group 7 16 Female 329 8 Group 8 17 Children: 9 Group 9 18 Boys N/A 10 Group 10 20 Girls N/A 11 Group 11 -
12 Group 12 - E. Well Being Ranking (No Households) 13 Group 13 -
Very Poor 8 9.2% 14 Group 14 - Poor 26 29.9% 15 Group 15 - Moderate 40 46.0% 16 Group 16 - Better Off 13 14.9% 17 Group 17 - Total 87 100% 18 Group 18 -
19 Group 19 - Total 162
Source: GVT Banswara Coordination Office - Rajasthan.\1 Subject to final adjustment following consolidation exercise prior to Annual Review Meeting (ARM) in Feb 2005.

Table AN12.12.2 GVT - Rajasthan - Banswara: Village Gara - Cost Benefit Analysis Summary (Rs'000).
Administration Costs / Development Activity EIRR \1 Year 1 Year 2 Year 3 Year 4 Year 5 Year 6 Year 7 Year 8 Year 9 Year 10(10%) % 1999/00 2000/01 2001/02 2002/03 2003/04 2004/05 2005/06 2006/07 2007/08 2008/09
A. Administration CostsTotal A N/A (972) 159% 35.9 241.3 227.1 238.6 249.5 250.3 223.6 22.4 22.4 22.4
B. Development Activity Component A 1. PPGF
Net Incremental Benefits N/A (59) 10% - (6.4) (7.1) (12.8) (17.6) (20.9) (30.3) (2.3) (2.3) (2.3)
2. VODNet Incremental Benefits 57% 202 -33% - (2.8) (8.8) 16.0 (49.4) (24.0) 44.3 75.1 75.6 76.2
3/5.Crop Technology, SWC and WRDNet Incremental Benefits 8% (107) 18% - (4.1) (92.5) 628.8 (87.9) (1,560.2) (296.4) 184.7 184.7 184.7
6. LivestockNet Incremental Benefits 166% 307 -50% - (5.7) (15.0) 21.0 77.1 209.9 (29.7) 59.4 59.4 59.4
7. ForestryNet Incremental Benefits 126% 18 -3% - - (2.8) 5.7 4.2 (5.1) (8.0) 6.9 6.9 6.9
8. Migration SupportNet Incremental Benefits N/A - 0% - - - - - - - - - -
SummaryNet Incremental Benefits 4% (611) 100% (35.9) (260.3) (353.3) 420.1 (323.0) (1,650.7) (543.7) 301.5 302.1 302.6
Sensitivity AnalysisAnalysis Period
12 Years N/A (997)20 Years (Base Case) 4% (611)25 Years 7% (498)30 Years 8% (434)
Costs - AdministrationInvestment Costs Decreased by 20 percent 6% (416)
Costs - Administrion and DevelopmentRecurrent Costs Increased by 20 percent -1% (959)
Benefits - Crop, SWC and WRDCrop Benefits Increased by 20 percent 13% 123 Livestock Benefits Increased by 20 percent 8% (297)
Source: Cost Benefit Analysis (CBA) Study Estimate Jan 2005.\1 EIRR = Economic Internal Rate of Return (rate at which NPV equal to zero).\2 NPV = Net Present Value of net incremental benefits at 12% (indicative opportunity cost of capital for rural development projects in India).
N/A = Not analysed as EIRR negative.
NPV \2

Table AN12.12.3 GVT - Rajasthan - Banswara: Village Gara - Cost Benefit Analysis Development Activity Summary A (Rs'000).
Administration Costs / Development Activity EIRR \1 Year 1 Year 2 Year 3 Year 4 Year 5 Year 6 Year 7 Year 8 Year 9 Year 10(10%) % 1999/00 2000/01 2001/02 2002/03 2003/04 2004/05 2005/06 2006/07 2007/08 2008/09
A. Administration CostsInvestment 35.9 241.3 227.1 238.6 249.5 250.3 223.6 - - - Recurrent - - - - - - - 22.4 22.4 22.4
Total A N/A (972) 159% 35.9 241.3 227.1 238.6 249.5 250.3 223.6 22.4 22.4 22.4
B. Development Intervention Component A 1. PPGF
Cost StreamInvestment - 6.4 7.0 12.5 16.9 19.9 28.7 - - - Recurrent - - 0.2 0.3 0.6 1.1 1.6 2.3 2.3 2.3 Total Costs - 6.4 7.1 12.8 17.6 20.9 30.3 2.3 2.3 2.3
Benefit StreamBefore / Without Project - - - - - - - - - - After / With Project - - - - - - - - - - Incremental Benefits - - - - - - - - - -
Net Incremental Benefits N/A (59) 10% - (6.4) (7.1) (12.8) (17.6) (20.9) (30.3) (2.3) (2.3) (2.3)
2. VODCost Stream
Investment - 2.8 8.6 74.4 136.6 104.9 31.8 - - - Recurrent - - 0.1 0.6 4.3 11.1 16.4 18.0 18.0 18.0 Total Costs - 2.8 8.8 75.0 140.9 116.1 48.2 18.0 18.0 18.0
Benefit StreamBefore / Without Project - - - - - - - - - - After / With Project - - - 91.0 91.5 92.0 92.5 93.1 93.6 94.2 Incremental Benefits - - - 91.0 91.5 92.0 92.5 93.1 93.6 94.2
Net Incremental Benefits 57% 202 -33% - (2.8) (8.8) 16.0 (49.4) (24.0) 44.3 75.1 75.6 76.2
3/5.Crop Technology, SWC and WRDCost Stream
InvestmentCrop Tecnology - 4.1 39.2 6.5 58.9 12.9 29.0 - - - Soil Water Conservation - - - - 635.1 591.1 449.5 - - - Water Resource Development - - 53.2 3.7 32.3 1,509.0 70.0 - - -
RecurrentCrop Tecnology - - 0.1 1.1 1.2 2.7 3.0 3.8 3.8 3.8 Soil Water Conservation - - - - - 79.4 153.3 209.5 209.5 209.5 Water Resource Development - - 8.0 8.5 13.4 239.7 250.2 250.2 250.2
Total Costs - 4.1 92.5 19.3 736.0 2,208.4 944.6 463.5 463.5 463.5 Benefit Stream
Before / Without Project - - - 235.7 235.7 235.7 235.7 235.7 235.7 235.7 After / With Project - - - 883.9 883.9 883.9 883.9 883.9 883.9 883.9 Incremental Benefits - - - 648.2 648.2 648.2 648.2 648.2 648.2 648.2
Net Incremental Benefits 8% (107) 18% - (4.1) (92.5) 628.8 (87.9) (1,560.2) (296.4) 184.7 184.7 184.7
Source: Cost Benefit Analysis (CBA) Study Estimate Jan 2005.\1 EIRR = Economic Internal Rate of Return (rate at which NPV equal to zero).\2 NPV = Net Present Value of net incremental benefits at 12% (indicative opportunity cost of capital for rural development projects in India).
N/A = Not analysed as EIRR negative.
NPV \2

Table AN12.12.4 GVT - Rajasthan - Banswara: Village Gara - Cost Benefit Analysis Development Activity Summary B (Rs'000).
Administration Costs / Development Activity Year 1 Year 2 Year 3 Year 4 Year 5 Year 6 Year 7 Year 8 Year 9 Year 101999/00 2000/01 2001/02 2002/03 2003/04 2004/05 2005/06 2006/07 2007/08 2008/09
6. LivestockCost Stream
Investment - 5.7 15.0 29.9 58.5 7.4 96.2 - - - Recurrent - - 5.3 5.7 8.9 159.8 166.8 166.8 166.8 Total Costs - 5.7 15.0 35.2 64.2 16.3 256.0 166.8 166.8 166.8
Benefit StreamBefore / Without Project - - - 151.6 151.6 151.6 151.6 151.6 151.6 151.6 After / With Project - - - 207.8 292.9 377.9 377.9 377.9 377.9 377.9 Incremental Benefits - - - 56.2 141.2 226.3 226.3 226.3 226.3 226.3
Net Incremental Benefits 166% 307 -50% - (5.7) (15.0) 21.0 77.1 209.9 (29.7) 59.4 59.4 59.4
7. ForestryCost Stream
Investment - - 2.8 - 3.9 15.3 16.7 - - - Recurrent - - 0.3 0.3 0.7 2.2 3.9 3.9 3.9 Total Costs - - 2.8 0.3 4.2 15.9 18.8 3.9 3.9 3.9
Benefit StreamBefore / Without Project - - - - - - - - - - After / With Project - - - 5.9 8.4 10.8 10.8 10.8 10.8 10.8 Incremental Benefits - - - 5.9 8.4 10.8 10.8 10.8 10.8 10.8
Net Incremental Benefits 126% 18 -3% - - (2.8) 5.7 4.2 (5.1) (8.0) 6.9 6.9 6.9
8. Migration SupportCost Stream
Investment - - - - - - - - - - Recurrent - - - - - - - - - Total Costs - - - - - - - - - -
Benefit StreamBefore / Without Project - - - - - - - - - - After / With Project - - - - - - - - - - Incremental Benefits - - - - - - - - - -
Net Incremental Benefits N/A - 0% - - - - - - - - - -
SummaryCost Stream
Investment 35.9 260.3 352.9 365.6 1,191.6 2,510.7 945.5 - - - Recurrent - - 0.4 15.6 20.7 117.3 576.0 676.7 676.7 676.7 Total Costs 35.9 260.3 353.3 381.2 1,212.3 2,627.9 1,521.5 676.7 676.7 676.7
Benefit StreamBefore / Without Project - - - 387.4 387.4 387.4 387.4 387.4 387.4 387.4 After / With Project - - - 1,188.7 1,276.7 1,364.6 1,365.1 1,365.7 1,366.2 1,366.8 Incremental Benefits - - - 801.4 889.3 977.2 977.8 978.3 978.8 979.4
Net Incremental Benefits 4% (611) 100% (35.9) (260.3) (353.3) 420.1 (323.0) (1,650.7) (543.7) 301.5 302.1 302.6
Source: Cost Benefit Analysis (CBA) Study Estimate Jan 2005.

Table AN12.12.5 GVT - Rajasthan - Banswara: Village Gara - Costs - Financial (Rs'000).
Cost Head / Subhead 1999/00 2000/01 2001/02 2002/03 2003/04 2004/05 2005/06Actual Actual Actual Actual Actual Budget Budget (Rs'000) (%)
A. Administration CostsGVT Bhopal (PHQ) - 60.3 75.4 67.3 52.8 66.8 61.1 383.7 5%DFIDI Consultancy 35.9 71.4 26.9 63.2 47.4 54.7 39.2 338.6 5%Rajastan Coordination Office - 128.5 147.0 127.6 171.7 150.5 143.8 869.1 12%
Total A 35.9 260.2 249.4 258.1 271.9 272.0 244.1 1,591.5 21%
B. Development CostsComponent A 1. PPGF - 7.1 7.7 13.8 18.8 22.1 31.9 101.4 1% 2. VOD - 3.2 9.6 82.7 151.8 116.6 35.3 399.2 5% 3. Crop Technology - 4.6 43.5 7.3 65.4 14.3 32.2 167.3 2% 4. SWC - - - - 940.9 875.7 666.0 2,482.6 33% 5. WRD - - 78.8 5.5 47.8 2,235.5 103.8 2,471.4 33% 6. Livestock - 6.3 16.7 33.2 65.0 8.2 106.9 236.2 3% 7. Forestry - - 3.1 - 4.3 17.0 18.5 42.9 1%8. Migration Support - - - - - - - - 0%
Subtotal - 21.1 159.5 142.5 1,294.0 3,289.3 994.6 5,901.0 79%
Other Development CostsSubtotal - - - - - - - -
Total (B - 21.1 159.5 142.5 1,294.0 3,289.3 994.6 5,901.0 79%
Total A + B 35.9 281.3 408.8 400.6 1,565.9 3,561.3 1,238.6 7,492.5 100%
GVT - 209.1 373.3 323.8 1,113.4 2,993.2 917.5 5,930.4 79%DFIDI 35.9 71.4 26.9 63.2 47.4 54.7 39.2 338.6 5%Community - 0.8 5.6 12.5 401.9 430.9 277.6 1,129.3 15%Government - 0.0 3.0 1.0 3.3 82.5 4.4 94.2 1%
Source: GVT Banswara Coordination Office - Rajasthan.
DFIDI = Department for International Development (India).PPGF = Participatory Planning and Group Formation.VOD = Village Organisation and Development.SWC = Soil and Water Conservation.WRD = Water Resource Development.
Total

Table AN12.12.5
Cost Head / Subhead
A. Administration CostsGVT Bhopal (PHQ)DFIDI ConsultancyRajastan Coordination Office
Total A
B. Development CostsComponent A 1. PPGF 2. VOD 3. Crop Technology 4. SWC 5. WRD 6. Livestock 7. Forestry8. Migration Support
Subtotal
Other Development CostsSubtotal
Total (B
Total A + B
GVTDFIDICommunityGovernment
Source:
DFIDI = Department for International Development (India).PPGF = Participatory Planning and Group Formation.VOD = Village Organisation and Development.SWC = Soil and Water Conservation.WRD = Water Resource Development.
GVT - Rajasthan - Banswara: Village Gara - Costs - Economic (Rs'000).
1999/00 2000/01 2001/02 2002/03 2003/04 2004/05 2005/06CF SCF Actual Actual Actual Actual Actual Budget Budget (Rs'000) (%)
0.90 1.00 - 54.2 67.9 60.6 47.5 60.1 55.0 345.4 6%1.00 1.00 35.9 71.4 26.9 63.2 47.4 54.7 39.2 338.6 6%0.90 1.00 - 115.7 132.3 114.8 154.5 135.5 129.4 782.2 14%
35.9 241.3 227.1 238.6 249.5 250.3 223.6 1,466.2 26%
0.90 1.00 - 6.4 7.0 12.5 16.9 19.9 28.7 91.3 2%0.90 1.00 - 2.8 8.6 74.4 136.6 104.9 31.8 359.3 6%0.90 1.00 - 4.1 39.2 6.5 58.9 12.9 29.0 150.6 3%0.90 0.75 - - - - 635.1 591.1 449.5 1,675.7 30%0.90 0.75 - - 53.2 3.7 32.3 1,509.0 70.0 1,668.2 29%0.90 1.00 - 5.7 15.0 29.9 58.5 7.4 96.2 212.6 4%0.90 1.00 - - 2.8 - 3.9 15.3 16.7 38.6 1%0.90 1.00 - - - - - - - - 0%
- 19.0 125.8 127.0 942.2 2,260.4 721.9 4,196.3 74%
0.90 1.00 - - - - - - - - - 19.0 125.8 127.0 942.2 2,260.4 721.9 4,196.3 74%
35.9 260.3 352.9 365.6 1,191.6 2,510.7 945.5 5,662.5 100%
- - - - - - - N/A- - - - - - - N/A- - - - - - - N/A- - - - - - - N/A
Cost Benefit Analysis (CBA) Study Estimate Jan 2005.
TotalsConversion Factors

Table AN12.12.6 GVT - Rajasthan - Banswara: Village Gara: VOD Household Assumptions.
Without \ With Project UnitsYear 1 Year 2 Year 3(Rs) (Rs) (Rs)
Development Activity:Village Organisation and Development
Before / Without Project Situation:
A. Self Help Groups (SHGs)Assumption Sum Zero Zero Zero - - -
B. Drudgery ReductionAssumption Sum Zero Zero Zero
Total Without Project Benefits - - -
After / With Project Situation:
A. Self Help Groups (SHGs)Assumptions
Average Household Savings Rs 2,121.7 Households (HHs) No 120 Present Group Deposits Rs'000 254.6 Annual Savings Increase % 3% 254.6 262.2 270.1 Deposits on Loan to Members % 35%SHG Interest Income % / Year 18%Assumed Benefit Rs'000 16.0 16.5 17.0
B. Drudgery ReductionAssumptions
Hours Saved / Day / Household No 1.0 Number of Days / Year / Household No 200 Days / Year / Household (8hrs/day) No 25.0 Households / Village No 120 Day Equivalent / Village No 3,000 Economic Value per Day (Rs/day) 25 Assumed Benefit Rs'000 75.0 75.0 75.0
Total With Project Benefits Rs'000 91.0 91.5 92.0
Incremental Benefits Rs'000 91.0 91.5 92.0
Source: Cost Benefit Analysis (CBA) Study Estimate Jan 2005.VOD = Village Organisation and Development.Households per village: Gara 120
Assumptions Benefits

Table AN12.12.6
Without \ With Project
Development Activity:Village Organisation and Development
Before / Without Project Situation:
A. Self Help Groups (SHGs)Assumption
B. Drudgery ReductionAssumption
Total Without Project Benefits
After / With Project Situation:
A. Self Help Groups (SHGs)Assumptions
Average Household SavingsHouseholds (HHs)Present Group DepositsAnnual Savings IncreaseDeposits on Loan to MembersSHG Interest Income Assumed Benefit
B. Drudgery ReductionAssumptions
Hours Saved / Day / HouseholdNumber of Days / Year / HouseholdDays / Year / Household (8hrs/day)Households / VillageDay Equivalent / VillageEconomic Value per DayAssumed Benefit
Total With Project Benefits
Incremental Benefits
Source:VOD = Village Organisation and Development.Households per village: Gara
GVT - Rajasthan - Banswara: Village Gara: Incremental VOD Benefit Stream (Rs'000).
Year 1 Year 2 Year 3 Year 4 Year 5 Year 6 Year 7 Year 8 Year 9 Year 101999/00 2000/01 2001/02 2002/03 2003/04 2004/05 2005/06 2006/07 2007/08 2008/09
- - - - - - - - - -
- - - 254.6 262.2 270.1 278.2 286.6 295.2 304.0
- - - 16.0 16.5 17.0 17.5 18.1 18.6 19.2
- - - 75.0 75.0 75.0 75.0 75.0 75.0 75.0
- - - 91.0 91.5 92.0 92.5 93.1 93.6 94.2
- - - 91.0 91.5 92.0 92.5 93.1 93.6 94.2
Cost Benefit Analysis (CBA) Study Estimate Jan 2005.
Benefit Streams (Rs '000)

Table AN12.12.7 GVT - Rajasthan - Banswara: Village Gara: Household Crop Net Margin Assumptions.
Without \ With Project UnitsYear 1 Year 2 Year 3(Rs) (Rs) (Rs)
Development Activity:Crop Technology, SWC and WRD
Before / Without Project Situation:Assumptions
Households (HHs) No 120 Crop Adoption Assumptions 100% 100% 100%
Kharif Crop Net Margin Rs/HH 1,650.8 1,650.8 1,650.8
Rabi Crop Net Margin Rs/HH 313.8 313.8 313.8 Total Without Project Benefits Rs/HH 1,964.6 1,964.6 1,964.6
After / With Project Situation:Assumptions
Households (HHs) No 120 Crop Adoption Assumptions 100% 100% 100%
Kharif Crop Net Margin Rs/HH 5,744.0 5,744.0 5,744.0
Rabi Crop Net Margin Rs/HH 1,622.0 1,622.0 1,622.0 Total With Project Benefits Rs/HH 7,366.0 7,366.0 7,366.0
Incremental Benefits Rs/HH 5,401.4 5,401.4 5,401.4
Source: Cost Benefit Analysis (CBA) Study Estimate Jan 2005.
Assumptions Benefits

Table AN12.12.7
Without \ With Project
Development Activity:Crop Technology, SWC and WRD
Before / Without Project Situation:Assumptions
Households (HHs)Crop Adoption Assumptions
Kharif Crop Net Margin
Rabi Crop Net MarginTotal Without Project Benefits
After / With Project Situation:Assumptions
Households (HHs)Crop Adoption Assumptions
Kharif Crop Net Margin
Rabi Crop Net MarginTotal With Project Benefits
Incremental Benefits
Source:
GVT - Rajasthan - Banswara: Village Gara: Incremental Crop Benefit Stream (Rs'000).
Year 1 Year 2 Year 3 Year 4 Year 5 Year 6 Year 7 Year 8 Year 9 Year 101999/00 2000/01 2001/02 2002/03 2003/04 2004/05 2005/06 2006/07 2007/08 2008/09
- - - 198.1 198.1 198.1 198.1 198.1 198.1 198.1
- - - 37.7 37.7 37.7 37.7 37.7 37.7 37.7 - - - 235.7 235.7 235.7 235.7 235.7 235.7 235.7
- - - 689.3 689.3 689.3 689.3 689.3 689.3 689.3
- - - 194.6 194.6 194.6 194.6 194.6 194.6 194.6 - - - 883.9 883.9 883.9 883.9 883.9 883.9 883.9
- - - 648.2 648.2 648.2 648.2 648.2 648.2 648.2
Cost Benefit Analysis (CBA) Study Estimate Jan 2005.
Benefit Streams (Rs '000)

Table AN12.12.8 GVT - Rajasthan - Banswara: Village Gara: Household Livestock Net Margin Assumptions.
Without \ With Project UnitsLivestock Year 1 Year 2 Year 3
(Rs) (Rs) (Rs)
Development Activity:Livestock
Before / Without Project Situation:Assumptions
Households (HHs) No 120 Annual Livestock Net Margin Rs/HH
Total Without Project Benefits 1,263.6 1,263.6 1,263.6
After / With Project Situation:
Development Activity:Assumptions
Households (HHs) No 120 Adoption Assumptions Percent 55% 78% 100%
Annual Livestock Net Margin Rs/HHTotal With Project Benefits 1,732.0 2,440.5 3,149.1
Incremental Benefits Rs/HH 468.4 1,176.9 1,885.4
Source: Cost Benefit Analysis (CBA) Study Estimate Jan 2005.
Assumptions Benefits

Table AN12.12.8
Without \ With ProjectLivestock
Development Activity:Livestock
Before / Without Project Situation:Assumptions
Households (HHs)Annual Livestock Net Margin
Total Without Project Benefits
After / With Project Situation:
Development Activity:Assumptions
Households (HHs)Adoption Assumptions
Annual Livestock Net MarginTotal With Project Benefits
Incremental Benefits
Source:
GVT - Rajasthan - Banswara: Village Gara: Incremental Livestock Benefit Stream (Rs'000).
Year 1 Year 2 Year 3 Year 4 Year 5 Year 6 Year 7 Year 8 Year 9 Year 101999/00 2000/01 2001/02 2002/03 2003/04 2004/05 2005/06 2006/07 2007/08 2008/09
- - - 151.6 151.6 151.6 151.6 151.6 151.6 151.6
- - - 207.8 292.9 377.9 377.9 377.9 377.9 377.9
- - - 56.2 141.2 226.3 226.3 226.3 226.3 226.3
Cost Benefit Analysis (CBA) Study Estimate Jan 2005.
Benefit Streams (Rs '000)

Table AN12.12.9 GVT - Rajasthan - Banswara: Village Gara: Forestry Benefit Assumptions.
Without \ With Project UnitsForestry Year 1 Year 2 Year 3
(Rs) (Rs) (Rs)
Development Activity:Forestry
Before / Without Project Situation:AssumptionsHouseholds (HHs) No 120 Annual Forestry Net Margin Rs/HH
Total Without Project Benefits - - -
After / With Project Situation:AssumptionsHouseholds (HHs) No 120 Adoption Assumptions Percent 55% 78% 100%Annual Forestry Net Margin Rs/HH
Total With Project Benefits 49.5 70.2 90.0
Incremental Benefits Rs/HH 49.5 70.2 90.0
Source: Cost Benefit Analysis (CBA) Study Estimate Jan 2005.
Assumptions Benefits

Table AN12.12.9
Without \ With ProjectForestry
Development Activity:Forestry
Before / Without Project Situation:AssumptionsHouseholds (HHs)Annual Forestry Net Margin
Total Without Project Benefits
After / With Project Situation:AssumptionsHouseholds (HHs)Adoption AssumptionsAnnual Forestry Net Margin
Total With Project Benefits
Incremental Benefits
Source:
GVT - Rajasthan - Banswara: Village Gara: Incremental Forestry Benefit Stream (Rs'000).
Year 1 Year 2 Year 3 Year 4 Year 5 Year 6 Year 7 Year 8 Year 9 Year 101999/00 2000/01 2001/02 2002/03 2003/04 2004/05 2005/06 2006/07 2007/08 2008/09
- - - - - - - - - -
- - - 5.9 8.4 10.8 10.8 10.8 10.8 10.8
- - - 5.9 8.4 10.8 10.8 10.8 10.8 10.8
Cost Benefit Analysis (CBA) Study Estimate Jan 2005.
Benefit Streams (Rs '000)

Table AN12.12.10 GVT - Rajasthan - Banswara: Village Gara: Migration Support Benefit Assumptions.
Without \ With ProjectYear 1 Year 2 Year 3(Rs) (Rs) (Rs)
Development Activity:Migration Support
Before / Without Project Situation:Assumptions
Economic Value per Day Rs/day 25.0 Days / Month / Household No 18 Economic Value per Month Rs/month 450.0 Months Migration / Year Months 4.0 Economic Value per Household Rs/HH 1,800.0 Households per Village No - Households per Village Migrating Percent 45%
Total Without Project Benefits Rs/Village - - -
After / With Project Situation:Assumptions
Economic Value per Day \1 Rs/day 25.0 25% 31.3 Days / Month / Household No 18 30% 24.0 Economic Value per Month Rs/month 450.0 750.0 Months Migration / Year Months 4.0 -25% 3.0 Economic Value per Household Rs/HH 1,800.0 2,250.0 Households per Village No - - Households per Village Migrating Percent 45% -10% 41%
Subtotal Migration Benefits Rs/Village - - -
Other Income Sum (Rs'000) - - - - - -
Total With Project Benefits Rs/Village - - -
Incremental Benefits Rs/Village - - -
Source: Cost Benefit Analysis (CBA) Study Estimate Jan 2005.
1\ Financial Wages (Rs/day):Skill Labour - Rs 160
Casual Labour :Male - Rs 40Female - Rs 30
Assumptions Benefits

Table AN12.12.10
Without \ With Project
Development Activity:Migration Support
Before / Without Project Situation:Assumptions
Economic Value per Day Days / Month / Household Economic Value per Month Months Migration / Year Economic Value per Household Households per Village Households per Village Migrating
Total Without Project Benefits
After / With Project Situation:Assumptions
Economic Value per Day \1Days / Month / Household Economic Value per Month Months Migration / Year Economic Value per Household Households per Village Households per Village Migrating
Subtotal Migration Benefits
Other Income
Total With Project Benefits
Incremental Benefits
Source:
1\ Financial Wages (Rs/day):Skill Labour - Rs 160
Casual Labour :Male - Rs 40Female - Rs 30
GVT - Rajasthan - Banswara: Village Gara: Incremental Migration Support Benefit Stream (Rs'000).
Year 1 Year 2 Year 3 Year 4 Year 5 Year 6 Year 7 Year 8 Year 9 Year 101999/00 2000/01 2001/02 2002/03 2003/04 2004/05 2005/06 2006/07 2007/08 2008/09
- - - - - - - - - -
- - - - - - - - - -
- - - - - - - - - -
- - - - - - - - - -
- - - - - - - - - -
Cost Benefit Analysis (CBA) Study Estimate Jan 2005.
Benefit Streams (Rs '000)
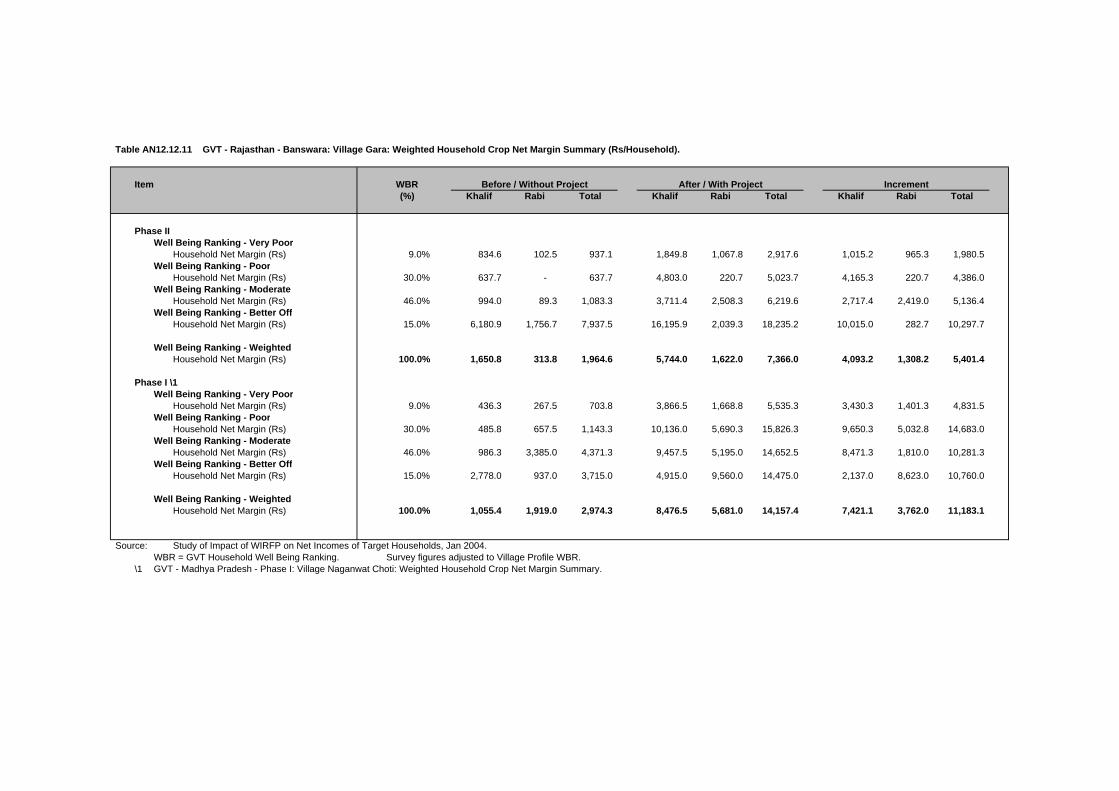
Table AN12.12.11 GVT - Rajasthan - Banswara: Village Gara: Weighted Household Crop Net Margin Summary (Rs/Household).
Item WBR(%) Khalif Rabi Total Khalif Rabi Total Khalif Rabi Total
Phase IIWell Being Ranking - Very Poor
Household Net Margin (Rs) 9.0% 834.6 102.5 937.1 1,849.8 1,067.8 2,917.6 1,015.2 965.3 1,980.5 Well Being Ranking - Poor
Household Net Margin (Rs) 30.0% 637.7 - 637.7 4,803.0 220.7 5,023.7 4,165.3 220.7 4,386.0 Well Being Ranking - Moderate
Household Net Margin (Rs) 46.0% 994.0 89.3 1,083.3 3,711.4 2,508.3 6,219.6 2,717.4 2,419.0 5,136.4 Well Being Ranking - Better Off
Household Net Margin (Rs) 15.0% 6,180.9 1,756.7 7,937.5 16,195.9 2,039.3 18,235.2 10,015.0 282.7 10,297.7
Well Being Ranking - WeightedHousehold Net Margin (Rs) 100.0% 1,650.8 313.8 1,964.6 5,744.0 1,622.0 7,366.0 4,093.2 1,308.2 5,401.4
Phase I \1Well Being Ranking - Very Poor
Household Net Margin (Rs) 9.0% 436.3 267.5 703.8 3,866.5 1,668.8 5,535.3 3,430.3 1,401.3 4,831.5 Well Being Ranking - Poor
Household Net Margin (Rs) 30.0% 485.8 657.5 1,143.3 10,136.0 5,690.3 15,826.3 9,650.3 5,032.8 14,683.0 Well Being Ranking - Moderate
Household Net Margin (Rs) 46.0% 986.3 3,385.0 4,371.3 9,457.5 5,195.0 14,652.5 8,471.3 1,810.0 10,281.3 Well Being Ranking - Better Off
Household Net Margin (Rs) 15.0% 2,778.0 937.0 3,715.0 4,915.0 9,560.0 14,475.0 2,137.0 8,623.0 10,760.0
Well Being Ranking - WeightedHousehold Net Margin (Rs) 100.0% 1,055.4 1,919.0 2,974.3 8,476.5 5,681.0 14,157.4 7,421.1 3,762.0 11,183.1
Source: Study of Impact of WIRFP on Net Incomes of Target Households, Jan 2004.WBR = GVT Household Well Being Ranking. Survey figures adjusted to Village Profile WBR.
\1 GVT - Madhya Pradesh - Phase I: Village Naganwat Choti: Weighted Household Crop Net Margin Summary.
Before / Without Project After / With Project Increment

Table AN12.12.12 GVT - Rajasthan - Banswara: Village Gara: Household Crop Net Margin Sensitivity Analysis.
Item EIRRKhalif Rabi Total Khalif Rabi Total Khalif Rabi Total
Development Activity:Crop Technology, SWC and WRD
Weighted Net Margin (Phase II)Household Net Margin (Rs) 1,650.8 313.8 1,964.6 5,744.0 1,622.0 7,366.0 4,093.2 1,308.2 5,401.4 Incremental Benefit (Phase II / Phase I) 48%
Base Case AssumptionsHousehold Net Margin (Rs) 1,650.8 313.8 1,964.6 5,744.0 1,622.0 7,366.0 4,093.2 1,308.2 5,401.4 Incremental Benefit (Phase II / Phase I) 48%Sensitivity Increase (%) 0%Development Activity 8%Overall Village 4%
Sensitivity AssumptionsHousehold Net Margin (Rs) 1,650.8 313.8 1,964.6 6,720.5 1,897.7 8,618.2 5,069.7 1,584.0 6,653.6 Incremental Benefit (Phase II / Phase I) 59%Sensitivity Increase (%) 0%Development Activity 46%Overall Village 12%
Weighted Net Margin (Phase I)Household Net Margin (Rs) 1,055.4 1,919.0 2,974.3 8,476.5 5,681.0 14,157.4 7,421.1 3,762.0 11,183.1
Source: Cost Benefit Analysis (CBA) Study Estimate Jan 2005.EIRR = Economic Internal Rate of Return (rate at which NPV equal to zero).
Before / Without Project After / With Project Increment

Table AN12.12.13 GVT - Rajasthan - Banswara: Village Gara: Weighted Household Livestock Net Margin Summary (Rs/Household).
Well Being Ranking Weight(%) Herd Value Net Margin Herd Value Net Margin Herd Value Net Margin
Phase I - Well Being Ranking (WBR) \1Madhya Pradesh - WBR Weighted DataVery Poor 16.0%
Average 580 (185.0) 5,650 412.5 474 597.5 Poor 63.0%
Average 2,350 982.5 8,250 2,141.0 1,180 1,158.5 Moderate 18.0%
Average 14,700 6,730.0 1,900 2,820.0 1,900 (3,910.0)Better Off 3.0%
Average 15,580 3,000.0 14,600 10,790.0 (196) 7,790.0
Phase I - WBR Weighted Data 100.0% 4,687 1,890.8 6,882 2,246.1 1,155 355.4
Phase II - Well Being Ranking (WBR)
Very Poor 16.0%Average 5,756 149.2 10,970 1,446.4 1,043 1,297.2
Poor 63.0%Average 13,128 852.2 25,979 3,008.8 2,570 2,156.8
Moderate 18.0%Average 13,525 4,035.1 27,020 5,249.5 2,699 1,214.4
Better Off 3.0%Average 12,700 (781.7) 41,873 2,573.3 5,835 3,355.0
Phase II - WBR Weighted Data 100.0% 12,007 1,263.6 24,242 3,149.1 2,447 1,885.6
Source: Study of Impact of WIRFP on Net Incomes of Target Households, Jan 2004.WBR = GVT Household Well Being Ranking. Survey figures adjusted to Village Profile WBR.
\1 GVT - Madhya Pradesh - Phase I: Village Naganwat Choti: Weighted Household Livestock Net Margin Summary.
Before / Without Project After / With Project Increment \1

WIRFP - Phase II - Cost Benefit Analysis Study
Tables AN12.0 Individual Village Cost Benefit Analysis
Tables AN12.13 GVT - Rajasthan - Banswara: Village Merana.
Table AN12.13.1 GVT - Rajasthan - Banswara: Village Merana: Village Profile.
Table AN12.13.2 GVT - Rajasthan - Banswara: Village Merana: Cost Benefit Analysis Summary (Rs'000).Table AN12.13.3 GVT - Rajasthan - Banswara: Village Merana: Cost Benefit Analysis Development Activity Summary A (Rs'000).Table AN12.13.4 GVT - Rajasthan - Banswara: Village Merana: Cost Benefit Analysis Development Activity Summary B (Rs'000).
Table AN12.13.5 GVT - Rajasthan - Banswara: Village Merana: Costs - Financial (Rs'000).GVT - Rajasthan - Banswara: Village Merana: Costs - Economic (Rs'000).
Table AN12.13.6 GVT - Rajasthan - Banswara: Village Merana: VOD Household Assumptions.GVT - Rajasthan - Banswara: Village Merana: Incremental VOD Benefit Stream (Rs'000).
Table AN12.13.7 GVT - Rajasthan - Banswara: Village Merana: Household Crop Net Margin Assumptions.GVT - Rajasthan - Banswara: Village Merana: Incremental Crop Benefit Stream (Rs'000).
Table AN12.13.8 GVT - Rajasthan - Banswara: Village Merana: Household Livestock Net Margin Assumptions.GVT - Rajasthan - Banswara: Village Merana: Incremental Livestock Benefit Stream (Rs'000).
Table AN12.13.9 GVT - Rajasthan - Banswara: Village Merana: Forestry Benefit Assumptions.GVT - Rajasthan - Banswara: Village Merana: Incremental Forestry Benefit Stream (Rs'000).
Table AN12.13.10 GVT - Rajasthan - Banswara: Village Merana: Migration Support Benefit Assumptions.GVT - Rajasthan - Banswara: Village Merana: Incremental Migration Support Benefit Stream (Rs'000).
Table AN12.13.11 GVT - Rajasthan - Banswara: Village Merana: Weighted Household Crop Net Margin Summary (Rs/Household).Table AN12.13.12 GVT - Rajasthan - Banswara: Village Merana: Household Crop Net Margin Sensitivity Analysis.
Table AN12.13.13 GVT - Rajasthan - Banswara: Village Merana: Weighted Household Livestock Net Margin Summary (Rs/Household).
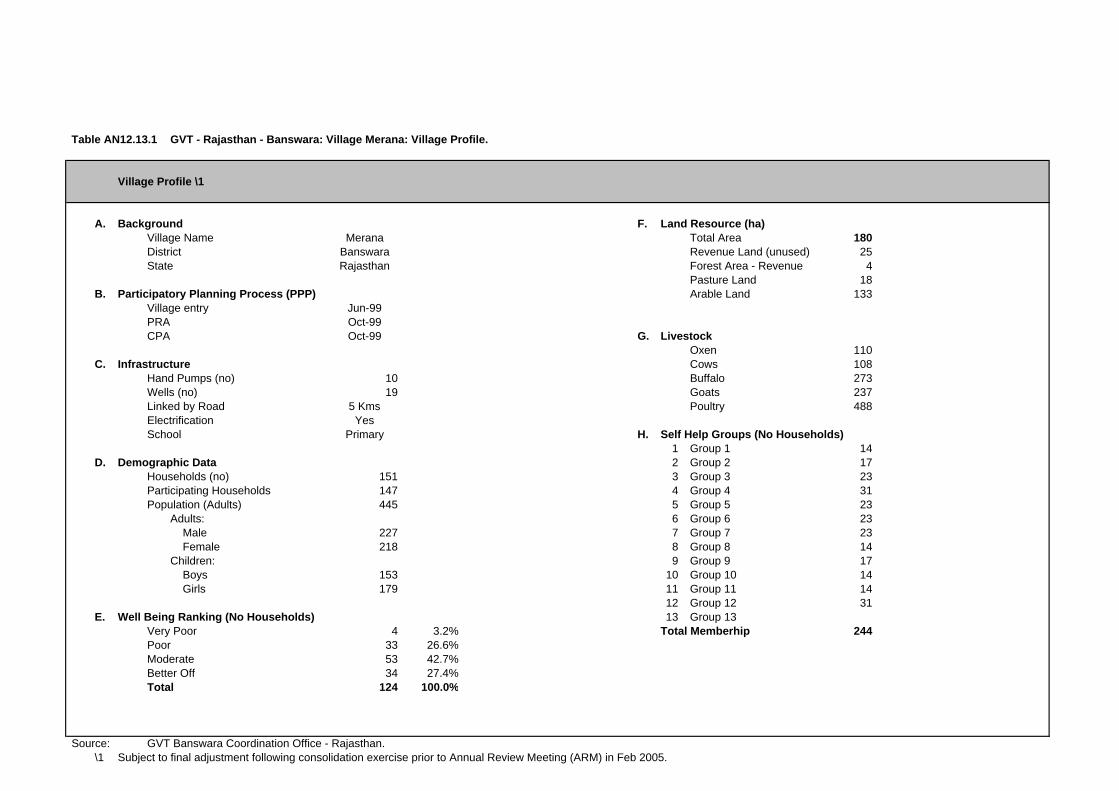
Table AN12.13.1 GVT - Rajasthan - Banswara: Village Merana: Village Profile.
Village Profile \1
A. Background F. Land Resource (ha)Village Name Merana Total Area 180 District Banswara Revenue Land (unused) 25 State Rajasthan Forest Area - Revenue 4
Pasture Land 18 B. Participatory Planning Process (PPP) Arable Land 133
Village entry Jun-99PRA Oct-99CPA Oct-99 G. Livestock
Oxen 110 C. Infrastructure Cows 108
Hand Pumps (no) 10 Buffalo 273 Wells (no) 19 Goats 237 Linked by Road 5 Kms Poultry 488 Electrification YesSchool Primary H. Self Help Groups (No Households)
1 Group 1 14 D. Demographic Data 2 Group 2 17
Households (no) 151 3 Group 3 23 Participating Households 147 4 Group 4 31 Population (Adults) 445 5 Group 5 23
Adults: 6 Group 6 23 Male 227 7 Group 7 23 Female 218 8 Group 8 14 Children: 9 Group 9 17 Boys 153 10 Group 10 14 Girls 179 11 Group 11 14
12 Group 12 31 E. Well Being Ranking (No Households) 13 Group 13
Very Poor 4 3.2% Total Memberhip 244 Poor 33 26.6%Moderate 53 42.7%Better Off 34 27.4%Total 124 100.0%
Source: GVT Banswara Coordination Office - Rajasthan.\1 Subject to final adjustment following consolidation exercise prior to Annual Review Meeting (ARM) in Feb 2005.
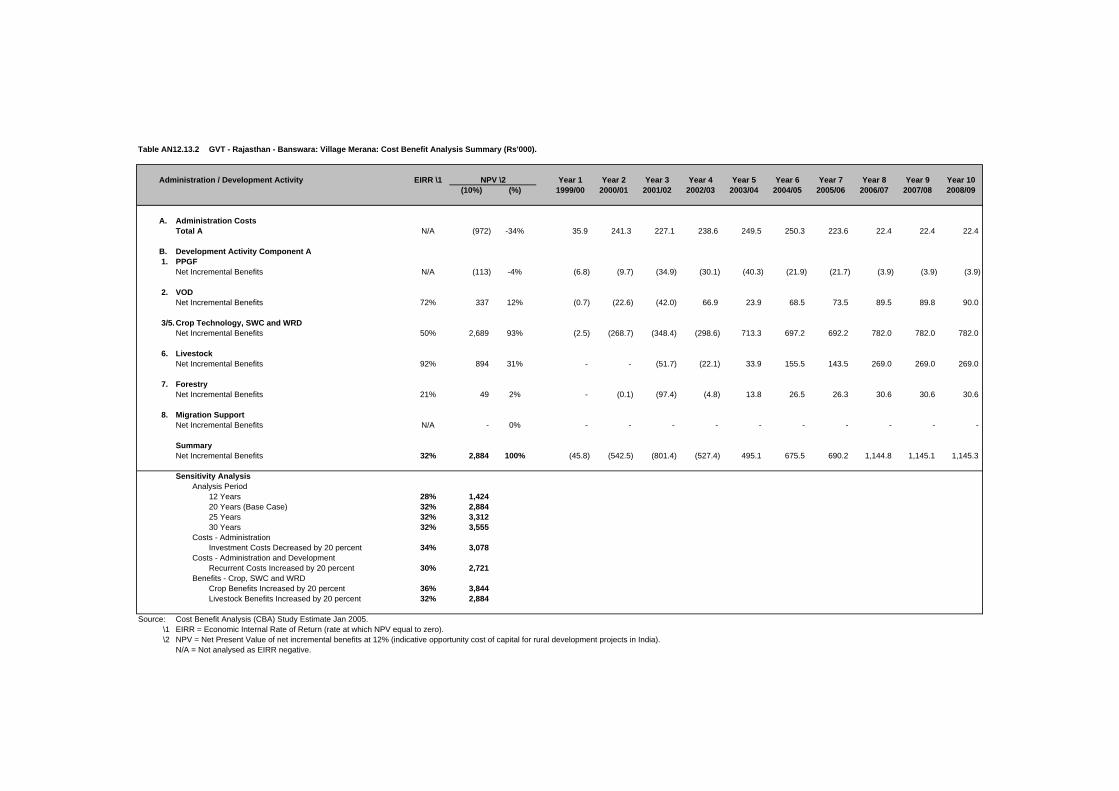
Table AN12.13.2 GVT - Rajasthan - Banswara: Village Merana: Cost Benefit Analysis Summary (Rs'000).
Administration / Development Activity EIRR \1 Year 1 Year 2 Year 3 Year 4 Year 5 Year 6 Year 7 Year 8 Year 9 Year 10(10%) (%) 1999/00 2000/01 2001/02 2002/03 2003/04 2004/05 2005/06 2006/07 2007/08 2008/09
A. Administration CostsTotal A N/A (972) -34% 35.9 241.3 227.1 238.6 249.5 250.3 223.6 22.4 22.4 22.4
B. Development Activity Component A 1. PPGF
Net Incremental Benefits N/A (113) -4% (6.8) (9.7) (34.9) (30.1) (40.3) (21.9) (21.7) (3.9) (3.9) (3.9)
2. VODNet Incremental Benefits 72% 337 12% (0.7) (22.6) (42.0) 66.9 23.9 68.5 73.5 89.5 89.8 90.0
3/5.Crop Technology, SWC and WRDNet Incremental Benefits 50% 2,689 93% (2.5) (268.7) (348.4) (298.6) 713.3 697.2 692.2 782.0 782.0 782.0
6. LivestockNet Incremental Benefits 92% 894 31% - - (51.7) (22.1) 33.9 155.5 143.5 269.0 269.0 269.0
7. ForestryNet Incremental Benefits 21% 49 2% - (0.1) (97.4) (4.8) 13.8 26.5 26.3 30.6 30.6 30.6
8. Migration SupportNet Incremental Benefits N/A - 0% - - - - - - - - - -
SummaryNet Incremental Benefits 32% 2,884 100% (45.8) (542.5) (801.4) (527.4) 495.1 675.5 690.2 1,144.8 1,145.1 1,145.3
Sensitivity AnalysisAnalysis Period
12 Years 28% 1,424 20 Years (Base Case) 32% 2,884 25 Years 32% 3,312 30 Years 32% 3,555
Costs - AdministrationInvestment Costs Decreased by 20 percent 34% 3,078
Costs - Administration and DevelopmentRecurrent Costs Increased by 20 percent 30% 2,721
Benefits - Crop, SWC and WRDCrop Benefits Increased by 20 percent 36% 3,844 Livestock Benefits Increased by 20 percent 32% 2,884
Source: Cost Benefit Analysis (CBA) Study Estimate Jan 2005.\1 EIRR = Economic Internal Rate of Return (rate at which NPV equal to zero).\2 NPV = Net Present Value of net incremental benefits at 12% (indicative opportunity cost of capital for rural development projects in India).
N/A = Not analysed as EIRR negative.
NPV \2

Table AN12.13.3 GVT - Rajasthan - Banswara: Village Merana: Cost Benefit Analysis Development Activity Summary A (Rs'000).
Administration / Development Activity EIRR \1 Year 1 Year 2 Year 3 Year 4 Year 5 Year 6 Year 7 Year 8 Year 9 Year 10(10%) (%) 1999/00 2000/01 2001/02 2002/03 2003/04 2004/05 2005/06 2006/07 2007/08 2008/09
A. Administration CostsInvestment 35.9 241.3 227.1 238.6 249.5 250.3 223.6 - - - Recurrent - - - - - - - 22.4 22.4 22.4
Total A N/A (972) -34% 35.9 241.3 227.1 238.6 249.5 250.3 223.6 22.4 22.4 22.4
B. Development Intervention Component A 1. PPGF
Cost StreamInvestment 6.8 9.5 34.5 28.8 38.3 18.9 18.3 - - - Recurrent - 0.2 0.4 1.3 2.0 2.9 3.4 3.9 3.9 3.9 Total Costs 6.8 9.7 34.9 30.1 40.3 21.9 21.7 3.9 3.9 3.9
Benefit StreamBefore / Without Project - - - - - - - - - - After / With Project - - - - - - - - - - Incremental Benefits - - - - - - - - - -
Net Incremental Benefits N/A (113) -4% (6.8) (9.7) (34.9) (30.1) (40.3) (21.9) (21.7) (3.9) (3.9) (3.9)
2. VODCost Stream
Investment 0.7 22.6 40.8 28.7 70.5 22.6 16.7 - - - Recurrent - 0.0 1.2 3.2 4.6 8.2 9.3 10.1 10.1 10.1 Total Costs 0.7 22.6 42.0 31.9 75.1 30.7 25.9 10.1 10.1 10.1
Benefit StreamBefore / Without Project - - - - - - - - - - After / With Project - - - 98.8 99.0 99.2 99.4 99.7 99.9 100.1 Incremental Benefits - - - 98.8 99.0 99.2 99.4 99.7 99.9 100.1
Net Incremental Benefits 72% 337 12% (0.7) (22.6) (42.0) 66.9 23.9 68.5 73.5 89.5 89.8 90.0
3/5.Crop Technology, SWC and WRDCost Stream
InvestmentCrop Tecnology 2.5 16.3 8.6 29.1 58.3 15.8 23.1 - - - Soil Water Conservation - 242.9 242.9 170.0 - - - - - - Water Resource Development - 9.5 64.6 27.0 46.0 96.3 79.1 - - -
RecurrentCrop Tecnology - 0.1 0.5 0.7 1.4 2.9 3.3 3.8 3.8 3.8 Soil Water Conservation - - 30.4 60.7 82.0 82.0 82.0 82.0 82.0 82.0 Water Resource Development - 1.4 11.1 15.2 22.1 36.5 48.4 48.4 48.4
Total Costs 2.5 268.7 348.4 298.6 202.9 219.0 224.0 134.2 134.2 134.2 Benefit Stream
Before / Without Project - - - - 413.0 413.0 413.0 413.0 413.0 413.0 After / With Project - - - - 1,329.2 1,329.2 1,329.2 1,329.2 1,329.2 1,329.2 Incremental Benefits - - - - 916.2 916.2 916.2 916.2 916.2 916.2
Net Incremental Benefits 50% 2,689 93% (2.5) (268.7) (348.4) (298.6) 713.3 697.2 692.2 782.0 782.0 782.0
Source: Cost Benefit Analysis (CBA) Study Estimate Jan 2005.\1 EIRR = Economic Internal Rate of Return (rate at which NPV equal to zero).\2 NPV = Net Present Value of net incremental benefits at 12% (indicative opportunity cost of capital for rural development projects in India).
N/A = Not analysed as EIRR negative.
NPV \2

Table AN12.13.4 GVT - Rajasthan - Banswara: Village Merana: Cost Benefit Analysis Development Activity Summary B (Rs'000).
Administration / Development Activity EIRR \1 Year 1 Year 2 Year 3 Year 4 Year 5 Year 6 Year 7 Year 8 Year 9 Year 10(10%) (%) 1999/00 2000/01 2001/02 2002/03 2003/04 2004/05 2005/06 2006/07 2007/08 2008/09
6. LivestockCost Stream
Investment - - 50.8 14.7 5.3 5.1 133.4 - - - Recurrent - 1.0 7.4 10.1 14.7 24.3 32.3 32.3 32.3 Total Costs - - 51.7 22.1 15.4 19.8 157.7 32.3 32.3 32.3
Benefit StreamBefore / Without Project - - - - 258.5 258.5 258.5 258.5 258.5 258.5 After / With Project - - - - 307.9 433.8 559.8 559.8 559.8 559.8 Incremental Benefits - - - - 49.3 175.3 301.2 301.2 301.2 301.2
Net Incremental Benefits 92% 894 31% - - (51.7) (22.1) 33.9 155.5 143.5 269.0 269.0 269.0
7. ForestryCost Stream
Investment - 0.1 97.3 19.4 8.9 5.0 4.7 - - - Recurrent - 0.0 9.7 11.7 12.6 13.1 13.5 13.5 13.5 Total Costs - 0.1 97.4 29.1 20.6 17.6 17.8 13.5 13.5 13.5
Benefit StreamBefore / Without Project - - - - - - - - - - After / With Project - - - 24.3 34.4 44.1 44.1 44.1 44.1 44.1 Incremental Benefits - - - 24.3 34.4 44.1 44.1 44.1 44.1 44.1
Net Incremental Benefits 21% 49 2% - (0.1) (97.4) (4.8) 13.8 26.5 26.3 30.6 30.6 30.6
8. Migration SupportCost Stream
Investment - - - - - - - - - - Recurrent - - - - - - - - - Total Costs - - - - - - - - - -
Benefit StreamBefore / Without Project - - - - - - - - - - After / With Project - - - - - - - - - - Incremental Benefits - - - - - - - - - -
Net Incremental Benefits N/A - 0% - - - - - - - - - -
SummaryCost Stream
Investment 45.8 542.2 766.6 556.3 476.8 414.0 498.9 - - - Recurrent - 0.3 34.8 94.2 127.0 145.3 171.9 216.4 216.4 216.4 Total Costs 45.8 542.5 801.4 650.4 603.8 559.3 670.8 216.4 216.4 216.4
Benefit StreamBefore / Without Project - - - - 671.5 671.5 671.5 671.5 671.5 671.5 After / With Project - - - 123.1 1,770.4 1,906.3 2,032.5 2,032.7 2,032.9 2,033.2 Incremental Benefits - - - 123.1 1,099.0 1,234.8 1,361.0 1,361.2 1,361.4 1,361.7
Net Incremental Benefits 32% 2,884 100% (45.8) (542.5) (801.4) (527.4) 495.1 675.5 690.2 1,144.8 1,145.1 1,145.3 EIRR
Source: Cost Benefit Analysis (CBA) Study Estimate Jan 2005.
NPV \2

Table AN12.13.5 GVT - Rajasthan - Banswara: Village Merana: Costs - Financial (Rs'000).
Cost Head / Subhead 1999/00 2000/01 2001/02 2002/03 2003/04 2004/05 2005/06Actual Actual Actual Actual Actual Budget Budget (Rs'000) (%)
A. Administration CostsGVT Bhopal (PHQ) - 60.3 75.4 67.3 52.8 66.8 61.1 383.7 DFIDI Consultancy 35.9 71.4 26.9 63.2 47.4 54.7 39.2 338.6 Rajastan Coordination Office - 128.5 147.0 127.6 171.7 150.5 143.8 869.1
Total (A) 35.9 260.2 249.4 258.1 271.9 272.0 244.1 1,591.5 40%
B. Development CostsComponent A 1. PPGF 7.6 10.6 38.3 32.0 42.6 21.1 20.4 172.5 4% 2. VOD 0.7 25.1 45.4 31.9 78.3 25.1 18.5 225.0 6% 3. Crop Technology 2.8 18.1 9.6 32.4 64.8 17.5 25.7 170.8 4% 4. SWC - 359.8 359.8 251.8 - - - 971.4 24% 5. WRD - 14.1 95.7 40.0 68.1 142.7 117.3 477.9 12% 6. Livestock - - 56.4 16.3 5.9 5.7 148.2 232.5 6% 7. Forestry - 0.1 108.2 21.5 9.9 5.6 5.2 150.5 4%8. Migration Support - - - - - - - - 0%
Subtotal 11.1 427.8 713.4 425.9 269.7 217.6 335.2 2,400.7 60%
Other Development CostsSubtotal - - - - - - - -
Total B 11.1 427.8 713.4 425.9 269.7 217.6 335.2 2,400.7 60%
Total A + B 47.0 688.0 962.7 684.0 541.6 489.6 579.3 3,992.2 100%
GVT 10.6 608.3 890.9 600.4 459.2 388.3 489.2 3,447.1 86%DFIDI 35.9 71.4 26.9 63.2 47.4 54.7 39.2 338.6 8%Community 0.2 5.6 25.9 11.9 21.9 26.3 22.3 113.9 3%Government 0.3 2.7 19.0 8.5 13.1 20.3 28.6 92.6 2%
Source: GVT Banswara Coordination Office - Rajasthan.
DFIDI = Department for International Development (India).PPGF = Participatory Planning and Group Formation.VOD = Village Organisation and Development.SWC = Soil and Water Conservation.WRD = Water Resource Development.
Total

Table AN12.13.5
Cost Head / Subhead
A. Administration CostsGVT Bhopal (PHQ)DFIDI ConsultancyRajastan Coordination Office
Total (A)
B. Development CostsComponent A 1. PPGF 2. VOD 3. Crop Technology 4. SWC 5. WRD 6. Livestock 7. Forestry8. Migration Support
Subtotal
Other Development CostsSubtotal
Total B
Total A + B
GVTDFIDICommunityGovernment
Source:
DFIDI = Department for International Development (India).PPGF = Participatory Planning and Group Formation.VOD = Village Organisation and Development.SWC = Soil and Water Conservation.WRD = Water Resource Development.
GVT - Rajasthan - Banswara: Village Merana: Costs - Economic (Rs'000).
1999/00 2000/01 2001/02 2002/03 2003/04 2004/05 2005/06CF SCF Actual Actual Actual Actual Actual Budget Budget (Rs'000) (%)
0.90 1.00 - 54.2 67.9 60.6 47.5 60.1 55.0 345.4 10%1.00 1.00 35.9 71.4 26.9 63.2 47.4 54.7 39.2 338.6 10%0.90 1.00 - 115.7 132.3 114.8 154.5 135.5 129.4 782.2 24%
35.9 241.3 227.1 238.6 249.5 250.3 223.6 1,466.2 44%
0.90 1.00 6.8 9.5 34.5 28.8 38.3 18.9 18.3 155.2 5%0.90 1.00 0.7 22.6 40.8 28.7 70.5 22.6 16.7 202.5 6%0.90 1.00 2.5 16.3 8.6 29.1 58.3 15.8 23.1 153.8 5%0.90 0.75 - 242.9 242.9 170.0 - - - 655.7 20%0.90 0.75 - 9.5 64.6 27.0 46.0 96.3 79.1 322.6 10%0.90 1.00 - - 50.8 14.7 5.3 5.1 133.4 209.3 6%0.90 1.00 - 0.1 97.3 19.4 8.9 5.0 4.7 135.5 4%0.90 1.00 - - - - - - - - 0%
10.0 300.9 539.5 317.7 227.4 163.8 275.3 1,834.5 56%
0.90 1.00 - - - - - - - - 0%10.0 300.9 539.5 317.7 227.4 163.8 275.3 1,834.5 56%
45.8 542.2 766.6 556.3 476.8 414.0 498.9 3,300.7 100%
- - - - - - - N/A- - - - - - - N/A- - - - - - - N/A- - - - - - - N/A
Cost Benefit Analysis (CBA) Study Estimate Jan 2005.
TotalsConversion Factors

Table AN12.13.6 GVT - Rajasthan - Banswara: Village Merana: VOD Household Assumptions.
Without \ With Project UnitsVillage Organisation and Development Year 1 Year 2 Year 3
(Rs) (Rs) (Rs)
Development Activity:Village Organisation and Development
Before / Without Project Situation:
A. Self Help Groups (SHGs)Assumption Sum Zero Zero Zero - - -
B. Drudgery ReductionAssumption Sum Zero Zero Zero
Total Without Project Benefits - - -
After / With Project Situation:
A. Self Help Groups (SHGs)Assumptions
Average Household Savings Rs 942.9 Households (HHs) No 147 Present Group Deposits Rs'000 138.6 Annual Savings Increase % 3% 138.6 142.8 147.0 Deposits to Loans to Members % 50%SHG Interest Income % / Year 10%Assumed Benefit Rs'000 6.9 7.1 7.4
B. Drudgery ReductionAssumptions
Hours Saved / Day / Household No 1.0 Number of Days / Year / Household No 200 Days / Year / Household (8hrs/day) No 25.0 Households / Village No 147 Day Equivalent / Village No 3,675 Economic Value per Day (Rs/day) 25 Assumed Benefit Rs'000 91.9 91.9 91.9
Total With Project Benefits Rs'000 98.8 99.0 99.2
Incremental Benefits Rs'000 98.8 99.0 99.2
Source: Cost Benefit Analysis (CBA) Study Estimate Jan 2005.VOD = Village Organisation and Development.Households per village: Merana 147
Assumptions Benefits

Table AN12.13.6
Without \ With ProjectVillage Organisation and Development
Development Activity:Village Organisation and Development
Before / Without Project Situation:
A. Self Help Groups (SHGs)Assumption
B. Drudgery ReductionAssumption
Total Without Project Benefits
After / With Project Situation:
A. Self Help Groups (SHGs)Assumptions
Average Household SavingsHouseholds (HHs)Present Group DepositsAnnual Savings IncreaseDeposits to Loans to MembersSHG Interest Income Assumed Benefit
B. Drudgery ReductionAssumptions
Hours Saved / Day / HouseholdNumber of Days / Year / HouseholdDays / Year / Household (8hrs/day)Households / VillageDay Equivalent / VillageEconomic Value per DayAssumed Benefit
Total With Project Benefits
Incremental Benefits
Source:VOD = Village Organisation and Development.Households per village: Merana
GVT - Rajasthan - Banswara: Village Merana: Incremental VOD Benefit Stream (Rs'000).
Year 1 Year 2 Year 3 Year 4 Year 5 Year 6 Year 7 Year 8 Year 9 Year 101999/00 2000/01 2001/02 2002/03 2003/04 2004/05 2005/06 2006/07 2007/08 2008/09
- - - - - - - - - -
- - - 138.6 142.8 147.0 151.5 156.0 160.7 165.5
- - - 6.9 7.1 7.4 7.6 7.8 8.0 8.3
- - - 91.9 91.9 91.9 91.9 91.9 91.9 91.9
- - - 98.8 99.0 99.2 99.4 99.7 99.9 100.1
- - - 98.8 99.0 99.2 99.4 99.7 99.9 100.1
Cost Benefit Analysis (CBA) Study Estimate Jan 2005.
Benefit Streams (Rs '000)

Table AN12.13.7 GVT - Rajasthan - Banswara: Village Merana: Household Crop Net Margin Assumptions.
Without \ With Project UnitsCrop Technology, SWC and WRD Year 1 Year 2 Year 3
(Rs) (Rs) (Rs)
Development Activity:Crop Technology, SWC and WRD
Before / Without Project Situation:Assumptions
Households (HHs) No 147 Crop Adoption Assumptions 100% 100% 100%
Kharif Crop Net Margin Rs/HH 2,293.5 2,293.5 2,293.5
Rabi Crop Net Margin Rs/HH 515.8 515.8 515.8 Total Without Project Benefits Rs/HH 2,809.2 2,809.2 2,809.2
After / With Project Situation:Assumptions
Households (HHs) No 147 Crop Adoption Assumptions 100% 100% 100%
Kharif Crop Net Margin Rs/HH 7,321.1 7,321.1 7,321.1
Rabi Crop Net Margin Rs/HH 1,720.8 1,720.8 1,720.8 Total With Project Benefits Rs/HH 9,041.8 9,041.8 9,041.8
Incremental Benefits Rs/HH 6,232.6 6,232.6 6,232.6
Source: Cost Benefit Analysis (CBA) Study Estimate Jan 2005.
BenefitsAssumptions

Table AN12.13.7
Without \ With ProjectCrop Technology, SWC and WRD
Development Activity:Crop Technology, SWC and WRD
Before / Without Project Situation:Assumptions
Households (HHs)Crop Adoption Assumptions
Kharif Crop Net Margin
Rabi Crop Net MarginTotal Without Project Benefits
After / With Project Situation:Assumptions
Households (HHs)Crop Adoption Assumptions
Kharif Crop Net Margin
Rabi Crop Net MarginTotal With Project Benefits
Incremental Benefits
Source:
GVT - Rajasthan - Banswara: Village Merana: Incremental Crop Benefit Stream (Rs'000).
Year 1 Year 2 Year 3 Year 4 Year 5 Year 6 Year 7 Year 8 Year 9 Year 101999/00 2000/01 2001/02 2002/03 2003/04 2004/05 2005/06 2006/07 2007/08 2008/09
- - - - 337.1 337.1 337.1 337.1 337.1 337.1
- - - - 75.8 75.8 75.8 75.8 75.8 75.8 - - - - 413.0 413.0 413.0 413.0 413.0 413.0
- - - - 1,076.2 1,076.2 1,076.2 1,076.2 1,076.2 1,076.2
- - - - 253.0 253.0 253.0 253.0 253.0 253.0 - - - - 1,329.2 1,329.2 1,329.2 1,329.2 1,329.2 1,329.2
- - - - 916.2 916.2 916.2 916.2 916.2 916.2
Cost Benefit Analysis (CBA) Study Estimate Jan 2005.
Benefit Streams (Rs '000)

Table AN12.13.8 GVT - Rajasthan - Banswara: Village Merana: Household Livestock Net Margin Assumptions.
Without \ With Project UnitsKharif \ Rabi Year 1 Year 2 Year 3
Livestock (Rs) (Rs) (Rs)
Development Activity:Livestock
Before / Without Project Situation:Assumptions
Households (HHs) No 147 Annual Livestock Net Margin Rs/HH
Total Without Project Benefits 1,758.6 1,758.6 1,758.6
After / With Project Situation:
Development Activity:Assumptions
Households (HHs) No 147 Adoption Assumptions Percent 55% 78% 100%
Annual Livestock Net Margin Rs/HHTotal With Project Benefits 2,094.3 2,951.1 3,807.9
Incremental Benefits Rs/HH 335.7 1,192.5 2,049.2
Source: Cost Benefit Analysis (CBA) Study Estimate Jan 2005.
BenefitsAssumptions

Table AN12.13.8
Without \ With ProjectKharif \ Rabi
Livestock
Development Activity:Livestock
Before / Without Project Situation:Assumptions
Households (HHs)Annual Livestock Net Margin
Total Without Project Benefits
After / With Project Situation:
Development Activity:Assumptions
Households (HHs)Adoption Assumptions
Annual Livestock Net MarginTotal With Project Benefits
Incremental Benefits
Source:
GVT - Rajasthan - Banswara: Village Merana: Incremental Livestock Benefit Stream (Rs'000).
Year 1 Year 2 Year 3 Year 4 Year 5 Year 6 Year 7 Year 8 Year 9 Year 101999/00 2000/01 2001/02 2002/03 2003/04 2004/05 2005/06 2006/07 2007/08 2008/09
- - - - 258.5 258.5 258.5 258.5 258.5 258.5
- - - - 307.9 433.8 559.8 559.8 559.8 559.8
- - - 49.3 175.3 301.2 301.2 301.2 301.2 301.2
Cost Benefit Analysis (CBA) Study Estimate Jan 2005.
Benefit Streams (Rs '000)
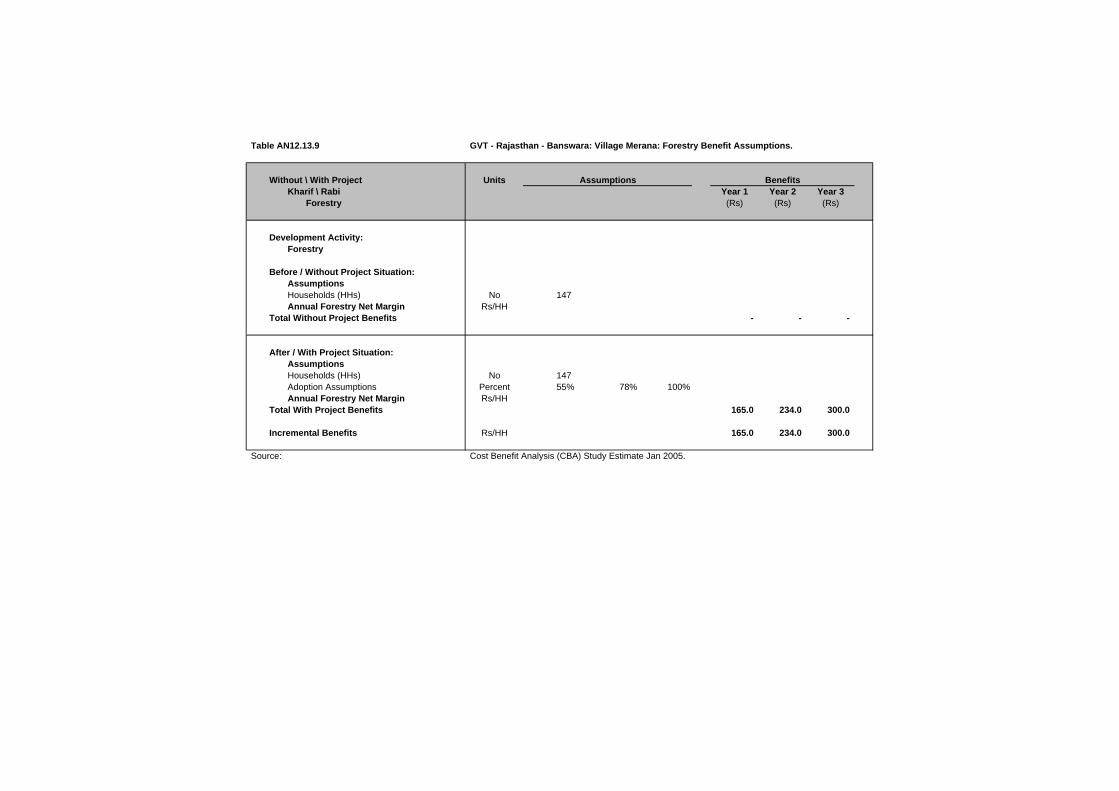
Table AN12.13.9 GVT - Rajasthan - Banswara: Village Merana: Forestry Benefit Assumptions.
Without \ With Project UnitsKharif \ Rabi Year 1 Year 2 Year 3
Forestry (Rs) (Rs) (Rs)
Development Activity:Forestry
Before / Without Project Situation:AssumptionsHouseholds (HHs) No 147 Annual Forestry Net Margin Rs/HH
Total Without Project Benefits - - -
After / With Project Situation:AssumptionsHouseholds (HHs) No 147 Adoption Assumptions Percent 55% 78% 100%Annual Forestry Net Margin Rs/HH
Total With Project Benefits 165.0 234.0 300.0
Incremental Benefits Rs/HH 165.0 234.0 300.0
Source: Cost Benefit Analysis (CBA) Study Estimate Jan 2005.
BenefitsAssumptions

Table AN12.13.9
Without \ With ProjectKharif \ Rabi
Forestry
Development Activity:Forestry
Before / Without Project Situation:AssumptionsHouseholds (HHs)Annual Forestry Net Margin
Total Without Project Benefits
After / With Project Situation:AssumptionsHouseholds (HHs)Adoption AssumptionsAnnual Forestry Net Margin
Total With Project Benefits
Incremental Benefits
Source:
GVT - Rajasthan - Banswara: Village Merana: Incremental Forestry Benefit Stream (Rs'000).
Year 1 Year 2 Year 3 Year 4 Year 5 Year 6 Year 7 Year 8 Year 9 Year 101999/00 2000/01 2001/02 2002/03 2003/04 2004/05 2005/06 2006/07 2007/08 2008/09
- - - - - - - - - -
- - - 24.3 34.4 44.1 44.1 44.1 44.1 44.1
- - - 24.3 34.4 44.1 44.1 44.1 44.1 44.1
Cost Benefit Analysis (CBA) Study Estimate Jan 2005.
Benefit Streams (Rs '000)

Table AN12.13.10 GVT - Rajasthan - Banswara: Village Merana: Migration Support Benefit Assumptions.
Without \ With ProjectYear 1 Year 2 Year 3(Rs) (Rs) (Rs)
Development Activity:Migration Support
Before / Without Project Situation:Assumptions
Economic Value per Day Rs/day 25.0 Days / Month / Household No 18 Economic Value per Month Rs/month 450.0 Months Migration / Year Months 4.0 Economic Value per Household Rs/HH 1,800.0 Households per Village No - Households per Village Migrating Percent 45%
Total Without Project Benefits Rs/Village - - -
After / With Project Situation:Assumptions
Economic Value per Day \1 Rs/day 25.0 25% 31.3 Days / Month / Household No 18 30% 24.0 Economic Value per Month Rs/month 450.0 750.0 Months Migration / Year Months 4.0 -25% 3.0 Economic Value per Household Rs/HH 1,800.0 2,250.0 Households per Village No - - Households per Village Migrating Percent 45% -10% 41%
Subtotal Migration Benefits Rs/Village - - -
Other Income Sum (Rs'000) - - - - - -
Total With Project Benefits Rs/Village - - -
Incremental Benefits Rs/Village - - -
Source: Cost Benefit Analysis (CBA) Study Estimate Jan 2005.
1\ Financial Wages (Rs/day):Skill Labour - Rs 160
Casual Labour :Male - Rs 40Female - Rs 30
BenefitsAssumptions

Table AN12.13.10
Without \ With Project
Development Activity:Migration Support
Before / Without Project Situation:Assumptions
Economic Value per Day Days / Month / Household Economic Value per Month Months Migration / Year Economic Value per Household Households per Village Households per Village Migrating
Total Without Project Benefits
After / With Project Situation:Assumptions
Economic Value per Day \1Days / Month / Household Economic Value per Month Months Migration / Year Economic Value per Household Households per Village Households per Village Migrating
Subtotal Migration Benefits
Other Income
Total With Project Benefits
Incremental Benefits
Source:
1\ Financial Wages (Rs/day):Skill Labour - Rs 160
Casual Labour :Male - Rs 40Female - Rs 30
GVT - Rajasthan - Banswara: Village Merana: Incremental Migration Support Benefit Stream (Rs'000).
Year 1 Year 2 Year 3 Year 4 Year 5 Year 6 Year 7 Year 8 Year 9 Year 101999/00 2000/01 2001/02 2002/03 2003/04 2004/05 2005/06 2006/07 2007/08 2008/09
- - - - - - - - - -
- - - - - - - - - -
- - - - - - - - - -
- - - - - - - - - -
- - - - - - - - - -
Cost Benefit Analysis (CBA) Study Estimate Jan 2005.
Benefit Streams (Rs '000)

Table AN12.13.11 GVT - Rajasthan - Banswara: Village Merana: Weighted Household Crop Net Margin Summary (Rs/Household).
Item WBR(%) Khalif Rabi Total Khalif Rabi Total Khalif Rabi Total
Phase IIWell Being Ranking - Very Poor
Household Net Margin (Rs) 3.0% 834.6 102.5 937.1 1,849.8 1,067.8 2,917.6 1,015.2 965.3 1,980.5 Well Being Ranking - Poor
Household Net Margin (Rs) 27.0% 637.7 - 637.7 4,803.0 220.7 5,023.7 4,165.3 220.7 4,386.0 Well Being Ranking - Poor
Household Net Margin (Rs) 43.0% 994.0 89.3 1,083.3 3,711.4 2,508.3 6,219.6 2,717.4 2,419.0 5,136.4 Well Being Ranking - Better Off
Household Net Margin (Rs) 27.0% 6,180.9 1,756.7 7,937.5 16,195.9 2,039.3 18,235.2 10,015.0 282.7 10,297.7
Well Being Ranking - WeightedHousehold Net Margin (Rs) 100% 2,293.5 515.8 2,809.2 7,321.1 1,720.8 9,041.8 5,027.6 1,205.0 6,232.6
Phase I \1Well Being Ranking - Very Poor
Household Net Margin (Rs) 3.0% 436.3 267.5 703.8 3,866.5 1,668.8 5,535.3 3,430.3 1,401.3 4,831.5 Well Being Ranking - Poor
Household Net Margin (Rs) 27.0% 485.8 657.5 1,143.3 10,136.0 5,690.3 15,826.3 9,650.3 5,032.8 14,683.0 Well Being Ranking - Poor
Household Net Margin (Rs) 43.0% 986.3 3,385.0 4,371.3 9,457.5 5,195.0 14,652.5 8,471.3 1,810.0 10,281.3 Well Being Ranking - Better Off
Household Net Margin (Rs) 27.0% 2,778.0 937.0 3,715.0 4,915.0 9,560.0 14,475.0 2,137.0 8,623.0 10,760.0
Well Being Ranking - WeightedHousehold Net Margin (Rs) 100% 1,318.4 1,894.1 3,212.5 8,246.5 6,401.5 14,648.0 6,928.1 4,507.4 11,435.5
Source: Study of Impact of WIRFP on Net Incomes of Target Households, Jan 2004.WBR = GVT Household Well Being Ranking. Survey figures adjusted to Village Profile WBR.
\1 GVT - Madhya Pradesh - Phase I: Village Naganwat Choti: Weighted Household Livestock Net Margin Summary.
Before / Without Project After / With Project Increment

Table AN12.13.12 GVT - Rajasthan - Banswara: Village Merana: Household Crop Net Margin Sensitivity Analysis.
Item EIRRKhalif Rabi Total Khalif Rabi Total Khalif Rabi Total
Development Activity:Crop Technology, SWC and WRD
Weighted Net Margin (Phase II)Household Net Margin (Rs) 2,293.5 515.8 2,809.2 7,321.1 1,720.8 9,041.8 5,027.6 1,205.0 6,232.6 Incremental Benefit (Phase II / Phase I) 55%
Base Case AssumptionsHousehold Net Margin (Rs) 2,293.5 515.8 2,809.2 7,321.1 1,720.8 9,041.8 5,027.6 1,205.0 6,232.6 Incremental Benefit (Phase II / Phase I) 55%Sensitivity Increase (%) 0%Development Acivity 50%Overall Village 32%
Sensitivity AssumptionsHousehold Net Margin (Rs) 2,293.5 515.8 2,809.2 7,321.1 1,720.8 9,041.8 5,027.6 1,205.0 6,232.6 Incremental Benefit (Phase II / Phase I) 55%Sensitivity Increase (%) 0%Development Acivity 50%Overall Village 32%
Weighted Net Margin (Phase I)Household Net Margin (Rs) 1,318.4 1,894.1 3,212.5 8,246.5 6,401.5 14,648.0 6,928.1 4,507.4 11,435.5
Source: Cost Benefit Analysis (CBA) Study Estimate Jan 2005.EIRR = Economic Internal Rate of Return (rate at which NPV equal to zero).
Before / Without Project After / With Project Increment

Table AN12.13.13 GVT - Rajasthan - Banswara: Village Merana: Weighted Household Livestock Net Margin Summary (Rs/Household).
Well Being Ranking Weight(%) Herd Value Net Margin Herd Value Net Margin Herd Value Net Margin
Phase I - Well Being Ranking (WBR) \1Madhya Pradesh - WBR Weighted DataVery Poor 3.0%
Average 580 (185.0) 5,650 412.5 474 597.5 Poor 27.0%
Average 2,350 982.5 8,250 2,141.0 1,180 1,158.5 Moderate 43.0%
Average 14,700 6,730.0 1,900 2,820.0 1,900 (3,910.0)Better Off 27.0%
Average 15,580 3,000.0 14,600 10,790.0 (196) 7,790.0
Phase I - WBR Weighted Data 100.0% 11,180 3,963.6 7,156 4,716.3 1,097 752.7
Phase II - Well Being Ranking (WBR)
Very Poor 3.0%Average 5,756 149.2 10,970 1,446.4 1,043 1,297.2
Poor 27.0%Average 13,128 852.2 25,979 3,008.8 2,570 2,156.8
Moderate 43.0%Average 13,525 4,035.1 27,020 5,249.5 2,699 1,214.4
Better Off 27.0%Average 12,700 (781.7) 41,873 2,573.3 5,835 3,355.0
Phase II - WBR Weighted Data 100.0% 12,962 1,758.6 30,268 3,807.9 3,461 2,049.3
Source: Study of Impact of WIRFP on Net Incomes of Target Households, Jan 2004.WBR = GVT Household Well Being Ranking. Survey figures adjusted to Village Profile WBR.
\1 GVT - Madhya Pradesh - Phase I: Village Naganwat Choti: Weighted Household Livestock Net Margin Summary.
Before / Without Project After / With Project Increment \1

WIRFP - Phase II - Cost Benefit Analysis Study
Tables AN12.0 Individual Village Cost Benefit Analysis
Tables AN12.14 GVT - Rajasthan - Banswara: Village Sundripada.
Table AN12.14.1 GVT - Rajasthan - Banswara: Village Sundripada: Village Profile.
Table AN12.14.2 GVT - Rajasthan - Banswara: Village Sundripada: Cost Benefit Analysis Summary (Rs'000).Table AN12.14.3 GVT - Rajasthan - Banswara: Village Sundripada: Cost Benefit Analysis Development Activity Summary A (Rs'000).Table AN12.14.4 GVT - Rajasthan - Banswara: Village Sundripada: Cost Benefit Analysis Development Activity Summary B (Rs'000).
Table AN12.14.5 GVT - Rajasthan - Banswara: Village Sundripada: Costs Financial (Rs'000).GVT - Rajasthan - Banswara: Village Sundripada: Costs Economic (Rs'000).
Table AN12.14.6 GVT - Rajasthan - Banswara: Village Sundripada: VOD Household Assumptions.GVT - Rajasthan - Banswara: Village Sundripada: Incremental VOD Benefit Stream (Rs'000).
Table AN12.14.7 GVT - Rajasthan - Banswara: Village Sundripada: Household Crop Net Margin Assumptions.GVT - Rajasthan - Banswara: Village Sundripada: Incremental Crop Benefit Stream (Rs'000).
Table AN12.14.8 GVT - Rajasthan - Banswara: Village Sundripada: Household Livestock Net Margin Assumptions.GVT - Rajasthan - Banswara: Village Sundripada: Incremental Livestock Benefit Stream (Rs'000).
Table AN12.14.9 GVT - Rajasthan - Banswara: Village Sundripada: Forestry Benefit Assumptions.GVT - Rajasthan - Banswara: Village Sundripada: Incremental Forestry Benefit Stream (Rs'000).
Table AN12.14.10 GVT - Rajasthan - Banswara: Village Sundripada: Migration Support Benefit Assumptions.GVT - Rajasthan - Banswara: Village Sundripada: Incremental Migration Support Benefit Stream (Rs'000).
Table AN12.14.11 GVT - Rajasthan - Banswara: Village Sundripada: Weighted Household Crop Net Margin Summary (Rs/Household).Table AN12.14.12 GVT - Rajasthan - Banswara: Village Sundripada: Household Crop Net Margin Sensitivity Analysis.
Table AN12.14.13 GVT - Rajasthan - Banswara: Village Sundripada: Weighted Household Livestock Net Margin Summary (Rs/Household).

Table AN12.14.1 GVT - Rajasthan - Banswara: Village Sundripada: Village Profile.
Village Profile \1
A. Background E. Well Being Ranking (No Households)Village Name Sundripada Very Poor 4 4.7%District Banswara Poor 16 18.6%State Rajasthan Moderate 29 33.7%
Better Off 37 43.0%B. Participatory Planning Process (PPP) Total 86 100%
Village entry Jan-00PRA Sep-00 F. Land Resource (ha)CPA Sep-00 Total Area 214
Revenue Land (unused) 20 C. Infrastructure Forest Area - Revenue 92
Hand Pumps (no) 8 Pasture Land 13 Wells (no) 16 Arable Land 89 Linked by Road 3 KmElectrification YesSchool Primary G. Livestock
Oxen 187 D. Demographic Data Cows 179
Households (no) 87 Buffalo N/AParticipating Households 78 Goats 361 Population (Adults) 522 Poultry N/A
Adults: Male 128 H. Self Help Groups (Membership) Female 138 1 Group 1 15 Children: 2 Group 2 22 Boys 146 3 Group 3 18 Girls 110 4 Group 4 18
5 Group 5 20 6 Group 6 20 7 Group 7 20
Total Memberhip 133
Source: GVT Banswara Coordination Office - Rajasthan.\1 Subject to final adjustment following consolidation exercise prior to Annual Review Meeting (ARM) in Feb 2005.

Table AN12.14.2 GVT - Rajasthan - Banswara: Village Sundripada: Cost Benefit Analysis Summary (Rs'000).
Administration Costs / Development Activity EIRR \1 Year 1 Year 2 Year 3 Year 4 Year 5 Year 6 Year 7 Year 8 Year 9 Year 10(10%) (%) 1999/00 2000/01 2001/02 2002/03 2003/04 2004/05 2005/06 2006/07 2007/08 2008/09
A. Administration CostsTotal A N/A (972) 687% 35.9 241.3 227.1 238.6 249.5 250.3 223.6 22.4 22.4 22.4
B. Development Activity Component A 1. PPGF
Net Incremental Benefits N/A (146) 103% - (12.3) (32.1) (45.4) (48.8) (45.4) (39.5) (5.3) (5.3) (5.3)
2. VODNet Incremental Benefits 26% 96 -68% - (10.9) (90.8) (2.7) 29.8 27.7 26.5 44.0 44.1 44.2
3/5.Crop Technology, SWC and WRDNet Incremental Benefits 19% 375 -265% - - (107.6) (83.3) (523.0) (515.9) (39.7) 372.0 372.0 372.0
6. LivestockNet Incremental Benefits 77% 482 -341% - (3.3) (29.0) (23.8) 19.5 99.0 34.5 152.6 152.6 152.6
7. ForestryNet Incremental Benefits 40% 23 -16% - - (7.6) (1.8) 3.8 1.3 3.3 8.6 8.6 8.6
8. Migration SupportNet Incremental Benefits N/A - 0% - - - - - - - - - -
SummaryNet Incremental Benefits 11% (141) 100% (35.9) (267.8) (494.3) (395.6) (768.0) (683.6) (238.4) 549.5 549.6 549.8
Sensitivity AnalysisAnalysis Period
12 Years -1% (842)20 Years (Base Case) 11% (141)25 Years 12% 64 30 Years 13% 181
Costs - AdministrationInvestment Costs Decreased by 20 percent 11% (141)
Costs - Administraion and DevelopmentRecurrent Costs Increased by 20 percent 8% (503)
Benefits - Crop, SWC and WRDCrop Benefits Increased by 20 percent 14% 335 Livestock Benefits Increased by 20 percent 11% (141)
Source: Cost Benefit Analysis (CBA) Study Estimate Jan 2005.\1 EIRR = Economic Internal Rate of Return (rate at which NPV equal to zero).\2 NPV = Net Present Value of net incremental benefits at 12% (indicative opportunity cost of capital for rural development projects in India).
N/A = Not analysed as EIRR negative.
NPV \2

Table AN12.14.3 GVT - Rajasthan - Banswara: Village Sundripada: Cost Benefit Analysis Development Activity Summary A (Rs'000).
Administration Costs / Development Activity EIRR \1 Year 1 Year 2 Year 3 Year 4 Year 5 Year 6 Year 7 Year 8 Year 9 Year 10(10%) (%) 1999/00 2000/01 2001/02 2002/03 2003/04 2004/05 2005/06 2006/07 2007/08 2008/09
A. Administration CostsInvestment 35.9 241.3 227.1 238.6 249.5 250.3 223.6 - - - Recurrent - - - - - - - 22.4 22.4 22.4
Total A N/A (972) 687% 35.9 241.3 227.1 238.6 249.5 250.3 223.6 22.4 22.4 22.4
B. Development Intervention Component A 1. PPGF
Cost StreamInvestment - 12.3 31.8 44.3 46.5 42.0 35.1 - - - Recurrent - - 0.3 1.1 2.2 3.4 4.4 5.3 5.3 5.3 Total Costs - 12.3 32.1 45.4 48.8 45.4 39.5 5.3 5.3 5.3
Benefit StreamBefore / Without Project - - - - - - - - - - After / With Project - - - - - - - - - - Incremental Benefits - - - - - - - - - -
Net Incremental Benefits N/A (146) 103% - (12.3) (32.1) (45.4) (48.8) (45.4) (39.5) (5.3) (5.3) (5.3)
2. VODCost Stream
Investment - 10.9 90.3 51.5 16.4 17.9 18.3 - - - Recurrent - - 0.5 5.1 7.6 8.5 9.3 10.3 10.3 10.3 Total Costs - 10.9 90.8 56.5 24.1 26.3 27.6 10.3 10.3 10.3
Benefit StreamBefore / Without Project - - - - - - - - - - After / With Project - - - 53.8 53.9 54.0 54.1 54.2 54.4 54.5 Incremental Benefits - - - 53.8 53.9 54.0 54.1 54.2 54.4 54.5
Net Incremental Benefits 26% 96 -68% - (10.9) (90.8) (2.7) 29.8 27.7 26.5 44.0 44.1 44.2
3/5.Crop Technology, SWC and WRDCost Stream
InvestmentCrop Technology - - 35.2 32.9 52.0 11.3 10.3 - - - Soil Water Conservation - - - - 384.2 370.4 375.8 - - - Water Resource Development - - 72.3 38.6 68.5 56.2 85.7 - - -
RecurrentCrop Technology - - - 0.9 1.7 3.0 3.3 3.5 3.5 3.5 Soil Water Conservation - - - - - 48.0 94.3 141.3 141.3 141.3 Water Resource Development - - 10.9 16.6 26.9 35.3 48.2 48.2 48.2
Total Costs - - 107.6 83.3 523.0 515.9 604.7 193.0 193.0 193.0 Benefit Stream
Before / Without Project - - - - - - 315.4 315.4 315.4 315.4 After / With Project - - - - - - 880.5 880.5 880.5 880.5 Incremental Benefits - - - - - - 565.0 565.0 565.0 565.0
Net Incremental Benefits 19% 375 -265% - - (107.6) (83.3) (523.0) (515.9) (39.7) 372.0 372.0 372.0
Source: Cost Benefit Analysis (CBA) Study Estimate Jan 2005.\1 EIRR = Economic Internal Rate of Return (rate at which NPV equal to zero).\2 NPV = Net Present Value of net incremental benefits at 12% (indicative opportunity cost of capital for rural development projects in India).
N/A = Not analysed as EIRR negative.
NPV \2

Table AN12.14.4 GVT - Rajasthan - Banswara: Village Sundripada: Cost Benefit Analysis Development Activity Summary B (Rs'000).
Administration Costs / Development Activity EIRR \1 Year 1 Year 2 Year 3 Year 4 Year 5 Year 6 Year 7 Year 8 Year 9 Year 10(10%) (%) 1999/00 2000/01 2001/02 2002/03 2003/04 2004/05 2005/06 2006/07 2007/08 2008/09
6. LivestockCost Stream
Investment - 3.3 29.0 16.5 27.9 4.7 126.6 - - - Recurrent - - 7.2 11.1 17.9 23.6 32.1 32.1 32.1 Total Costs - 3.3 29.0 23.8 38.9 22.6 150.2 32.1 32.1 32.1
Benefit StreamBefore / Without Project - - - - 95.7 95.7 95.7 95.7 95.7 95.7 After / With Project - - - - 154.2 217.3 280.4 280.4 280.4 280.4 Incremental Benefits - - - - 58.5 121.6 184.7 184.7 184.7 184.7
Net Incremental Benefits 77% 482 -341% - (3.3) (29.0) (23.8) 19.5 99.0 34.5 152.6 152.6 152.6
7. ForestryCost Stream
Investment - - 7.6 7.6 4.0 8.8 5.9 - - - Recurrent - - 0.8 1.5 1.9 2.8 3.4 3.4 3.4 Total Costs - - 7.6 8.4 5.6 10.7 8.7 3.4 3.4 3.4
Benefit StreamBefore / Without Project - - - - - - - - - - After / With Project - - - 6.6 9.4 12.0 12.0 12.0 12.0 12.0 Incremental Benefits - - - 6.6 9.4 12.0 12.0 12.0 12.0 12.0
Net Incremental Benefits 40% 23 -16% - - (7.6) (1.8) 3.8 1.3 3.3 8.6 8.6 8.6
8. Migration SupportCost Stream
Investment - - - - - - - - - - Recurrent - - - - - - - - - Total Costs - - - - - - - - - -
Benefit StreamBefore / Without Project - - - - - - - - - - After / With Project - - - - - - - - - - Incremental Benefits - - - - - - - - - -
Net Incremental Benefits N/A - 0% - - - - - - - - - -
SummaryCost Stream
Investment 35.9 267.8 493.4 430.1 849.0 761.6 881.2 - - - Recurrent - - 0.9 25.9 40.8 109.6 173.1 266.5 266.5 266.5 Total Costs 35.9 267.8 494.3 456.0 889.8 871.2 1,054.2 266.5 266.5 266.5
Benefit StreamBefore / Without Project - - - - 95.7 95.7 411.2 411.2 411.2 411.2 After / With Project - - - 60.4 217.5 283.3 1,227.0 1,227.1 1,227.3 1,227.4 Incremental Benefits - - - 60.4 121.7 187.6 815.8 816.0 816.1 816.2
Net Incremental Benefits 11% (141) 100% (35.9) (267.8) (494.3) (395.6) (768.0) (683.6) (238.4) 549.5 549.6 549.8
Source: Cost Benefit Analysis (CBA) Study Estimate Jan 2005.
NPV \2

Table AN12.14.5 GVT - Rajasthan - Banswara: Village Sundripada: Costs Financial (Rs'000).
Cost Head / Subhead 1999/00 2000/01 2001/02 2002/03 2003/04 2004/05 2005/06Actual Actual Actual Actual Actual Budget Budget (Rs'000) (%)
A. Administration CostsGVT Bhopal (PHQ) - 60.3 75.4 67.3 52.8 66.8 61.1 383.7 8%DFIDI Consultancy 35.9 71.4 26.9 63.2 47.4 54.7 39.2 338.6 7%Rajastan Coordination Office - 128.5 147.0 127.6 171.7 150.5 143.8 869.1 19%
Total A 35.9 260.2 249.4 258.1 271.9 272.0 244.1 1,591.5 34%
B. Development CostsComponent A 1. PPGF - 13.7 35.4 49.3 51.7 46.7 39.0 235.7 5% 2. VOD - 12.1 100.3 57.2 18.2 19.9 20.3 228.0 5% 3. Crop Technology - - 39.2 36.6 57.7 12.6 11.4 157.5 3% 4. SWC - - - - 569.1 548.8 556.7 1,674.6 36% 5. WRD - - 107.2 57.2 101.5 83.2 126.9 476.0 10% 6. Livestock - 3.6 32.3 18.4 30.9 5.2 140.7 231.1 5% 7. Forestry - - 8.4 8.5 4.5 9.8 6.5 37.6 1%8. Migration Support - - - - - - - - 0%
Subtotal - 29.4 322.7 227.0 833.8 726.1 901.6 3,040.6 66%
Other Development CostsSubtotal - - - - - - - -
Total B - 29.4 322.7 227.0 833.8 726.1 901.6 3,040.6 66%
Total A + B 35.9 289.6 572.0 485.1 1,105.7 998.1 1,145.6 4,632.1 100%
GVT - 216.5 490.2 391.4 804.3 706.2 845.0 3,453.6 75%DFIDI 35.9 71.4 26.9 63.2 47.4 54.7 39.2 338.6 7%Community - 0.5 25.5 14.4 233.6 220.4 234.4 728.8 16%Government - 1.2 29.4 16.0 20.4 16.9 27.1 111.0 2%
Source: GVT Banswara Coordination Office - Rajasthan.
DFIDI = Department for International Development (India).PPGF = Participatory Planning and Group Formation.VOD = Village Organisation and Development.SWC = Soil and Water Conservation.WRD = Water Resource Development.
Totals

Table AN12.14.5
Cost Head / Subhead
A. Administration CostsGVT Bhopal (PHQ)DFIDI ConsultancyRajastan Coordination Office
Total A
B. Development CostsComponent A 1. PPGF 2. VOD 3. Crop Technology 4. SWC 5. WRD 6. Livestock 7. Forestry8. Migration Support
Subtotal
Other Development CostsSubtotal
Total B
Total A + B
GVTDFIDICommunityGovernment
Source:
DFIDI = Department for International Development (India).PPGF = Participatory Planning and Group Formation.VOD = Village Organisation and Development.SWC = Soil and Water Conservation.WRD = Water Resource Development.
GVT - Rajasthan - Banswara: Village Sundripada: Costs Economic (Rs'000).
1999/00 2000/01 2001/02 2002/03 2003/04 2004/05 2005/06CF SCF Actual Actual Actual Actual Actual Budget Budget (Rs'000) (%)
0.90 1.00 - 54.2 67.9 60.6 47.5 60.1 55.0 345.4 9%1.00 1.00 35.9 71.4 26.9 63.2 47.4 54.7 39.2 338.6 9%0.90 1.00 - 115.7 132.3 114.8 154.5 135.5 129.4 782.2 21%
35.9 241.3 227.1 238.6 249.5 250.3 223.6 1,466.2 39%
0.90 1.00 - 12.3 31.8 44.3 46.5 42.0 35.1 212.1 6%0.90 1.00 - 10.9 90.3 51.5 16.4 17.9 18.3 205.2 6%0.90 1.00 - - 35.2 32.9 52.0 11.3 10.3 141.8 4%0.90 0.75 - - - - 384.2 370.4 375.8 1,130.4 30%0.90 0.75 - - 72.3 38.6 68.5 56.2 85.7 321.3 9%0.90 1.00 - 3.3 29.0 16.5 27.9 4.7 126.6 208.0 6%0.90 1.00 - - 7.6 7.6 4.0 8.8 5.9 33.9 1%0.90 1.00 - - - - - - - - 0%
- 26.5 266.3 191.5 599.5 511.3 657.6 2,252.6 61%
0.90 1.00 - - - - - - - - 0%- 26.5 266.3 191.5 599.5 511.3 657.6 2,252.6 61%
35.9 267.8 493.4 430.1 849.0 761.6 881.2 3,718.8 100%
- - - - - - - N/A- - - - - - - N/A- - - - - - - N/A- - - - - - - N/A
Cost Benefit Analysis (CBA) Study Estimate Jan 2005.
TotalsConversion Factors

Table AN12.14.6 GVT - Rajasthan - Banswara: Village Sundripada: VOD Household Assumptions.
Without \ With Project UnitsYear 1 Year 2 Year 3(Rs) (Rs) (Rs)
Development Activity:Village Organisation and Development
Before / Without Project Situation:
A. Self Help Groups (SHGs)Assumption Sum Zero Zero Zero - - -
B. Drudgery ReductionAssumption Sum Zero Zero Zero
Total Without Project Benefits - - -
After / With Project Situation:
A. Self Help Groups (SHGs)Assumptions
Average Household Savings Rs 943.8 Households (HHs) No 80 Present Group Deposits Rs'000 75.5 Annual Savings Increase % 3% 75.5 77.8 80.1 Deposits on Loan to Members % 25%SHG Interest Income % / Year 20%Assumed Benefit Rs'000 3.8 3.9 4.0
B. Drudgery ReductionAssumptions
Hours Saved / Day / Household No 1.0 Number of Days / Year / Household No 200 Days / Year / Household (8hrs/day) No 25.0 Households / Village No 80 Day Equivalent / Village No 2,000 Economic Value per Day (Rs/day) 25 Assumed Benefit Rs'000 50.0 50.0 50.0
Total With Project Benefits Rs'000 53.8 53.9 54.0
Incremental Benefits Rs'000 53.8 53.9 54.0
Source: Cost Benefit Analysis (CBA) Study Estimate Jan 2005.VOD = Village Organisation and Development.Households per village: Sundripada 80
Assumptions Benefits

Table AN12.14.6
Without \ With Project
Development Activity:Village Organisation and Development
Before / Without Project Situation:
A. Self Help Groups (SHGs)Assumption
B. Drudgery ReductionAssumption
Total Without Project Benefits
After / With Project Situation:
A. Self Help Groups (SHGs)Assumptions
Average Household SavingsHouseholds (HHs)Present Group DepositsAnnual Savings IncreaseDeposits on Loan to MembersSHG Interest Income Assumed Benefit
B. Drudgery ReductionAssumptions
Hours Saved / Day / HouseholdNumber of Days / Year / HouseholdDays / Year / Household (8hrs/day)Households / VillageDay Equivalent / VillageEconomic Value per DayAssumed Benefit
Total With Project Benefits
Incremental Benefits
Source:VOD = Village Organisation and Development.Households per village: Sundripada
GVT - Rajasthan - Banswara: Village Sundripada: Incremental VOD Benefit Stream (Rs'000).
Year 1 Year 2 Year 3 Year 4 Year 5 Year 6 Year 7 Year 8 Year 9 Year 101999/00 2000/01 2001/02 2002/03 2003/04 2004/05 2005/06 2006/07 2007/08 2008/09
- - - - - - - - - -
- - - 75.5 77.8 80.1 82.5 85.0 87.5 90.2
- - - 3.8 3.9 4.0 4.1 4.2 4.4 4.5
- - - 50.0 50.0 50.0 50.0 50.0 50.0 50.0
- - - 53.8 53.9 54.0 54.1 54.2 54.4 54.5
- - - 53.8 53.9 54.0 54.1 54.2 54.4 54.5
Cost Benefit Analysis (CBA) Study Estimate Jan 2005.
Benefit Streams (Rs '000)

Table AN12.14.7 GVT - Rajasthan - Banswara: Village Sundripada: Household Crop Net Margin Assumptions.
Without \ With Project UnitsYear 1 Year 2 Year 3(Rs) (Rs) (Rs)
Development Activity:Crop Technology, SWC and WRD
Before / Without Project Situation:Assumptions
Households (HHs) No 80 Crop Adoption Assumptions 100% 100% 100%
Kharif Crop Net Margin Rs/HH 3,152.2 3,152.2 3,152.2
Rabi Crop Net Margin Rs/HH 790.8 790.8 790.8 Total Without Project Benefits Rs/HH 3,943.1 3,943.1 3,943.1
After / With Project Situation:Assumptions
Households (HHs) No 80 Crop Adoption Assumptions 100% 100% 100%
Kharif Crop Net Margin Rs/HH 9,183.1 9,183.1 9,183.1
Rabi Crop Net Margin Rs/HH 1,822.8 1,822.8 1,822.8 Total With Project Benefits Rs/HH 11,005.9 11,005.9 11,005.9
Incremental Benefits Rs/HH 7,062.9 7,062.9 7,062.9
Source: Cost Benefit Analysis (CBA) Study Estimate Jan 2005.
BenefitsAssumptions

Table AN12.14.7
Without \ With Project
Development Activity:Crop Technology, SWC and WRD
Before / Without Project Situation:Assumptions
Households (HHs)Crop Adoption Assumptions
Kharif Crop Net Margin
Rabi Crop Net MarginTotal Without Project Benefits
After / With Project Situation:Assumptions
Households (HHs)Crop Adoption Assumptions
Kharif Crop Net Margin
Rabi Crop Net MarginTotal With Project Benefits
Incremental Benefits
Source:
GVT - Rajasthan - Banswara: Village Sundripada: Incremental Crop Benefit Stream (Rs'000).
Year 1 Year 2 Year 3 Year 4 Year 5 Year 6 Year 7 Year 8 Year 9 Year 101999/00 2000/01 2001/02 2002/03 2003/04 2004/05 2005/06 2006/07 2007/08 2008/09
- - - - - - 252.2 252.2 252.2 252.2
- - - - - - 63.3 63.3 63.3 63.3 - - - - - - 315.4 315.4 315.4 315.4
- - - - - - 734.6 734.6 734.6 734.6
- - - - - - 145.8 145.8 145.8 145.8 - - - - - - 880.5 880.5 880.5 880.5
- - - - - - 565.0 565.0 565.0 565.0
Cost Benefit Analysis (CBA) Study Estimate Jan 2005.
Benefit Streams (Rs '000)

Table AN12.14.8 GVT - Rajasthan - Banswara: Village Sundripada: Household Livestock Net Margin Assumption
Without \ With Project UnitsLivestock Year 1 Year 2 Year 3
(Rs) (Rs) (Rs)
Development Activity:Livestock
Before / Without Project Situation:Assumptions
Households (HHs) No 80 Annual Livestock Net Margin Rs/HH
Total Without Project Benefits 1,196.7 1,196.7 1,196.7
After / With Project Situation:
Development Activity:Assumptions
Households (HHs) No 80 Adoption Assumptions Percent 55% 78% 100%
Annual Livestock Net Margin Rs/HHTotal With Project Benefits 1,927.9 2,716.6 3,505.3
Incremental Benefits Rs/HH 731.2 1,519.9 2,308.6
Source: Cost Benefit Analysis (CBA) Study Estimate Jan 2005.
BenefitsAssumptions

Table AN12.14.8
Without \ With ProjectLivestock
Development Activity:Livestock
Before / Without Project Situation:Assumptions
Households (HHs)Annual Livestock Net Margin
Total Without Project Benefits
After / With Project Situation:
Development Activity:Assumptions
Households (HHs)Adoption Assumptions
Annual Livestock Net MarginTotal With Project Benefits
Incremental Benefits
Source:
GVT - Rajasthan - Banswara: Village Sundripada: Incremental Livestock Benefit Stream (Rs'000).
Year 1 Year 2 Year 3 Year 4 Year 5 Year 6 Year 7 Year 8 Year 9 Year 101999/00 2000/01 2001/02 2002/03 2003/04 2004/05 2005/06 2006/07 2007/08 2008/09
- - - - 95.7 95.7 95.7 95.7 95.7 95.7
- - - - 154.2 217.3 280.4 280.4 280.4 280.4
- - - - 58.5 121.6 184.7 184.7 184.7 184.7
Cost Benefit Analysis (CBA) Study Estimate Jan 2005.
Benefit Streams (Rs '000)
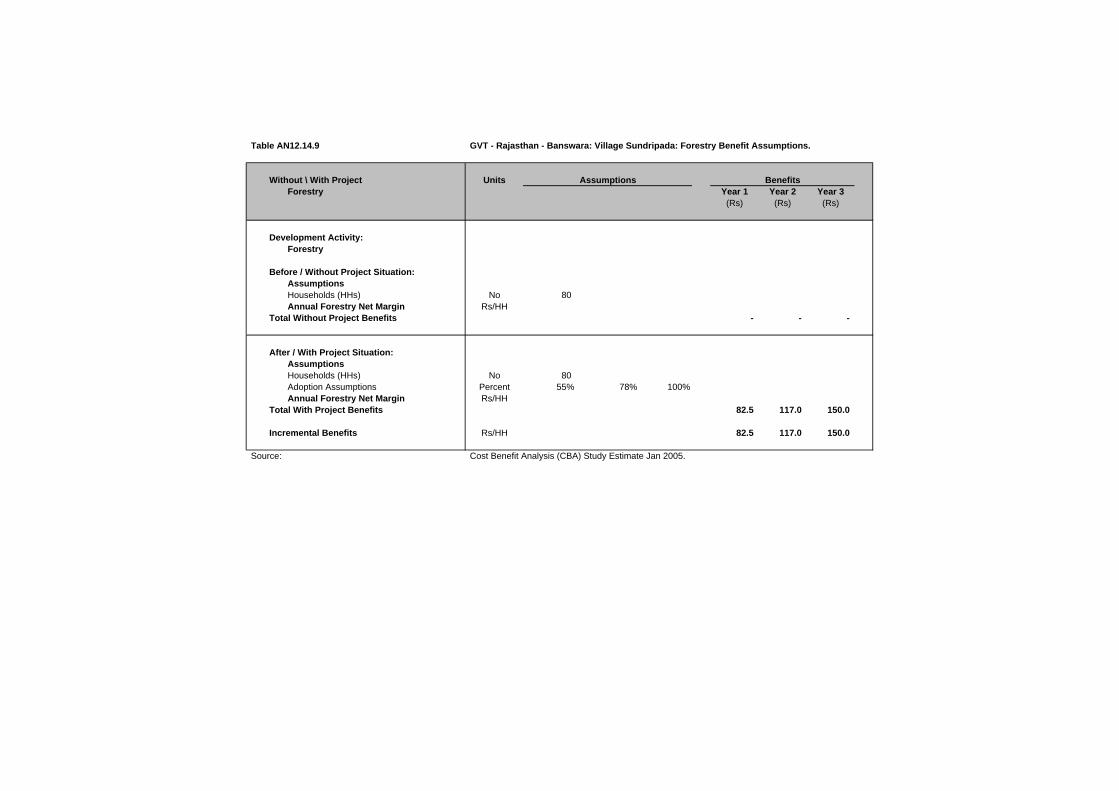
Table AN12.14.9 GVT - Rajasthan - Banswara: Village Sundripada: Forestry Benefit Assumptions.
Without \ With Project UnitsForestry Year 1 Year 2 Year 3
(Rs) (Rs) (Rs)
Development Activity:Forestry
Before / Without Project Situation:AssumptionsHouseholds (HHs) No 80 Annual Forestry Net Margin Rs/HH
Total Without Project Benefits - - -
After / With Project Situation:AssumptionsHouseholds (HHs) No 80 Adoption Assumptions Percent 55% 78% 100%Annual Forestry Net Margin Rs/HH
Total With Project Benefits 82.5 117.0 150.0
Incremental Benefits Rs/HH 82.5 117.0 150.0
Source: Cost Benefit Analysis (CBA) Study Estimate Jan 2005.
BenefitsAssumptions

Table AN12.14.9
Without \ With ProjectForestry
Development Activity:Forestry
Before / Without Project Situation:AssumptionsHouseholds (HHs)Annual Forestry Net Margin
Total Without Project Benefits
After / With Project Situation:AssumptionsHouseholds (HHs)Adoption AssumptionsAnnual Forestry Net Margin
Total With Project Benefits
Incremental Benefits
Source:
GVT - Rajasthan - Banswara: Village Sundripada: Incremental Forestry Benefit Stream (Rs'000).
Year 1 Year 2 Year 3 Year 4 Year 5 Year 6 Year 7 Year 8 Year 9 Year 101999/00 2000/01 2001/02 2002/03 2003/04 2004/05 2005/06 2006/07 2007/08 2008/09
- - - - - - - - - -
- - - 6.6 9.4 12.0 12.0 12.0 12.0 12.0
- - - 6.6 9.4 12.0 12.0 12.0 12.0 12.0
Cost Benefit Analysis (CBA) Study Estimate Jan 2005.
Benefit Streams (Rs '000)

Table AN12.14.10 GVT - Rajasthan - Banswara: Village Sundripada: Migration Support Benefit Assumptions.
Without \ With ProjectYear 1 Year 2 Year 3(Rs) (Rs) (Rs)
Development Activity:Migration Support
Before / Without Project Situation:Assumptions
Economic Value per Day Rs/day 25.0 Days / Month / Household No 18 Economic Value per Month Rs/month 450.0 Months Migration / Year Months 4.0 Economic Value per Household Rs/HH 1,800.0 Households per Village No - Households per Village Migrating Percent 45%
Total Without Project Benefits Rs/Village - - -
After / With Project Situation:Assumptions
Economic Value per Day \1 Rs/day 25.0 25% 31.3 Days / Month / Household No 18 30% 24.0 Economic Value per Month Rs/month 450.0 750.0 Months Migration / Year Months 4.0 -25% 3.0 Economic Value per Household Rs/HH 1,800.0 2,250.0 Households per Village No - - Households per Village Migrating Percent 45% -10% 41%
Subtotal Migration Benefits Rs/Village - - -
Other Income Sum (Rs'000) - - - - - -
Total With Project Benefits Rs/Village - - -
Incremental Benefits Rs/Village - - -
Source: Cost Benefit Analysis (CBA) Study Estimate Jan 2005.
1\ Financial Wages (Rs/day):Skill Labour - Rs 160
Casual Labour :Male - Rs 40Female - Rs 30
BenefitsAssumptions

Table AN12.14.10
Without \ With Project
Development Activity:Migration Support
Before / Without Project Situation:Assumptions
Economic Value per Day Days / Month / Household Economic Value per Month Months Migration / Year Economic Value per Household Households per Village Households per Village Migrating
Total Without Project Benefits
After / With Project Situation:Assumptions
Economic Value per Day \1Days / Month / Household Economic Value per Month Months Migration / Year Economic Value per Household Households per Village Households per Village Migrating
Subtotal Migration Benefits
Other Income
Total With Project Benefits
Incremental Benefits
Source:
1\ Financial Wages (Rs/day):Skill Labour - Rs 160
Casual Labour :Male - Rs 40Female - Rs 30
GVT - Rajasthan - Banswara: Village Sundripada: Incremental Migration Support Benefit Stream (Rs'000).
Year 1 Year 2 Year 3 Year 4 Year 5 Year 6 Year 7 Year 8 Year 9 Year 101999/00 2000/01 2001/02 2002/03 2003/04 2004/05 2005/06 2006/07 2007/08 2008/09
- - - - - - - - - -
- - - - - - - - - -
- - - - - - - - - -
- - - - - - - - - -
- - - - - - - - - -
Cost Benefit Analysis (CBA) Study Estimate Jan 2005.
Benefit Streams (Rs '000)

Table AN12.14.11 GVT - Rajasthan - Banswara: Village Sundripada: Weighted Household Crop Net Margin Summary (Rs/Household).
Item WBR(%) Khalif Rabi Total Khalif Rabi Total Khalif Rabi Total
Phase IIWell Being Ranking - Very Poor
Household Net Margin (Rs) 5.0% 834.6 102.5 937.1 1,849.8 1,067.8 2,917.6 1,015.2 965.3 1,980.5 Well Being Ranking - Poor
Household Net Margin (Rs) 18.0% 637.7 - 637.7 4,803.0 220.7 5,023.7 4,165.3 220.7 4,386.0 Well Being Ranking - Moderate
Household Net Margin (Rs) 34.0% 994.0 89.3 1,083.3 3,711.4 2,508.3 6,219.6 2,717.4 2,419.0 5,136.4 Well Being Ranking - Better Off
Household Net Margin (Rs) 43.0% 6,180.9 1,756.7 7,937.5 16,195.9 2,039.3 18,235.2 10,015.0 282.7 10,297.7
Well Being Ranking - WeightedHousehold Net Margin (Rs) 100.0% 3,152.2 790.8 3,943.1 9,183.1 1,822.8 11,005.9 6,030.9 1,032.0 7,062.9
Phase I \1Well Being Ranking - Very Poor
Household Net Margin (Rs) 5.0% 436.3 267.5 703.8 3,866.5 1,668.8 5,535.3 3,430.3 1,401.3 4,831.5 Well Being Ranking - Very Poor
Household Net Margin (Rs) 18.0% 485.8 657.5 1,143.3 10,136.0 5,690.3 15,826.3 9,650.3 5,032.8 14,683.0 Well Being Ranking - Poor
Household Net Margin (Rs) 34.0% 986.3 3,385.0 4,371.3 9,457.5 5,195.0 14,652.5 8,471.3 1,810.0 10,281.3 Well Being Ranking - Better Off
Household Net Margin (Rs) 43.0% 2,778.0 937.0 3,715.0 4,915.0 9,560.0 14,475.0 2,137.0 8,623.0 10,760.0
Well Being Ranking - WeightedHousehold Net Margin (Rs) 100.0% 1,639.1 1,685.5 3,324.6 7,346.8 6,984.8 14,331.6 5,707.7 5,299.2 11,006.9
Source: Study of Impact of WIRFP on Net Incomes of Target Households, Jan 2004.WBR = GVT Household Well Being Ranking. Survey figures adjusted to Village Profile WBR.
\1 GVT - Madhya Pradesh - Phase I: Village Naganwat Choti: Weighted Household Crop Net Margin Summary.
Before / Without Project After / With Project Increment

Table AN12.14.12 GVT - Rajasthan - Banswara: Village Sundripada: Household Crop Net Margin Sensitivity Analysis.
Item EIRRKhalif Rabi Total Khalif Rabi Total Khalif Rabi Total
Development Activity:Crop Technology, SWC and WRD
Weighted Net Margin (Phase II)Household Net Margin (Rs) 3,152.2 790.8 3,943.1 9,183.1 1,822.8 11,005.9 6,030.9 1,032.0 7,062.9 Incremental Benefit (Phase II / Phase I) 64%
Base Case AssumptionsHousehold Net Margin (Rs) 3,152.2 790.8 3,943.1 9,183.1 1,822.8 11,005.9 6,030.9 1,032.0 7,062.9 Incremental Benefit (Phase II / Phase I) 64%Sensitivity Increase (%) 0%Development Acivity 19%Overall Village 11%
Sensitivity AssumptionsHousehold Net Margin (Rs) 3,152.2 790.8 3,943.1 9,642.3 1,914.0 11,556.2 6,490.0 1,123.1 7,613.2 Incremental Benefit (Phase II / Phase I) 69%Sensitivity Increase (%) 0%Development Acivity 21%Overall Village 12%
Weighted Net Margin (Phase I)Household Net Margin (Rs) 1,639.1 1,685.5 3,324.6 7,346.8 6,984.8 14,331.6 5,707.7 5,299.2 11,006.9
Source: Cost Benefit Analysis (CBA) Study Estimate Jan 2005.EIRR = Economic Internal Rate of Return (rate at which NPV equal to zero).
Before / Without Project After / With Project Increment

Table AN12.14.13 GVT - Rajasthan - Banswara: Village Sundripada: Weighted Household Livestock Net Margin Summary (Rs/Household).
Well Being Ranking Weight(%) Herd Value Net Margin Herd Value Net Margin Herd Value Net Margin
Phase I - Well Being Ranking (WBR) \1Madhya Pradesh - WBR Weighted DataVery Poor 5.0%
Average 580 (185.0) 5,650 412.5 474 597.5 Poor 18.0%
Average 2,350 982.5 8,250 2,141.0 1,180 1,158.5 Moderate 34.0%
Average 14,700 6,730.0 1,900 2,820.0 1,900 (3,910.0)Better Off 43.0%
Average 15,580 3,000.0 14,600 10,790.0 (196) 7,790.0
Phase I - WBR Weighted Data 100.0% 12,149 3,745.8 8,692 6,004.5 798 2,258.7
Phase II - Well Being Ranking (WBR)
Very Poor 5.0%Average 5,756 149.2 10,970 1,446.4 1,043 1,297.2
Poor 18.0%Average 13,128 852.2 25,979 3,008.8 2,570 2,156.8
Moderate 34.0%Average 13,525 4,035.1 27,020 5,249.5 2,699 1,214.4
Better Off 43.0%Average 12,700 (781.7) 41,873 2,573.3 5,835 3,355.0
Phase II - WBR Weighted Data 100.0% 12,710 1,196.7 32,417 3,505.3 3,941 2,308.6
Source: Study of Impact of WIRFP on Net Incomes of Target Households, Jan 2004.WBR = GVT Household Well Being Ranking. Survey figures adjusted to Village Profile WBR.
\1 GVT - Madhya Pradesh - Phase I: Village Naganwat Choti: Weighted Household Livestock Net Margin Summary.
Before / Without Project After / With Project Increment \1

WIRFP - Phase II - Cost Benefit Analysis Study
Tables AN12.0 Individual Village Cost Benefit Analysis
Tables AN12.15 IFFDC - Rajesthan - Pratapgarh: Village Chhayan.
Table AN12.15.1 IFFDC - Rajesthan - Pratapgarh: Village Chhayan: Village Profile.
Table AN12.15.2 IFFDC - Rajesthan - Pratapgarh: Village Chhayan: Cost Benefit Analysis Summary (Rs'000).Table AN12.15.3 IFFDC - Rajesthan - Pratapgarh: Village Chhayan: Cost Benefit Analysis Development Activity Summary A (Rs'000).Table AN12.15.4 IFFDC - Rajesthan - Pratapgarh: Village Chhayan: Cost Benefit Analysis Development Activity Summary B (Rs'000).
Table AN12.15.5 IFFDC - Rajasthan - Pratapgarh: Village Chhayan: Costs - Financial (Rs'000).IFFDC - Rajasthan - Pratapgarh: Village Chhayan: Costs - Economic (Rs'000).
Table AN12.15.6 IFFDC - Rajesthan - Pratapgarh: Village Chhayan: VOD Household Assumptions.IFFDC - Rajesthan - Pratapgarh: Village Chhayan: Incremental VOD Benefit Stream (Rs'000).
Table AN12.15.7 IFFDC - Rajesthan - Pratapgarh: Village Chhayan: Household Crop Net Margin Assumptions.IFFDC - Rajesthan - Pratapgarh: Village Chhayan: Incremental Crop Benefit Stream (Rs'000).
Table AN12.15.8 IFFDC - Rajesthan - Pratapgarh: Village Chhayan: Household Livestock Net Margin Assumptions.IFFDC - Rajesthan - Pratapgarh: Village Chhayan: Incremental Livestock Benefit Stream (Rs'000).
Table AN12.15.9 IFFDC - Rajesthan - Pratapgarh: Village Chhayan: Forestry Benefit Assumptions.IFFDC - Rajesthan - Pratapgarh: Village Chhayan: Incremental Forestry Benefit Stream (Rs'000).
Table AN12.15.10 IFFDC - Rajesthan - Pratapgarh: Village Chhayan: Migration Support Benefit Assumptions.IFFDC - Rajesthan - Pratapgarh: Village Chhayan: Incremental Migration Support Benefit Stream (Rs'000).
Table AN12.15.11 IFFDC - Rajesthan - Pratapgarh: Village Chhayan: Weighted Household Crop Net Margin Summary (Rs/Household).Table AN12.15.12 IFFDC - Rajesthan - Pratapgarh: Village Chhayan: Weighted Household Crop Net Margin Sensitivity Analysis (Rs/Household).
Table AN12.15.13 IFFDC - Rajesthan - Pratapgarh: Village Chhayan: Weighted Household Livestock Net Margin Summary (Rs/Household).

Table AN12.15.1 IFFDC - Rajesthan - Pratapgarh: Village Chhayan: Village Profile.
Village Profile \1
A. Background D. Well Being Ranking (No Households)Village Name Chhayan Very Poor 31 29.8%District Pratapgarh Poor 32 30.8%State Rajasthan Moderate 27 26.0%
Better Off 14 13.5%Participatory Planning Process (PPP) Total 104 100%
Village entry Oct-99PRA Dec-00 E. Land Resource (ha)CPA Dec-00 Total Area 448
Revenue Land (unused) 38 B. Infrastructure Forest Area - Revenue 149
Hand Pumps (no) 8 Pasture Land - Wells (no) 25 Arable Land 132 Linked by Road 1 km 319 Electrification YesSchool Primary F. Livestock
Oxen N/AC. Demographic Data Cows N/A
Households (no) 104 Buffalo N/AParticipating Households 60 Goats N/APopulation (Adults) 642 Poultry N/A
Adults: Male 260 G. Self Help Groups (No Households) Female 382 1 Group 1 12 Children: 2 Group 2 16 Boys N/A 3 Group 3 12 Girls N/A 4 Group 4 13
5 Group 5 9 6 Group 6 9
Total Memberhip 71
Source: IFFDC Pratapgarh Coordination Office - Rajasthan.\1 Subject to final adjustment following consolidation exercise prior to Annual Review Meeting (ARM) in Feb 2005.

Table AN12.15.2 IFFDC - Rajesthan - Pratapgarh: Village Chhayan: Cost Benefit Analysis Summary (Rs'000).
Administration Costs / Development Activity EIRR \1 Year 1 Year 2 Year 3 Year 4 Year 5 Year 6 Year 7 Year 8 Year 9 Year 10(10%) (%) 1999/00 2000/01 2001/02 2002/03 2003/04 2004/05 2005/06 2006/07 2007/08 2008/09
A. Administration CostsTotal A N/A (1,449) 60% 237.1 209.8 199.3 366.6 388.0 389.3 373.8 37.4 37.4 37.4
B. Development Intervention Component A 1. PPGF
Net Incremental Benefits N/A (42) 2% (6.7) (3.5) (9.9) (16.0) (6.6) (7.3) (9.7) (1.4) (1.4) (1.4)
2. VODNet Incremental Benefits 13% 7 0% - - (11.2) (17.3) 35.1 7.3 (248.7) 38.5 39.2 39.9
3/5.Crop Technology, SWC and WRDNet Incremental Benefits N/A (1,300) 54% - (0.9) (349.8) (735.7) (634.8) (152.1) (156.6) (25.6) (25.6) (25.6)
6. LivestockNet Incremental Benefits 77% 348 -14% - (7.6) (4.2) (23.1) (13.7) 61.2 96.7 104.8 104.8 104.8
7. ForestryNet Incremental Benefits 28% 27 -1% - (8.0) (2.0) (7.2) (9.9) 9.7 8.5 12.5 12.5 12.5
8. Migration SupportNet Incremental Benefits N/A - 0% - - - - - - - - - -
SummaryNet Incremental Benefits N/A (2,408) 100% (243.8) (229.8) (576.4) (1,165.9) (1,017.9) (470.6) (683.6) 91.4 92.1 92.9
Sensitivity AnalysisAnalysis Period
12 Years N/A (2,527)20 Years (Base Case) N/A (2,408)25 Years N/A (2,374)30 Years N/A (2,354)
Costs - AdministrationInvestment Costs Decreased by 20 percent N/A (2,118)
Costs - Administration and DevelopmentRecurrent Costs Increased by 20 percent N/A (2,703)
Benefits - Crops, SWC and WRDCrop Benefits Increased by 20 percent N/A (2,130)Livestock Benefits Increased by 20 percent N/A (2,272)
Source: Cost Benefit Analysis (CBA) Study Estimate Jan 2005.\1 EIRR = Economic Internal Rate of Return (rate at which NPV equal to zero).\2 NPV = Net Present Value of net incremental benefits at 12% (indicative opportunity cost of capital for rural development projects in India).
N/A = Not analysed as EIRR negative.
NPV \2

Table AN12.15.3 IFFDC - Rajesthan - Pratapgarh: Village Chhayan: Cost Benefit Analysis Development Activity Summary A (Rs'000).
Administration Costs / Development Activity EIRR \1 Year 1 Year 2 Year 3 Year 4 Year 5 Year 6 Year 7 Year 8 Year 9 Year 10(10%) (%) 1999/00 2000/01 2001/02 2002/03 2003/04 2004/05 2005/06 2006/07 2007/08 2008/09
A. Administration CostsInvestment 237.1 209.8 199.3 366.6 388.0 389.3 373.8 - - - Recurrent - - - - - - - 37.4 37.4 37.4
Total A N/A (1,449) 60% 237.1 209.8 199.3 366.6 388.0 389.3 373.8 37.4 37.4 37.4
B. Development Intervention Component A 1. PPGF
Cost StreamInvestment 6.7 3.3 9.6 15.5 5.7 6.3 8.6 - - - Recurrent - 0.2 0.3 0.5 0.9 1.0 1.2 1.4 1.4 1.4 Total Costs 6.7 3.5 9.9 16.0 6.6 7.3 9.7 1.4 1.4 1.4
Benefit StreamBefore / Without Project - - - - - - - - - - After / With Project - - - - - - - - - - Incremental Benefits - - - - - - - - - -
Net Incremental Benefits N/A (42) 2% (6.7) (3.5) (9.9) (16.0) (6.6) (7.3) (9.7) (1.4) (1.4) (1.4)
2. VODCost Stream
Investment - - 11.2 75.3 19.8 47.3 301.5 - - - Recurrent - - - 0.6 4.3 5.3 7.7 22.7 22.7 22.7 Total Costs - - 11.2 75.8 24.1 52.6 309.2 22.7 22.7 22.7
Benefit StreamBefore / Without Project - - - - - - - - - - After / With Project - - - 58.6 59.2 59.8 60.5 61.2 61.9 62.6 Incremental Benefits - - - 58.6 59.2 59.8 60.5 61.2 61.9 62.6
Net Incremental Benefits 13% 7 0% - - (11.2) (17.3) 35.1 7.3 (248.7) 38.5 39.2 39.9
3/5.Crop Technology, SWC and WRDCost Stream
InvestmentCrop Technology - 0.9 1.1 7.8 45.6 14.9 16.2 - - - Soil Water Conservation - - 33.1 42.8 29.0 13.5 16.9 - - - Water Resource Development - - 315.6 633.5 685.7 141.8 118.1 - - -
RecurrentCrop Technology - - 0.0 0.1 0.2 1.4 1.8 2.2 2.2 2.2 Soil Water Conservation - - - 4.1 9.5 13.1 14.8 16.9 16.9 16.9 Water Resource Development - - - 47.3 142.4 245.2 266.5 284.2 284.2 284.2
Total Costs - 0.9 349.8 735.7 912.4 429.8 434.2 303.3 303.3 303.3 Benefit Stream
Before / Without Project - - - - 107.5 107.5 107.5 107.5 107.5 107.5 After / With Project - - - - 385.2 385.2 385.2 385.2 385.2 385.2 Incremental Benefits - - - - 277.7 277.7 277.7 277.7 277.7 277.7
Net Incremental Benefits N/A (1,300) 54% - (0.9) (349.8) (735.7) (634.8) (152.1) (156.6) (25.6) (25.6) (25.6)
Source: Cost Benefit Analysis (CBA) Study Estimate Jan 2005.\1 EIRR = Economic Internal Rate of Return (rate at which NPV equal to zero).\2 NPV = Net Present Value of net incremental benefits at 12% (indicative opportunity cost of capital for rural development projects in India).
N/A = Not analysed as EIRR negative.
NPV \2

Table AN12.15.4 IFFDC - Rajesthan - Pratapgarh: Village Chhayan: Cost Benefit Analysis Development Activity Summary B (Rs'000).
Administration Costs / Development Activity EIRR \1 Year 1 Year 2 Year 3 Year 4 Year 5 Year 6 Year 7 Year 8 Year 9 Year 10(10%) (%) 1999/00 2000/01 2001/02 2002/03 2003/04 2004/05 2005/06 2006/07 2007/08 2008/09
6. LivestockCost Stream
Investment - 7.6 3.5 22.0 38.5 2.3 9.0 - - - Recurrent - - 0.8 1.1 3.3 7.2 7.4 8.3 8.3 8.3 Total Costs - 7.6 4.2 23.1 41.8 9.4 16.4 8.3 8.3 8.3
Benefit StreamBefore / Without Project - - - - 75.8 75.8 75.8 75.8 75.8 75.8 After / With Project - - - - 103.9 146.4 188.9 188.9 188.9 188.9 Incremental Benefits - - - - 28.1 70.6 113.1 113.1 113.1 113.1
Net Incremental Benefits 77% 348 -14% - (7.6) (4.2) (23.1) (13.7) 61.2 96.7 104.8 104.8 104.8
7. ForestryCost Stream
Investment - 8.0 1.2 16.2 21.4 3.6 4.5 - - - Recurrent - 0.8 0.9 2.5 4.7 5.0 5.5 5.5 5.5 Total Costs - 8.0 2.0 17.1 23.9 8.3 9.5 5.5 5.5 5.5
Benefit StreamBefore / Without Project - - - - - - - - - - After / With Project - - - 9.9 14.0 18.0 18.0 18.0 18.0 18.0 Incremental Benefits - - - 9.9 14.0 18.0 18.0 18.0 18.0 18.0
Net Incremental Benefits 28% 27 -1% - (8.0) (2.0) (7.2) (9.9) 9.7 8.5 12.5 12.5 12.5
8. Migration SupportCost Stream
Investment - - - - - - - - - - Recurrent - - - - - - - - - Total Costs - - - - - - - - - -
Benefit StreamBefore / Without Project - - - - - - - - - - After / With Project - - - - - - - - - - Incremental Benefits - - - - - - - - - -
Net Incremental Benefits N/A - 0% - - - - - - - - - -
SummaryCost Stream
Investment 243.8 229.6 574.5 1,179.8 1,233.7 618.8 848.6 - - - Recurrent - 0.2 1.8 54.6 163.2 277.9 304.3 378.6 378.6 378.6 Total Costs 243.8 229.8 576.4 1,234.4 1,396.9 896.7 1,152.9 378.6 378.6 378.6
Benefit StreamBefore / Without Project - - - - 183.4 183.4 183.4 183.4 183.4 183.4 After / With Project - - - 68.5 562.4 609.5 652.7 653.4 654.1 654.8 Incremental Benefits - - - 68.5 379.0 426.1 469.3 470.0 470.7 471.5
Net Incremental Benefits N/A (2,408) 100% (243.8) (229.8) (576.4) (1,165.9) (1,017.9) (470.6) (683.6) 91.4 92.1 92.9
Source: Cost Benefit Analysis (CBA) Study Estimate Jan 2005.
NPV \2

Table AN12.15.5 IFFDC - Rajasthan - Pratapgarh: Village Chhayan: Costs - Financial (Rs'000).
Cost Head / Subhead 1999/00 2000/01 2001/02 2002/03 2003/04 2004/05 2005/06Actual Actual Actual Actual Actual Budget Budget (Rs'000) (%)
A. Administration CostsIFFDC Head Quarters 106.0 46.3 47.3 84.7 53.8 47.2 47.2 432.5 7%DFIDI 35.9 71.4 26.9 63.2 47.4 54.7 39.2 338.6 5%Pratapgarh Coordination Office 117.6 107.5 144.2 252.5 324.6 324.6 324.6 1,595.6 26%
Total A 259.5 225.1 218.4 400.3 425.8 426.5 411.0 2,366.7 38%
B. Development CostsComponent A 1. PPG 7.4 3.7 10.7 17.3 6.4 7.0 9.5 62.0 1% 2. VOD - - 12.4 83.6 22.0 52.5 335.0 505.5 8% 3. Crop - 1.0 1.2 8.7 50.7 16.5 18.0 96.1 2% 4. SWC - - 49.0 63.4 42.9 20.0 25.0 200.3 3% 5. WRD - - 467.6 938.6 1,015.9 210.0 175.0 2,807.0 45% 6. Livestock - 8.5 3.9 24.5 42.8 2.5 10.0 92.1 1% 7. Forestry - 8.9 1.4 18.0 23.7 4.0 5.0 61.0 1% 8. Migration Support - - - - - - - - 0%
Subtotal 7.4 22.1 546.1 1,154.0 1,204.4 312.5 577.5 3,824.0 62%
Other Development CostsSubtotal - - - - - - - - 0%
Total B 7.4 22.1 546.1 1,154.0 1,204.4 312.5 577.5 3,824.0 62%
Total A + B 266.9 247.2 764.5 1,554.3 1,630.2 739.0 988.5 6,190.7 100%
Source: IFFDC Pratapgarh Coordination Office - Rajasthan.
DFIDI = Department for International Development (India).PPG = Participatory Planning and Group Formation.VOD = Village Organisation and Development.SWC = Soil and Water Conservation.WRD = Water Resource Development.
Total

Table AN12.15.5
Cost Head / Subhead
A. Administration CostsIFFDC Head QuartersDFIDIPratapgarh Coordination Office
Total A
B. Development CostsComponent A 1. PPG 2. VOD 3. Crop 4. SWC 5. WRD 6. Livestock 7. Forestry 8. Migration Support
Subtotal
Other Development CostsSubtotal
Total B
Total A + B
Source:
DFIDI = Department for International Development (India).PPG = Participatory Planning and Group Formation.VOD = Village Organisation and Development.SWC = Soil and Water Conservation.WRD = Water Resource Development.
IFFDC - Rajasthan - Pratapgarh: Village Chhayan: Costs - Economic (Rs'000).
1999/00 2000/01 2001/02 2002/03 2003/04 2004/05 2005/06CF SCF Actual Actual Actual Actual Actual Budget Budget (Rs'000) (%)
0.90 1.00 95.4 41.6 42.5 76.2 48.4 42.5 42.5 389.2 8%1.00 1.00 35.9 71.4 26.9 63.2 47.4 54.7 39.2 338.6 7%0.90 1.00 105.9 96.7 129.8 227.2 292.1 292.1 292.1 1,436.0 29%
237.1 209.8 199.3 366.6 388.0 389.3 373.8 2,163.9 44%
0.90 1.00 6.7 3.3 9.6 15.5 5.7 6.3 8.6 55.8 1%0.90 1.00 - - 11.2 75.3 19.8 47.3 301.5 454.9 9%0.90 1.00 - 0.9 1.1 7.8 45.6 14.9 16.2 86.5 2%0.90 0.75 - - 33.1 42.8 29.0 13.5 16.9 135.2 3%0.90 0.75 - - 315.6 633.5 685.7 141.8 118.1 1,894.7 38%0.90 1.00 - 7.6 3.5 22.0 38.5 2.3 9.0 82.9 2%0.90 1.00 - 8.0 1.2 16.2 21.4 3.6 4.5 54.9 1%0.90 1.00 - - - - - - - - 0%
6.7 19.9 375.3 813.2 845.7 229.5 474.8 2,764.9 56%
0.90 1.00 - - - - - - - - 0%6.7 19.9 375.3 813.2 845.7 229.5 474.8 2,764.9 56%
243.8 229.6 574.5 1,179.8 1,233.7 618.8 848.6 4,928.8 100%
Cost Benefit Analysis (CBA) Study Estimate Jan 2005.
TotalConversion Factors

Table AN12.15.6 IFFDC - Rajesthan - Pratapgarh: Village Chhayan: VOD Household Assumptions.
Without \ With Project UnitsYear 1 Year 2 Year 3(Rs) (Rs) (Rs)
Development Activity:Village Organisation and Development
Before / Without Project Situation:
A. Self Help Groups (SHGs)Assumption Sum Zero Zero Zero - - -
B. Drudgery ReductionAssumption Sum Zero Zero Zero
Total Without Project Benefits - - -
After / With Project Situation:
A. Self Help Groups (SHGs)Assumptions
Average Saving / Household Rs 2,463 Households / Village No 60 Present Group Deposits Rs'000 147.8 147.8 152.2 156.8 Annual Savings Increase % 3%Deposit on Loan to Members % 95%SHG Interest Income % / Year 15%Assumed Benefit Rs'000 21.1 21.7 22.3
B. Drudgery ReductionAssumptions
Hours Saved / Day / Household No 1.0 Number of Days / Year / Household No 200 Days / Year / Household (8hrs/day) No 25.0 Households / Village No 60 Day Equivalent / Village No 1,500 Economic Value per Day (Rs/day) 25 Assumed Benefit Rs'000 37.5 37.5 37.5
Total With Project Benefits Rs'000 58.6 59.2 59.8
Incremental Benefits Rs'000 58.6 59.2 59.8
Source: Cost Benefit Analysis (CBA) Study Estimate Jan 2005.VOD = Village Organisation and Development.Participating households per village: Moti Kheri 60
Assumptions Benefits

Table AN12.15.6
Without \ With Project
Development Activity:Village Organisation and Development
Before / Without Project Situation:
A. Self Help Groups (SHGs)Assumption
B. Drudgery ReductionAssumption
Total Without Project Benefits
After / With Project Situation:
A. Self Help Groups (SHGs)Assumptions
Average Saving / HouseholdHouseholds / VillagePresent Group DepositsAnnual Savings IncreaseDeposit on Loan to MembersSHG Interest Income Assumed Benefit
B. Drudgery ReductionAssumptions
Hours Saved / Day / HouseholdNumber of Days / Year / HouseholdDays / Year / Household (8hrs/day)Households / VillageDay Equivalent / VillageEconomic Value per DayAssumed Benefit
Total With Project Benefits
Incremental Benefits
Source:VOD = Village Organisation and Development.Participating households per village: Moti Kheri
IFFDC - Rajesthan - Pratapgarh: Village Chhayan: Incremental VOD Benefit Stream (Rs'000).
Year 1 Year 2 Year 3 Year 4 Year 5 Year 6 Year 7 Year 8 Year 9 Year 101999/00 2000/01 2001/02 2002/03 2003/04 2004/05 2005/06 2006/07 2007/08 2008/09
- - - - - - - - - -
- - - 147.8 152.2 156.8 161.5 166.4 171.3 176.5
- - - 21.1 21.7 22.3 23.0 23.7 24.4 25.1
- - - 37.5 37.5 37.5 37.5 37.5 37.5 37.5
- - - 58.6 59.2 59.8 60.5 61.2 61.9 62.6
- - - 58.6 59.2 59.8 60.5 61.2 61.9 62.6
Cost Benefit Analysis (CBA) Study Estimate Jan 2005.
Benefit Streams (Rs '000)

Table AN12.15.7 IFFDC - Rajesthan - Pratapgarh: Village Chhayan: Household Crop Net Margin Assumptions.
Without \ With Project UnitsYear 1 Year 2 Year 3
(Rs/HH) (Rs/HH) (Rs/HH)
Development Activity:Crop Technology, SWC and WRD
Before / Without Project Situation:Assumptions
Households (HHs) No 60 Crop Adoption Assumptions 100% 100% 100%
Kharif Crop Net Margin Rs/HH 1,510.0 1,510.0 1,510.0
Rabi Crop Net Margin Rs/HH 282.3 282.3 282.3 Total Without Project Benefits Rs/HH 1,792.3 1,792.3 1,792.3
After / With Project Situation:Assumptions
Households (HHs) No 60 Crop Adoption Assumptions 100% 100% 100%
Kharif Crop Net Margin Rs/HH 5,114.3 5,114.3 5,114.3
Rabi Crop Net Margin Rs/HH 1,306.0 1,306.0 1,306.0 Total With Project Benefits Rs/HH 6,420.3 6,420.3 6,420.3
Incremental Benefits Rs/HH 4,627.9 4,627.9 4,627.9
Source: Cost Benefit Analysis (CBA) Study Estimate Jan 2005.
BenefitsAssumptions

Table AN12.15.7
Without \ With Project
Development Activity:Crop Technology, SWC and WRD
Before / Without Project Situation:Assumptions
Households (HHs)Crop Adoption Assumptions
Kharif Crop Net Margin
Rabi Crop Net MarginTotal Without Project Benefits
After / With Project Situation:Assumptions
Households (HHs)Crop Adoption Assumptions
Kharif Crop Net Margin
Rabi Crop Net MarginTotal With Project Benefits
Incremental Benefits
Source:
IFFDC - Rajesthan - Pratapgarh: Village Chhayan: Incremental Crop Benefit Stream (Rs'000).
Year 1 Year 2 Year 3 Year 4 Year 5 Year 6 Year 7 Year 8 Year 9 Year 101999/00 2000/01 2001/02 2002/03 2003/04 2004/05 2005/06 2006/07 2007/08 2008/09
- - - - 90.6 90.6 90.6 90.6 90.6 90.6
- - - - 16.9 16.9 16.9 16.9 16.9 16.9 - - - - 107.5 107.5 107.5 107.5 107.5 107.5
- - - - 306.9 306.9 306.9 306.9 306.9 306.9
- - - - 78.4 78.4 78.4 78.4 78.4 78.4 - - - - 385.2 385.2 385.2 385.2 385.2 385.2
- - - - 277.7 277.7 277.7 277.7 277.7 277.7
Cost Benefit Analysis (CBA) Study Estimate Jan 2005.
Benefit Streams (Rs '000)

Table AN12.15.8 IFFDC - Rajesthan - Pratapgarh: Village Chhayan: Household Livestock Net Margin Assumption
Without \ With Project UnitsLivestock Year 1 Year 2 Year 3
(Rs) (Rs) (Rs)
Development Activity:Livestock
Before / Without Project Situation:Assumptions
Households (HHs) No 60 Annual Livestock Net Margin Rs/HH
Total Without Project Benefits 1,263.6 1,263.6 1,263.6
After / With Project Situation:
Development Activity:Assumptions
Households (HHs) No 60 Adoption Assumptions Percent 55% 78% 100%
Annual Livestock Net Margin Rs/HHTotal With Project Benefits 1,732.0 2,440.5 3,149.1
Incremental Benefits Rs/HH 468.4 1,176.9 1,885.4
Source: Cost Benefit Analysis (CBA) Study Estimate Jan 2005.
BenefitsAssumptions

Table AN12.15.8
Without \ With ProjectLivestock
Development Activity:Livestock
Before / Without Project Situation:Assumptions
Households (HHs)Annual Livestock Net Margin
Total Without Project Benefits
After / With Project Situation:
Development Activity:Assumptions
Households (HHs)Adoption Assumptions
Annual Livestock Net MarginTotal With Project Benefits
Incremental Benefits
Source:
IFFDC - Rajesthan - Pratapgarh: Village Chhayan: Incremental Livestock Benefit Stream (Rs'000).
Year 1 Year 2 Year 3 Year 4 Year 5 Year 6 Year 7 Year 8 Year 9 Year 101999/00 2000/01 2001/02 2002/03 2003/04 2004/05 2005/06 2006/07 2007/08 2008/09
- - - - 75.8 75.8 75.8 75.8 75.8 75.8
- - - - 103.9 146.4 188.9 188.9 188.9 188.9
- - - 28.1 70.6 113.1 113.1 113.1 113.1 113.1
Cost Benefit Analysis (CBA) Study Estimate Jan 2005.
Benefit Streams (Rs '000)

Table AN12.15.9 IFFDC - Rajesthan - Pratapgarh: Village Chhayan: Forestry Benefit Assumptions.
Without \ With Project UnitsForestry Year 1 Year 2 Year 3
(Rs) (Rs) (Rs)
Development Activity:Forestry
Before / Without Project Situation:AssumptionsHouseholds (HHs) No 60 Annual Forestry Net Margin Rs/HH
Total Without Project Benefits - - -
After / With Project Situation:AssumptionsHouseholds (HHs) No 60 Adoption Assumptions Percent 55% 78% 100%Annual Forestry Net Margin Rs/HH
Total With Project Benefits 165.0 234.0 300.0
Incremental Benefits Rs/HH 165.0 234.0 300.0
Source: Cost Benefit Analysis (CBA) Study Estimate Jan 2005.
BenefitsAssumptions

Table AN12.15.9
Without \ With ProjectForestry
Development Activity:Forestry
Before / Without Project Situation:AssumptionsHouseholds (HHs)Annual Forestry Net Margin
Total Without Project Benefits
After / With Project Situation:AssumptionsHouseholds (HHs)Adoption AssumptionsAnnual Forestry Net Margin
Total With Project Benefits
Incremental Benefits
Source:
IFFDC - Rajesthan - Pratapgarh: Village Chhayan: Incremental Forestry Benefit Stream (Rs'000).
Year 1 Year 2 Year 3 Year 4 Year 5 Year 6 Year 7 Year 8 Year 9 Year 101999/00 2000/01 2001/02 2002/03 2003/04 2004/05 2005/06 2006/07 2007/08 2008/09
- - - - - - - - - -
- - - 9.9 14.0 18.0 18.0 18.0 18.0 18.0
- - - 9.9 14.0 18.0 18.0 18.0 18.0 18.0
Cost Benefit Analysis (CBA) Study Estimate Jan 2005.
Benefit Streams (Rs '000)

Table AN12.15.10 IFFDC - Rajesthan - Pratapgarh: Village Chhayan: Migration Support Benefit Assumptions.
Without \ With ProjectYear 1 Year 2 Year 3(Rs) (Rs) (Rs)
Development Activity:Migration Support
Before / Without Project Situation:Assumptions
Economic Value per Day Rs/day 25.0 Days / Month / Household No - Economic Value per Month Rs/month - Months Migration / Year Months 4.0 Economic Value per Household Rs/HH - Households per Village No 60 Households per Village Migrating Percent 45%
Total Without Project Benefits Rs/Village - - -
After / With Project Situation:Assumptions
Economic Value per Day \1 Rs/day 25.0 30% 32.5 Days / Month / Household No - 30% - Economic Value per Month Rs/month - - Months Migration / Year Months 4.0 -20% 3.2 Economic Value per Household Rs/HH - - Households per Village No 60 60 Households per Village Migrating Percent 45% -20% 36%
Subtotal Migration Income Rs/Village - - -
Other Income Sum (Rs) - - - - - -
Total With Project Benefits Rs/Village - - -
Incremental Benefits Rs/Village - - -
Source: Cost Benefit Analysis (CBA) Study Estimate Jan 2005.
1\ Financial Wages (Rs/day):Skill Labour - Rs 160
Casual Labour :Male - Rs 40Female - Rs 30
BenefitsAssumptions

Table AN12.15.10
Without \ With Project
Development Activity:Migration Support
Before / Without Project Situation:Assumptions
Economic Value per Day Days / Month / Household Economic Value per Month Months Migration / Year Economic Value per Household Households per Village Households per Village Migrating
Total Without Project Benefits
After / With Project Situation:Assumptions
Economic Value per Day \1Days / Month / Household Economic Value per Month Months Migration / Year Economic Value per Household Households per Village Households per Village Migrating
Subtotal Migration Income
Other Income
Total With Project Benefits
Incremental Benefits
Source:
1\ Financial Wages (Rs/day):Skill Labour - Rs 160
Casual Labour :Male - Rs 40Female - Rs 30
IFFDC - Rajesthan - Pratapgarh: Village Chhayan: Incremental Migration Support Benefit Stream (Rs'000).
Year 1 Year 2 Year 3 Year 4 Year 5 Year 6 Year 7 Year 8 Year 9 Year 101999/00 2000/01 2001/02 2002/03 2003/04 2004/05 2005/06 2006/07 2007/08 2008/09
- - - - - - - - - -
- - - - - - - - - -
- - - - - - - - - -
- - - - - - - - - -
- - - - - - - - - -
Cost Benefit Analysis (CBA) Study Estimate Jan 2005.
Benefit Streams (Rs '000)

Table AN12.15.11 IFFDC - Rajesthan - Pratapgarh: Village Chhayan: Weighted Household Crop Net Margin Summary (Rs/Household).
Item WBR(%) Khalif Rabi Total Khalif Rabi Total Khalif Rabi Total
Phase IIWell Being Ranking - Very Poor
Household Net Margin (Rs) 30.0% 834.6 102.5 937.1 1,849.8 1,067.8 2,917.6 1,015.2 965.3 1,980.5 Well Being Ranking - Very Poor
Household Net Margin (Rs) 31.0% 637.7 - 637.7 4,803.0 220.7 5,023.7 4,165.3 220.7 4,386.0 Well Being Ranking - Poor
Household Net Margin (Rs) 26.0% 994.0 89.3 1,083.3 3,711.4 2,508.3 6,219.6 2,717.4 2,419.0 5,136.4 Well Being Ranking - Better Off
Household Net Margin (Rs) 13.0% 6,180.9 1,756.7 7,937.5 16,195.9 2,039.3 18,235.2 10,015.0 282.7 10,297.7
Well Being Ranking - WeightedHousehold Net Margin (Rs) 100% 1,510.0 282.3 1,792.3 5,114.3 1,306.0 6,420.3 3,604.3 1,023.7 4,627.9
Phase I \1Well Being Ranking - Very Poor
Household Net Margin (Rs) 30.0% 436.3 267.5 703.8 3,866.5 1,668.8 5,535.3 3,430.3 1,401.3 4,831.5 Well Being Ranking - Very Poor
Household Net Margin (Rs) 31.0% 485.8 657.5 1,143.3 10,136.0 5,690.3 15,826.3 9,650.3 5,032.8 14,683.0 Well Being Ranking - Poor
Household Net Margin (Rs) 26.0% 986.3 3,385.0 4,371.3 9,457.5 5,195.0 14,652.5 8,471.3 1,810.0 10,281.3 Well Being Ranking - Better Off
Household Net Margin (Rs) 13.0% 2,778.0 937.0 3,715.0 4,915.0 9,560.0 14,475.0 2,137.0 8,623.0 10,760.0
Well Being Ranking - WeightedHousehold Net Margin (Rs) 100% 899.0 1,286.0 2,185.0 7,400.0 4,858.1 12,258.1 6,501.0 3,572.1 10,073.1
Source: IFFDC Pratapgarh Coordination Office - Rajasthan.WBR = IFFDC Household Well Being Ranking. Survey figures adjusted to Village Profile WBR.\1 GVT - Madhya Pradesh - Phase I: Village Naganwat Choti: Weighted Household Crop Net Margin Summary.
Before / Without Project After / With Project Increment

Table AN12.15.12 IFFDC - Rajesthan - Pratapgarh: Village Chhayan: Weighted Household Crop Net Margin Sensitivity Analysis (Rs/Household).
Item EIRRKhalif Rabi Total Khalif Rabi Total Khalif Rabi Total
Development Activity:Crop Technology, SWC and WRD
Weighted Net Margin (Phase II)Household Net Margin (Rs) 1,510.0 282.3 1,792.3 5,114.3 1,306.0 6,420.3 3,604.3 1,023.7 4,627.9 Incremental Benefit (Phase II / Phase I) 46%
Base Case AssumptionsHousehold Net Margin (Rs) 1,510.0 282.3 1,792.3 5,114.3 1,306.0 6,420.3 3,604.3 1,023.7 4,627.9 Incremental Benefit (Phase II / Phase I) 46%Sensitivity Increase (%) 0%Development Acivity N/AOverall Village N/A
Sensitivity AssumptionsHousehold Net Margin (Rs) 1,510.0 282.3 1,792.3 13,808.5 3,526.2 17,334.7 12,298.5 3,243.9 15,542.4 Incremental Benefit (Phase II / Phase I) 154%Sensitivity Increase (%) 0%Development Acivity 24%Overall Village 12%
Weighted Net Margin (Phase I)Household Net Margin (Rs) 899.0 1,286.0 2,185.0 7,400.0 4,858.1 12,258.1 6,501.0 3,572.1 10,073.1
Source: IFFDC Pratapgarh Coordination Office - Rajasthan.EIRR = Economic Internal Rate of Return (rate at which NPV equal to zero).
Before / Without Project After / With Project Increment
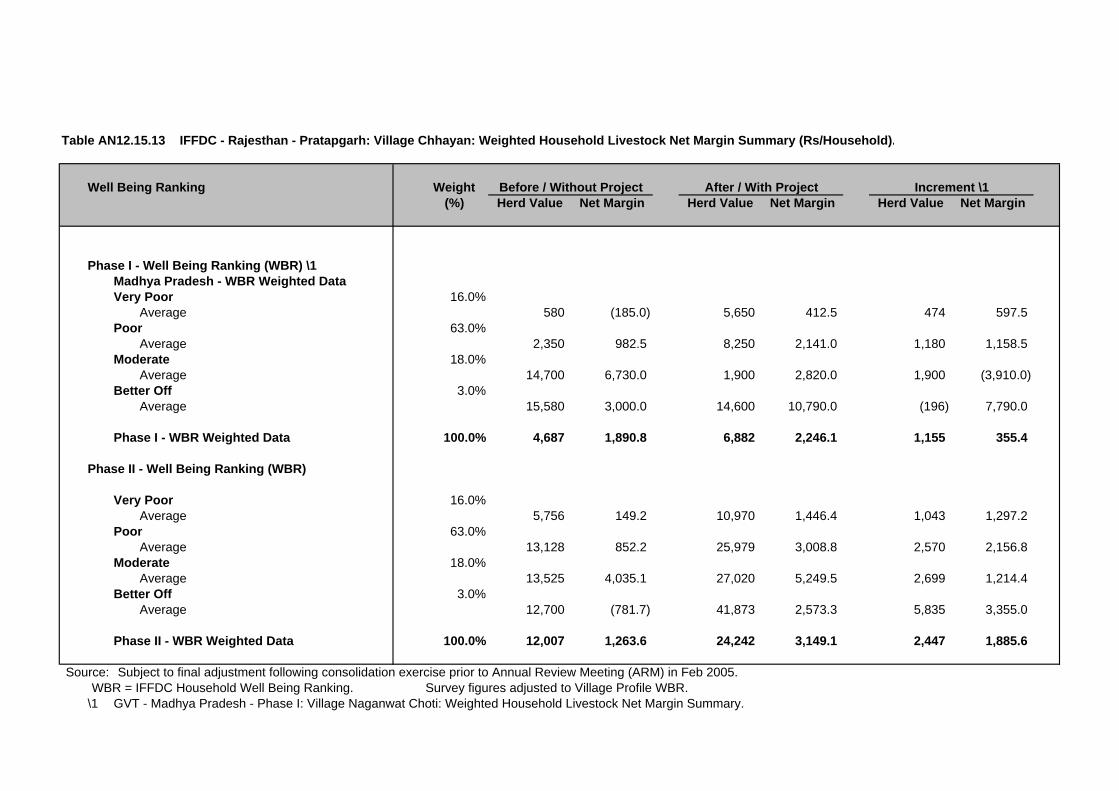
Table AN12.15.13 IFFDC - Rajesthan - Pratapgarh: Village Chhayan: Weighted Household Livestock Net Margin Summary (Rs/Household).
Well Being Ranking Weight(%) Herd Value Net Margin Herd Value Net Margin Herd Value Net Margin
Phase I - Well Being Ranking (WBR) \1Madhya Pradesh - WBR Weighted DataVery Poor 16.0%
Average 580 (185.0) 5,650 412.5 474 597.5 Poor 63.0%
Average 2,350 982.5 8,250 2,141.0 1,180 1,158.5 Moderate 18.0%
Average 14,700 6,730.0 1,900 2,820.0 1,900 (3,910.0)Better Off 3.0%
Average 15,580 3,000.0 14,600 10,790.0 (196) 7,790.0
Phase I - WBR Weighted Data 100.0% 4,687 1,890.8 6,882 2,246.1 1,155 355.4
Phase II - Well Being Ranking (WBR)
Very Poor 16.0%Average 5,756 149.2 10,970 1,446.4 1,043 1,297.2
Poor 63.0%Average 13,128 852.2 25,979 3,008.8 2,570 2,156.8
Moderate 18.0%Average 13,525 4,035.1 27,020 5,249.5 2,699 1,214.4
Better Off 3.0%Average 12,700 (781.7) 41,873 2,573.3 5,835 3,355.0
Phase II - WBR Weighted Data 100.0% 12,007 1,263.6 24,242 3,149.1 2,447 1,885.6
Source: Subject to final adjustment following consolidation exercise prior to Annual Review Meeting (ARM) in Feb 2005.WBR = IFFDC Household Well Being Ranking. Survey figures adjusted to Village Profile WBR.
\1 GVT - Madhya Pradesh - Phase I: Village Naganwat Choti: Weighted Household Livestock Net Margin Summary.
Before / Without Project After / With Project Increment \1

WIRFP - Phase II - Cost Benefit Analysis Study
Tables AN12.0 Individual Village Cost Benefit Analysis
Tables AN12.0 IFFDC - Rajesthan - Pratapgarh: Village Chhota Mayanga.
Table AN12.16.1 IFFDC - Rajesthan - Pratapgarh: Village Chhota Mayanga: Village Profile.
Table AN12.16.2 IFFDC - Rajesthan - Pratapgarh: Village Chhota Mayanga: Cost Benefit Analysis Summary (Rs'000).Table AN12.16.3 IFFDC - Rajesthan - Pratapgarh: Village Chhota Mayanga: Cost Benefit Analysis Development Activity Summary A (Rs'000).Table AN12.16.4 IFFDC - Rajesthan - Pratapgarh: Village Chhota Mayanga: Cost Benefit Analysis Development Activity Summary B (Rs'000).
Table AN12.16.5 IFFDC - Rajasthan - Pratapgarh: Village Chhota Mayanga: Costs - Financial (Rs'000).IFFDC - Rajasthan - Pratapgarh: Village Chhota Mayanga: Costs - Economic (Rs'000).
Table AN12.16.6 IFFDC - Rajesthan - Pratapgarh: Village Chhota Mayanga: VOD Household Assumptions.IFFDC - Rajesthan - Pratapgarh: Village Chhota Mayanga: Incremental VOD Benefit Stream (Rs'000).
Table AN12.16.7 IFFDC - Rajesthan - Pratapgarh: Village Chhota Mayanga: Household Crop Net Margin Assumptions.IFFDC - Rajesthan - Pratapgarh: Village Chhota Mayanga: Incremental Crop Benefit Stream (Rs'000).
Table AN12.16.8 IFFDC - Rajesthan - Pratapgarh: Village Chhota Mayanga: Household Livestock Net Margin Assumptions.IFFDC - Rajesthan - Pratapgarh: Village Chhota Mayanga: Incremental Livestock Benefit Stream (Rs'000).
Table AN12.16.9 IFFDC - Rajesthan - Pratapgarh: Village Chhota Mayanga: Forestry Benefit Assumptions.IFFDC - Rajesthan - Pratapgarh: Village Chhota Mayanga: Incremental Forestry Benefit Stream (Rs'000).
Table AN12.16.10 IFFDC - Rajesthan - Pratapgarh: Village Chhota Mayanga: Migration Support Benefit Assumptions.IFFDC - Rajesthan - Pratapgarh: Village Chhota Mayanga: Incremental Migration Support Benefit Stream (Rs'000).
Table AN12.16.11 IFFDC - Rajesthan - Pratapgarh: Village Chhota Mayanga: Weighted Household Crop Net Margin Summary (Rs/Household).Table AN12.16.12 IFFDC - Rajesthan - Pratapgarh: Village Chhota Mayanga: Weighted Household Crop Net Margin Sensitivity Analysis (Rs/Household).
Table AN12.16.13 IFFDC - Rajesthan - Pratapgarh: Village Chhota Mayanga: Weighted Household Livestock Net Margin Summary (Rs/Household).

Table AN12.16.1 IFFDC - Rajesthan - Pratapgarh: Village Chhota Mayanga: Village Profile.
Village Profile \1
A. Background E. Well Being Ranking (No Households)Village Name Chhota Mayanga Very Poor 5 20.8%District Pratapgarh Poor 10 41.7%State Rajasthan Moderate 4 16.7%
Better Off 5 20.8%B. Participatory Planning Process (PPP) Total 24 100%
Village entry Oct-00PRA Jan-01CPA Jan-01 F. Land Resource (ha)
Total Area 104 C. Infrastructure Revenue Land (unused) 38
Hand Pumps (no) 2 Forest Area - Revenue 17 Wells (no) 12 Pasture Land 11 Linked by Road 1.5 km Arable Land 38 Electrification Yes 104 School Primary
G. LivestockD. Demographic Data Oxen N/A
Households (no) 49 Cows N/AParticipating Households 31 Buffalo N/APopulation (Adults) 225 Goats N/A
Adults: Poultry N/A Male 124 Female 101 H. Self Help Groups (No Households)Children: 1 Group 1 17 Boys N/A 2 Group 2 17 Girls N/A 3 Group 3 17
4 Group 4 - Total Memberhip 51
Source: IFFDC Pratapgarh Coordination Office - Rajasthan.\1 Subject to final adjustment following consolidation exercise prior to Annual Review Meeting (ARM) in Feb 2005.

Table AN12.16.2 IFFDC - Rajesthan - Pratapgarh: Village Chhota Mayanga: Cost Benefit Analysis Summary (Rs'000).
Administration Costs / Development Activity EIRR \1 Year 1 Year 2 Year 3 Year 4 Year 5 Year 6 Year 7 Year 8 Year 9 Year 10(10%) (%) 1999/00 2000/01 2001/02 2002/03 2003/04 2004/05 2005/06 2006/07 2007/08 2008/09
A. Administration CostsTotal A N/A (1,449) 87% 237.1 209.8 199.3 366.6 388.0 389.3 373.8 37.4 37.4 37.4
B. Development Intervention Component A 1. PPGF
Net Incremental Benefits N/A (19) 1% - (1.2) (4.3) (10.9) (0.6) (6.3) (6.4) (0.7) (0.7) (0.7)
2. VODNet Incremental Benefits 23% 26 -2% - (4.5) (15.6) 19.1 27.6 20.2 (158.2) 25.1 25.3 25.5
3/5.Crop Technology, SWC and WRDNet Incremental Benefits -5% (517) 31% - (47.1) (107.0) (365.3) (501.1) (41.3) (52.6) 54.3 54.3 54.3
6. LivestockNet Incremental Benefits 104% 272 -16% - - (2.5) (10.2) (6.6) 14.4 43.1 88.7 88.7 88.7
7. ForestryNet Incremental Benefits 50% 27 -2% - (4.3) (0.9) 0.2 1.0 7.4 7.3 8.1 8.1 8.1
8. Migration SupportNet Incremental Benefits N/A - 0% - - - - - - - - - -
SummaryNet Incremental Benefits N/A (1,660) 100% (237.1) (266.9) (329.6) (733.7) (867.8) (394.8) (540.7) 138.2 138.4 138.6
Sensitivity AnalysisAnalysis Period
12 Years N/A (1,837)20 Years (Base Case) N/A (1,660)25 Years -2% (1,608)30 Years 0% (1,579)
Costs - AdministrationInvestment Costs Decreased by 20 percent -4% (1,370)
Costs - Administration and DevelopmentRecurrent Costs Increasede by 20 percent N/A (1,853)
Benefits - Crop, SWC and WRDCrop Benefits Increased by 20 percent -2% (1,397)Livestock Benefits Increased by 20 percent -4% (1,563)
Source: Cost Benefit Analysis (CBA) Study Estimate Jan 2005.\1 EIRR = Economic Internal Rate of Return (rate at which NPV equal to zero).\2 NPV = Net Present Value of net incremental benefits at 12% (indicative opportunity cost of capital for rural development projects in India).
N/A = Not analysed as EIRR negative.
NPV \2
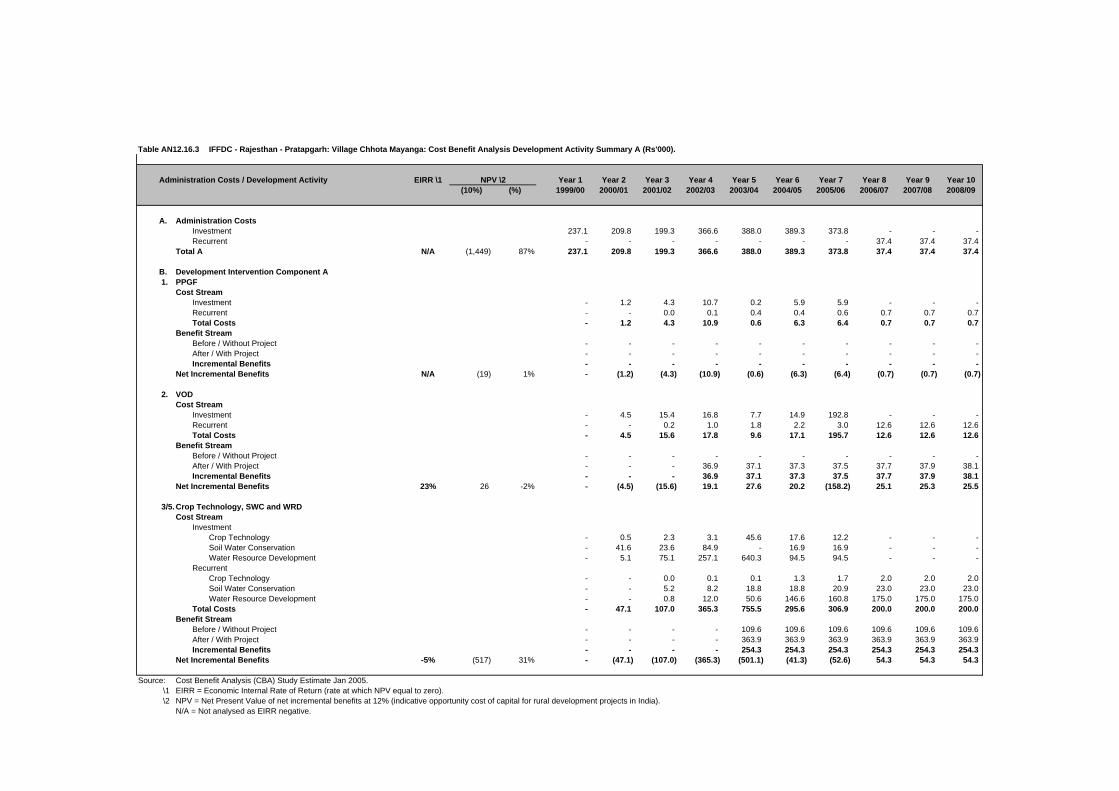
Table AN12.16.3 IFFDC - Rajesthan - Pratapgarh: Village Chhota Mayanga: Cost Benefit Analysis Development Activity Summary A (Rs'000).
Administration Costs / Development Activity EIRR \1 Year 1 Year 2 Year 3 Year 4 Year 5 Year 6 Year 7 Year 8 Year 9 Year 10(10%) (%) 1999/00 2000/01 2001/02 2002/03 2003/04 2004/05 2005/06 2006/07 2007/08 2008/09
A. Administration CostsInvestment 237.1 209.8 199.3 366.6 388.0 389.3 373.8 - - - Recurrent - - - - - - - 37.4 37.4 37.4
Total A N/A (1,449) 87% 237.1 209.8 199.3 366.6 388.0 389.3 373.8 37.4 37.4 37.4
B. Development Intervention Component A 1. PPGF
Cost StreamInvestment - 1.2 4.3 10.7 0.2 5.9 5.9 - - - Recurrent - - 0.0 0.1 0.4 0.4 0.6 0.7 0.7 0.7 Total Costs - 1.2 4.3 10.9 0.6 6.3 6.4 0.7 0.7 0.7
Benefit StreamBefore / Without Project - - - - - - - - - - After / With Project - - - - - - - - - - Incremental Benefits - - - - - - - - - -
Net Incremental Benefits N/A (19) 1% - (1.2) (4.3) (10.9) (0.6) (6.3) (6.4) (0.7) (0.7) (0.7)
2. VODCost Stream
Investment - 4.5 15.4 16.8 7.7 14.9 192.8 - - - Recurrent - - 0.2 1.0 1.8 2.2 3.0 12.6 12.6 12.6 Total Costs - 4.5 15.6 17.8 9.6 17.1 195.7 12.6 12.6 12.6
Benefit StreamBefore / Without Project - - - - - - - - - - After / With Project - - - 36.9 37.1 37.3 37.5 37.7 37.9 38.1 Incremental Benefits - - - 36.9 37.1 37.3 37.5 37.7 37.9 38.1
Net Incremental Benefits 23% 26 -2% - (4.5) (15.6) 19.1 27.6 20.2 (158.2) 25.1 25.3 25.5
3/5.Crop Technology, SWC and WRDCost Stream
InvestmentCrop Technology - 0.5 2.3 3.1 45.6 17.6 12.2 - - - Soil Water Conservation - 41.6 23.6 84.9 - 16.9 16.9 - - - Water Resource Development - 5.1 75.1 257.1 640.3 94.5 94.5 - - -
RecurrentCrop Technology - - 0.0 0.1 0.1 1.3 1.7 2.0 2.0 2.0 Soil Water Conservation - - 5.2 8.2 18.8 18.8 20.9 23.0 23.0 23.0 Water Resource Development - - 0.8 12.0 50.6 146.6 160.8 175.0 175.0 175.0
Total Costs - 47.1 107.0 365.3 755.5 295.6 306.9 200.0 200.0 200.0 Benefit Stream
Before / Without Project - - - - 109.6 109.6 109.6 109.6 109.6 109.6 After / With Project - - - - 363.9 363.9 363.9 363.9 363.9 363.9 Incremental Benefits - - - - 254.3 254.3 254.3 254.3 254.3 254.3
Net Incremental Benefits -5% (517) 31% - (47.1) (107.0) (365.3) (501.1) (41.3) (52.6) 54.3 54.3 54.3
Source: Cost Benefit Analysis (CBA) Study Estimate Jan 2005.\1 EIRR = Economic Internal Rate of Return (rate at which NPV equal to zero).\2 NPV = Net Present Value of net incremental benefits at 12% (indicative opportunity cost of capital for rural development projects in India).
N/A = Not analysed as EIRR negative.
NPV \2

Table AN12.16.4 IFFDC - Rajesthan - Pratapgarh: Village Chhota Mayanga: Cost Benefit Analysis Development Activity Summary B (Rs'000).
Administration Costs / Development Activity EIRR \1 Year 1 Year 2 Year 3 Year 4 Year 5 Year 6 Year 7 Year 8 Year 9 Year 10(10%) (%) 1999/00 2000/01 2001/02 2002/03 2003/04 2004/05 2005/06 2006/07 2007/08 2008/09
6. LivestockCost Stream
Investment - - 2.5 10.0 5.3 6.8 12.2 - - - Recurrent - - - 0.3 1.3 1.8 2.5 3.7 3.7 3.7 Total Costs - - 2.5 10.2 6.6 8.5 14.6 3.7 3.7 3.7
Benefit StreamBefore / Without Project - - - - - 61.9 61.9 61.9 61.9 61.9 After / With Project - - - - - 84.9 119.6 154.3 154.3 154.3 Incremental Benefits - - - - - 22.9 57.7 92.4 92.4 92.4
Net Incremental Benefits 104% 272 -16% - - (2.5) (10.2) (6.6) 14.4 43.1 88.7 88.7 88.7
7. ForestryCost Stream
Investment - 4.3 0.5 4.7 5.7 0.9 0.9 - - - Recurrent - - 0.4 0.5 1.0 1.5 1.6 1.7 1.7 1.7 Total Costs - 4.3 0.9 5.2 6.7 2.4 2.5 1.7 1.7 1.7
Benefit StreamBefore / Without Project - - - - - - - - - - After / With Project - - - 5.4 7.6 9.8 9.8 9.8 9.8 9.8 Incremental Benefits - - - 5.4 7.6 9.8 9.8 9.8 9.8 9.8
Net Incremental Benefits 50% 27 -2% - (4.3) (0.9) 0.2 1.0 7.4 7.3 8.1 8.1 8.1
8. Migration SupportCost Stream
Investment - - - - - - - - - - Recurrent - - - - - - - - - - Total Costs - - - - - - - - - -
Benefit StreamBefore / Without Project - - - - - - - - - - After / With Project - - - - - - - - - - Incremental Benefits - - - - - - - - - -
Net Incremental Benefits N/A - 0% - - - - - - - - - - EIRR
SummaryCost Stream
Investment 237.1 266.9 322.9 753.9 1,093.0 546.6 709.0 - - - Recurrent - - 6.7 22.1 73.9 172.6 191.0 256.1 256.1 256.1 Total Costs 237.1 266.9 329.6 776.0 1,166.9 719.2 900.0 256.1 256.1 256.1
Benefit StreamBefore / Without Project - - - - 109.6 171.5 171.5 171.5 171.5 171.5 After / With Project - - - 42.3 408.7 495.9 530.8 565.7 566.0 566.2 Incremental Benefits - - - 42.3 299.1 324.4 359.3 394.2 394.5 394.7
Net Incremental Benefits N/A (1,660) 100% (237.1) (266.9) (329.6) (733.7) (867.8) (394.8) (540.7) 138.2 138.4 138.6
Source: Cost Benefit Analysis (CBA) Study Estimate Jan 2005.
NPV \2
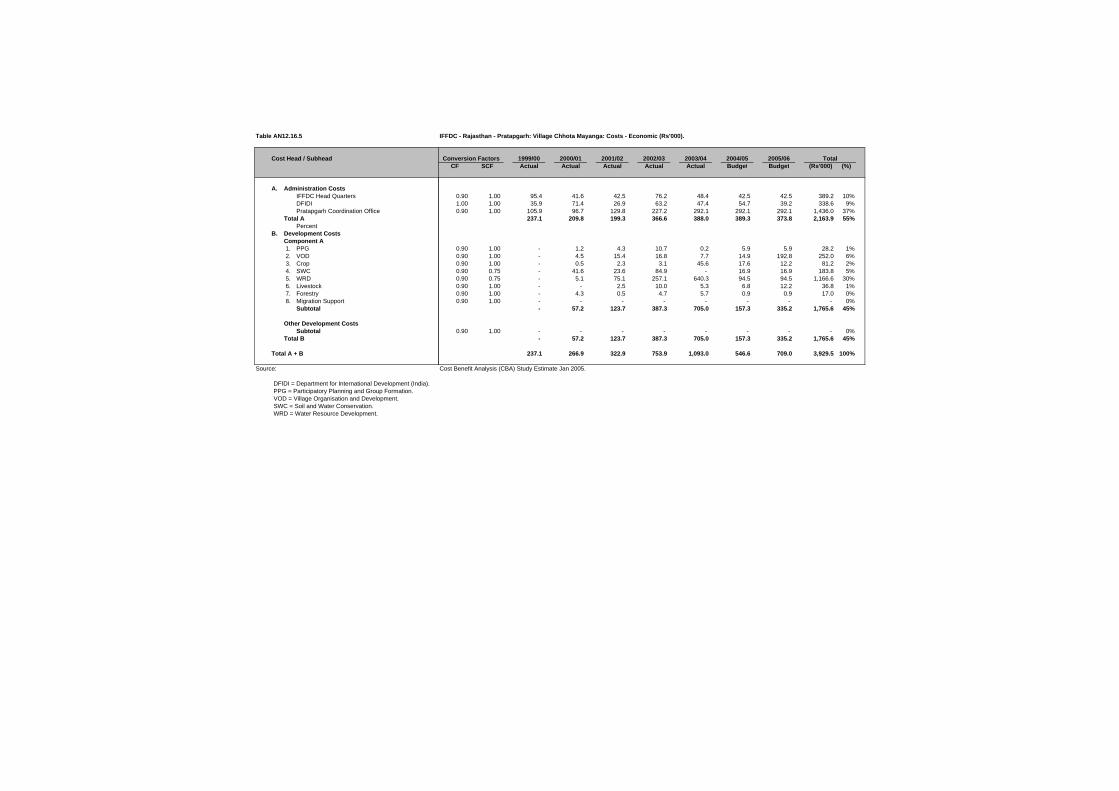
Table AN12.16.5
Cost Head / Subhead
A. Administration CostsIFFDC Head QuartersDFIDIPratapgarh Coordination Office
Total APercent
B. Development CostsComponent A 1. PPG 2. VOD 3. Crop 4. SWC 5. WRD 6. Livestock 7. Forestry 8. Migration Support
Subtotal
Other Development CostsSubtotal
Total B
Total A + B
Source:
DFIDI = Department for International Development (India).PPG = Participatory Planning and Group Formation.VOD = Village Organisation and Development.SWC = Soil and Water Conservation.WRD = Water Resource Development.
IFFDC - Rajasthan - Pratapgarh: Village Chhota Mayanga: Costs - Economic (Rs'000).
1999/00 2000/01 2001/02 2002/03 2003/04 2004/05 2005/06CF SCF Actual Actual Actual Actual Actual Budget Budget (Rs'000) (%)
0.90 1.00 95.4 41.6 42.5 76.2 48.4 42.5 42.5 389.2 10%1.00 1.00 35.9 71.4 26.9 63.2 47.4 54.7 39.2 338.6 9%0.90 1.00 105.9 96.7 129.8 227.2 292.1 292.1 292.1 1,436.0 37%
237.1 209.8 199.3 366.6 388.0 389.3 373.8 2,163.9 55%
0.90 1.00 - 1.2 4.3 10.7 0.2 5.9 5.9 28.2 1%0.90 1.00 - 4.5 15.4 16.8 7.7 14.9 192.8 252.0 6%0.90 1.00 - 0.5 2.3 3.1 45.6 17.6 12.2 81.2 2%0.90 0.75 - 41.6 23.6 84.9 - 16.9 16.9 183.8 5%0.90 0.75 - 5.1 75.1 257.1 640.3 94.5 94.5 1,166.6 30%0.90 1.00 - - 2.5 10.0 5.3 6.8 12.2 36.8 1%0.90 1.00 - 4.3 0.5 4.7 5.7 0.9 0.9 17.0 0%0.90 1.00 - - - - - - - - 0%
- 57.2 123.7 387.3 705.0 157.3 335.2 1,765.6 45%
0.90 1.00 - - - - - - - - 0%- 57.2 123.7 387.3 705.0 157.3 335.2 1,765.6 45%
237.1 266.9 322.9 753.9 1,093.0 546.6 709.0 3,929.5 100%
Cost Benefit Analysis (CBA) Study Estimate Jan 2005.
TotalConversion Factors

Table AN12.16.6 IFFDC - Rajesthan - Pratapgarh: Village Chhota Mayanga: VOD Household Assumptions.
Without \ With Project UnitsYear 1 Year 2 Year 3(Rs) (Rs) (Rs)
Development Activity:Village Organisation and Development
Before / Without Project Situation:
A. Self Help Groups (SHGs)Assumption Sum Zero Zero Zero - - -
B. Drudgery ReductionAssumption Sum Zero Zero Zero
Total Without Project Benefits - - -
After / With Project Situation:
A. Self Help Groups (SHGs)Assumptions
Average Saving / Household Rs 1,429 Households / Village No 49 Present Group Deposits Rs'000 70.0 70.0 72.1 74.3 Annual Savings Increase % 3%Deposits on Loan to Members % 60%SHG Interest Income % / Year 15%Assumed Benefit Rs'000 6.3 6.5 6.7
B. Drudgery ReductionAssumptions
Hours Saved / Day / Household No 1.0 Number of Days / Year / Household No 200 Days / Year / Household (8hrs/day) No 25.0 Households / Village No 49 Day Equivalent / Village No 1,225 Economic Value per Day (Rs/day) 25 Assumed Benefit Rs'000 30.6 30.6 30.6
Total With Project Benefits Rs'000 36.9 37.1 37.3
Incremental Benefits Rs'000 36.9 37.1 37.3
Source: Cost Benefit Analysis (CBA) Study Estimate Jan 2005.VOD = Village Organisation and Development.Participating households per village: C Mayanga 49
Assumptions Benefits
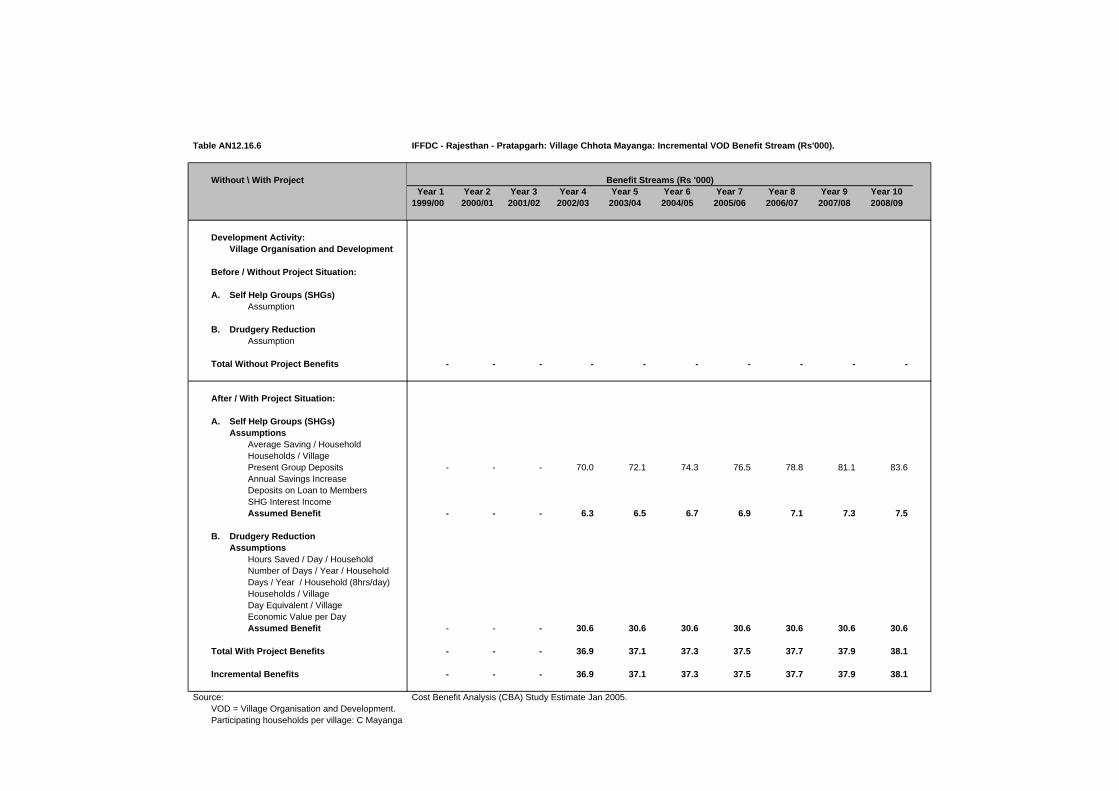
Table AN12.16.6
Without \ With Project
Development Activity:Village Organisation and Development
Before / Without Project Situation:
A. Self Help Groups (SHGs)Assumption
B. Drudgery ReductionAssumption
Total Without Project Benefits
After / With Project Situation:
A. Self Help Groups (SHGs)Assumptions
Average Saving / HouseholdHouseholds / VillagePresent Group DepositsAnnual Savings IncreaseDeposits on Loan to MembersSHG Interest Income Assumed Benefit
B. Drudgery ReductionAssumptions
Hours Saved / Day / HouseholdNumber of Days / Year / HouseholdDays / Year / Household (8hrs/day)Households / VillageDay Equivalent / VillageEconomic Value per DayAssumed Benefit
Total With Project Benefits
Incremental Benefits
Source:VOD = Village Organisation and Development.Participating households per village: C Mayanga
IFFDC - Rajesthan - Pratapgarh: Village Chhota Mayanga: Incremental VOD Benefit Stream (Rs'000).
Year 1 Year 2 Year 3 Year 4 Year 5 Year 6 Year 7 Year 8 Year 9 Year 101999/00 2000/01 2001/02 2002/03 2003/04 2004/05 2005/06 2006/07 2007/08 2008/09
- - - - - - - - - -
- - - 70.0 72.1 74.3 76.5 78.8 81.1 83.6
- - - 6.3 6.5 6.7 6.9 7.1 7.3 7.5
- - - 30.6 30.6 30.6 30.6 30.6 30.6 30.6
- - - 36.9 37.1 37.3 37.5 37.7 37.9 38.1
- - - 36.9 37.1 37.3 37.5 37.7 37.9 38.1
Cost Benefit Analysis (CBA) Study Estimate Jan 2005.
Benefit Streams (Rs '000)

Table AN12.16.7 IFFDC - Rajesthan - Pratapgarh: Village Chhota Mayanga: Household Crop Net Margin Assumpt
Without \ With Project UnitsCrop Technology, SWC and WRD Year 1 Year 2 Year 3
(Rs/HH) (Rs/HH) (Rs/HH)
Development Activity:Crop Technology, SWC and WRD
Before / Without Project Situation:Assumptions
Households (HHs) No 49 Crop Adoption Assumptions 100% 100% 100%
Kharif Crop Net Margin Rs/HH 1,848.2 1,848.2 1,848.2
Rabi Crop Net Margin Rs/HH 388.0 388.0 388.0 Total Without Project Benefits Rs/HH 2,236.3 2,236.3 2,236.3
After / With Project Situation:Assumptions
Households (HHs) No 49 Crop Adoption Assumptions 100% 100% 100%
Kharif Crop Net Margin Rs/HH 6,275.8 6,275.8 6,275.8
Rabi Crop Net Margin Rs/HH 1,151.2 1,151.2 1,151.2 Total With Project Benefits Rs/HH 7,427.0 7,427.0 7,427.0
Incremental Benefits Rs/HH 5,190.7 5,190.7 5,190.7
Source: Cost Benefit Analysis (CBA) Study Estimate Jan 2005.
BenefitsAssumptions

Table AN12.16.7
Without \ With ProjectCrop Technology, SWC and WRD
Development Activity:Crop Technology, SWC and WRD
Before / Without Project Situation:Assumptions
Households (HHs)Crop Adoption Assumptions
Kharif Crop Net Margin
Rabi Crop Net MarginTotal Without Project Benefits
After / With Project Situation:Assumptions
Households (HHs)Crop Adoption Assumptions
Kharif Crop Net Margin
Rabi Crop Net MarginTotal With Project Benefits
Incremental Benefits
Source:
IFFDC - Rajesthan - Pratapgarh: Village Chhota Mayanga: Incremental Crop Benefit Stream (Rs'000).
Year 1 Year 2 Year 3 Year 4 Year 5 Year 6 Year 7 Year 8 Year 9 Year 101999/00 2000/01 2001/02 2002/03 2003/04 2004/05 2005/06 2006/07 2007/08 2008/09
- - - - 90.6 90.6 90.6 90.6 90.6 90.6
- - - - 19.0 19.0 19.0 19.0 19.0 19.0 - - - - 109.6 109.6 109.6 109.6 109.6 109.6
- - - - 307.5 307.5 307.5 307.5 307.5 307.5
- - - - 56.4 56.4 56.4 56.4 56.4 56.4 - - - - 363.9 363.9 363.9 363.9 363.9 363.9
- - - - 254.3 254.3 254.3 254.3 254.3 254.3
Cost Benefit Analysis (CBA) Study Estimate Jan 2005.
Benefit Streams (Rs '000)

Table AN12.16.8 IFFDC - Rajesthan - Pratapgarh: Village Chhota Mayanga: Household Livestock Net Margin Ass
Without \ With Project UnitsLivestock Year 1 Year 2 Year 3
(Rs) (Rs) (Rs)
Development Activity:Livestock
Before / Without Project Situation:Assumptions
Households (HHs) No 49 Annual Livestock Net Margin Rs/HH
Total Without Project Benefits 1,263.6 1,263.6 1,263.6
After / With Project Situation:
Development Activity:Assumptions
Households (HHs) No 49 Adoption Assumptions Percent 55% 78% 100%
Annual Livestock Net Margin Rs/HHTotal With Project Benefits 1,732.0 2,440.5 3,149.1
Incremental Benefits Rs/HH 468.4 1,176.9 1,885.4
Source: Cost Benefit Analysis (CBA) Study Estimate Jan 2005.
BenefitsAssumptions

Table AN12.16.8
Without \ With ProjectLivestock
Development Activity:Livestock
Before / Without Project Situation:Assumptions
Households (HHs)Annual Livestock Net Margin
Total Without Project Benefits
After / With Project Situation:
Development Activity:Assumptions
Households (HHs)Adoption Assumptions
Annual Livestock Net MarginTotal With Project Benefits
Incremental Benefits
Source:
IFFDC - Rajesthan - Pratapgarh: Village Chhota Mayanga: Incremental Livestock Benefit Stream (Rs'000).
Year 1 Year 2 Year 3 Year 4 Year 5 Year 6 Year 7 Year 8 Year 9 Year 101999/00 2000/01 2001/02 2002/03 2003/04 2004/05 2005/06 2006/07 2007/08 2008/09
- - - - - 61.9 61.9 61.9 61.9 61.9
- - - - - 84.9 119.6 154.3 154.3 154.3
- - - - - 22.9 57.7 92.4 92.4 92.4
Cost Benefit Analysis (CBA) Study Estimate Jan 2005.
Benefit Streams (Rs '000)

Table AN12.16.9 IFFDC - Rajesthan - Pratapgarh: Village Chhota Mayanga: Forestry Benefit Assumptions.
Without \ With Project UnitsForestry Year 1 Year 2 Year 3
(Rs) (Rs) (Rs)
Development Activity:Forestry
Before / Without Project Situation:AssumptionsHouseholds (HHs) No 49 Annual Forestry Net Margin Rs/HH
Total Without Project Benefits - - -
After / With Project Situation:AssumptionsHouseholds (HHs) No 49 Adoption Assumptions Percent 55% 78% 100%Annual Forestry Net Margin Rs/HH
Total With Project Benefits 110.0 156.0 200.0
Incremental Benefits Rs/HH 110.0 156.0 200.0
Source: Cost Benefit Analysis (CBA) Study Estimate Jan 2005.
BenefitsAssumptions
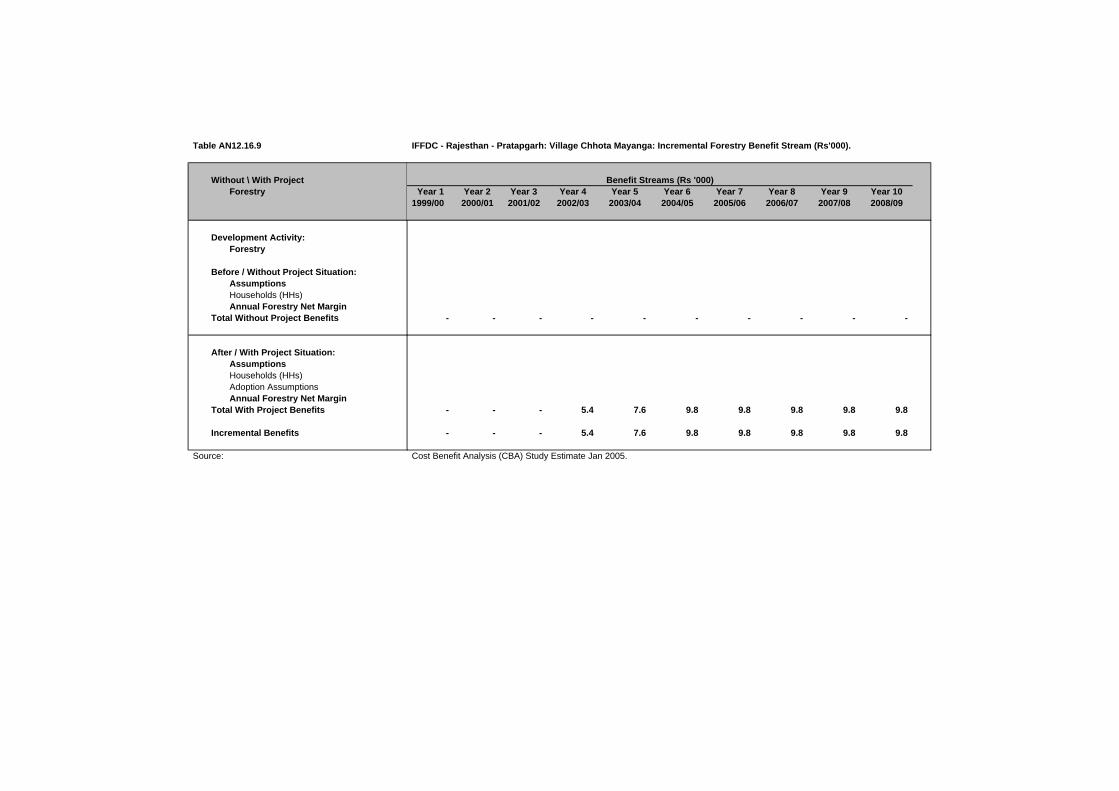
Table AN12.16.9
Without \ With ProjectForestry
Development Activity:Forestry
Before / Without Project Situation:AssumptionsHouseholds (HHs)Annual Forestry Net Margin
Total Without Project Benefits
After / With Project Situation:AssumptionsHouseholds (HHs)Adoption AssumptionsAnnual Forestry Net Margin
Total With Project Benefits
Incremental Benefits
Source:
IFFDC - Rajesthan - Pratapgarh: Village Chhota Mayanga: Incremental Forestry Benefit Stream (Rs'000).
Year 1 Year 2 Year 3 Year 4 Year 5 Year 6 Year 7 Year 8 Year 9 Year 101999/00 2000/01 2001/02 2002/03 2003/04 2004/05 2005/06 2006/07 2007/08 2008/09
- - - - - - - - - -
- - - 5.4 7.6 9.8 9.8 9.8 9.8 9.8
- - - 5.4 7.6 9.8 9.8 9.8 9.8 9.8
Cost Benefit Analysis (CBA) Study Estimate Jan 2005.
Benefit Streams (Rs '000)

Table AN12.16.10 IFFDC - Rajesthan - Pratapgarh: Village Chhota Mayanga: Migration Support Benefit Assumptio
Without \ With ProjectYear 1 Year 2 Year 3(Rs) (Rs) (Rs)
Development Activity:Migration Support
Before / Without Project Situation:Assumptions
Economic Value per Day Rs/day 25.0 Days / Month / Household No - Economic Value per Month Rs/month - Months Migration / Year Months 4.0 Economic Value per Household Rs/HH - Households per Village No 49 Households per Village Migrating Percent 45%
Total Without Project Benefits Rs/Village - - -
After / With Project Situation:Assumptions
Economic Value per Day \1 Rs/day 25.0 30% 32.5 Days / Month / Household No - 30% - Economic Value per Month Rs/month - - Months Migration / Year Months 4.0 -20% 3.2 Economic Value per Household Rs/HH - - Households per Village No 49 49 Households per Village Migrating Percent 45% -20% 36%
Subtotal Migration Income Rs/Village - - -
Other Income Sum (Rs) - - - - - -
Total With Project Benefits Rs/Village - - -
Incremental Benefits Rs/Village - - -
Source: Cost Benefit Analysis (CBA) Study Estimate Jan 2005.
1\ Financial Wages (Rs/day):Skill Labour - Rs 160
Casual Labour :Male - Rs 40Female - Rs 30
BenefitsAssumptions

Table AN12.16.10
Without \ With Project
Development Activity:Migration Support
Before / Without Project Situation:Assumptions
Economic Value per Day Days / Month / Household Economic Value per Month Months Migration / Year Economic Value per Household Households per Village Households per Village Migrating
Total Without Project Benefits
After / With Project Situation:Assumptions
Economic Value per Day \1Days / Month / Household Economic Value per Month Months Migration / Year Economic Value per Household Households per Village Households per Village Migrating
Subtotal Migration Income
Other Income
Total With Project Benefits
Incremental Benefits
Source:
1\ Financial Wages (Rs/day):Skill Labour - Rs 160
Casual Labour :Male - Rs 40Female - Rs 30
IFFDC - Rajesthan - Pratapgarh: Village Chhota Mayanga: Incremental Migration Support Benefit Stream (Rs'000).
Year 1 Year 2 Year 3 Year 4 Year 5 Year 6 Year 7 Year 8 Year 9 Year 101999/00 2000/01 2001/02 2002/03 2003/04 2004/05 2005/06 2006/07 2007/08 2008/09
- - - - - - - - - -
- - - - - - - - - -
- - - - - - - - - -
- - - - - - - - - -
- - - - - - - - - -
Cost Benefit Analysis (CBA) Study Estimate Jan 2005.
Benefit Streams (Rs '000)
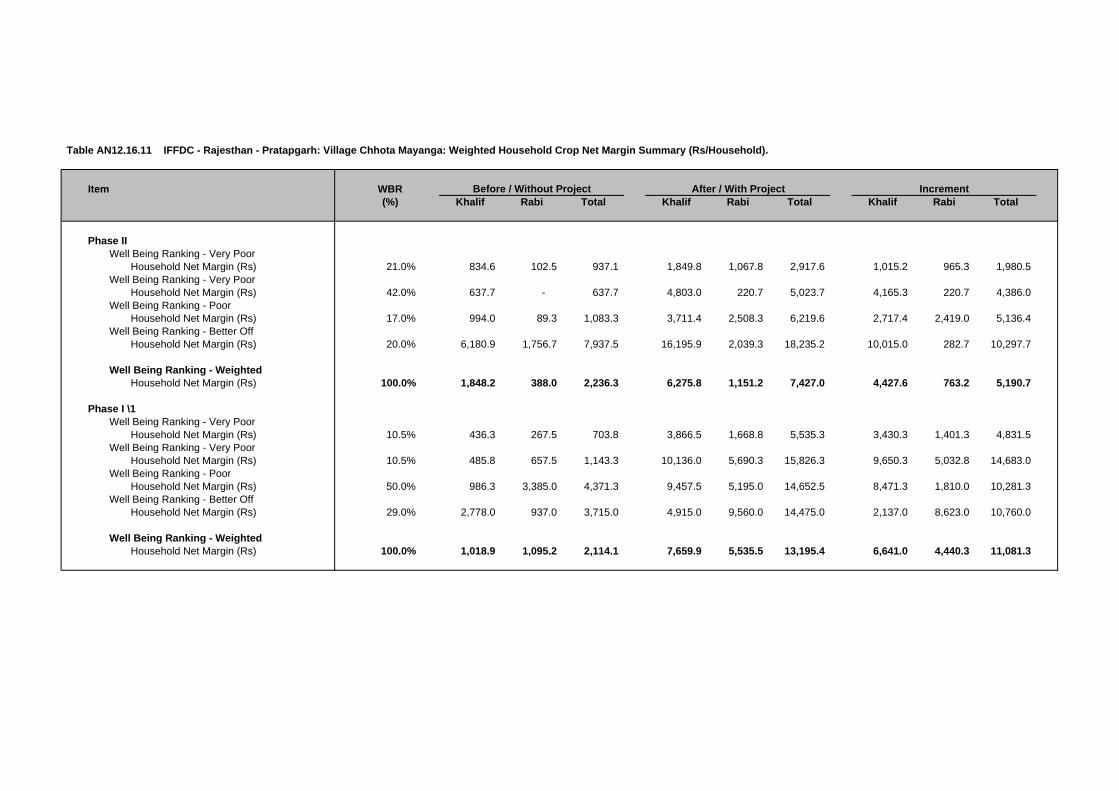
Table AN12.16.11 IFFDC - Rajesthan - Pratapgarh: Village Chhota Mayanga: Weighted Household Crop Net Margin Summary (Rs/Household).
Item WBR(%) Khalif Rabi Total Khalif Rabi Total Khalif Rabi Total
Phase IIWell Being Ranking - Very Poor
Household Net Margin (Rs) 21.0% 834.6 102.5 937.1 1,849.8 1,067.8 2,917.6 1,015.2 965.3 1,980.5 Well Being Ranking - Very Poor
Household Net Margin (Rs) 42.0% 637.7 - 637.7 4,803.0 220.7 5,023.7 4,165.3 220.7 4,386.0 Well Being Ranking - Poor
Household Net Margin (Rs) 17.0% 994.0 89.3 1,083.3 3,711.4 2,508.3 6,219.6 2,717.4 2,419.0 5,136.4 Well Being Ranking - Better Off
Household Net Margin (Rs) 20.0% 6,180.9 1,756.7 7,937.5 16,195.9 2,039.3 18,235.2 10,015.0 282.7 10,297.7
Well Being Ranking - WeightedHousehold Net Margin (Rs) 100.0% 1,848.2 388.0 2,236.3 6,275.8 1,151.2 7,427.0 4,427.6 763.2 5,190.7
Phase I \1Well Being Ranking - Very Poor
Household Net Margin (Rs) 10.5% 436.3 267.5 703.8 3,866.5 1,668.8 5,535.3 3,430.3 1,401.3 4,831.5 Well Being Ranking - Very Poor
Household Net Margin (Rs) 10.5% 485.8 657.5 1,143.3 10,136.0 5,690.3 15,826.3 9,650.3 5,032.8 14,683.0 Well Being Ranking - Poor
Household Net Margin (Rs) 50.0% 986.3 3,385.0 4,371.3 9,457.5 5,195.0 14,652.5 8,471.3 1,810.0 10,281.3 Well Being Ranking - Better Off
Household Net Margin (Rs) 29.0% 2,778.0 937.0 3,715.0 4,915.0 9,560.0 14,475.0 2,137.0 8,623.0 10,760.0
Well Being Ranking - WeightedHousehold Net Margin (Rs) 100.0% 1,018.9 1,095.2 2,114.1 7,659.9 5,535.5 13,195.4 6,641.0 4,440.3 11,081.3
Before / Without Project After / With Project Increment

Table AN12.16.12 IFFDC - Rajesthan - Pratapgarh: Village Chhota Mayanga: Weighted Household Crop Net Margin Sensitivity Analysis (Rs/Household).
Item EIRRKhalif Rabi Total Khalif Rabi Total Khalif Rabi Total
Development Activity:Crop Technology, SWC and WRD
Weighted Net Margin (Phase II)Household Net Margin (Rs) 1,848.2 388.0 2,236.3 6,275.8 1,151.2 7,427.0 4,427.6 763.2 5,190.7 Incremental Benefit (Phase II / Phase I) 47%
Base Case AssumptionsHousehold Net Margin (Rs) 1,848.2 388.0 2,236.3 6,275.8 1,151.2 7,427.0 4,427.6 763.2 5,190.7 Incremental Benefit (Phase II / Phase I) 47%Sensitivity Increase (%) 0%Development Acivity -5%Overall Village N/A
Sensitivity AssumptionsHousehold Net Margin (Rs) 1,848.2 388.0 2,236.3 14,434.4 2,647.7 17,082.1 12,586.1 2,259.7 14,845.8 Incremental Benefit (Phase II / Phase I) 134%Sensitivity Increase (%) 0%Development Acivity 33%Overall Village 12%
Weighted Net Margin (Phase I)Household Net Margin (Rs) 1,018.9 1,095.2 2,114.1 7,659.9 5,535.5 13,195.4 6,641.0 4,440.3 11,081.3
Source: IFFDC Pratapgarh Coordination Office - Rajasthan.EIRR = Economic Internal Rate of Return (rate at which NPV equal to zero).N/A = Not analysed as EIRR negative.
Before / Without Project After / With Project Increment

Table AN12.16.13 IFFDC - Rajesthan - Pratapgarh: Village Chhota Mayanga: Weighted Household Livestock Net Margin Summary (Rs/Household).
Well Being Ranking Weight(%) Herd Value Net Margin Herd Value Net Margin Herd Value Net Margin
Phase I - Well Being Ranking (WBR) \1Madhya Pradesh - WBR Weighted DataVery Poor 16.0%
Average 580 (185.0) 5,650 412.5 474 597.5 Poor 63.0%
Average 2,350 982.5 8,250 2,141.0 1,180 1,158.5 Moderate 18.0%
Average 14,700 6,730.0 1,900 2,820.0 1,900 (3,910.0)Better Off 3.0%
Average 15,580 3,000.0 14,600 10,790.0 (196) 7,790.0
Phase I - WBR Weighted Data 100.0% 4,687 1,890.8 6,882 2,246.1 1,155 355.4
Phase II - Well Being Ranking (WBR)
Very Poor 16.0%Average 5,756 149.2 10,970 1,446.4 1,043 1,297.2
Poor 63.0%Average 13,128 852.2 25,979 3,008.8 2,570 2,156.8
Moderate 18.0%Average 13,525 4,035.1 27,020 5,249.5 2,699 1,214.4
Better Off 3.0%Average 12,700 (781.7) 41,873 2,573.3 5,835 3,355.0
Phase II - WBR Weighted Data 100.0% 12,007 1,263.6 24,242 3,149.1 2,447 1,885.6
Source: Study of Impact of WIRFP on Net Incomes of Target Households, Jan 2004.WBR = IFFDC Household Well Being Ranking. Survey figures adjusted to Village Profile WBR.
\1 GVT - Madhya Pradesh - Phase I: Village Naganwat Choti: Weighted Household Livestock Net Margin Summary.
Before / Without Project After / With Project Increment \1

WIRFP - Phase II - Cost Benefit Analysis Study
Tables AN12.0 Individual Village Cost Benefit Analysis
Tables AN12.17 IFFDC - Rajesthan - Pratapgarh: Village Dharis Kheri.
Table AN12.17.1 IFFDC - Rajesthan - Pratapgarh: Village Dharis Kheri: Village Profile.
Table AN12.17.2 IFFDC - Rajesthan - Pratapgarh: Village Dharis Kheri: Cost Benefit Analysis Summary (Rs'000).Table AN12.17.3 IFFDC - Rajesthan - Pratapgarh: Village Dharis Kheri: Cost Benefit Analysis Development Activity Summary A (Rs'000).Table AN12.17.4 IFFDC - Rajesthan - Pratapgarh: Village Dharis Kheri: Cost Benefit Analysis Development Activity Summary B (Rs'000).
Table AN12.17.5 IFFDC - Rajasthan - Pratapgarh: Village Dharis Kheri: Costs - Financial (Rs'000).IFFDC - Rajasthan - Pratapgarh: Village Dharis Kheri: Costs - Economic (Rs'000).
Table AN12.17.6 IFFDC - Rajesthan - Pratapgarh: Village Dharis Kheri: VOD Household Assumptions.IFFDC - Rajesthan - Pratapgarh: Village Dharis Kheri: Incremental VOD Benefit Stream (Rs'000).
Table AN12.17.7 IFFDC - Rajesthan - Pratapgarh: Village Dharis Kheri: Household Crop Net Margin Assumptions.IFFDC - Rajesthan - Pratapgarh: Village Dharis Kheri: Incremental Crop Benefit Stream (Rs'000).
Table AN12.17.8 IFFDC - Rajesthan - Pratapgarh: Village Dharis Kheri: Household Livestock Net Margin Assumptions.IFFDC - Rajesthan - Pratapgarh: Village Dharis Kheri: Incremental Livestock Benefit Stream (Rs'000).
Table AN12.17.9 IFFDC - Rajesthan - Pratapgarh: Village Dharis Kheri: Forestry Benefit Assumptions.IFFDC - Rajesthan - Pratapgarh: Village Dharis Kheri: Incremental Forestry Benefit Stream (Rs'000).
Table AN12.17.10 IFFDC - Rajesthan - Pratapgarh: Village Dharis Kheri: Migration Support Benefit Assumptions.IFFDC - Rajesthan - Pratapgarh: Village Dharis Kheri: Incremental Migration Support Benefit Stream (Rs'000).
Table AN12.17.11 IFFDC - Rajesthan - Pratapgarh: Village Dharis Kheri: Weighted Household Crop Net Margin Summary (Rs/Household).Table AN12.17.12 IFFDC - Rajesthan - Pratapgarh: Village Dharis Kheri: Weighted Household Crop Net Margin Sensitivity Analysis (Rs/Household).
Table AN12.17.13 IFFDC - Rajesthan - Pratapgarh: Village Dharis Kheri: Weighted Household Livestock Net Margin Summary (Rs/Household).

Table AN12.17.1 IFFDC - Rajesthan - Pratapgarh: Village Dharis Kheri: Village Profile.
Village Profile \1
A. Background E. Well Being Ranking (No Households)Village Name Dharis Kheri Very Poor 33 35.9%District Pratapgarh Poor 20 21.7%State Rajasthan Moderate 26 28.3%
Better Off 13 14.1%B. Participatory Planning Process (PPP) Total 92 100%
Village entry Oct-99PRA Nov-00 F. Land Resource (ha)CPA Nov-00 Total Area -
Revenue Land (unused) - C. Infrastructure Forest Area - Revenue -
Hand Pumps (no) 5 Pasture Land - Wells (no) 15 Arable Land - Linked by Road 4 Kms - Electrification NoSchool Primary G. Livestock
Oxen 200 D. Demographic Data Cows 325
Households (no) 88 Buffalo 90 Participating Households 67 Goats 350 Population (Adults) 414 Poultry 985
Adults: Male 208 H. Self Help Groups (No Households) Female 206 1 Group 1 12 Children: 2 Group 2 11 Boys N/A 3 Group 3 10 Girls N/A 4 Group 4 13
5 Group 5 9 6 Group 6 10 7 Group 7 15 8 Group 8 14
Total Memberhip 94
Source: IFFDC Pratapgarh Coordination Office - Rajasthan.\1 Subject to final adjustment following consolidation exercise prior to Annual Review Meeting (ARM) in Feb 2005.

Table AN12.17.2 IFFDC - Rajesthan - Pratapgarh: Village Dharis Kheri: Cost Benefit Analysis Summary (Rs'000).
Administration Costs / Development Activity EIRR \1 Year 1 Year 2 Year 3 Year 4 Year 5 Year 6 Year 7 Year 8 Year 9 Year 10(10%) (%) 1999/00 2000/01 2001/02 2002/03 2003/04 2004/05 2005/06 2006/07 2007/08 2008/09
A. Administration CostsTotal A N/A (1,449) 129% 237.1 209.8 199.3 366.6 388.0 389.3 373.8 37.4 37.4 37.4
B. Development Activity Component A 1. PPGF
Net Incremental Benefits N/A (54) 5% (3.6) (27.6) (9.9) (11.5) (5.6) (5.0) (8.7) (1.6) (1.6) (1.6)
2. VODNet Incremental Benefits 282% 58 -5% - (12.4) 37.6 45.1 (12.5) (25.8) (170.3) 37.2 37.4 37.7
3/5.Crop Technology, SWC and WRDNet Incremental Benefits 6% (174) 16% - (16.0) (255.2) (242.7) (29.9) (39.8) (116.2) 90.9 90.9 90.9
6. LivestockNet Incremental Benefits 80% 448 -40% - (8.4) (22.6) (6.4) 10.4 69.9 112.3 131.7 131.7 131.7
7. ForestryNet Incremental Benefits 34% 50 -5% - (4.3) (1.7) (24.7) (6.4) 16.6 16.2 20.2 20.2 20.2
8. Migration SupportNet Incremental Benefits N/A - 0% - - - - - - - - - -
SummaryNet Incremental Benefits 1% (1,121) 100% (240.7) (278.5) (450.9) (606.8) (432.0) (373.4) (540.6) 241.0 241.2 241.4
Sensitivity AnalysisAnalysis Period
12 Years N/A (1,429)20 Years (Base Case) 1% (1,121)25 Years 3% (1,031)30 Years 5% (980)
Costs - AdministrationInvestment Costs Decreased by7 20 percent 3% (831)
Costs - Administration and DevelopmentRecurrent Costs Increased by 20 percent -1% (1,278)
Benefits - Crop, SWC and WRDCrop Benefits Increased by 20 percent 4% (822)Livestock Benefits Increased by 20 percent 3% (947)
Source: Cost Benefit Analysis (CBA) Study Estimate Jan 2005.\1 EIRR = Economic Internal Rate of Return (rate at which NPV equal to zero).\2 NPV = Net Present Value of net incremental benefits at 12% (indicative opportunity cost of capital for rural development projects in India).
N/A = Not analysed as EIRR negative.
NPV \2

Table AN12.17.3 IFFDC - Rajesthan - Pratapgarh: Village Dharis Kheri: Cost Benefit Analysis Development Activity Summary A (Rs'000).
Administration Costs / Development Activity EIRR \1 Year 1 Year 2 Year 3 Year 4 Year 5 Year 6 Year 7 Year 8 Year 9 Year 10(10%) (%) 1999/00 2000/01 2001/02 2002/03 2003/04 2004/05 2005/06 2006/07 2007/08 2008/09
A. Administration CostsInvestment 237.1 209.8 199.3 366.6 388.0 389.3 373.8 - - - Recurrent - - - - - - - 37.4 37.4 37.4
Total A N/A (1,449) 129% 237.1 209.8 199.3 366.6 388.0 389.3 373.8 37.4 37.4 37.4
B. Development Intervention Component A 1. PPGF
Cost StreamInvestment 3.6 27.5 9.1 10.5 4.3 3.6 7.2 - - - Recurrent - 0.1 0.8 1.0 1.3 1.4 1.5 1.6 1.6 1.6 Total Costs 3.6 27.6 9.9 11.5 5.6 5.0 8.7 1.6 1.6 1.6
Benefit StreamBefore / Without Project - - - - - - - - - - After / With Project - - - - - - - - - - Incremental Benefits - - - - - - - - - -
Net Incremental Benefits N/A (54) 5% (3.6) (27.6) (9.9) (11.5) (5.6) (5.0) (8.7) (1.6) (1.6) (1.6)
2. VODCost Stream
Investment - 12.4 18.1 9.9 67.2 77.4 218.3 - - - Recurrent - - 0.6 1.5 2.0 5.4 9.3 20.2 20.2 20.2 Total Costs - 12.4 18.7 11.5 69.2 82.8 227.5 20.2 20.2 20.2
Benefit StreamBefore / Without Project - - - - - - - - - - After / With Project - - 56.4 56.6 56.8 57.0 57.2 57.4 57.6 57.8 Incremental Benefits - - 56.4 56.6 56.8 57.0 57.2 57.4 57.6 57.8
Net Incremental Benefits 282% 58 -5% - (12.4) 37.6 45.1 (12.5) (25.8) (170.3) 37.2 37.4 37.7
3/5.Crop Technology, SWC and WRDCost Stream
InvestmentCrop Technology - 0.6 2.6 7.1 51.0 27.9 61.4 - - - Soil Water Conservation - - 42.0 6.2 17.2 30.4 37.1 - - - Water Resource Development - 15.4 208.2 190.5 123.7 121.5 135.0 - - -
RecurrentCrop Technology - - 0.0 0.1 0.3 1.5 2.2 3.8 3.8 3.8 Soil Water Conservation - - - 5.2 6.0 8.2 12.0 16.6 16.6 16.6 Water Resource Development - - 2.3 33.5 62.1 80.7 98.9 119.1 119.1 119.1
Total Costs - 16.0 255.2 242.7 260.3 270.2 346.6 139.5 139.5 139.5 Benefit Stream
Before / Without Project - - - - 183.7 183.7 183.7 183.7 183.7 183.7 After / With Project - - - - 414.1 414.1 414.1 414.1 414.1 414.1 Incremental Benefits - - - - 230.4 230.4 230.4 230.4 230.4 230.4
Net Incremental Benefits 6% (174) 16% - (16.0) (255.2) (242.7) (29.9) (39.8) (116.2) 90.9 90.9 90.9
Source: Cost Benefit Analysis (CBA) Study Estimate Jan 2005.\1 EIRR = Economic Internal Rate of Return (rate at which NPV equal to zero).\2 NPV = Net Present Value of net incremental benefits at 12% (indicative opportunity cost of capital for rural development projects in India).
N/A = Not analysed as EIRR negative.
NPV \2

Table AN12.17.4 IFFDC - Rajesthan - Pratapgarh: Village Dharis Kheri: Cost Benefit Analysis Development Activity Summary B (Rs'000).
Administration Costs / Development Activity EIRR \1 Year 1 Year 2 Year 3 Year 4 Year 5 Year 6 Year 7 Year 8 Year 9 Year 10(10%) (%) 1999/00 2000/01 2001/02 2002/03 2003/04 2004/05 2005/06 2006/07 2007/08 2008/09
6. LivestockCost Stream
Investment - 8.4 21.7 3.4 17.9 10.8 21.6 - - - Recurrent - - 0.8 3.0 3.4 5.1 6.2 8.4 8.4 8.4 Total Costs - 8.4 22.6 6.4 21.3 15.9 27.8 8.4 8.4 8.4
Benefit StreamBefore / Without Project - - - - 100.9 100.9 100.9 100.9 100.9 100.9 After / With Project - - - - 132.6 186.8 241.0 241.0 241.0 241.0 Incremental Benefits - - - - 31.6 85.9 140.1 140.1 140.1 140.1
Net Incremental Benefits 80% 448 -40% - (8.4) (22.6) (6.4) 10.4 69.9 112.3 131.7 131.7 131.7
7. ForestryCost Stream
Investment - 4.3 1.3 39.5 23.8 4.5 4.5 - - - Recurrent - 0.4 0.6 4.5 6.9 7.3 7.8 7.8 7.8 Total Costs - 4.3 1.7 40.1 28.3 11.4 11.8 7.8 7.8 7.8
Benefit StreamBefore / Without Project - - - - - - - - - - After / With Project - - - 15.4 21.8 28.0 28.0 28.0 28.0 28.0 Incremental Benefits - - - 15.4 21.8 28.0 28.0 28.0 28.0 28.0
Net Incremental Benefits 34% 50 -5% - (4.3) (1.7) (24.7) (6.4) 16.6 16.2 20.2 20.2 20.2
8. Migration SupportCost Stream
Investment - - - - - - - - - - Recurrent - - - - - - - - - Total Costs - - - - - - - - - -
Benefit StreamBefore / Without Project - - - - - - - - - - After / With Project - - - - - - - - - - Incremental Benefits - - - - - - - - - -
Net Incremental Benefits N/A - 0% - - - - - - - - - -
SummaryCost Stream
Investment 240.7 278.4 502.3 633.8 693.1 665.4 858.9 - - - Recurrent - 0.1 5.0 45.0 79.6 109.2 137.4 214.9 214.9 214.9 Total Costs 240.7 278.5 507.3 678.7 772.6 774.6 996.2 214.9 214.9 214.9
Benefit StreamBefore / Without Project - - - - 284.6 284.6 284.6 284.6 284.6 284.6 After / With Project - - 56.4 72.0 625.2 685.8 740.3 740.5 740.7 740.9 Incremental Benefits - - 56.4 72.0 340.6 401.2 455.6 455.9 456.1 456.3
Net Incremental Benefits 1% (1,121) 100% (240.7) (278.5) (450.9) (606.8) (432.0) (373.4) (540.6) 241.0 241.2 241.4
Source: Cost Benefit Analysis (CBA) Study Estimate Jan 2005.
NPV \2

Table AN12.17.5 IFFDC - Rajasthan - Pratapgarh: Village Dharis Kheri: Costs - Financial (Rs'000).
Cost Head / Subhead 1999/00 2000/01 2001/02 2002/03 2003/04 2004/05 2005/06Actual Actual Actual Actual Actual Budget Budget (Rs'000) (%)
A. Administration CostsIFFDC Head Quarters 106.0 46.3 47.3 84.7 53.8 47.2 47.2 432.5 9%DFIDI 35.9 71.4 26.9 63.2 47.4 54.7 39.2 338.6 7%Pratapgarh Coordination Office 117.6 107.5 144.2 252.5 324.6 324.6 324.6 1,595.6 35%
Total A 259.5 225.1 218.4 400.3 425.8 426.5 411.0 2,366.7 51%
B. Development CostsComponent A 1. PPG 4.0 30.5 10.1 11.6 4.8 4.0 8.0 73.1 2% 2. VOD - 13.8 20.1 11.0 74.7 86.0 242.5 448.1 10% 3. Crop - 0.7 2.9 7.9 56.6 31.0 68.2 167.4 4% 4. SWC - - 62.2 9.2 25.5 45.0 55.0 196.9 4% 5. WRD - 22.8 308.5 282.2 183.3 180.0 200.0 1,176.8 26% 6. Livestock - 9.4 24.1 3.8 19.9 12.0 24.0 93.2 2% 7. Forestry - 4.8 1.4 43.9 26.4 5.0 5.0 86.5 2% 8. Migration Support - - - - - - - - 0%
Subtotal 4.0 82.0 429.4 369.7 391.2 363.0 602.7 2,241.9 49%
Other Development CostsSubtotal - - - - - - - - 0%
Total B 4.0 82.0 429.4 369.7 391.2 363.0 602.7 2,241.9 49%
Total A + B 263.5 307.1 647.8 770.0 817.0 789.5 1,013.7 4,608.7 100%
Source: IFFDC Pratapgarh Coordination Office - Rajasthan.
DFIDI = Department for International Development (India).PPG = Participatory Planning and Group Formation.VOD = Village Organisation and Development.SWC = Soil and Water Conservation.WRD = Water Resource Development.
Total

Table AN12.17.5
Cost Head / Subhead
A. Administration CostsIFFDC Head QuartersDFIDIPratapgarh Coordination Office
Total A
B. Development CostsComponent A 1. PPG 2. VOD 3. Crop 4. SWC 5. WRD 6. Livestock 7. Forestry 8. Migration Support
Subtotal
Other Development CostsSubtotal
Total B
Total A + B
Source:
DFIDI = Department for International Development (India).PPG = Participatory Planning and Group Formation.VOD = Village Organisation and Development.SWC = Soil and Water Conservation.WRD = Water Resource Development.
IFFDC - Rajasthan - Pratapgarh: Village Dharis Kheri: Costs - Economic (Rs'000).
1999/00 2000/01 2001/02 2002/03 2003/04 2004/05 2005/06CF SCF Actual Actual Actual Actual Actual Budget Budget (Rs'000) (%)
0.90 1.00 95.4 41.6 42.5 76.2 48.4 42.5 42.5 389.2 10%1.00 1.00 35.9 71.4 26.9 63.2 47.4 54.7 39.2 338.6 9%0.90 1.00 105.9 96.7 129.8 227.2 292.1 292.1 292.1 1,436.0 37%
237.1 209.8 199.3 366.6 388.0 389.3 373.8 2,163.9 56%
0.90 1.00 3.6 27.5 9.1 10.5 4.3 3.6 7.2 65.8 2%0.90 1.00 - 12.4 18.1 9.9 67.2 77.4 218.3 403.3 10%0.90 1.00 - 0.6 2.6 7.1 51.0 27.9 61.4 150.6 4%0.90 0.75 - - 42.0 6.2 17.2 30.4 37.1 132.9 3%0.90 0.75 - 15.4 208.2 190.5 123.7 121.5 135.0 794.3 21%0.90 1.00 - 8.4 21.7 3.4 17.9 10.8 21.6 83.9 2%0.90 1.00 - 4.3 1.3 39.5 23.8 4.5 4.5 77.9 2%0.90 1.00 - - - - - - - - 0%
3.6 68.6 303.1 267.1 305.1 276.1 485.1 1,708.7 44%
0.90 1.00 - - - - - - - - 0%3.6 68.6 303.1 267.1 305.1 276.1 485.1 1,708.7 44%
240.7 278.4 502.3 633.8 693.1 665.4 858.9 3,872.6 100%
IFFDC Pratapgarh Coordination Office - Rajasthan.
TotalConversion Factors

Table AN12.17.6 IFFDC - Rajesthan - Pratapgarh: Village Dharis Kheri: VOD Household Assumptions.
Without \ With Project UnitsYear 1 Year 2 Year 3(Rs) (Rs) (Rs)
Development Activity:Village Organisation and Development
Before / Without Project Situation:
A. Self Help Groups (SHGs)Assumption Sum Zero Zero Zero - - -
B. Drudgery ReductionAssumption Sum Zero Zero Zero
Total Without Project Benefits - - -
After / With Project Situation:
A. Self Help Groups (SHGs)Assumptions
Average Saving / Household Rs 1,137 Households / Village No 80 Present Group Savings Rs'000 91.0 91.0 93.7 96.5 Annual Savings Increase % 3%Deposits on Loan to Members % 35%SHG Interest Income % / Year 20%Assumed Benefit Rs'000 6.4 6.6 6.8
B. Drudgery ReductionAssumptions
Hours Saved / Day / Household No 1.0 Number of Days / Year / Household No 200 Days / Year / Household (8hrs/day) No 25.0 Households / Village No 80 Day Equivalent / Village No 2,000 Economic Value per Day (Rs/day) 25 Assumed Benefit Rs'000 50.0 50.0 50.0
Total With Project Benefits Rs'000 56.4 56.6 56.8
Incremental Benefits Rs'000 56.4 56.6 56.8
Source: Cost Benefit Analysis (CBA) Study Estimate Jan 2005.VOD = Village Organisation and Development.Participating households per village: Dharis Kheri 80
Assumptions Benefits

Table AN12.17.6
Without \ With Project
Development Activity:Village Organisation and Development
Before / Without Project Situation:
A. Self Help Groups (SHGs)Assumption
B. Drudgery ReductionAssumption
Total Without Project Benefits
After / With Project Situation:
A. Self Help Groups (SHGs)Assumptions
Average Saving / HouseholdHouseholds / VillagePresent Group SavingsAnnual Savings IncreaseDeposits on Loan to MembersSHG Interest Income Assumed Benefit
B. Drudgery ReductionAssumptions
Hours Saved / Day / HouseholdNumber of Days / Year / HouseholdDays / Year / Household (8hrs/day)Households / VillageDay Equivalent / VillageEconomic Value per DayAssumed Benefit
Total With Project Benefits
Incremental Benefits
Source:VOD = Village Organisation and Development.Participating households per village: Dharis Kheri
IFFDC - Rajesthan - Pratapgarh: Village Dharis Kheri: Incremental VOD Benefit Stream (Rs'000).
Year 1 Year 2 Year 3 Year 4 Year 5 Year 6 Year 7 Year 8 Year 9 Year 101999/00 2000/01 2001/02 2002/03 2003/04 2004/05 2005/06 2006/07 2007/08 2008/09
- - - - - - - - - -
- - 91.0 93.7 96.5 99.4 102.4 105.4 108.6 111.9
- - 6.4 6.6 6.8 7.0 7.2 7.4 7.6 7.8
- - 50.0 50.0 50.0 50.0 50.0 50.0 50.0 50.0
- - 56.4 56.6 56.8 57.0 57.2 57.4 57.6 57.8
- - 56.4 56.6 56.8 57.0 57.2 57.4 57.6 57.8
Cost Benefit Analysis (CBA) Study Estimate Jan 2005.
Benefit Streams (Rs '000)
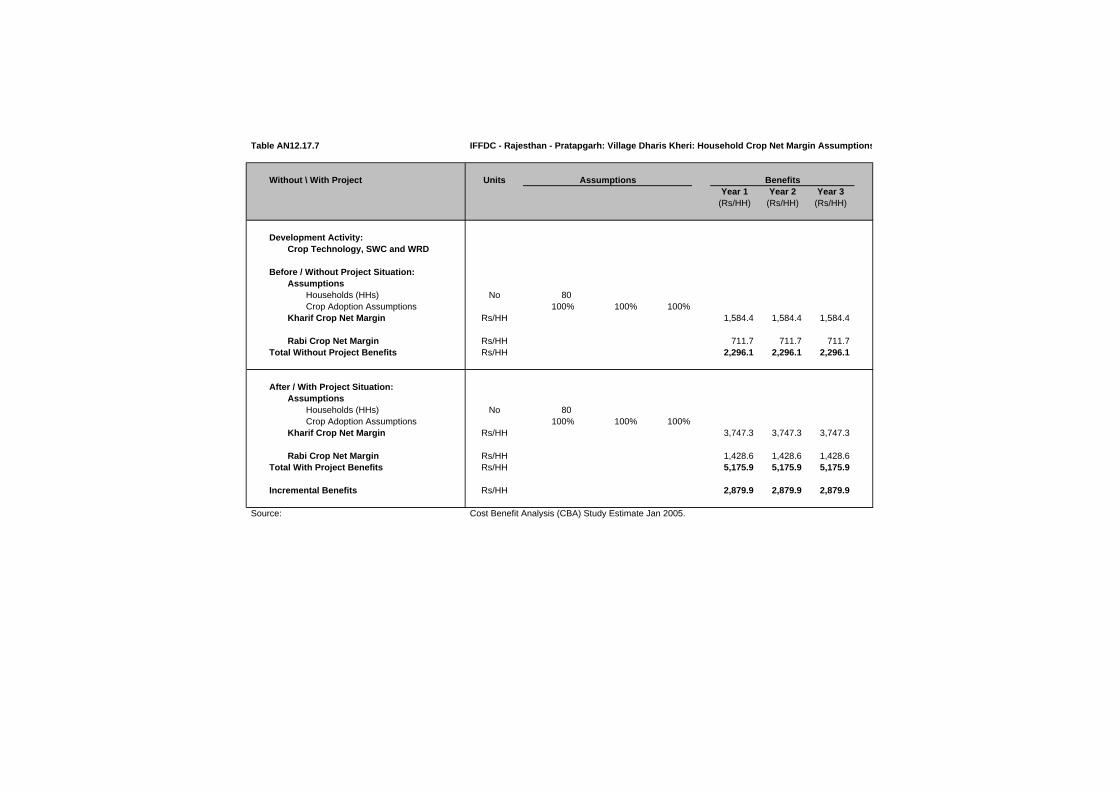
Table AN12.17.7 IFFDC - Rajesthan - Pratapgarh: Village Dharis Kheri: Household Crop Net Margin Assumptions
Without \ With Project UnitsYear 1 Year 2 Year 3
(Rs/HH) (Rs/HH) (Rs/HH)
Development Activity:Crop Technology, SWC and WRD
Before / Without Project Situation:Assumptions
Households (HHs) No 80 Crop Adoption Assumptions 100% 100% 100%
Kharif Crop Net Margin Rs/HH 1,584.4 1,584.4 1,584.4
Rabi Crop Net Margin Rs/HH 711.7 711.7 711.7 Total Without Project Benefits Rs/HH 2,296.1 2,296.1 2,296.1
After / With Project Situation:Assumptions
Households (HHs) No 80 Crop Adoption Assumptions 100% 100% 100%
Kharif Crop Net Margin Rs/HH 3,747.3 3,747.3 3,747.3
Rabi Crop Net Margin Rs/HH 1,428.6 1,428.6 1,428.6 Total With Project Benefits Rs/HH 5,175.9 5,175.9 5,175.9
Incremental Benefits Rs/HH 2,879.9 2,879.9 2,879.9
Source: Cost Benefit Analysis (CBA) Study Estimate Jan 2005.
Assumptions Benefits

Table AN12.17.7
Without \ With Project
Development Activity:Crop Technology, SWC and WRD
Before / Without Project Situation:Assumptions
Households (HHs)Crop Adoption Assumptions
Kharif Crop Net Margin
Rabi Crop Net MarginTotal Without Project Benefits
After / With Project Situation:Assumptions
Households (HHs)Crop Adoption Assumptions
Kharif Crop Net Margin
Rabi Crop Net MarginTotal With Project Benefits
Incremental Benefits
Source:
IFFDC - Rajesthan - Pratapgarh: Village Dharis Kheri: Incremental Crop Benefit Stream (Rs'000).
Year 1 Year 2 Year 3 Year 4 Year 5 Year 6 Year 7 Year 8 Year 9 Year 101999/00 2000/01 2001/02 2002/03 2003/04 2004/05 2005/06 2006/07 2007/08 2008/09
- - - - 126.8 126.8 126.8 126.8 126.8 126.8
- - - - 56.9 56.9 56.9 56.9 56.9 56.9 - - - - 183.7 183.7 183.7 183.7 183.7 183.7
- - - - 299.8 299.8 299.8 299.8 299.8 299.8
- - - - 114.3 114.3 114.3 114.3 114.3 114.3 - - - - 414.1 414.1 414.1 414.1 414.1 414.1
- - - - 230.4 230.4 230.4 230.4 230.4 230.4
Cost Benefit Analysis (CBA) Study Estimate Jan 2005.
Benefit Streams (Rs '000)

Table AN12.17.8 IFFDC - Rajesthan - Pratapgarh: Village Dharis Kheri: Household Livestock Net Margin Assump
Without \ With Project UnitsKharif \ Rabi Year 1 Year 2 Year 3
Livestock (Rs) (Rs) (Rs)
Development Activity:Livestock
Before / Without Project Situation:Assumptions
Households (HHs) No 80 Annual Livestock Net Margin Rs/HH
Total Without Project Benefits 1,261.6 1,261.6 1,261.6
After / With Project Situation:
Development Activity:Assumptions
Households (HHs) No 80 Adoption Assumptions Percent 55% 78% 100%
Annual Livestock Net Margin Rs/HHTotal With Project Benefits 1,657.0 2,334.9 3,012.8
Incremental Benefits Rs/HH 395.4 1,073.3 1,751.2
Source: Cost Benefit Analysis (CBA) Study Estimate Jan 2005.
Assumptions Benefits

Table AN12.17.8
Without \ With ProjectKharif \ Rabi
Livestock
Development Activity:Livestock
Before / Without Project Situation:Assumptions
Households (HHs)Annual Livestock Net Margin
Total Without Project Benefits
After / With Project Situation:
Development Activity:Assumptions
Households (HHs)Adoption Assumptions
Annual Livestock Net MarginTotal With Project Benefits
Incremental Benefits
Source:
IFFDC - Rajesthan - Pratapgarh: Village Dharis Kheri: Incremental Livestock Benefit Stream (Rs'000).
Year 1 Year 2 Year 3 Year 4 Year 5 Year 6 Year 7 Year 8 Year 9 Year 101999/00 2000/01 2001/02 2002/03 2003/04 2004/05 2005/06 2006/07 2007/08 2008/09
- - - - 100.9 100.9 100.9 100.9 100.9 100.9
- - - - 132.6 186.8 241.0 241.0 241.0 241.0
- - - - 31.6 85.9 140.1 140.1 140.1 140.1
Cost Benefit Analysis (CBA) Study Estimate Jan 2005.
Benefit Streams (Rs '000)

Table AN12.17.9 IFFDC - Rajesthan - Pratapgarh: Village Dharis Kheri: Forestry Benefit Assumptions.
Without \ With Project UnitsKharif \ Rabi Year 1 Year 2 Year 3
Forestry (Rs) (Rs) (Rs)
Development Activity:Forestry
Before / Without Project Situation:AssumptionsHouseholds (HHs) No 80 Annual Forestry Net Margin Rs/HH
Total Without Project Benefits - - -
After / With Project Situation:AssumptionsHouseholds (HHs) No 80 Adoption Assumptions Percent 55% 78% 100%Annual Forestry Net Margin Rs/HH
Total With Project Benefits 192.5 273.0 350.0
Incremental Benefits Rs/HH 192.5 273.0 350.0
Source: Cost Benefit Analysis (CBA) Study Estimate Jan 2005.
Assumptions Benefits

Table AN12.17.9
Without \ With ProjectKharif \ Rabi
Forestry
Development Activity:Forestry
Before / Without Project Situation:AssumptionsHouseholds (HHs)Annual Forestry Net Margin
Total Without Project Benefits
After / With Project Situation:AssumptionsHouseholds (HHs)Adoption AssumptionsAnnual Forestry Net Margin
Total With Project Benefits
Incremental Benefits
Source:
IFFDC - Rajesthan - Pratapgarh: Village Dharis Kheri: Incremental Forestry Benefit Stream (Rs'000).
Year 1 Year 2 Year 3 Year 4 Year 5 Year 6 Year 7 Year 8 Year 9 Year 101999/00 2000/01 2001/02 2002/03 2003/04 2004/05 2005/06 2006/07 2007/08 2008/09
- - - - - - - - - -
- - - 15.4 21.8 28.0 28.0 28.0 28.0 28.0
- - - 15.4 21.8 28.0 28.0 28.0 28.0 28.0
Cost Benefit Analysis (CBA) Study Estimate Jan 2005.
Benefit Streams (Rs '000)

Table AN12.17.10 IFFDC - Rajesthan - Pratapgarh: Village Dharis Kheri: Migration Support Benefit Assumptions.
Without \ With ProjectYear 1 Year 2 Year 3(Rs) (Rs) (Rs)
Development Activity:Migration Support
Before / Without Project Situation:Assumptions
Economic Value per Day Rs/day 25.0 Days / Month / Household No - Economic Value per Month Rs/month - Months Migration / Year Months 4.0 Economic Value per Household Rs/HH - Households per Village No 80 Households per Village Migrating Percent 45%
Total Without Project Benefits Rs/Village - - -
After / With Project Situation:Assumptions
Economic Value per Day \1 Rs/day 25.0 30% 32.5 Days / Month / Household No - 30% - Economic Value per Month Rs/month - - Months Migration / Year Months 4.0 -20% 3.2 Economic Value per Household Rs/HH - - Households per Village No 80 80 Households per Village Migrating Percent 45% -20% 36%
Subtotal Migration Income Rs/Village - - -
Other Income Sum (Rs) - - - - - -
Total With Project Benefits Rs/Village - - -
Incremental Benefits Rs/Village - - -
Source: Cost Benefit Analysis (CBA) Study Estimate Jan 2005.
1\ Financial Wages (Rs/day):Skill Labour - Rs 160
Casual Labour :Male - Rs 40Female - Rs 30
Assumptions Benefits

Table AN12.17.10
Without \ With Project
Development Activity:Migration Support
Before / Without Project Situation:Assumptions
Economic Value per Day Days / Month / Household Economic Value per Month Months Migration / Year Economic Value per Household Households per Village Households per Village Migrating
Total Without Project Benefits
After / With Project Situation:Assumptions
Economic Value per Day \1Days / Month / Household Economic Value per Month Months Migration / Year Economic Value per Household Households per Village Households per Village Migrating
Subtotal Migration Income
Other Income
Total With Project Benefits
Incremental Benefits
Source:
1\ Financial Wages (Rs/day):Skill Labour - Rs 160
Casual Labour :Male - Rs 40Female - Rs 30
IFFDC - Rajesthan - Pratapgarh: Village Dharis Kheri: Incremental Migration Support Benefit Stream (Rs'000).
Year 1 Year 2 Year 3 Year 4 Year 5 Year 6 Year 7 Year 8 Year 9 Year 101999/00 2000/01 2001/02 2002/03 2003/04 2004/05 2005/06 2006/07 2007/08 2008/09
- - - - - - - - - -
- - - - - - - - - -
- - - - - - - - - -
- - - - - - - - - -
- - - - - - - - - -
Cost Benefit Analysis (CBA) Study Estimate Jan 2005.
Benefit Streams (Rs '000)

Table AN12.17.11 IFFDC - Rajesthan - Pratapgarh: Village Dharis Kheri: Weighted Household Crop Net Margin Summary (Rs/Household).
Item WBR(%) Khalif Rabi Total Khalif Rabi Total Khalif Rabi Total
Phase IIWell Being Ranking - Very Poor
Household Net Margin (Rs) 36.0% 834.6 834.6 834.6 834.6 834.6 834.6 834.6 834.6 834.6 Well Being Ranking - Very Poor
Household Net Margin (Rs) 22.0% 637.7 637.7 637.7 637.7 637.7 637.7 637.7 637.7 637.7 Well Being Ranking - Poor
Household Net Margin (Rs) 28.0% 994.0 89.3 1,083.3 3,711.4 2,508.3 6,219.6 2,717.4 2,419.0 5,136.4 Well Being Ranking - Better Off
Household Net Margin (Rs) 14.0% 6,180.9 1,756.7 7,937.5 16,195.9 2,039.3 18,235.2 10,015.0 282.7 10,297.7
Well Being Ranking - WeightedHousehold Net Margin (Rs) 100% 1,584.4 711.7 1,855.3 3,747.3 1,428.6 4,735.2 2,603.7 1,157.6 3,320.6
Phase I \1Well Being Ranking - Very Poor
Household Net Margin (Rs) 36.0% 436.3 267.5 703.8 3,866.5 1,668.8 5,535.3 3,430.3 1,401.3 4,831.5 Well Being Ranking - Very Poor
Household Net Margin (Rs) 22.0% 485.8 657.5 1,143.3 10,136.0 5,690.3 15,826.3 9,650.3 5,032.8 14,683.0 Well Being Ranking - Poor
Household Net Margin (Rs) 28.0% 986.3 3,385.0 4,371.3 9,457.5 5,195.0 14,652.5 8,471.3 1,810.0 10,281.3 Well Being Ranking - Better Off
Household Net Margin (Rs) 14.0% 2,778.0 937.0 3,715.0 4,915.0 9,560.0 14,475.0 2,137.0 8,623.0 10,760.0
Well Being Ranking - WeightedHousehold Net Margin (Rs) 100% 929.0 1,319.9 2,248.9 6,958.1 4,645.6 11,603.7 6,029.1 3,325.7 9,354.8
Source: Study of Impact of WIRFP on Net Incomes of Target Households, Jan 2004.WBR = IFFDC Household Well Being Ranking. Survey figures adjusted to Village Profile WBR.\1 GVT - Madhya Pradesh - Phase I: Village Naganwat Choti: Weighted Household Crop Net Margin Summary.
Before / Without Project After / With Project Increment
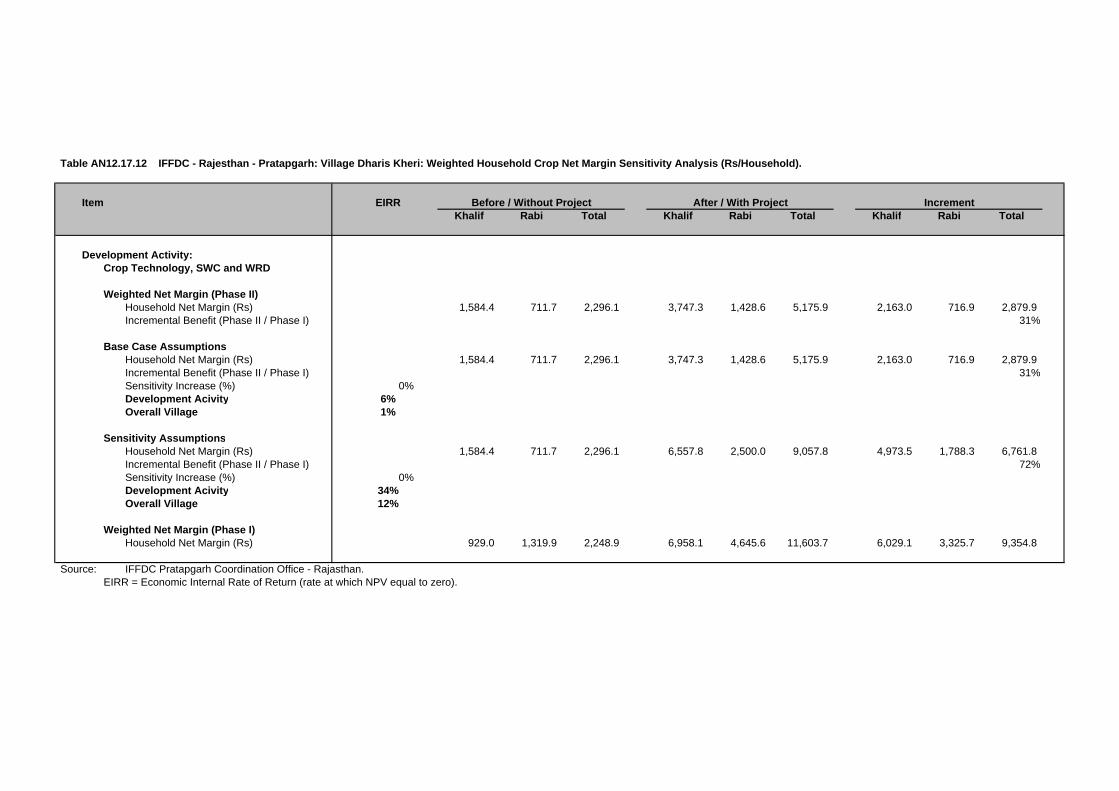
Table AN12.17.12 IFFDC - Rajesthan - Pratapgarh: Village Dharis Kheri: Weighted Household Crop Net Margin Sensitivity Analysis (Rs/Household).
Item EIRRKhalif Rabi Total Khalif Rabi Total Khalif Rabi Total
Development Activity:Crop Technology, SWC and WRD
Weighted Net Margin (Phase II)Household Net Margin (Rs) 1,584.4 711.7 2,296.1 3,747.3 1,428.6 5,175.9 2,163.0 716.9 2,879.9 Incremental Benefit (Phase II / Phase I) 31%
Base Case AssumptionsHousehold Net Margin (Rs) 1,584.4 711.7 2,296.1 3,747.3 1,428.6 5,175.9 2,163.0 716.9 2,879.9 Incremental Benefit (Phase II / Phase I) 31%Sensitivity Increase (%) 0%Development Acivity 6%Overall Village 1%
Sensitivity AssumptionsHousehold Net Margin (Rs) 1,584.4 711.7 2,296.1 6,557.8 2,500.0 9,057.8 4,973.5 1,788.3 6,761.8 Incremental Benefit (Phase II / Phase I) 72%Sensitivity Increase (%) 0%Development Acivity 34%Overall Village 12%
Weighted Net Margin (Phase I)Household Net Margin (Rs) 929.0 1,319.9 2,248.9 6,958.1 4,645.6 11,603.7 6,029.1 3,325.7 9,354.8
Source: IFFDC Pratapgarh Coordination Office - Rajasthan.EIRR = Economic Internal Rate of Return (rate at which NPV equal to zero).
Before / Without Project After / With Project Increment
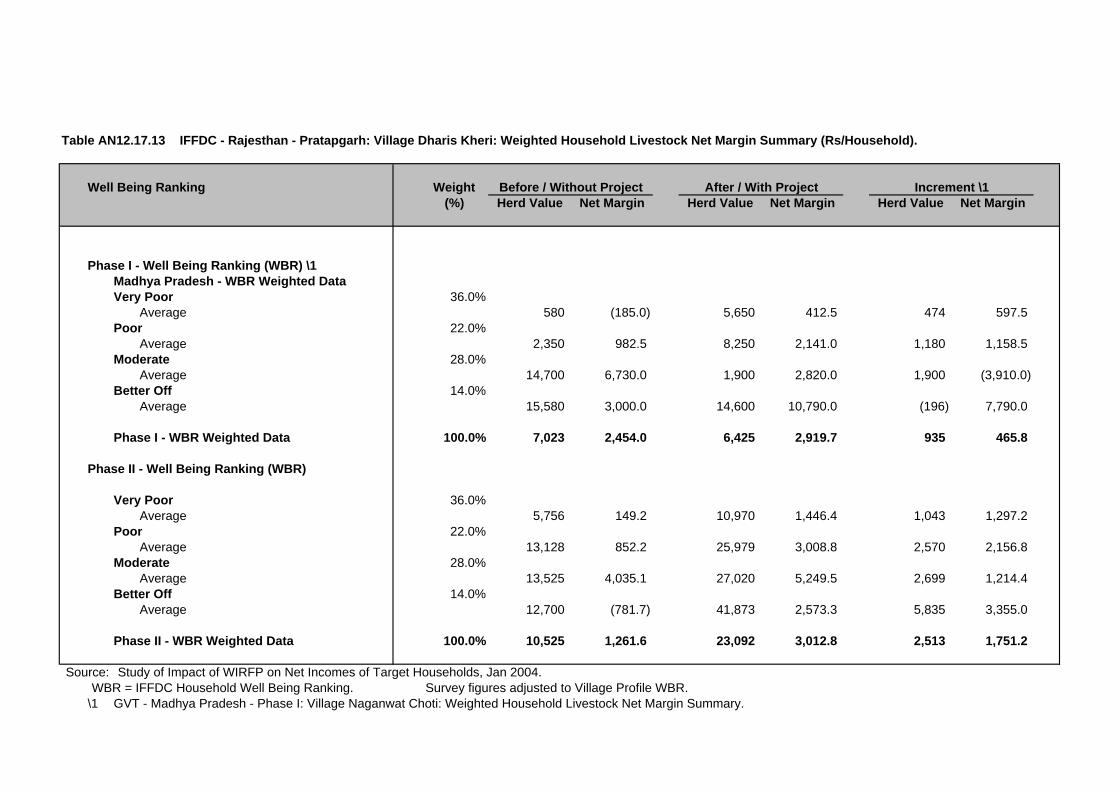
Table AN12.17.13 IFFDC - Rajesthan - Pratapgarh: Village Dharis Kheri: Weighted Household Livestock Net Margin Summary (Rs/Household).
Well Being Ranking Weight(%) Herd Value Net Margin Herd Value Net Margin Herd Value Net Margin
Phase I - Well Being Ranking (WBR) \1Madhya Pradesh - WBR Weighted DataVery Poor 36.0%
Average 580 (185.0) 5,650 412.5 474 597.5 Poor 22.0%
Average 2,350 982.5 8,250 2,141.0 1,180 1,158.5 Moderate 28.0%
Average 14,700 6,730.0 1,900 2,820.0 1,900 (3,910.0)Better Off 14.0%
Average 15,580 3,000.0 14,600 10,790.0 (196) 7,790.0
Phase I - WBR Weighted Data 100.0% 7,023 2,454.0 6,425 2,919.7 935 465.8
Phase II - Well Being Ranking (WBR)
Very Poor 36.0%Average 5,756 149.2 10,970 1,446.4 1,043 1,297.2
Poor 22.0%Average 13,128 852.2 25,979 3,008.8 2,570 2,156.8
Moderate 28.0%Average 13,525 4,035.1 27,020 5,249.5 2,699 1,214.4
Better Off 14.0%Average 12,700 (781.7) 41,873 2,573.3 5,835 3,355.0
Phase II - WBR Weighted Data 100.0% 10,525 1,261.6 23,092 3,012.8 2,513 1,751.2
Source: Study of Impact of WIRFP on Net Incomes of Target Households, Jan 2004.WBR = IFFDC Household Well Being Ranking. Survey figures adjusted to Village Profile WBR.
\1 GVT - Madhya Pradesh - Phase I: Village Naganwat Choti: Weighted Household Livestock Net Margin Summary.
Before / Without Project After / With Project Increment \1

WIRFP - Phase II - Cost Benefit Analysis Study
Tables AN12.0 Individual Village Cost Benefit Analysis
Tables AN12.18 IFFDC - Rajasthan - Pratapgarh: Village Kachotia.
Table AN12.18.1 IFFDC - Rajasthan - Pratapgarh: Village Kachotia: Village Profile.
Table AN12.18.2 IFFDC - Rajasthan - Pratapgarh: Village Kachotia: Cost Benefit Analysis Summary (Rs'000).Table AN12.18.3 IFFDC - Rajasthan - Pratapgarh: Village Kachotia: Cost Benefit Analysis Development Activity Summary A (Rs'000).Table AN12.18.4 IFFDC - Rajasthan - Pratapgarh: Village Kachotia: Cost Benefit Analysis Development Activity Summary B (Rs'000).
Table AN12.18.5 IFFDC - Rajasthan - Pratapgarh: Village Kachotia: Costs - Financial (Rs'000).IFFDC - Rajasthan - Pratapgarh: Village Kachotia: Costs - Economic (Rs'000).
Table AN12.18.6 IFFDC - Rajasthan - Pratapgarh: Village Kachotia: VOD Household Assumptions.IFFDC - Rajasthan - Pratapgarh: Village Kachotia: Incremental VOD Benefit Stream (Rs'000).
Table AN12.18.7 IFFDC - Rajasthan - Pratapgarh: Village Kachotia: Household Crop Net Margin Assumptions.IFFDC - Rajasthan - Pratapgarh: Village Kachotia: Incremental Crop Benefit Stream (Rs'000).
Table AN12.18.8 IFFDC - Rajasthan - Pratapgarh: Village Kachotia: Household Livestock Net Margin Assumptions.IFFDC - Rajasthan - Pratapgarh: Village Kachotia: Incremental Livestock Benefit Stream (Rs'000).
Table AN12.18.9 IFFDC - Rajasthan - Pratapgarh: Village Kachotia: Forestry Benefit Assumptions.IFFDC - Rajasthan - Pratapgarh: Village Kachotia: Incremental Forestry Benefit Stream (Rs'000).
Table AN12.18.10 IFFDC - Rajasthan - Pratapgarh: Village Kachotia: Migration Support Benefit Assumptions.IFFDC - Rajasthan - Pratapgarh: Village Kachotia: Incremental Migration Support Benefit Stream (Rs'000).
Table AN12.18.11 IFFDC - Rajasthan - Pratapgarh: Village Kachotia: Weighted Household Crop Net Margin Summary (Rs/Household).Table AN12.18.12 IFFDC - Rajasthan - Pratapgarh: Village Kachotia: Weighted Household Crop Net Margin Sensitivity Analysis (Rs/Household).
Table AN12.18.13 IFFDC - Rajasthan - Pratapgarh: Village Kachotia: Weighted Household Livestock Net Margin Summary (Rs/Household).

Table AN12.18.1 IFFDC - Rajasthan - Pratapgarh: Village Kachotia: Village Profile.
Village Profile \1
A. Background E. Well Being Ranking (No Households)Village Name Kachotia Very Poor 75 44.1%District Pratapgarh Poor 51 30.0%State Rajasthan Moderate 32 18.8%
Better Off 12 7.1%B. Participatory Planning Process (PPP) Total 170 100%
Village entry Jan-00PRA Mar-00 F. Land Resource (ha)CPA Mar-00 Total Area -
Revenue Land (unused) - C. Infrastructure Forest Area - Revenue -
Hand Pumps (no) 10 Pasture Land - Wells (no) 39 Arable Land - Linked by Road 1 km - Electrification NoSchool Primary G. Livestock
Oxen 369 D. Demographic Data Cows 340
Households (no) 170 Buffalo 81 Participating Households 100 Goats 392 Population (Adults) 1,165 Poultry 920
Adults: Male 604 H. Self Help Groups (No Households) Female 561 1 Group 1 14 Children: 2 Group 2 20 Boys N/A 3 Group 3 13 Girls N/A 4 Group 4 21
5 Group 5 20 6 Group 6 20 7 Group 7 -
Total Memberhip 108
Source: IFFDC Pratapgarh Coordination Office - Rajasthan.\1 Subject to final adjustment following consolidation exercise prior to Annual Review Meeting (ARM) in Feb 2005.

Table AN12.18.2 IFFDC - Rajasthan - Pratapgarh: Village Kachotia: Cost Benefit Analysis Summary (Rs'000).
Administration Costs / Development Activity EIRR \1 Year 1 Year 2 Year 3 Year 4 Year 5 Year 6 Year 7 Year 8 Year 9 Year 10(10%) (%) 1999/00 2000/01 2001/02 2002/03 2003/04 2004/05 2005/06 2006/07 2007/08 2008/09
A. Administration CostsTotal A N/A (1,449) 263% 237.1 209.8 199.3 366.6 388.0 389.3 373.8 37.4 37.4 37.4
B. Development Intervention Component A 1. PPGF
Net Incremental Benefits N/A (41) 7% (6.7) (7.4) (8.2) (11.0) (10.5) (5.1) (7.9) (1.3) (1.3) (1.3)
2. VODNet Incremental Benefits 18% 53 -10% - (82.3) (6.9) 39.7 9.7 30.3 (155.6) 50.7 50.9 51.1
3/5.Crop Technology, SWC and WRDNet Incremental Benefits 17% 220 -40% - (78.4) (348.4) (297.1) 162.0 3.5 (59.9) 224.7 224.7 224.7
6. LivestockNet Incremental Benefits 124% 597 -108% - (5.4) (3.4) (10.8) 9.7 81.3 149.0 170.8 170.8 170.8
7. ForestryNet Incremental Benefits 43% 68 -12% - (5.4) (3.3) (9.7) 0.1 7.2 2.0 26.3 26.3 26.3
8. Migration SupportNet Incremental Benefits N/A - 0% - - - - - - - - - -
SummaryNet Incremental Benefits 8% (551) 100% (243.8) (388.6) (569.5) (655.5) (217.0) (272.1) (446.2) 433.9 434.1 434.3
Sensitivity AnalysisAnalysis Period
12 Years -4% (1,104)20 Years (Base Case) 8% (551)25 Years 9% (388)30 Years 10% (296)
Costs - AdministrationInvestment Costs Decreased by 20 percent 10% (261)
Costs - Administration and DevelopmentRecurrent Costs Increased by 20 percent 6% (759)
Benefits - Crops, SWC and WRDCrop Benefits Increased by 20 percent 11% (141)Livestock Benefits Increased by 20 percent 9% (339)
Source: Cost Benefit Analysis (CBA) Study Estimate Jan 2005.\1 EIRR = Economic Internal Rate of Return (rate at which NPV equal to zero).\2 NPV = Net Present Value of net incremental benefits at 12% (indicative opportunity cost of capital for rural development projects in India).
N/A = Not analysed as EIRR negative.
NPV \2

Table AN12.18.3 IFFDC - Rajasthan - Pratapgarh: Village Kachotia: Cost Benefit Analysis Development Activity Summary A (Rs'000).
Administration Costs / Development Activity EIRR \1 Year 1 Year 2 Year 3 Year 4 Year 5 Year 6 Year 7 Year 8 Year 9 Year 10(10%) (%) 1999/00 2000/01 2001/02 2002/03 2003/04 2004/05 2005/06 2006/07 2007/08 2008/09
A. Administration CostsInvestment 237.1 209.8 199.3 366.6 388.0 389.3 373.8 - - - Recurrent - - - - - - - 37.4 37.4 37.4
Total A N/A (1,449) 263% 237.1 209.8 199.3 366.6 388.0 389.3 373.8 37.4 37.4 37.4
B. Development Intervention Component A 1. PPGF
Cost StreamInvestment 6.7 7.2 7.9 10.5 9.7 4.1 6.8 - - - Recurrent - 0.2 0.3 0.5 0.8 1.0 1.1 1.3 1.3 1.3 Total Costs 6.7 7.4 8.2 11.0 10.5 5.1 7.9 1.3 1.3 1.3
Benefit StreamBefore / Without Project - - - - - - - - - - After / With Project - - - - - - - - - - Incremental Benefits - - - - - - - - - -
Net Incremental Benefits N/A (41) 7% (6.7) (7.4) (8.2) (11.0) (10.5) (5.1) (7.9) (1.3) (1.3) (1.3)
2. VODCost Stream
Investment - 82.3 76.9 26.6 55.6 32.4 216.9 - - - Recurrent - - 4.1 8.0 9.3 12.1 13.7 24.5 24.5 24.5 Total Costs - 82.3 81.1 34.6 64.9 44.5 230.6 24.5 24.5 24.5
Benefit StreamBefore / Without Project - - - - - - - - - - After / With Project - - 74.1 74.3 74.5 74.8 75.0 75.2 75.4 75.7 Incremental Benefits - - 74.1 74.3 74.5 74.8 75.0 75.2 75.4 75.7
Net Incremental Benefits 18% 53 -10% - (82.3) (6.9) 39.7 9.7 30.3 (155.6) 50.7 50.9 51.1
3/5.Crop Technology, SWC and WRDCost Stream
InvestmentCrop Technology - 0.6 5.2 28.1 60.0 27.9 29.3 - - - Soil Water Conservation - 29.9 40.4 44.1 16.5 37.1 30.4 - - - Water Resource Development - 47.8 291.8 165.0 90.1 243.0 270.0 - - -
RecurrentCrop Technology - - 0.0 0.1 0.8 2.3 3.0 3.8 3.8 3.8 Soil Water Conservation - - 3.7 8.8 14.3 16.4 21.0 24.8 24.8 24.8 Water Resource Development - 7.2 50.9 75.7 89.2 125.7 166.2 166.2 166.2
Total Costs - 78.4 348.4 297.1 257.4 415.9 479.3 194.7 194.7 194.7 Benefit Stream
Before / Without Project - - - - 147.4 147.4 147.4 147.4 147.4 147.4 After / With Project - - - - 566.9 566.9 566.9 566.9 566.9 566.9 Incremental Benefits - - - - 419.5 419.5 419.5 419.5 419.5 419.5
Net Incremental Benefits 17% 220 -40% - (78.4) (348.4) (297.1) 162.0 3.5 (59.9) 224.7 224.7 224.7 EIRR
Source: Cost Benefit Analysis (CBA) Study Estimate Jan 2005.\1 EIRR = Economic Internal Rate of Return (rate at which NPV equal to zero).\2 NPV = Net Present Value of net incremental benefits at 12% (indicative opportunity cost of capital for rural development projects in India).
N/A = Not analysed as EIRR negative.
NPV \2

Table AN12.18.4 IFFDC - Rajasthan - Pratapgarh: Village Kachotia: Cost Benefit Analysis Development Activity Summary B (Rs'000).
Administration Costs / Development Activity EIRR \1 Year 1 Year 2 Year 3 Year 4 Year 5 Year 6 Year 7 Year 8 Year 9 Year 10(10%) (%) 1999/00 2000/01 2001/02 2002/03 2003/04 2004/05 2005/06 2006/07 2007/08 2008/09
6. LivestockCost Stream
Investment - 5.4 2.9 10.0 38.3 28.8 24.3 - - - Recurrent - - 0.5 0.8 1.8 5.7 8.5 11.0 11.0 11.0 Total Costs - 5.4 3.4 10.8 40.1 34.5 32.8 11.0 11.0 11.0
Benefit StreamBefore / Without Project - - - - 111.6 111.6 111.6 111.6 111.6 111.6 After / With Project - - - - 161.4 227.4 293.4 293.4 293.4 293.4 Incremental Benefits - - - - 49.8 115.8 181.8 181.8 181.8 181.8
Net Incremental Benefits 124% 597 -108% - (5.4) (3.4) (10.8) 9.7 81.3 149.0 170.8 170.8 170.8
7. ForestryCost Stream
Investment - 5.4 2.7 29.6 25.6 24.3 27.0 - - - Recurrent - - 0.5 0.8 3.8 6.3 8.8 11.5 11.5 11.5 Total Costs - 5.4 3.3 30.4 29.4 30.6 35.8 11.5 11.5 11.5
Benefit StreamBefore / Without Project - - - - - - - - - - After / With Project - - - 20.8 29.5 37.8 37.8 37.8 37.8 37.8 Incremental Benefits - - - 20.8 29.5 37.8 37.8 37.8 37.8 37.8
Net Incremental Benefits 43% 68 -12% - (5.4) (3.3) (9.7) 0.1 7.2 2.0 26.3 26.3 26.3
8. Migration SupportCost Stream
Investment - - - - - - - - - - Recurrent - - - - - - - - - - Total Costs - - - - - - - - - -
Benefit StreamBefore / Without Project - - - - - - - - - - After / With Project - - - - - - - - - - Incremental Benefits - - - - - - - - - -
Net Incremental Benefits N/A - 0% - - - - - - - - - - EIRR
SummaryCost Stream
Investment 243.8 388.4 627.1 680.6 683.7 786.9 978.4 - - - Recurrent - 0.2 16.5 70.0 106.6 133.0 181.9 280.4 280.4 280.4 Total Costs 243.8 388.6 643.6 750.6 790.3 919.9 1,160.2 280.4 280.4 280.4
Benefit StreamBefore / Without Project - - - - 259.0 259.0 259.0 259.0 259.0 259.0 After / With Project - - 74.1 95.1 832.3 906.8 973.1 973.3 973.5 973.8 Incremental Benefits - - 74.1 95.1 573.3 647.8 714.0 714.3 714.5 714.7
Net Incremental Benefits 8% (551) 100% (243.8) (388.6) (569.5) (655.5) (217.0) (272.1) (446.2) 433.9 434.1 434.3
Source: Cost Benefit Analysis (CBA) Study Estimate Jan 2005.EIRR = Economic Internal Rate of Return (rate at which NPV equal to zero).NPV = Net Present Value of net incremental benefits at 12% (indicative opportunity cost of capital for rural development projects in India).N/A = Not analysed as EIRR negative.
NPV \2

Table AN12.18.5 IFFDC - Rajasthan - Pratapgarh: Village Kachotia: Costs - Financial (Rs'000).
Cost Head / Subhead 1999/00 2000/01 2001/02 2002/03 2003/04 2004/05 2005/06Actual Actual Actual Actual Actual Budget Budget (Rs'000) (%)
A. Administration CostsIFFDC Head Quarters 106.0 46.3 47.3 84.7 53.8 47.2 47.2 432.5 8%DFIDI 35.9 71.4 26.9 63.2 47.4 54.7 39.2 338.6 6%Pratapgarh Coordination Office 117.6 107.5 144.2 252.5 324.6 324.6 324.6 1,595.6 30%
Total A 259.5 225.1 218.4 400.3 425.8 426.5 411.0 2,366.7 44%
B. Development CostsComponent A 1. PPG 7.4 8.0 8.7 11.6 10.8 4.5 7.5 58.6 1% 2. VOD - 91.4 85.5 29.6 61.8 36.0 241.0 545.3 10% 3. Crop - 0.7 5.8 31.2 66.7 31.0 32.5 167.9 3% 4. SWC - 44.4 59.9 65.3 24.4 55.0 45.0 294.0 6% 5. WRD - 70.8 432.3 244.5 133.5 360.0 400.0 1,641.0 31% 6. Livestock - 6.0 3.2 11.1 42.5 32.0 27.0 121.9 2% 7. Forestry - 6.0 3.1 32.9 28.4 27.0 30.0 127.4 2% 8. Migration Support - - - - - - - - 0%
Subtotal 7.4 227.3 598.5 426.3 368.1 545.5 783.0 2,956.1 56%
Other Development CostsSubtotal - - - - - - - - 0%
Total B 7.4 227.3 598.5 426.3 368.1 545.5 783.0 2,956.1 56%
Total A + B 266.9 452.4 816.9 826.6 793.9 972.0 1,194.0 5,322.8 100%
Source: IFFDC Pratapgarh Coordination Office - Rajasthan.
DFIDI = Department for International Development (India).PPG = Participatory Planning and Group Formation.VOD = Village Organisation and Development.SWC = Soil and Water Conservation.WRD = Water Resource Development.
Total
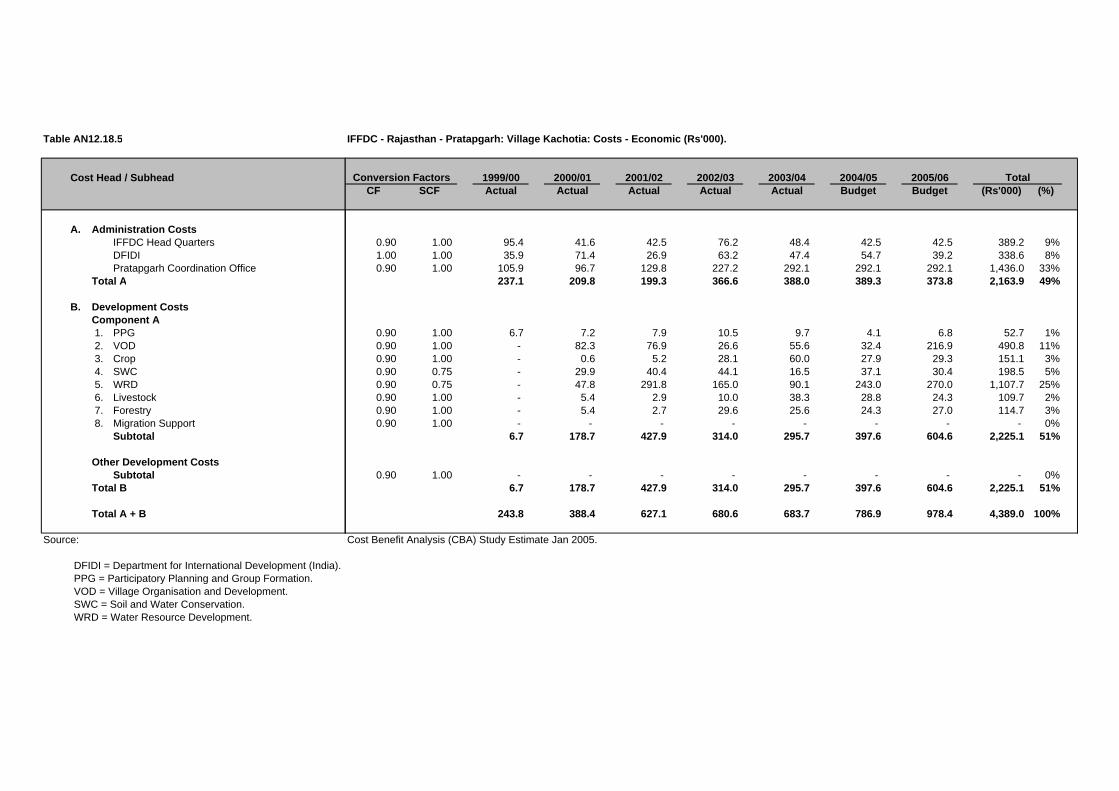
Table AN12.18.5
Cost Head / Subhead
A. Administration CostsIFFDC Head QuartersDFIDIPratapgarh Coordination Office
Total A
B. Development CostsComponent A 1. PPG 2. VOD 3. Crop 4. SWC 5. WRD 6. Livestock 7. Forestry 8. Migration Support
Subtotal
Other Development CostsSubtotal
Total B
Total A + B
Source:
DFIDI = Department for International Development (India).PPG = Participatory Planning and Group Formation.VOD = Village Organisation and Development.SWC = Soil and Water Conservation.WRD = Water Resource Development.
IFFDC - Rajasthan - Pratapgarh: Village Kachotia: Costs - Economic (Rs'000).
1999/00 2000/01 2001/02 2002/03 2003/04 2004/05 2005/06CF SCF Actual Actual Actual Actual Actual Budget Budget (Rs'000) (%)
0.90 1.00 95.4 41.6 42.5 76.2 48.4 42.5 42.5 389.2 9%1.00 1.00 35.9 71.4 26.9 63.2 47.4 54.7 39.2 338.6 8%0.90 1.00 105.9 96.7 129.8 227.2 292.1 292.1 292.1 1,436.0 33%
237.1 209.8 199.3 366.6 388.0 389.3 373.8 2,163.9 49%
0.90 1.00 6.7 7.2 7.9 10.5 9.7 4.1 6.8 52.7 1%0.90 1.00 - 82.3 76.9 26.6 55.6 32.4 216.9 490.8 11%0.90 1.00 - 0.6 5.2 28.1 60.0 27.9 29.3 151.1 3%0.90 0.75 - 29.9 40.4 44.1 16.5 37.1 30.4 198.5 5%0.90 0.75 - 47.8 291.8 165.0 90.1 243.0 270.0 1,107.7 25%0.90 1.00 - 5.4 2.9 10.0 38.3 28.8 24.3 109.7 2%0.90 1.00 - 5.4 2.7 29.6 25.6 24.3 27.0 114.7 3%0.90 1.00 - - - - - - - - 0%
6.7 178.7 427.9 314.0 295.7 397.6 604.6 2,225.1 51%
0.90 1.00 - - - - - - - - 0%6.7 178.7 427.9 314.0 295.7 397.6 604.6 2,225.1 51%
243.8 388.4 627.1 680.6 683.7 786.9 978.4 4,389.0 100%
Cost Benefit Analysis (CBA) Study Estimate Jan 2005.
TotalConversion Factors

Table AN12.18.6 IFFDC - Rajasthan - Pratapgarh: Village Kachotia: VOD Household Assumptions.
Without \ With Project UnitsVillage Organisation and Development Year 1 Year 2 Year 3
(Rs) (Rs) (Rs)
Development Activity:Village Organisation and Development
Before / Without Project Situation:
A. Self Help Groups (SHGs)Assumption Sum Zero Zero Zero - - -
B. Drudgery ReductionAssumption Sum Zero Zero Zero
Total Without Project Benefits - - -
After / With Project Situation:
A. Self Help Groups (SHGs)Assumptions
Average Saving / Household Rs 923 Households / Village No 108 Present Group Deposits Rs'000 99.7 99.7 102.7 105.8 Annual Savings Increase % 3%Deposits on Loan to Members % 37%SHG Interest Income % / Year 18%Assumed Benefit Rs'000 6.6 6.8 7.0
B. Drudgery ReductionAssumptions
Hours Saved / Day / Household No 1.0 Number of Days / Year / Household No 200 Days / Year / Household (8hrs/day) No 25.0 Households / Village No 108 Day Equivalent / Village No 2,700 Economic Value per Day (Rs/day) 25 Assumed Benefit Rs'000 67.5 67.5 67.5
Total With Project Benefits Rs'000 74.1 74.3 74.5
Incremental Benefits Rs'000 74.1 74.3 74.5
Source: Cost Benefit Analysis (CBA) Study Estimate Jan 2005.VOD = Village Organisation and Development.Participating households per village: Kachotia 108
Assumptions Benefits

Table AN12.18.6
Without \ With ProjectVillage Organisation and Development
Development Activity:Village Organisation and Development
Before / Without Project Situation:
A. Self Help Groups (SHGs)Assumption
B. Drudgery ReductionAssumption
Total Without Project Benefits
After / With Project Situation:
A. Self Help Groups (SHGs)Assumptions
Average Saving / HouseholdHouseholds / VillagePresent Group DepositsAnnual Savings IncreaseDeposits on Loan to MembersSHG Interest Income Assumed Benefit
B. Drudgery ReductionAssumptions
Hours Saved / Day / HouseholdNumber of Days / Year / HouseholdDays / Year / Household (8hrs/day)Households / VillageDay Equivalent / VillageEconomic Value per DayAssumed Benefit
Total With Project Benefits
Incremental Benefits
Source:VOD = Village Organisation and Development.Participating households per village: Kachotia
IFFDC - Rajasthan - Pratapgarh: Village Kachotia: Incremental VOD Benefit Stream (Rs'000).
Year 1 Year 2 Year 3 Year 4 Year 5 Year 6 Year 7 Year 8 Year 9 Year 101999/00 2000/01 2001/02 2002/03 2003/04 2004/05 2005/06 2006/07 2007/08 2008/09
- - - - - - - - - -
- - 99.7 102.7 105.8 108.9 112.2 115.6 119.0 122.6
- - 6.6 6.8 7.0 7.3 7.5 7.7 7.9 8.2
- - 67.5 67.5 67.5 67.5 67.5 67.5 67.5 67.5
- - 74.1 74.3 74.5 74.8 75.0 75.2 75.4 75.7
- - 74.1 74.3 74.5 74.8 75.0 75.2 75.4 75.7
Cost Benefit Analysis (CBA) Study Estimate Jan 2005.
Benefit Streams (Rs '000)

Table AN12.18.7 IFFDC - Rajasthan - Pratapgarh: Village Kachotia: Household Crop Net Margin Assumptions.
Without \ With Project UnitsCrop Technology, SWC and WRD Year 1 Year 2 Year 3
(Rs/HH) (Rs/HH) (Rs/HH)
Development Activity:Crop Technology, SWC and WRD
Before / Without Project Situation:Assumptions
Households (HHs) No 108 Crop Adoption Assumptions 100% 100% 100%
Kharif Crop Net Margin Rs/HH 1,180.0 1,180.0 1,180.0
Rabi Crop Net Margin Rs/HH 185.0 185.0 185.0 Total Without Project Benefits Rs/HH 1,365.1 1,365.1 1,365.1
After / With Project Situation:Assumptions
Households (HHs) No 108 Crop Adoption Assumptions 100% 100% 100%
Kharif Crop Net Margin Rs/HH 4,093.7 4,093.7 4,093.7
Rabi Crop Net Margin Rs/HH 1,155.3 1,155.3 1,155.3 Total With Project Benefits Rs/HH 5,249.0 5,249.0 5,249.0
Incremental Benefits Rs/HH 3,883.9 3,883.9 3,883.9
Source: Cost Benefit Analysis (CBA) Study Estimate Jan 2005.
BenefitsAssumptions
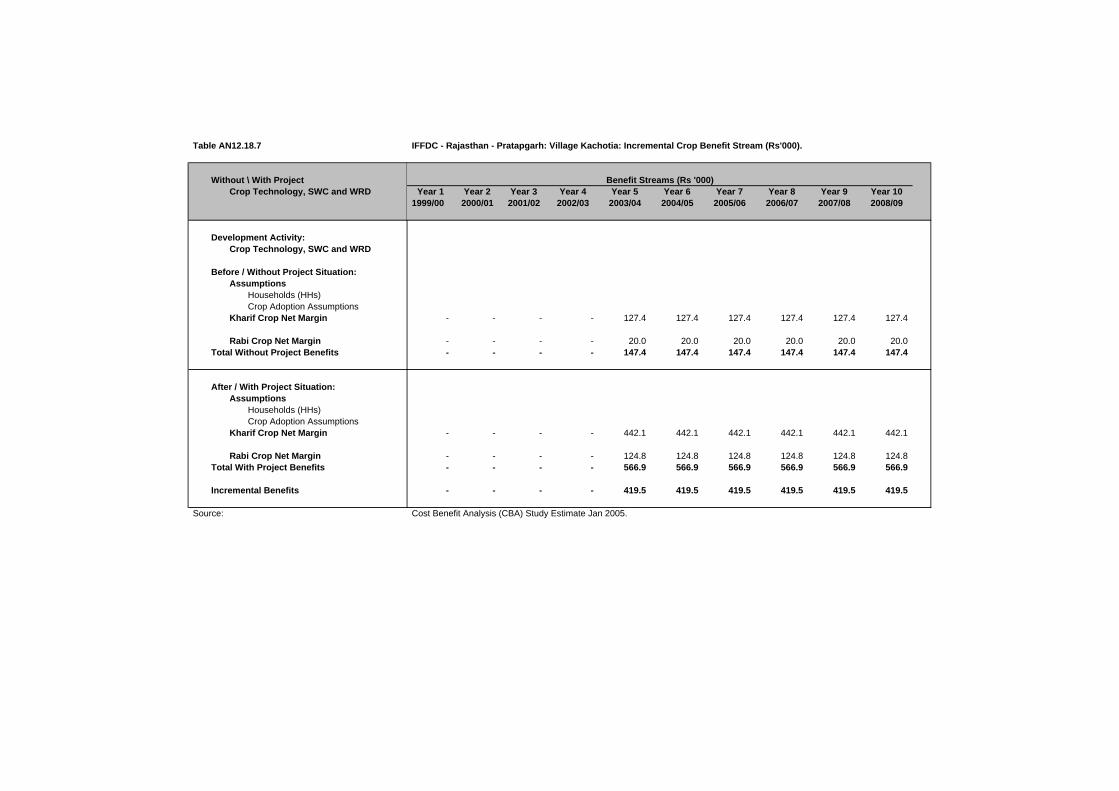
Table AN12.18.7
Without \ With ProjectCrop Technology, SWC and WRD
Development Activity:Crop Technology, SWC and WRD
Before / Without Project Situation:Assumptions
Households (HHs)Crop Adoption Assumptions
Kharif Crop Net Margin
Rabi Crop Net MarginTotal Without Project Benefits
After / With Project Situation:Assumptions
Households (HHs)Crop Adoption Assumptions
Kharif Crop Net Margin
Rabi Crop Net MarginTotal With Project Benefits
Incremental Benefits
Source:
IFFDC - Rajasthan - Pratapgarh: Village Kachotia: Incremental Crop Benefit Stream (Rs'000).
Year 1 Year 2 Year 3 Year 4 Year 5 Year 6 Year 7 Year 8 Year 9 Year 101999/00 2000/01 2001/02 2002/03 2003/04 2004/05 2005/06 2006/07 2007/08 2008/09
- - - - 127.4 127.4 127.4 127.4 127.4 127.4
- - - - 20.0 20.0 20.0 20.0 20.0 20.0 - - - - 147.4 147.4 147.4 147.4 147.4 147.4
- - - - 442.1 442.1 442.1 442.1 442.1 442.1
- - - - 124.8 124.8 124.8 124.8 124.8 124.8 - - - - 566.9 566.9 566.9 566.9 566.9 566.9
- - - - 419.5 419.5 419.5 419.5 419.5 419.5
Cost Benefit Analysis (CBA) Study Estimate Jan 2005.
Benefit Streams (Rs '000)

Table AN12.18.8 IFFDC - Rajasthan - Pratapgarh: Village Kachotia: Household Livestock Net Margin Assumption
Without \ With Project UnitsLivestock Year 1 Year 2 Year 3
(Rs) (Rs) (Rs)
Development Activity:Livestock
Before / Without Project Situation:Assumptions
Households (HHs) No 108 Annual Livestock Net Margin Rs/HH
Total Without Project Benefits 1,033.3 1,033.3 1,033.3
After / With Project Situation:
Development Activity:Assumptions
Households (HHs) No 108 Adoption Assumptions Percent 55% 78% 100%
Annual Livestock Net Margin Rs/HHTotal With Project Benefits 1,494.1 2,105.4 2,716.6
Incremental Benefits Rs/HH 460.9 1,072.1 1,683.3
Source: Cost Benefit Analysis (CBA) Study Estimate Jan 2005.
BenefitsAssumptions

Table AN12.18.8
Without \ With ProjectLivestock
Development Activity:Livestock
Before / Without Project Situation:Assumptions
Households (HHs)Annual Livestock Net Margin
Total Without Project Benefits
After / With Project Situation:
Development Activity:Assumptions
Households (HHs)Adoption Assumptions
Annual Livestock Net MarginTotal With Project Benefits
Incremental Benefits
Source:
IFFDC - Rajasthan - Pratapgarh: Village Kachotia: Incremental Livestock Benefit Stream (Rs'000).
Year 1 Year 2 Year 3 Year 4 Year 5 Year 6 Year 7 Year 8 Year 9 Year 101999/00 2000/01 2001/02 2002/03 2003/04 2004/05 2005/06 2006/07 2007/08 2008/09
- - - - 111.6 111.6 111.6 111.6 111.6 111.6
- - - - 161.4 227.4 293.4 293.4 293.4 293.4
- - - - 49.8 115.8 181.8 181.8 181.8 181.8
Cost Benefit Analysis (CBA) Study Estimate Jan 2005.
Benefit Streams (Rs '000)

Table AN12.18.9 IFFDC - Rajasthan - Pratapgarh: Village Kachotia: Forestry Benefit Assumptions.
Without \ With Project UnitsForestry Year 1 Year 2 Year 3
(Rs) (Rs) (Rs)
Development Activity:Forestry
Before / Without Project Situation:AssumptionsHouseholds (HHs) No 108 Annual Forestry Net Margin Rs/HH
Total Without Project Benefits - - -
After / With Project Situation:AssumptionsHouseholds (HHs) No 108 Adoption Assumptions Percent 55% 78% 100%Annual Forestry Net Margin Rs/HH
Total With Project Benefits 192.5 273.0 350.0
Incremental Benefits Rs/HH 192.5 273.0 350.0
Source: Cost Benefit Analysis (CBA) Study Estimate Jan 2005.
BenefitsAssumptions

Table AN12.18.9
Without \ With ProjectForestry
Development Activity:Forestry
Before / Without Project Situation:AssumptionsHouseholds (HHs)Annual Forestry Net Margin
Total Without Project Benefits
After / With Project Situation:AssumptionsHouseholds (HHs)Adoption AssumptionsAnnual Forestry Net Margin
Total With Project Benefits
Incremental Benefits
Source:
IFFDC - Rajasthan - Pratapgarh: Village Kachotia: Incremental Forestry Benefit Stream (Rs'000).
Year 1 Year 2 Year 3 Year 4 Year 5 Year 6 Year 7 Year 8 Year 9 Year 101999/00 2000/01 2001/02 2002/03 2003/04 2004/05 2005/06 2006/07 2007/08 2008/09
- - - - - - - - - -
- - - 20.8 29.5 37.8 37.8 37.8 37.8 37.8
- - - 20.8 29.5 37.8 37.8 37.8 37.8 37.8
Cost Benefit Analysis (CBA) Study Estimate Jan 2005.
Benefit Streams (Rs '000)

Table AN12.18.10 IFFDC - Rajasthan - Pratapgarh: Village Kachotia: Migration Support Benefit Assumptions.
Without \ With ProjectMigration Support Year 1 Year 2 Year 3
(Rs) (Rs) (Rs)
Development Activity:Migration Support
Before / Without Project Situation:Assumptions
Economic Value per Day Rs/day 25.0 Days / Month / Household No - Economic Value per Month Rs/month - Months Migration / Year Months 4.0 Economic Value per Household Rs/HH - Households per Village No 108 Households per Village Migrating Percent 45%
Total Without Project Benefits Rs/Village - - -
After / With Project Situation:Assumptions
Economic Value per Day \1 Rs/day 25.0 30% 32.5 Days / Month / Household No - 30% - Economic Value per Month Rs/month - - Months Migration / Year Months 4.0 -20% 3.2 Economic Value per Household Rs/HH - - Households per Village No 108 108 Households per Village Migrating Percent 45% -20% 36%
Subtotal Migration Income Rs/Village - - -
Other Income Sum (Rs) - - - - - -
Total With Project Benefits Rs/Village - - -
Incremental Benefits Rs/Village - - -
Source: Cost Benefit Analysis (CBA) Study Estimate Jan 2005.
1\ Financial Wages (Rs/day):Skill Labour - Rs 160
Casual Labour :Male - Rs 40Female - Rs 30
BenefitsAssumptions
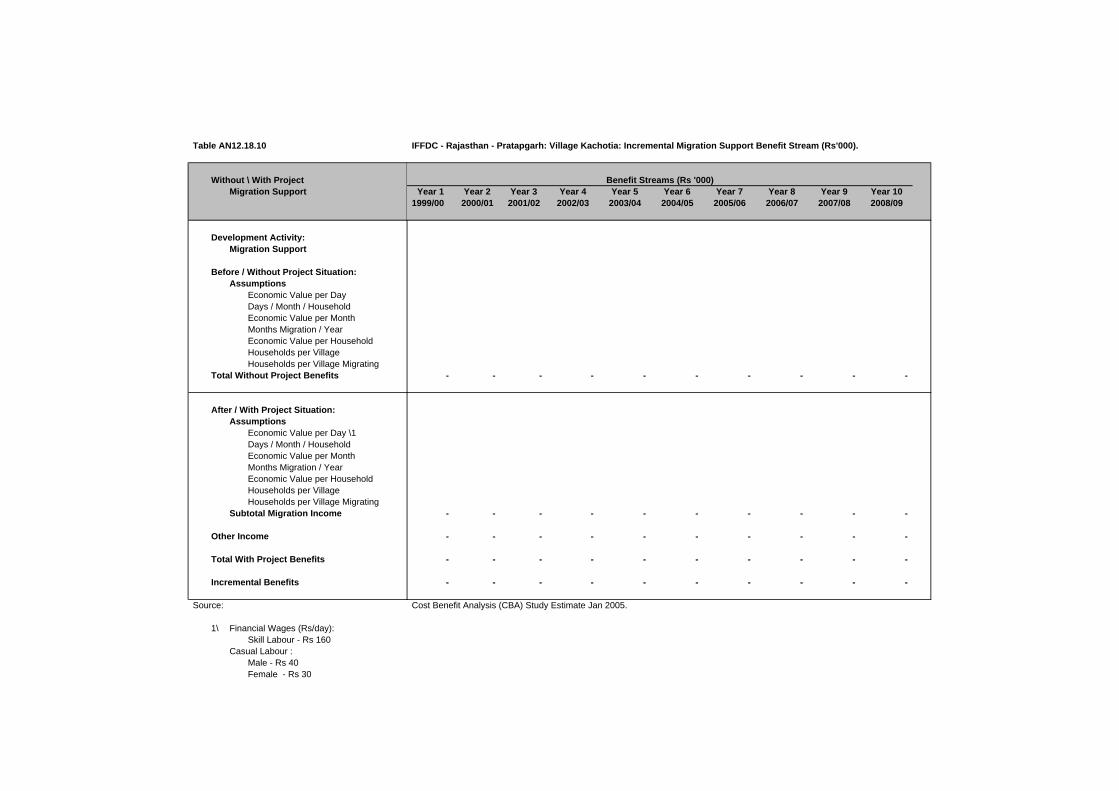
Table AN12.18.10
Without \ With ProjectMigration Support
Development Activity:Migration Support
Before / Without Project Situation:Assumptions
Economic Value per Day Days / Month / Household Economic Value per Month Months Migration / Year Economic Value per Household Households per Village Households per Village Migrating
Total Without Project Benefits
After / With Project Situation:Assumptions
Economic Value per Day \1Days / Month / Household Economic Value per Month Months Migration / Year Economic Value per Household Households per Village Households per Village Migrating
Subtotal Migration Income
Other Income
Total With Project Benefits
Incremental Benefits
Source:
1\ Financial Wages (Rs/day):Skill Labour - Rs 160
Casual Labour :Male - Rs 40Female - Rs 30
IFFDC - Rajasthan - Pratapgarh: Village Kachotia: Incremental Migration Support Benefit Stream (Rs'000).
Year 1 Year 2 Year 3 Year 4 Year 5 Year 6 Year 7 Year 8 Year 9 Year 101999/00 2000/01 2001/02 2002/03 2003/04 2004/05 2005/06 2006/07 2007/08 2008/09
- - - - - - - - - -
- - - - - - - - - -
- - - - - - - - - -
- - - - - - - - - -
- - - - - - - - - -
Cost Benefit Analysis (CBA) Study Estimate Jan 2005.
Benefit Streams (Rs '000)

Table AN12.18.11 IFFDC - Rajasthan - Pratapgarh: Village Kachotia: Weighted Household Crop Net Margin Summary (Rs/Household).
Item WBR(%) Khalif Rabi Total Khalif Rabi Total Khalif Rabi Total
Phase IIWell Being Ranking - Very Poor
Household Net Margin (Rs) 44.0% 834.6 102.5 937.1 1,849.8 1,067.8 2,917.6 1,015.2 965.3 1,980.5 Well Being Ranking - Very Poor
Household Net Margin (Rs) 30.0% 637.7 - 637.7 4,803.0 220.7 5,023.7 4,165.3 220.7 4,386.0 Well Being Ranking - Poor
Household Net Margin (Rs) 19.0% 994.0 89.3 1,083.3 3,711.4 2,508.3 6,219.6 2,717.4 2,419.0 5,136.4 Well Being Ranking - Better Off
Household Net Margin (Rs) 7.0% 6,180.9 1,756.7 7,937.5 16,195.9 2,039.3 18,235.2 10,015.0 282.7 10,297.7
Well Being Ranking - WeightedHousehold Net Margin (Rs) 100.0% 1,180.0 185.0 1,365.1 4,093.7 1,155.3 5,249.0 2,913.6 970.3 3,883.9
Phase I \1Well Being Ranking - Very Poor
Household Net Margin (Rs) 44.0% 436.3 267.5 703.8 3,866.5 1,668.8 5,535.3 3,430.3 1,401.3 4,831.5 Well Being Ranking - Very Poor
Household Net Margin (Rs) 30.0% 485.8 657.5 1,143.3 10,136.0 5,690.3 15,826.3 9,650.3 5,032.8 14,683.0 Well Being Ranking - Poor
Household Net Margin (Rs) 19.0% 986.3 3,385.0 4,371.3 9,457.5 5,195.0 14,652.5 8,471.3 1,810.0 10,281.3 Well Being Ranking - Better Off
Household Net Margin (Rs) 7.0% 2,778.0 937.0 3,715.0 4,915.0 9,560.0 14,475.0 2,137.0 8,623.0 10,760.0
Well Being Ranking - WeightedHousehold Net Margin (Rs) 100.0% 719.5 1,023.7 1,743.2 6,883.0 4,097.6 10,980.6 6,163.5 3,073.9 9,237.4
Source: Study of Impact of WIRFP on Net Incomes of Target Households, Jan 2004.WBR = IFFDC Household Well Being Ranking. Survey figures adjusted to Village Profile WBR.\1 GVT - Madhya Pradesh - Phase I: Village Naganwat Choti: Weighted Household Crop Net Margin Summary.
Before / Without Project After / With Project Increment

Table AN12.18.12 IFFDC - Rajasthan - Pratapgarh: Village Kachotia: Weighted Household Crop Net Margin Sensitivity Analysis (Rs/Household).
Item EIRRKhalif Rabi Total Khalif Rabi Total Khalif Rabi Total
Development Activity:Crop Technology, SWC and WRD
Weighted Net Margin (Phase II)Household Net Margin (Rs) 1,180.0 185.0 1,365.1 4,093.7 1,155.3 5,249.0 2,913.6 970.3 3,883.9 Incremental Benefit (Phase II / Phase I) 42%
Base Case AssumptionsHousehold Net Margin (Rs) 1,180.0 185.0 1,365.1 4,093.7 1,155.3 5,249.0 2,913.6 970.3 3,883.9 Incremental Benefit (Phase II / Phase I) 42%Sensitivity Increase (%) 0%Development Acivity 17%Overall Village 8%
Sensitivity AssumptionsHousehold Net Margin (Rs) 1,180.0 185.0 1,365.1 5,321.8 1,501.9 6,823.7 4,141.7 1,316.9 5,458.6 Incremental Benefit (Phase II / Phase I) 59%Sensitivity Increase (%) 0%Development Acivity 28%Overall Village 12%
Weighted Net Margin (Phase I)Household Net Margin (Rs) 719.5 1,023.7 1,743.2 6,883.0 4,097.6 10,980.6 6,163.5 3,073.9 9,237.4
Source: Study of Impact of WIRFP on Net Incomes of Target Households, Jan 2004.EIRR = Economic Internal Rate of Return (rate at which NPV equal to zero).
Before / Without Project After / With Project Increment

Table AN12.18.13 IFFDC - Rajasthan - Pratapgarh: Village Kachotia: Weighted Household Livestock Net Margin Summary (Rs/Household).
Well Being Ranking Weight(%) Herd Value Net Margin Herd Value Net Margin Herd Value Net Margin
Phase I - Well Being Ranking (WBR) \1Madhya Pradesh - WBR Weighted DataVery Poor 44.0%
Average 580 (185.0) 5,650 412.5 474 597.5 Poor 30.0%
Average 2,350 982.5 8,250 2,141.0 1,180 1,158.5 Moderate 19.0%
Average 14,700 6,730.0 1,900 2,820.0 1,900 (3,910.0)Better Off 7.0%
Average 15,580 3,000.0 14,600 10,790.0 (196) 7,790.0
Phase I - WBR Weighted Data 100.0% 4,844 1,702.1 6,344 2,114.9 910 412.9
Phase II - Well Being Ranking (WBR)
Very Poor 44.0%Average 5,756 149.2 10,970 1,446.4 1,043 1,297.2
Poor 30.0%Average 13,128 852.2 25,979 3,008.8 2,570 2,156.8
Moderate 19.0%Average 13,525 4,035.1 27,020 5,249.5 2,699 1,214.4
Better Off 7.0%Average 12,700 (781.7) 41,873 2,573.3 5,835 3,355.0
Phase II - WBR Weighted Data 100.0% 9,930 1,033.3 20,685 2,716.6 2,151 1,683.4
Source: Study of Impact of WIRFP on Net Incomes of Target Households, Jan 2004.WBR = IFFDC Household Well Being Ranking. Survey figures adjusted to Village Profile WBR.
\1 GVT - Madhya Pradesh - Phase I: Village Naganwat Choti: Weighted Household Livestock Net Margin Summary.
Before / Without Project After / With Project Increment \1

WIRFP - Phase II - Cost Benefit Analysis Study
Tables AN12.0 Individual Village Cost Benefit Analysis
Tables AN12.19 IFFDC - Rajasthan - Pratapgarh: Village Moti Kheri.
Table AN12.19.1 IFFDC - Rajasthan - Pratapgarh: Village Moti Kheri: Village Profile.
Table AN12.19.2 IFFDC - Rajasthan - Pratapgarh: Village Moti Kheri: Cost Benefit Analysis Summary (Rs'000).Table AN12.19.3 IFFDC - Rajasthan - Pratapgarh: Village Moti Kheri: Cost Benefit Analysis Development Activity Summary A (Rs'000).Table AN12.19.4 IFFDC - Rajasthan - Pratapgarh: Village Moti Kheri: Cost Benefit Analysis Development Activity Summary B (Rs'000).
Table AN12.19.5 IFFDC - Rajasthan - Pratapgarh: Village Moti Kheri: Costs - Financial (Rs'000).IFFDC - Rajasthan - Pratapgarh: Village Moti Kheri: Costs - Economic (Rs'000).
Table AN12.19.6 IFFDC - Rajasthan - Pratapgarh: Village Moti Kheri: VOD Household Assumptions.IFFDC - Rajasthan - Pratapgarh: Village Moti Kheri: Incremental VOD Benefit Stream (Rs'000).
Table AN12.19.7 IFFDC - Rajasthan - Pratapgarh: Village Moti Kheri: Household Crop Net Margin Assumptions.IFFDC - Rajasthan - Pratapgarh: Village Moti Kheri: Incremental Crop Benefit Stream (Rs'000).
Table AN12.19.8 IFFDC - Rajasthan - Pratapgarh: Village Moti Kheri: Household Livestock Net Margin Assumptions.IFFDC - Rajasthan - Pratapgarh: Village Moti Kheri: Incremental Livestock Benefit Stream (Rs'000).
Table AN12.19.9 IFFDC - Rajasthan - Pratapgarh: Village Moti Kheri: Forestry Benefit Assumptions.IFFDC - Rajasthan - Pratapgarh: Village Moti Kheri: Incremental Forestry Benefit Stream (Rs'000).
Table AN12.19.10 IFFDC - Rajasthan - Pratapgarh: Village Moti Kheri: Migration Support Benefit Assumptions.IFFDC - Rajasthan - Pratapgarh: Village Moti Kheri: Incremental Migration Support Benefit Stream (Rs'000).
Table AN12.19.11 IFFDC - Rajasthan - Pratapgarh: Village Moti Kheri: Weighted Household Crop Net Margin Summary (Rs/Household).Table AN12.19.12 IFFDC - Rajasthan - Pratapgarh: Village Moti Kheri: Weighted Household Crop Net Margin Sensitivity Analysis (Rs/Household).
Table AN12.19.13 IFFDC - Rajasthan - Pratapgarh: Village Moti Kheri: Weighted Household Livestock Net Margin Summary.

Table AN12.19.1 IFFDC - Rajasthan - Pratapgarh: Village Moti Kheri: Village Profile.
Village Profile \1
A. Background E. Land Resource (ha)Village Name Moti Kheri Total Area - District Pratapgarh Revenue Land - State Rajasthan Forest Area - R -
Pasture Land - Participatory Planning Process (PPP) Arable Land -
Village entry Oct-99 - PRA Nov-00CPA Nov-00 F. Livestock
Oxen 200 B. Infrastructure Cows 193
Hand Pumps (no) 7 Buffalo 78 Wells (no) 50 Goats 271 Linked by Road 5 km Poultry 93 Electrification NoSchool Primary G. Self Help Groups (No Households)
1 Group 1 12 C. Demographic Data 2 Group 2 7
Households (no) 115 3 Group 3 18 Participating Households 112 4 Group 4 11 Population (Adults) 627 5 Group 5 19
Adults: 6 Group 6 13 Male 312 7 Group 7 14 Female 315 8 Group 8 15 Children: 9 Group 9 12 Boys N/A 10 Group 10 14 Girls N/A 11 Group 11 18
12 Group 12 14 D. Well Being Ranking (No Households) 13 Group 13 11
Very Poor 27 23.5% Total Memberhip 178 Poor 33 28.7%Moderate 46 40.0%Better Off 9 7.8%Total 115 100%
Source: IFFDC Pratapgarh Coordination Office - Rajasthan.\1 Subject to final adjustment following consolidation exercise prior to Annual Review Meeting (ARM) in Feb 2005.

Table AN12.19.2 IFFDC - Rajasthan - Pratapgarh: Village Moti Kheri: Cost Benefit Analysis Summary (Rs'000).
Administration Costs / Development Activity EIRR \1 Year 1 Year 2 Year 3 Year 4 Year 5 Year 6 Year 7 Year 8 Year 9 Year 10(10%) (%) 1999/00 2000/01 2001/02 2002/03 2003/04 2004/05 2005/06 2006/07 2007/08 2008/09
A. Administration CostsTotal A N/A (1,449) 96% 237.1 209.8 199.3 366.6 388.0 389.3 373.8 37.4 37.4 37.4
B. Development Intervention Component A 1. PPGF
Net Incremental Benefits N/A (53) 4% (6.6) (20.2) (6.1) (13.6) (10.3) (6.8) (9.1) (1.7) (1.7) (1.7)
2. VODNet Incremental Benefits 19% 41 -3% (4.3) (11.3) 69.4 (24.5) (25.5) (58.7) (222.0) 55.6 56.2 56.8
3/5.Crop Technology, SWC and WRDNet Incremental Benefits 2% (695) 46% - (312.4) (426.3) (462.4) (354.9) (171.9) (106.7) 168.0 168.0 168.0
6. LivestockNet Incremental Benefits 91% 578 -38% - (6.8) (28.3) (32.8) 69.1 138.0 86.9 163.8 163.8 163.8
7. ForestryNet Incremental Benefits 27% 74 -5% - (27.3) (16.3) (4.7) 3.1 13.9 (11.7) 36.9 36.9 36.9
8. Migration SupportNet Incremental Benefits N/A - 0% - - - - - - - - - -
SummaryNet Incremental Benefits 2% (1,504) 100% (248.0) (587.6) (606.9) (904.6) (706.7) (474.8) (636.4) 385.3 385.9 386.5
Sensitivity AnalysisAnalysis Period - Sustainabilty
12 Years N/A (1,997)20 Years (Base Case) 2% (1,504)25 Years 4% (1,360)30 Years 6% (1,278)
Costs - AdministrationInvestment Costs Decreased by 20 percent 3% (1,214)
Costs - Administration and DevelopmentRecurrent Costs Increased by 20 percent -1% (1,849)
Benefits - Crop, SWC and WRDCrop Benefits Increased by 20 percent 6% (1,025)Livestock Benefits Increased by 20 percent 4% (1,179)
Source: Cost Benefit Analysis (CBA) Study Estimate Jan 2005.\1 EIRR = Economic Internal Rate of Return (rate at which NPV equal to zero).\2 NPV = Net Present Value of net incremental benefits at 12% (indicative opportunity cost of capital for rural development projects in India).
N/A = Not analysed as EIRR negative.
NPV \2

Table AN12.19.3 IFFDC - Rajasthan - Pratapgarh: Village Moti Kheri: Cost Benefit Analysis Development Activity Summary A (Rs'000).
Administration Costs / Development Activity EIRR \1 Year 1 Year 2 Year 3 Year 4 Year 5 Year 6 Year 7 Year 8 Year 9 Year 10(10%) (%) 1999/00 2000/01 2001/02 2002/03 2003/04 2004/05 2005/06 2006/07 2007/08 2008/09
A. Administration CostsInvestment 237.1 209.8 199.3 366.6 388.0 389.3 373.8 - - - Projected - - - - - - - 37.4 37.4 37.4
Total A N/A (1,449) 96% 237.1 209.8 199.3 366.6 388.0 389.3 373.8 37.4 37.4 37.4
B. Development Intervention Component A 1. PPGF
Cost StreamInvestment 6.6 20.0 5.5 12.8 9.2 5.4 7.7 - - - Recurrent - 0.2 0.7 0.8 1.1 1.4 1.5 1.7 1.7 1.7 Total Costs 6.6 20.2 6.1 13.6 10.3 6.8 9.1 1.7 1.7 1.7
Benefit StreamBefore / Without Project - - - - - - - - - - After / With Project - - - - - - - - - - Incremental Benefits - - - - - - - - - -
Net Incremental Benefits N/A (53) 4% (6.6) (20.2) (6.1) (13.6) (10.3) (6.8) (9.1) (1.7) (1.7) (1.7)
2. VODCost Stream
Investment 4.3 11.0 16.5 110.1 106.1 134.6 291.6 - - - Recurrent - 0.2 0.8 1.6 7.1 12.4 19.1 33.7 33.7 33.7 Total Costs 4.3 11.3 17.3 111.7 113.2 147.0 310.7 33.7 33.7 33.7
Benefit StreamBefore / Without Project - - - - - - - - - - After / With Project - - 86.7 87.2 87.7 88.2 88.8 89.3 89.9 90.5 Incremental Benefits - - 86.7 87.2 87.7 88.2 88.8 89.3 89.9 90.5
Net Incremental Benefits 19% 41 -3% (4.3) (11.3) 69.4 (24.5) (25.5) (58.7) (222.0) 55.6 56.2 56.8
3/5.Crop Technology, SWC and WRDCost Stream
InvestmentCrop Technology - 2.0 4.2 34.6 73.2 80.1 52.2 - - - Soil Water Conservation - 253.1 124.1 39.7 15.2 3.4 - - - - Water Resource Development - 57.3 257.8 293.5 628.6 352.5 263.3 - - -
RecurrentCrop Technology - - 0.0 0.2 1.0 2.9 4.9 6.2 6.2 6.2 Soil Water Conservation - - 31.6 47.1 52.1 54.0 54.4 54.4 54.4 54.4 Water Resource Development - - 8.6 47.3 91.3 185.6 238.5 278.0 278.0 278.0
Total Costs - 312.4 426.3 462.4 861.5 678.5 613.2 338.5 338.5 338.5 Benefit Stream
Before / Without Project - - - - 156.7 156.7 156.7 156.7 156.7 156.7 After / With Project - - - - 663.2 663.2 663.2 663.2 663.2 663.2 Incremental Benefits - - - - 506.5 506.5 506.5 506.5 506.5 506.5
Net Incremental Benefits 2% (695) 46% - (312.4) (426.3) (462.4) (354.9) (171.9) (106.7) 168.0 168.0 168.0
Source: Cost Benefit Analysis (CBA) Study Estimate Jan 2005.\1 EIRR = Economic Internal Rate of Return (rate at which NPV equal to zero).\2 NPV = Net Present Value of net incremental benefits at 12% (indicative opportunity cost of capital for rural development projects in India).
N/A = Not analysed as EIRR negative.
NPV \2

Table AN12.19.4 IFFDC - Rajasthan - Pratapgarh: Village Moti Kheri: Cost Benefit Analysis Development Activity Summary B (Rs'000).
Administration Costs / Development Activity EIRR \1 Year 1 Year 2 Year 3 Year 4 Year 5 Year 6 Year 7 Year 8 Year 9 Year 10(10%) (%) 1999/00 2000/01 2001/02 2002/03 2003/04 2004/05 2005/06 2006/07 2007/08 2008/09
6. LivestockCost Stream
Investment - 6.8 27.6 38.6 21.1 38.3 85.5 - - - Recurrent - - 0.7 3.4 7.3 9.4 13.2 21.8 21.8 21.8 Total Costs - 6.8 28.3 42.0 28.4 47.7 98.7 21.8 21.8 21.8
Benefit StreamBefore / Without Project - - - 206.3 206.3 206.3 206.3 206.3 206.3 206.3 After / With Project - - - 215.6 303.8 392.0 392.0 392.0 392.0 392.0 Incremental Benefits - - - 9.2 97.4 185.6 185.6 185.6 185.6 185.6
Net Incremental Benefits 91% 578 -38% - (6.8) (28.3) (32.8) 69.1 138.0 86.9 163.8 163.8 163.8
7. ForestryCost Stream
Investment - 27.3 13.6 31.4 33.4 31.5 54.0 - - - Recurrent - - 2.7 4.1 7.2 10.6 13.7 19.1 19.1 19.1 Total Costs - 27.3 16.3 35.5 40.6 42.1 67.7 19.1 19.1 19.1
Benefit StreamBefore / Without Project - - - - - - - - - - After / With Project - - - 30.8 43.7 56.0 56.0 56.0 56.0 56.0 Incremental Benefits - - - 30.8 43.7 56.0 56.0 56.0 56.0 56.0
Net Incremental Benefits 27% 74 -5% - (27.3) (16.3) (4.7) 3.1 13.9 (11.7) 36.9 36.9 36.9 EIRR
8. Migration SupportCost Stream
Investment - - - - - - - - - - Recurrent - - - - - - - - - - Total Costs - - - - - - - - - -
Benefit StreamBefore / Without Project - - - - - - - - - - After / With Project - - - - - - - - - - Incremental Benefits - - - - - - - - - -
Net Incremental Benefits N/A - 0% - - - - - - - - - -
SummaryCost Stream
Investment 248.0 587.2 648.5 927.4 1,274.8 1,035.1 1,128.0 - - - Recurrent - 0.4 45.1 104.5 167.2 276.2 345.3 452.2 452.2 452.2 Total Costs 248.0 587.6 693.6 1,031.9 1,442.0 1,311.2 1,473.3 452.2 452.2 452.2
Benefit StreamBefore / Without Project - - - 206.3 363.0 363.0 363.0 363.0 363.0 363.0 After / With Project - - 86.7 333.6 1,098.3 1,199.4 1,199.9 1,200.5 1,201.1 1,201.7 Incremental Benefits - - 86.7 127.2 735.3 836.4 836.9 837.5 838.1 838.7
Net Incremental Benefits 2% (1,504) 100% (248.0) (587.6) (606.9) (904.6) (706.7) (474.8) (636.4) 385.3 385.9 386.5
Source: Cost Benefit Analysis (CBA) Study Estimate Jan 2005.
NPV \2

Table AN12.19.5 IFFDC - Rajasthan - Pratapgarh: Village Moti Kheri: Costs - Financial (Rs'000).
Cost Head / Subhead 1999/00 2000/01 2001/02 2002/03 2003/04 2004/05 2005/06Actual Actual Actual Actual Actual Budget Budget (Rs'000) (%)
A. Administration CostsIFFDC Head Quarters (Delhi) 106.0 46.3 47.3 84.7 53.8 47.2 47.2 432.5 6%DFIDI 35.9 71.4 26.9 63.2 47.4 54.7 39.2 338.6 5%Pratapgarh Coordination Office, Rajasthan 117.6 107.5 144.2 252.5 324.6 324.6 324.6 1,595.6 22%
Total A 259.5 225.1 218.4 400.3 425.8 426.5 411.0 2,366.7 32%
B. Development Costs 0% 0%Component A 1. PPG 7.3 22.2 6.1 14.2 10.2 6.0 8.5 74.6 1% 2. VOD 4.8 12.3 18.4 122.3 117.9 149.5 324.0 749.1 10% 3. Crop - 2.2 4.6 38.5 81.4 89.0 58.0 273.7 4% 4. SWC - 375.0 183.9 58.8 22.5 5.0 - 645.1 9% 5. WRD - 84.9 381.9 434.8 931.3 522.3 390.0 2,745.2 38% 6. Livestock - 7.6 30.6 42.9 23.4 42.5 95.0 242.0 3% 7. Forestry - 30.3 15.1 34.9 37.1 35.0 60.0 212.5 3% 8. Migration Support - - - - - - - - 0%
Subtotal 12.1 534.4 640.6 746.4 1,223.8 849.3 935.5 4,942.2 68%
Other Development CostsSubtotal - - - - - - - - 0%
Total B 12.1 534.4 640.6 746.4 1,223.8 849.3 935.5 4,942.2 68%
Total A + B 271.6 759.5 859.0 1,146.8 1,649.7 1,275.8 1,346.5 7,308.9 100%
Source: IFFDC Pratapgarh Coordination Office - Rajasthan.
DFIDI = Department for International Development (India).PPG = Participatory Planning and Group Formation.VOD = Village Organisation and Development.SWC = Soil and Water Conservation.WRD = Water Resource Development.
Total

Table AN12.19.5
Cost Head / Subhead
A. Administration CostsIFFDC Head Quarters (Delhi)DFIDIPratapgarh Coordination Office, Rajasthan
Total A
B. Development CostsComponent A 1. PPG 2. VOD 3. Crop 4. SWC 5. WRD 6. Livestock 7. Forestry 8. Migration Support
Subtotal
Other Development CostsSubtotal
Total B
Total A + B
Source:
DFIDI = Department for International Development (India).PPG = Participatory Planning and Group Formation.VOD = Village Organisation and Development.SWC = Soil and Water Conservation.WRD = Water Resource Development.
IFFDC - Rajasthan - Pratapgarh: Village Moti Kheri: Costs - Economic (Rs'000).
1999/00 2000/01 2001/02 2002/03 2003/04 2004/05 2005/06CF SCF Actual Actual Actual Actual Actual Budget Budget (Rs'000) (%)
0.90 1.00 95.4 41.6 42.5 76.2 48.4 42.5 42.5 389.2 7%1.00 1.00 35.9 71.4 26.9 63.2 47.4 54.7 39.2 338.6 6%0.90 1.00 105.9 96.7 129.8 227.2 292.1 292.1 292.1 1,436.0 25%
237.1 209.8 199.3 366.6 388.0 389.3 373.8 2,163.9 37%
0.90 1.00 6.6 20.0 5.5 12.8 9.2 5.4 7.7 67.1 1%0.90 1.00 4.3 11.0 16.5 110.1 106.1 134.6 291.6 674.2 12%0.90 1.00 - 2.0 4.2 34.6 73.2 80.1 52.2 246.3 4%0.90 0.75 - 253.1 124.1 39.7 15.2 3.4 - 435.4 7%0.90 0.75 - 57.3 257.8 293.5 628.6 352.5 263.3 1,853.0 32%0.90 1.00 - 6.8 27.6 38.6 21.1 38.3 85.5 217.8 4%0.90 1.00 - 27.3 13.6 31.4 33.4 31.5 54.0 191.2 3%0.90 1.00 - - - - - - - - 0%
10.9 377.5 449.2 560.7 886.8 645.7 754.2 3,685.1 63%
0.90 1.00 - - - - - - - - 0%10.9 377.5 449.2 560.7 886.8 645.7 754.2 3,685.1 63%
248.0 587.2 648.5 927.4 1,274.8 1,035.1 1,128.0 5,849.1 100%
Cost Benefit Analysis (CBA) Study Estimate Jan 2005.
TotalConversion Factors

Table AN12.19.6 IFFDC - Rajasthan - Pratapgarh: Village Moti Kheri: VOD Household Assumptions.
Without \ With Project UnitsYear 1 Year 2 Year 3(Rs) (Rs) (Rs)
Development Activity:Village Organisation and Development
Before / Without Project Situation:
A. Self Help Groups (SHGs)Assumption Sum Zero Zero Zero - - -
B. Drudgery ReductionAssumption Sum Zero Zero Zero
Total Without Project Benefits - - -
After / With Project Situation:
A. Self Help Groups (SHGs)Assumptions
Average Saving / Household Rs 2,482 Households / Village No 112 Present Group Deposits Rs'000 278.0 278.0 286.3 294.9 Annual Savings Increase % 3%Deposits on Loan to Members % 40%SHG Interest Income % / Year 15%Assumed Benefit Rs'000 16.7 17.2 17.7
B. Drudgery ReductionAssumptions
Hours Saved / Day / Household No 1.0 Number of Days / Year / Household No 200 Days / Year / Household (8hrs/day) No 25.0 Households / Village No 112 Day Equivalent / Village No 2,800 Economic Value per Day (Rs/day) 25 Assumed Benefit Rs'000 70.0 70.0 70.0
Total With Project Benefits Rs'000 86.7 87.2 87.7
Incremental Benefits Rs'000 86.7 87.2 87.7
Source: Cost Benefit Analysis (CBA) Study Estimate Jan 2005.VOD = Village Organisation and Development.Participating households per village: Moti Kheri 112
Assumptions Benefits

Table AN12.19.6
Without \ With Project
Development Activity:Village Organisation and Development
Before / Without Project Situation:
A. Self Help Groups (SHGs)Assumption
B. Drudgery ReductionAssumption
Total Without Project Benefits
After / With Project Situation:
A. Self Help Groups (SHGs)Assumptions
Average Saving / HouseholdHouseholds / VillagePresent Group DepositsAnnual Savings IncreaseDeposits on Loan to MembersSHG Interest Income Assumed Benefit
B. Drudgery ReductionAssumptions
Hours Saved / Day / HouseholdNumber of Days / Year / HouseholdDays / Year / Household (8hrs/day)Households / VillageDay Equivalent / VillageEconomic Value per DayAssumed Benefit
Total With Project Benefits
Incremental Benefits
Source:VOD = Village Organisation and Development.Participating households per village: Moti Kheri
IFFDC - Rajasthan - Pratapgarh: Village Moti Kheri: Incremental VOD Benefit Stream (Rs'000).
Year 1 Year 2 Year 3 Year 4 Year 5 Year 6 Year 7 Year 8 Year 9 Year 101999/00 2000/01 2001/02 2002/03 2003/04 2004/05 2005/06 2006/07 2007/08 2008/09
- - - - - - - - - -
- - 278.0 286.3 294.9 303.8 312.9 322.3 331.9 341.9
- - 16.7 17.2 17.7 18.2 18.8 19.3 19.9 20.5
- - 70.0 70.0 70.0 70.0 70.0 70.0 70.0 70.0
- - 86.7 87.2 87.7 88.2 88.8 89.3 89.9 90.5
- - 86.7 87.2 87.7 88.2 88.8 89.3 89.9 90.5
Cost Benefit Analysis (CBA) Study Estimate Jan 2005.
Benefit Streams (Rs '000)

Table AN12.19.7 IFFDC - Rajasthan - Pratapgarh: Village Moti Kheri: Household Crop Net Margin Assumptions.
Without \ With Project UnitsYear 1 Year 2 Year 3
(Rs/HH) (Rs/HH) (Rs/HH)
Development Activity:Crop Technology, SWC and WRD
Before / Without Project Situation:Assumptions
Households (HHs) No 112 Crop Adoption Assumptions 100% 100% 100%
Kharif Crop Net Margin Rs/HH 1,215.5 1,215.5 1,215.5
Rabi Crop Net Margin Rs/HH 183.3 183.3 183.3 Total Without Project Benefits Rs/HH 1,398.8 1,398.8 1,398.8
After / With Project Situation:Assumptions
Households (HHs) No 112 Crop Adoption Assumptions 100% 100% 100%
Kharif Crop Net Margin Rs/HH 4,455.1 4,455.1 4,455.1
Rabi Crop Net Margin Rs/HH 1,466.3 1,466.3 1,466.3 Total With Project Benefits Rs/HH 5,921.4 5,921.4 5,921.4
Incremental Benefits Rs/HH 4,522.6 4,522.6 4,522.6
Source: Cost Benefit Analysis (CBA) Study Estimate Jan 2005.
BenefitsAssumptions
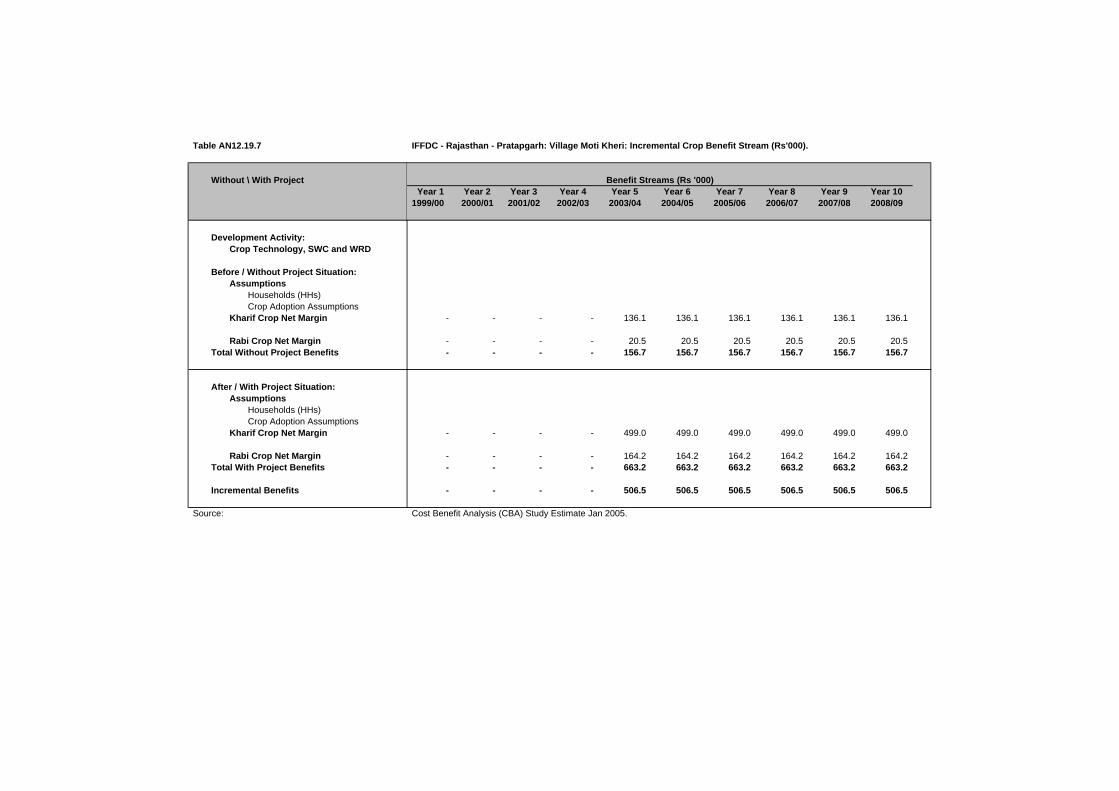
Table AN12.19.7
Without \ With Project
Development Activity:Crop Technology, SWC and WRD
Before / Without Project Situation:Assumptions
Households (HHs)Crop Adoption Assumptions
Kharif Crop Net Margin
Rabi Crop Net MarginTotal Without Project Benefits
After / With Project Situation:Assumptions
Households (HHs)Crop Adoption Assumptions
Kharif Crop Net Margin
Rabi Crop Net MarginTotal With Project Benefits
Incremental Benefits
Source:
IFFDC - Rajasthan - Pratapgarh: Village Moti Kheri: Incremental Crop Benefit Stream (Rs'000).
Year 1 Year 2 Year 3 Year 4 Year 5 Year 6 Year 7 Year 8 Year 9 Year 101999/00 2000/01 2001/02 2002/03 2003/04 2004/05 2005/06 2006/07 2007/08 2008/09
- - - - 136.1 136.1 136.1 136.1 136.1 136.1
- - - - 20.5 20.5 20.5 20.5 20.5 20.5 - - - - 156.7 156.7 156.7 156.7 156.7 156.7
- - - - 499.0 499.0 499.0 499.0 499.0 499.0
- - - - 164.2 164.2 164.2 164.2 164.2 164.2 - - - - 663.2 663.2 663.2 663.2 663.2 663.2
- - - - 506.5 506.5 506.5 506.5 506.5 506.5
Cost Benefit Analysis (CBA) Study Estimate Jan 2005.
Benefit Streams (Rs '000)

Table AN12.19.8 IFFDC - Rajasthan - Pratapgarh: Village Moti Kheri: Household Livestock Net Margin Assumptio
Without \ With Project UnitsLivestock Year 1 Year 2 Year 3
(Rs) (Rs) (Rs)
Development Activity:Livestock
Before / Without Project Situation:Assumptions
Households (HHs) No 112 Annual Livestock Net Margin Rs/HH
Total Without Project Benefits 1,842.3 1,842.3 1,842.3
After / With Project Situation:
Development Activity:Assumptions
Households (HHs) No 112 Adoption Assumptions Percent 55% 78% 100%
Annual Livestock Net Margin Rs/HHTotal With Project Benefits 1,924.8 2,712.2 3,499.6
Incremental Benefits Rs/HH 82.5 869.9 1,657.3
Source: Cost Benefit Analysis (CBA) Study Estimate Jan 2005.
BenefitsAssumptions
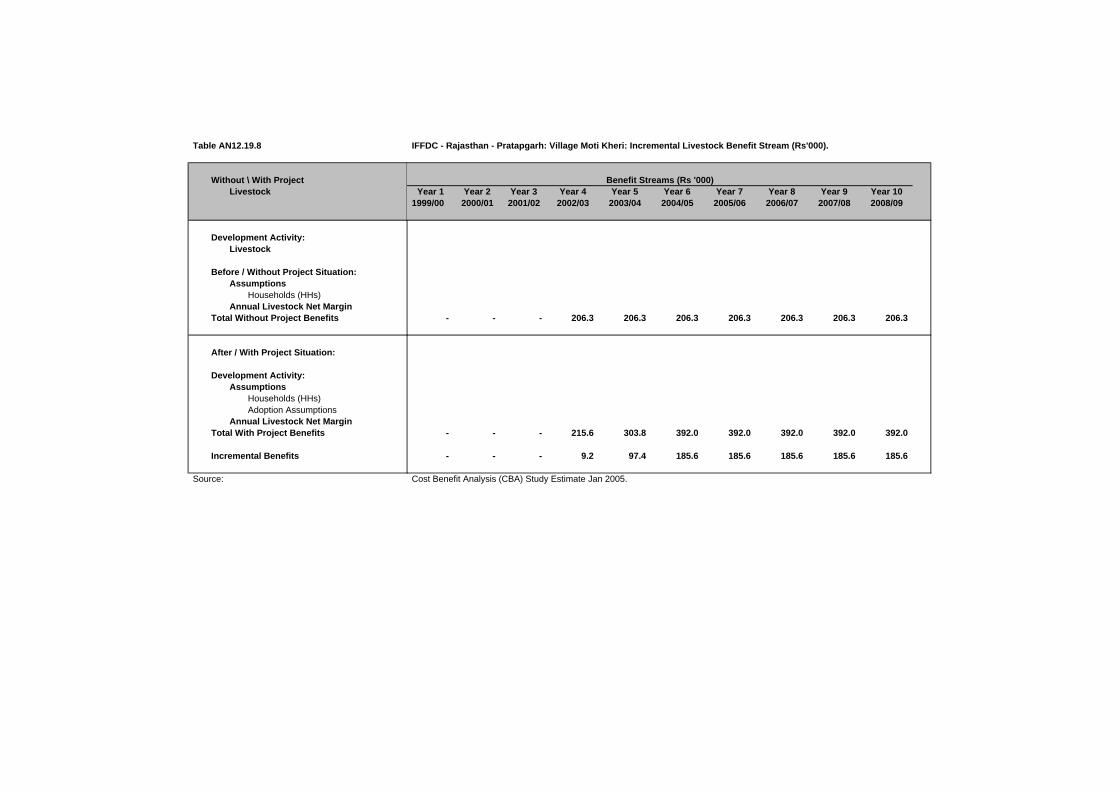
Table AN12.19.8
Without \ With ProjectLivestock
Development Activity:Livestock
Before / Without Project Situation:Assumptions
Households (HHs)Annual Livestock Net Margin
Total Without Project Benefits
After / With Project Situation:
Development Activity:Assumptions
Households (HHs)Adoption Assumptions
Annual Livestock Net MarginTotal With Project Benefits
Incremental Benefits
Source:
IFFDC - Rajasthan - Pratapgarh: Village Moti Kheri: Incremental Livestock Benefit Stream (Rs'000).
Year 1 Year 2 Year 3 Year 4 Year 5 Year 6 Year 7 Year 8 Year 9 Year 101999/00 2000/01 2001/02 2002/03 2003/04 2004/05 2005/06 2006/07 2007/08 2008/09
- - - 206.3 206.3 206.3 206.3 206.3 206.3 206.3
- - - 215.6 303.8 392.0 392.0 392.0 392.0 392.0
- - - 9.2 97.4 185.6 185.6 185.6 185.6 185.6
Cost Benefit Analysis (CBA) Study Estimate Jan 2005.
Benefit Streams (Rs '000)

Table AN12.19.9 IFFDC - Rajasthan - Pratapgarh: Village Moti Kheri: Forestry Benefit Assumptions.
Without \ With Project UnitsForestry Year 1 Year 2 Year 3
(Rs) (Rs) (Rs)
Development Activity:Forestry
Before / Without Project Situation:AssumptionsHouseholds (HHs) No 112 Annual Forestry Net Margin Rs/HH
Total Without Project Benefits - - -
After / With Project Situation:AssumptionsHouseholds (HHs) No 112 Adoption Assumptions Percent 55% 78% 100%Annual Forestry Net Margin Rs/HH
Total With Project Benefits 275.0 390.0 500.0
Incremental Benefits Rs/HH 275.0 390.0 500.0
Source: Cost Benefit Analysis (CBA) Study Estimate Jan 2005.
BenefitsAssumptions

Table AN12.19.9
Without \ With ProjectForestry
Development Activity:Forestry
Before / Without Project Situation:AssumptionsHouseholds (HHs)Annual Forestry Net Margin
Total Without Project Benefits
After / With Project Situation:AssumptionsHouseholds (HHs)Adoption AssumptionsAnnual Forestry Net Margin
Total With Project Benefits
Incremental Benefits
Source:
IFFDC - Rajasthan - Pratapgarh: Village Moti Kheri: Incremental Forestry Benefit Stream (Rs'000).
Year 1 Year 2 Year 3 Year 4 Year 5 Year 6 Year 7 Year 8 Year 9 Year 101999/00 2000/01 2001/02 2002/03 2003/04 2004/05 2005/06 2006/07 2007/08 2008/09
- - - - - - - - - -
- - - 30.8 43.7 56.0 56.0 56.0 56.0 56.0
- - - 30.8 43.7 56.0 56.0 56.0 56.0 56.0
Cost Benefit Analysis (CBA) Study Estimate Jan 2005.
Benefit Streams (Rs '000)

Table AN12.19.10 IFFDC - Rajasthan - Pratapgarh: Village Moti Kheri: Migration Support Benefit Assumptions.
Without \ With ProjectYear 1 Year 2 Year 3(Rs) (Rs) (Rs)
Development Activity:Migration Support
Before / Without Project Situation:Assumptions
Economic Value per Day Rs/day 25.0 Days / Month / Household No - Economic Value per Month Rs/month - Months Migration / Year Months 4.0 Economic Value per Household Rs/HH - Households per Village No 112 Households per Village Migrating Percent 45%
Total Without Project Benefits Rs/Village - - -
After / With Project Situation:Assumptions
Economic Value per Day \1 Rs/day 25.0 30% 32.5 Days / Month / Household No - 30% - Economic Value per Month Rs/month - - Months Migration / Year Months 4.0 -20% 3.2 Economic Value per Household Rs/HH - - Households per Village No 112 112 Households per Village Migrating Percent 45% -20% 36%
Subtotal Migration Income Rs/Village - - -
Other Income Sum (Rs) - - - - - -
Total With Project Benefits Rs/Village - - -
Incremental Benefits Rs/Village - - -
Source: Cost Benefit Analysis (CBA) Study Estimate Jan 2005.
1\ Financial Wages (Rs/day):Skill Labour - Rs 160
Casual Labour :Male - Rs 40Female - Rs 30
BenefitsAssumptions

Table AN12.19.10
Without \ With Project
Development Activity:Migration Support
Before / Without Project Situation:Assumptions
Economic Value per Day Days / Month / Household Economic Value per Month Months Migration / Year Economic Value per Household Households per Village Households per Village Migrating
Total Without Project Benefits
After / With Project Situation:Assumptions
Economic Value per Day \1Days / Month / Household Economic Value per Month Months Migration / Year Economic Value per Household Households per Village Households per Village Migrating
Subtotal Migration Income
Other Income
Total With Project Benefits
Incremental Benefits
Source:
1\ Financial Wages (Rs/day):Skill Labour - Rs 160
Casual Labour :Male - Rs 40Female - Rs 30
IFFDC - Rajasthan - Pratapgarh: Village Moti Kheri: Incremental Migration Support Benefit Stream (Rs'000).
Year 1 Year 2 Year 3 Year 4 Year 5 Year 6 Year 7 Year 8 Year 9 Year 101999/00 2000/01 2001/02 2002/03 2003/04 2004/05 2005/06 2006/07 2007/08 2008/09
- - - - - - - - - -
- - - - - - - - - -
- - - - - - - - - -
- - - - - - - - - -
- - - - - - - - - -
Cost Benefit Analysis (CBA) Study Estimate Jan 2005.
Benefit Streams (Rs '000)

Table AN12.19.11 IFFDC - Rajasthan - Pratapgarh: Village Moti Kheri: Weighted Household Crop Net Margin Summary (Rs/Household).
Item WBR(%) Khalif Rabi Total Khalif Rabi Total Khalif Rabi Total
Phase IIWell Being Ranking - Very Poor
Household Net Margin (Rs) 24.0% 834.6 102.5 937.1 1,849.8 1,067.8 2,917.6 1,015.2 965.3 1,980.5 Well Being Ranking - Poor
Household Net Margin (Rs) 29.0% 637.7 - 637.7 4,803.0 220.7 5,023.7 4,165.3 220.7 4,386.0 Well Being Ranking - Moderate
Household Net Margin (Rs) 40.0% 994.0 89.3 1,083.3 3,711.4 2,508.3 6,219.6 2,717.4 2,419.0 5,136.4 Well Being Ranking - Better Off
Household Net Margin (Rs) 7.0% 6,180.9 1,756.7 7,937.5 16,195.9 2,039.3 18,235.2 10,015.0 282.7 10,297.7
Well Being Ranking - WeightedHousehold Net Margin (Rs) 100% 1,215.5 183.3 1,398.8 4,455.1 1,466.3 5,921.4 3,239.6 1,283.0 4,522.6
Phase I \1Well Being Ranking - Very Poor
Household Net Margin (Rs) 24.0% 436.3 267.5 703.8 3,866.5 1,668.8 5,535.3 3,430.3 1,401.3 4,831.5 Well Being Ranking - Poor
Household Net Margin (Rs) 29.0% 485.8 657.5 1,143.3 10,136.0 5,690.3 15,826.3 9,650.3 5,032.8 14,683.0 Well Being Ranking - Moderate
Household Net Margin (Rs) 40.0% 986.3 3,385.0 4,371.3 9,457.5 5,195.0 14,652.5 8,471.3 1,810.0 10,281.3 Well Being Ranking - Better Off
Household Net Margin (Rs) 7.0% 2,778.0 937.0 3,715.0 4,915.0 9,560.0 14,475.0 2,137.0 8,623.0 10,760.0
Well Being Ranking - WeightedHousehold Net Margin (Rs) 100% 834.5 1,674.5 2,509.0 7,994.5 4,797.9 12,792.3 7,159.9 3,123.4 10,283.3
Source: Study of Impact of WIRFP on Net Incomes of Target Households, Jan 2004.WBR = IFFDC Household Well Being Ranking. Survey figures adjusted to Village Profile WBR.\1 GVT - Madhya Pradesh - Phase I: Village Naganwat Choti: Weighted Household Crop Net Margin Summary.
Before / Without Project After / With Project Increment

Table AN12.19.12 IFFDC - Rajasthan - Pratapgarh: Village Moti Kheri: Weighted Household Crop Net Margin Sensitivity Analysis (Rs/Household).
Item EIRRKhalif Rabi Total Khalif Rabi Total Khalif Rabi Total
Development Activity:Crop Technology, SWC and WRD
Weighted Net Margin (Phase II)Household Net Margin (Rs) 1,215.5 183.3 1,398.8 4,455.1 1,466.3 5,921.4 3,239.6 1,283.0 4,522.6 Incremental Benefit (Phase II / Phase I) 44%
Base Case AssumptionsHousehold Net Margin (Rs) 1,215.5 183.3 1,398.8 4,455.1 1,466.3 5,921.4 3,239.6 1,283.0 4,522.6 Incremental Benefit (Phase II / Phase I) 44%Sensitivity Increase (%) 0%Development Acivity 2%Overall Village 2%
Sensitivity AssumptionsHousehold Net Margin (Rs) 1,215.5 183.3 1,398.8 7,128.1 2,346.1 9,474.2 5,912.6 2,162.8 8,075.5 Incremental Benefit (Phase II / Phase I) 79%Sensitivity Increase (%) 0%Development Acivity 20%Overall Village 12%
Weighted Net Margin (Phase I)Household Net Margin (Rs) 834.5 1,674.5 2,509.0 7,994.5 4,797.9 12,792.3 7,159.9 3,123.4 10,283.3
Source: Subject to final adjustment following consolidation exercise prior to Annual Review Meeting (ARM) in Feb 2005.EIRR = Economic Internal Rate of Return (rate at which NPV equal to zero).
Before / Without Project After / With Project Increment

Table AN12.19.13 IFFDC - Rajasthan - Pratapgarh: Village Moti Kheri: Weighted Household Livestock Net Margin Summary.
Well Being Ranking Weight(%) Herd Value Net Margin Herd Value Net Margin Herd Value Net Margin
Phase I - Well Being Ranking (WBR) \1Madhya Pradesh - WBR Weighted DataVery Poor 24.0%
Average 580 (185.0) 5,650 412.5 474 597.5 Poor 29.0%
Average 2,350 982.5 8,250 2,141.0 1,180 1,158.5 Moderate 40.0%
Average 14,700 6,730.0 1,900 2,820.0 1,900 (3,910.0)Better Off 7.0%
Average 15,580 3,000.0 14,600 10,790.0 (196) 7,790.0
Phase I - WBR Weighted Data 100.0% 7,791 3,142.5 5,531 2,603.2 1,202 (539.3)
Phase II - Well Being Ranking (WBR)
Very Poor 24.0%Average 5,756 149.2 10,970 1,446.4 1,043 1,297.2
Poor 29.0%Average 13,128 852.2 25,979 3,008.8 2,570 2,156.8
Moderate 40.0%Average 13,525 4,035.1 27,020 5,249.5 2,699 1,214.4
Better Off 7.0%Average 12,700 (781.7) 41,873 2,573.3 5,835 3,355.0
Phase II - WBR Weighted Data 100.0% 11,488 1,842.3 23,906 3,499.6 2,484 1,657.4
Source: Study of Impact of WIRFP on Net Incomes of Target Households, Jan 2004.WBR = IFFDC Household Well Being Ranking. Survey figures adjusted to Village Profile WBR.
\1 GVT - Madhya Pradesh - Phase I: Village Naganwat Choti: Weighted Household Livestock Net Margin Summary.
Before / Without Project After / With Project Increment \1

WIRFP - Phase II - Cost Benefit Analysis Study
Tables AN12.0 Individual Village Cost Benefit Analysis
Tables AN12.20 IFFDC - Rajasthan - Pratapgarh: Village S Ka Khera.
Table AN12.20.1 IFFDC - Rajasthan - Pratapgarh: Village S Ka Khera: Village Profile.
Table AN12.20.2 IFFDC - Rajasthan - Pratapgarh: Village S Ka Khera: Cost Benefit Analysis Summary (Rs'000).Table AN12.20.3 IFFDC - Rajasthan - Pratapgarh: Village S Ka Khera: Cost Benefit Analysis Development Activity Summary A (Rs'000).Table AN12.20.4 IFFDC - Rajasthan - Pratapgarh: Village S Ka Khera: Cost Benefit Analysis Development Activity Summary B (Rs'000).
Table AN12.20.5 IFFDC - Rajasthan - Pratapgarh: Village S Ka Kheri: Costs - Financial (Rs'000).IFFDC - Rajasthan - Pratapgarh: Village S Ka Kheri: Costs - Economic (Rs'000).
Table AN12.20.6 IFFDC - Rajasthan - Pratapgarh: Village S Ka Khera: VOD Household Assumptions.IFFDC - Rajasthan - Pratapgarh: Village S Ka Khera: Incremental VOD Benefit Stream (Rs'000).
Table AN12.20.7 IFFDC - Rajasthan - Pratapgarh: Village S Ka Khera: Household Crop Net Margin Assumptions.IFFDC - Rajasthan - Pratapgarh: Village S Ka Khera: Incremental Crop Benefit Stream (Rs'000).
Table AN12.20.8 IFFDC - Rajasthan - Pratapgarh: Village S Ka Khera: Household Livestock Net Margin Assumptions.IFFDC - Rajasthan - Pratapgarh: Village S Ka Khera: Incremental Livestock Benefit Stream (Rs'000).
Table AN12.20.9 IFFDC - Rajasthan - Pratapgarh: Village S Ka Khera: Forestry Benefit Assumptions.IFFDC - Rajasthan - Pratapgarh: Village S Ka Khera: Incremental Forestry Benefit Stream (Rs'000).
Table AN12.20.10 IFFDC - Rajasthan - Pratapgarh: Village S Ka Khera: Migration Support Benefit Assumptions.IFFDC - Rajasthan - Pratapgarh: Village S Ka Khera: Incremental Migration Support Benefit Stream (Rs'000).
Table AN12.20.11 IFFDC - Rajasthan - Pratapgarh: Village S Ka Khera: Weighted Household Crop Net Margin Summary (Rs/Household).Table AN12.20.12 IFFDC - Rajasthan - Pratapgarh: Village S Ka Khera: Weighted Household Crop Net Margin Sensitivity Analysis (Rs/Household).
Table AN12.20.13 IFFDC - Rajasthan - Pratapgarh: Village S Ka Khera: Weighted Household Livestock Net Margin Summary (Rs/Household).

Table AN12.20.1 IFFDC - Rajasthan - Pratapgarh: Village S Ka Khera: Village Profile.
Village Profile \1
A. Background D. Well Being Ranking (No Households)Village Name S Ka Khera Very Poor 8 20.0%District Pratapgarh Poor 13 32.5%State Rajasthan Moderate 15 37.5%
Better Off 4 10.0%Participatory Planning Process (PPP) Total 40 100%
Village entry Oct-99PRA Nov-99 E. Land Resource (ha)CPA Nov-99 Total Area 62
Revenue Land (unused) 4 B. Infrastructure Forest Area - Revenue 22
Hand Pumps (no) 3 Pasture Land - Wells (no) 12 Arable Land 36 Linked by Road 1 km Electrification NoSchool Primary F. Livestock
Oxen 200 C. Demographic Data Cows 193
Households (no) 40 Buffalo 78 Participating Households 34 Goats 271 Population (Adults) 186 Poultry 93
Adults: Male 103 G. Self Help Groups (No Households) Female 83 1 Group 1 15 Children: 2 Group 2 17 Boys N/A 3 Group 3 15 Girls N/A 4 Group 4 -
Total Membership 47
Source: IFFDC Pratapgarh Coordination Office - Rajasthan.\1 Subject to final adjustment following consolidation exercise prior to Annual Review Meeting (ARM) in Feb 2005.
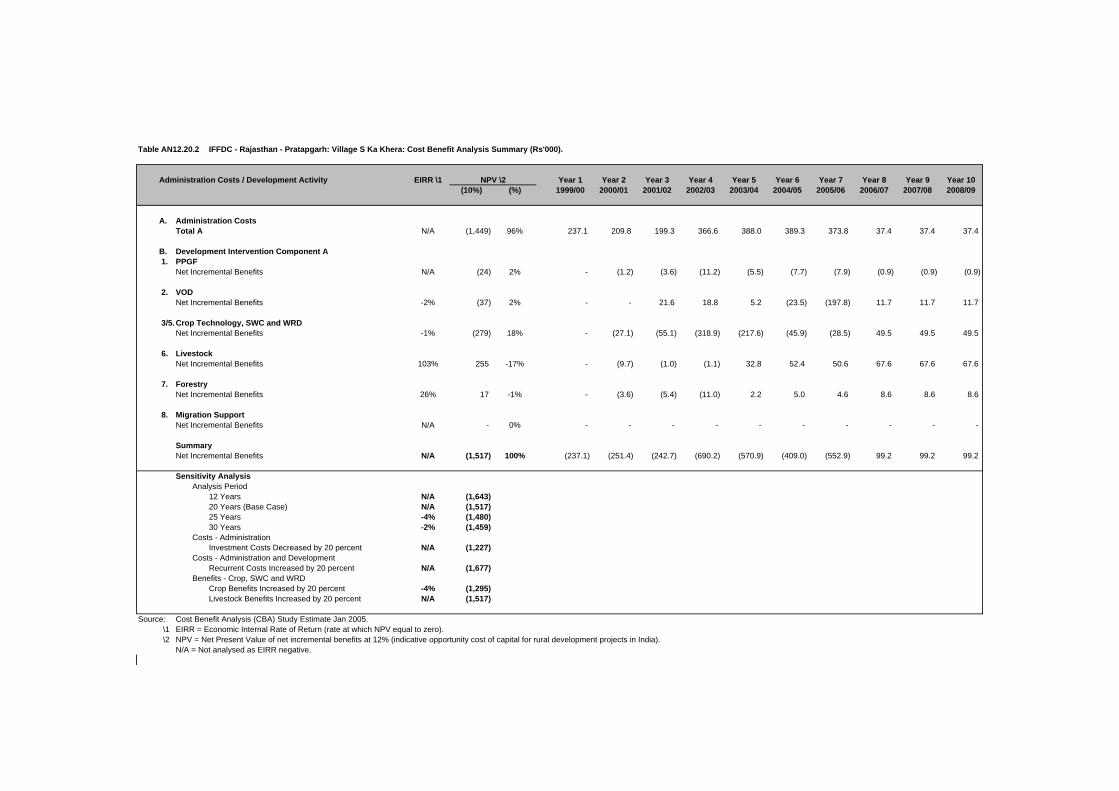
Table AN12.20.2 IFFDC - Rajasthan - Pratapgarh: Village S Ka Khera: Cost Benefit Analysis Summary (Rs'000).
Administration Costs / Development Activity EIRR \1 Year 1 Year 2 Year 3 Year 4 Year 5 Year 6 Year 7 Year 8 Year 9 Year 10(10%) (%) 1999/00 2000/01 2001/02 2002/03 2003/04 2004/05 2005/06 2006/07 2007/08 2008/09
A. Administration CostsTotal A N/A (1,449) 96% 237.1 209.8 199.3 366.6 388.0 389.3 373.8 37.4 37.4 37.4
B. Development Intervention Component A 1. PPGF
Net Incremental Benefits N/A (24) 2% - (1.2) (3.6) (11.2) (5.5) (7.7) (7.9) (0.9) (0.9) (0.9)
2. VODNet Incremental Benefits -2% (37) 2% - - 21.6 18.8 5.2 (23.5) (197.8) 11.7 11.7 11.7
3/5.Crop Technology, SWC and WRDNet Incremental Benefits -1% (279) 18% - (27.1) (55.1) (318.9) (217.6) (45.9) (28.5) 49.5 49.5 49.5
6. LivestockNet Incremental Benefits 103% 255 -17% - (9.7) (1.0) (1.1) 32.8 52.4 50.6 67.6 67.6 67.6
7. ForestryNet Incremental Benefits 26% 17 -1% - (3.6) (5.4) (11.0) 2.2 5.0 4.6 8.6 8.6 8.6
8. Migration SupportNet Incremental Benefits N/A - 0% - - - - - - - - - -
SummaryNet Incremental Benefits N/A (1,517) 100% (237.1) (251.4) (242.7) (690.2) (570.9) (409.0) (552.9) 99.2 99.2 99.2
Sensitivity AnalysisAnalysis Period
12 Years N/A (1,643)20 Years (Base Case) N/A (1,517)25 Years -4% (1,480)30 Years -2% (1,459)
Costs - AdministrationInvestment Costs Decreased by 20 percent N/A (1,227)
Costs - Administration and DevelopmentRecurrent Costs Increased by 20 percent N/A (1,677)
Benefits - Crop, SWC and WRDCrop Benefits Increased by 20 percent -4% (1,295)Livestock Benefits Increased by 20 percent N/A (1,517)
Source: Cost Benefit Analysis (CBA) Study Estimate Jan 2005.\1 EIRR = Economic Internal Rate of Return (rate at which NPV equal to zero).\2 NPV = Net Present Value of net incremental benefits at 12% (indicative opportunity cost of capital for rural development projects in India).
N/A = Not analysed as EIRR negative.
NPV \2
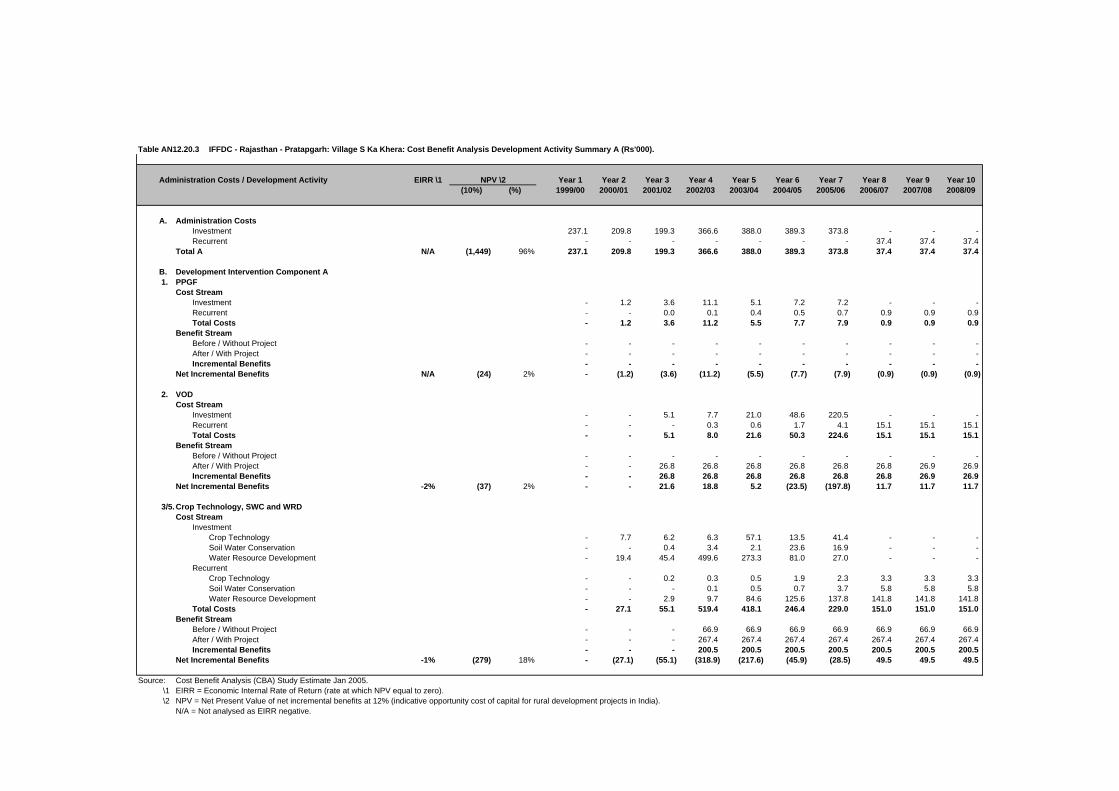
Table AN12.20.3 IFFDC - Rajasthan - Pratapgarh: Village S Ka Khera: Cost Benefit Analysis Development Activity Summary A (Rs'000).
Administration Costs / Development Activity EIRR \1 Year 1 Year 2 Year 3 Year 4 Year 5 Year 6 Year 7 Year 8 Year 9 Year 10(10%) (%) 1999/00 2000/01 2001/02 2002/03 2003/04 2004/05 2005/06 2006/07 2007/08 2008/09
A. Administration CostsInvestment 237.1 209.8 199.3 366.6 388.0 389.3 373.8 - - - Recurrent - - - - - - - 37.4 37.4 37.4
Total A N/A (1,449) 96% 237.1 209.8 199.3 366.6 388.0 389.3 373.8 37.4 37.4 37.4
B. Development Intervention Component A 1. PPGF
Cost StreamInvestment - 1.2 3.6 11.1 5.1 7.2 7.2 - - - Recurrent - - 0.0 0.1 0.4 0.5 0.7 0.9 0.9 0.9 Total Costs - 1.2 3.6 11.2 5.5 7.7 7.9 0.9 0.9 0.9
Benefit StreamBefore / Without Project - - - - - - - - - - After / With Project - - - - - - - - - - Incremental Benefits - - - - - - - - - -
Net Incremental Benefits N/A (24) 2% - (1.2) (3.6) (11.2) (5.5) (7.7) (7.9) (0.9) (0.9) (0.9)
2. VODCost Stream
Investment - - 5.1 7.7 21.0 48.6 220.5 - - - Recurrent - - - 0.3 0.6 1.7 4.1 15.1 15.1 15.1 Total Costs - - 5.1 8.0 21.6 50.3 224.6 15.1 15.1 15.1
Benefit StreamBefore / Without Project - - - - - - - - - - After / With Project - - 26.8 26.8 26.8 26.8 26.8 26.8 26.9 26.9 Incremental Benefits - - 26.8 26.8 26.8 26.8 26.8 26.8 26.9 26.9
Net Incremental Benefits -2% (37) 2% - - 21.6 18.8 5.2 (23.5) (197.8) 11.7 11.7 11.7
3/5.Crop Technology, SWC and WRDCost Stream
InvestmentCrop Technology - 7.7 6.2 6.3 57.1 13.5 41.4 - - - Soil Water Conservation - - 0.4 3.4 2.1 23.6 16.9 - - - Water Resource Development - 19.4 45.4 499.6 273.3 81.0 27.0 - - -
RecurrentCrop Technology - - 0.2 0.3 0.5 1.9 2.3 3.3 3.3 3.3 Soil Water Conservation - - - 0.1 0.5 0.7 3.7 5.8 5.8 5.8 Water Resource Development - - 2.9 9.7 84.6 125.6 137.8 141.8 141.8 141.8
Total Costs - 27.1 55.1 519.4 418.1 246.4 229.0 151.0 151.0 151.0 Benefit Stream
Before / Without Project - - - 66.9 66.9 66.9 66.9 66.9 66.9 66.9 After / With Project - - - 267.4 267.4 267.4 267.4 267.4 267.4 267.4 Incremental Benefits - - - 200.5 200.5 200.5 200.5 200.5 200.5 200.5
Net Incremental Benefits -1% (279) 18% - (27.1) (55.1) (318.9) (217.6) (45.9) (28.5) 49.5 49.5 49.5
Source: Cost Benefit Analysis (CBA) Study Estimate Jan 2005.\1 EIRR = Economic Internal Rate of Return (rate at which NPV equal to zero).\2 NPV = Net Present Value of net incremental benefits at 12% (indicative opportunity cost of capital for rural development projects in India).
N/A = Not analysed as EIRR negative.
NPV \2

Table AN12.20.4 IFFDC - Rajasthan - Pratapgarh: Village S Ka Khera: Cost Benefit Analysis Development Activity Summary B (Rs'000).
Administration Costs / Development Activity EIRR \1 Year 1 Year 2 Year 3 Year 4 Year 5 Year 6 Year 7 Year 8 Year 9 Year 10(10%) (%) 1999/00 2000/01 2001/02 2002/03 2003/04 2004/05 2005/06 2006/07 2007/08 2008/09
6. LivestockCost Stream
Investment - 9.7 - 8.1 6.2 18.9 18.9 - - - Recurrent - - 1.0 1.0 1.8 2.4 4.3 6.2 6.2 6.2 Total Costs - 9.7 1.0 9.1 8.0 21.3 23.2 6.2 6.2 6.2
Benefit StreamBefore / Without Project - - - 72.5 72.5 72.5 72.5 72.5 72.5 72.5 After / With Project - - - 80.4 113.3 146.2 146.2 146.2 146.2 146.2 Incremental Benefits - - - 7.9 40.8 73.7 73.7 73.7 73.7 73.7
Net Incremental Benefits 103% 255 -17% - (9.7) (1.0) (1.1) 32.8 52.4 50.6 67.6 67.6 67.6
7. ForestryCost Stream
Investment - 3.6 5.0 17.1 5.0 4.5 4.5 - - - Recurrent - - 0.4 0.9 2.6 3.1 3.5 4.0 4.0 4.0 Total Costs - 3.6 5.4 18.0 7.6 7.6 8.0 4.0 4.0 4.0
Benefit StreamBefore / Without Project - - - - - - - - - - After / With Project - - - 6.9 9.8 12.6 12.6 12.6 12.6 12.6 Incremental Benefits - - - 6.9 9.8 12.6 12.6 12.6 12.6 12.6
Net Incremental Benefits 26% 17 -1% - (3.6) (5.4) (11.0) 2.2 5.0 4.6 8.6 8.6 8.6
8. Migration SupportCost Stream
Investment - - - - - - - - - - Recurrent - - - - - - - - - - Total Costs - - - - - - - - - -
Benefit StreamBefore / Without Project - - - - - - - - - - After / With Project - - - - - - - - - - Incremental Benefits - - - - - - - - - -
Net Incremental Benefits N/A - 0% - - - - - - - - - -
SummaryCost Stream
Investment 237.1 251.4 265.0 920.0 757.8 586.7 710.2 - - - Recurrent - - 4.5 12.3 91.0 136.0 156.4 214.5 214.5 214.5 Total Costs 237.1 251.4 269.5 932.3 848.9 722.7 866.6 214.5 214.5 214.5
Benefit StreamBefore / Without Project - - - 139.4 139.4 139.4 139.4 139.4 139.4 139.4 After / With Project - - 26.8 381.5 417.3 453.0 453.0 453.0 453.1 453.1 Incremental Benefits - - 26.8 242.1 278.0 313.6 313.7 313.7 313.7 313.7
Net Incremental Benefits N/A (1,517) 100% (237.1) (251.4) (242.7) (690.2) (570.9) (409.0) (552.9) 99.2 99.2 99.2
Source: Cost Benefit Analysis (CBA) Study Estimate Jan 2005.
NPV \2
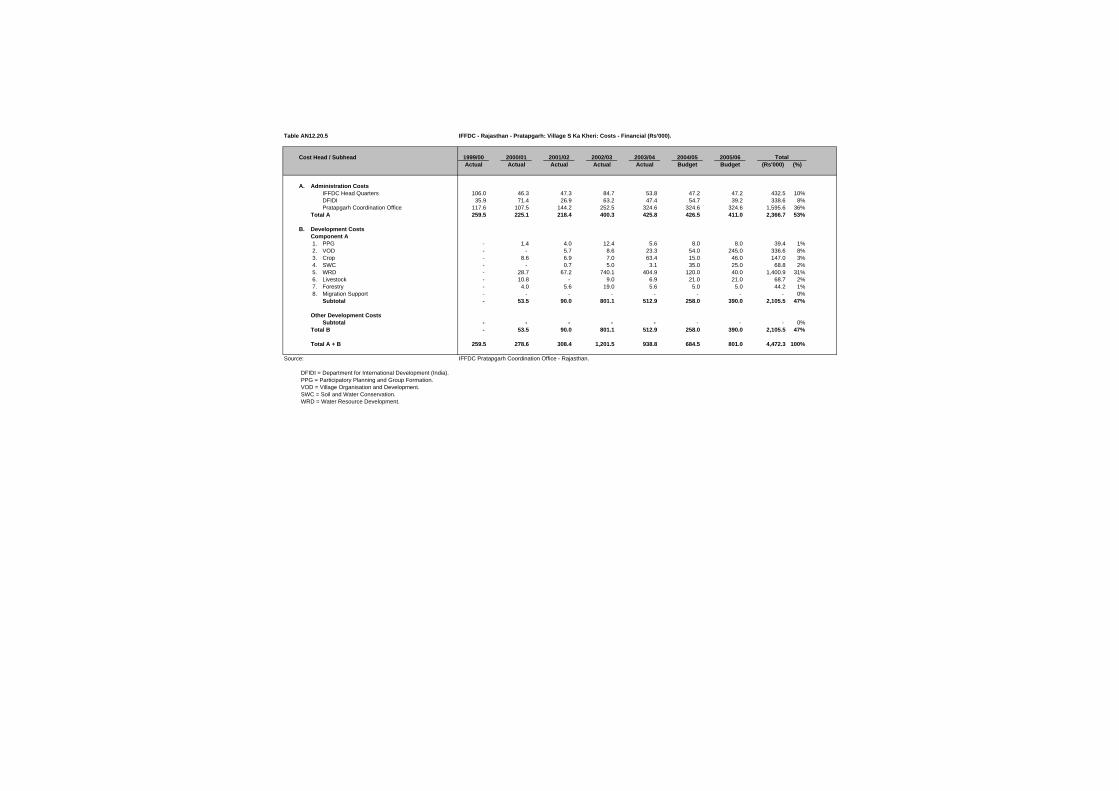
Table AN12.20.5 IFFDC - Rajasthan - Pratapgarh: Village S Ka Kheri: Costs - Financial (Rs'000).
Cost Head / Subhead 1999/00 2000/01 2001/02 2002/03 2003/04 2004/05 2005/06Actual Actual Actual Actual Actual Budget Budget (Rs'000) (%)
A. Administration CostsIFFDC Head Quarters 106.0 46.3 47.3 84.7 53.8 47.2 47.2 432.5 10%DFIDI 35.9 71.4 26.9 63.2 47.4 54.7 39.2 338.6 8%Pratapgarh Coordination Office 117.6 107.5 144.2 252.5 324.6 324.6 324.6 1,595.6 36%
Total A 259.5 225.1 218.4 400.3 425.8 426.5 411.0 2,366.7 53%
B. Development CostsComponent A 1. PPG - 1.4 4.0 12.4 5.6 8.0 8.0 39.4 1% 2. VOD - - 5.7 8.6 23.3 54.0 245.0 336.6 8% 3. Crop - 8.6 6.9 7.0 63.4 15.0 46.0 147.0 3% 4. SWC - - 0.7 5.0 3.1 35.0 25.0 68.8 2% 5. WRD - 28.7 67.2 740.1 404.9 120.0 40.0 1,400.9 31% 6. Livestock - 10.8 - 9.0 6.9 21.0 21.0 68.7 2% 7. Forestry - 4.0 5.6 19.0 5.6 5.0 5.0 44.2 1% 8. Migration Support - - - - - - - - 0%
Subtotal - 53.5 90.0 801.1 512.9 258.0 390.0 2,105.5 47%
Other Development CostsSubtotal - - - - - - - - 0%
Total B - 53.5 90.0 801.1 512.9 258.0 390.0 2,105.5 47%
Total A + B 259.5 278.6 308.4 1,201.5 938.8 684.5 801.0 4,472.3 100%
Source: IFFDC Pratapgarh Coordination Office - Rajasthan.
DFIDI = Department for International Development (India).PPG = Participatory Planning and Group Formation.VOD = Village Organisation and Development.SWC = Soil and Water Conservation.WRD = Water Resource Development.
Total

Table AN12.20.5
Cost Head / Subhead
A. Administration CostsIFFDC Head QuartersDFIDIPratapgarh Coordination Office
Total A
B. Development CostsComponent A 1. PPG 2. VOD 3. Crop 4. SWC 5. WRD 6. Livestock 7. Forestry 8. Migration Support
Subtotal
Other Development CostsSubtotal
Total B
Total A + B
Source:
DFIDI = Department for International Development (India).PPG = Participatory Planning and Group Formation.VOD = Village Organisation and Development.SWC = Soil and Water Conservation.WRD = Water Resource Development.
IFFDC - Rajasthan - Pratapgarh: Village S Ka Kheri: Costs - Economic (Rs'000).
CF SCF 1999/00 2000/01 2001/02 2002/03 2003/04 2004/05 2005/06Actual Actual Actual Actual Actual Budget Budget (Rs'000) (%)
0.90 1.00 95.4 41.6 42.5 76.2 48.4 42.5 42.5 389.2 10%1.00 1.00 35.9 71.4 26.9 63.2 47.4 54.7 39.2 338.6 9%0.90 1.00 105.9 96.7 129.8 227.2 292.1 292.1 292.1 1,436.0 39%
237.1 209.8 199.3 366.6 388.0 389.3 373.8 2,163.9 58%
0.90 1.00 - 1.2 3.6 11.1 5.1 7.2 7.2 35.4 1%0.90 1.00 - - 5.1 7.7 21.0 48.6 220.5 303.0 8%0.90 1.00 - 7.7 6.2 6.3 57.1 13.5 41.4 132.3 4%0.90 0.75 - - 0.4 3.4 2.1 23.6 16.9 46.4 1%0.90 0.75 - 19.4 45.4 499.6 273.3 81.0 27.0 945.6 25%0.90 1.00 - 9.7 - 8.1 6.2 18.9 18.9 61.9 2%0.90 1.00 - 3.6 5.0 17.1 5.0 4.5 4.5 39.7 1%0.90 1.00 - - - - - - - - 0%
- 41.7 65.7 553.4 369.8 197.3 336.4 1,564.3 42%
0.90 1.00 - - - - - - - - 0%- 41.7 65.7 553.4 369.8 197.3 336.4 1,564.3 42%
237.1 251.4 265.0 920.0 757.8 586.7 710.2 3,728.2 100%
Cost Benefit Analysis (CBA) Study Estimate Jan 2005.
Total

Table AN12.20.6 IFFDC - Rajasthan - Pratapgarh: Village S Ka Khera: VOD Household Assumptions.
Without \ With Project UnitsYear 1 Year 2 Year 3(Rs) (Rs) (Rs)
Development Activity:Village Organisation and Development
Before / Without Project Situation:
A. Self Help Groups (SHGs)Assumption Sum Zero Zero Zero - - -
B. Drudgery ReductionAssumption Sum Zero Zero Zero
Total Without Project Benefits - - -
After / With Project Situation:
A. Self Help Groups (SHGs)Assumptions
Average Saving / Household Rs 160 Households / Village No 42 Present Group Deposits Rs'000 6.7 6.7 6.9 7.1 Annual Savings Increase % 3%Deposits on Loan to Members % 75%SHG Interest Income % / Year 10%Assumed Benefit Rs'000 0.5 0.5 0.5
B. Drudgery ReductionAssumptions
Hours Saved / Day / Household No 1.0 Number of Days / Year / Household No 200 Days / Year / Household (8hrs/day) No 25.0 Households / Village No 42 Day Equivalent / Village No 1,050 Economic Value per Day (Rs/day) 25 Assumed Benefit Rs'000 26.3 26.3 26.3
Total With Project Benefits Rs'000 26.8 26.8 26.8
Incremental Benefits Rs'000 26.8 26.8 26.8
Source: Cost Benefit Analysis (CBA) Study Estimate Jan 2005.VOD = Village Organisation and Development.Participating households per village: S Ka Khera 42
Assumptions Benefits

Table AN12.20.6
Without \ With Project
Development Activity:Village Organisation and Development
Before / Without Project Situation:
A. Self Help Groups (SHGs)Assumption
B. Drudgery ReductionAssumption
Total Without Project Benefits
After / With Project Situation:
A. Self Help Groups (SHGs)Assumptions
Average Saving / HouseholdHouseholds / VillagePresent Group DepositsAnnual Savings IncreaseDeposits on Loan to MembersSHG Interest Income Assumed Benefit
B. Drudgery ReductionAssumptions
Hours Saved / Day / HouseholdNumber of Days / Year / HouseholdDays / Year / Household (8hrs/day)Households / VillageDay Equivalent / VillageEconomic Value per DayAssumed Benefit
Total With Project Benefits
Incremental Benefits
Source:VOD = Village Organisation and Development.Participating households per village: S Ka Khera
IFFDC - Rajasthan - Pratapgarh: Village S Ka Khera: Incremental VOD Benefit Stream (Rs'000).
Year 1 Year 2 Year 3 Year 4 Year 5 Year 6 Year 7 Year 8 Year 9 Year 101999/00 2000/01 2001/02 2002/03 2003/04 2004/05 2005/06 2006/07 2007/08 2008/09
- - - - - - - - - -
- - 6.7 6.9 7.1 7.4 7.6 7.8 8.0 8.3
- - 0.5 0.5 0.5 0.6 0.6 0.6 0.6 0.6
- - 26.3 26.3 26.3 26.3 26.3 26.3 26.3 26.3
- - 26.8 26.8 26.8 26.8 26.8 26.8 26.9 26.9
- - 26.8 26.8 26.8 26.8 26.8 26.8 26.9 26.9
Cost Benefit Analysis (CBA) Study Estimate Jan 2005.
Benefit Streams (Rs '000)

Table AN12.20.7 IFFDC - Rajasthan - Pratapgarh: Village S Ka Khera: Household Crop Net Margin Assumptions.
Without \ With Project UnitsYear 1 Year 2 Year 3
(Rs/HH) (Rs/HH) (Rs/HH)
Development Activity:Crop Technology, SWC and WRD
Before / Without Project Situation:Assumptions
Households (HHs) No 42 Crop Adoption Assumptions 100% 100% 100%
Kharif Crop Net Margin Rs/HH 1,363.2 1,363.2 1,363.2
Rabi Crop Net Margin Rs/HH 229.2 229.2 229.2 Total Without Project Benefits Rs/HH 1,592.4 1,592.4 1,592.4
After / With Project Situation:Assumptions
Households (HHs) No 42 Crop Adoption Assumptions 100% 100% 100%
Kharif Crop Net Margin Rs/HH 4,947.7 4,947.7 4,947.7
Rabi Crop Net Margin Rs/HH 1,418.4 1,418.4 1,418.4 Total With Project Benefits Rs/HH 6,366.1 6,366.1 6,366.1
Incremental Benefits Rs/HH 4,773.7 4,773.7 4,773.7
Source: Cost Benefit Analysis (CBA) Study Estimate Jan 2005.
BenefitsAssumptions

Table AN12.20.7
Without \ With Project
Development Activity:Crop Technology, SWC and WRD
Before / Without Project Situation:Assumptions
Households (HHs)Crop Adoption Assumptions
Kharif Crop Net Margin
Rabi Crop Net MarginTotal Without Project Benefits
After / With Project Situation:Assumptions
Households (HHs)Crop Adoption Assumptions
Kharif Crop Net Margin
Rabi Crop Net MarginTotal With Project Benefits
Incremental Benefits
Source:
IFFDC - Rajasthan - Pratapgarh: Village S Ka Khera: Incremental Crop Benefit Stream (Rs'000).
Year 1 Year 2 Year 3 Year 4 Year 5 Year 6 Year 7 Year 8 Year 9 Year 101999/00 2000/01 2001/02 2002/03 2003/04 2004/05 2005/06 2006/07 2007/08 2008/09
- - - 57.3 57.3 57.3 57.3 57.3 57.3 57.3
- - - 9.6 9.6 9.6 9.6 9.6 9.6 9.6 - - - 66.9 66.9 66.9 66.9 66.9 66.9 66.9
- - - 207.8 207.8 207.8 207.8 207.8 207.8 207.8
- - - 59.6 59.6 59.6 59.6 59.6 59.6 59.6 - - - 267.4 267.4 267.4 267.4 267.4 267.4 267.4
- - - 200.5 200.5 200.5 200.5 200.5 200.5 200.5
Cost Benefit Analysis (CBA) Study Estimate Jan 2005.
Benefit Streams (Rs '000)

Table AN12.20.8 IFFDC - Rajasthan - Pratapgarh: Village S Ka Khera: Household Livestock Net Margin Assumpt
Without \ With Project UnitsLivestock Year 1 Year 2 Year 3
(Rs) (Rs) (Rs)
Development Activity:Livestock
Before / Without Project Situation:Assumptions
Households (HHs) No 42 Annual Livestock Net Margin Rs/HH
Total Without Project Benefits 1,725.9 1,725.9 1,725.9
After / With Project Situation:
Development Activity:Assumptions
Households (HHs) No 42 Adoption Assumptions Percent 55% 78% 100%
Annual Livestock Net Margin Rs/HHTotal With Project Benefits 1,915.0 2,698.4 3,481.8
Incremental Benefits Rs/HH 189.1 972.5 1,755.9
Source: Cost Benefit Analysis (CBA) Study Estimate Jan 2005.
BenefitsAssumptions

Table AN12.20.8
Without \ With ProjectLivestock
Development Activity:Livestock
Before / Without Project Situation:Assumptions
Households (HHs)Annual Livestock Net Margin
Total Without Project Benefits
After / With Project Situation:
Development Activity:Assumptions
Households (HHs)Adoption Assumptions
Annual Livestock Net MarginTotal With Project Benefits
Incremental Benefits
Source:
IFFDC - Rajasthan - Pratapgarh: Village S Ka Khera: Incremental Livestock Benefit Stream (Rs'000).
Year 1 Year 2 Year 3 Year 4 Year 5 Year 6 Year 7 Year 8 Year 9 Year 101999/00 2000/01 2001/02 2002/03 2003/04 2004/05 2005/06 2006/07 2007/08 2008/09
- - - 72.5 72.5 72.5 72.5 72.5 72.5 72.5
- - - 80.4 113.3 146.2 146.2 146.2 146.2 146.2
- - - 7.9 40.8 73.7 73.7 73.7 73.7 73.7
Cost Benefit Analysis (CBA) Study Estimate Jan 2005.
Benefit Streams (Rs '000)

Table AN12.20.9 IFFDC - Rajasthan - Pratapgarh: Village S Ka Khera: Forestry Benefit Assumptions.
Without \ With Project UnitsForestry Year 1 Year 2 Year 3
(Rs) (Rs) (Rs)
Development Activity:Forestry
Before / Without Project Situation:AssumptionsHouseholds (HHs) No 42 Annual Forestry Net Margin Rs/HH
Total Without Project Benefits - - -
After / With Project Situation:AssumptionsHouseholds (HHs) No 42 Adoption Assumptions Percent 55% 78% 100%Annual Forestry Net Margin Rs/HH
Total With Project Benefits 165.0 234.0 300.0
Incremental Benefits Rs/HH 165.0 234.0 300.0
Source: Cost Benefit Analysis (CBA) Study Estimate Jan 2005.
BenefitsAssumptions

Table AN12.20.9
Without \ With ProjectForestry
Development Activity:Forestry
Before / Without Project Situation:AssumptionsHouseholds (HHs)Annual Forestry Net Margin
Total Without Project Benefits
After / With Project Situation:AssumptionsHouseholds (HHs)Adoption AssumptionsAnnual Forestry Net Margin
Total With Project Benefits
Incremental Benefits
Source:
IFFDC - Rajasthan - Pratapgarh: Village S Ka Khera: Incremental Forestry Benefit Stream (Rs'000).
Year 1 Year 2 Year 3 Year 4 Year 5 Year 6 Year 7 Year 8 Year 9 Year 101999/00 2000/01 2001/02 2002/03 2003/04 2004/05 2005/06 2006/07 2007/08 2008/09
- - - - - - - - - -
- - - 6.9 9.8 12.6 12.6 12.6 12.6 12.6
- - - 6.9 9.8 12.6 12.6 12.6 12.6 12.6
Cost Benefit Analysis (CBA) Study Estimate Jan 2005.
Benefit Streams (Rs '000)

Table AN12.20.10 IFFDC - Rajasthan - Pratapgarh: Village S Ka Khera: Migration Support Benefit Assumptions.
Without \ With ProjectYear 1 Year 2 Year 3(Rs) (Rs) (Rs)
Development Activity:Migration Support
Before / Without Project Situation:Assumptions
Economic Value per Day Rs/day 25.0 Days / Month / Household No - Economic Value per Month Rs/month - Months Migration / Year Months 4.0 Economic Value per Household Rs/HH - Households per Village No 42 Households per Village Migrating Percent 45%
Total Without Project Benefits Rs/Village - - -
After / With Project Situation:Assumptions
Economic Value per Day \1 Rs/day 25.0 30% 32.5 Days / Month / Household No - 30% - Economic Value per Month Rs/month - - Months Migration / Year Months 4.0 -20% 3.2 Economic Value per Household Rs/HH - - Households per Village No 42 42 Households per Village Migrating Percent 45% -20% 36%
Subtotal Migration Income Rs/Village - - -
Other Income Sum (Rs) - - - - - -
Total With Project Benefits Rs/Village - - -
Incremental Benefits Rs/Village - - -
Source: Cost Benefit Analysis (CBA) Study Estimate Jan 2005.
1\ Financial Wages (Rs/day):Skill Labour - Rs 160
Casual Labour :Male - Rs 40Female - Rs 30
BenefitsAssumptions

Table AN12.20.10
Without \ With Project
Development Activity:Migration Support
Before / Without Project Situation:Assumptions
Economic Value per Day Days / Month / Household Economic Value per Month Months Migration / Year Economic Value per Household Households per Village Households per Village Migrating
Total Without Project Benefits
After / With Project Situation:Assumptions
Economic Value per Day \1Days / Month / Household Economic Value per Month Months Migration / Year Economic Value per Household Households per Village Households per Village Migrating
Subtotal Migration Income
Other Income
Total With Project Benefits
Incremental Benefits
Source:
1\ Financial Wages (Rs/day):Skill Labour - Rs 160
Casual Labour :Male - Rs 40Female - Rs 30
IFFDC - Rajasthan - Pratapgarh: Village S Ka Khera: Incremental Migration Support Benefit Stream (Rs'000).
Year 1 Year 2 Year 3 Year 4 Year 5 Year 6 Year 7 Year 8 Year 9 Year 101999/00 2000/01 2001/02 2002/03 2003/04 2004/05 2005/06 2006/07 2007/08 2008/09
- - - - - - - - - -
- - - - - - - - - -
- - - - - - - - - -
- - - - - - - - - -
- - - - - - - - - -
Cost Benefit Analysis (CBA) Study Estimate Jan 2005.
Benefit Streams (Rs '000)

Table AN12.20.11 IFFDC - Rajasthan - Pratapgarh: Village S Ka Khera: Weighted Household Crop Net Margin Summary (Rs/Household).
Item WBR(%) Khalif Rabi Total Khalif Rabi Total Khalif Rabi Total
Phase IIWell Being Ranking - Very Poor
Household Net Margin (Rs) 20.0% 834.6 102.5 937.1 1,849.8 1,067.8 2,917.6 1,015.2 965.3 1,980.5 Well Being Ranking - Poor
Household Net Margin (Rs) 33.0% 637.7 - 637.7 4,803.0 220.7 5,023.7 4,165.3 220.7 4,386.0 Well Being Ranking - Moderate
Household Net Margin (Rs) 37.0% 994.0 89.3 1,083.3 3,711.4 2,508.3 6,219.6 2,717.4 2,419.0 5,136.4 Well Being Ranking - Better Off
Household Net Margin (Rs) 10.0% 6,180.9 1,756.7 7,937.5 16,195.9 2,039.3 18,235.2 10,015.0 282.7 10,297.7
Well Being Ranking - WeightedHousehold Net Margin (Rs) 100.0% 1,363.2 229.2 1,592.4 4,947.7 1,418.4 6,366.1 3,584.5 1,189.2 4,773.7
Phase I \1Well Being Ranking - Very Poor
Household Net Margin (Rs) 20.0% 436.3 484.0 436.3 2,304.0 1,078.3 2,898.3 2,351.8 1,078.3 2,946.0 Well Being Ranking - Poor
Household Net Margin (Rs) 33.0% 485.8 657.5 1,143.3 10,136.0 5,690.3 15,826.3 9,650.3 5,032.8 14,683.0 Well Being Ranking - Moderate
Household Net Margin (Rs) 37.0% 986.3 3,385.0 4,371.3 9,457.5 5,195.0 14,652.5 8,471.3 1,810.0 10,281.3 Well Being Ranking - Better Off
Household Net Margin (Rs) 10.0% 2,778.0 937.0 3,715.0 4,915.0 9,560.0 14,475.0 2,137.0 8,623.0 10,760.0
Well Being Ranking - WeightedHousehold Net Margin (Rs) 100.0% 890.3 1,659.9 2,453.4 7,796.5 4,971.6 12,671.2 7,003.0 3,408.5 10,314.7
Source: Study of Impact of WIRFP on Net Incomes of Target Households, Jan 2004.WBR = IFFDC Household Well Being Ranking. Survey figures adjusted to Village Profile WBR.
\1 GVT - Madhya Pradesh - Phase I: Village Naganwat Choti: Weighted Household Crop Net Margin Summary.
Before / Without Project After / With Project Increment
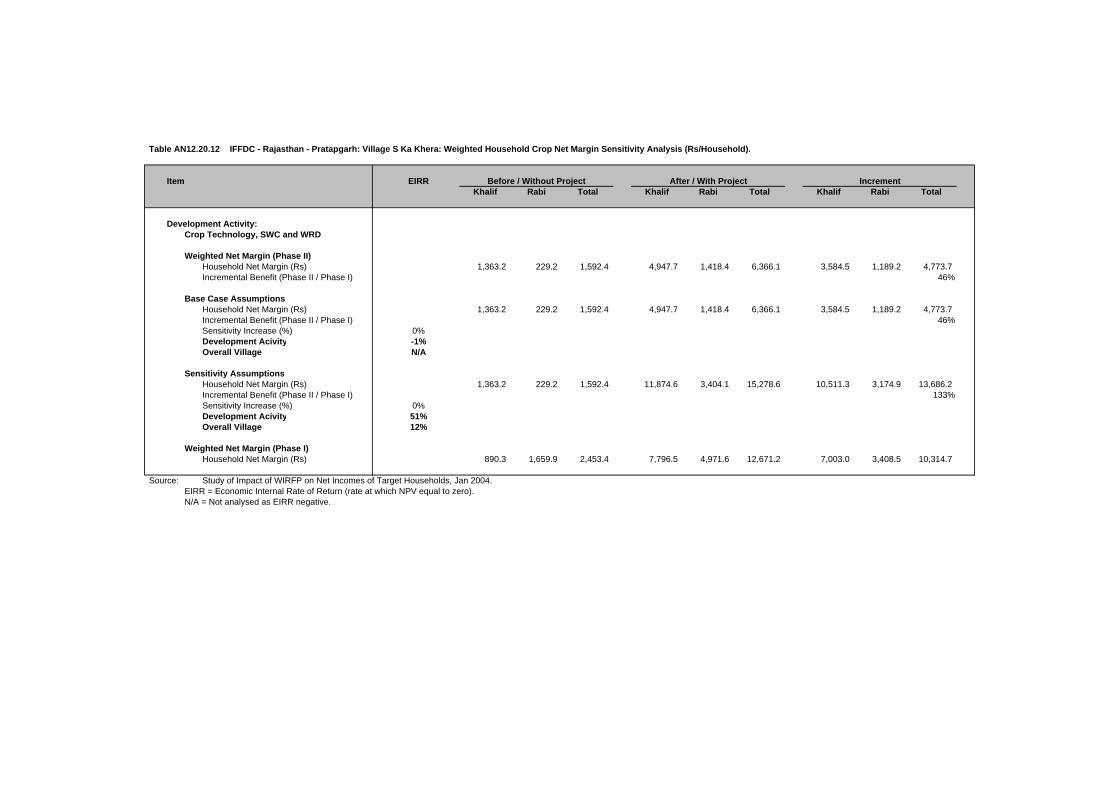
Table AN12.20.12 IFFDC - Rajasthan - Pratapgarh: Village S Ka Khera: Weighted Household Crop Net Margin Sensitivity Analysis (Rs/Household).
Item EIRRKhalif Rabi Total Khalif Rabi Total Khalif Rabi Total
Development Activity:Crop Technology, SWC and WRD
Weighted Net Margin (Phase II)Household Net Margin (Rs) 1,363.2 229.2 1,592.4 4,947.7 1,418.4 6,366.1 3,584.5 1,189.2 4,773.7 Incremental Benefit (Phase II / Phase I) 46%
Base Case AssumptionsHousehold Net Margin (Rs) 1,363.2 229.2 1,592.4 4,947.7 1,418.4 6,366.1 3,584.5 1,189.2 4,773.7 Incremental Benefit (Phase II / Phase I) 46%Sensitivity Increase (%) 0%Development Acivity -1%Overall Village N/A
Sensitivity AssumptionsHousehold Net Margin (Rs) 1,363.2 229.2 1,592.4 11,874.6 3,404.1 15,278.6 10,511.3 3,174.9 13,686.2 Incremental Benefit (Phase II / Phase I) 133%Sensitivity Increase (%) 0%Development Acivity 51%Overall Village 12%
Weighted Net Margin (Phase I)Household Net Margin (Rs) 890.3 1,659.9 2,453.4 7,796.5 4,971.6 12,671.2 7,003.0 3,408.5 10,314.7
Source: Study of Impact of WIRFP on Net Incomes of Target Households, Jan 2004.EIRR = Economic Internal Rate of Return (rate at which NPV equal to zero).N/A = Not analysed as EIRR negative.
Before / Without Project After / With Project Increment

Table AN12.20.13 IFFDC - Rajasthan - Pratapgarh: Village S Ka Khera: Weighted Household Livestock Net Margin Summary (Rs/Household).
Well Being Ranking Weight(%) Herd Value Net Margin Herd Value Net Margin Herd Value Net Margin
Phase I - Well Being Ranking (WBR) \1Madhya Pradesh - WBR Weighted DataVery Poor 20.0%
Average 580 (185.0) 5,650 412.5 474 597.5 Poor 33.0%
Average 2,350 982.5 8,250 2,141.0 1,180 1,158.5 Moderate 37.0%
Average 14,700 6,730.0 1,900 2,820.0 1,900 (3,910.0)Better Off 10.0%
Average 15,580 3,000.0 14,600 10,790.0 (196) 7,790.0
Phase I - WBR Weighted Data 100.0% 7,889 3,077.3 6,016 2,911.4 1,168 (165.9)
Phase II - Well Being Ranking (WBR)
Very Poor 20.0%Average 5,756 149.2 10,970 1,446.4 1,043 1,297.2
Poor 33.0%Average 13,128 852.2 25,979 3,008.8 2,570 2,156.8
Moderate 37.0%Average 13,525 4,035.1 27,020 5,249.5 2,699 1,214.4
Better Off 10.0%Average 12,700 (781.7) 41,873 2,573.3 5,835 3,355.0
Phase II - WBR Weighted Data 100.0% 11,758 1,725.9 24,952 3,481.8 2,639 1,756.0
Source: Study of Impact of WIRFP on Net Incomes of Target Households, Jan 2004.WBR = IFFDC Household Well Being Ranking. Survey figures adjusted to Village Profile WBR.
\1 GVT - Madhya Pradesh - Phase I: Village Naganwat Choti: Weighted Household Livestock Net Margin Summary.
Before / Without Project After / With Project Increment \1

DFID / India: Western India Rainfed Farming Project / Final Report / October 2005
Project Cost Benefit Analysis
AN13

Project Cost Benefit Analysis
AN13-1
DFID / India: Western India Rainfed Farming Project / Final Report / October 2005
Project Cost Benefit Analysis
AN13
Overall Results
Details of the economic investment and recurrent costs and the quantified incremental economic benefits for each of the major development activities are set out in Annex 13 for the 20 sample villages. Selected results are summarised in Table A13.1.
The overall EIRR of the net incremental benefit stream for the 20 sample villages is estimated at 10 percent with a resulting negative NPV of Rs 4.6 million when using an opportunity cost of capital of 12 percent for rural development projects in India. This should be considered as a satisfactory result given the exceedingly poor resource base of the villages selected for the phase two interventions.
Of the twenty sample villages, six villages (Gujarat two, Madhya Pradesh two and Rajasthan two) achieved EIRRs in excess of the 12 percent measure of the opportunity cost of capital for rural development projects.
Sensitivity analysis
Three types of sensitivity analysis were conducted to test the robustness of the cost and benefit assumptions for the phase two sample villages, namely:
• the required level of incremental household net crop margin, in relation to the figure recorded in the phase one village, to achieve an EIRR of 12 percent;
• variation to the number of years for the analysis period to identify the minimum number of years required for project viability; and
• sensitivity to decreases/increases in cost and benefit assumptions:
• a decrease in administration investment costs by 20 percent;
• an increase in administration and development recurrent costs estimates by 20 percent;
• an increase in the ‘with project’ household crop net margin by 20 percent, and
• an increase in the ‘with project’ household livestock net margin by 20 percent.
Incremental Household Crop Net Margin
The phase two incremental household net crop margins, weighted for WBR, for the 20 sample villages ranged from a low of Rs 2,880 (Dharis Kheri, Rajastan) to a high

Project Cost Benefit Analysis
AN13-2
DFID / India: Western India Rainfed Farming Project / Final Report / October 2005
of Rs 7,063 (Sundripada, Rajastan). Given this range of incremental income, six of the 20 sample villages achieved EIRRs equal to or exceeding 12 percent (base case). The adjusted incremental household income to achieve an EIRR of 12 percent, ranged from a low of Rs 7,229 to a high of Rs 12,712. The base case assumptions for the phase two villages, represents some 30 to 50 percent of incremental income levels achieved in the phase one village sampled. It is suggested that, given a longer period of sustained support to the phase two villages, incremental income levels can be expected to increase above those levels recorded in the Net Income Survey in 2003. The sensitivity test measured, for each of the 20 sample villages, the required level of incremental income to achieve an EIRR of 12 percent. This required incremental income level was then compared with the results using the data from the phase one-village sample.
This sensitivity analysis showed that a further nine villages (a total of 15 villages) would achieve an EIRR of 12 percent at incremental household income levels less than those achieved using the phase one sample data, but that the remaining five village would require incremental income levels significantly above the phase one sample to achieve the 12 percent EIRR.
Period of Analysis (years)
The base case period of analysis is for the benefit assumptions to be sustainable for over a 20-year period yielding an EIRR 10 percent. The discounting process has a relatively insignificant effect on the overall EIRR if the analysis period, and benefit assumptions, are extended beyond this period. For both a 25 and 30-year period of analysis, the EIRR would increase by two percentage points to 12 percent. However, and of more significance, if the period of project sustainability is only maintained for 12 years, the EIRR would be reduced by 10 percentage points to zero percent with a substantially negative NPV of Rs 17.6 million.
Cost / Benefit Assumptions - Reduced Administration Investment Costs
At the inception workshop there was much discussion concerning the allocation of the implementing agency headquarter and consultancy administration investment costs. The concern centred on whether the allocation of these investment costs on the basis of the percentage of development costs disbursed for component A, reliably reflected the level of headquarter activity related to this component. A 20 percent reduction in these administration costs would increase the overall village sample EIRR by two percentage points to 12 percent with a near zero NPV, and with a total of seven of the sample villages achieving an EIRR greater than 12 percent.
Cost / Benefit Assumptions – Increased Ongoing Recurrent Costs
As previously indicated in this Annex, no information was forthcoming from the implementing agencies as to the projected level of ongoing administration and development recurrent cost expenditure. This recurrent expenditure would be required to sustain the village development over the life of the project. In addition, no a source of funding been identified for this expenditure. Indicative estimates of recurrent costs have been made for the purpose of the cost benefit analysis but it is recognised that these projections could be substantially under estimated. A sensitivity test was run to identify the effect of a 20 percent increase in the projected recurrent expenditure over the period of the project. Such an increase would reduce
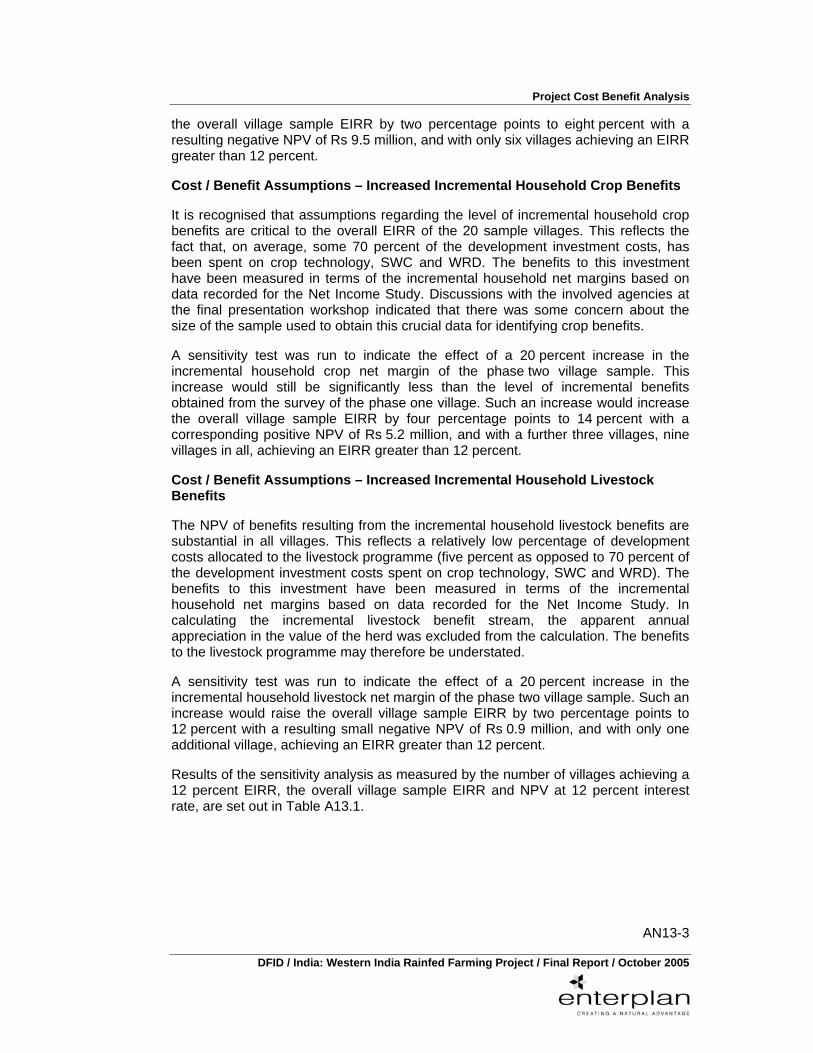
Project Cost Benefit Analysis
AN13-3
DFID / India: Western India Rainfed Farming Project / Final Report / October 2005
the overall village sample EIRR by two percentage points to eight percent with a resulting negative NPV of Rs 9.5 million, and with only six villages achieving an EIRR greater than 12 percent.
Cost / Benefit Assumptions – Increased Incremental Household Crop Benefits
It is recognised that assumptions regarding the level of incremental household crop benefits are critical to the overall EIRR of the 20 sample villages. This reflects the fact that, on average, some 70 percent of the development investment costs, has been spent on crop technology, SWC and WRD. The benefits to this investment have been measured in terms of the incremental household net margins based on data recorded for the Net Income Study. Discussions with the involved agencies at the final presentation workshop indicated that there was some concern about the size of the sample used to obtain this crucial data for identifying crop benefits.
A sensitivity test was run to indicate the effect of a 20 percent increase in the incremental household crop net margin of the phase two village sample. This increase would still be significantly less than the level of incremental benefits obtained from the survey of the phase one village. Such an increase would increase the overall village sample EIRR by four percentage points to 14 percent with a corresponding positive NPV of Rs 5.2 million, and with a further three villages, nine villages in all, achieving an EIRR greater than 12 percent.
Cost / Benefit Assumptions – Increased Incremental Household Livestock Benefits
The NPV of benefits resulting from the incremental household livestock benefits are substantial in all villages. This reflects a relatively low percentage of development costs allocated to the livestock programme (five percent as opposed to 70 percent of the development investment costs spent on crop technology, SWC and WRD). The benefits to this investment have been measured in terms of the incremental household net margins based on data recorded for the Net Income Study. In calculating the incremental livestock benefit stream, the apparent annual appreciation in the value of the herd was excluded from the calculation. The benefits to the livestock programme may therefore be understated.
A sensitivity test was run to indicate the effect of a 20 percent increase in the incremental household livestock net margin of the phase two village sample. Such an increase would raise the overall village sample EIRR by two percentage points to 12 percent with a resulting small negative NPV of Rs 0.9 million, and with only one additional village, achieving an EIRR greater than 12 percent.
Results of the sensitivity analysis as measured by the number of villages achieving a 12 percent EIRR, the overall village sample EIRR and NPV at 12 percent interest rate, are set out in Table A13.1.

Project Cost Benefit Analysis
AN13-4
DFID / India: Western India Rainfed Farming Project / Final Report / October 2005
Table A13.1: Economic Analysis – Sensitivity Tests
Sensitivity Test Results in Comparison to Base Case Assumptions Base Case Number of Villages (No) 1/ 6
Overall Sample EIRR (%) 10%
Overall Sample NVP (Rs M) (4.6)
Incremental Crop Income Level
Base Case Positive Negative
Number of Villages (No) 1/ 6 15 5
Change from Base Case (No) +9
Period of Analysis 20 Years 12 Years 25 Years 30 Years Number of Villages (No) 6 3 7 8
Change from Base Case (No) - -3 +1 +2
Overall Sample EIRR (%) 10% 0% 12% 12%
Change from Base Case (%) - -10% +2% +2%
Overall Sample NVP (Rs M) (4.6) (17.6) (0.8) 1.3
Change from Base Case (Rs M) - (13.0) 3.8 5.9
Changes to Cost / Benefit Assumptions 2/
Test 1 Test 2 Test 3 Test 4
Number of Villages (No) 7 6 9 7
Change from Base Case (No) +1 - +3 +1
Overall Sample EIRR (%) 12% 8% 14% 12%
Change from Base Case (%) +2% -2% +6% +4%
Overall Sample NVP (Rs M) (0.1) (9.5) 5.2 (0.9)
Change from Base Case (Rs M) 3.5 (4.9) 9.8 3.7
Source: Cost Benefit Analysis Study, January 2005. 1/ Number of villages achieving an economic internal rate of return (EIRR) greater than 12 percent (taken as
the opportunity cost of capital for rural development projects in India). 2/ Test One = Administration investment costs reduced by 20 percent.
Test Two = Administration and development recurrent costs increased by 20 percent. Test Three = Household crop net margins increased by 20 percent. Test Four = Household livestock net margins increased by 20 percent. EIRR = Economic Internal Rate of Return, NPV = Net Present Value at 12% interest rate.
WIRFP - Phase II - Cost Benefit Analysis Study
Tables AN13.0 Project Cost Benefit Analysis
Table AN13.1 Cost Benefit Analysis - Sample Village Summary - Financial and Economic Costs (Rs'000).Table AN13.2 Cost Benefit Analysis - Sample Village Summary - Economic Net Incremental Benefit Stream (Rs'000).Table AN13.3 Cost Benefit Analysis - Sample Village Summary - Economic Analysis - Net Present Value (NPV) and Economic Internal Rate of Return (EIRR).
Cost Benefit Analysis - Sample Village Summary - Economic Analysis - Sensitivity Analysis A.Cost Benefit Analysis - Sample Village Summary - Economic Analysis - Sensitivity Analysis B.Cost Benefit Analysis - Sample Village Summary - Economic Analysis - Sensitivity Analysis C.

Table AN13.1 Cost Benefit Analysis - Sample Village Summary - Financial and Economic Costs (Rs'000).
Phase II Households / VillageSample Villages Core Villages Administration Number Cost Administration Total
(No) Componant A Other Costs \1 Componant A Other Costs \1(No) (Rs'000)
Gramin Vikas Trust (GVT)Dahod Coordination Office, Gujarat
A. GVT Administration Costs Gujarat 20 GVT Bhopal (PHQ) 383.7 345.4 DFIDI Consultancy 338.6 338.6 Dahod Coordination Office 1,757.6 1,581.8 Total A 2,480.0 2,879.1 684.2 3,563.3 188 19 2,265.8 2,192.2 615.8 2,808.0
B. Development Costs (per village analysed)Component A
1. Jadha 2,480.0 7,384.1 - 9,864.1 363 27 2,265.8 5,344.7 - 7,610.5 2. Kasotia 2,480.0 3,042.5 - 5,522.5 193 29 2,265.8 2,283.5 - 4,549.4 3. Poyali 2,480.0 3,978.9 - 6,458.8 120 54 2,265.8 2,914.2 - 5,180.0
Jhabua Coordination Office, Madhya Pradesh 72 A. GVT Administration Costs Madhya Pradesh
GVT Bhopal (PHQ) 383.7 345.4 DFIDI Consultancy 338.6 338.6 Jhabua Coordination Office 903.0 812.7 Total A 1,625.4 1,996.7 295.3 3,917.4 107 37 1,496.7 1,479.1 265.7 3,241.6
B. Development Costs (per village analysed)Component A
1. Bagoli 1,625.4 3,887.2 - 5,512.6 86 64 1,496.7 2,880.9 - 4,377.6 2. Borwa 1,625.4 1,250.9 - 2,876.3 36 80 1,496.7 969.1 - 2,465.8 3. Chamjhar 1,625.4 3,798.3 - 5,423.7 79 69 1,496.7 2,712.0 - 4,208.7 4. Chenpura 1,625.4 3,700.9 - 5,326.3 160 33 1,496.7 2,860.7 - 4,357.4 5. Kadwapada 1,625.4 2,342.7 - 3,968.1 86 46 1,496.7 1,872.9 - 3,369.6 6. Padabanda 1,625.4 2,840.0 - 4,465.4 37 121 1,496.7 2,077.7 - 3,574.4
Banswara Coordination Office, RajasthanA. GVT Administration Costs Rajasthan 60
GVT Bhopal (PHQ) 383.7 345.4 DFIDI Consultancy 338.6 338.6 Banswara Coordination Office 869.1 782.2 Total A 1,591.5 2,586.3 437.4 4,615.2 140 33 1,466.2 1,926.1 393.7 3,786.0
B. Development Costs (per village analysed)Component A
1. Bakaner 1,591.5 3,541.4 - 5,132.9 90 57 1,466.2 2,634.7 - 4,100.9 2. Bhuripada 1,591.5 3,909.4 - 5,500.9 160 34 1,466.2 2,851.0 - 4,317.2 3. Gara 1,591.5 5,901.0 - 7,492.5 120 62 1,466.2 4,196.3 - 5,662.5 4. Merana 1,591.5 2,400.7 - 3,992.2 147 27 1,466.2 1,834.5 - 3,300.7 5. Sundripada 1,591.5 3,040.6 - 4,632.1 80 58 1,466.2 2,252.6 - 3,718.8
Indian Farm Forestry Development Cooperative (IFFDC)Pratapgarh Coordination Office, Rajasthan 25
A. IFFDC Administration Costs RajasthanIFFDC Head Quarters 432.5 389.2 DFIDI Consultancy 338.6 338.6 Pratapgarh Coordination Office 1,595.6 1,436.0 Total A 2,366.7 2,011.4 57.6 4,435.7 86 52 2,163.9 1,456.7 51.8 3,672.4
B. Development Costs (per village analysed)Component A
1. Chhayan 2,366.7 3,824.0 - 6,190.7 60 103 2,163.9 2,764.9 - 4,928.8 2. Chhota Myanga 2,366.7 2,461.9 - 4,828.7 49 99 2,163.9 1,765.6 - 3,929.5 3. Dharis Kheri 2,366.7 2,241.9 - 4,608.7 80 58 2,163.9 1,708.7 - 3,872.6 4. Kachotia 2,366.7 2,956.1 - 5,322.8 108 49 2,163.9 2,225.1 - 4,389.0 5. Moti Kheri 2,366.7 4,942.2 - 7,308.9 112 65 2,163.9 3,685.1 - 5,849.1 6. Soma Ka Khera 2,366.7 2,105.5 - 4,472.3 42 106 2,163.9 1,564.3 - 3,728.2
Source: Cost Benefit Analysis (CBA) Study Estimate Jan 2005.\1 Component B and C development costs.
Financial Costs Per Village (Rs'000) Economic Costs Per Village (Rs'000)TotalDevelopment Costs Development Costs

Table AN13.2 Cost Benefit Analysis - Sample Village Summary - Economic Net Incremental Benefit Stream (Rs'000).
Sample Villages EIRR \1 NPV \2 Year 1 Year 2 Year 3 Year 4 Year 5 Year 6 Year 7 Year 8 Year 9 Year 10(10%) 1999/00 2000/01 2001/02 2002/03 2003/04 2004/05 2005/06 2006/07 2007/08 2008/09
Gramin Vikas Trust (GVT)Dahod Coordination Office, Gujarat
Incremental Net Benefits (per villaged analysed) 1. Jadha 28% 4,440 (36) (700) (1,175) (1,204) (795) 902 1,498 2,041 2,045 2,049 2. Kasotia 27% 2,266 (36) (750) (616) (307) 472 (96) 383 1,078 1,079 1,080 3. Poyali 11% (178) (36) (469) (1,118) (289) (521) (477) (26) 604 604 604 Subtotal 23% 6,527 (108) (1,920) (2,909) (1,800) (843) 329 1,855 3,723 3,728 3,733
Jhabua Coordination Office, Madhya PradeshIncremental Net Benefits (per villaged analysed) 1. Bagoli 3% (1,046) (36) (491) (1,093) (592) (750) 25 76 313 313 313 2. Borwa 5% (516) (36) (227) (263) (409) (512) (80) (378) 222 222 222 3. Chamjhar N/A (1,888) (36) (364) (1,021) (673) (350) (907) (230) 121 121 121 4. Chenpura 18% 956 (36) (263) (693) (1,169) (1,060) 318 654 887 887 888 5. Kadwapada 14% 175 (36) (287) (503) (718) (384) (103) 219 488 489 489 6. Padabanda N/A (1,593) (36) (257) (614) (844) (347) (739) (160) 90 90 90 Subtotal 6% (3,913) (215) (1,888) (4,187) (4,406) (3,403) (1,487) 182 2,120 2,122 2,123
Banswara Coordination Office, RajasthanIncremental Net Benefits (per villaged analysed) 1. Bakaner 4% (918) (36) (312) (762) (1,123) (564) (42) (145) 352 353 353 2. Bhuripada 14% 323 (36) (339) (743) (1,201) (346) 255 302 725 622 622 3. Gara 4% (611) (36) (260) (353) 420 (323) (1,651) (544) 302 302 303 4. Merana 32% 2,884 (46) (542) (801) (527) 495 675 690 1,145 1,145 1,145 5. Sundripada 11% (141) (36) (268) (494) (396) (768) (684) (238) 549 550 550 Subtotal 15% 1,537 (189) (1,722) (3,154) (2,827) (1,506) (1,446) 65 3,073 2,971 2,973
Indian Farm Forestry Development Cooperative (IFFDC)Pratapgarh Coordination Office, Rajasthan
Incremental Net Benefits (per villaged analysed) 1. Chhayan N/A (2,408) (244) (230) (576) (1,166) (1,018) (471) (684) 91 92 93 2. Chhota Mayanga N/A (1,660) (237) (267) (330) (734) (868) (395) (541) 138 138 139 3. Dharis Kheri 1% (1,121) (241) (278) (451) (607) (432) (373) (541) 241 241 241 4. Kachotia 8% (551) (244) (389) (569) (655) (217) (272) (446) 434 434 434 5. Moti Kheri 2% (1,504) (248) (588) (607) (905) (707) (475) (636) 385 386 386 6. Soma Ka Khera -4% (1,480) (237) (251) (243) (690) (571) (409) (553) 99 99 99 Subtotal -1% (8,761) (1,451) (2,003) (2,776) (4,757) (3,812) (2,395) (3,400) 1,389 1,391 1,393
Net Incremental Benefits - Sample Village Summary 10% (4,609) (1,963) (7,533) (13,026) (13,790) (9,565) (4,999) (1,299) 10,305 10,211 10,222
Source: Cost Benefit Analysis (CBA) Study Estimate Jan 2005.\1 EIRR = Economic Internal Rate of Return (rate at which NPV equal to zero).\2 NPV = Net Present Value of net incremental benefits at 12% (indicative opportunity cost of capital for rural development projects in India).
N/A = Not analysed as EIRR negative.

Table AN13.3 Cost Benefit Analysis - Sample Village Summary - Economic Analysis - Net Present Value (NPV) and Economic Internal Rate of Return (EIRR).
Sample Villages AdministrationCost PPGF VOD Crop, SWC & WRD LiveStock Forestry Migration
NPV \2 NPV NPV NPV NPV NPV NPV NPV EIRR \1
Gramin Vikas Trust (GVT)Dahod Coordination Office, Gujarat
Development Activity NPV and EIRR 1. Jadha (1,503) (200) 1,231 2,260 2,350 75 226 4,440 28% * 2. Kasotia (1,503) (107) 454 1,995 1,304 54 69 2,266 27% * 3. Poyali (1,503) (103) 220 484 605 48 70 (178) 11%
Jhabua Coordination Office, Madhya PradeshDevelopment Activity NPV and EIRR 1. Bagoli (985) (46) (103) (166) 220 34 - (1,046) 3% 2. Borwa (985) (40) (13) 334 152 8 28 (516) 5% 3. Chamjhar (985) (40) 49 (1,348) 408 30 (2) (1,888) N/A 4. Chenpura (985) (63) 207 748 1,020 26 4 956 18% * 5. Kadwapada (985) (85) 175 708 290 62 10 175 14% * 6. Padabanda (985) (50) (106) (710) 227 19 12 (1,593) N/A
Banswara Coordination Office, RajasthanDevelopment Activity NPV and EIRR 1. Bakaner (972) (141) 70 (174) 269 30 - (918) 4% 2. Bhuripada (972) (129) 369 497 520 38 - 323 14% * 3. Gara (972) (59) 202 (107) 307 18 - (611) 4% 4. Merana (972) (113) 337 2,689 894 49 - 2,884 32% * 5. Sundripada (972) (146) 96 375 482 23 - (141) 11%
Indian Farm Forestry Development Cooperative (IFFDC)Pratapgarh Coordination Office, Rajasthan
Development Activity NPV and EIRR 1. Chhayan (1,449) (42) 7 (1,300) 348 27 - (2,408) N/A 2. Chhota Mayanga (1,449) (19) 26 (517) 272 27 - (1,660) N/A 3. Dharis Kheri (1,449) (54) 58 (174) 448 50 - (1,121) 1% 4. Kachotia (1,449) (41) 53 220 597 68 - (551) 8% 5. Moti Kheri (1,449) (53) 41 (695) 578 74 - (1,504) 2% 6. Soma Ka Khera (1,449) (37) (279) 255 255 17 - (1,517) N/A
Project Sample Villages (20) - Overall - - - - - - - (4,609) 10% 6
Source: Cost Benefit Analysis (CBA) Study Estimate Jan 2005.\1 EIRR = Economic Internal Rate of Return (rate at which NPV equal to zero).\2 NPV = Net Present Value of net incremental benefits at 12% (indicative opportunity cost of capital for rural development projects in India).
N/A = Not analysed as EIRR negative.* Individual villages achieving an EIRR greater than 12 percent.
Development Activity Benefits ResultOverall Village

Table AN13.3
Sample Villages
Gramin Vikas Trust (GVT)Dahod Coordination Office, Gujarat
Development Activity NPV and EIRR 1. Jadha 2. Kasotia 3. Poyali
Jhabua Coordination Office, Madhya PradeshDevelopment Activity NPV and EIRR 1. Bagoli 2. Borwa 3. Chamjhar 4. Chenpura 5. Kadwapada 6. Padabanda
Banswara Coordination Office, RajasthanDevelopment Activity NPV and EIRR 1. Bakaner 2. Bhuripada 3. Gara 4. Merana 5. Sundripada
Indian Farm Forestry Development Cooperative (IFFDC)Pratapgarh Coordination Office, Rajasthan
Development Activity NPV and EIRR 1. Chhayan 2. Chhota Mayanga 3. Dharis Kheri 4. Kachotia 5. Moti Kheri 6. Soma Ka Khera
Project Sample Villages (20) - Overall
Source:
Cost Benefit Analysis - Sample Village Summary - Economic Analysis - Sensitivity Analysis A
Phase IActivity Village Activity Village
(Rs/HH) (Rs/HH) (%) \2 EIRR EIRR (Rs/HH) (%) \2 EIRR EIRR (Rs/HH) (%) \2
12,712.1 4,313.5 34% 29% 28% 4,313.5 34% * 29% 28% 4,313.5 34% *12,073.4 4,095.6 34% 67% 27% 4,095.6 34% * 67% 27% 4,095.6 34% *
9,873.1 4,807.8 49% 22% 11% 4,807.8 49% 24% 12% 5,146.0 52% *
11,183.1 5,401.4 48% 9% 3% 5,401.4 48% 23% 12% 8,347.8 75% *11,367.8 6,354.5 56% 34% 5% 6,354.5 56% 63% 12% 10,174.4 90% *
7,228.8 3,183.9 44% N/A N/A 3,183.9 44% 19% 12% 8,819.8 122%10,989.7 4,238.8 39% 23% 18% 4,238.8 39% * 23% 18% 4,238.8 39% *
9,715.4 4,692.0 48% 32% 14% 4,692.0 48% * 32% 14% 4,692.0 48% *11,200.4 6,144.0 55% N/A N/A 6,144.0 55% 27% 12% 18,019.9 161%
10,259.4 4,672.4 46% 9% 4% 4,672.4 46% 22% 12% 7,470.8 73% *10,989.7 4,238.8 39% 19% 14% 4,238.8 39% * 19% 14% 4,238.8 39% *11,183.1 5,401.4 48% 8% 4% 5,401.4 48% 46% 12% 6,653.6 59% *11,435.5 6,232.6 55% 50% 32% 6,232.6 55% * 50% 32% 6,232.6 55% *11,006.9 7,062.9 64% 19% 11% 7,062.9 64% 21% 12% 7,613.2 69% *
10,073.1 4,627.9 46% N/A N/A 4,627.9 46% 24% 12% 15,542.4 154%11,081.3 5,190.7 47% -5% N/A 5,190.7 47% 33% 12% 14,845.8 134%
9,354.8 2,879.9 31% 6% 1% 2,879.9 31% 34% 12% 6,761.8 72% *9,237.4 3,883.9 42% 17% 8% 3,883.9 42% 28% 12% 5,458.6 59% *
10,283.3 4,522.6 44% 2% 2% 4,522.6 44% 20% 12% 8,075.5 79% *10,314.7 4,773.7 46% -1% N/A 4,773.7 46% 51% 12% 13,686.2 133%
6 15
Cost Benefit Analysis (CBA) Study Estimate Jan 2005.\1 Incremental HH income required to give the activity an EIRR sufficient to provide a return to both activity development cost and administrative costs.
If the activity EIRR was greater than 15% or the village EIRR greater than 12% no sensitivity analysis was performed. \2 Phase II incremental household income expressed as a percentage of the phase I incremental household income.
* Individual villages achieving an EIRR greater than 12 percent.
Incremental IncomeBase Case Sensitivity Test \1
Incremental Income
Crop, SWC and WRD Sensitivity AnalysisPhase II
Incremental Household Income

Table AN13.3
Sample Villages
Gramin Vikas Trust (GVT)Dahod Coordination Office, Gujarat
Development Activity NPV and EIRR 1. Jadha 2. Kasotia 3. Poyali
Jhabua Coordination Office, Madhya PradeshDevelopment Activity NPV and EIRR 1. Bagoli 2. Borwa 3. Chamjhar 4. Chenpura 5. Kadwapada 6. Padabanda
Banswara Coordination Office, RajasthanDevelopment Activity NPV and EIRR 1. Bakaner 2. Bhuripada 3. Gara 4. Merana 5. Sundripada
Indian Farm Forestry Development Cooperative (IFFDC)Pratapgarh Coordination Office, Rajasthan
Development Activity NPV and EIRR 1. Chhayan 2. Chhota Mayanga 3. Dharis Kheri 4. Kachotia 5. Moti Kheri 6. Soma Ka Khera
Project Sample Villages (20) - Overall
Source:
Cost Benefit Analysis - Sample Village Summary - Economic Analysis - Sensitivity Analysis B
ParticipatingHouseholdsPer Village(Number) EIRR \1 NPV \2 EIRR \1 NPV \2 EIRR \1 NPV \2 EIRR \1 NPV \2
363 28% 4,440 * 23% 1,828 * 28% 4,440 * 29% 5,639 *193 27% 2,266 * 22% 889 * 27% 2,669 * 27% 2,898 *120 11% (178) 0% (949) 12% 48 * 13% 176 *
86 3% (1,046) -9% (1,445) 6% (929) 7% (862)36 5% (516) 5% (800) 7% (433) 8% (386)79 N/A (1,888) N/A (2,042) -4% (1,843) -2% (1,818)
160 18% 956 * 10% (176) 19% 1,288 * 19% 1,476 *86 14% 175 * 5% (449) 15% 357 * 15% 461 *37 N/A (1,593) N/A (1,708) N/A (1,560) -2% (1,541)
90 4% (918) -8% (1,368) 7% (786) 8% (712)160 14% 323 * 6% (470) 15% 556 * 16% 688 *120 4% (611) N/A (997) 7% (498) 8% (434)147 32% 2,884 * 28% 1,424 * 32% 3,312 * 32% 3,555 *80 11% (141.4) -1% (842) 12% 64 * 13% 181 *
60 N/A (2,408) N/A (2,527) N/A (2,374) N/A (2,354)49 N/A (1,660) N/A (1,837) -2% (1,608) 0% (1,579)80 1% (1,121) N/A (1,429) 1% (1,121) 5% (980)
108 8% (551) -4% (1,104) 9% (388) 10% (296)112 2% (1,504) N/A (1,997) 4% (1,360) 6% (1,278)42 N/A (1,517) N/A (1,643) -4% (1,480) -2% (1,459)
10% (4,609) 6 0% (17,643) 3 12% (789) 8 12% 1,378 8
Cost Benefit Analysis (CBA) Study Estimate Jan 2005.\1 EIRR = Economic Internal Rate of Return (rate at which NPV equal to zero).\2 NPV = Net Present Value of net incremental benefits at 12% (indicative opportunity cost of capital for rural development projects in
N/A = Not analysed as EIRR negative.* Individual villages achieving an EIRR greater than 12 percent.
Base CaseAnalysis Period
20 Years
Project Analysis Period
30 Years
12 25

Table AN13.3
Sample Villages
Gramin Vikas Trust (GVT)Dahod Coordination Office, Gujarat
Development Activity NPV and EIRR 1. Jadha 2. Kasotia 3. Poyali
Jhabua Coordination Office, Madhya PradeshDevelopment Activity NPV and EIRR 1. Bagoli 2. Borwa 3. Chamjhar 4. Chenpura 5. Kadwapada 6. Padabanda
Banswara Coordination Office, RajasthanDevelopment Activity NPV and EIRR 1. Bakaner 2. Bhuripada 3. Gara 4. Merana 5. Sundripada
Indian Farm Forestry Development Cooperative (IFFDC)Pratapgarh Coordination Office, Rajasthan
Development Activity NPV and EIRR 1. Chhayan 2. Chhota Mayanga 3. Dharis Kheri 4. Kachotia 5. Moti Kheri 6. Soma Ka Khera
Project Sample Villages (20) - Overall
Source:
Cost Benefit Analysis - Sample Village Summary - Economic Analysis - Sensitivity Analysis C
ParticipatingHouseholdsPer Village(Number) EIRR \1 NPV \2 EIRR \1 NPV \2 EIRR \1 NPV \2 EIRR \1 NPV \2
363 30% 4,740 * 27% 3,931 * 31% 5,348 * 31% 5,265 *193 31% 2,566 * 26% 2,090 * 30% 2,945 * 30% 2,771 *120 13% 122 * 9% (456) 15% 495 * 12% 61 *
86 5% (849) 1% (1,327) 8% (520) 3% (1,046)36 7% (319) 3% (586) 9% (250) 6% (440)79 N/A (1,691) N/A (2,167) -2% (1,478) -5% (1,732)
160 19% 1,116 * 16% 677 * 20% 1,474 * 19% 1,251 *86 17% 372 * 14% 47 * 18% 572 * 16% 382 *37 N/A (1,396) N/A (1,783) -3% (1,349) N/A (1,489)
90 6% (724) 2% (1,140) 8% (514) 7% (689)160 16% 518 * 12% 61 * 18% 963 * 16% 541 *120 6% (416) -1% (959) 13% 123 * 8% (297)147 34% 3,078 * 30% 2,721 * 36% 3,844 * 32% 2,884 *80 11% (141.4) 8% (503.3) 14% 334.7 * 11% (141.4)
60 N/A (2,118) N/A (2,703) N/A (2,130) N/A (2,272)49 -4% (1,370) N/A (1,853) -2% (1,397) -4% (1,563)80 3% (831) -1% (1,278) 4% (822) 3% (947)
108 10% (261) 6% (759) 11% (141) 9% (339)112 3% (1,214) -1% (1,849) 6% (1,025) 4% (1,179)42 N/A (1,227) N/A (1,677) (0.0) (1,295) N/A (1,517)
12% (46) 7 8% (9,513) 6 14% 5,177 9 12% (933) 7
Cost Benefit Analysis (CBA) Study Estimate Jan 2005.\1 EIRR = Economic Internal Rate of Return (rate at which NPV equal to zero).\2 NPV = Net Present Value of net incremental benefits at 12% (indicative opportunity cost of capital for rural development projects in India).
N/A = Not analysed as EIRR negative.* Individual villages achieving an EIRR greater than 12 percent.
BenefitsLivestock
HH Income Plus 20%HH Income Plus 20%Crops, SWC and WRD
CostsAdministration
Investment Less 20%Development
Recurrent Plus 20%