department: financial services for submission to · this report provides finance committee with...
TRANSCRIPT
Department: Financial ServicesMarch 16, 2015
For Submission toMarch 23, 2015
Finance Committee Meeting
To: Deputy Mayor Jeff Carlson and Members of Finance Committee
Re: Unaudited 2014 Year End Financial Information
Introduction:
This report provides Finance Committee with highlights of the 2014 General Fund,Utility Fund and Reserve Funded operations for the year ended December 31, 2014.The narrative in this report has been prepared by the managers of each respectiveBusiness Unit.
Attached for your information are:
A. Summary of Operations
i. General Fund – 2014 Corporate Accounts (A-1)
ii. General Fund – 2014 Business Unit Operations (A-2)
iii. Utility & Reserve Funds – 2014 Operations (A-3)
iv. Narrative to the Summary of Operations (A-4)
B. Statement of Reserves (Attachment B)
C. 2014 Budget Appropriation Unexpended (Carry Overs) (Attachment C)
D. Summary of Subdivision Surplus
i. Industrial Subdivision Surplus Funding Analysis (Attachment D-1)
ii. Residential Subdivision Surplus Funding Analysis (Attachment D-2)
E. Offsite Account Analysis (Attachment E)
F. Investment Summary (Attachment F)
G. External & Internal Borrowings (Attachment G)
H. Affordable Housing & Heart of Our City Committee (Attachment H)
I. GST Rebates (Attachment I)
J. Corporate Budget Contingency (Attachment J)
K. 2012-2014 Budget Initiatives (Attachment K)
1

As Finance Committee is aware, December 31, 2014 marked the completion of theCity's fifth multi-year operating budget cycle (2012-2014). To accommodate the three-year budget cycle, Business Units were expected to operate within their 36 monthbudget allocation. If there was a shortfall after the second year, Business Units wereexpected to overcome the deficit by adjusting expenditures in the final year of thethree-year budget (2014); and if the experience after the second year resulted in a netsurplus, the Business Units rolled over the surplus to assist their operations during2014.
Conclusion
To conclude we are extremely pleased with the successful conclusion of our fifth multi-year budget cycle. The Business Units within our organization continue to do anadmirable job of providing established levels of service to our community and managingbudget funds responsibly within our overall three year operating budget. In addition,our financial policies continue to serve the City of Lethbridge and its residents well andgive us a solid financial position for the future. We look forward to continuing successesin the future.
Respectfully submitted,
Corey Wight, CA Barry Sawada, CA Garth Sherwin, CACity Treasurer Controller City Manager
2
Attachment A - 1
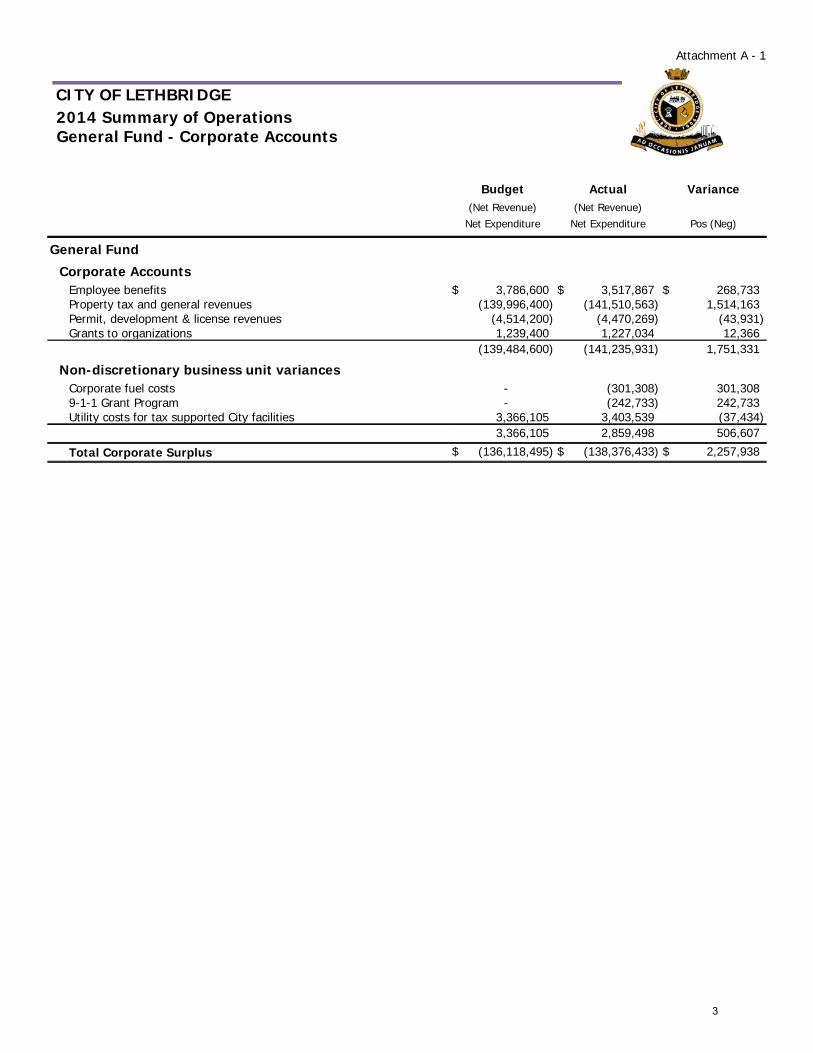
CITY OF LETHBRIDGE2014 Summary of OperationsGeneral Fund - Corporate Accounts
Budget(Net Revenue)
Net Expenditure
Actual(Net Revenue)
Net Expenditure
Variance
Pos (Neg)
General Fund
Corporate AccountsEmployee benefits $ 3,786,600 $ 3,517,867 $ 268,733Property tax and general revenues (139,996,400) (141,510,563) 1,514,163Permit, development & license revenues (4,514,200) (4,470,269) (43,931)Grants to organizations 1,239,400 1,227,034 12,366
(139,484,600) (141,235,931) 1,751,331
Non-discretionary business unit variancesCorporate fuel costs - (301,308) 301,3089-1-1 Grant Program - (242,733) 242,733Utility costs for tax supported City facilities 3,366,105 3,403,539 (37,434)
3,366,105 2,859,498 506,607
Total Corporate Surplus $ (136,118,495) $ (138,376,433) $ 2,257,938
3

Attachment A - 2
CITY OF LETHBRIDGE2012 - 2014 Summary of OperationsGeneral Fund - Business Unit Operations
2014 2014 2014 2013 2012-2014Budget
Net Expenditure
Actual
Net Expenditure
Variance
Pos (Neg)
Roll OverRemaining
Pos (Neg)
TotalOperating
ActualPos (Neg)
Boards and CommissionsGalt Museum $ 1,429,652 $ 1,428,888 $ 764 $ - $ 764Lethbridge Regional Police Services 30,335,096 30,335,096 - - -Public Library 5,438,492 5,430,221 8,271 - 8,271
General GovernmentCity Clerk Department 693,915 686,403 7,512 - 7,512City Manager & Communications Dept. 1,132,855 1,122,759 10,096 - 10,096City Solicitor Department 315,595 283,246 32,349 - 32,349Economic Development 1,339,246 1,328,330 10,916 - 10,916Mayor & City Council Office 885,197 856,469 28,728 123,131 151,859Pay-As-You-Go 12,429,000 12,429,000 - - -
Corporate ServicesAssessment & Taxation 1,542,799 1,490,959 51,840 114,465 166,305Financial Services 2,481,447 2,435,418 46,029 119,328 165,357Human Resources 1,735,002 1,705,461 29,541 - 29,541Information Technology 3,166,582 3,155,855 10,727 - 10,727
Community ServicesCommunity & Social Development 756,400 756,400 - - -Community Services Support 912,964 905,706 7,258 - 7,258ENMAX Centre 1,190,156 1,252,301 (62,145) - (62,145)Facility Services 4,512,942 4,512,942 - - -Fire & Emergency Services 19,749,071 19,653,794 95,277 - 95,277Helen Schuler Nature Centre 562,425 537,653 24,772 - 24,772Public Safety Communications Centre 2,200,141 2,200,602 (461) - (461)Recreation & Culture 7,163,824 7,200,505 (36,681) 50,734 14,053Regulatory Services 1,190,789 1,146,965 43,824 31,887 75,711Transit and Accessible Transportation 10,778,679 10,623,071 155,608 470,121 625,729
Planning and Development ServicesDevelopment Services 2,479,197 2,423,853 55,344 - 55,344Inspection Services 2,132,713 2,186,927 (54,214) 10,806 (43,408)
Infrastructure ServicesInfrastructure Services Administration 668,471 684,777 (16,306) 32,588 16,282Parks Maintenance and Management 10,364,905 10,362,476 2,429 20,568 22,997Storm Sewer Maintenance 331,187 316,871 14,316 - 14,316Transportation 11,555,406 11,547,592 7,814 4,642 12,456
Total $139,474,148 $139,000,540 $ 473,608 $ 978,270 $ 1,451,878
4
Attachment A - 3
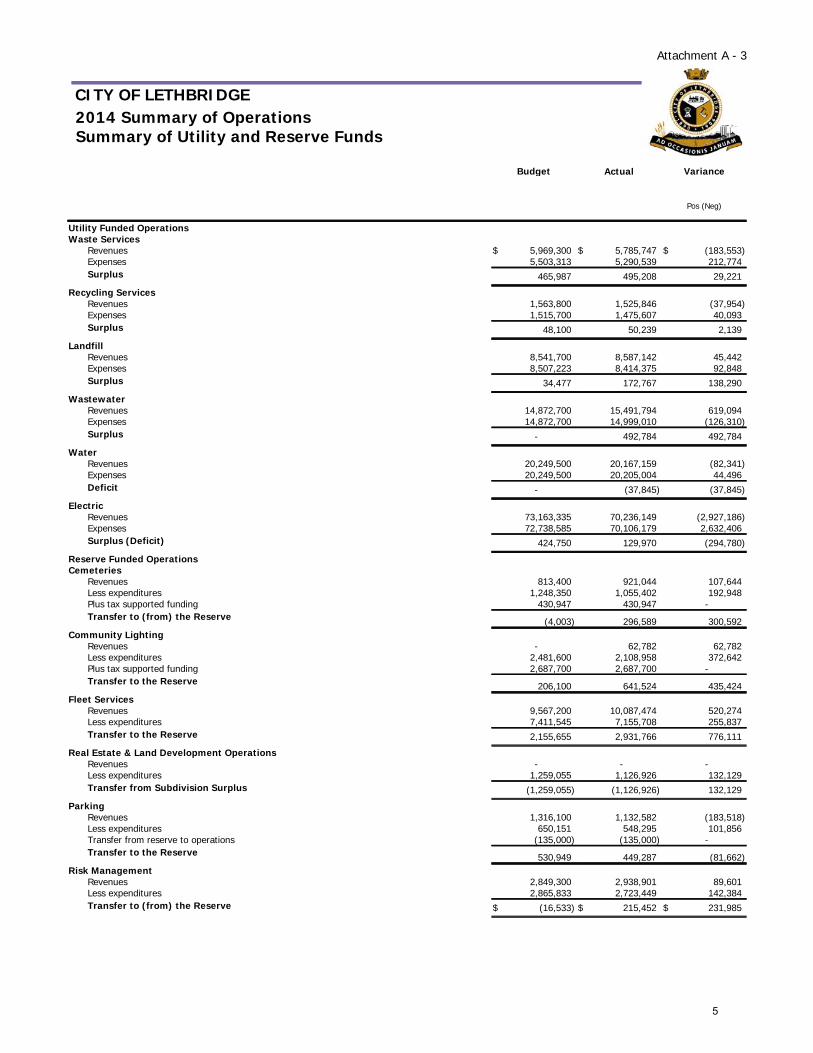
CITY OF LETHBRIDGE2014 Summary of OperationsSummary of Utility and Reserve Funds
Budget Actual Variance
Pos (Neg)
Utility Funded OperationsWaste Services
Revenues $ 5,969,300 $ 5,785,747 $ (183,553)Expenses 5,503,313 5,290,539 212,774Surplus 465,987 495,208 29,221
Recycling ServicesRevenues 1,563,800 1,525,846 (37,954)Expenses 1,515,700 1,475,607 40,093Surplus 48,100 50,239 2,139
LandfillRevenues 8,541,700 8,587,142 45,442Expenses 8,507,223 8,414,375 92,848Surplus 34,477 172,767 138,290
WastewaterRevenues 14,872,700 15,491,794 619,094Expenses 14,872,700 14,999,010 (126,310)Surplus - 492,784 492,784
WaterRevenues 20,249,500 20,167,159 (82,341)Expenses 20,249,500 20,205,004 44,496Deficit - (37,845) (37,845)
ElectricRevenues 73,163,335 70,236,149 (2,927,186)Expenses 72,738,585 70,106,179 2,632,406Surplus (Deficit) 424,750 129,970 (294,780)
Reserve Funded OperationsCemeteries
Revenues 813,400 921,044 107,644Less expenditures 1,248,350 1,055,402 192,948Plus tax supported funding 430,947 430,947 -Transfer to (from) the Reserve (4,003) 296,589 300,592
Community LightingRevenues - 62,782 62,782Less expenditures 2,481,600 2,108,958 372,642Plus tax supported funding 2,687,700 2,687,700 -Transfer to the Reserve 206,100 641,524 435,424
Fleet ServicesRevenues 9,567,200 10,087,474 520,274Less expenditures 7,411,545 7,155,708 255,837Transfer to the Reserve 2,155,655 2,931,766 776,111
Real Estate & Land Development OperationsRevenues - - -Less expenditures 1,259,055 1,126,926 132,129Transfer from Subdivision Surplus (1,259,055) (1,126,926) 132,129
ParkingRevenues 1,316,100 1,132,582 (183,518)Less expenditures 650,151 548,295 101,856Transfer from reserve to operations (135,000) (135,000) -Transfer to the Reserve 530,949 449,287 (81,662)
Risk ManagementRevenues 2,849,300 2,938,901 89,601Less expenditures 2,865,833 2,723,449 142,384Transfer to (from) the Reserve $ (16,533) $ 215,452 $ 231,985
5

Attachment A - 4
Narrative to the Summary of Operations
The following provides Finance Committee with an overview of the operations of the City ofLethbridge, and are summarized under the following areas:
I General Fund Operations
a. Corporate Accounts
b. Business Unit Operations
II Utility Funded Operations
III Reserves
IV Capital Works Summary
V Glossary of Terms
I.a. General Fund - 2014 Corporate Accounts
Corporate Accounts Surplus of $2,257,938 - Specific positive and negative budget variancesresulting from factors not attributable to the business unit management (e.g. windfall revenues andutility costs on city facilities) are reported as a corporate responsibility.
By City policy, the corporate portion of the General Fund surplus accrues to the Municipal RevenueStabilization Reserve.
The major areas are summarized as follows:
Employee Benefit accounts - ended the year with a positive variance of $268,700. The mostsignificant contributing factors were lower than anticipated rates for medical and dental coverage andfavorable WCB rates.
Property tax and general revenues - ended the year with a positive variance of $1,514,200.
Property Taxes - ended the year with a positive variance of $1,469,300. This was due to acombination of factors. Community growth was higher than budgeted by $634,100 due mainly to higher than anticipated growth in commercial properties as well as higher than anticipatedgrowth in educational residential properties of $225,100. The City realized higher than anticipatedproperty tax revenue from Grant-in-lieu properties of $120,100. In addition, interim and
6
Attachment A - 4 (cont'd)
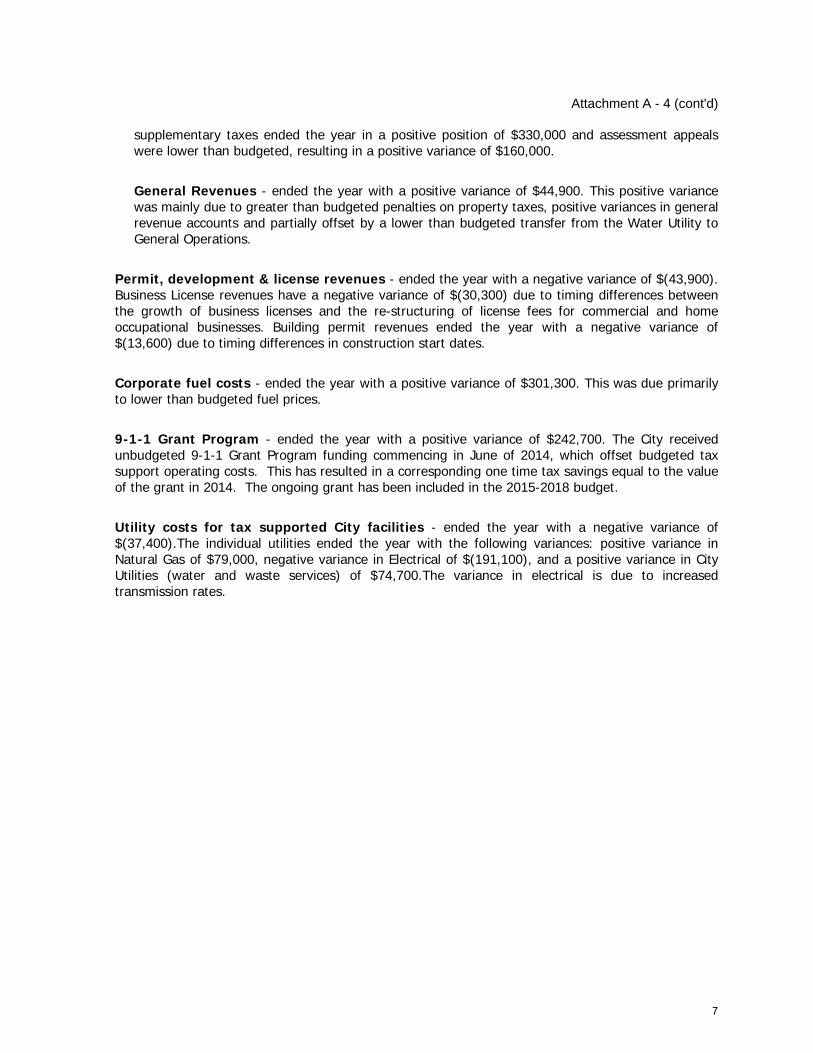
supplementary taxes ended the year in a positive position of $330,000 and assessment appealswere lower than budgeted, resulting in a positive variance of $160,000.
General Revenues - ended the year with a positive variance of $44,900. This positive variancewas mainly due to greater than budgeted penalties on property taxes, positive variances in generalrevenue accounts and partially offset by a lower than budgeted transfer from the Water Utility toGeneral Operations.
Permit, development & license revenues - ended the year with a negative variance of $(43,900).Business License revenues have a negative variance of $(30,300) due to timing differences betweenthe growth of business licenses and the re-structuring of license fees for commercial and homeoccupational businesses. Building permit revenues ended the year with a negative variance of$(13,600) due to timing differences in construction start dates.
Corporate fuel costs - ended the year with a positive variance of $301,300. This was due primarilyto lower than budgeted fuel prices.
9-1-1 Grant Program - ended the year with a positive variance of $242,700. The City receivedunbudgeted 9-1-1 Grant Program funding commencing in June of 2014, which offset budgeted taxsupport operating costs. This has resulted in a corresponding one time tax savings equal to the valueof the grant in 2014. The ongoing grant has been included in the 2015-2018 budget.
Utility costs for tax supported City facilities - ended the year with a negative variance of$(37,400).The individual utilities ended the year with the following variances: positive variance inNatural Gas of $79,000, negative variance in Electrical of $(191,100), and a positive variance in CityUtilities (water and waste services) of $74,700.The variance in electrical is due to increasedtransmission rates.
7

Attachment A - 4 (cont'd)
I.b. General Fund - 2014 Business Unit Operations
Business Unit Accounts ended the year with a positive variance of $473,608 (which represents 0.3% ofthe Business Units' budgets). This amount along with the rollover remaining from 2013 of $978,270 totals$1,451,878 as shown in detail in the General Fund - Business Unit Operations in Attachment A-2.
Significant areas contributing to the tax supported Business Unit variances are described below:
Boards and Commissions
Galt Museum - ended the year with a positive variance of $800.
Lethbridge Regional Police Services (LRPS) - ended the year in a balanced position as a resultof applying Police Commission approved prior year carry overs to operational expenditures of$(426,300). The net over expenditures was a result of a requirement to increase security services by$(200,000) in order to house prisoners within the LRPS facility due to a recent decision of the AlbertaSolicitor General to no longer allow use of the Remand Centre for prisoner detention, the need foradditional polygraph service of $(30,000) for newly hired staff, legal expenses for ongoinginvestigations of $(50,000), recruiting costs of $(50,000), and other general operating costs of$(96,300).
Public Library - ended the year with a positive variance of $8,300 due to higher than anticipatedrevenues from grants, fines & fees and miscellaneous income combined with under expenditures inlibrary materials, security and special services.
General Government and Corporate Services
Mayor & City Council Office - ended the year with a positive variance of $28,700 due to lower thanbudgeted travel and convention expenses.
Assessment & Taxation - ended the year with a positive variance of $51,800 due to temporarystaffing vacancies resulting from a maternity leave and a long-term illness. The department is fullystaffed in 2015.
Financial Services - ended the year with a positive variance of $46,000 due to under expendituresin banking and other financing charges.
Community Services
Community & Social Development - Family and Community Support Services (FCSS) has beenapproved by the Province to expend the amount of $21,300 from the 2014 grant in 2015. Theseamounts have been carried forward to 2015.
ENMAX Centre - ended the year with a negative variance of $(62,100). This was due to lower thanexpected attendance resulting in a shortfall of food and beverage sales.
8

Attachment A - 4 (cont'd)
Fire & Emergency Services - ended the year with a positive variance of $95,300 in generaloperations. The 2014 recruit class, ambulances, consumables and equipment required for the AlbertaHealth Services service increase on December 1, 2014 was funded through Alberta Health revenue.
Recreation & Culture - ended the year with a negative variance of $(36,700).
Regulatory Services - ended the year with a positive variance of $43,800. Animal control had apositive variance of $65,000 which was mainly due to reduced operating expenses during buildingconstruction and dog license fee revenue. Regulatory Services general expenditures had a $(21,200)negative variance.
Transit and Accessible Transportation - ended the year with a positive variance of $155,600.
Transit - ended the year with a positive variance of $223,100. Transit was able to reduce the costof warranty on smart card software maintenance by $45,800 through contract negotiations. Advertising and fare revenues had a positive variance of $48,300. Operating costs were underbudget by $129,000 due to improved attendance management, training programs that werecurtailed due to building construction and purchasing efficiencies for uniforms.
Access-A-Ride (AAR) - ended the year with a negative variance of $(67,500). A revenueshortfall of $(134,800) indicates that expectations of ridership were estimated higher than thesystem can currently manage. AAR had an positive variance in operations of $67,300 that partiallyoffset the revenue shortfall.
Planning and Development Services
Planning and Development Services - ended the year with a positive variance of $1,100. Thiswas as a result of revenue shortfalls being offset by under expenditures through a conscious decisionto control operating expenditures to match decreased volumes.
Infrastructure Services
Infrastructure Services - ended the year with a positive variance of $8,300.
9

Attachment A - 4 (cont'd)
II 2014 Utility Funded Operations
Utility Services - The Utility Services operation ended the year with a positive variance of $356,900which has been distributed back to the utilities at year end.
i) Contracted service costs ended the year under spent due to favorablemeter reading services contract pricing.
$ 430,500
ii) Under expenditures were realized in the Customer Call Center, CollectionsManagement, contract costs for disconnects/reconnects, bad debt expenseand System Maintenance accounts.
368,500
iii) Negative variance in Utility administration fee revenue - there was arevenue shortfall for disconnect notices and disconnect/reconnect fees dueto a change in collection practices. For example, rather than immediatelydisconnecting customers in arrears and charging a disconnect fee,customers are given an additional 48 hours to pay prior to disconnecting.Additionally, the $15 disconnect notice fee is waived if the customer hasnot received a notice in the previous 6 month period. As well, as revenuesfrom Utility Service's administration fees did not meet budgeted targets dueto lower than projected community growth.
(442,100)
Waste and Recycling Services - is comprised of the Waste, Recycling and Landfill operations.
Waste Services
Budgeted surplus $ 466,000Actual surplus 495,200Variance - positive $ 29,200
Waste (Solid Waste) Services - ended the year with a positive variance of $29,200. The variancewas due to factors as follows:
i) The Clean City Programs finished the year in a positive position due tounder expenditures in the Large Item Service program of $110,000, theCity Property Clean-Up program of $10,000 and the Fall Leaf collectionprogram of approximately $11,000.
$ 131,000
ii) Commercial collection expenses ended the year with a positive variance.This is due to costs associated with dumping commercial waste at thelandfill being lower than budget as well as a reduction in replacement binpurchases.
49,200
iii) Residential collection expenditures ended the year with a positive varianceof $48,000 due primarily to a lower than budgeted amount spent on binreplacements as well as lower than budgeted equipment repair andservicing charges.
48,000
10

Attachment A - 4 (cont'd)
Waste Services (continued)
iv) Waste Services Administration and Accounting finished the year with anegative variance due to a greater than budgeted amount of engineeringstudies.
(15,400)
v) Revenues ended the year with a negative variance of $(183,600).Residential revenues ended the year in a slight positive variance of$12,900, but were offset by a negative variance of $(196,500) in theCommercial class.
(183,600)
The accumulated surplus as at December 31, 2014 is $1,272,683, 2013 was $777,475.
Recycling Services
Budgeted surplus $ 48,100Actual surplus 50,200Variance - positive $ 2,100
Recycling Services - ended the year with a positive variance of $2,100. The major factors thatcontributed to this variance are as follows:
i) Residential Waste Diversion programs finished the year with a positivevariance of $156,400. The Hazardous Waste Diversion programs (E-waste,Toxic waste and Paint) ended the year with a negative variance of$(42,700). The Organic Waste Diversion programs (Chipping, Green waste,Christmas Tree and Fall Leaf Collection) collectively ended the year with anegative variance of $(95,000). These negative variances were offset by a$294,100 positive variance in the recycling depots operations. This islargely due to greater efficiencies associated with operating the newcentralized recycling stations (the 2012-2014 operating budget was basedon the previous operating model associated with operating a number ofsmaller recycling stations throughout the City).
$ 156,400
ii) Waste prevention (education and green waste) accounts finished the yearwith a positive variance due to a reduction in costs relating toEnvironmental Week activities.
33,800
iii) The Commercial Recycling program ended the year with a positive variancedue to decreased equipment and supplies charges.
7,900
iv) Waste Reduction recycling revenues finished the year with a negativevariance due to lower than budgeted residential growth.
(38,000)
v) An increased transfer of funds were applied to 2014 CIP E-12 - RecyclingDepot - to reduce planned borrowing and its associated costs.
(158,000)
The accumulated surplus as at December 31, 2014 is $743,687, 2013 was $693,448.
11
Attachment A - 4 (cont'd)
Landfill Operations
Budgeted surplus $ 34,500Actual surplus 172,800Variance - positive $ 138,300
Landfill Operations - ended the year with a positive variance of $138,300. The major factors thatcontributed to this are as follows:
i) Landfill operating costs were under budget due to a reduction in landfillcontractual service costs.
$ 74,500
ii) Net revenues were slightly greater (0.53%) than anticipated. 47,700
iii) Debenture Debt - payments and financial charges were slightly lower thanbudgeted due to a lower than budgeted amount of borrowing required forlandfill upgrades.
16,100
The accumulated surplus as at December 31, 2014 is $1,564,389, 2013 was $1,391,622.
Wastewater Operations
Balanced budget $ - Actual surplus 492,800 Variance - positive $ 492,800
Wastewater Operations - ended the year with a positive variance of $492,800. The majorcontributing factors to this are as follows:
i) Commercial, Regional and Industrial revenues realized during the yearwere higher than budgeted. This positive variance is the result of higherthan usual sewage loading from industry. Industrial customers canmitigate the additional costs through more diligent wastewater pre-treatment.
$ 619,100
ii) Wastewater Collection accounts ended the year with a positive variance.During 2014, there were increased efforts directed towards the repair andmaintenance of sanitary service connections. However these were morethan offset by under expenditures in sanitary main repair and wastewaterutility locates.
220,200
iii) Wastewater Engineering and Technical Support ended the year with apositive variance due primarily to a temporarily unfilled position.
50,900
iv) Wastewater Administration accounts ended the year with a positivevariance due primarily to lower than budgeted charges from Utility Servicesfor meter data management services.
48,500
v) Wastewater treatment plant (WWTP) maintenance and process operationsended 2014 with a negative variance due primarily to over expenditures tothe annual sludge removal program.
(50,900)
12

Attachment A - 4 (cont'd)
Wastewater Operations (continued)
vi) Wastewater lifecycle renewal programs had a negative variance in 2014 asadditional funds were applied to fund the 2014 Sanitary Sewer Re-liningprogram.
(395,000)
The accumulated surplus as at December 31, 2014 is $2,166,477, 2013 was $1,673,693.
Water Operations
Balanced budget $ -Actual deficit 37,800Variance - negative $ (37,800)
Water Operations - ended the year with a negative variance of $(37,800). The major contributingfactors to this are as follows:
i) Water Distribution System operations ended the 2014 year with a negativevariance due primarily to an increased amount of preventative andcorrective maintenance to the water distribution system.
$ (182,800)
ii) Water Treatment Plant ended the year with a slight negative variance dueprimarily to weather events in March and June which caused unusuallymuddy water to be drawn from the Oldman River requiring increasedchemical treatment of the raw water supply .
(164,800)
iii) Water revenues ended the year with a slight negative variance (0.20% ofbudget).
(39,400)
iv) Water Administration accounts ended with a positive variance due primarilyto lower than budgeted charges from Utility Services for meter datamanagement services.
82,300
v) Water Engineering and Technical Support ended the year with a positivevariance due to temporary staff vacancies.
107,200
vi) Debenture Debt – payments and financial charges had a positive variancedue to a lower than budgeted amount of borrowing required for watercapital upgrades.
159,700
The accumulated surplus as at December 31, 2014 is $2,000,860, 2013 was $2,038,705.
13
Attachment A - 4 (cont'd)
Electric Utility
Budgeted surplus $ 424,800Actual surplus 130,000Variance - negative $ (294,800)
The Electric Utility generated a negative variance of $(294,800) from operations for the 2014 fiscalyear, broken down as follows:
Regulated Rate Tariff - negative $ (440,000)Distribution Tariff - negative (435,000)Fibre Operations - positive 20,000Transmission Tariff - positive 560,200Total Electric Operations - negative variance $ (294,800)
Regulated Rate - sales of electricity under the Regulated Rate Option experienced a negativevariance of $(440,000). The month of July came in at a loss which was due to being under hedged,resulting in having to purchase more energy for customers at higher open market prices. Also, sincethe budget was prepared in 2011, the Department of Energy has removed the Utility's ability topurchase long term hedges which limits the stability of wholesale energy costs.
Distribution Tariff - ended the year with a negative variance of $(435,000). This can be attributedto an overall decrease in the amount of energy consumed by customers in the City. Residentialcustomers showed a 2% decrease in consumption while commercial customers reduced consumptionby 7.5% when compared to 2013. Industrial customers increased consumption by less than ½ of 1%.At this time it is unclear whether this can be attributed to weather or other factors.
Fibre Operations - ended the year with a positive variance of $20,000 due to an increase incustomer requirements for service.
Transmission Tariff - experienced a positive variance of $560,200 primarily due to a reduction inmaintenance costs for substations and transmission lines. This can be attributed to significant capitalwork being done over the past few years creating a more reliable system. The capital workload hasalso reduced the number of employee hours available for maintenance.
The 2014 Electric Operations actual surplus of about $130,000 will be transferred to the MunicipalRevenue Stabilization Reserve in 2015 in accordance with City policy.
14
Attachment A - 4 (cont'd)
III 2014 Reserves
The Reserve Funded Operations are summarized for Finance Committee on Attachment A-3. Inaddition, all City reserves are reported in the Statement of Reserves. Additional information isdescribed below:
Cemeteries Transfer to Reserve - the 2014 net transfer to the cemetery reserve was in a positivevariance of $300,600, comprised of $18,800 of interest revenue and a $281,800 positive variance inoperations. The major factors that contributed to the positive variance in operations are as follows:
i) Rights to Internment and Internment Services revenue exceeded 2014 budget expectations dueto Mountain View plot sales by $108,400.
ii) Deferred lifecycle maintenance of $143,400 and a positive variance in various operationalexpenditures of $30,000.
Community Lighting Transfer to Reserve - finished the year with a positive net transfer to thereserve of $435,400. Roadway Lighting distribution and consumption charges ended the year with apositive variance of $301,500 due primarily to savings realized due to the recent conversion of thecity's 13,000 streetlights to LED bulbs. Roadway lighting maintenance programs also finished the yearwith a positive variance of $133,900 due to decreased maintenance required for the newly installedLED bulbs. This underexpenditure will be balanced through an increased transfer to the CommunityLighting Reserve.
Fleet Services Transfer to Reserve - Fleet operations ended the year with a positive net transferto the reserve of $776,100 more than budgeted. This positive variance was due primarily to lowerthan budgeted fuel prices of approximately $553,200 as well as increased monthly rental revenue dueto higher than budgeted equipment usage of approximately $981,400. These positive variances werepartially offset by an increased allocation for equipment replacement $(535,900) as well as increasedcosts for parts, consumables and outsourced specialty services $(222,600).
Parking Transfer to Reserve - The transfer to the reserve had a negative variance of $(81,700).Off-street parking operations finished the year in a with a slight positive variance of approximately$12,800 due to increased revenue from both Off-street parking lots and from Off-street RV parking.This positive variance was off-set by a $(94,500) negative variance in On-street parking operationsdue in large part to a recent legislative requirement to remit GST on parking revenues.
Risk Management Transfer to Reserve - the contribution to the Insurance Reserve of $232,000was higher than budgeted due to lower than anticipated insurance premium costs.
Snow Clearing - ice control and snow removal operations ended the year with a positive variance of$495,200. In accordance with City Council policy, any annual variance from sanding and snow andice removal operations will be transferred to / funded from the Municipal Revenue StabilizationReserve (MRSR).
Traffic Safety Act Revenues - ended the year with a negative variance of $(1,179,400). TheIntersection Safety Devices (red light radar enforcement) were down earlier in the year, due to adirective from the Solicitor General's office to all police agencies to cease using Intersection Safety
15
Attachment A - 4 (cont'd)
Devices until such time as the Province certified the systems and issued certificatesauthorizing their use. In addition, equipment problems and poor weather early in the year(equipment cannot be used in certain locations and traffic speeds decrease during adverse winterconditions) resulted in less than budgeted revenues. Revenues include photo radar for the City ofLethbridge, provincial violation fines (tickets for speeding, failing to stop, going through red lights,etc.) and revenue from Coaldale and Taber for delivery of Photo Radar Enforcement. In accordancewith City Council policy, the Traffic Safety Act revenues will be directed to the Municipal RevenueStabilization Reserve and do not impact the year end operating surplus.
16

Attachment A-4 (cont'd)
IV Capital Works
2014 Expenditures
FacilitiesCrossings Ice Complex (2014-2023 D-7) 10,754,600$ Lethbridge Regional Police Headquarters Expansion (2014-2023 D-6) 5,284,900 Transit Facility Expansion (2011-2020 D-25) 4,587,700 ENMAX Air Conditioning (2014-2023 D-23) 1,250,900 Public Operations Facility (2011-2020 D-7) 855,300 Henderson Outdoor Pool (2014-2023 D-13 Amended March 2, 2015) 801,100
Infrastructure
* Water Main Renewals (Operating Budget) 4,588,300 28 Street North (Mayor Magrath Drive to 26 Avenue North) (2011-2020 C-30) 3,849,900
* Sewer Lining Program (Operating Budget) 2,870,300 Metis Trail - Includes Deep Utilities (2014-2023 CO-7 & EO-1 Amended Sept 2014) 2,781,600 Exhibition Infrastructure Upgrades (2014-2023 D-9) 2,688,900
Residential Subdivisions (SunRidge, RiverStone, Crossings) 2,563,800
* Electric Switchgear Replacement (2014-2023 F-6) 2,439,100 Electric Cable Replacement (2014-2023 F-15) 2,397,300 SE Regional Lift Station (2014-2023 EO-2) 2,296,500 43 Street North (Highway 3 to 9 Avenue North) (2011-2020 C-17) 2,129,000 26 Avenue North (Scenic Drive to 28 Street North) (2011-2020 C-18) 2,036,600 Traffic & Pedestrian Signals (2014-2023 CO-1) 1,930,200 Advanced Metering Infrastructure (2014-2023 F-17) 1,588,500
* Sanitary Sewer (2A Avenue North & 26 Street North) (Operating Budget) 1,526,700 Storm Outfall Rehabilitation (Operating Budget) 1,489,100
* Park Lighting Replacement (2014-2023 D-19) 1,210,800
* Mayor Magrath Drive (40 Avenue South to City Limit) (2014-2023 CO-2) 1,068,700
* Arterial Roadways (2014-2023 C-9) 1,024,700 Parks Asset Management (2014-2023 D-5) 1,012,800
* Street Upgrading (Operating Budget) 919,500 Northwest Substation for Additional Capacity (2014-2023 F-4) 913,400
* Lane Drainage Improvements (Operating Budget) 912,200
* Completed in 2014
City Council has approved a number of projects, the majority through the Capital Improvement Program. These projects, by their nature, are often completed over a number of years. The most significant expenditures for the twelve month period were as follows:
For the most part, capital projects have a construction period which expands beyond the calendar year. These cost figures only represent capital expenditures made in 2014.
17

Attachment A - 4 (cont'd)
V Glossary of Terms
Business Unit Operations Roll Over - Prior year(s) tax supported budget variance between theapproved budget and actual revenue or expenditures for the fiscal period. To accommodate the threeyear budget cycle, Business Units were expected to operate within their 36 month budget allocation.If there was a shortfall after the second year, Business Units were expected to overcome the deficitby adjusting expenditures in the final year of the three-year budget (2014); and if the experienceafter the second year resulted in a net surplus, the Business Units rolled over the surplus to assisttheir operations during the last year of the budget cycle.
Business Unit Operation Variance - The specific Business Unit budgeted variance between theapproved budget and actual net expenditure for the fiscal period. These variances are theresponsibility of the business unit.
Corporate Accounts - Specific revenues and expenses are considered corporate in nature sincevariances are not attributable to operational decisions. These include employee benefits, propertytaxes and general revenues, permits, development and license revenues and grants to organizations.By City policy, the corporate portion of the General Fund surplus accrues to the Municipal RevenueStabilization Reserve.
Corporate Fuel - Variances due to market price fluctuations versus budgeted fuel costs for taxsupported services (price variances for Fleet Service's units are offset against the Fleet Reserve).
Electric Utility Operating Surplus/Deficit - The City of Lethbridge electric utility's residualoperating surplus/ (deficit) is applied to/ (from) the Municipal Revenue Stabilization Reserve (MRSR).
Non-discretionary business unit variances - Specific positive and negative budget variancesresulting from factors not attributable to the business unit management (e.g. windfall revenues andutility costs on city facilities) are reported as a corporate responsibility. Similar to corporate accounts,the surplus or deficit accrues to the Municipal Revenue Stabilization Reserve.
Reserve Funded Operations - City services where the expenditures of the related operations arefunded from specific revenue sources that are legally restricted for specified purposes.
Utility costs for tax supported City facilities - Variances due to utility price fluctuations versusbudgeted City facility utility costs. These variances are not attributable to management decisions.
Utility Funded Operations - The City sets fees and user charges for each utility operation at a levelthat fully supports the total direct and indirect cost of the utility. Therefore, these operations areaccounted for separately from taxation supported operations.
Water, Wastewater and Waste Accumulated Surplus - The primary purpose of the surpluses isto set aside funds to provide for unanticipated or emergency expenditures that could not bereasonably foreseen during the preparation of the budget and/or for down payments on the utility'scapital projects.
18
Attachment B
December 31 December 312014 2013
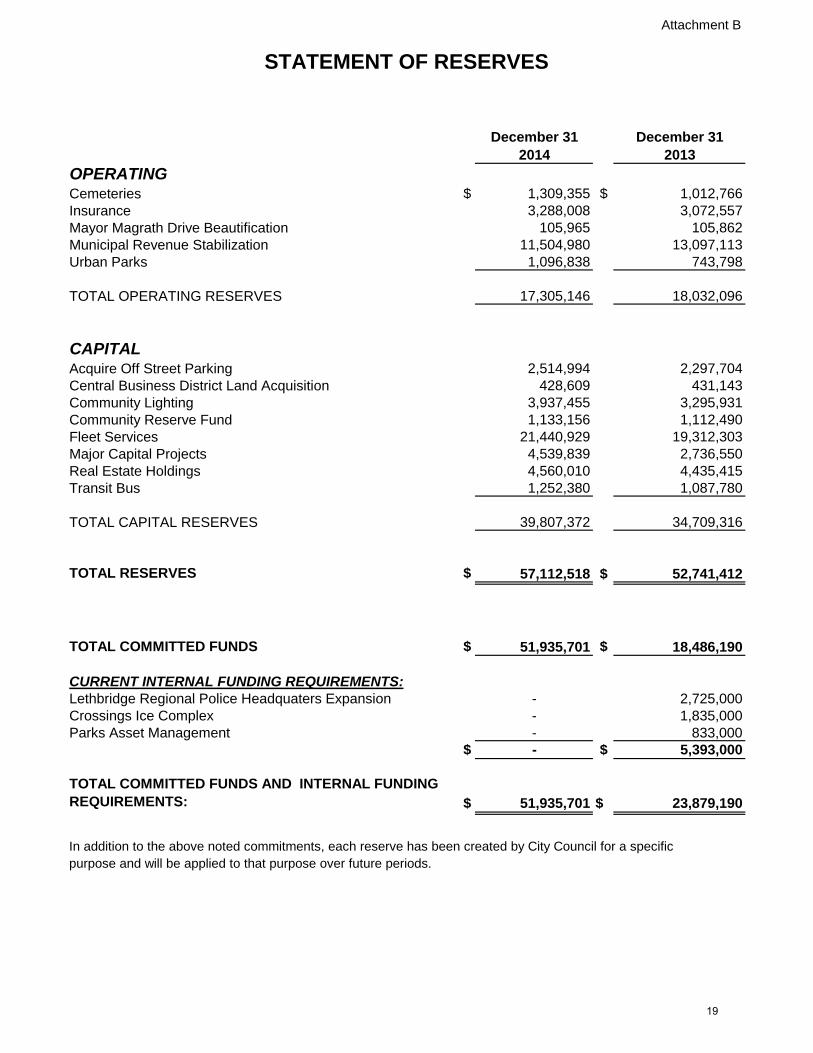
OPERATINGCemeteries $ 1,309,355 $ 1,012,766Insurance 3,288,008 3,072,557Mayor Magrath Drive Beautification 105,965 105,862Municipal Revenue Stabilization 11,504,980 13,097,113Urban Parks 1,096,838 743,798
TOTAL OPERATING RESERVES 17,305,146 18,032,096
CAPITAL Acquire Off Street Parking 2,514,994 2,297,704Central Business District Land Acquisition 428,609 431,143Community Lighting 3,937,455 3,295,931Community Reserve Fund 1,133,156 1,112,490Fleet Services 21,440,929 19,312,303Major Capital Projects 4,539,839 2,736,550Real Estate Holdings 4,560,010 4,435,415Transit Bus 1,252,380 1,087,780
TOTAL CAPITAL RESERVES 39,807,372 34,709,316
TOTAL RESERVES $ 57,112,518 $ 52,741,412
TOTAL COMMITTED FUNDS $ 51,935,701 $ 18,486,190
CURRENT INTERNAL FUNDING REQUIREMENTS:Lethbridge Regional Police Headquaters Expansion - 2,725,000Crossings Ice Complex - 1,835,000Parks Asset Management - 833,000
$ - $ 5,393,000
TOTAL COMMITTED FUNDS AND INTERNAL FUNDING REQUIREMENTS: $ 51,935,701 $ 23,879,190
In addition to the above noted commitments, each reserve has been created by City Council for a specificpurpose and will be applied to that purpose over future periods.
STATEMENT OF RESERVES
19

RESERVE ANALYSISFor Period Ending December 31, 2014
Attachment B
CEMETERIES
Balance as at January 1, 2014 $ 1,012,765.77
Add: Allocation from Operations 277,776.12Interest earnings 18,813.44 296,589.56
Balance as at December 31, 2014 $ 1,309,355.33
Committed funds:Cemetery Marketing Plan (Budget 2012-14) $ 30,000.00
INSURANCE
Balance as at January 1, 2014 $ 3,072,556.59
Add: Allocation from Operations 215,451.19
Balance as at December 31, 2014 $ 3,288,007.78
Committed funds:Data Entry Project (Budget 2012-14) $ 70,000.00
MAYOR MAGRATH DRIVE BEAUTIFICATION
Balance as at January 1, 2014 $ 105,862.32
Add: - Thrift Lodge 316.80 - Saigonese Restaurant 250.00 566.80
106,429.12
Less: Land Lease Taxes 463.63
Balance as at December 31, 2014 $ 105,965.49
OPERATING RESERVES
20
RESERVE ANALYSISFor Period Ending December 31, 2014
Attachment B
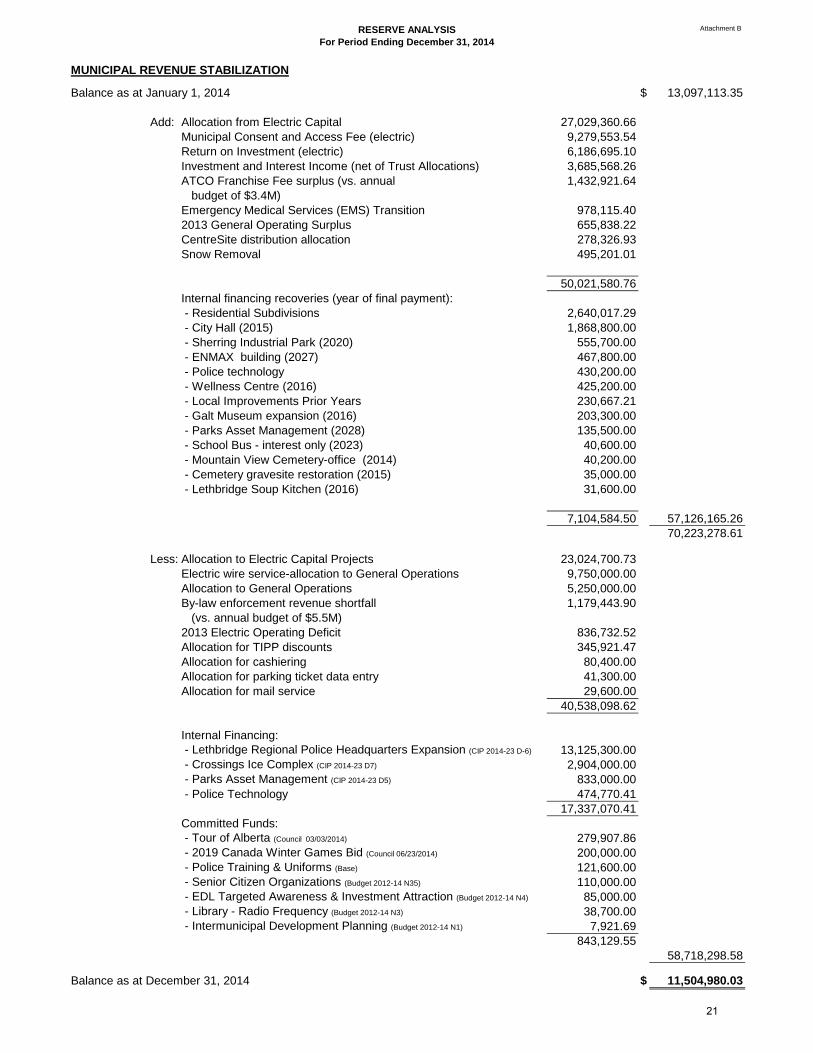
MUNICIPAL REVENUE STABILIZATION
Balance as at January 1, 2014 $ 13,097,113.35
Add: Allocation from Electric Capital 27,029,360.66Municipal Consent and Access Fee (electric) 9,279,553.54Return on Investment (electric) 6,186,695.10Investment and Interest Income (net of Trust Allocations) 3,685,568.26ATCO Franchise Fee surplus (vs. annual 1,432,921.64 budget of $3.4M)Emergency Medical Services (EMS) Transition 978,115.402013 General Operating Surplus 655,838.22CentreSite distribution allocation 278,326.93Snow Removal 495,201.01
50,021,580.76Internal financing recoveries (year of final payment): - Residential Subdivisions 2,640,017.29 - City Hall (2015) 1,868,800.00 - Sherring Industrial Park (2020) 555,700.00 - ENMAX building (2027) 467,800.00 - Police technology 430,200.00 - Wellness Centre (2016) 425,200.00 - Local Improvements Prior Years 230,667.21 - Galt Museum expansion (2016) 203,300.00 - Parks Asset Management (2028) 135,500.00 - School Bus - interest only (2023) 40,600.00 - Mountain View Cemetery-office (2014) 40,200.00 - Cemetery gravesite restoration (2015) 35,000.00 - Lethbridge Soup Kitchen (2016) 31,600.00
7,104,584.50 57,126,165.2670,223,278.61
Less: Allocation to Electric Capital Projects 23,024,700.73Electric wire service-allocation to General Operations 9,750,000.00Allocation to General Operations 5,250,000.00By-law enforcement revenue shortfall 1,179,443.90 (vs. annual budget of $5.5M)2013 Electric Operating Deficit 836,732.52Allocation for TIPP discounts 345,921.47Allocation for cashiering 80,400.00Allocation for parking ticket data entry 41,300.00Allocation for mail service 29,600.00
40,538,098.62
Internal Financing: - Lethbridge Regional Police Headquarters Expansion (CIP 2014-23 D-6) 13,125,300.00 - Crossings Ice Complex (CIP 2014-23 D7) 2,904,000.00 - Parks Asset Management (CIP 2014-23 D5) 833,000.00 - Police Technology 474,770.41
17,337,070.41Committed Funds: - Tour of Alberta (Council 03/03/2014) 279,907.86 - 2019 Canada Winter Games Bid (Council 06/23/2014) 200,000.00 - Police Training & Uniforms (Base) 121,600.00 - Senior Citizen Organizations (Budget 2012-14 N35) 110,000.00 - EDL Targeted Awareness & Investment Attraction (Budget 2012-14 N4) 85,000.00 - Library - Radio Frequency (Budget 2012-14 N3) 38,700.00 - Intermunicipal Development Planning (Budget 2012-14 N1) 7,921.69
843,129.5558,718,298.58
Balance as at December 31, 2014 $ 11,504,980.03
21
RESERVE ANALYSISFor Period Ending December 31, 2014
Attachment B
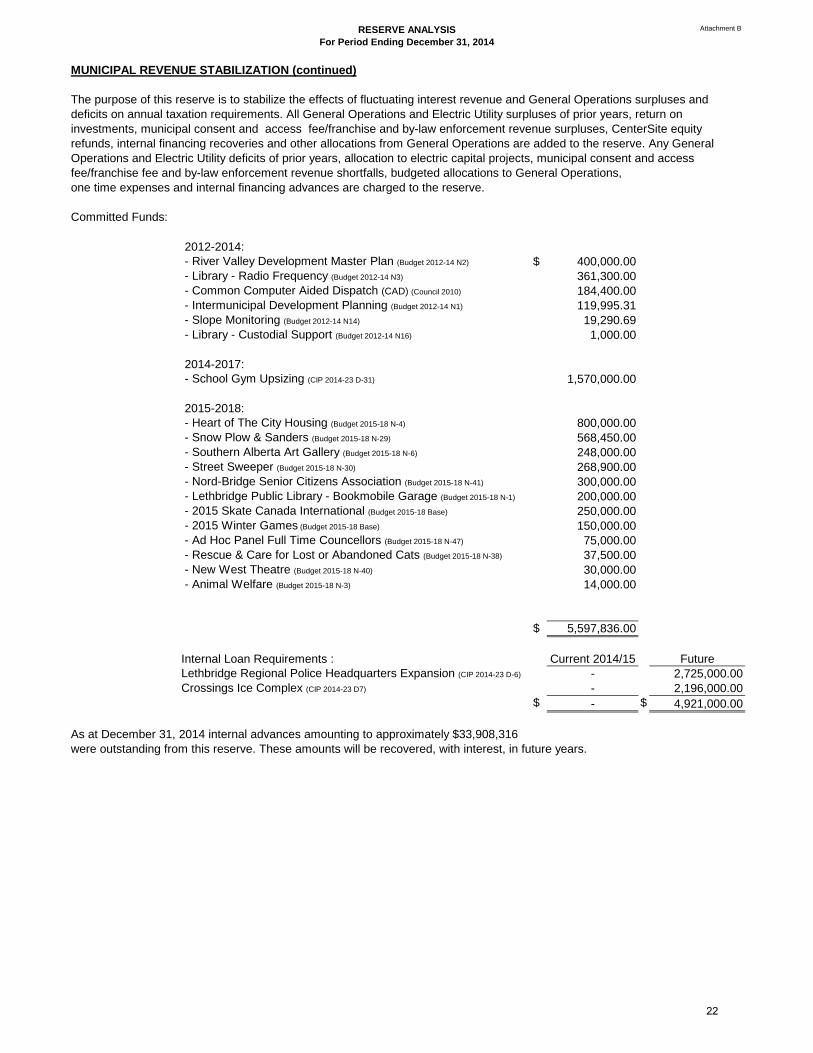
MUNICIPAL REVENUE STABILIZATION (continued)
The purpose of this reserve is to stabilize the effects of fluctuating interest revenue and General Operations surpluses anddeficits on annual taxation requirements. All General Operations and Electric Utility surpluses of prior years, return oninvestments, municipal consent and access fee/franchise and by-law enforcement revenue surpluses, CenterSite equity refunds, internal financing recoveries and other allocations from General Operations are added to the reserve. Any General Operations and Electric Utility deficits of prior years, allocation to electric capital projects, municipal consent and access fee/franchise fee and by-law enforcement revenue shortfalls, budgeted allocations to General Operations, one time expenses and internal financing advances are charged to the reserve.
Committed Funds:
2012-2014: - River Valley Development Master Plan (Budget 2012-14 N2) $ 400,000.00 - Library - Radio Frequency (Budget 2012-14 N3) 361,300.00 - Common Computer Aided Dispatch (CAD) (Council 2010) 184,400.00 - Intermunicipal Development Planning (Budget 2012-14 N1) 119,995.31 - Slope Monitoring (Budget 2012-14 N14) 19,290.69 - Library - Custodial Support (Budget 2012-14 N16) 1,000.00
2014-2017: - School Gym Upsizing (CIP 2014-23 D-31) 1,570,000.00
2015-2018: - Heart of The City Housing (Budget 2015-18 N-4) 800,000.00 - Snow Plow & Sanders (Budget 2015-18 N-29) 568,450.00 - Southern Alberta Art Gallery (Budget 2015-18 N-6) 248,000.00 - Street Sweeper (Budget 2015-18 N-30) 268,900.00 - Nord-Bridge Senior Citizens Association (Budget 2015-18 N-41) 300,000.00 - Lethbridge Public Library - Bookmobile Garage (Budget 2015-18 N-1) 200,000.00 - 2015 Skate Canada International (Budget 2015-18 Base) 250,000.00 - 2015 Winter Games (Budget 2015-18 Base) 150,000.00 - Ad Hoc Panel Full Time Councellors (Budget 2015-18 N-47) 75,000.00 - Rescue & Care for Lost or Abandoned Cats (Budget 2015-18 N-38) 37,500.00 - New West Theatre (Budget 2015-18 N-40) 30,000.00 - Animal Welfare (Budget 2015-18 N-3) 14,000.00
$ 5,597,836.00
Internal Loan Requirements : Current 2014/15 FutureLethbridge Regional Police Headquarters Expansion (CIP 2014-23 D-6) - 2,725,000.00Crossings Ice Complex (CIP 2014-23 D7) - 2,196,000.00
$ - $ 4,921,000.00
As at December 31, 2014 internal advances amounting to approximately $33,908,316were outstanding from this reserve. These amounts will be recovered, with interest, in future years.
22

RESERVE ANALYSISFor Period Ending December 31, 2014
Attachment B
MUNICIPAL REVENUE STABILIZATION (continued)
In addition, amounts to the following community groups remain committed against this reserve. These amounts have been recorded as receivables by the City as at December 31, 2014.
Year Maturity Original Balance as at AnnualAmount December 31, 2014 Payment
Japanese Gardens 2005 2015 18,000.00 $ 1,800.00 $ 1,800.00Lethbridge Softball Association 2005 2016 190,000.00 24,434.58 12,217.29Prairie Baseball Club 1999 2019 240,000.00 50,000.00 10,000.00
SLP Skate Park naming 2014 2023 100,000.00 70,000.00 10,000.00Lethbridge Hurricanes 2012 2029 2,500,000.00 2,166,666.66 166,666.67
URBAN PARKS
Balance as at January 1, 2014 $ 743,798.46
Add: Allocation from operations 417,174.58Trans Alta right of way transmission line access 5,865.00 423,039.58
1,166,838.04
Less: West Lethbridge Centre Washrooms (CIP 2014-23 D38) 70,000.00
Balance as at December 31, 2014 $ 1,096,838.04
Committed Funds: - Lethbridge Sports Park Change Rooms (CIP 2014-23 D37) $ 770,000.00 - West Lethbridge Centre Washrooms (CIP 2014-23 D38) 420,000.00 - Urban Forest Management Plan (Budget 2015-18 N-8) 175,000.00 - Henderson Lake Water Quality (CIP 2008-17 D10) 51,265.00 - Galt Gardens Master Plan (Budget 2015-18 N-15) 50,000.00 - Nicholas Sheran Playground (CIP 2011-20 D19) 25,000.00 - Parks equipment 10,888.00
$ 1,502,153.00
TOTAL OPERATING RESERVES as at December 31, 2014 $ 17,305,146.67
23
RESERVE ANALYSISFor Period Ending December 31, 2014
Attachment B
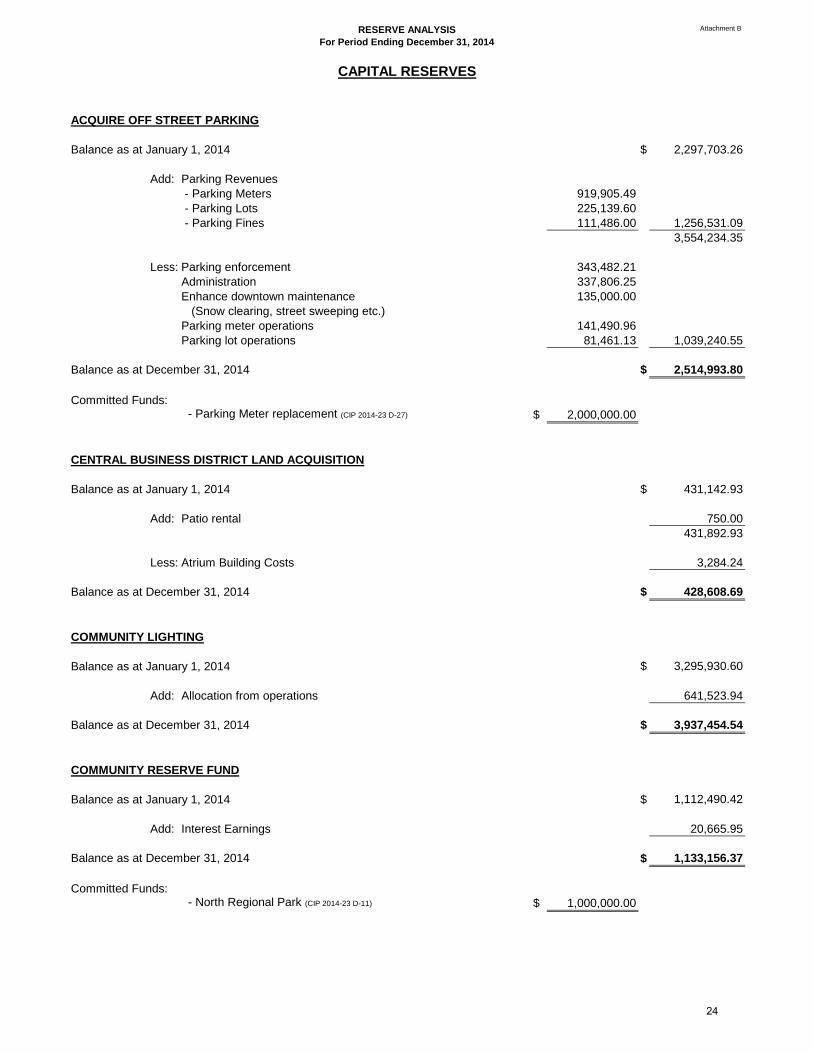
ACQUIRE OFF STREET PARKING
Balance as at January 1, 2014 $ 2,297,703.26
Add: Parking Revenues - Parking Meters 919,905.49 - Parking Lots 225,139.60 - Parking Fines 111,486.00 1,256,531.09
3,554,234.35
Less: Parking enforcement 343,482.21Administration 337,806.25Enhance downtown maintenance 135,000.00 (Snow clearing, street sweeping etc.)Parking meter operations 141,490.96Parking lot operations 81,461.13 1,039,240.55
Balance as at December 31, 2014 $ 2,514,993.80
Committed Funds: - Parking Meter replacement (CIP 2014-23 D-27) $ 2,000,000.00
CENTRAL BUSINESS DISTRICT LAND ACQUISITION
Balance as at January 1, 2014 $ 431,142.93
Add: Patio rental 750.00431,892.93
Less: Atrium Building Costs 3,284.24
Balance as at December 31, 2014 $ 428,608.69
COMMUNITY LIGHTING
Balance as at January 1, 2014 $ 3,295,930.60
Add: Allocation from operations 641,523.94
Balance as at December 31, 2014 $ 3,937,454.54
COMMUNITY RESERVE FUND
Balance as at January 1, 2014 $ 1,112,490.42
Add: Interest Earnings 20,665.95
Balance as at December 31, 2014 $ 1,133,156.37
Committed Funds: - North Regional Park (CIP 2014-23 D-11) $ 1,000,000.00
CAPITAL RESERVES
24

RESERVE ANALYSISFor Period Ending December 31, 2014
Attachment B
FLEET SERVICES
Balance as at January 1, 2014 $ 19,312,303.44
Add: Asset replacement contributions 2,625,424.62Allocation from fleet operations 240,252.29Sale of Equipment 98,082.89Recoveries: - School Bus debt paydown (principal)(2023) 72,400.00 3,036,159.80
22,348,463.24
Less: Purchase of equipment 419,428.40
Fleet Management 488,106.08 907,534.48
Balance as at December 31, 2014 $ 21,440,928.76
As at December 31, 2014 internal advances amounting to about $932,141 are owing to thisreserve. These amounts are to be recovered in future years.
Committed funds:Budget 2015-2018 $ 25,432,583.00Budget 2012-2014 4,375,900.00Transit Fleet Maintenance 555,028.65Equipment replacements (2011 and prior) 22,200.00
$ 30,385,711.65
MAJOR CAPITAL PROJECTS
Balance as at January 1, 2014 $ 2,736,550.21
Add: Pay-As-You-Go 1,680,718.86Repayment of salt & sand storage facility 50,000.00Interest Earnings 72,569.57 1,803,288.43
Balance as at December 31, 2014 $ 4,539,838.64
Committed funds:Leisure Centre (CIP 2014-23 D-32 amended August 5, 2014) $ 9,600,000.00Spitz Stadium (CIP 2014-23 D-40) 1,400,000.00
$ 11,000,000.00
REAL ESTATE HOLDINGS
Balance as at January 1, 2014 $ 4,435,414.65
Add: Right of Way Sale Proceeds 166,764.96Land Lease Tax Recovery 3,198.45Rental Income: College Lincoln Ford 5,220.00 Maple Leaf Foods 2,640.00 177,823.41
4,613,238.06
Less: Melcor Land Exchange 48,228.35Road Closure Fees 5,000.00 53,228.35
Balance as at December 31, 2014 $ 4,560,009.71
25

RESERVE ANALYSISFor Period Ending December 31, 2014
Attachment B
TRANSIT BUS
Balance as at January 1, 2014 $ 1,087,780.11
Add: Allocation from operations for 125,000.00 transit technology & system improvementsAllocation from operations for 39,600.00 radio & equipment maintenance lifecycle 164,600.00
Balance as at December 31, 2014 $ 1,252,380.11
Committed Funds:Transit and Access-A-Ride Master Plan (Budget 2015-18 N-7) $ 350,000.00
Note: The balance of this reserve consists of funds allocated to the reservefor maintenance and lifecycle of Lethbridge Transit and ACCESS-A-Ridetechnology and equipment
TOTAL CAPITAL RESERVES as at December 31, 2014 $ 39,807,370.62TOTAL OPERATING RESERVES as at December 31, 2014 17,305,146.67
TOTAL RESERVES as at December 31, 2014 $ 57,112,517.29
TOTAL COMMITTED FUNDS $ 51,935,700.65TOTAL CURRENT INTERNAL LOAN REQUIREMENTS -
TOTAL FUNDING REQUIREMENTS $ 51,935,700.65
EXCESS OF RESERVES OVER CURRENT FUNDING REQUIREMENTS $ 5,176,816.64
26

Attachment C
GENERAL FUND
GENERAL GOVERNMENT $ 3,504,211 - election, legal, contingencies, City Council initiatives, Airport, environmental projects
COMMUNITY SERVICES 2,359,330
Canada day activities, committees
PLANNING AND DEVELOPMENT SERVICES 1,054,909
EQUIPMENT REPLACEMENT/MAINTENANCE 997,906 - corporate photocopiers, printers and plotters, computers, mail service, network equipment, phone system, disaster recovery, audio visual equipment
HUMAN RESOURCES 2,726,985
flexible benefit programs, succession planning
INFRASTRUCTURE MAINTENANCE AND PLANNING 523,741
PROTECTIVE SERVICES 544,456
equipment replacements, police projects
TECHNOLOGY 130,000
$ 11,841,538
UTILITY FUND
Water & Wastewater Capital Works/Equipment $ 294,689 Sanitation Operations 1,389,317 Electric Operations 106,012
$ 1,790,018
- Fire and EMS projects/funding, community programs, EOC training exercise,
- database software
CITY OF LETHBRIDGEBUDGET APPROPRIATION UNEXPENDED (CARRY OVERS)
AS AT DECEMBER 31, 2014
- community and social development, library projects, affordable housing,
- arbitration, employee wellness, WCB rebates, corporate training, research projects,
- parks maintenance, engineering capital, amenities
- planning studies, municipal heritage program, downtown planning, inspection services
27
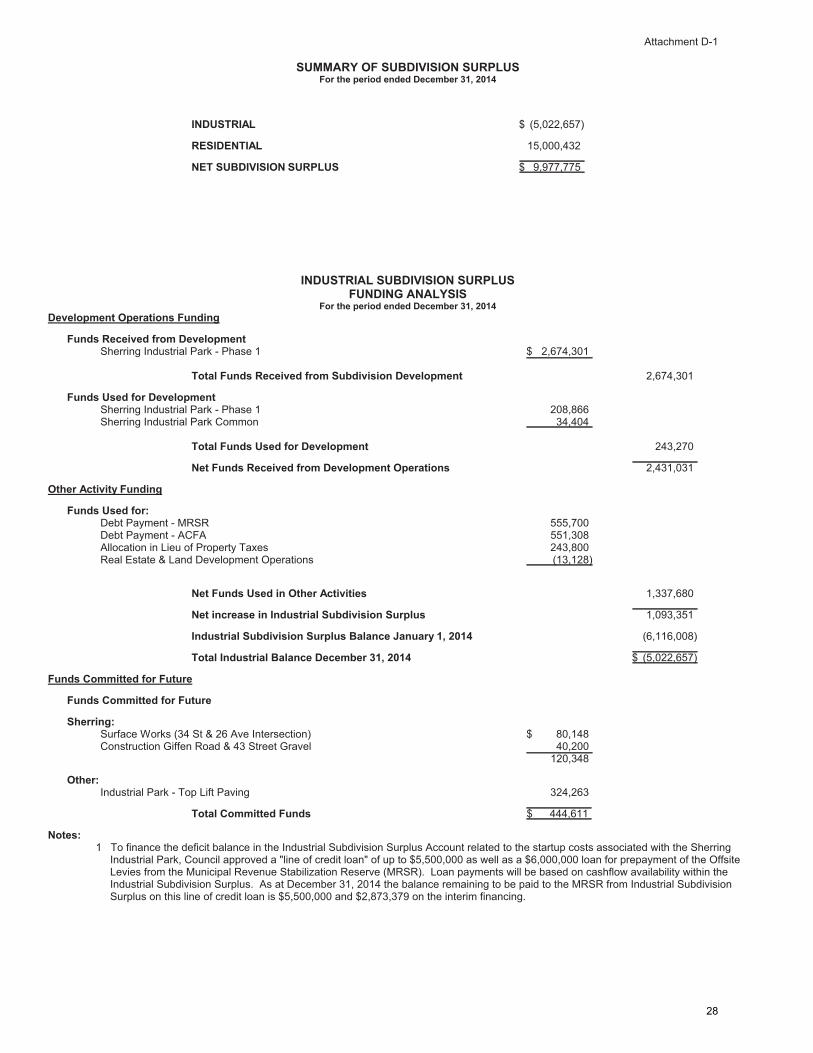
SUMMARY OF SUBDIVISION SURPLUSFor the period ended December 31, 2014
INDUSTRIAL $ (5,022,657)
RESIDENTIAL 15,000,432
NET SUBDIVISION SURPLUS $ 9,977,775
INDUSTRIAL SUBDIVISION SURPLUSFUNDING ANALYSIS
For the period ended December 31, 2014Development Operations Funding
Funds Received from DevelopmentSherring Industrial Park - Phase 1 $ 2,674,301
Total Funds Received from Subdivision Development 2,674,301
Funds Used for DevelopmentSherring Industrial Park - Phase 1 208,866Sherring Industrial Park Common 34,404
Total Funds Used for Development 243,270
Net Funds Received from Development Operations 2,431,031
Other Activity Funding
Funds Used for:Debt Payment - MRSR 555,700Debt Payment - ACFA 551,308Allocation in Lieu of Property Taxes 243,800Real Estate & Land Development Operations (13,128)
Net Funds Used in Other Activities 1,337,680
Net increase in Industrial Subdivision Surplus 1,093,351
Industrial Subdivision Surplus Balance January 1, 2014 (6,116,008)
Total Industrial Balance December 31, 2014 $ (5,022,657)
Funds Committed for Future
Funds Committed for Future
Sherring:Surface Works (34 St & 26 Ave Intersection) $ 80,148Construction Giffen Road & 43 Street Gravel 40,200
120,348
Other:Industrial Park - Top Lift Paving 324,263
Total Committed Funds $ 444,611
Notes:1 To finance the deficit balance in the Industrial Subdivision Surplus Account related to the startup costs associated with the Sherring
Industrial Park, Council approved a "line of credit loan" of up to $5,500,000 as well as a $6,000,000 loan for prepayment of the OffsiteLevies from the Municipal Revenue Stabilization Reserve (MRSR). Loan payments will be based on cashflow availability within theIndustrial Subdivision Surplus. As at December 31, 2014 the balance remaining to be paid to the MRSR from Industrial SubdivisionSurplus on this line of credit loan is $5,500,000 and $2,873,379 on the interim financing.
Attachment D-1
28

RESIDENTIAL SUBDIVISION SURPLUSFUNDING ANALYSIS
For the period ended December 31, 2014Development Operations Funding
Funds Received from Subdivision DevelopmentSunRidge:Phase 3D $ 267,948Phase 3A 2,071
270,019RiverStone:Phase 11 7,398,250Phase 20 3,532,078Phase 16 258,794Phase 15 227,450Phase 14 91,578Phase 1-8 72,317
11,580,467Copperwood:Copperwood Joint Venture 91,117
CrossingsCommercial 9,497,575Phase 1 3,043,970
12,541,545Total Funds Received from Subdivision Development 24,483,148
Funds Used for DevelopmentSunRidge:Common 87,178Phase 3A 17,350Phase 3C 14,500Phase 1 6,725Phase 3D 1,075Phase 3B 1,042
127,870RiverStone:Common 738,692Phase 20 386,023Phase 11 127,101Phase 22 51,532Phase 21 23,194Phase 17 20,465Phase 16 14,028Phase 15 11,155Phase 10,12,13,14 9,003
1,381,193Crossings:Common 1,399,638Phase 2 1,215,506Phase 1 137,493Phase 3 350
2,752,987
Waterbridge 49,778
Blackwolf II 48,533
Legacy Ridge - Commercial Site 2,600Total Funds Used for Development 4,362,961
Net Funds Recovered from Development Operations 20,120,187Other Activity Funding
Funds Received:Land - Metis Trail Right of Way 96,266
Funds Used:Internal Loan - Municipal Revenue Stabilization Reserve (Note 1) 2,633,252Real Estate & Land Development Operations 1,140,053Helen Schuler Nature Centre Expansion and Renovation (CIP 2011-22 / D-18) 1,100,000Parks Maintenance 135,000Land - 40th Ave West for RiverStone 103,050Allocation in Lieu of Property Taxes 88,900Weed Control 9,000Interest Payment - MRSR 6,766
5,216,021Less Funds Used for Other Activities 5,119,755
Net increase in Residential Subdivision Surplus 15,000,432
Residential Subdivision Surplus Balance January 1, 2014 -
Total Residential Subdivision Surplus Balance December 31, 2014 $ 15,000,432
Attachment D-2
29

RESIDENTIAL SUBDIVISION SURPLUSFUNDING ANALYSIS
For the period ended December 31, 2014
Funds Committed for Future
Projects:RiverStone:
Phase 17,21,22 Engineering Consulting Services $ 493,094Phase 11,17,18,19,21,22 Development Guidelines 193,148Phase 11 & Storm Facility 135,012Phase 20 Underground Utilities and Surface Works 122,106Phase 11 Landscape Construction 118,587Phases 9-13 Design & Development Guidelines 66,545Phases 14, 16, 20 Design & Development Guidelines 24,370Phase 13, 14, 16 & Canal Landscaping 22,683Phases 16 & 20 Engineering Services 2,903
1,178,448Crossings:
Phase 2 Underground and Surface 520,278Ph 3 & 4, Caledonia Engineering Consulting 280,935Phase 1 Underground and Surface 270,417Mauretania Road Construction 192,396Phase 1-7 Development Guidelines 175,810Phase 1 Landscape Construction 93,867Phase 1,2,8 Britannia & Landscape Engineering 64,038Mauretania Road Engineering 11,599
1,609,340SunRidge:
Phase 3C, 3D & 3B Design & Development Guidelines 37,520Phase 1-2 Design & Development Guidelines 16,406
53,926Waterbridge:
Waterbridge ASP & Outline Plan 58,094
Other Projects (2014 and prior):Whoop Up Drive - Coal Banks Blvd to Mauretania Rd (CIP 2011-22 / C-36) (Note 2) 2,200,000Affordable Housing (Note 3) 1,083,002Parks Capital 666,526Chinook Trail Land Purchase - Melcor Land Exchange (Note 4) 222,453Pest Control 39,891
4,211,872CIP Projects (2014-2017):
North Regional Park Development (D-11) 5,400,000New School Site Development (D-33) 3,530,000Vacant School Site Development (D-36) 1,600,000
10,530,000
Total Committed Funds $ 17,641,680
Notes:1 Internal loan from the Municipal Revenue Stabilization Reserve - to finance the deficit balance in the Residential Subdivision Surplus
Account related to the start up costs associated with the SunRidge and Crossings subdivisions, Council approved an original "line of creditloan" of up to $8,000,000 from the Municipal Revenue Stabilization Reserve (MRSR) at a rate based on the City's average short terminvestment rate. Additionally, Council authorized an additional $13,200,000 for costs associated with Crossings under By-Law 5410 tobring the total line of credit to $21,200,000. Loan repayments are based on cashflow availability within the Residential Subdivision Surplus. During 2014, $2,633,252 has been repaid to the MRSR, leaving no balance remaining to be paid from Residential Subdivision Surplus onthis overall line of credit as at December 31, 2014.
2 Whoop Up Drive - Subdivision Surplus will front end finance the construction of Whoop Up Drive for $2,200,000. Repayment will be basedon cashflow availability within the Offsite Levy Account.
3 Affordable Housing - as at December 31, 2014, $1,083,002 has been committed to the Affordable Housing Fund.
4 Chinook Trail Land Purchase - as at December 31, 2014 the Melcor Developments Ltd. land exchange contains a commitment fromResidential Subdivision Surplus of $222,453 to front end finance the purchase of Chinook Drive Right-of-Way lands (which will be repaidonce Chinook Trail commences).
Attachment D-2
30
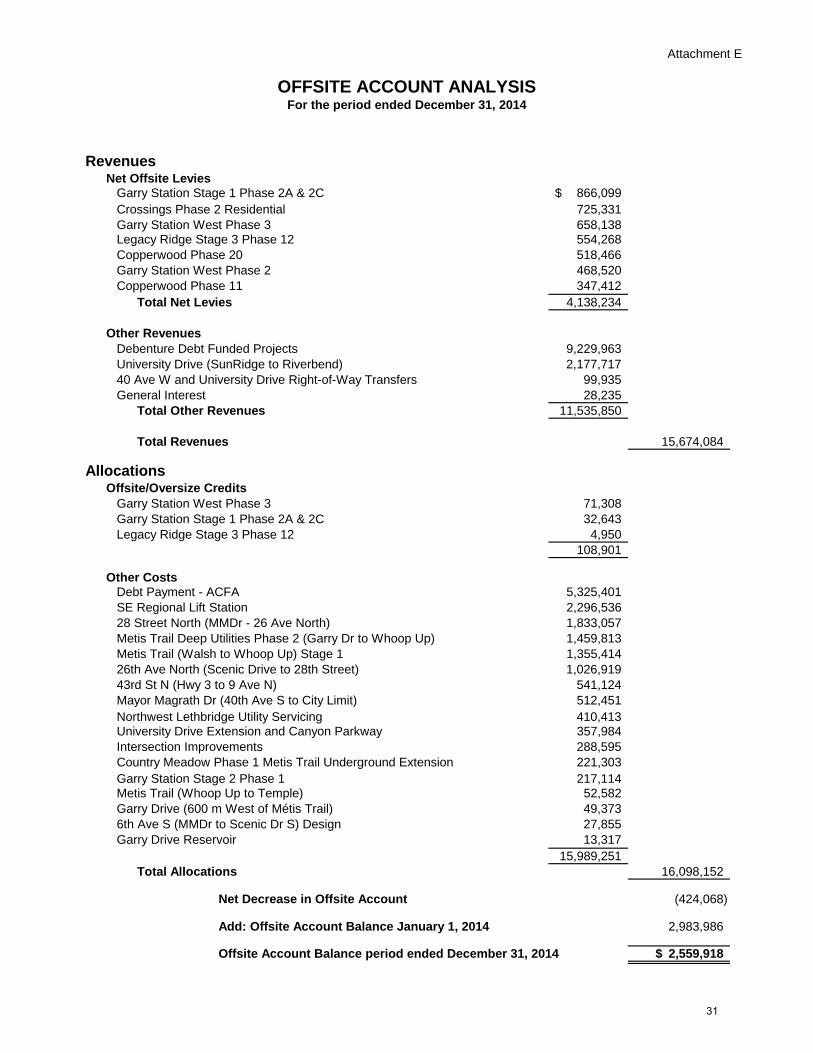
Attachment E
For the period ended December 31, 2014
RevenuesNet Offsite Levies
Garry Station Stage 1 Phase 2A & 2C 866,099$ Crossings Phase 2 Residential 725,331 Garry Station West Phase 3 658,138 Legacy Ridge Stage 3 Phase 12 554,268 Copperwood Phase 20 518,466 Garry Station West Phase 2 468,520 Copperwood Phase 11 347,412
Total Net Levies 4,138,234
Other RevenuesDebenture Debt Funded Projects 9,229,963 University Drive (SunRidge to Riverbend) 2,177,717 40 Ave W and University Drive Right-of-Way Transfers 99,935 General Interest 28,235
Total Other Revenues 11,535,850
Total Revenues 15,674,084
AllocationsOffsite/Oversize Credits
Garry Station West Phase 3 71,308 Garry Station Stage 1 Phase 2A & 2C 32,643 Legacy Ridge Stage 3 Phase 12 4,950
108,901
Other CostsDebt Payment - ACFA 5,325,401 SE Regional Lift Station 2,296,536 28 Street North (MMDr - 26 Ave North) 1,833,057 Metis Trail Deep Utilities Phase 2 (Garry Dr to Whoop Up) 1,459,813 Metis Trail (Walsh to Whoop Up) Stage 1 1,355,414 26th Ave North (Scenic Drive to 28th Street) 1,026,919 43rd St N (Hwy 3 to 9 Ave N) 541,124 Mayor Magrath Dr (40th Ave S to City Limit) 512,451 Northwest Lethbridge Utility Servicing 410,413 University Drive Extension and Canyon Parkway 357,984 Intersection Improvements 288,595 Country Meadow Phase 1 Metis Trail Underground Extension 221,303 Garry Station Stage 2 Phase 1 217,114 Metis Trail (Whoop Up to Temple) 52,582 Garry Drive (600 m West of Métis Trail) 49,373 6th Ave S (MMDr to Scenic Dr S) Design 27,855 Garry Drive Reservoir 13,317
15,989,251 Total Allocations 16,098,152
Net Decrease in Offsite Account (424,068)
Add: Offsite Account Balance January 1, 2014 2,983,986
Offsite Account Balance period ended December 31, 2014 2,559,918$
OFFSITE ACCOUNT ANALYSIS
31

Attachment E
For the period ended December 31, 2014
Funds Committed for Future
Projects (2014 and prior) Funded by Debentures (external borrowings):Metis Trail (Walsh to Whoop Up) Stage 1 (CIP 2014-23 CO-7) 4,712,586$ Metis Trail Deep Utilities (Garry Dr to Whoop Up) (CIP 2014-23 EO-1) 2,834,187 28 Street North (MMDr - 26 Ave N) (CIP 2011-20 C-30) 2,425,575 43rd St N (Hwy 3 to 9 Ave N) (CIP 2011-20 C-17) 1,108,876
West Siphon Screen Relocation (CIP 2014-23 EO-3) 811,000
SE Regional Lift Station (CIP 2014-23 EO-2) 645,799 26th Ave North (Scenic Drive to 28th Street) (CIP 2011-20 C-18) 95,573 Mayor Magrath Dr (40th Ave S to City Limit) (CIP 2014-23 CO-2) 15,546
12,649,142
Projects (2014 and prior) Funded by Offsite Levies:South Siphon Upgrade (CIP 2008-17 E-14) 375,000
Intersection Improvements - Growth (CIP 2014-23 CO-1) 348,496
University Drive Extension, SunRidge to South of Chinook 300,000 North Scenic Dr (Uplands Blvd to 42 Ave N) (CIP 2014-23 CO-10) 200,000
5th Ave N (Stafford Dr to MMDr N) Design (CIP 2014-23 CO-3) 86,000
13 St N (Crowsnest Tr to 26 Ave N) Design (CIP 2014-23 CO-4) 86,000 Northwest Lethbridge Utility Servicing 60,000
6th Ave S (MMDr to Scenic Dr S) Design (CIP 2011-20 C-21) 24,094 1,479,590
14,128,732$
OFFSITE ACCOUNT ANALYSIS
32
City of Lethbridge Attachment F
Investment Summary Year ended December 31, 2014
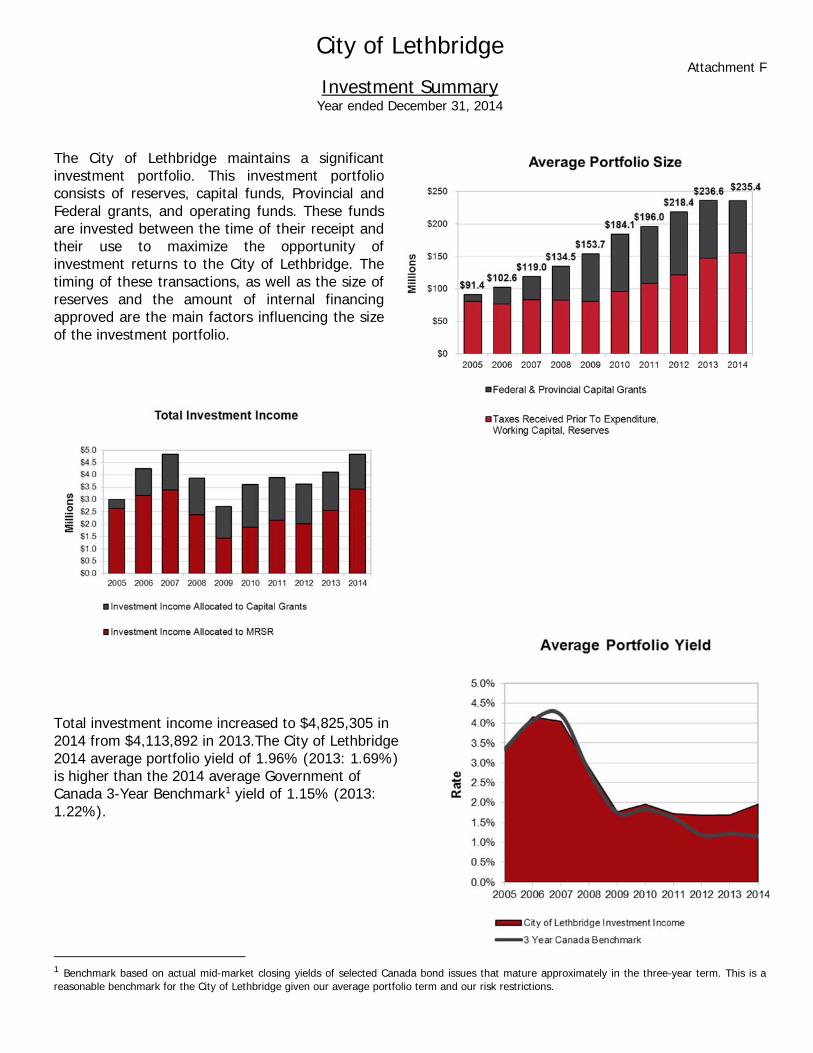
The City of Lethbridge maintains a significant investment portfolio. This investment portfolio consists of reserves, capital funds, Provincial and Federal grants, and operating funds. These funds are invested between the time of their receipt and their use to maximize the opportunity of investment returns to the City of Lethbridge. The timing of these transactions, as well as the size of reserves and the amount of internal financing approved are the main factors influencing the size of the investment portfolio.
Total investment income increased to $4,825,305 in 2014 from $4,113,892 in 2013.The City of Lethbridge 2014 average portfolio yield of 1.96% (2013: 1.69%) is higher than the 2014 average Government of Canada 3-Year Benchmark1 yield of 1.15% (2013: 1.22%).
1 Benchmark based on actual mid-market closing yields of selected Canada bond issues that mature approximately in the three-year term. This is a reasonable benchmark for the City of Lethbridge given our average portfolio term and our risk restrictions.

City of Lethbridge Investment Summary
as at December 31, 2014
The City of Lethbridge’s first investment objective is safety of principal, and accordingly the City invests only in institutions with a minimum credit rating of R1 or A. A Company having an R1 rating is considered high-grade prime credit. Its ability to repay current liabilities as they come due is very high. The R1 rating is further broken down into High (R1H), Middle (R1M) and Low (R1L). The short-term ratings of R1H, R1M, and R1L are roughly equivalent to the long term ratings of AAA, AA, and A respectively. During 2007 the City invested in Asset Backed Commercial Paper (ABCP) with a rating of R1High. A subsequent market disruption led to a restructuring of the original investment. Through that restructuring the City received longer term Master Asset Vehicle 2 (MAV2) notes in exchange for the original ABCP investment. The City currently owns MAV2 notes in the amount of $8,373,000 Class A-1 (rated AA-Low) and $13,893,000 Class A-2 (rated A-Low).
Our current portfolio is diversified among 40 different institutions from the Government and Financial Institution sectors as well as the MAV Class A-1 and A-2 described above.
During 2014, City Council amended the Investments Policy (CC44) including revisions to the criteria for selection and approval of investment firms and representatives.

Attachment G
Year EndOriginal Year of Interest Annual Balance Per Year ofPrincipal Borrowing Term Rate Payment 2014 Capita Maturity
(yrs) 93,004
Self SupportedLocal Improvement
Lane Paving 219,357 2009 10 3.344% 25,989 118,751 2019Canyon Parkway 500,000 2013 10 3.079% 58,473 456,591 2023
Land DevelopmentSherring Industrial Park 4,200,000 2005 15 4.422% 386,028 2,014,987 2020Sherring Industrial Park 1,800,000 2006 15 4.600% 167,446 931,599 2021
Offsite LevyGarry Drive Reservoir 523,000 2012 3 1.369% 178,534 176,717 2015Garry Drive West 1,100,000 2011 5 1.650% 230,106 450,874 201628th Street North 1,400,000 2011 5 1.650% 292,862 573,839 2016Northwest Lethbridge Utility Servicing 1,000,000 2012 5 1.603% 208,922 609,553 2017Garry Drive West 1,287,000 2012 5 1.603% 268,883 784,495 2017Mayor Magrath Drive 1,000,000 2012 5 1.603% 208,922 609,553 2017University Drive 1,000,000 2013 5 1.684% 209,378 708,754 2018Metis Trail 1,000,000 2013 5 1.684% 209,378 708,754 2018Metis Trail 1,200,000 2013 5 2.199% 254,751 970,381 2018Northwest Lethbridge Utility Servicing 800,000 2013 5 1.797% 168,013 645,673 2018Metis Trail Drive Deep Utilities 1,040,000 2013 5 1.797% 218,417 839,375 2018University Drive 800,000 2013 5 1.797% 168,013 645,673 2018University Drive 700,000 2014 5 1.719% 146,703 700,000 2019South East Water Reservoir 3,000,000 2006 15 4.584% 278,775 1,653,293 2021South Siphon Upgrade - Stage 2 1,500,000 2011 10 2.485% 170,334 1,088,217 2021South East Water Reservoir 1,000,000 2007 15 4.614% 93,113 617,027 2022South Siphon Upgrade 500,000 2012 10 2.226% 56,048 408,653 2022South Siphon Upgrade 1,000,000 2010 15 3.885% 88,595 786,952 2025West Lethbridge Water Reservoir 2,300,000 2010 15 3.885% 203,769 1,809,989 2025Garry Drive Reservoir 5,700,000 2011 15 3.013% 475,124 4,754,875 2026SE Regional Lift Station 3,600,000 2014 15 2.814% 295,865 3,600,000 2029Northwest Lethbridge Utility Servicing 1,000,000 2010 20 4.124% 73,909 859,495 2030Northwest Lethbridge Utility Servicing 600,000 2011 20 3.292% 41,190 532,982 2031Northwest Lethbridge Utility Servicing 15,000,000 2011 20 3.145% 1,016,133 13,301,283 2031Northwest Lethbridge Utility Servicing 2,900,000 2012 20 2.922% 192,500 2,622,608 2032
Total Self-Supported 6,386,173 43,980,940 472.89
Utility SupportedWater
Water Treatment Plant Upgrading 750,000 2000 15 6.250% 78,488 73,872 2015Water Treatment Plant Upgrading 1,750,000 2001 15 5.500% 174,345 321,896 2016Water Treatment Plant Upgrading 1,150,000 2002 15 6.125% 119,376 318,357 2017South East Water Reservoir 1,000,000 2005 15 4.422% 91,911 479,759 2020South East Water Reservoir 3,250,000 2006 15 4.267% 295,579 1,772,480 2021Public Operations Site 1,500,000 2012 15 2.627% 121,640 1,332,261 2027Public Operations Site 1,250,000 2013 15 2.959% 103,796 1,148,298 2028Public Operations Site 500,000 2013 15 3.586% 43,389 474,313 2028Public Operations Site 1,000,000 2013 15 3.295% 85,030 947,491 2028
1,113,554 6,868,727 73.85 Wastewater
Headworks Facility 500,000 2007 10 4.493% 62,620 173,932 2017Lagoon Upgrade 500,000 2009 10 3.344% 59,238 270,680 2019Sewer Relief 1,350,000 2006 15 4.584% 125,449 743,982 2021Public Operations Site 1,500,000 2012 10 2.177% 167,731 1,225,405 2022Plant Outfall Twinning 782,000 2008 15 4.565% 70,965 518,976 2023Public Operations Site 1,250,000 2013 10 2.499% 142,042 1,081,703 2023Public Operations Site 500,000 2013 10 3.079% 58,473 456,591 2023WWTP Headworks & Clarifier 500,000 2011 15 3.013% 41,678 417,094 2026
728,196 4,888,362 52.56 Solid Waste
Automated Collection 1,510,000 2006 10 4.115% 185,720 353,092 2016Landfill Cell Development 3,500,000 2012 5 1.603% 731,227 2,133,435 2017Automated Collection - Carts 600,000 2009 10 3.344% 71,086 324,816 2019Landfill Surface Water Management 430,000 2010 10 3.377% 51,027 275,049 2020Landfill Royalty Buyout 6,250,000 2003 20 5.813% 664,621 4,557,668 2023Landfill Construction & 28 St N 2,300,000 2003 20 5.625% 194,463 1,344,539 2023Landfill Approval Compliance 2,100,000 2008 15 4.565% 194,892 1,425,270 2023Landfill Approval Compliance 900,000 2009 15 3.973% 80,221 656,717 2024
2,173,257 11,070,586 119.03 Electric
Electric Infrastructure Replacement 2,000,000 2011 15 3.013% 166,710 1,668,377 2026Electric Infrastructure Replacement 3,000,000 2012 15 2.627% 243,280 2,664,522 2027
409,990 4,332,899 46.59
Total Utility Supported 4,424,997 27,160,574 292.04
Total External Borrowings December 31, 2014 10,811,170$ 71,141,514$ 764.93
City of LethbridgeExternal Borrowings (ACFA)
As At December 31, 2014
35
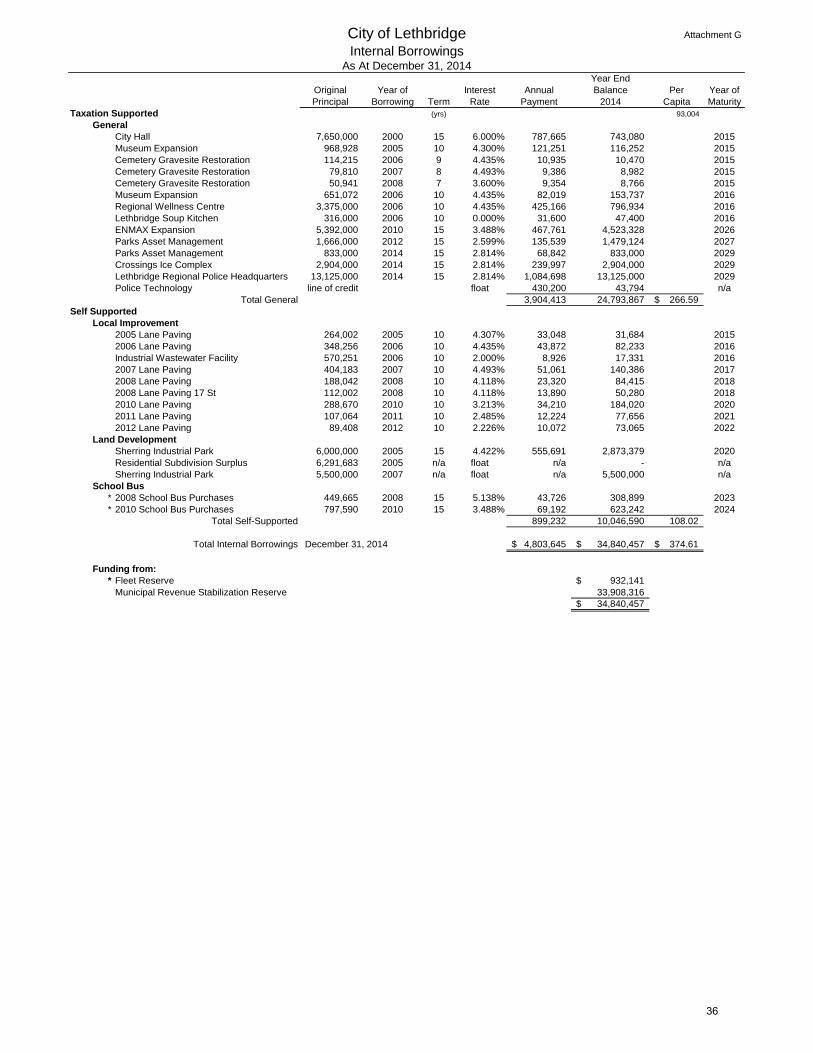
Attachment G
Year EndOriginal Year of Interest Annual Balance Per Year ofPrincipal Borrowing Term Rate Payment 2014 Capita Maturity
Taxation Supported (yrs) 93,004
GeneralCity Hall 7,650,000 2000 15 6.000% 787,665 743,080 2015Museum Expansion 968,928 2005 10 4.300% 121,251 116,252 2015Cemetery Gravesite Restoration 114,215 2006 9 4.435% 10,935 10,470 2015Cemetery Gravesite Restoration 79,810 2007 8 4.493% 9,386 8,982 2015Cemetery Gravesite Restoration 50,941 2008 7 3.600% 9,354 8,766 2015Museum Expansion 651,072 2006 10 4.435% 82,019 153,737 2016Regional Wellness Centre 3,375,000 2006 10 4.435% 425,166 796,934 2016Lethbridge Soup Kitchen 316,000 2006 10 0.000% 31,600 47,400 2016ENMAX Expansion 5,392,000 2010 15 3.488% 467,761 4,523,328 2026Parks Asset Management 1,666,000 2012 15 2.599% 135,539 1,479,124 2027Parks Asset Management 833,000 2014 15 2.814% 68,842 833,000 2029Crossings Ice Complex 2,904,000 2014 15 2.814% 239,997 2,904,000 2029Lethbridge Regional Police Headquarters 13,125,000 2014 15 2.814% 1,084,698 13,125,000 2029Police Technology line of credit float 430,200 43,794 n/a
Total General 3,904,413 24,793,867 266.59$ Self Supported
Local Improvement2005 Lane Paving 264,002 2005 10 4.307% 33,048 31,684 20152006 Lane Paving 348,256 2006 10 4.435% 43,872 82,233 2016Industrial Wastewater Facility 570,251 2006 10 2.000% 8,926 17,331 20162007 Lane Paving 404,183 2007 10 4.493% 51,061 140,386 20172008 Lane Paving 188,042 2008 10 4.118% 23,320 84,415 20182008 Lane Paving 17 St 112,002 2008 10 4.118% 13,890 50,280 20182010 Lane Paving 288,670 2010 10 3.213% 34,210 184,020 20202011 Lane Paving 107,064 2011 10 2.485% 12,224 77,656 20212012 Lane Paving 89,408 2012 10 2.226% 10,072 73,065 2022
Land DevelopmentSherring Industrial Park 6,000,000 2005 15 4.422% 555,691 2,873,379 2020Residential Subdivision Surplus 6,291,683 2005 n/a float n/a - n/aSherring Industrial Park 5,500,000 2007 n/a float n/a 5,500,000 n/a
School Bus * 2008 School Bus Purchases 449,665 2008 15 5.138% 43,726 308,899 2023* 2010 School Bus Purchases 797,590 2010 15 3.488% 69,192 623,242 2024
Total Self-Supported 899,232 10,046,590 108.02
Total Internal Borrowings December 31, 2014 4,803,645$ 34,840,457$ 374.61$
Funding from:* Fleet Reserve 932,141$
Municipal Revenue Stabilization Reserve 33,908,316 34,840,457$
Internal BorrowingsCity of Lethbridge
As At December 31, 2014
36
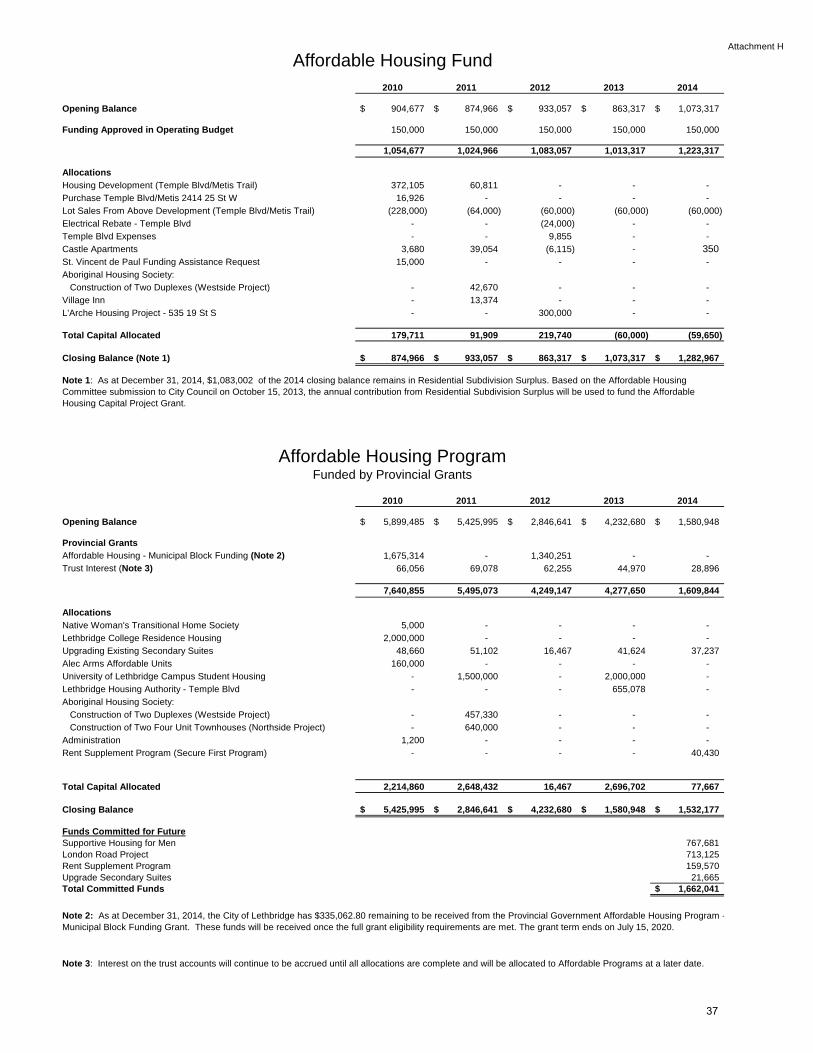
Attachment H
2010 2011 2012 2013 2014
Opening Balance 904,677$ 874,966$ 933,057$ 863,317$ 1,073,317$
Funding Approved in Operating Budget 150,000 150,000 150,000 150,000 150,000
1,054,677 1,024,966 1,083,057 1,013,317 1,223,317
Allocations
Housing Development (Temple Blvd/Metis Trail) 372,105 60,811 - - -
Purchase Temple Blvd/Metis 2414 25 St W 16,926 - - - -
Lot Sales From Above Development (Temple Blvd/Metis Trail) (228,000) (64,000) (60,000) (60,000) (60,000)
Electrical Rebate - Temple Blvd - - (24,000) - -
Temple Blvd Expenses - - 9,855 - -
Castle Apartments 3,680 39,054 (6,115) - 350 St. Vincent de Paul Funding Assistance Request 15,000 - - - -
Aboriginal Housing Society:
Construction of Two Duplexes (Westside Project) - 42,670 - - -
Village Inn - 13,374 - - -
L'Arche Housing Project - 535 19 St S - - 300,000 - -
Total Capital Allocated 179,711 91,909 219,740 (60,000) (59,650)
Closing Balance (Note 1) 874,966$ 933,057$ 863,317$ 1,073,317$ 1,282,967$
2010 2011 2012 2013 2014
Opening Balance 5,899,485$ 5,425,995$ 2,846,641$ 4,232,680$ 1,580,948$
Provincial GrantsAffordable Housing - Municipal Block Funding (Note 2) 1,675,314 - 1,340,251 - - Trust Interest (Note 3) 66,056 69,078 62,255 44,970 28,896
7,640,855 5,495,073 4,249,147 4,277,650 1,609,844
Allocations
Native Woman's Transitional Home Society 5,000 - - - -
Lethbridge College Residence Housing 2,000,000 - - - -
Upgrading Existing Secondary Suites 48,660 51,102 16,467 41,624 37,237
Alec Arms Affordable Units 160,000 - - - -
University of Lethbridge Campus Student Housing - 1,500,000 - 2,000,000 -
Lethbridge Housing Authority - Temple Blvd - - - 655,078 -
Aboriginal Housing Society:
Construction of Two Duplexes (Westside Project) - 457,330 - - -
Construction of Two Four Unit Townhouses (Northside Project) - 640,000 - - -
Administration 1,200 - - - -
Rent Supplement Program (Secure First Program) - - - - 40,430
Total Capital Allocated 2,214,860 2,648,432 16,467 2,696,702 77,667
Closing Balance 5,425,995$ 2,846,641$ 4,232,680$ 1,580,948$ 1,532,177$
Funds Committed for FutureSupportive Housing for Men 767,681 London Road Project 713,125 Rent Supplement Program 159,570 Upgrade Secondary Suites 21,665 Total Committed Funds 1,662,041$
Note 3: Interest on the trust accounts will continue to be accrued until all allocations are complete and will be allocated to Affordable Programs at a later date.
Affordable Housing Fund
Note 1: As at December 31, 2014, $1,083,002 of the 2014 closing balance remains in Residential Subdivision Surplus. Based on the Affordable Housing Committee submission to City Council on October 15, 2013, the annual contribution from Residential Subdivision Surplus will be used to fund the Affordable Housing Capital Project Grant.
Affordable Housing ProgramFunded by Provincial Grants
Note 2: As at December 31, 2014, the City of Lethbridge has $335,062.80 remaining to be received from the Provincial Government Affordable Housing Program -Municipal Block Funding Grant. These funds will be received once the full grant eligibility requirements are met. The grant term ends on July 15, 2020.
37

Attachment H
2010 2011 2012 2013 2014
Opening Balance 900,872$ 922,175$ 584,488$ 418,920$ 349,485$
Funding Approved in Operating Budget 500,000 500,000 465,000 465,000 465,000
1,400,872 1,422,175 1,049,488 883,920 814,485
Allocations
Governance and Administration 172,579 163,311 125,744 122,834 131,363 Design, Planning and Regulatory Processes 61,385 109,131 12,374 - - Championing, Marketing and Promotion 25,364 57,206 44,969 45,224 37,449 Downtown Life (Events) 25,000 35,739 70,199 60,077 70,007 Enhancement Works 57,580 105,399 53,817 13,571 8,591 Functional Works Maintenance and Upkeep 136,789 366,901 323,465 292,729 327,969
Total Allocated 478,697 837,687 630,568 534,435 575,379
Closing Balance (Note 1) 922,175$ 584,488$ 418,920$ 349,485$ 239,106$
Heart of Our City Committee(Downtown Redevelopment Fund)
Note 1: Funds remaining at the close of 2014 are committed to ongoing projects and programs to be delivered in 2015 based on the 2015 - 2018 approved operating budget.
38

Attachment I
2010 2011 2012 2013 2014
Opening Balance 1,177,523$ 817,699$ 1,096,619$ 1,437,052$ 1,455,090$
GST Rebates 980,458 1,096,438 1,168,789 1,154,487 1,090,767
2,157,981 1,914,137 2,265,408 2,591,539 2,545,857
AllocationsCommunity Capital Grant Program 450,000 450,000 450,000 450,000 450,000 Community Capital Grant Program - one time allocation 495,941 - - - - Capital Asset Plan & Register 128,378 101,497 128,356 141,842 152,175 Strategic Building Asset Management 250,000 250,000 250,000 250,000 250,000 Capital Asset Management Maintenance Fees 15,963 16,021 - 18,733 19,593 SLP Skate Park (CIP 2014-2023 D-41) - - - 275,874 110,478
Total Capital Allocated 1,340,282 817,518 828,356 1,136,449 982,246
Closing Balance 817,699$ 1,096,619$ 1,437,052$ 1,455,090$ 1,563,611$
GST Rebates
39
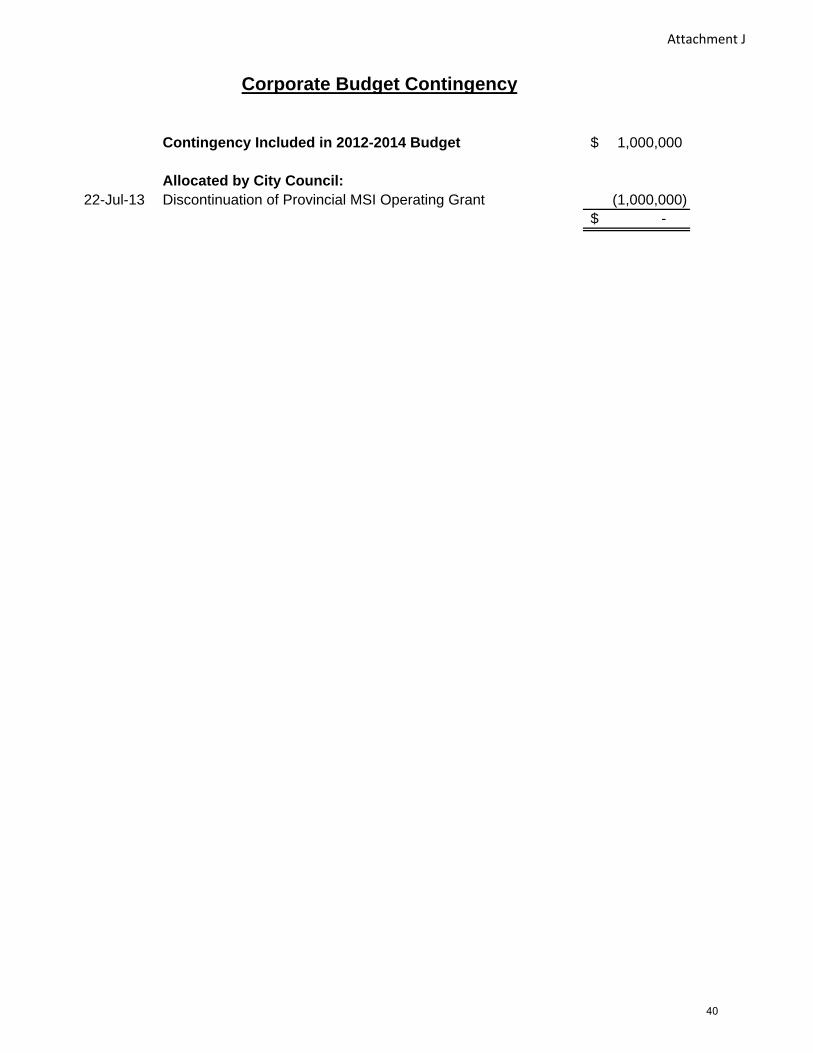
Attachment J
Contingency Included in 2012-2014 Budget 1,000,000$
Allocated by City Council:22-Jul-13 Discontinuation of Provincial MSI Operating Grant (1,000,000)
-$
Corporate Budget Contingency
40
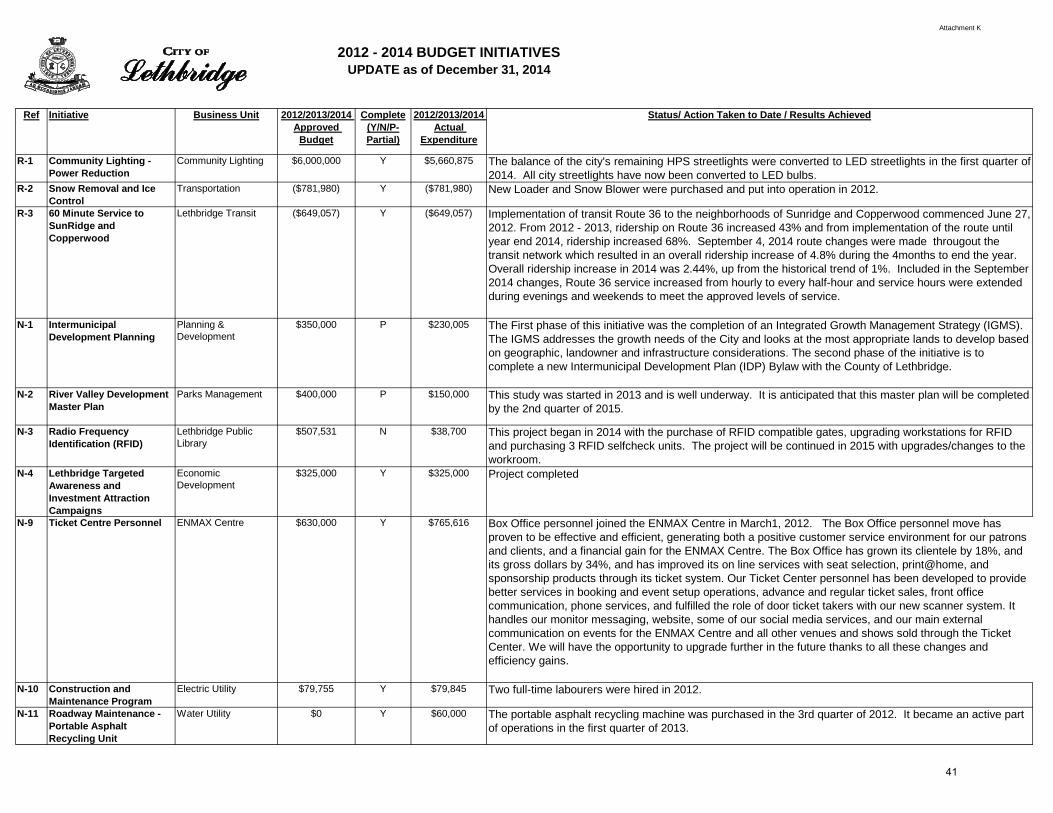
Attachment K
2012 - 2014 BUDGET INITIATIVES3 UPDATE as of December 31, 2014
Ref Initiative Business Unit 2012/2013/2014 Approved
Budget
Complete(Y/N/P-Partial)
2012/2013/2014 Actual
Expenditure
Status/ Action Taken to Date / Results Achieved
R-1 Community Lighting - Power Reduction
Community Lighting $6,000,000 Y $5,660,875 The balance of the city's remaining HPS streetlights were converted to LED streetlights in the first quarter of2014. All city streetlights have now been converted to LED bulbs.
R-2 Snow Removal and Ice Control
Transportation ($781,980) Y ($781,980) New Loader and Snow Blower were purchased and put into operation in 2012.
R-3 60 Minute Service to SunRidge and Copperwood
Lethbridge Transit ($649,057) Y ($649,057) Implementation of transit Route 36 to the neighborhoods of Sunridge and Copperwood commenced June 27, 2012. From 2012 - 2013, ridership on Route 36 increased 43% and from implementation of the route until year end 2014, ridership increased 68%. September 4, 2014 route changes were made througout the transit network which resulted in an overall ridership increase of 4.8% during the 4months to end the year. Overall ridership increase in 2014 was 2.44%, up from the historical trend of 1%. Included in the September 2014 changes, Route 36 service increased from hourly to every half-hour and service hours were extended during evenings and weekends to meet the approved levels of service.
N-1 Intermunicipal Development Planning
Planning & Development
$350,000 P $230,005 The First phase of this initiative was the completion of an Integrated Growth Management Strategy (IGMS). The IGMS addresses the growth needs of the City and looks at the most appropriate lands to develop based on geographic, landowner and infrastructure considerations. The second phase of the initiative is to complete a new Intermunicipal Development Plan (IDP) Bylaw with the County of Lethbridge.
N-2 River Valley Development Master Plan
Parks Management $400,000 P $150,000 This study was started in 2013 and is well underway. It is anticipated that this master plan will be completed by the 2nd quarter of 2015.
N-3 Radio Frequency Identification (RFID)
Lethbridge Public Library
$507,531 N $38,700 This project began in 2014 with the purchase of RFID compatible gates, upgrading workstations for RFID and purchasing 3 RFID selfcheck units. The project will be continued in 2015 with upgrades/changes to the workroom.
N-4 Lethbridge Targeted Awareness and Investment Attraction Campaigns
Economic Development
$325,000 Y $325,000 Project completed
N-9 Ticket Centre Personnel ENMAX Centre $630,000 Y $765,616 Box Office personnel joined the ENMAX Centre in March1, 2012. The Box Office personnel move has proven to be effective and efficient, generating both a positive customer service environment for our patrons and clients, and a financial gain for the ENMAX Centre. The Box Office has grown its clientele by 18%, and its gross dollars by 34%, and has improved its on line services with seat selection, print@home, and sponsorship products through its ticket system. Our Ticket Center personnel has been developed to provide better services in booking and event setup operations, advance and regular ticket sales, front office communication, phone services, and fulfilled the role of door ticket takers with our new scanner system. It handles our monitor messaging, website, some of our social media services, and our main external communication on events for the ENMAX Centre and all other venues and shows sold through the Ticket Center. We will have the opportunity to upgrade further in the future thanks to all these changes and efficiency gains.
N-10 Construction and Maintenance Program
Electric Utility $79,755 Y $79,845 Two full-time labourers were hired in 2012.
N-11 Roadway Maintenance - Portable Asphalt Recycling Unit
Water Utility $0 Y $60,000 The portable asphalt recycling machine was purchased in the 3rd quarter of 2012. It became an active part of operations in the first quarter of 2013.
41

Attachment K
Ref Initiative Business Unit 2012/2013/2014 Approved
Budget
Complete(Y/N/P-Partial)
2012/2013/2014 Actual
Expenditure
Status/ Action Taken to Date / Results Achieved
N-12 Work Management System for Operations
Water Utility $587,500 Y $587,500 Led by the Community Asset Management Program (CAMP) business unit, the Water Utility selected the CityWorks Work Order Management Software system to serve as the software system to deploy to the water and wastewater Utilities operations and engineering departments. By the end of 2014, the system was substantially implemented and in use.
N-13 Accessible transportation Service Increase
Accessible Transportation
$330,305 Y $330,305 The approved 5 additional hours of service in Access-A-Ride were implemented September 4, 2013. The additional hours of service were added during peak times, which are morning and afternoon (approx. 7:30 - 9:30 and 2:30 - 4:30). The 5 additional hours of service were scheduled specifically to assist in providing on-demand trips. Reviewing the ridership statistics provided from our scheduling software, we have concluded that on-demand trips have increased a total of 3% from 2012 to 2014, an equivalent of 1,773 rides.
N-14 Slope Monitoring Transportation $115,000 Y $73,886 In 2012, EBA Engineering was been retained to perform both slope monitoring in the neighborhoods of Southridge/Sandstone and Tudor estates. In 2013, slopes in the Scenic Heights area was added to the study. EBA also performed a Geotechnical evaluation for groundwater studies in the Southridge/Sandstone neighborhoods. By the end of 2014, all work pertaining to this initiative has been completed.
N-15 Minimum Property Standards
Regulatory Services $266,000 Y $247,291 Additional bylaw officer hired in April of 2012, vehicle purchased in 2013. The plan to address substandard properties developed with 90% of properties listed on the original deficient list completed or at advanced stage of completion. From the outset of this position, Regulatory Services restructured the department to enable responsibilities to be shared rather than one individual staff member being solely responsible for certain bylaws. This worked quite well, as the majority of the list of substandart properties were addressed quickly, and a supplementary list was created.
N-16 Custodial Support The Crossings Branch Library
Lethbridge Public Library
$217,384 Y $179,854 This position was filled in early 2012 providing the Library with the certification needed to inspect the boilers at the Crossings Branch Library. This position has also provided an increased level of custodial care allowing for enhanced service levels to Library customers and staff. The $10,000 for supplies was expended in 2013. The position was vacant for approximately 1.5 months in 2014 due to staff changes.
N-29 Lethbridge International Air Show
Community - Council Referral
$67,500 Y $67,500 These funds were used to support the annual Alberta International Air Show. This event provides a variety of educational, recreational, family and group activities to the City.
N-33 Pay-As-You-Go Capacity Increase
Pay-As-You-Go Program
$1,000,000 Y $1,000,000 2014 amount has been allocated.
N-35 Nord-Bridge Senior Citizen Association & LSCO
Community - Council Referral
$330,000 Y $330,000 $75,000 was allocated to Nord-Bridge Seniors Centre and $35,000 was allocated to Lethbridge Senior Citizen Organization for assistance in their operational deficits.
N-36 Nikka Yuko Japanese Garden
Community - Council Referral
$101,500 Y $99,992 The ongoing fee for service increase of $27,000; $27,800; $28,700 was used to provide culture programming at the Gardens. The $18,000 one-time allocation was use to purchase computer equipment, advertising, public relations and other programming costs.
N-37 Lethbridge Habitat for Humanity
Community - Council Referral
$30,000 Y $30,000 The increase of this grant allocation has been used to assist in the purchase of a single family lot from the City. A home will then be constructed on the lot for a low-income family.
N-38 Lethbridge Food Bank & Interfaith Food Bank
Community - Council Referral
$7,200 Y $7,200 This funding has assisted the food banks to help meet the increased demand of services within the community.
42