deomi organizational climate survey (deocs) report sample 2016.pdf · deomi organizational climate...
TRANSCRIPT

168xxxx
SampleSample
DEOMI Organizational Climate Survey
(DEOCS) Report
Tuesday, March 1, 2016
Admin Number:
Commander/Director:
Organization:
Defense Equal Opportunity Management Institute
Directorate of Research
Patrick AFB, FL
FOR OFFICIAL USE ONLY
FOR OFFICIAL USE ONLY
Commander/Director Eyes Only
DEPARTMENT OF DEFENSE
RCS: DD-P&R (AR) 2338

TABLE OF CONTENTSPage
3
6
I. How to Interpret your DEOCS Results
II. Demographic Breakout
III. Perceptions of Discrimination
IV. Sexual Assault Prevention and Response
VI. Overall Unit Summary
VII. DEOCS Summary of Survey Item Responses
8
20
52
Defense Equal Opportunity Management Institute
FOR OFFICIAL USE ONLY
2ADMIN#: 168xxxx
82
V. Climate Factor Subgroup Comparison
55
VIII. Recommendations
58
80
Appendix A: Your Locally Developed Questions
It is important to review all sections contained in this report. Compare the information presented in Section III,
Perceptions of Discrimination, Section V, Climate Factor Subgroup Comparison, along with Appendix, Written
Comments from Your Organization. Doing so can sometimes help to validate potential areas of concern.
The DEOCS report provides valuable information about members’ perceptions of the organization’s climate.
Individual Service instructions typically require organizations to use multiple approaches, such as individual
interviews and/or focus groups, when assessing command climate.
Discretion should be taken prior to making any management or disciplinary decisions based solely on the
results.
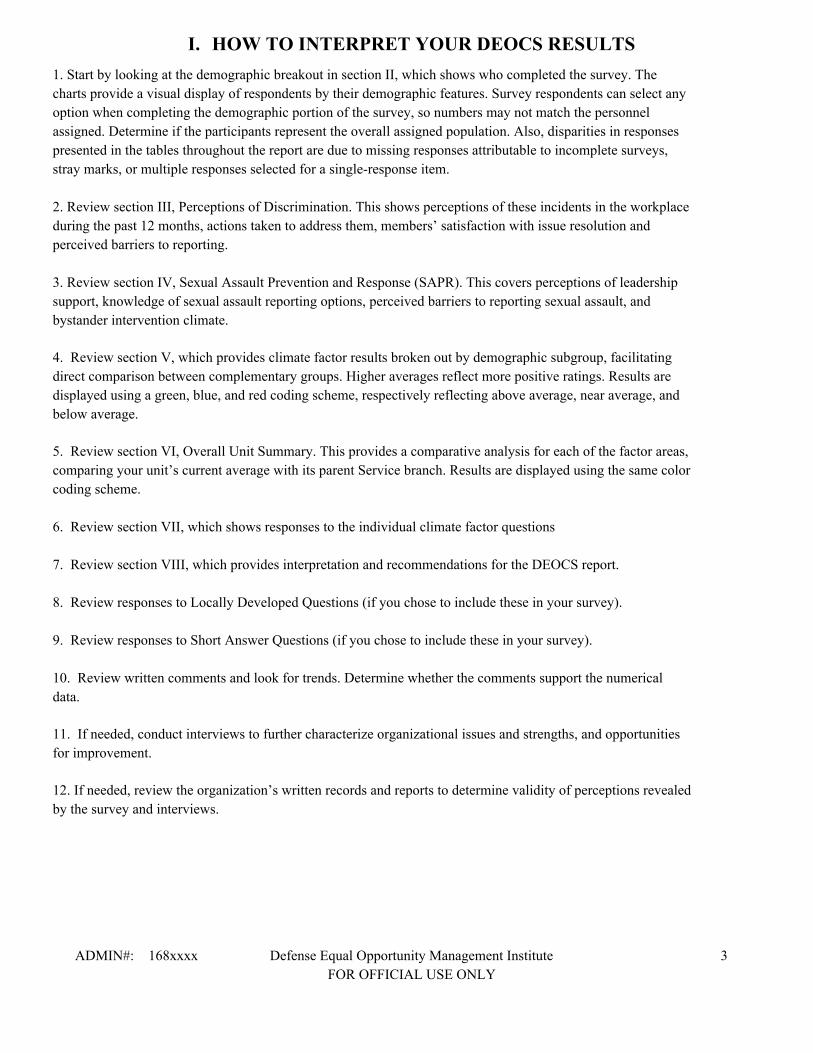
I. HOW TO INTERPRET YOUR DEOCS RESULTS
Defense Equal Opportunity Management Institute
FOR OFFICIAL USE ONLY
ADMIN#: 168xxxx 3
1. Start by looking at the demographic breakout in section II, which shows who completed the survey. The
charts provide a visual display of respondents by their demographic features. Survey respondents can select any
option when completing the demographic portion of the survey, so numbers may not match the personnel
assigned. Determine if the participants represent the overall assigned population. Also, disparities in responses
presented in the tables throughout the report are due to missing responses attributable to incomplete surveys,
stray marks, or multiple responses selected for a single-response item.
2. Review section III, Perceptions of Discrimination. This shows perceptions of these incidents in the workplace
during the past 12 months, actions taken to address them, members’ satisfaction with issue resolution and
perceived barriers to reporting.
3. Review section IV, Sexual Assault Prevention and Response (SAPR). This covers perceptions of leadership
support, knowledge of sexual assault reporting options, perceived barriers to reporting sexual assault, and
bystander intervention climate.
4. Review section V, which provides climate factor results broken out by demographic subgroup, facilitating
direct comparison between complementary groups. Higher averages reflect more positive ratings. Results are
displayed using a green, blue, and red coding scheme, respectively reflecting above average, near average, and
below average.
5. Review section VI, Overall Unit Summary. This provides a comparative analysis for each of the factor areas,
comparing your unit’s current average with its parent Service branch. Results are displayed using the same color
coding scheme.
6. Review section VII, which shows responses to the individual climate factor questions
7. Review section VIII, which provides interpretation and recommendations for the DEOCS report.
8. Review responses to Locally Developed Questions (if you chose to include these in your survey).
9. Review responses to Short Answer Questions (if you chose to include these in your survey).
10. Review written comments and look for trends. Determine whether the comments support the numerical
data.
11. If needed, conduct interviews to further characterize organizational issues and strengths, and opportunities
for improvement.
12. If needed, review the organization’s written records and reports to determine validity of perceptions revealed
by the survey and interviews.

ADMIN#: 168xxxx Defense Equal Opportunity Management Institute
FOR OFFICIAL USE ONLY
4
Steps to interpreting DEOMI DEOCS color coding:
1. Identify areas of concern and strength (both for your overall unit and subgroups) using the color-coded
comparisons:
a. Unit: Examine Section IV Sexual Assault Prevention and Response (page 20, 21) and Section VI
Overall Unit Summary (pages 55 - 57) to compare your unit’s score on each DEOCS factor to
your Service’s average. Additionally, compare your unit’s score to the “Range of Near Service
Average” to gauge relational standing of your unit’s score to your Service.
b. Subgroups: Examine Section V Climate Factor Subgroup Comparisons (pages 52 - 54) to
compare perceptions among subgroups and to your Service’s average. In addition to using the
color coding schema, compare the subgroup’s numeric average (displayed in each box) to the
“Range of near Service Average” (presented on mages 20, 21, 55 - 57) to gauge the relative
standing of each subgroup to your Service.
2. Examine the item-level results by using the favorable/unfavorable responses to guide interpretation on
the factor contained within Section IV (SAPR Item Results, pages 22 - 51) and Section VII (DEOCS
Summary of Survey Item Results, pages 58 - 79).
3. Examine the written comments associated with the area of concern and determine if any of the
comments are associated with negative perceptions. Overall, comments can be easier to manage if they
are broken into themes.
4. Based on the degree of favorability of the item-level results and written comments, determine if the
classification of your unit or subgroup(s) as ‘Below Service Average’ or ‘Near Service Average’ is at an
acceptable level based on your unit’s standards.
5. If results do not meet the expectations of the unit’s standards, use the findings to guide follow-on climate
assessment actions (e.g., develop plan of action to improve climate; determining the demographic
composition of focus groups and the topics to discuss with them; identify records and reports to analyze
to validate perceptions, etc.). For more strategies to improve or maintain a healthy command climate,
refer to “Recommendations” throughout Section IV SAPR (pages 20-51) and Section VIII
Recommendations (pages 80-81).
STEPS TO INTERPRET DEOCS COLOR CODING
General InterpretationColor Coding Category Criteria
Green
Blue
Red
Above Service
Average
Near Service
Average
Below Service
Average
Perceptions fall in the upper
80th percentile of the
responses within your
Service.
Perceptions fall in the 21st to
79th percentile of responses
within your Service.
Perceptions fall in the lower
20th percentile of responses
within your Service.
Indicates that the perceptions of your members
are markedly more favorable than the
perceptions commonly held across your
Service.
Indicates that the perceptions of your members
are similar to that of the perceptions
commonly held across your Service.
Indicates that the perceptions of your members
are markedly less favorable than those
commonly held across your Service.

5ADMIN#: 168xxxx Defense Equal Opportunity Management Institute
FOR OFFICIAL USE ONLY
NOTE: The DEOCS report provides unit-level comparisons that help identify subgroups that may harbor
negative - or positive perceptions regarding a particular climate factor. However, be mindful that a red color
coding does not automatically reflect a negative find. It simply means that your average is below your
Service’s average from a unit-level standpoint. Your actual favorability scores (in section VII) for that
factor may reflect a positive percentage. Using that percentage, you should be able to determine if there is in
fact an issue within your organization.
MAKING CLIMATE ASSESSMENT RESULTS WORK FOR YOUR ORGANIZATION
1. Share the results with members of your organization.
2. Involve key leaders; let members know you are acting on their feedback.
3. If needed, establish an action team to develop and implement a plan for organizational improvement.
4. Conduct another climate assessment in accordance with your Service component directives to determine
the effectiveness of the corrective actions that were taken to remedy validated perceptions.
If you or your staff requires assistance, do not hesitate to contact
the DEOCS Support Team at DSN 854-2675/3260/4217 or commercial (321) 494-2675/3260/4217.

II. DEMOGRAPHIC BREAKOUT
Majority
American Indian
Asian
Black
Native Hawaiian
White
Two or More
RACE
Defense Equal Opportunity Management Institute
FOR OFFICIAL USE ONLY
6ADMIN#: 168xxxx
Total
MINORITY vs MAJORITY
For the majority/minority subgroup categories, the majority category includes all respondents who listed their
race as “White,” and their ethnicity as “not Hispanic.” All other respondents are included in the minority
subgroup.
Minority
100.00
100.00
Frequency Percent
Frequency Percent
377
394
212
983
38.35
40.08
21.57Declined
10
18
180
4
501
37
233
1.02
1.83
18.31
0.41
50.97
3.76
23.70
983
Declined
Total

Defense Equal Opportunity Management Institute
FOR OFFICIAL USE ONLY
ADMIN#: 168xxxx 7
Total
Hispanic
Not Hispanic
ETHNICITY
GENDER
CATEGORY
Total
Women
Men
Total
100.00
100.00
100.00
Frequency Percent
Frequency Percent
Frequency Percent
642
143
198
983
65.31
14.55
20.14
463
520
983
47.10
52.90
100
91
46
87
128
511
20
10.17
9.26
4.68
8.85
13.02
2.03
51.98
Declined
983
Jr Enlisted (E1-E6)
Sr Enlisted (E7-E9)
Jr Officer (O1-O3)
Sr Officer (O4 and up)
Jr Civ (Grades 1-8)
Sr Civ (Grades 9-SES)
Other

Defense Equal Opportunity Management Institute
FOR OFFICIAL USE ONLY
ADMIN#: 168xxxx 8
III. PERCEPTION OF DISCRIMINATION
Race/Nat Orig/Color
Sexual Harassment
Gender (Sex)
Religion
Age
Disability
Total 100.00
PercentFrequency
This section addresses whether members of the organization experienced discrimination and sexual harassment,
directed from members of the organization, during the last 12 months; whether they reported the incident; and
their satisfaction with how the reported incident was resolved.
Within the past 12 months, I have personally experienced an incident of discrimination or sexual harassment
within my current organization (Mark all that apply):
NOTE: Respondents can select multiple bases of discrimination, which accounts for any disparities in totals.
Information specific to Sexual Harassment begins on page 14.
34
12
24
6
21
16
10
3
2
24
22.37
7.89
15.79
13.82
10.53
3.95
6.58
1.97
1.32
Equal Pay
Genetic Information
Pregnancy
Retaliation 15.79
152

Defense Equal Opportunity Management Institute
FOR OFFICIAL USE ONLY
ADMIN#: 168xxxx 9
YES
NO
Total 100.00
PercentFrequency
EXPERIENCED DISCRIMINATION BASED ON RACE/NATIONAL ORIGIN/COLOR
MINORITY
NOTE: Respondents who selected “Decline to respond” for Race and/or Hispanic declaration in the
demographics section account for disparities that may appear in totals shown below.
MAJORITY
Frequency Percent
Total
NO
YES
100.00
6
388
394
1.52
98.48
16
361
377
4.24
95.76
ADMIN#: 168xxxx Defense Equal Opportunity Management Institute
FOR OFFICIAL USE ONLY
10
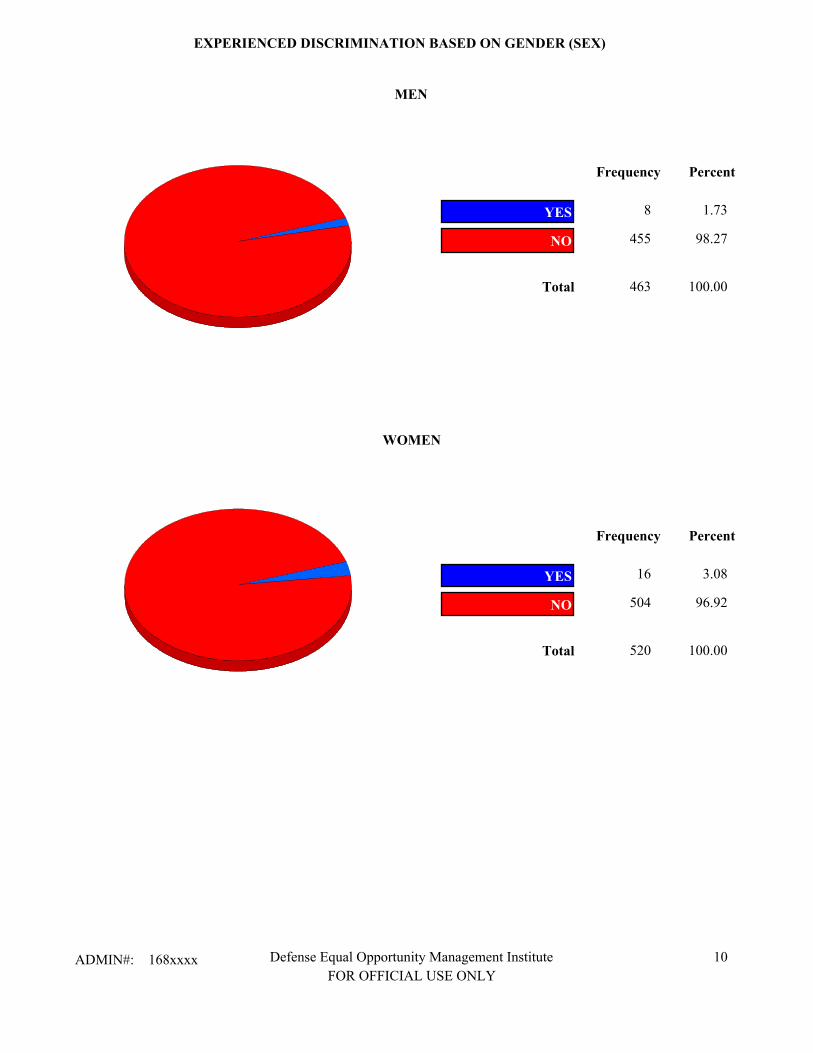
EXPERIENCED DISCRIMINATION BASED ON GENDER (SEX)
MEN
WOMEN
Frequency Percent
Total
NO
YES
100.00
PercentFrequency
Total
NO
YES
100.00
8
455
16
504
520
3.08
96.92
1.73
98.27
463

Defense Equal Opportunity Management Institute
FOR OFFICIAL USE ONLY
11ADMIN#: 168xxxx
Actions Taken Following Incident of Discrimination
Total 100.00
Frequency Percent
NOTE: Respondents’ option to select more than one type of discrimination accounts for disparities that may
appear in the totals shown below.
Did not report the incident to anyone.
Confronted individual.
Reported incident to supervisor/superior.
Reported incident through EO/EEO representative.
Filed formal complaint through EO/EEO representative.
2
2
29
11
33
77
2.60
2.60
37.66
14.29
42.86
Did you report any of the incidents of discrimination to someone in your organization?
"N/A" responses not included.

Reported Incident of Discrimination to Formal Complaint, EO/EEO or Supervisor:
Demographic Breakout
NOTE: Respondents who selected “Decline to respond” for Race and/or Hispanic declaration in the
demographics section or responded with N/A, account for disparities that may appear in totals shown below.
Table 1. Reported Incident of Discrimination by Demographic Breakout
Reported Incident of Discrimination
Reported Did Not Report Total
Number Percent Number Percent Number Percent
Civilian 50.88 49.12 29 28 57 100.00
Military 50.00 50.00 3 3 6 100.00
Men 33.33 66.67 7 14 21 100.00
Women 57.78 42.22 26 19 45 100.00
Majority 44.44 55.56 8 10 18 100.00
Minority 65.38 34.62 17 9 26 100.00
Figure 1. Reported Incident of Discrimination by Demographic Subgroups
Civilian
Military
Men
Women
Majority
Minority
50.88
50.00
33.33
57.78
44.44
65.38
%
%
%
%
%
%
"N/A" responses not included.
ADMIN#: 168xxxx Defense Equal Opportunity Management Institute
FOR OFFICIAL USE ONLY
12

Satisfaction with Discrimination Issue Resolution: Members who Filed Formal Complaint or
Reported Incident to EO/EEO or Supervisor
Figure 2. How satisfied are you with how your issue was (or is being) resolved?
NOTE: Data for individuals who confronted the offenders are not included in the DEOCS satisfaction analysis.
PercentFrequency
100.00Total
Somewhat Dissatisfied
Very Dissatisfied
ADMIN#: 168xxxx Defense Equal Opportunity Management Institute
FOR OFFICIAL USE ONLY
13
53.13
34.38
17
11
32
9.38 3
1 3.13Very Satisfied
Somewhat Satisfied
“N/A” responses not included.

Perceived Barriers to Reporting Discrimination
If you did not report the incident to anyone in your chain of command, please indicate your personal reasons
why. (Mark all that apply)
Figure 3. Barriers to Reporting Discrimination
PercentFrequency
100.00Total
Other.
Lack of support from chain of command.
Fear of reprisal.
Lack of privacy/confidentiality.
The incident would not be believed.
The incident would not be taken seriously.
ADMIN#: 168xxxx Defense Equal Opportunity Management Institute
FOR OFFICIAL USE ONLY
14
19
7
9
16
16
5
72
26.39
9.72
12.50
22.22
22.22
6.94
“N/A” responses not included.

ADMIN#: 168xxxx Defense Equal Opportunity Management Institute
FOR OFFICIAL USE ONLY
15
Experiences of Sexual Harassment
MEN
WOMEN
Frequency Percent
Total
NO
YES
100.00
PercentFrequency
Total
NO
YES
100.00
8
512
520
1.54
98.46
4
459
463
0.86
99.14

Defense Equal Opportunity Management Institute
FOR OFFICIAL USE ONLY
16ADMIN#: 168xxxx
Actions Taken Following Incident of Sexual Harassment
Total 100.00
Frequency Percent
NOTE: Respondents’ option to select more than one type of discrimination accounts for disparities that may
appear in the totals shown below.
Did not report the incident to anyone.
Confronted individual.
Reported incident to supervisor/superior.
Reported incident through EO/EEO representative.
Filed formal complaint through EO/EEO representative.
Did you report any of the incidents of sexual harassment to someone in your organization?
0
0
4
4
12
0.00
0.00
33.33
33.33
33.33
4
“N/A” responses not included.

Members who Filed Formal Complaint or Reported Incident of Sexual Harassment to EO/EEO or
Supervisor: Demographic Breakout
NOTE: Respondents who selected “Decline to respond” for Race and/or Hispanic declaration in the
demographics section or responded with N/A, account for disparities that may appear in totals shown below.
Table 2. Reported Incident of Sexual Harassment by Demographic Breakout
Reported Incident of Sexual Harassment
Reported Did Not Report Total
Number Percent Number Percent Number Percent
Civilian 66.67 33.33 4 2 6 100.00
Military 0.00 0.00 0 0 0 100.00
Men 75.00 25.00 3 1 4 100.00
Women 25.00 75.00 1 3 4 100.00
Majority 33.33 66.67 2 4 6 100.00
Minority 100.00 0.00 1 0 1 100.00
Figure 4. Reported Incident of Sexual Harassment by Demographic Subgroups
Civilian
Military
Men
Women
Majority
Minority
66.67
0.00
75.00
25.00
33.33
100.00
%
%
%
%
%
%
“N/A” responses not included.
ADMIN#: 168xxxx Defense Equal Opportunity Management Institute
FOR OFFICIAL USE ONLY
17

Satisfaction with Sexual Harassment Issue Resolution: Members who Filed Formal Complaint or
Reported Incident to EO/EEO or Supervisor
Figure 5. How satisfied are you with how your issue was (or is being) resolved?
NOTE: Data for individuals who confronted the offenders are not included in the DEOCS satisfaction
analysis.
PercentFrequency
100.00Total
Somewhat Dissatisfied
Very Dissatisfied
ADMIN#: 168xxxx Defense Equal Opportunity Management Institute
FOR OFFICIAL USE ONLY
18
50.00
0.00
2
0
4
25.00 1
1 25.00Very Satisfied
Somewhat Satisfied
“N/A” responses not included.
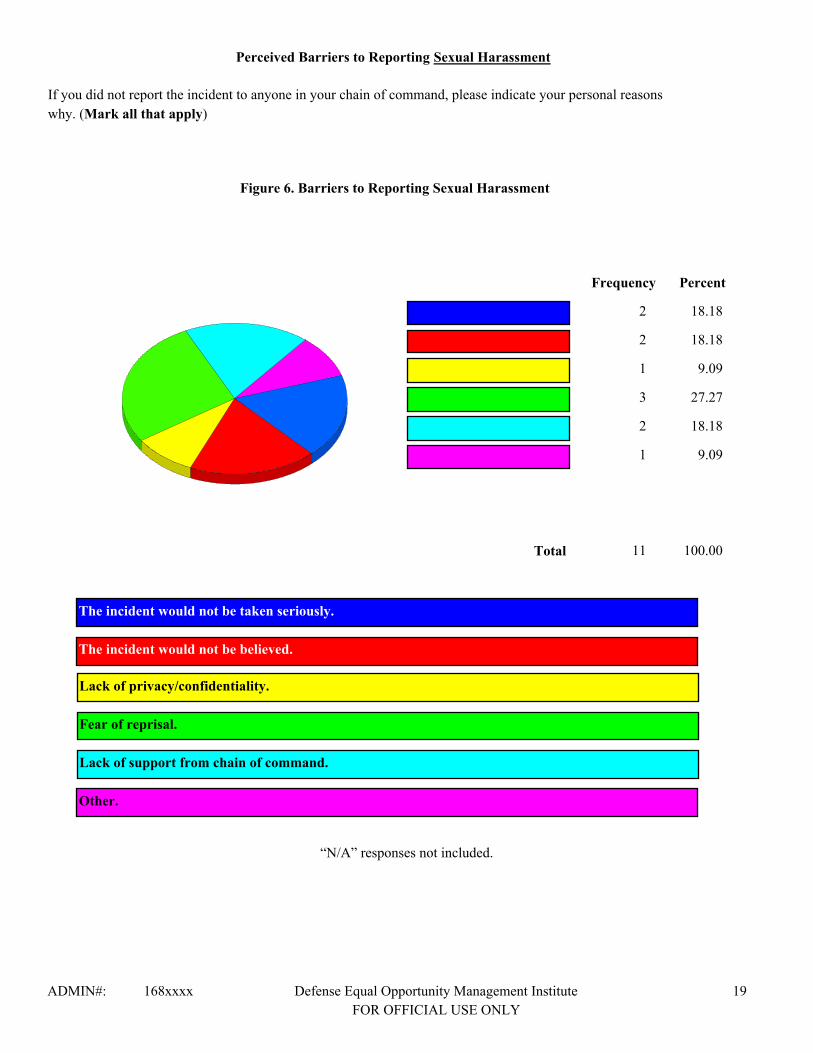
Perceived Barriers to Reporting Sexual Harassment
If you did not report the incident to anyone in your chain of command, please indicate your personal reasons
why. (Mark all that apply)
Figure 6. Barriers to Reporting Sexual Harassment
PercentFrequency
100.00Total
Other.
Lack of support from chain of command.
Fear of reprisal.
Lack of privacy/confidentiality.
The incident would not be believed.
The incident would not be taken seriously.
ADMIN#: 168xxxx Defense Equal Opportunity Management Institute
FOR OFFICIAL USE ONLY
19
2
2
1
3
2
1
11
18.18
18.18
9.09
27.27
18.18
9.09
“N/A” responses not included.

IV. SEXUAL ASSAULT PREVENTION AND RESPONSE
This section addresses members' perceptions of the Sexual Assault Prevention and Response (SAPR) climate
within your organization. Specifically, this section includes members' perceptions of the following topic areas:
1) Perceptions of Safety
2) Chain of Command Support
3) Publicity of SAPR Information
4) Unit Reporting Climate
5) Perceived Barriers to Reporting Sexual Assault
6) Unit Prevention Climate
7) Restricted Reporting Knowledge
Below you will find the overall unit summary information pertaining to the SAPR climate within your
organization, compared to the DEOMI database for your Service. Results display above average, average, and
below average using a green, blue, and red coding scheme, respectively. Above average indicates that the
perceptions of your members are markedly more favorable than the perceptions commonly held across your
Service. Average indicates that the perceptions of your members are similar to that of the perceptions commonly
held across your Service. Below average indicates that the perceptions of your members are markedly less
favorable than those held across your Service. Your organization’s average is displayed along with its respective
Service branch average.
Green = Above Service AverageBlue = Near Service AverageRed = Below Service Average
Perceptions of Safety
3.72
3.77
Your Unit
Your Service
Range of “Near Service” Average = - 3.69 3.83
Chain of Command Support
3.48
3.56
Your Unit
Your Service
Range of “Near Service” Average = - 3.45 3.68
ADMIN#: 168xxxx Defense Equal Opportunity Management Institute
FOR OFFICIAL USE ONLY
20

Publicity of SAPR Information
2.88
3.19
Your Unit
Your Service
Range of “Near Service” Average = - 3.03 3.36
Unit Reporting Climate
3.55
3.63
Your Unit
Your Service
Range of “Near Service” Average = - 3.54 3.74
Zero Perceived Barriers to Reporting Sexual Assault
34.89
39.11
Your Unit
Your Service
%
%
Range of “Near Service” Average = - 30.56 47.62
Unit Prevention Climate
3.58
3.57
Your Unit
Your Service
Range of “Near Service” Average = - 3.51 3.67
Restricted Reporting Knowledge
71.90
76.58
Your Unit
Your Service
%
%
Range of “Near Service” Average = - 70.97 82.83
Green = Above Service AverageRed = Below Service Average Blue = Near Service Average
ADMIN#: 168xxxx Defense Equal Opportunity Management Institute
FOR OFFICIAL USE ONLY
21

Perceptions of Safety
Perceptions of Safety refers to members’ feelings of safety from being sexually assaulted where they currently
live and perform their work/duties. Two questions measure Perceptions of Safety; each item is measured on a
four-point scale, where respondents may select very unsafe, unsafe, safe, or very safe.
Table 3 displays Perceptions of Safety where individuals live, subdivided by residence and respondents’
perceptions of safety where they work. The table displays the percentage of members who indicated they feel
safe or very safe combined into “Safe” and displays the percentages of members who indicate they feel unsafe or
very unsafe combined into “Unsafe.” In cases where fewer than five people in a subgroup complete the survey,
you will not receive any data for that subgroup in order to maintain respondent anonymity; that group’s data will
be marked with 0.00.
To what extent do you feel safe from
being sexually assaulted where you
currently live:
Safe Unsafe Total
Number Percent Number Percent Number Percent
Table 3. Respondents’ Perceptions of Safety
On-base/post/station
Off-base/post/station
82 100.00 0 0.00 82 100.00
To what extent do you feel safe from
being sexually assaulted where you
perform your work/duties:
886 15 901 98.34 1.66 100.00
969 14 983 98.58 1.42 100.00
ADMIN#: 168xxxx Defense Equal Opportunity Management Institute
FOR OFFICIAL USE ONLY
22

Figure 7. Respondents’ Perceptions of Safety where they Live by Demographic Subgroups
Men
Women
Jr. Enlisted
Sr. Enlisted
Jr. Officer
Sr. Officer
Jr. Civilian
Sr. Civilian
Organization
Service
98.92
98.08
100.00
98.90
100.00
97.70
97.66
98.24
98.47
98.45
To what extent do you feel safe from being sexually assaulted where you currently live?
%
%
%
%
%
%
%
%
%
%
Analyzing Responses based on Demographic Subgroups:
Figure 7 displays the percentage of respondents who feel “Safe” where they live by demographic subgroups. In
cases where fewer than five people in a subgroup complete the survey, you will not receive any data for that
subgroup in order to maintain respondent anonymity; that group’s data will be marked with 0.00.
ADMIN#: 168xxxx Defense Equal Opportunity Management Institute
FOR OFFICIAL USE ONLY
23

Figure 8. Respondents’ Perceptions of Safety at Work by Demographic Subgroups
Men
Women
Jr. Enlisted
Sr. Enlisted
Jr. Officer
Sr. Officer
Jr. Civilian
Sr. Civilian
98.70
98.46
100.00
100.00
100.00
97.70
97.66
98.24
To what extent do you feel safe from being sexually assaulted where you perform your work/duties?
98.58
98.74Service
Organization
%
%
%
%
%
%
%
%
%
%
Figure 8 displays the percentage of respondents who feel “Safe” where they work by demographic subgroups.
In cases where fewer than five people in a subgroup complete the survey, you will not receive any data for
that subgroup in order to maintain respondent anonymity; that group’s data will be marked with 0.00.
ADMIN#: 168xxxx Defense Equal Opportunity Management Institute
FOR OFFICIAL USE ONLY
24

Recommendations:
While Perceptions of Safety may not necessarily reflect the actual level of risk faced by an individual or group,
the reasoning behind such perceptions may yield valuable information about a number of environmental risks
that pertain not only to sexual assault, but also to domestic violence, substance abuse, disruptive conditions in
living quarters, and other problems that require command attention. Use the results as a guide for developing a
plan of action for leadership within your unit. Use the responses displayed by residence and by demographic
subgroup to identify any differences between groups. Consider holding sensing sessions/focus groups with
several members of these demographic groups to understand any differences in responses in your unit’s results.
Incorporate feedback from these sessions into your plan of action for leadership.
.
Foster and encourage first-line supervisor involvement in the detection of potential threats and risks within
your unit. About 80% of the sexual assaults within the Department of Defense occur between people that
know each other. Consequently, standard physical security measures may not always address the factors that
give rise to sexual assaults between co-workers, friends, and acquaintances. Well-trained and empowered
first-line supervisors are likely the first to become aware of behaviors that contribute to increased risk for
sexual assault and other disruptive behaviors within the unit.
As appropriate, encourage your unit leaders to regularly visit military living quarters - especially during
evenings and weekends.
Consider contacting base law enforcement and criminal investigators to obtain local threat information, for
both on- and off- base housing areas.
Review and modify as appropriate "party" and alcohol use policies in on-base living quarters. Many
interactions that lead to sexual assault begin in social settings and often involve alcohol. Such policies
should promote responsible alcohol use, encourage all involved to be on the lookout for situations at risk for
sexual assault, and outline how to safely address inappropriate behavior.
Encourage professional workplace behavior and intervention against those who do not behave respectfully.
Research has found that the presence of unchecked sexual harassment within a unit increases the likelihood
of sexual assault within that unit. Unit leadership must not only enforce these standards but also set the
example.
.
.
.
.
Here are additional recommendations and information to consider when developing your plan of action:
ADMIN#: 168xxxx Defense Equal Opportunity Management Institute
FOR OFFICIAL USE ONLY
25

Chain of Command Support
Chain of Command Support refers to members’ perceptions of the extent to which command behaviors are
targeted towards preventing sexual assault and creating an environment where members would feel comfortable
reporting a sexual assault. Seven questions measure Chain of Command Support; each item is measured on a
four-point scale assessing extent, where respondents may select not at all, slight extent, moderate extent, or
great extent.
Table 5 displays the percentage of individuals who perceive a favorable Chain of Command Support climate,
meaning that they perceive the chain of command to display the positive command behaviors to a moderate
extent or a great extent. Additionally, this table displays the percentage of individuals who perceive an
unfavorable Chain of Command Support climate, meaning that they perceive the chain of command to display
the positive behaviors to a slight extent or not at all.
Table 5. Respondents' Perceptions of Chain of Command Support
To what extent does your chain of command:Favorable Unfavorable Total
Number Percent Number Percent Number Percent
Promote a unit climate based on “respect and
trust” 79.45 20.55 781 202 983 100.00
Refrain from sexist comments and behaviors 95.73 4.27 941 42 983 100.00
Actively discourage sexist comments and
behaviors 92.47 7.53 909 74 983 100.00
Provide sexual assault prevention and response
training that interests and engages you 86.78 13.22 853 130 983 100.00
Encourage bystander intervention to assist
others in situations at risk for sexual assault or
other harmful behavior
89.22 10.78 877 106 983 100.00
Encourage victims to report sexual assault 90.34 9.66 888 95 983 100.00
Create an environment where victims feel
comfortable reporting sexual assault 89.32 10.68 878 105 983 100.00
ADMIN#: 168xxxx Defense Equal Opportunity Management Institute
FOR OFFICIAL USE ONLY
26

Analyzing Responses based on Demographic Subgroups:
The Chain of Command Support index is calculated by first assigning numerical values to each anchor, where
“1” equals not at all, “2” equals slight extent, “3” equals moderate extent, and “4” equals great extent, and then
computing individuals’ mean responses to the seven Chain of Command Support questions. Figure 9 displays
your unit’s combined average on these questions by demographic subgroups, with higher scores reflecting more
favorable Chain of Command Support. In cases where fewer than five people in a subgroup complete the survey,
you will not receive any data for that subgroup in order to maintain respondent anonymity; that group's data will
be marked with 0.00.
Figure 9. Respondents’ Perceptions of Chain of Command Support by Demographic Subgroups
Men
Women
Jr. Enlisted
Sr. Enlisted
Jr. Officer
Sr. Officer
Jr. Civilian
Sr. Civilian
Organization
Service
3.54
3.43
3.56
3.70
3.62
3.60
3.39
3.43
3.48
3.56
ADMIN#: 168xxxx Defense Equal Opportunity Management Institute
FOR OFFICIAL USE ONLY
27

Recommendations:
The Chain Of Command Support index provides insight into how unit members perceive leadership's
behaviors related to preventing sexual assault and creating an environment where victims would feel
comfortable reporting sexual assault. Use the results as a guide for developing a plan of action for leadership
within your unit. Use the responses displayed by demographic subgroup to identify any differences between
groups. Consider holding sensing sessions/focus groups with several members of these demographic groups
to understand any differences in responses in your unit’s results. Incorporate feedback from these sessions
into your plan of action for leadership.
Here are additional recommendations and information to consider when developing your plan of action:
Motivate and empower your command team to take action on those items that get a less favorable rating. For
example, if the chain of command is not seen as actively discouraging sexist comments and behaviors,
clearly set your expectations with your unit leaders and consider inviting an installation resource in to help
improve their skill set. Some sexist comments and behaviors may be so common practice that they escape
scrutiny by those using them. Capturing a wide variety of perspectives from people within and outside your
leadership chain can help you identify problem areas. Unchecked sexist comments and behaviors
communicate to offenders that the unit is a place that tolerates treating someone unfairly because of their
gender. This kind of climate may act as a "green light" for those who perpetrate sexual assault.
Emphasize the importance of reporting sexual assault and getting needed assistance.
Refrain from using the phrase "zero tolerance" on an individual unit-level. While no one should ever
tolerate, condone or accept sexual assault, use of this term may have the unintended effect of keeping
victims from reporting; no service member wants to be the person that shatters the commander's expectation
that "zero" sexual assaults will occur in the unit. Rather, emphasize that sexual assault has no place in your
unit - but if it does occur, encourage those impacted to choose one of the reporting options and get care.
Adjust supervision policies to allow unit members to engage care and other resources without intrusive
questioning. An environment that is conducive to reporting also allows victims a reasonable amount of
flexibility to schedule and attend appointments for care and assistance. While personnel accountability is
important, victim feedback indicates that supervisors often ask such intrusive questions about the nature of
care appointments that victims sometimes forego reporting the crime and getting care so as to not attract
negative attention.
Seek out training opportunities that encourage small group discussion and active participation. "One size fits
all" training rarely imparts lasting changes in knowledge, skills, and behavior. Members between the ages of
18 to 25 may be most at risk for sexual assault, but many at this age see themselves as impervious to this and
other harms. Small group discussions with a mentor can help overcome such resistance and impart lasting
change. Contact your servicing Sexual Assault Response Coordinator for meaningful and impactful training
formats and opportunities.
.
.
.
.
.
ADMIN#: 168xxxx Defense Equal Opportunity Management Institute
FOR OFFICIAL USE ONLY
28

Additional Resources:
Training materials and discussion guides that can be used in smaller groups are available at www.sapr.mil.
Also, follow links on sapr.mil to your Service webpage for additional materials.
Consider attending DEOMI’s Leadership Team Awareness Seminar (LTAS). Target audience for LTAS is
senior officers (commanders and key staff/department heads O-3/O-6) and senior enlisted advisors (E-7/E-9)
as well as civilians including legal officers, chaplains, and inspector general personnel in leadership
positions. Duration of the course is 5 Days (40 hours). For more information contact: Student Management
Division for enrollment into LTAS, Commercial (321)494-5653/7543 (DSN 854).
ADMIN#: 168xxxx Defense Equal Opportunity Management Institute
FOR OFFICIAL USE ONLY
29

Publicity of SAPR Information
Publicity of SAPR Information refers to the extent to which members' perceive that SAPR-related information
and resources is publicly displayed and openly communicated. There are three questions measuring Publicity of
SAPR Information; each item is measured on a four-point scale measuring extent, where respondents may select
not at all, slight extent, moderate extent, or great extent.
The following table displays the percentage of individuals who perceive there to be a favorable climate of
Publicity of SAPR Information, meaning that they perceive the display of SAPR information and resources is to
a moderate extent or a great extent. This table also displays the percentage of individuals who perceive there is
an unfavorable climate of Publicity of SAPR Information, meaning that they perceive the display of SAPR
information and resources is to a slight extent or not at all.
Table 6. Respondents’ Perceptions of Publicity of SAPR Information
To what extent does your chain of command:Favorable Unfavorable Total
Number Percent Number Percent Number Percent
Disseminate information on the outcomes of
sexual assault courts-martial occurring within
your Service
46.69 53.31 459 524 983 100.00
Publicize sexual assault reporting resources (e.g.,
Sexual Assault Response Coordinator contact
information; Victim Advocate contact
information; awareness posters; sexual assault
hotline phone number)
78.84 21.16 775 208 983 100.00
Publicize the Restricted (confidential) Reporting
option for sexual assault 74.47 25.53 732 251 983 100.00
ADMIN#: 168xxxx Defense Equal Opportunity Management Institute
FOR OFFICIAL USE ONLY
30

Analyzing Responses based on Demographic Subgroups:
Figure 10 provides results of the Publicity of SAPR Information index by demographic subgroups. The Publicity
of SAPR Information index is calculated by first assigning numerical values to each anchor, where “1” equals
not at all, “2” equals slight extent, “3” equals moderate extent, and “4” equals great extent, and then computing
individuals’ mean responses to the three publicity questions. The figure below displays your unit’s combined
average on these questions by demographic subgroups, with higher scores reflecting more favorable perceptions
of Publicity of SAPR Information. In cases where fewer than five people in a subgroup complete the survey, you
will not receive any data for that subgroup in order to maintain respondent anonymity; that group’s data will be
marked with 0.00.
Figure 10. Respondents’ Perceptions of Publicity of SAPR Information by Demographic Subgroups
Men
Women
Jr. Enlisted
Sr. Enlisted
Jr. Officer
Sr. Officer
Jr. Civilian
Sr. Civilian
Organization
Service
2.93
2.84
3.08
3.16
2.97
2.90
2.78
2.81
2.88
3.19
ADMIN#: 168xxxx Defense Equal Opportunity Management Institute
FOR OFFICIAL USE ONLY
31

Recommendations:
The Publicity of SAPR Information index can provide insight about the availability of SAPR-related
information and resources. Publically discussing issues surrounding sexual assault and displaying SAPR
resources is an important step in decreasing the stigma associated with this crime. Communicating openly
with members of your organization about sexual assault will also help to raise awareness of the issue. Use
the results as a guide for developing a plan of action for leadership within your unit to increase the
availability of these resources and information. Use the responses displayed by demographic subgroup to
identify any differences between groups. Consider holding sensing sessions/focus groups with several
members of these demographic groups to understand any differences in responses in your unit’s results.
Incorporate feedback from these sessions into your plan of action for leadership.
Here are additional recommendations and information to consider when developing your plan of action:
Empower your command team to publically display SAPR information by guiding them to resources
that they can utilize (see Additional Resources section below).
Integrate SAPR messaging into existing communication plans and publications (e.g., town halls, all
hands, commander’s call, newsletter, etc.).
Feature sexual assault related resources in unit common areas. Publicize the DoD sexual assault
hotline (www.safehelpline.org) as an anonymous, free, and available worldwide 24 hours a day
resource.
Disseminate policy letters against sexism, sexual harassment, and sexual assault.
.
.
o
Publicize SAPR information to prevent sexual assaults in your unit:
o
o
o
Publicize SAPR information in response to a sexual assault allegation made in your unit:
Take the opportunity to discuss the SAPR program, the support resources available to both victims
and accused members, and prevention topics.
Actively discourage rumors and speculation about the allegation.
Consider appropriate releases of information to keep unit members informed and derail rumors. The
release must consider the privacy of the victim, the accused, and the sensitivity of the matters
involved. Work with your local criminal investigators and staff judge advocate to determine what
can be said, when it is released, and how to communicate such information.
To the extent legally permissible, discuss the outcomes and disciplinary actions, if any, of sexual
assault allegations.
When all personnel are held appropriately accountable for their behavior, the unit climate of trust and
safety is enhanced and personnel may feel safer coming forward with issues or incident reports. An
example of a practice that promotes accountability includes: Publicizing the punishments for
misconduct or criminal offenses consistent with law and Department of Defense regulations
(Excerpted from the 2014-2016 DoD Sexual Assault Prevention Strategy, Section 5).
o
o
o
o
o
ADMIN#: 168xxxx Defense Equal Opportunity Management Institute
FOR OFFICIAL USE ONLY
32

Additional Resources:
Nationally, Sexual Assault Awareness Month (SAAM) occurs in April and commits to raising awareness
and promoting the prevention of sexual violence through use of special events and public education. SAAM
provides commands/installations an annual opportunity to highlight DoD and Service policies addressing
sexual assault prevention and response. Visit www.sapr.mil for Sexual Assault Awareness Month Campaign
materials.
Stay up-to-date on SAPR policies by visiting www.sapr.mil and sign up to receive the SAPRO's quarterly
newsletter (SAPR Source).
Visit www.safehelpline.org for outreach materials.
Visit www.deomi.org for sexual assault awareness observance posters.
ADMIN#: 168xxxx Defense Equal Opportunity Management Institute
FOR OFFICIAL USE ONLY
33

Unit Reporting Climate
Unit Reporting Climate measures the extent to which members perceive that the chain of command would take
appropriate actions to address an Unrestricted Report of sexual assault and that there would be minimal
retaliation if a sexual assault was reported. Ten questions measure Unit Reporting Climate, where respondents
may select not at all likely, slightly likely, moderately likely, or very likely.
Table 7 below displays the percentage of individuals who perceive a favorable Unit Reporting Climate, meaning
that they perceive individuals within the unit (chain of command or members) are moderately likely or very
likely to engage in the positive Unit Reporting Climate behavior. The table also displays the percentage of
individuals who perceive an unfavorable Unit Reporting Climate, meaning that they believe the individuals
within the unit are slightly likely or not at all likely to engage in the positive Unit Reporting Climate behavior.
Within this scale, there are three questions that ask about the extent of negative behavior and are therefore
reverse scored to remain consistent with a higher score being more favorable (indicated with an asterisk).
Table 7. Respondents' Perceptions of Unit Reporting Climate
If someone were to report a sexual assault
to your current chain of command, how
likely is it that:
Favorable Unfavorable Total
Number Percent Number Percent Number Percent
The chain of command would take the report
seriously. 95.32 4.68 937 46 983 100.00
The chain of command would keep knowledge of
the report limited to those with a need to know. 92.68 7.32 911 72 983 100.00
The chain of command would forward the report
outside the unit to criminal investigators. 87.59 12.41 861 122 983 100.00
The chain of command would take steps to
protect the safety of the person making the
report.
93.49 6.51 919 64 983 100.00
The chain of command would support the person
making the report. 93.49 6.51 919 64 983 100.00
The chain of command would take corrective
action to address factors that may have led to the
sexual assault.
92.88 7.12 913 70 983 100.00
ADMIN#: 168xxxx Defense Equal Opportunity Management Institute
FOR OFFICIAL USE ONLY
34

Unit members would label the person making
the report a troublemaker (*). 83.32 16.68 819 164 983 100.00
Unit members would support the person making
the report. 89.42 10.58 879 104 983 100.00
The offender(s) or their associates would
retaliate against the person making the report
(*).
82.30 17.70 809 174 983 100.00
The career of the person making the report
would suffer (*). 83.83 16.17 824 159 983 100.00
ADMIN#: 168xxxx Defense Equal Opportunity Management Institute
FOR OFFICIAL USE ONLY
35

Analyzing Responses based on Demographic Subgroups:
Figure 11 provides the results of the Unit Reporting Climate index by demographic subgroups, with higher
scores indicating more favorable responses. The Unit Reporting Climate index is calculated by first assigning
numerical values to each anchor, where “1” equals not at all likely, “2” equals slightly likely, “3” equals
moderately likely, and “4” equals very likely, and then computing individuals’ mean responses to the 10 Unit
Reporting Climate questions. The figure below displays your unit’s combined average on these questions by
demographic subgroups, with higher scores reflecting a more favorable Unit Reporting Climate. In cases where
fewer than five people in a subgroup complete the survey, you will not receive any data for that subgroup in
order to maintain respondent anonymity; that group’s data will be marked with 0.00.
Figure 11. Respondents’ Perceptions of Unit Reporting Climate by Demographic Subgroups
Men
Women
Jr. Enlisted
Sr. Enlisted
Jr. Officer
Sr. Officer
Jr. Civilian
Sr. Civilian
Organization
Service
3.63
3.48
3.54
3.72
3.72
3.76
3.45
3.50
3.55
3.63
ADMIN#: 168xxxx Defense Equal Opportunity Management Institute
FOR OFFICIAL USE ONLY
36

Recommendations:
The Unit Reporting Climate index can provide insight into how members perceive a report of sexual assault
would be handled by the chain of command and unit members. These perceptions are important as they will
likely influence members’ willingness to report a sexual assault. Use the favorable and unfavorable ratings
on the survey items as a guide for developing a plan of action for leadership within your unit to improve
Unit Reporting Climate perceptions. Use the responses displayed by demographic subgroup to identify any
differences between groups. Consider holding sensing sessions/focus groups with several members of these
demographic groups to understand any differences in responses in your unit’s results. Incorporate feedback
from these sessions into your plan of action for leadership.
Here are additional recommendations and information to consider when developing your plan of action:
.
. Optimize Unit Reporting Climate to prevent sexual assault in your unit:
Encourage your command team to take action on those items that receive a less favorable rating. For
instance, if unit members perceive that the chain of command does not take sexual assault reports
seriously, follow up with unit leaders to ensure that this responsibility is not taken lightly. Service
members perceive that sexual assault reports are not taken seriously when allegations are ignored,
leadership at any level encourages victims to drop their report, and victims are scrutinized and
blamed for getting victimized.
Ensure DoD and Service requirements are met with regard to case progress and updates to victims.
DoD Instruction 6495.02 requires the establishment of a multi-disciplinary case management group
(CMG), co-chaired by the Deputy Installation Commander and the SARC. While each Service may
refer to this group by a different name (i.e., Sexual Assault Review Board, etc.), the CMG should
meet monthly to review individual cases, improve reporting, facilitate monthly victim updates, and
to discuss process improvements to ensure system accountability and victim access to quality
services. As a commander, you must attend the monthly CMG until final disposition has been taken
in the case. You are also responsible for providing monthly updates to victims of sexual assault on
their case.
o
o
Maintain a favorable Unit Reporting Climate in response to a sexual assault allegation made in your unit:
All sexual assault allegations that come to the chain of command’s attention must be referred to a
military criminal investigative organization (CID, NCIS or AFOSI). Commanders may not conduct
their own internal or preliminary investigation (e.g., commander’s inquiry, “15-6 investigations”,
etc.). Once the investigation is complete, you or a more senior commander must review the criminal
investigation, evaluate the evidence with the assistance of a judge advocate, and determine any
appropriate disciplinary action to be taken. If the victim and the accused are both within your unit, it
is important that you should remain objective (fair and impartial) and take appropriate action based
on the evidence.
Discourage members from participating in “barracks gossip” or grapevine speculation about the case
or investigation. Remind everyone to wait until all the facts are known and final disposition of the
allegation has occurred before reaching conclusions. While victims must see their allegations are
taken seriously, the alleged offender is presumed innocent until proven guilty. Remind members that
discussion of a possible sexual assault incident might compromise an ongoing investigation.
Emphasize the importance of balance in the justice system. “Choosing sides” is never fair to the
parties involved, and can rip a unit apart. Supporting the victim and the accused through the military
justice process does not require anyone to take a side. Rather, as a commander, you have a duty to
ensure both parties (if both are under your command) are connected with appropriate services and
support.
o
o
o
ADMIN#: 168xxxx Defense Equal Opportunity Management Institute
FOR OFFICIAL USE ONLY
37

o
o
o
Advise those who may have knowledge of the events leading up to or surrounding the incident to
fully cooperate with any investigation involved.
Consider some form of targeted unit refresher training; or have an outside expert address the unit
regarding preventive measures, as well as some of the emotional or psychological feelings that may
manifest themselves, affect the unit, and require the unit’s response during the course of the
investigation. It is important that unit members not see “refresher training” as a group punishment
because someone reported a sexual assault. Rather, small group discussions led by knowledgeable
leaders are often the most helpful.
Continuously monitor the unit’s overall climate to ensure neither the victim and/or the alleged
offender is being ostracized. Prevent organizational splintering by communicating your expectations
with first-line supervisors; encourage supervisors to stop rumors, monitor the formation of cliques,
and communicate observed ostracism upwards. Keep in mind that sexual assault is not solely an
individual-level issue; it requires a sustained systemic response because it is influenced by a
wide-range of individual-, organizational-, and societal-level variables.
Make victims aware of the option to request an expedited temporary or permanent transfer from their
assigned command or base, or to a different location within their assigned command or base. Also
keep in mind that alleged offenders may alternatively be moved.
o
ADMIN#: 168xxxx Defense Equal Opportunity Management Institute
FOR OFFICIAL USE ONLY
38

Perceived Barriers to Reporting Sexual Assault
Perceived Barriers to Reporting Sexual Assault refers to the frequency of barriers to reporting sexual assault
individuals perceive within their unit/organization. Members are asked to select all that may apply from eight
potential barriers, along with two additional options: “Another reason other than what is provided above” and
“There are no barriers that would prevent victims from reporting a sexual assault.”
The table below displays the percentage of members who perceive each barrier to reporting sexual assault.
Table 8. Respondents’ Perceived Barriers to Reporting Sexual Assault
In your current unit/organization, which of
the following would be the most likely
reasons why a victim of sexual assault
would not report the incident?
Selected Not Selected Total
Number Percent Number Percent Number Percent
Negative impact to career or progress. 28.28 71.72 278 705 983 100.00
Loss of privacy/confidentiality. 44.96 55.04 442 541 983 100.00
Fear of professional retaliation for making the
report. 24.11 75.89 237 746 983 100.00
Fear of social retaliation for making the report. 29.91 70.09 294 689 983 100.00
Lack of confidence in the military justice system. 18.72 81.28 184 799 983 100.00
Lack of confidence in the chain of command. 21.77 78.23 214 769 983 100.00
Takes too much time and effort to report. 12.82 87.18 126 857 983 100.00
Not knowing how to make a sexual assault
report. 10.78 89.22 106 877 983 100.00
Another reason other than what is provided
above. 8.65 91.35 85 898 983 100.00
There are no barriers that would prevent victims
from reporting a sexual assault. 34.89 65.11 343 640 983 100.00
ADMIN#: 168xxxx Defense Equal Opportunity Management Institute
FOR OFFICIAL USE ONLY
39

Analyzing Responses based on Demographic Subgroups:
The figures on the following pages provide results of the Perceived Barriers to Reporting Sexual Assault
questions by demographic subgroups. The figures display the percentage of members that perceive zero barriers
to reporting sexual assault (Figure 12), one to two barriers to reporting sexual assault (Figure 13), and three or
more barriers to reporting sexual assault (Figure 14) by demographic subgroups. Taken together, these three
figures represent the total group members who responded to the survey. In cases where fewer than five people
in a subgroup complete the survey, you will not receive any data for that subgroup in order to maintain
respondent anonymity; that group’s data will be marked with 0.00.
Figure 12. Percentage of Respondents who Perceived Zero Barriers to
Reporting Sexual Assault by Demographic Subgroups
Men
Women
Jr. Enlisted
Sr. Enlisted
Jr. Officer
Sr. Officer
Jr. Civilian
Sr. Civilian
39.09
31.35
30.00
37.36
36.96
40.23
29.69
36.01
%
%
%
%
%
%
%
%
34.99
37.78Service
Organization %
%
ADMIN#: 168xxxx Defense Equal Opportunity Management Institute
FOR OFFICIAL USE ONLY
40

Figure 13. Percentage of Respondents who Perceived One to Two Barriers to
Reporting Sexual Assault by Demographic Subgroups
Figure 14. Percentage of Respondents who Perceived Three or More Barriers to
Reporting Sexual Assault by Demographic Subgroups
Sr. Civilian
Jr. Civilian
Sr. Officer
Jr. Officer
Sr. Enlisted
Jr. Enlisted
Women
Men
Sr. Civilian
Jr. Civilian
Sr. Officer
Jr. Officer
Sr. Enlisted
Jr. Enlisted
Women
Men
29.16
33.65
23.00
35.16
34.78
37.93
35.16
29.94
31.75
35.00
47.00
27.47
28.26
21.84
35.16
34.05
%
%
%
%
%
%
%
%
%
%
%
%
%
%
%
%
Service
Organization
Service
Organization %
%
%
%
31.54
29.70
33.47
32.52
ADMIN#: 168xxxx Defense Equal Opportunity Management Institute
FOR OFFICIAL USE ONLY
41

Recommendations:
Due to the nature of sexual assault crimes, victims often do not feel comfortable reporting or talking about
their experience. There are steps leadership can take to reduce or eliminate these barriers which would
increase the likelihood of a sexual assault being reported. The Perceived Barriers to Reporting Sexual
Assault question can provide insight into why members within your organization may not feel comfortable
reporting a sexual assault. Use these results as a guide to help develop a plan of action to eliminate
perceived barriers within your organization. Compare the percentage of perceived barriers within your
organization to the results of your respective service. Use the responses displayed by demographic subgroup
to identify any differences between groups. Consider holding sensing sessions/focus groups with several
members of these demographic groups to understand any differences in responses in your unit’s results.
Incorporate feedback from these sessions to help develop a plan of action for leadership to eliminate
perceived barriers to reporting sexual assault. While you may never be able to eliminate all barriers to
reporting, your work to address these concerns sends a powerful, positive message to victims.
Here are additional recommendations and information to consider when developing your plan of action:
.
Motivate and empower your command team to take action on barriers that are frequently perceived. Have a
frank discussion with members regarding these barriers and be open to members’ suggestions for
improvement. Take steps to clarify misperceptions and reduce concerns by demonstrating effort towards
eliminating that barrier. For example, if members perceive “negative impact to career or progress” to be a
barrier to reporting sexual assault within your unit, ask members why this perception exists. Inquire further
about this perception and communicate procedures in place to safeguard against negative impact on career.
Follow through by addressing this with your CMG to ensure members’ careers and progression are not, in
fact, affected by reporting a sexual assault.
As a commander, you must carefully communicate two messages. First, sexual assault is a crime and has no
place in your unit. Second, if sexual assault does occur, encourage victims to pick one of the two reporting
options and seek assistance. Keep in mind that these messages must be balanced.
Avoid statements like “zero tolerance” on an individual unit level. While this sounds effective, it actually
sends a message to victims that you do not want them to come forward to report: No member wants to be the
one to tell their commander that the number of known sexual assaults in the unit is no longer “zero.”
Ensure victims feel comfortable coming forward to report sexual assaults by encouraging them to do so to
the Sexual Assault Response Coordinator (SARC). Stress to your members that you do not have access to
identifying information about victims making Restricted Reports; this will build members’ trust in your
unit’s SARC and Victim Advocate (VA).
As a commander, you can strengthen member’s trust in the reporting process by recommending the most
qualified and trained professional to serve in critical advocacy positions.
.
.
.
.
ADMIN#: 168xxxx Defense Equal Opportunity Management Institute
FOR OFFICIAL USE ONLY
42

Unit Prevention Climate (Bystander Intervention)
Unit Prevention Climate, also known as Bystander Intervention Climate, refers to individuals’ intentions to act
if they were to observe a situation that may lead to a sexual assault. Unit Prevention Climate is measured with
two questions; one item is situation based and asks respondents to indicate which action they would take if in a
given situation. One item presents respondents with a scenario and asks at which point they would most likely
intervene if they witnessed the escalating situation. A summary of the responses collected within your
organization are displayed in Figure 15 through Figure 17.
Figure 15. Responses to Bystander Intervention Action Question
Suppose you see someone secretly putting something in another person’s drink. You’re unsure what it
was. Which of the following are you most likely to do in this kind of situation?
PercentFrequency
100.00Total
Leave to avoid any kind of trouble.
Watch the situation to see if it escalates.
Seek assistance from someone to help deal with the situation.
Tell the drink owner what you saw.
Confront the person.
Nothing.
ADMIN#: 168xxxx Defense Equal Opportunity Management Institute
FOR OFFICIAL USE ONLY
43
194
688
91
1
2
6
982
19.76
70.06
9.27
0.10
0.20
0.61

Figure 16. Responses to Bystander Intervention Point of Intervention Question
Imagine you go to a bar with a group of people whom you just met. What is the earliest point at which you
would intervene in the following escalating situation? (Select one)
PercentFrequency
100.00Total
In this scenario, I would not intervene at any point.
As they leave, the person resists the senior leader and says, “No.”
You see the senior leader quietly escorting the intoxicated person out of the bar.
The senior leader repeatedly hugs the person, rubs his/her shoulders, and offers to
walk him/her back to quarters.
The person appears intoxicated and disoriented, and continues to be the senior
leader’s main focus of attention.
The senior leader buys a second and third drink for the same person despite his/her
repeated objections.
A senior leader buys a drink for a person in the group and tells him/her a drink cannot
be refused, as doing so would go against tradition.
ADMIN#: 168xxxx Defense Equal Opportunity Management Institute
FOR OFFICIAL USE ONLY
44
379
363
112
42
19
40
27
982
38.59
36.97
11.41
4.28
1.93
4.07
2.75

Analyzing Responses based on Demographic Subgroups:
The Unit Prevention Climate index is the numeric composite of the two bystander intervention climate
questions. Figure 17 provides the results of the Unit Prevention Climate index by demographic subgroups,
with higher scores indicating more favorable responses. In cases where fewer than five people in a subgroup
complete the survey, you will not receive any data for that subgroup in order to maintain respondent
anonymity; that group’s data will be marked with 0.00.
Figure 17. Unit Prevention Climate Index by Demographic Subgroups
Men
Women
Jr. Enlisted
Sr. Enlisted
Jr. Officer
Sr. Officer
Jr. Civilian
Sr. Civilian
Organization
Service
3.62
3.55
3.65
3.62
3.65
3.73
3.44
3.56
3.58
3.57
ADMIN#: 168xxxx Defense Equal Opportunity Management Institute
FOR OFFICIAL USE ONLY
45

Prevalence of Respondents Observing High Risk Situations and Responses
Respondents were asked if they have observed a situation they believed could have led to a sexual assault within
the past 12 months. Respondents’ responses to this observation question are displayed in Figure 18.
Figure 18. Percentage of Respondents who Observed a High Risk Situation
In the past 12 months, I observed a situation that I believe was, or could have led to, a sexual assault.
PercentFrequency
100.00Total
No
Yes
ADMIN#: 168xxxx Defense Equal Opportunity Management Institute
FOR OFFICIAL USE ONLY
46
1.93
98.07
19
964
983
If respondents answered “yes” to the observation of a high risk situation question, they were prompted to
identify the response that most closely resembled their actions. Figure 19 displays the responses of those
who completed the question across your organization.

Figure 19. Respondents’ Reported Actions Taken Following High Risk Situation
PercentFrequency
100.00Total
I considered intervening in the situation, but I could not safely take any action.
I told someone in a position of authority about the situation.
I asked others to step in as a group and diffuse the situation.
I created a distraction to cause one or more of the people to disengage from the situation.
I confronted the person who appeared to be causing the situation.
I asked the person who appeared to be at risk if they needed help.
I stepped in and separated the people involved in the situation.
ADMIN#: 168xxxx Defense Equal Opportunity Management Institute
FOR OFFICIAL USE ONLY
47
2
6
2
1
1
4
1
2
19
10.53
31.58
10.53
5.26
5.26
21.05
5.26
10.53
I decided to not take action.
Recommendations:
The Unit Prevention Climate index can provide insight into members’ intentions to act if they observe a situation
that may lead to a sexual assault. Use these results as a guide to help develop a plan of action to increase
bystander intervention within your organization. Look at the frequency of responses to the hypothetical scenario
questions and the prevalence of respondents observing a high risk situation question to gain an understanding of
how respondents within your organization plan to intervene as well as how they have intervened in the past. Set
the expectation that your people must look out for each other, both on and off the battlefield. Encourage safely
stepping in to de-escalate the situation when someone looks to be at risk for sexual assault or about to perpetrate
a crime. Employ training that relies on scenarios to demonstrate application of bystander prevention concepts and
drive small group discussions.
If yes, in response to this situation, select the response that most closely resembles your actions:

ADMIN#: 168xxxx Defense Equal Opportunity Management Institute
FOR OFFICIAL USE ONLY
48
Use Unit Prevention Climate index displayed by demographic subgroups to identify any differences between
groups. Consider holding sensing sessions/focus groups with several members of these demographic subgroups
to understand any differences in responses in your unit’s results. Incorporate feedback from these sessions to
help develop a plan of action for leadership to increase bystander intervention within your organization.
Here are additional recommendations and information to consider when developing your plan of action:
Promote bystander intervention by “practicing what you preach.” Be an active bystander by calling out
sexist remarks and sexually harassing behaviors if they are observed. When appropriate, demonstrate
acceptable alternative behaviors as part of the corrective process. This will help provide the motivation
and confidence necessary for members within your organization to act.
It takes some practice and courage to intervene and discourage or stop unacceptable behavior. Teach
bystander intervention strategies to motivate and empower your people to watch for questionable
behavior or risky choices, take safe action to de-escalate situations, and help ensure personal safety. One
approach involves emphasizing the “ABCs” of Bystander Intervention:
.
Assess for safety. Ensure that all parties are safe, and whether the situation requires calling
authorities. When deciding to intervene, your personal safety should be the #1 priority. When in
doubt, call for help.
Be with others. If it is safe to intervene, you are likely to have a greater influence on the parties
involved when you work together with someone or several people. Your safety is increased when
you stay with a group of friends that you know well.
Care for the person. Ask if the target of the unwanted sexual advance, attention, or behavior is okay.
Does he or she need medical care? Does he or she want to talk to a Victim Advocate about reporting
the matter? Ask if someone they trust can help them get home safely.
Encourage your members to be receptive to messages from others indicating their behavior is not
acceptable.
Recognizing the rewarding positive personnel behavior can also be an effective strategy to increase and
reinforce appropriate bystander behavior.
.
o
o
.
.
Additional Resources:
Visit www.sapr.mil for Active Bystander Training material.
o

Restricted Reporting Knowledge
Knowledge of the Restricted Reporting option is assessed with one question. The item reads, “All of the
following people can receive an Unrestricted Report of sexual assault. However, a Restricted (confidential)
Report can only be made to certain people. Please identify which of the following types of people can and
cannot take a Restricted Report.” The Sexual Assault Response Coordinator, Victim Advocate, and Military
Service Healthcare Personnel (see footnote below table) can take a Restricted Report. “Anyone in my chain of
command” and “Criminal investigator and Military Police Officer” are incorrect answers. These persons cannot
take a Restricted Report. Table 9 displays the percentage of members within your organization who correctly
and incorrectly identified who can and cannot take a Restricted Report.
Table 9. Respondents’ Restricted Reporting Knowledge
Identify which of following types of people
can and cannot take a Restricted Report:
Correct Incorrect Total
Number Percent Number Percent Number Percent
Sexual Assault Response Coordinator 88.61 11.39 871 112 983 100.00
Victim Advocate 70.60 29.40 694 289 983 100.00
Military Service Healthcare Personnel 81.28 18.72 799 184 983 100.00
Anyone in my chain of command 74.87 25.13 736 247 983 100.00
Criminal investigator and Military Police
Officer 44.15 55.85 434 549 983 100.00
Footnote: Laws vary from state to state regarding the authority of Military Service Healthcare Personnel
to receive Restricted Reports. Therefore, the response options for “Military Service Healthcare
Personnel” reads “Yes, can take a Restricted Report (assuming state law permits)” and “No, cannot take
a Restricted Report in any state.” Please check with your local Sexual Assault Response Coordinator for
more information on local state laws to verify if sexual assault victims who seek medical care or sexual
assault forensic exams can make a Restricted Report to health care providers.
ADMIN#: 168xxxx Defense Equal Opportunity Management Institute
FOR OFFICIAL USE ONLY
49

The Department of Defense is committed to ensuring victims of sexual assault are protected; treated with
dignity and respect; and provided support, advocacy, and care. The DoD also strongly supports applicable
law enforcement and criminal justice procedures that enable persons to be held accountable for sexual
assault offenses and criminal dispositions, as appropriate. To achieve these dual objectives, the
Department’s preference is for complete Unrestricted Reporting of sexual assaults to allow for the provision
of victims’ services and to pursue accountability. However, Unrestricted Reporting may represent a barrier
for victims to access services, when the victim desires no command or law enforcement involvement.
Consequently, the DoD recognizes a fundamental need to provide a confidential disclosure vehicle via the
Restricted Reporting option.
Recommendations:
Figure 20. Respondents’ Restricted Reporting Knowledge by Demographic Subgroups
Figure 20 displays the average percentage of members who responded correctly, displayed by demographic
subgroup, on the Restricted Reporting Knowledge question. The question is scored by averaging the
percentage correct across the five response options of the types of people who can and cannot take a
Restricted Report. In cases where fewer than five people in a subgroup complete the survey, you will not
receive any data for that subgroup in order to maintain respondent anonymity; that group's data will be
marked with 0.00.
Analyzing Responses based on Demographic Subgroups:
Men
Women
Jr. Enlisted
Service 76.58 %
Organization 71.90 %
Sr. Civilian 67.05 %
66.41 %Jr. Civilian
Sr. Officer
Jr. Officer
Sr. Enlisted
85.52 %
85.65 %
82.64 %
76.60 %
69.19 %
74.95 %
ADMIN#: 168xxxx Defense Equal Opportunity Management Institute
FOR OFFICIAL USE ONLY
50

Additional Resources:
Visit www.sapr.mil for SAPR training material, webcasts, research, DoD regulations and policies, and more.
Periodically take the opportunity to remind everyone of how to make an Unrestricted or Restricted
Report. Be sure to include how to contact the Sexual Assault Response Coordinator (SARC) and
Victim Advocate (VA) that service your unit or the installation.
Emphasize that command has a legal responsibility to follow up on all allegations of sexual assault.
Individuals desiring a Restricted Report should contact a SARC, VA, or medical/mental health care
provider.
Publicize that victims of sexual assault may now have an attorney represent them during the military
justice process. These attorneys are assigned at the victim’s request, regardless of whether a victim
makes either a Restricted or Unrestricted Report. SARCs connect victims with these specialized
attorneys.
Training is an important element in sexual assault prevention and response. Provide annual
training and encourage members to take this training seriously. A short slide-based training once a
year is NOT sufficient to make a lasting impression on your personnel - mostly because none of them
expect to become a victim of sexual assault. Contact your servicing SARC for more meaningful and
impactful training formats and opportunities.
Incorporate specific sexual assault prevention and response monitoring, measures and education into
normal command training, readiness, and safety forums (e.g., quarterly training guidance, unit status
reports, and safety briefings).
Discuss your unit’s DEOCS results with your installation’s SARC and request that he/she conduct
additional training or speak at commanders’ calls.
.
.
.
.
.
.
A Restricted Report allows victims to experience the services and support available to them and receive
information about the investigative and military justice process in a means that preserves their
confidentiality. Every year, a percentage of victims convert from a Restricted Report to an Unrestricted
Report to participate in the justice process. As a result, the Department makes available the Restricted
Reporting as a means for victims to become knowledgeable about their legal options. As of January 2014,
all Services have specially-trained attorneys to represent victims of sexual assault, regardless of which
reporting option is selected. This ability to confer confidentially with an attorney about their case may also
encourage more victims to participate in the military justice system.
The Restricted Reporting Knowledge score can provide insight into members’ knowledge of the reporting
options of sexual assault. Use the correct and incorrect responses as a guide for developing a plan of action
to increase awareness and knowledge of the reporting options. Use the responses displayed by demographic
subgroup to identify any differences between groups. Use this information to enhance the education and
training of your personnel.
Here are additional recommendations and information to consider when developing your plan of action:
ADMIN#: 168xxxx Defense Equal Opportunity Management Institute
FOR OFFICIAL USE ONLY
51

Sexual Assault Prevention and Response Climate Overview
The following chart provides a demographic summary of the SAPR Climate variables. Results display above
average, average, and below average using a green, blue, and red coding scheme, respectively. Above average
indicates that the perceptions of your members are markedly more favorable than the perceptions commonly
held across your Service. Average indicates that the perceptions of your members are similar to that of the
perceptions commonly held across your Service. Below average indicates that the perceptions of your members
are markedly less favorable than those held across your Service. In cases where fewer than five people in a
subgroup complete the survey, you will not receive any data for that subgroup; this helps maintain respondent
anonymity.
V. CLIMATE FACTOR SUBGROUP COMPARISONS
Perceptions
of
Safety
Chain of
Command
Support
Publicity of
SAPR
Information
Unit
Reporting
Climate
Zero Perceived
Barriers
to Reporting
Unit
Prevention
Climate
Restricted
Reporting
Knowledge
Minority
Majority
3.69
3.77
3.51
3.53
2.92
2.88
3.53
3.62
34.48
37.56
3.54
3.63
69.18
74.11
Women
Men
3.64
3.81
3.43
3.54
2.84
2.93
3.48
3.63
31.15
39.09
3.55
3.62
69.19
74.95
Officer
Enlisted
3.83
3.82
3.60
3.63
2.93
3.12
3.75
3.63
39.10
32.98
3.70
3.64
85.56
79.48
Junior Enlisted
Senior Enlisted
3.82
3.82
3.56
3.70
3.08
3.16
3.54
3.72
30.00
36.26
3.65
3.62
76.60
82.64
Junior Officer
Senior Officer
3.91
3.79
3.62
3.60
2.97
2.90
3.72
3.76
36.96
40.23
3.65
3.73
85.65
85.52
Military
Civilian
3.83
3.66
3.62
3.42
3.04
2.80
3.68
3.49
35.49
34.74
3.66
3.54
81.98
66.92
Junior Civilian
Senior Civilian
3.62
3.67
3.39
3.43
2.78
2.81
3.45
3.50
29.69
36.01
3.44
3.56
66.41
67.05
Defense Equal Opportunity Management Institute
FOR OFFICIAL USE ONLY
ADMIN#: 52
Blue = Near Service Average Green = Above Service AverageRed = Below Service Average
168xxxx
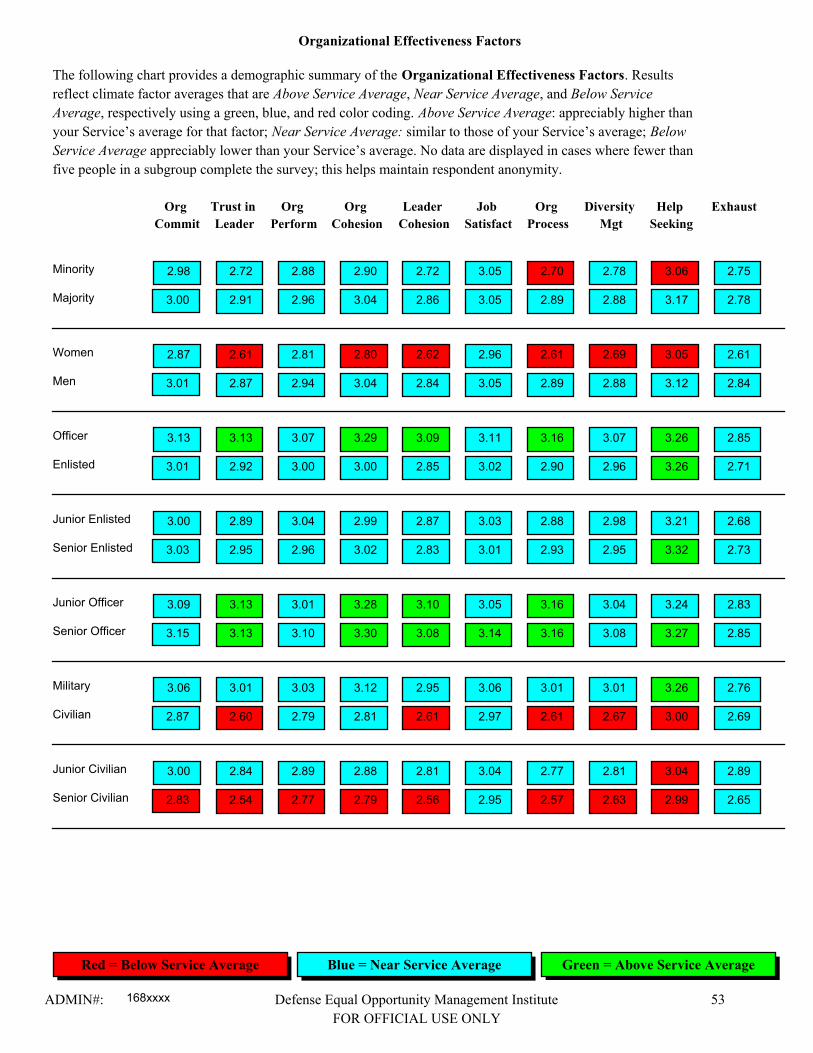
Organizational Effectiveness Factors
The following chart provides a demographic summary of the Organizational Effectiveness Factors. Results
reflect climate factor averages that are Above Service Average, Near Service Average, and Below Service
Average, respectively using a green, blue, and red color coding. Above Service Average: appreciably higher than
your Service’s average for that factor; Near Service Average: similar to those of your Service’s average; Below
Service Average appreciably lower than your Service’s average. No data are displayed in cases where fewer than
five people in a subgroup complete the survey; this helps maintain respondent anonymity.
Org
Commit
Trust in
Leader
Org
Perform
Org
Cohesion
Leader
Cohesion
Job
Satisfact
Org
Process
Diversity
Mgt
Help
Seeking
Exhaust
Minority
Majority
2.98
3.00
2.72
2.91
2.88
2.96
2.90
3.04
2.72
2.86
3.05
3.05
2.70
2.89
2.78
2.88
3.06
3.17
2.75
2.78
Women
Men
2.87
3.01
2.61
2.87
2.81
2.94
2.80
3.04
2.62
2.84
2.96
3.05
2.61
2.89
2.69
2.88
3.05
3.12
2.61
2.84
Officer
Enlisted
3.13
3.01
3.13
2.92
3.07
3.00
3.29
3.00
3.09
2.85
3.11
3.02
3.16
2.90
3.07
2.96
3.26
3.26
2.85
2.71
Junior Enlisted
Senior Enlisted
3.00
3.03
2.89
2.95
3.04
2.96
2.99
3.02
2.87
2.83
3.03
3.01
2.88
2.93
2.98
2.95
3.21
3.32
2.68
2.73
Junior Officer
Senior Officer
3.09
3.15
3.13
3.13
3.01
3.10
3.28
3.30
3.10
3.08
3.05
3.14
3.16
3.16
3.04
3.08
3.24
3.27
2.83
2.85
Military
Civilian
3.06
2.87
3.01
2.60
3.03
2.79
3.12
2.81
2.95
2.61
3.06
2.97
3.01
2.61
3.01
2.67
3.26
3.00
2.76
2.69
Junior Civilian
Senior Civilian
3.00
2.83
2.84
2.54
2.89
2.77
2.88
2.79
2.81
2.56
3.04
2.95
2.77
2.57
2.81
2.63
3.04
2.99
2.89
2.65
Defense Equal Opportunity Management Institute
FOR OFFICIAL USE ONLY
ADMIN#: 53
Blue = Near Service Average Green = Above Service AverageRed = Below Service Average
168xxxx

Equal Opportunity / Equal Employment Opportunity / Fair Treatment Factors
The following chart provides a demographic summary of the EO/EEO, Fair Treatment Factors. Results
reflect climate factor averages that are Above Service Average, Near Service Average, and Below Service
Average, respectively using a green, blue, and red color coding. Above Service Average: appreciably higher than
your Service’s average for that factor; Near Service Average: similar to those of your Service’s average; Below
Service Average appreciably lower than your Service’s average. No data are displayed in cases where fewer than
five people in a subgroup complete the survey; this helps maintain respondent anonymity.
Sexist
Behavior
Sexual
Harass
Sex
Discrim
Racist
Behavior
Disabil
Discrim
Racial
Discrim
Age
Discrim
Religious
Discrim
Demean
Behavior
Hazing
Behavior
Minority
Majority
3.27
3.38
3.28
3.35
3.20
3.38
3.32
3.46
3.16
3.25
3.11
3.37
3.06
3.17
3.30
3.43
3.15
3.33
3.47
3.59
Women
Men
3.24
3.39
3.23
3.36
3.17
3.32
3.28
3.47
3.16
3.18
3.12
3.27
3.01
3.11
3.28
3.41
3.12
3.31
3.49
3.55
Officer
Enlisted
3.61
3.44
3.52
3.46
3.58
3.41
3.68
3.47
0.00
0.00
3.56
3.36
0.00
0.00
3.58
3.46
3.57
3.31
3.74
3.60
Junior Enlisted
Senior Enlisted
3.41
3.47
3.43
3.50
3.39
3.42
3.46
3.49
0.00
0.00
3.33
3.40
0.00
0.00
3.43
3.49
3.20
3.44
3.52
3.69
Junior Officer
Senior Officer
3.62
3.60
3.53
3.52
3.63
3.56
3.72
3.66
0.00
0.00
3.62
3.52
0.00
0.00
3.61
3.56
3.60
3.56
3.78
3.72
Military
Civilian
3.51
3.22
3.49
3.20
3.48
3.13
3.56
3.28
0.00
3.17
3.44
3.07
0.00
3.05
3.51
3.26
3.42
3.10
3.66
3.45
Junior Civilian
Senior Civilian
3.26
3.21
3.21
3.20
3.24
3.10
3.35
3.26
3.28
3.14
3.22
3.03
3.15
3.03
3.37
3.23
3.17
3.09
3.45
3.45
Defense Equal Opportunity Management Institute
FOR OFFICIAL USE ONLY
ADMIN#: 54
Blue = Near Service Average Green = Above Service AverageRed = Below Service Average
168xxxx

VI. OVERALL UNIT SUMMARYThe figures below compare your organization’s average for each climate factor against your Service’s average.
The box to the right of each figure containing your organization’s average will be color-coded blue, red, or
green. Blue indicates your organization’s average falls within the Range of “Near Service Average” values
shown below each figure. Unit averages below this range are color coded red, while averages above this range
are color coded green. Service averages are recalculated on a fiscal year semi-annual basis.
Organizational Commitment
2.93
3.01
Your Unit
Your Service
2.83 3.20-Range of “Near Service” Average =
Trust in Leadership
2.74
2.87
Your Unit
Your Service
2.66 3.09-Range of “Near Service” Average =
Organizational Performance
2.87
2.93
Your Unit
Your Service
2.78 3.10-Range of “Near Service” Average =
Organizational Cohesion
2.91
2.97
Your Unit
Your Service
2.80 3.13-Range of “Near Service” Average =
Leadership Cohesion
2.72
2.84
Your Unit
Your Service
2.65 3.06-Range of “Near Service” Average =
Job Satisfaction
3.00
2.96
Your Unit
Your Service
2.80 3.13-Range of “Near Service” Average =
ADMIN#: 168xxxx Defense Equal Opportunity Management Institute
FOR OFFICIAL USE ONLY
55
Green = Above Service AverageRed = Below Service Average Blue = Near Service Average

Organizational Processes
2.74
2.88
Your Unit
Your Service
2.73 3.05-Range of “Near Service” Average =
Diversity Management
2.78
2.92
Your Unit
Your Service
2.76 3.08-Range of “Near Service” Average =
Help Seeking Behaviors
3.08
3.15
Your Unit
Your Service
3.06 3.25-Range of “Near Service” Average =
Exhaustion
2.71
2.75
Your Unit
Your Service
2.59 2.92-Range of “Near Service” Average =
Sexist Behaviors
3.31
3.26
Your Unit
Your Service
3.13 3.39-Range of “Near Service” Average =
Sexual Harassment
3.29
3.36
Your Unit
Your Service
3.25 3.47-Range of “Near Service” Average =
Sex Discrimination
3.24
3.33
Your Unit
Your Service
3.20 3.47-Range of “Near Service” Average =
ADMIN#: 168xxxx Defense Equal Opportunity Management Institute
FOR OFFICIAL USE ONLY
56
Green = Above Service AverageRed = Below Service Average Blue = Near Service Average
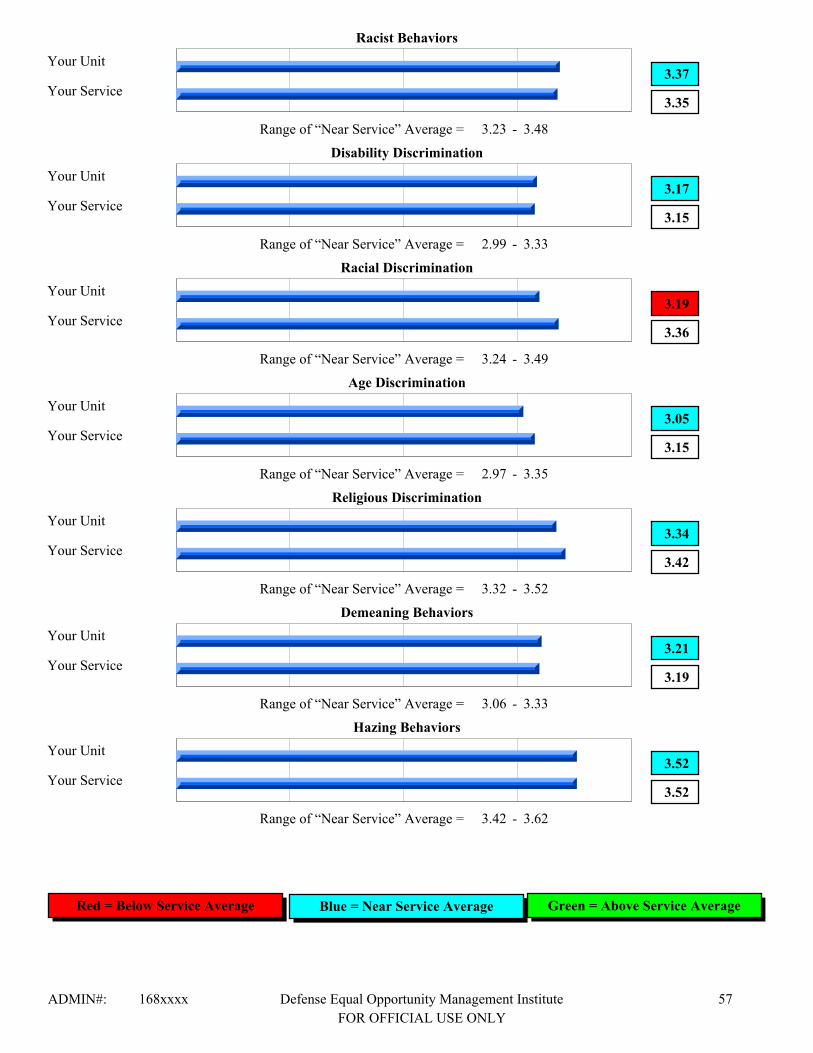
Racist Behaviors
3.37
3.35
Your Unit
Your Service
3.23 3.48-Range of “Near Service” Average =
Disability Discrimination
3.17
3.15
Your Unit
Your Service
2.99 3.33-Range of “Near Service” Average =
Racial Discrimination
3.19
3.36
Your Unit
Your Service
3.24 3.49-Range of “Near Service” Average =
Age Discrimination
3.05
3.15
Your Unit
Your Service
2.97 3.35-Range of “Near Service” Average =
Religious Discrimination
3.34
3.42
Your Unit
Your Service
3.32 3.52-Range of “Near Service” Average =
Demeaning Behaviors
3.21
3.19
Your Unit
Your Service
3.06 3.33-Range of “Near Service” Average =
Hazing Behaviors
3.52
3.52
Your Unit
Your Service
3.42 3.62-Range of “Near Service” Average =
ADMIN#: 168xxxx Defense Equal Opportunity Management Institute
FOR OFFICIAL USE ONLY
57
Green = Above Service AverageRed = Below Service Average Blue = Near Service Average

VII. DEOCS SUMMARY OF SURVEY ITEM RESULTS
QuestionFavorable Unfavorable Total
Number Percent Number Percent Number Percent
Organizational Commitment
I feel motivated to give my best efforts to the
mission of my organization. 84.13 15.87 827 156 983 100.00
I feel a strong sense of belonging to this
organization. 65.62 34.38 645 338 983 100.00
I am proud to tell others that I belong to this
organization. 75.69 24.31 744 239 983 100.00
Overall Average 75.14 24.86 2,216 733 2,949 100.00
Unfavorable
Favorable 75.14
24.86
ADMIN#: 168xxxx Defense Equal Opportunity Management Institute
FOR OFFICIAL USE ONLY
58
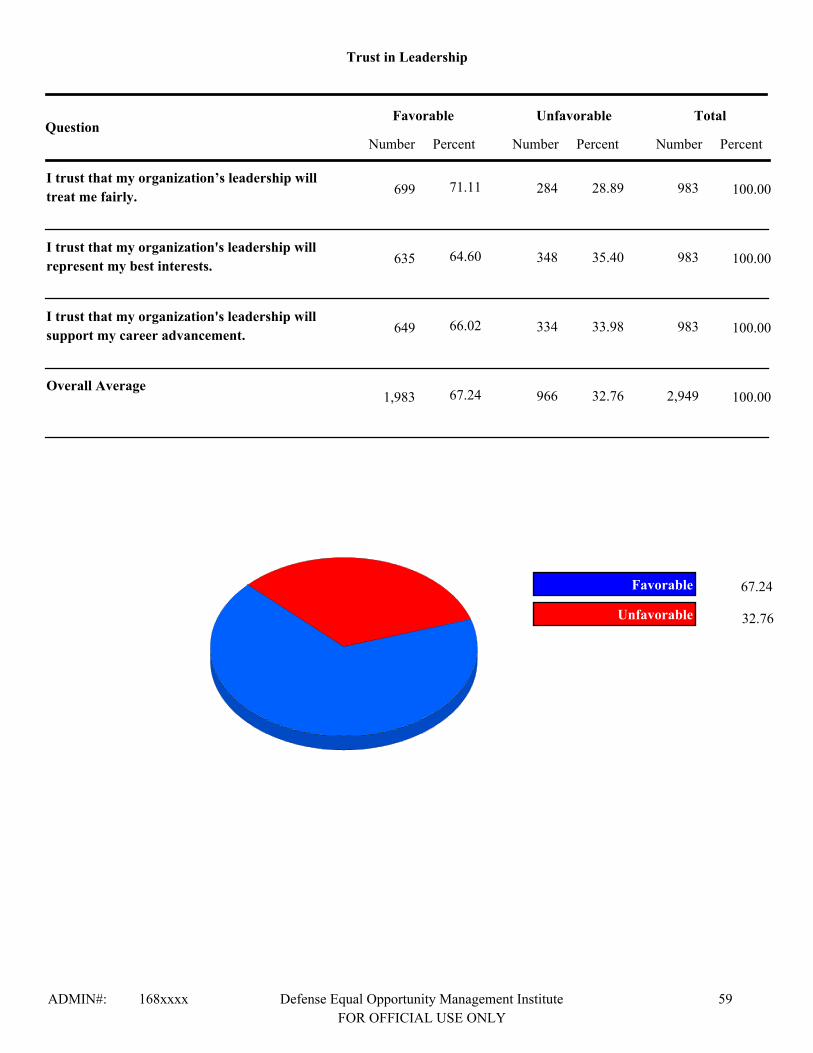
Question
Trust in Leadership
Favorable Unfavorable Total
Number Percent Number Percent Number Percent
I trust that my organization’s leadership will
treat me fairly. 71.11 28.89 699 284 983 100.00
I trust that my organization's leadership will
represent my best interests. 64.60 35.40 635 348 983 100.00
I trust that my organization's leadership will
support my career advancement. 66.02 33.98 649 334 983 100.00
Overall Average 67.24 32.76 1,983 966 2,949 100.00
Unfavorable
Favorable 67.24
32.76
ADMIN#: 168xxxx Defense Equal Opportunity Management Institute
FOR OFFICIAL USE ONLY
59

Question
Organizational Performance
Favorable Unfavorable Total
Number Percent Number Percent Number Percent
When short suspense/tasks arise, people in my
organization do an outstanding job in handling
these situations.
81.99 18.01 806 177 983 100.00
My organization's performance, compared to
similar organizations, is high. 76.20 23.80 749 234 983 100.00
My organization makes good use of available
resources to accomplish its mission. 74.26 25.74 730 253 983 100.00
All members of my organization make valuable
contributions to completing tasks. 67.55 32.45 664 319 983 100.00
Overall 75.00 25.00 2,949 983 3,932 100.00
Unfavorable
Favorable 75.00
25.00
ADMIN#: 168xxxx Defense Equal Opportunity Management Institute
FOR OFFICIAL USE ONLY
60

Question
Organizational Cohesion
Favorable Unfavorable Total
Number Percent Number Percent Number Percent
Members trust each other. 64.50 35.50 634 349 983 100.00
Members support each other to get the job done. 81.99 18.01 806 177 983 100.00
Members work well together as a team. 79.04 20.96 777 206 983 100.00
Members look out for each other's welfare. 82.30 17.70 809 174 983 100.00
Overall 76.96 23.04 3,026 906 3,932 100.00
Unfavorable
Favorable 76.96
23.04
ADMIN#: 168xxxx Defense Equal Opportunity Management Institute
FOR OFFICIAL USE ONLY
61

Question
Leadership Cohesion
Favorable Unfavorable Total
Number Percent Number Percent Number Percent
Leaders in my organization work well together
as a team. 68.46 31.54 673 310 983 100.00
Leaders in my organization communicate well
with each other. 59.82 40.18 588 395 983 100.00
Leaders in my organization support each other
to get the job done. 75.28 24.72 740 243 983 100.00
Leaders in my organization are consistent in
enforcing policies. 65.41 34.59 643 340 983 100.00
Overall 67.24 32.76 2,644 1,288 3,932 100.00
Unfavorable
Favorable 67.24
32.76
ADMIN#: 168xxxx Defense Equal Opportunity Management Institute
FOR OFFICIAL USE ONLY
62

Question
Job Satisfaction
Favorable Unfavorable Total
Number Percent Number Percent Number Percent
I like my job. 85.05 14.95 836 147 983 100.00
Most days I am enthusiastic about my work. 77.92 22.08 766 217 983 100.00
I feel satisfied with my present job. 75.99 24.01 747 236 983 100.00
I find real enjoyment in my work. 73.75 26.25 725 258 983 100.00
Overall 78.18 21.82 3,074 858 3,932 100.00
Unfavorable
Favorable 78.18
21.82
ADMIN#: 168xxxx Defense Equal Opportunity Management Institute
FOR OFFICIAL USE ONLY
63

Question
Diversity Management
Favorable Unfavorable Total
Number Percent Number Percent Number Percent
Members are encouraged to perform to their
fullest potential, regardless of their background. 82.10 17.90 807 176 983 100.00
Members have access to a mentoring program. 62.36 37.64 613 370 983 100.00
Members' skills and other attributes are taken
into account when assigning tasks. 65.31 34.69 642 341 983 100.00
Efforts are made to make everyone feel like part
of the team. 69.28 30.72 681 302 983 100.00
Overall 69.76 30.24 2,743 1,189 3,932 100.00
Unfavorable
Favorable 69.76
30.24
ADMIN#: 168xxxx Defense Equal Opportunity Management Institute
FOR OFFICIAL USE ONLY
64

Question
Organizational Processes
Favorable Unfavorable Total
Number Percent Number Percent Number Percent
Discipline is administered fairly. 72.74 27.26 715 268 983 100.00
Programs are in place to address members’
concerns. 67.65 32.35 665 318 983 100.00
Decisions are made after reviewing relevant
information. 70.91 29.09 697 286 983 100.00
Relevant job information is shared among
members. 63.99 36.01 629 354 983 100.00
Personnel are accountable for their behavior. 68.16 31.84 670 313 983 100.00
Overall 68.69 31.31 3,376 1,539 4,915 100.00
Unfavorable
Favorable 68.69
31.31
ADMIN#: 168xxxx Defense Equal Opportunity Management Institute
FOR OFFICIAL USE ONLY
65

What best describes your career intentions?
PercentFrequency
100.00Total
Definitely leave after completion of current obligation.
Probably leave after current obligation.
Stay next several years.
Probably stay.
Definitely stay.
N/A.
ADMIN#: 168xxxx Defense Equal Opportunity Management Institute
FOR OFFICIAL USE ONLY
66
480
212
63
76
81
71
48.83
21.57
6.41
7.73
8.24
7.22
983

Question
Help Seeking Behaviors
Favorable Unfavorable Total
Number Percent Number Percent Number Percent
Members are well trained to recognize the
signs of depression, suicidal thoughts, or Post
Traumatic Stress Disorder (PTSD).
74.67 25.33 734 249 983 100.00
Seeking help for depression, suicidal thoughts,
or Post Traumatic Stress Disorder (PTSD) is a
sign of strength.
94.51 5.49 929 54 983 100.00
Seeking help for depression, suicidal thoughts,
or Post Traumatic Stress Disorder (PTSD)
would negatively impact a member’s career.
79.04 20.96 777 206 983 100.00
Overall 82.74 17.26 2,440 509 2,949 100.00
Unfavorable
Favorable 82.74
17.26
ADMIN#: 168xxxx Defense Equal Opportunity Management Institute
FOR OFFICIAL USE ONLY
67

Question
Exhaustion
Number Percent Number Percent Number Percent
Favorable Unfavorable Total
I feel mentally worn out. 58.29 41.71 573 410 983 100.00
I feel physically worn out. 70.50 29.50 693 290 983 100.00
I feel emotionally worn out. 68.46 31.54 673 310 983 100.00
Overall 65.75 34.25 1,939 1,010 2,949 100.00
Unfavorable
Favorable 65.75
34.25
ADMIN#: 168xxxx Defense Equal Opportunity Management Institute
FOR OFFICIAL USE ONLY
68

Question
Hazing Behaviors
Number Percent Number Percent Number Percent
Favorable Unfavorable Total
Newcomers in this organization are pressured to
engage in potentially harmful activities that are
not related to the mission.
95.52 4.48 939 44 983 100.00
Newcomers are harassed and humiliated prior to
being accepted into the organization. 95.32 4.68 937 46 983 100.00
To be accepted in this organization, members
must participate in potentially dangerous
activities that are not related to the mission.
96.13 3.87 945 38 983 100.00
Overall Average 95.66 4.34 2,821 128 2,949 100.00
Unfavorable
Favorable 95.66
4.34
ADMIN#: 168xxxx Defense Equal Opportunity Management Institute
FOR OFFICIAL USE ONLY
69

Question
Demeaning Behaviors
Favorable Unfavorable Total
Number Percent Number Percent Number Percent
Certain members are purposely excluded from
social work group activities. 84.23 15.77 828 155 983 100.00
Certain members are frequently reminded of
small errors or mistakes they have made, in an
effort to belittle them.
79.86 20.14 785 198 983 100.00
Certain members are excessively teased to the
point where they are unable to defend
themselves.
93.79 6.21 922 61 983 100.00
Overall 85.96 14.04 2,535 414 2,949 100.00
Unfavorable
Favorable 85.96
14.04
ADMIN#: 168xxxx Defense Equal Opportunity Management Institute
FOR OFFICIAL USE ONLY
70

In what way or ways do you perceive favoritism is being displayed?
PercentFrequency
100.00Total
Do not know
Personal relationships
Performance report ratings
Job opportunities
Race/sex/national origin difference
Other
ADMIN#: 168xxxx Defense Equal Opportunity Management Institute
FOR OFFICIAL USE ONLY
71
22
123
34
142
6
39
6.01
33.61
9.29
38.80
1.64
10.66
366

Question
Racial Discrimination
Favorable Unfavorable Total
Number Percent Number Percent Number Percent
Qualified personnel of all races/ethnicities can
expect similar job assignments. 84.44 15.56 830 153 983 100.00
People of all races/ethnicities can expect to be
treated with the same level of professionalism. 89.73 10.27 882 101 983 100.00
Qualified personnel of all races/ethnicities can
expect the same training opportunities. 92.17 7.83 906 77 983 100.00
Overall 88.78 11.22 2,618 331 2,949 100.00
Unfavorable
Favorable 88.78
11.22
ADMIN#: 168xxxx Defense Equal Opportunity Management Institute
FOR OFFICIAL USE ONLY
72

Question
Sex Discrimination
Favorable Unfavorable Total
Number Percent Number Percent Number Percent
Qualified members of both genders can expect to
be treated with the same level of professionalism. 90.74 9.26 892 91 983 100.00
Qualified members of both genders can expect
similar job assignments. 90.54 9.46 890 93 983 100.00
Qualified members of both genders can expect
the same training opportunities. 92.78 7.22 912 71 983 100.00
Overall 91.35 8.65 2,694 255 2,949 100.00
Unfavorable
Favorable 91.35
8.65
ADMIN#: 168xxxx Defense Equal Opportunity Management Institute
FOR OFFICIAL USE ONLY
73

Question
Religious Discrimination
Favorable Unfavorable Total
Number Percent Number Percent Number Percent
Qualified people of all religions can expect
similar job assignments. 96.13 3.87 945 38 983 100.00
Leaders do not publicly endorse a particular
religion. 94.40 5.60 928 55 983 100.00
Qualified personnel of all religions can expect
the same training opportunities. 97.36 2.64 957 26 983 100.00
Overall 95.96 4.04 2,830 119 2,949 100.00
Unfavorable
Favorable 95.96
4.04
ADMIN#: 168xxxx Defense Equal Opportunity Management Institute
FOR OFFICIAL USE ONLY
74

Question
Sexual Harassment
Favorable Unfavorable Total
Number Percent Number Percent Number Percent
Leaders play an active role in the prevention of
sexual harassment. 92.17 7.83 906 77 983 100.00
Leaders in my organization adequately respond
to allegations of sexual harassment. 96.13 3.87 945 38 983 100.00
Sexual harassment does not occur in my work
area. 95.02 4.98 934 49 983 100.00
Overall 94.44 5.56 2,785 164 2,949 100.00
Unfavorable
Favorable 94.44
5.56
ADMIN#: 168xxxx Defense Equal Opportunity Management Institute
FOR OFFICIAL USE ONLY
75

Question
Racist Behaviors
Favorable Unfavorable Total
Number Percent Number Percent Number Percent
Racial comments are not used in my work area. 93.90 6.10 923 60 983 100.00
Racial slurs are not used in my work area. 95.22 4.78 936 47 983 100.00
Racial jokes are not used in my work area. 94.30 5.70 927 56 983 100.00
Overall 94.47 5.53 2,786 163 2,949 100.00
Unfavorable
Favorable 94.47
5.53
ADMIN#: 168xxxx Defense Equal Opportunity Management Institute
FOR OFFICIAL USE ONLY
76

Question
Sexist Behaviors
Favorable Unfavorable Total
Number Percent Number Percent Number Percent
Sexist slurs are not used in my work area. 92.37 7.63 908 75 983 100.00
Sexist jokes are not used in my work area. 92.88 7.12 913 70 983 100.00
Sexist comments are not used in my work area. 93.59 6.41 920 63 983 100.00
Overall 92.95 7.05 2,741 208 2,949 100.00
Unfavorable
Favorable 92.95
7.05
ADMIN#: 168xxxx Defense Equal Opportunity Management Institute
FOR OFFICIAL USE ONLY
77

Question
Age Discrimination (Civilians only)
Favorable Unfavorable Total
Number Percent Number Percent Number Percent
Qualified personnel over 40 years old can expect
similar job assignments as younger personnel. 85.13 14.87 544 95 639 100.00
Qualified personnel over 40 years old can expect
the same training opportunities as younger
personnel.
84.19 15.81 538 101 639 100.00
Qualified personnel over 40 years old can expect
the same career enhancing opportunities as
younger personnel.
82.94 17.06 530 109 639 100.00
Overall 84.09 15.91 1,612 305 1,917 100.00
Unfavorable
Favorable 84.09
15.91
ADMIN#: 168xxxx Defense Equal Opportunity Management Institute
FOR OFFICIAL USE ONLY
78

Question
Disability Discrimination (Civilians only)
Favorable Unfavorable Total
Number Percent Number Percent Number Percent
Qualified personnel who are disabled can expect
similar job assignments as non-disabled
personnel.
91.39 8.61 584 55 639 100.00
Qualified personnel who are disabled can expect
the same training opportunities as non-disabled
personnel.
94.37 5.63 603 36 639 100.00
Qualified personnel who are disabled can expect
the same career enhancing opportunities as
non-disabled personnel.
92.64 7.36 592 47 639 100.00
Overall 92.80 7.20 1,779 138 1,917 100.00
Unfavorable
Favorable 92.80
7.20
ADMIN#: 168xxxx Defense Equal Opportunity Management Institute
FOR OFFICIAL USE ONLY
79

VIII. RECOMMENDATIONS
The following section provides interpretation and recommendations for the DEOCS report. Based on the data
obtained, the DEOCS results for your organization may vary between organizational strengths and concerns. It is
important to not only review section VII, DEOCS Summary, but to contrast that information with section V,
Climate Factor Subgroup Comparison. Appendix on Written Comments, may also help to validate some areas of
concerns within sections VII and V, please ensure you review that area to determine if there are comments that
speak directly to any areas of concern.
This section also seeks to provide guidance for additional steps in the climate assessment effort, and prescribe
actions to help address organizational concerns.
Share positive results with the organization’s members. Compare subgroups to determine whether diminished
perceptions of climate factors are prevalent among specific groups, and the sources of those perceptions.
Above Average/Average
Seek to identify-and reinforce-those practices and
programs currently in place.
Reinforce behaviors that create a climate of
inclusion, supporting and preserving the dignity and
worth of all members.
Continue to promote and maintain a healthy human
relations climate. This can be done by ensuring all
members in the unit understand their roles and
responsibilities.
Share positive results to enhance members’
commitment to the organization and its mission.
Consider utilizing training aids to further provide
awareness and knowledge regarding key factors.
Below Average
It is important to note that some or all of the three
lowest averages may actually be comparable to your
respective Service averages, and not necessarily
represent a negative finding. If any of these averages
appear appreciably lower than your Service average,
they should be treated as an organizational concern.
In cases where low averages, compare the
demographic subgroups to determine whether
diminished perceptions are more obvious among
specific groups.
After identifying the specific climate factors with
low averages and those demographic subgroups that
harbor negative perceptions regarding them, use
these findings to plan follow-on assessment efforts,
including focus groups, interviews, and written
record reviews. Conducting focus groups and
interviews can help determine the source and extent
of specific perceptions.
Develop an action plan and socialize the plan with
members. Set a timeline for the action items
designed to address each specific validated concern,
and provide timely feedback on progress
accomplishing them. This will demonstrate your
willingness to listen to your subordinates, and take
action to improve conditions when possible.
ADMIN#: 168xxxx Defense Equal Opportunity Management Institute
FOR OFFICIAL USE ONLY
80

We trust these recommendations for interpretation will prove useful. DEOMI believes the DEOCS can help
commanders improve the readiness within their commands. To make best use of this tool, DEOMI provides
tools and products designed to address the mission impacting issues that were identified during the climate
assessment process.
ASSESSMENT TO SOLUTIONS
The Assessment to Solutions area of deomi.org is designed to support leaders and equal opportunity
professionals by providing tools and products designed to address the mission-impacting issues identified
during the climate assessment process. Assessment to Solutions has products and training material to help
organizations overcome negative perceptions; these can also aid in the development of an action plan. The
Assessment to Solutions area is broken down into the main assessment areas of the DEOCS, which are
EO/EEO/Fair treatment, Organizational Effectiveness and Sexual Assault Prevention and Response. Each
area is further broken down by the factors included in these main areas of the Climate Assessment, and a
host of products are provided to assist in overcoming negative perceptions at an organization.
Access to products can be found at the “Assessment to Solutions” website which is designed to support
leaders and equal opportunity professionals. To access the site go to:
http://www.deomi.org/DRN/AssessToSolutions/index.html
The DEOCS Support Team is available to assist you and can be contacted at:
321-494-2675/3260/4217
DSN: 854-2675/3260/4217
ADMIN#: 168xxxx Defense Equal Opportunity Management Institute
FOR OFFICIAL USE ONLY
81

If someone failed to respond to a question, or if for any other reason the computer could not interpret the
response, it was not counted.
Appendix A: Your Locally Developed Questions
Total
Strongly Disagree
Disagree
Strongly Agree
Agree
54 5.5
47 4.8
421 42.8
461 46.9
Frequency Percent
983 100.0
My supervisor ensures we have a workplace that does not engage in nor tolerate unlawful
discrimination or harassment.
1.
Total
Strongly Disagree
Disagree
Strongly Agree
Agree
64 6.5
110 11.2
423 43.0
386 39.3
Frequency Percent
983 100.0
An atmosphere of respect exists in my work area.2.
Total
Strongly Disagree
Disagree
Strongly Agree
Agree
77 7.8
183 18.6
498 50.7
225 22.9
Frequency Percent
983 100.0
I believe men and women work together as a team.3.
Defense Equal Opportunity Management Institute
FOR OFFICIAL USE ONLY
82ADMIN#: 168xxxx

Total
Strongly Disagree
Disagree
Strongly Agree
Agree
90 9.2
179 18.2
463 47.1
251 25.5
Frequency Percent
983 100.0
I am encouraged to think of new ways to accomplish our mission.4.
Total
Strongly Disagree
Disagree
Strongly Agree
Agree
81 8.2
171 17.4
447 45.5
284 28.9
Frequency Percent
983 100.0
I can raise concerns about issues that affect my job without fear of reprisal.5.
Total
Strongly Disagree
Disagree
Strongly Agree
Agree
80 8.1
170 17.3
493 50.2
240 24.4
Frequency Percent
983 100.0
The leaders in my Directorate deal effectively with adversity or conflict when it occurs.6.
Total
Strongly Disagree
Disagree
Strongly Agree
Agree
64 6.5
118 12.0
481 48.9
320 32.6
Frequency Percent
983 100.0
I like my job.7.
Defense Equal Opportunity Management Institute
FOR OFFICIAL USE ONLY
83ADMIN#: 168xxxx

Total
Strongly Disagree
Disagree
Strongly Agree
Agree
88 9.0
154 15.7
481 48.9
260 26.5
Frequency Percent
983 100.0
My job description accurately reflects the duties that I perform.8.
Total
Strongly Disagree
Disagree
Strongly Agree
Agree
26 2.6
53 5.4
592 60.2
312 31.7
Frequency Percent
983 100.0
When a customer is dissatisfied, I can usually correct the problem to their satisfaction.9.
Total
Strongly Disagree
Disagree
Strongly Agree
Agree
233 23.7
320 32.6
367 37.3
63 6.4
Frequency Percent
983 100.0
In the last 12 months, I have seen improvements in the organization's performance.10.
Defense Equal Opportunity Management Institute
FOR OFFICIAL USE ONLY
84ADMIN#: 168xxxx