denver immigrant community & … · ruby hill church or mosque, ... outreach and building...
TRANSCRIPT

DENVER IMMIGRANT COMMUNITY & NEIGHBORHOOD ASSESSMENT
February 2014
2
IMMIGRANT COMMUNITY & NEIGHBORHOOD ASSESSMENT
A Community that Welcomes, is a Community that Thrives
Letter from the Director
INTRODUCTION Background Data Sources Neighborhood Assets DENVER’S NEIGHBORHOODS
DENVER’S FOREIGN-BORN POPULATIONS Immigrants Refugees FOREIGN BORN RESIDENTS BY NEIGHBORHOOD LANGUAGES SPOKEN IN DENVER TOP IMMIGRANT NEIGHBORHOOD SNAPSHOTS Athmar Park Barnum East Colfax Elyria Swansea Mar Lee Montbello Ruby Hill Westwood GLOSSARY
ENDNOTES DETAILED CITY-WIDE MAP
3
4
6
8
10
12
20
21
22
CONTENTS
Think of a time when you felt truly
welcomed into a new or foreign environment… were you greeted by
positivity, did you feel you had opportunities to learn and ultimately a
place to contribute your ideas and values?
A welcoming community sees the economic, social and cultural potential
in giving the diversity of ideas, skills,
creativity and identity a place to grow. A common characteristic of Denver
residents is that we quickly develop deep personal connections to our
community. We identify with the neighborhood we grew up in, live in and
work in because they contain a bit of our personal history and journey. They
reflect back to us our roots, generations
old or recently planted. Immigrants are trying to plant the very same roots.
Denver is home to immigrants from six continents; they make up one-sixth
of our City population and speak over 140 languages and dialects. They look
for welcoming communities at their church or mosque, in their
neighborhood, apartment building and
workplace. Immigrants embody the American
entrepreneurial spirit, they are risk-takers, they are willing to try
whatever it takes to succeed, and they are willing to put in the work to get
there. We are working to support and
capitalize upon this energy and spirit to
make Denver a better city for all residents.
Jamie Torres HRCP Deputy Director and DOCS Director

3
INTRODUCTION AND BACKGROUND DENVER: A GLOBAL CITY Denver Mayor Michael B. Hancock’s vision for Denver includes fostering its identity as a globally competing city with inclusive government institutions and strong non-profit networks for foreign visitors and immigrant & refugee residents. Immigrant integration is an essential piece of Denver’s developmental goals. Integration requires that newcomers are woven into the social, economic, cultural, and political fabric of their new communities.1 This is a process in which both the immigrant and the receiving community share equal responsibility. Understanding where Denver’s foreign-born residents live, their countries of origin, languages spoken, and other key characteristics are vital to the City’s effort to build a more connected, collaborative and welcoming community. BUILDING A STRONGER ECONOMY Foreign-born residents contribute their skills, values, and culture to the community when they are effectively integrated into society. In return, integration requires that the community share its laws, customs, services and opportunities with its foreign born residents. An influx of immigrants into an economy has shown to positively affect the income rates of native-born individuals.2 Immigrants are far more likely to start new businesses, despite any language and cultural barriers they may face.3 Denver can benefit tremendously from the hard-working cultures that exist in immigrant populations. Supporting these individuals and families through immigrant integration proves beneficial for the City’s economy. THE PURPOSE OF THIS REPORT Understanding our foreign-born residents, the adversities they face, and the opportunities that they create for our city is vital to our overall effort to build a cohesive and more connected community. This report seeks to contribute to our understanding of our immigrant community members and to develop strategies for outreach and building bridges. DATA SOURCES The data in this report largely come from The Piton Foundation, the U.S. Census Bureau, U.S. Census Bureau’s American Community Survey (ACS), Denver Public Schools (DPS) and the Colorado Department of Public Health and Environment (CDPHE). NEIGHBORHOOD ASSETS For the purposes of this report we have mapped four indicators of neighborhood assets. The first are the immigrants themselves, indicated by the % of foreign born in a given neighborhood and census tract. The remaining three assets are schools, institutions of faith and nonprofits that serve or work directly with immigrant and refugee residents.

4
DENVER’S NEIGHBORHOODS
IMMIGRANT COMMUNITY & NEIGHBORHOOD ASSESSMENT
There are 75 unique neighborhoods in Denver. Depending on its size, a neighborhood may be divided into more than one “census tract.” A census tract is a small, relatively permanent subdivision of a county used to collect and tabulate U.S. Census data.4 Tract data is useful in seeing the differences that may exist within a neighborhood. While foreign-born individuals and families live across the city, some neighborhoods (and census tracts) have higher populations.

5
Foreign-Born Populations in Denver This report highlights the Denver neighborhoods with the highest populations of foreign born individuals, highest levels of non-English speakers, and the characteristics of these neighborhoods. The map below shows the density of Denver’s foreign-born populations by census tracts, with the darker shades of pink depicting higher percentages of foreign-born populations.

6
IMMIGRANT COMMUNITY & NEIGHBORHOOD ASSESSMENT
DENVER’S FOREIGN-BORN POPULATIONS Immigration in the United States has traditionally been localized to large metropolitan cities like Los Angeles, New York and Miami. But mid-size cities like Denver have emerged in the past two decades as highly desirable cities for both immigrants and refugees. Newcomers choose Denver as their home based on differing circumstances. Denver has been categorized as one of eight “re-emerging gateway cities” by the Brookings Institution.5 This identifier refers to metro areas that are entry points “absorbing a record number” of immigrants.6 Denver’s foreign-born populations arrive from a wide-array of countries. The U.S. Census Bureau estimates there are 97,358 individuals living in Denver who were born outside of the U.S.8 This is approximately 16% of Denver’s total population (604,356).9 The largest segment of foreign-born population in Denver (and the United States) arrive from Mexico, yet the chart below shows the great diversity of areas of origins for Denver’s foreign-born population. For the purposes of this report, foreign-born individuals are divided into two categories: refugees and non-refugee immigrants. The primary distinctions between these groups are the ways individuals arrive in Denver and the State, Federal, and City resources available to them upon arrival.
Immigrants The vast majority of Denver’s foreign-born population are non-refugee immigrants. Non-refugee immigrants are individuals who were not born in the U.S. and come to reside permanently or temporarily and who do not arrive via the refugee process. Immigrants come to Colorado for a variety of reasons including to join family, find economic opportunity, and build careers. Although they may not have refugee status, many immigrants are similarly escaping difficult situations in their home country. Non-refugee immigrants who are living in the U.S. with legal status are unable to apply for public benefits for the first five years of their residency.10
9%
18%
7%
1%
64%
1%
Denver's Foreign Born Populations: Areas of Origin7
Europe
Asia
Africa
Oceania
Latin America
North America

7
Refugees
A refugee is a person who has left their country of origin and is unable or unwilling to return due to a "well-founded fear of being persecuted for reasons of race, religion, nationality, membership in a particular social group, or political opinion, is outside the country of his nationality, and is unable to or, owing to such fear, is unwilling to avail himself of the protection of that country."11
Refugee resettlement is a planned process. Individuals apply to be resettled and through cooperation between the United Nations and resettlement countries, enter into a process that can take years, often decades, before resettlement actually takes place. The United States resettles more refugees from around the world than all other counties combined. In 2012, the U.S. resettled just over 58,000 refugees.12 In 2013, the U.S. resettled 69,730 refugees.13
In 2013, 2199 refugees, asylees and secondary migrants were resettled in Colorado.14 In 2012, 1,797 refugees were resettled in Colorado, the majority of whom were resettled in the Denver-metro area.15 The United States resettles refugees from different countries each year depending on changes in other countries’ political climates and the Presidential Determination set forth by the White House. The chart to the right shows where refugees in Colorado were resettled from in 2012. The Colorado State Department’s Colorado Refugee Service Program (CRSP) collaborates with some 130 non-governmental organizations across Colorado to assist with education, legal, citizenship, health, training, employment and financial services for resettled refugees. There are four Voluntary Agencies (refugee resettlement agencies) within Denver, along with countless partners. Upon arrival, resettlement agencies assist with all of the services necessary for get established in a new community including arrival at the airport, housing, home orientation, assistance enrolling children in school, connecting to local services, community orientation, medical screening, ESL classes, employment assistance and ongoing assistance. Refugees then have approximately 8 months of cash assistance and early employment and self-sufficiency is a goal of refugee resettlement.
16%
55%
2%
26%
1%
Resettled Refugees in CO: Areas of Origin (2012)16
South Asia
East Asia
Americas
Africa
Central Asia (Europe)

8
Foreign-Born Residents by Neighborhood
IMMIGRANT COMMUNITY & NEIGHBORHOOD ASSESSMENT
NEIGHBORHOOD Largest census tract %
neighborhood
average NEIGHBORHOOD
Largest census tract %
neighborhood
average NEIGHBORHOOD
Largest census tract %
neighborhood
average
Athmar Park 30% 28.5% Globeville 26% 26% Ruby Hill 33% 29%
Baker 13% 13% Goldsmith 17% 17% Skyland 6% 6%
Barnum 34% 34% Hale 11% 8% Sloans Lake 11% 6%
Barnum West 21% 21% Hampden 22% 18.25% South Park Hill 8% 7.5%
Bear Valley 29% 27.5% Hampden South 19% 13.3% Southmoor Park 8% 6%
Belcaro 9% 9% Harvey Park 24% 22.5% Speer 8% 6%
Berkley 5% 5% Harvey Park South 13% 13% Stapleton 8% 7.5%
Capitol Hill 8% 6.3% Highland 22% 13.5% Sun Valley 12% 12%
Chaffee Park 19% 19% Hilltop 11% 5.5% Sunnyside 22% 14.7%
Cheeseman Park 5% 4% Indian Creek 13% 13% Union Station 9% 9%
Cherry Creek 17% 17% Jefferson Park 26% 26% University 11% 9%
City Park 6% 6% Kennedy 37% 37% University Hills 15% 9%
City Park West 4% 3.5% Lincoln Park 13% 10.5% University Park 12% 11%
Clayton 18% 18% Lowry Field 12% 12% Valverde 16% 16%
Cole 30% 30% Mar Lee 32% 29% Villa Park 29% 25.5%
College View/South 31% 31% Marston 11% 8.5% Virginia Village 31% 22.5%
Congress Park 9% 6.7% Montbello 37% 33.8% Wash Park West 7% 5%
Cory-Merrill 6% 6% Montclair 6% 6% Washington Park 2% 1.5%
Country Club 5% 5% North Capitol hill 9% 7% Washington Virginia Vale 32% 17.7%
DIA 6% 6% North Park Hill 8% 8% Wellshire 6% 6%
East Colfax 36% 25.5% Northeast Park Hill 14% 14% West Colfax 31% 23%
Elyria Swansea 33% 33% Overland 9% 9% West Highland 6% 4%
Five Points 10% 8% Platt Park 5% 5% Westwood 47% 36%
Fort Logan 12% 9.7% Regis 6% 6% Whittier 7% 7%
Gateway GVR 28% 22% Rosedale 7% 4% Windsor 32% 22.7%
The Brookings Institute has categorized Denver as one of nine re-emerging gateway cities for immigrants.17 Alongside Minneapolis-St.Paul, Oakland, Phoenix, Portland, Sacramento, San Jose, Seattle, and Tampa, Denver is absorbing a record number of immigrants each year.18 The figure below shows the percentage of immigrants in each of Denver’s neighborhoods and census tracts. It is important to note that immigrants live in every neighborhood in Denver.

9
NEIGHBORHOOD Largest census tract %
neighborhood average
Kennedy 37% 37%
Westwood 47% 36%
Barnum 34% 34%
Montbello 37% 33.8%
Elyria Swansea 33% 33%
College View/South Platte 31% 31%
Cole 30% 30%
Mar Lee 32% 29%
Ruby Hill 33% 29%
Athmar Park 30% 28.5%
NEIGHBORHOOD Largest census tract %
neighborhood average
Westwood 47% 36%
Kennedy 37% 37%
Montbello 37% 33.8%
East Colfax 36% 25.5%
Barnum 34% 34%
Elyria Swansea 33% 33%
Ruby Hill 33% 29%
Mar Lee 32% 29%
Washington Virginia Vale 32% 17.7%
Windsor 32% 22.7%
Neighborhoods with Highest Concentrations of Foreign Born
The above charts depict the neighborhoods and census tracts with the highest concentration of foreign-born residents. Both provide valuable insight into the concentration of these populations. For example, one of Washington Virginia Vale’s census tracts consists of 32% foreign-born individuals, yet it’s neighborhood average isn’t even in the top 10 in Denver. This shows that there is a high population of foreign-born residents concentrated in a smaller geographic area within the Washington Virginia Vale neighborhood. This can be useful in determining where to develop and promote immigrant and refugee services and integration strategies.
Source: U.S. Census Bureau. American Community Survey, 2007-2011.

10
LANGUAGES SPOKEN IN DENVER
Source: Maps produced April 2013, Denver GIS. These maps depict languages spoken at home as indicated by registration forms of Denver Public Schools Families.
IMMIGRANT COMMUNITY & NEIGHBORHOOD ASSESSMENT
Denver Public Schools has accounted for 145 languages spoken by their students’ families. English and Spanish account for nearly 94% of those languages spoken [English 55% and Spanish 39%]. The remaining 6% is made up of 143 different languages and dialects. This 6% includes top languages: Vietnamese, Arabic and Somali with several hundred families each, as well as languages such as Zuni, Norwegian, Lakota and 31 other languages indicated by only one family each.19 The maps below reflect the most frequent non-English languages spoken by families in Denver. Downloadable maps can be found at www.denvergov.org/community_support

11
Source: Maps produced April 2013, Denver GIS. These maps depict languages spoken at home as indicated by registration forms of Denver Public Schools Families.

12
IMMIGRANT COMMUNITY & NEIGHBORHOOD ASSESSMENT
ATHMAR PARK NEIGHBORHOOD
Goldrick Elementary, Math
and Science Leadership Academy, Valverde
Elementary
Athmar Park Branch Library,
Caring Hands Ministries, Colorado Immigrant Right
Coalition (CIRC), Denver Coalition for Integration
73.0%
20.6%
3.5%
1.1%0.8%
0.2%
1.0%
Latino Non Latino White
Asian Pacific Islander African American
Native American Other Race/ethnicity
SCHOOLS PLACES OF WORSHIP
SNAPSHOT
Neighborhood population: 8,898 (2010 Census) Childhood poverty rate: 45.1% (2007-2011 ACS)
Free & reduced lunch rate: 91.7% (2011 DPS) Avg. median household income: $40,284 (2007-2011 ACS)
Immigrant statistics: Children born to foreign born moms: 53.8% (CDPHE 2008)
Foreign born: 29% (2006-2010 ACS), 27.3% (2000 Census)
Top non-English languages spoken: Spanish, Vietnamese, Khmer, Chinese/Mandarin, French (DPS)
Top countries of origin (non USA): Mexico, Venezuela, El Salvador, Vietnam, Cambodia, Germany (2011 ACS Census)
AGENCIES
Church of Jesus Christ of Latter-Day
Saints, Denver Buddhist Culture, Inc., Denver Grace Brethren Church, Iglesia
Vida Abundante, New Life Fellowship, St Rose of Lima Catholic Parish, Word
Song
13
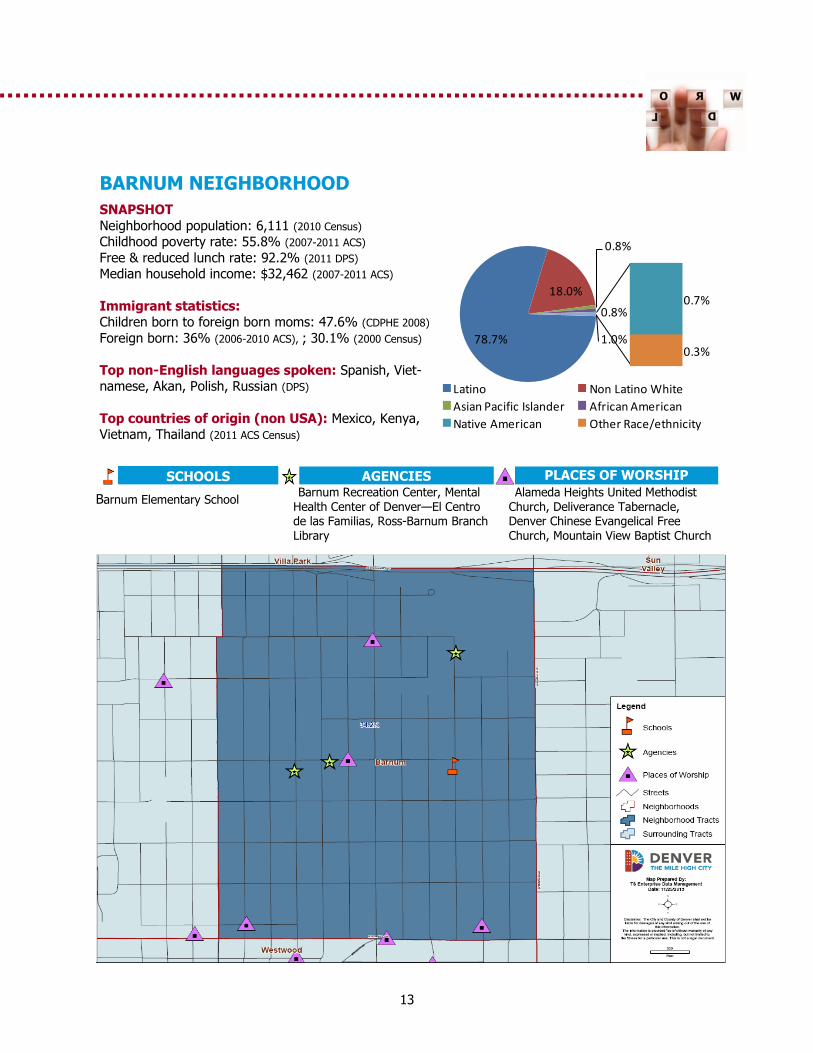
BARNUM NEIGHBORHOOD
78.7%
18.0%
0.8%
0.8%0.7%
0.3%1.0%
Latino Non Latino White
Asian Pacific Islander African American
Native American Other Race/ethnicity
SNAPSHOT
Neighborhood population: 6,111 (2010 Census) Childhood poverty rate: 55.8% (2007-2011 ACS)
Free & reduced lunch rate: 92.2% (2011 DPS) Median household income: $32,462 (2007-2011 ACS)
Immigrant statistics: Children born to foreign born moms: 47.6% (CDPHE 2008)
Foreign born: 36% (2006-2010 ACS), ; 30.1% (2000 Census)
Top non-English languages spoken: Spanish, Viet-namese, Akan, Polish, Russian (DPS)
Top countries of origin (non USA): Mexico, Kenya, Vietnam, Thailand (2011 ACS Census)
Barnum Recreation Center, Mental Health Center of Denver—El Centro de las Familias, Ross-Barnum Branch Library
Alameda Heights United Methodist Church, Deliverance Tabernacle, Denver Chinese Evangelical Free Church, Mountain View Baptist Church
SCHOOLS PLACES OF WORSHIP AGENCIES
Barnum Elementary School

14
IMMIGRANT COMMUNITY & NEIGHBORHOOD ASSESSMENT
EAST COLFAX NEIGHBORHOOD
27.70%32.40%
11.30%
24.30%
0.80%
0.10%
0.90%
Latino Non Latino White
Asian Pacific Islander African American
Native American Other Race/ethnicity
SNAPSHOT
Neighborhood population: 10,191 (2010 Census) Childhood poverty rate: 50.90% (2007-2011 ACS)
Free & reduced lunch rate: 86.8% (2011 DPS) Avg. median household income: $36,306 (2007-2011 ACS)
Immigrant statistics: Children born to foreign born moms: 47.8% (CDPHE 2008)
Foreign born: 25% (2006-2010 ACS);27.5% (2000 Census)
Top non-English languages spoken: Spanish, Burmese, Karen, Nepali, Arabic, Amharic, Somali, Oromo, Tigrigna,
French, Rundi, Maay, Swahili, Bangli, Twi (DPS)
Top countries of origin (non USA): Mexico,
Ethiopia, Kenya, Sudan, Burma, Thailand, China, Korea (2011 ACS Census)
Ashley Elementary School ESL for Refugee Women, Grace Apartments, Mercy Housing
Eritrean Orthodox Church, Greater St John Baptist Church, Greater Union Baptist Church, Zion Temple Church
SCHOOLS PLACES OF WORSHIP AGENCIES

15
ELYRIA SWANSEA NEIGHBORHOOD
83.8%
8.8%
0.3%
5.6%0.5%
0.3%0.8%
Latino Non Latino WhiteAsian Pacific Islander African AmericanNative American Other Race/ethnicity
SNAPSHOT
Neighborhood population: 6,401 (2010 Census) Childhood poverty rate: 49.8% (2007-2011 ACS)
Free & reduced lunch rate: 94.2% (2011 DPS)
Median household income: $32,116 (2007-2011 ACS)
Immigrant statistics: Children born to foreign born moms: 61.4% (CDPHE 2008)
Foreign born: 32% (2006-2010 ACS); 39.3% (2000 Census)
Top non-English languages spoken: Spanish, Arabic, Maay, Japanese, Amharic, Chinese (DPS)
Top countries of origin (non USA): Mexico, Korea, Philippines (2011 ACS Census)
Swansea Elementary Swansea Recreation Center, Valdez-Perry Branch Library
Church of Christ, Iglesia Del Dios Vivo, Pilgrim Church Congregational, Shiloh Temple, Apostolic Pentecostal Church
SCHOOLS PLACES OF WORSHIP AGENCIES

16
IMMIGRANT COMMUNITY & NEIGHBORHOOD ASSESSMENT
MAR LEE NEIGHBORHOOD
68.0%
24.7%
3.7%
1.4% 0.7%
0.2%
0.9%
Latino Non Latino White
Asian Pacific Islander African American
Native American Other Race/ethnicity
SNAPSHOT
Neighborhood population: 12,452 (2010 Census) Childhood poverty rate: 29.2% (2007-2011 ACS)
Free & reduced lunch rate: 91.2% (2011 DPS)
Avg. median household income: $40,197 (2007-2011 ACS)
Immigrant statistics: Children born to foreign born moms: 51.5% (CDPHE 2008)
Foreign born: 29% (2006-2010 ACS); 26.3% (2000 Census)
Top non-English languages spoken: Spanish, Vietnamese, Arabic, Chinese/Mandarin, Somali (DPS)
Top countries of origin (non USA): Mexico, El Salvador, Guatemala, Honduras, Colombia, Vietnam,
Korea, Laos, Philippines, Thailand (2011 ACS Census)
CMS Community School, Denison Montessori, Force Elementary, Johnson Elementary, STRIVE Prep Lake Campus
Denver Housing Authority, Hadley Branch Library, Head Start Bright
Stars , Mountain View Child Care
Center, Volunteers of America
Confluence Ministries, Denver First Wesleyan Church, Fundamental Baptist Church, Mikvah of Denver, Praise Center Church, Pearl at West Side Christian Church
SCHOOLS PLACES OF WORSHIP AGENCIES

17
MONTBELLO NEIGHBORHOOD
60.3%
8.4%
1.7%
29.1%0.3%
0.1%
0.4%
Latino Non Latino WhiteAsian Pacific Islander African AmericanNative American Other Race/ethnicity
Amesse Elementary, Collegiate DCIA at Ford, Farrell B. Howell K-8 Greenwood K-8, Maxwell Elementary McGlone Elementary, SOAR Oakland Elementary, St. Andrew Lutheran School
Immersion Ministries, Life By Design Ministries, Light of Christ Anglican, Love Christian Fellowship, Montbello Catholic Parish of The Ascension, Montbello Cooperative Ministries, Newsong Fellowship, Northeast Church of Christ, Power of His Word, St. Andrew Lutheran Church, True-light Baptist Church, United Church of Montbello, Vietnamese Community Baptist Church
Denver Human Services: Montbello, Food Bank of the Rockies, Kiddie Cat Daycare, Lowry Family Center, Montbello Branch Library, Montbello Recreation Center
SCHOOLS PLACES OF WORSHIP AGENCIES
SNAPSHOT:
Neighborhood population: 30,348 (2010 Census) Childhood poverty rate: 33.9% (2007-2011 ACS)
Free & reduced lunch rate : 90.63% (2011 DPS) Avg. Median household income: $43,438 (2007-2011 ACS)
Immigrant statistics: Children born to Foreign Born moms: 55.5% (CDPHE 2008)
Foreign Born: 33% (2006-2010 ACS),; 23% (2000 Census)
Top non-English languages spoken: Spanish, Viet-namese, French (DPS)
Top countries of origin (non USA): Mexico, Cuba, Honduras, Cambodia, Eritrea, Nigeria, Sudan (2011 ACS
Census)

18
IMMIGRANT COMMUNITY & NEIGHBORHOOD ASSESSMENT
RUBY HILL NEIGHBORHOOD
69.2%
20.9%
5.8%
2.4%
0.9%
0.2%
1.1%
Latino Non Latino White
Asian Pacific Islander African American
Native American Other Race/ethnicity
SNAPSHOT
Neighborhood population: 9,820 (2010 Census) Childhood poverty rate: 35.4% (2007-2011 ACS)
Free & reduced lunch rate: 91.9% (2011 DPS) Avg. median household income: $34,971 (2007-2011 ACS)
Immigrants statistics: Children born to foreign born moms: 54.8% (CDPHE 2008)
Foreign born: 28% (2006-2010 ACS);27.32% (2000 Census)
Top non-English languages spoken: Spanish, Vietnamese, Somali, Khmer (DPS)
Top countries of origin (non USA): Mexico, Guatemala, Dominican Republic, Eritrea, Vietnam (2011 ACS
Census)
Goldsman Elementary, Schmitt Elementary
Athmar Recreation Center, Caring Hands Ministries, Denver Housing Authority
Denver Family Church, Garden Park Mennonite Brethren, Iglesian I Cristo Church of Christ, Iglesia Vida Abundante, New Life Fellowship, Praise Center Church, Pearl at West Side Christian Church, Victory Baptist Church
SCHOOLS PLACES OF WORSHIP AGENCIES

19
WESTWOOD NEIGHBORHOOD
80.7%
11.4%4.4%
1.7% 1.0%
0.3%
1.3%
Latino Non Latino WhiteAsian Pacific Islander African AmericanNative American Other Race/ethnicity
AGENCIES Castro Elementary, Kepner Middle School, Knapp Elementary, Munroe Elementary
Catholic Charities Kentucky Head Start, Denver Indian Family Resource Center, Southwest Improvement Council, Westwood Branch Library
Alameda Heights United Methodist Church, Calvary Indian Church, Cornerstone Baptist, Church of Greater Denver, Denver Grace Brethren Church, Eternal Life Temple, Gracelife Church, Lily of the Valley Church, Redeemer Lutheran Church, Setfree Church, St. Anthony of Padua, Victory Out Reach
SCHOOLS PLACES OF WORSHIP AGENCIES
SNAPSHOT
Neighborhood population: 15,486 (2010 Census) Childhood poverty rate: 46.1% (2007-2011 ACS)
Free & reduced lunch rate: 95.1% (2011 DPS) Avg. Median Household Income: $28,572 (2007-2011 ACS)
Immigrant statistics: Children born to Foreign Born moms: 57% (CDPHE 2008)
Foreign Born: 47% (2006-2010 ACS); 34.9% (2000 Census)
Top non-English languages spoken: Spanish, Vietnamese, Somali, Arabic, Khmer, Navajo (DPS)
Top countries of origin (non USA): Mexico, Vietnam, Burma, Syria, Nigeria, El Salvador, Guatemala
(2011 ACS Census)

20
IMMIGRANT COMMUNITY & NEIGHBORHOOD ASSESSMENT
GLOSSARY
Census-tract
A small, relatively permanent subdivision of a county used to collect and tabulate U.S. Census data. Depending on its size, a neighborhood can be composed of several census tracts. A Census Tract
generally contains between 1,500 and 8,000 people with an optimal size of 4,000 people, and is designed to be relatively homogeneous with respect to population characteristics, economic status, and
living conditions.20
Child poverty rate
Number of children less than 18 years of age living in related families with total cash incomes below federal poverty levels for same size families as a percent of all children less than 18 living in related
families. 21
Immigrant
An individual who was not born in the U.S. but came to the U.S. to reside permanently or temporarily. Immigrants migrate to the U.S. for a variety of reasons including, but not limited to, join
family, find economic opportunity, jobs, or to escape difficult situations in their native country.
Immigrant Integration
A dynamic, two-way process in which newcomers and members of the receiving community work
together to integrate new members and ensure their equal treatment in society. 22
Foreign Born Individuals born outside of the U.S. This includes both immigrants and refugees.
Free & reduced lunch
Number of students grades K-12 receiving free school lunches as a percent of total student enrollment
grades K-12. Note that because some kindergartners receive free lunches but are not included in the enrollment data for grades K-12, the percent of students receiving free school lunch can exceed 100%
in some neighborhoods. To qualify for the federal Free School Lunch Program, family income must not
exceed 130% of federal poverty guidelines. 23
Native Born in a place or country indicated.
Naturalization
The process by which U.S. citizenship is granted to a foreign citizen or national after he or she fulfills
the requirements established by Congress in the Immigration and Nationality Act (INA). 24
Refugee A person who "owing to a well-founded fear of being persecuted for reasons of race, religion,
nationality, membership in a particular social group, or political opinion, is outside the country of his
nationality, and is unable to or, owing to such fear, is unwilling to avail himself of the protection of that country." This definition comes from the Refugee Act of 1980 which takes its definition of refugee from
the 1951 United Nations Convention relating to the Status of Refugees and its 1967 protocol.25
Secondary Migrant
A refugee who moves/relocates from the state or country of first or primary residence to another state

21
ENDNOTES
1 Schoch, G. (2008). Needs and Asset Assessment for the City of Denver in the Area of Education and Activities for Immigrant
Children and Families. (Unpublished master’s thesis). University of Colorado at Denver, CO.
2 R. J. Shapiro & J. Vellucci, The Impact of Immigration and Immigration Reform on the Wages of American Workers (Washington, D.C.: New Policy Institute, 2008) 1<http://ndn.org/sites/default/files/paper/Impact_of_Immigration_on_US_Wages_-_Shapiro-Vellucci_-_Final-_May_24_2010_0.pdf>. 3 Ibid. 4 U.S. Census Bureau. “Decennial Management Division Glossary.” n.d. <http://www.census.gov/dmd/www/glossary.html> 5 Singer, A., The Rise of New Immigrant Gateways (Washington, D.C.: The Brookings Institution, February 2004) 5. <http://www.brookings.edu/~/media/research/files/reports/2004/2/demographics%20singer/20040301_gateways.pdf> 6 Ibid. 7 U.S. Census Bureau. American Community Survey. “American Fact Finder.” 2008-2012. Table DP02. <http://factfinder2.census.gov/faces/nav/jsf/pages/index.xhtml> 8 Ibid. 9 Ibid.
10 U.S. Department of Health & Human Services. “Overview of Immigrants’ Eligibility for SNAP, TANF, Medicaid, and CHIP.” March, 2012. <http://aspe.hhs.gov/hsp/11/ImmigrantAccess/Eligibility/ib.shtml > 11 United Nations High Commissioner for Refugees (UNHCR). “Refugees.” UNHCR. 2014. <http://www.unhcr.org/pages/49c3646c125.html> 12 Office of Refugee Resettlement: An Office of the Administration for Children & Families. “Refugee Arrival Data.” 2013. <https://www.acf.hhs.gov/programs/orr/resource/fiscal-year-2012-refugee-arrivals>
13 State of Colorado. Colorado Refugee Service Program. 2014. 14 Ibid. 15 State of Colorado. “Country of Origin of Colorado Refugee and Asylee Arrivals.” Colorado Refugee Service Program. 2013. <http://www.colorado.gov/cs/Satellite/CDHS-SelfSuff/CBON/1251580884704> 16 Ibid. 17 Ibid. 18 Ibid. 19 Denver Public Schools 20 Ibid. 21 The Piton Foundation. “Neighborhood Summaries.” 2010. < http://www.piton.org/index.cfm?fuseaction=communityfacts.neighborhoodslist > 22 Upwardly Global. “Glossary of Terms.” 2011. <http://www.upwardlyglobal.org/about-upglo/immigrants-and-employers/hr-glossary > 23 Ibid. 24 U.S. Department of Homeland Security. “Citizenship Through Naturalization.” U.S. Citizenship and Immigration Services.” January, 22, 2013. <http://www.uscis.gov/us-citizenship/citizenship-through-naturalization> 25 Ibid.

22
IMMIGRANT COMMUNITY & NEIGHBORHOOD ASSESSMENT

23

24
The Denver Office of Community Support (DOCS) is an office of
The Agency for Human Rights & Community Partnerships (HRCP)
Derek Okubo, HRCP Executive Director Jamie Torres, HRCP Deputy Director and DOCS Director
Emily Sumner, DOCS Intern Collin Whelley, DOCS Intern
PHOTO CREDIT: VISIT DENVER