density-functional theory computer simulations of …kummelgroup.ucsd.edu/pubs/papers_2016/chagarov...
TRANSCRIPT
THE JOURNAL OF CHEMICAL PHYSICS 145, 064704 (2016)
Density-functional theory computer simulations of CZTS0.25Se0.75 alloyphase diagrams
E. Chagarov,1 K. Sardashti,1 R. Haight,2 D. B. Mitzi,3 and A. C. Kummel11Departments of Chemistry and Biochemistry, University of California, San Diego, La Jolla, California 92093,USA2IBM T. J. Watson Research Center, P.O. Box 218, Yorktown Heights, New York 10598, USA3Departments of Mechanical Engineering and Materials Science, Duke University, Durham,North Carolina 27708, USA
(Received 2 March 2016; accepted 12 July 2016; published online 9 August 2016)
Density-functional theory simulations of CZTS, CZTSe, and CZTS0.25Se0.75 photovoltaic compoundshave been performed to investigate the stability of the CZTS0.25Se0.75 alloy vs. decomposition intoCZTS, CZTSe, and other secondary compounds. The Gibbs energy for vibrational contributionswas estimated by calculating phonon spectra and thermodynamic properties at finite temperatures.It was demonstrated that the CZTS0.25Se0.75 alloy is stabilized not by enthalpy of formation butprimarily by the mixing contributions to the Gibbs energy. The Gibbs energy gains/losses for severaldecomposition reactions were calculated as a function of temperature with/without intermixing andvibration contributions to the Gibbs energy. A set of phase diagrams was built in the multidimensionalspace of chemical potentials at 300 K and 900 K temperatures to demonstrate alloy stability andboundary compounds at various chemical conditions. It demonstrated for CZTS0.25Se0.75 that thechemical potentials for stability differ between typical processing temperature (∼900 K) and operatingtemperature (300 K). This implies that as cooling progresses, the flux/concentration of S should beincreased in MBE growth to maintain the CZTS0.25Se0.75 in a thermodynamically stable state tominimize phase decomposition. Published by AIP Publishing. [http://dx.doi.org/10.1063/1.4959591]
I. INTRODUCTION
While more than 80% of solar energy in the world isgenerated by crystalline Si-based photovoltaic (PV) devices,thin film solar technology has great promise to gain a largershare in the PV market. Thin film PV devices have theadvantage of using polycrystalline absorbers with direct-bandgap and short absorption lengths, which reduces themanufacturing costs and enables monolithic integration ofthe solar cells.1,2 Chalcogenide thin films, particularly CdTeand Cu(In,Ga)Se2, are well-developed PV technologies thatare already commercialized and manufactured as PV moduleswith efficiencies greater than 10%.3 Scarcity of In and Tealong with toxicity of Cd can impose serious limitations onthe large-scale production of chalcogenide solar cells and,consequently, may require switching to different thin filmmaterials.4,5 Therefore, in order to meet the global terawatt-scale energy demands, development of thin films with earth-abundant and non-toxic elements is essential.
Cu2ZnSn(S,Se)4 (CZTSSe) is the most promising earth-abundant material to replace thin film chalcogenides forsolar cell applications because of its optimal direct, andtunable, bandgap energy (1.0-1.5 eV) and large absorptioncoefficient (>104 cm−1).6,7 However, the efficiency of CZTSSechampion cells is at least 6%-8% (absolute) lower than thatfor CdTe and CIGSe, mostly due to its low open-circuit-voltage (Voc).8 Further improvements in the PV performanceof CZTSSe devices strongly rely on identification andpassivation of the non-radiative carrier recombination sites
that limit the Voc. Many of the previous theoretical andexperimental investigations attributed the deficit in Voc toeither potential fluctuations due to charged defects or tolarger-scale inhomogeneities in the phase, crystal structure, orcomposition of the CZTSSe films.7,9,10
Phase and composition inhomogeneity of CZTSSe filmsstem from a very small stability region of single-phasekesterite in the equilibrium phase diagrams, which results inthe formation of secondary phases.11,12 While the compositionof secondary phases strongly depends on the growth conditionsincluding temperature and partial pressure (or chemicalpotential) of CZTSSe constituents, ZnS and Cu2SnS3 arethe two most widely reported secondary compounds forCZTS.13–15 Depending on the composition and electricalproperties, many of the secondary phases that grow alongwith the CZTSSe films could limit the PV performance byacting as a barrier within the film or by forming interfaceswith the kesterites with very large defect densities.16–18
Consequently, many theoretical studies have focused onfinding the optimal conditions for synthesis of single-phaseCZTSSe.11,19–22 Ab initio DFT (density functional theory)calculations predicted that CZTS is stable with respect toits major binary compounds at temperatures below 1100 Kunder modest sulfur pressures.20 Similar ab initio calculationsshowed that, with the introduction of point defects includingvacancies and antisites, formation of single-phase CZTS isunlikely.22
Another important example of atomic scale compositionalinhomogeneity is the intermixing between the Cu and Zn
0021-9606/2016/145(6)/064704/9/$30.00 145, 064704-1 Published by AIP Publishing.
Reuse of AIP Publishing content is subject to the terms: https://publishing.aip.org/authors/rights-and-permissions. Downloaded to IP: 137.110.60.216 On: Fri, 19 Aug
2016 15:17:12

064704-2 Chagarov et al. J. Chem. Phys. 145, 064704 (2016)
ions in the kesterite structure, forming the [CuZn + ZnCu]defect complex.11,23 Intermixing in combination with the lowdielectric constant of CZTS-Se causes electrostatic potentialfluctuations and the formation of band tail states that havebeen identified as one of the major factors limiting theVoc.10 Near-resonant Raman scattering studies of CZTSfilms found the critical temperature for the order-disordertransitions for Cu and Zn sites to be 533 K.24 In addition,neutron powder diffraction on CZTS films has illustrateda strong dependence of Cu/Zn intermixing disorder on thecooling regimen from the synthesis temperature to the roomtemperature, where slow-cooled films showed 70% orderas opposed to quenched films with complete disorder.25
Therefore, it is critical to design the film synthesis andpost-growth treatment processes in a temperature range thatdoes not lead to the formation of significant amounts ofsecondary phases as well as disorder in the CZTSSe structure.In this study, by employing DFT calculations, the stability ofCZTSSe alloys with respect to formation of pure CZTS andCZTSe as well as binary and ternary chalcogenides has beenevaluated, considering not only enthalpies of formation, butalso Gibbs energy contributions from thermal vibration andintermixing.
II. SIMULATION DETAILS
The DFT simulations were performed using theVienna Ab Initio Simulation Package (VASP) plane-wavesimulation package using projector augmented-wave (PAW)pseudopotentials (PP).26–31 The valence electrons for Snincluded 5s25p2, for S—3s23p4, for Se—4s24p4, for Cuincluded 3d104s1, and for Zn included 3d104s2 states. The DFTsimulations were performed with 500 eV plane-wave cutoffand 10−8 eV energy convergence level. The K-point gridsused for all compounds are summarized in Table S1 of thesupplementary material.32 The bulk compounds were relaxedat variable volume using the conjugate-gradient algorithm with0.01 eV/Å force tolerance level, and their relaxed parametersare summarized in Table S2 of the supplementary material.32
The projection operators were evaluated in reciprocal space.For enhanced accuracy, an additional support grid for the eval-uation of the augmentation charges was used. The additionalsupport grid had 8× the number of points as the standard grid.The precision of the charge-density grids was set automaticallyto avoid aliasing errors (PREC = Accurate in VASP).
The relaxed variable volume unit cells were replicated tocreate perfect supercells which were later used to calculateforce constants. The supercells sizes are summarized in TableS1 of the supplementary material.32 The force constants werecalculated in VASP using the two-point central differencescheme with the finite-displacement step of 0.01 Å taking intoaccount system symmetry. The obtained force constants wereuploaded into the PHONOPY phonon calculation packageto obtain phonon spectra and derive the thermodynamicsproperties (Helmholtz free energy, heat capacity, and thermalentropy) in a temperature range of 0-1000 K.33,34 The phononspectra and thermodynamic properties were integrated with a24 × 24 × 24 grid.
To provide an accurate representation of the CZTSxSe1−xsemiconductor bandgap, the HSE06 hybrid exchange-correlation functional was used for some simulations.35–37
To make the bandgap representation even more accurate,the alpha (α) mixing parameter of the HSE06 functionalthat defines the mixing partition between the Perdew, Burke,and Ernzerhof (PBE) functional exchange and Hartree-Fockexchange terms was varied, the bandgaps were calculated andcompared to the experimentally measured bandgap of 1.13 eVfor CZTS0.30Se0.70 measured by Haight et al.38–40 The mixingvalue α = 0.23 was found to be the most optimal, providingbandgaps of 0.92 eV for CZTSe (vs. 0.96 eV for CZTSe,41
1.04 eV for CZTS0.03Se0.9742), 1.45 eV for CZTS (vs. CZTS
values of 1.4-1.5 eV41,43–45), and 1.06 eV for CZTS0.30Se0.70(vs. 1.13 eV40). The experimental samples used as a referencefor the DFT calculations had high quality (as defined by theoptical properties) to minimize possible microscopic defects,which potentially could affect the experimental bandgap. Inaddition, these experimental samples had been measured atroom or even lower temperatures to minimize the effectof thermal expansion on the measured bandgap. Since theHSE06 fitted mixing parameter of 0.23 is very close tothe well-tested default HSE06 mixing parameter of 0.25and was fitted to the high-quality experimentally measuredbandgaps, it provides one of the most reliable approacheswith available experimental data. The more extended researchinvestigating effect of HSE06 mixing parameter variation isprovided elsewhere.46 All HSE06 simulations below wereperformed with a mixing parameter α = 0.23, which is veryclose to the default HSE06 mixing parameter of 0.25.
III. RESULTS AND DISCUSSION
The CZTS0.25Se0.75 alloy was simulated with randomplacement of S and Se atoms in S sites of the CZTSkesterite unit cell which was relaxed at variable volumeand later expanded to a 64-atom 2 × 2 × 1 supercell tocalculate force constants. The supercell provides interatomicforce constants over a larger real-space range, whichincreases the accuracy of dynamical matrix calculationsand phonon spectra. Originally 5 different S/Se randomplacement configurations in CZTS0.25Se0.75 unit cell wererelaxed choosing the configuration with the minimal totalenergy. All 5 configurations had close total energies sinceS/Se intermixing in CZTS0.25Se0.75 has low defect formationenergy of 0.03 eV/pair. In addition to the S-Se alloy, purekesterite CZTS and CZTSe unit cells were relaxed at variablevolume and later expanded to 2 × 2 × 1 supercells to calculateforce constants. To build phase diagrams, possible secondaryphases should be simulated to delineate regions of stability.As secondary phases, supercells of Cu2SnS3, Cu2SnSe3, CuS,CuSe, SnS, SnSe, ZnS, and ZnSe were simulated. It is alsopossible that alloy secondary phases such as ZnS0.25Se0.75 andCu2SnS0.25Se0.75 can be formed; however, since the alloysoccupy such a small portion of the available phase space, thechances that the decomposition product alloys would have aphase space border with CZTS0.25Se0.75 are remote, and itwould be even more improbable that the phase space border
Reuse of AIP Publishing content is subject to the terms: https://publishing.aip.org/authors/rights-and-permissions. Downloaded to IP: 137.110.60.216 On: Fri, 19 Aug
2016 15:17:12
064704-3 Chagarov et al. J. Chem. Phys. 145, 064704 (2016)
to CZTS0.25Se0.75 would persist in a significant temperaturerange since as shown below the chemical potentials forphase stability change with temperature. To obtain compoundformation energies, pure bulk Cu, Zn, Sn, S, and Se elementaryphases were also calculated. To minimize cell-size effectson the force constants required for phonon calculations, thesupercells of secondary phases were constructed to have a totalnumber of atoms as close as possible to the 64 atoms of theCZTSxSe1−x supercells and shapes close to cubic (Table S132).All these CZTSxSe1−x, secondary, and elementary phaseunitcells were initially relaxed at variable volume belowthe 0.01 eV/Å force tolerance level with the PBE exchange-correlation functional and later were re-relaxed at variablevolume with the HSE06 (0.23 mixing parameter) hybridfunctional providing two datasets using PBE and HSE06functionals.
The phase diagram can be built solving the appropriatechoice of the following equations for CZTS0.25Se0.75 systemstability:
2 × µ(Cu) + µ(Zn) + µ(Sn) + 4 × µ(S) = ∆G(CZTS), (1)
2 × µ(Cu) + µ(Zn) + µ(Sn) + 4 × µ(Se) = ∆G(CZTSe), (2)
2 × µ(Cu) + µ(Zn) + µ(Sn) + µ(S) + 3 × µ(Se)= ∆G(CZTS0.25Se0.75), (3)
where µ is the chemical potential and ∆G is the Gibbsenergy of the corresponding compound. To require stability ofCZTSxSe1−x compounds over secondary phases, the followingrelevant conditions for secondary phases should be satisfied:
µ(Cu) + µ(S) < ∆G(CuS), (4)µ(Cu) + µ(Se) < ∆G(CuSe), (5)µ(Sn) + µ(S) < ∆G(SnS), (6)µ(Sn) + µ(Se) < ∆G(SnSe), (7)µ(Zn) + µ(S) < ∆G(ZnS), (8)µ(Zn) + µ(Se) < ∆G(ZnSe), (9)
2 × µ(Cu) + µ(Sn) + 3 × µ(S) < ∆G(Cu2SnS3), (10)2 × µ(Cu) + µ(Sn) + 3 × µ(Se) < ∆G(Cu2SnSe3). (11)
TABLE I. DFT calculated formation energies per formula unit with PBE andHSE06 (α= 0.23) functionals in comparison with other simulated values.
Compound HSE06 (eV) PBE (eV) Other sources (eV)
CZTS −4.596 −3.758 −4.21 (Ref. 7)CZTSe −4.238 −3.268 −3.31 (Ref. 19)CZTS0.25Se0.75 −4.302 −3.368CuS −0.500 −0.402 −0.49 (Ref. 7)CuSe −0.427 −0.271 −0.30 (Ref. 19)SnS −0.987 −0.947 −1.01 (Ref. 7)SnSe −0.976 −0.906 −0.90 (Ref. 19)ZnS −1.870 −1.627 −1.75 (Ref. 7)ZnSe −1.674 −1.435 −1.45 (Ref. 19)Cu2SnS3 −2.627 −2.060 −2.36 (Ref. 7)Cu2SnSe3 −2.462 −1.789 −1.80 (Ref. 19)
In addition, all elemental components should favorformation of compounds instead of pure elements, whichprovides a 3rd set of conditions: µ(Cu) < 0, µ(Zn) < 0,µ(Sn) < 0, µ(S) < 0, µ(Se) < 0. The values of DFT calculatedformation energies for PBE and HSE06 (α = 0.23) arepresented in Table I. The differences between PBE-and HSE06-calculated formation energies result from thedifference in the treatment of the exchange energy by PBEand HSE06 functionals. The local density approximation(LDA) and generalized gradient approximation (GGA) DFTfunctionals often underestimate the binding energy andover-estimate bond-length vs. experimental values. As aresult HSE06, which is more accurate, provides larger(more negative) formation energies than PBE (Table I).Since formation energy is provided per formula unit, theaccumulated difference is larger for big molecules like CZTS-Se, CZTS, CZTSe (all with 8 atoms/f.u.) than for smallermolecules like SnS, SnSe with 2 atoms/f.u.
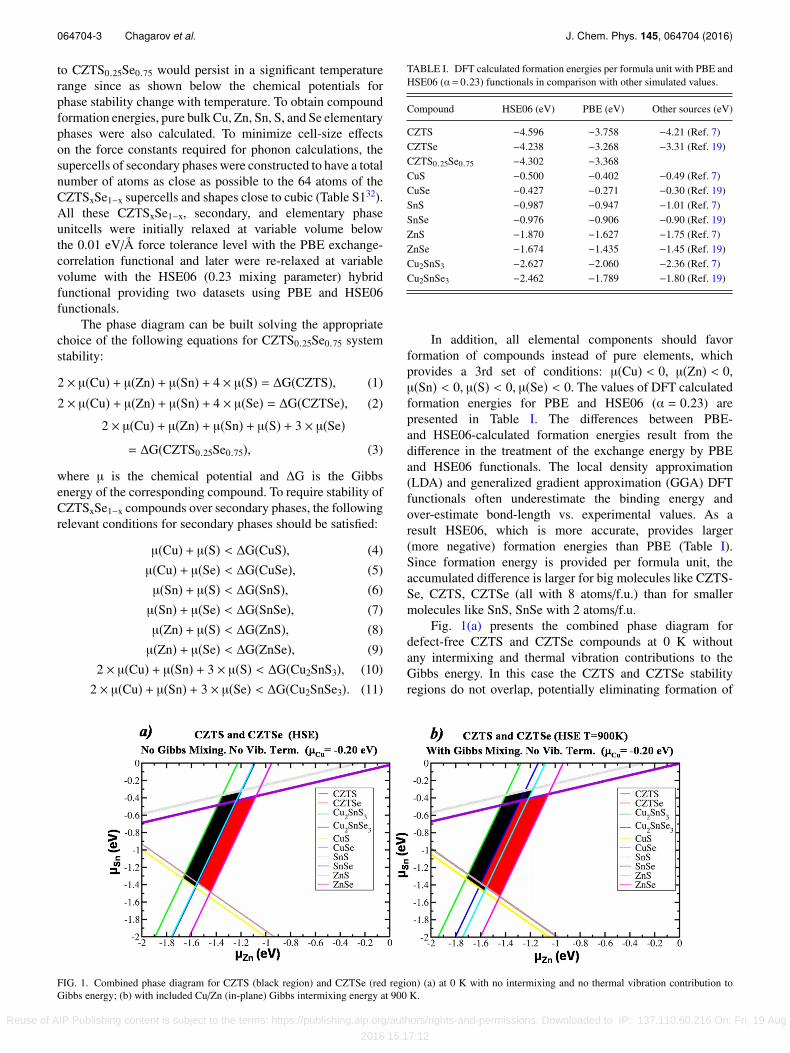
Fig. 1(a) presents the combined phase diagram fordefect-free CZTS and CZTSe compounds at 0 K withoutany intermixing and thermal vibration contributions to theGibbs energy. In this case the CZTS and CZTSe stabilityregions do not overlap, potentially eliminating formation of
FIG. 1. Combined phase diagram for CZTS (black region) and CZTSe (red region) (a) at 0 K with no intermixing and no thermal vibration contribution toGibbs energy; (b) with included Cu/Zn (in-plane) Gibbs intermixing energy at 900 K.
Reuse of AIP Publishing content is subject to the terms: https://publishing.aip.org/authors/rights-and-permissions. Downloaded to IP: 137.110.60.216 On: Fri, 19 Aug
2016 15:17:12
064704-4 Chagarov et al. J. Chem. Phys. 145, 064704 (2016)
the CZTS0.25Se0.75 alloy. To double-check this instabilitywithout intermixing at 0 K, the formation energy of theCZTS0.25Se0.75 alloy was calculated considering CZTS andCZTSe as initial phases,∆Hf(CZTS0.25Se0.75) = Etot(CZTS0.25Se0.75) − 1/4 × Etot
(CZTS) − 3/4 × Etot(CZTSe), leading to near-zero positivevalues of +2.56 × 10⁻² eV (HSE06) and +2.27 × 10⁻² eV(PBE) consistent with ideal CZTS0.25Se0.75 formation beingthermodynamically unfavorable at 0 K.
Fig. 1(b) presents the same combined phase diagramtaking into account intermixing between Cu and Zn atomslying in Cu-Zn planes where such switching is possible;as explained below both entropic and internal energychange effects were included. This has been experimentallyshown by neutron powder diffraction measurements.19
The intermixing Gibbs energy contribution was calculatedas ∆Gm = −T∆Sm = −T(kB × lnΩ), where Sm = intermixingentropy, T = temperature, kB = Boltzmann constant, and Ω= number of ways to arrange the atoms. The∆Gm per moleculewas evaluated using Stirling’s approximation.
Since Cu-Zn intermixing creates [CuZn + ZnCu] switchingdefects with non-zero defect formation energy, the properenergy correction dU should be added to energy balanceequations. The k × [CuZn + ZnCu] (k = 1, 2, 4) defects inCZTS0.25Se0.75 were recently investigated in more detailindicating that the lowest defect formation energy per pair wasfound for clustering defects.23 Five different configurationswith 4 × [CuZn + ZnCu] were simulated in CZTS0.25Se0.75with defect formation energies of 0.118, 0.133, 0.145, 0.163,and 0.183 eV/pair (HSE06) demonstrating low variation fordifferent defect placement.23 The lowest defect formationenergy +0.118 eV/pair (HSE06) was selected as the mostprobable value. The highest defect concentration is achievedwhen half of Cu/Zn pairs are switched, and the other halfare left intact. Since the CZTS kesterite unit cell has 2formula units, a dU energy contribution per formula unitis defined as dU = +0.118/2 = +0.059 eV (HSE06). Thesame defect was recalculated with PBE functional providingdU = +0.046 eV (PBE). Although the dU term was added forgeneral completeness in Figs. 1(b), 2 and 3, it provides novisible change to phase diagrams due to its small value. Due tochemical similarity, the S and Se intermixing in CZTSSe haseven lower defect formation energy of 0.03 eV/pair (HSE06).Therefore it was ignored for the dU term but was includedinto the Gibbs mixing energy term.
The inclusion of the Cu/Zn intermixing contribution tothe Gibbs energy expands the CZTS and CZTSe regions ofstability, creating a noticeable overlap between them and mak-ing possible alloy formation (Fig. 1(b)). For CZTS0.25Se0.75,intermixing between S and Se is also possible (as mentionedpreviously) and should be included into the intermixingGibbs energy contribution thereby further expanding theregion of alloy stability. Gibbs energy mixing contributionin the CZTS0.25Se0.75 alloy was evaluated at 900 K usingStirling’s approximation for different types of intermixing:(a) Cu/Zn mixing in Cu/Zn planes provides ∆Gmix = −0.1075eV/formula unit, (b) mixing of all S/Se provides ∆Gmix= −0.1745 eV/formula unit, and (c) combined S/Se and Cu/Zn(in-plane) mixing provides∆Gmix = −0.2820 eV/formula unit.
At 0 K, there is no overlap between CZTS and CZTSe(Fig. 1(a)). Including the intermixing between Cu/Zn at 900K (typical processing temperature) (Fig. 1(b)) creates anoverlap between CZTS and CZTSe consistent with stabilityof CZTS-Se at 900 K but not at 0 K.
Besides intermixing, Gibbs energy contributions from ionthermal vibration at finite temperature should be taken intoaccount. This term was estimated calculating phonon spectraand deriving the thermodynamic properties for CZTS0.25Se0.75alloy and the secondary phases at a temperature range of0-1000 K. Due to the high computational cost of HSE06force constant calculations, which in the case of low alloysymmetry can require up to ∼2 × 3 × N (N = number ofatoms) total energy calculations, the phonon simulationswere performed with the more efficient PBE-GGA exchange-correlation functional.38,39 The obtained phonon spectra forCZTS0.25Se0.75, CZTS, CZTSe, and secondary phases (CuS,CuSe, SnS, SnSe, ZnS, ZnSe, Cu2SnS3, and Cu2SnSe3) aresummarized in the supplementary material Figs. S3-S7.32
To verify convergence of phonon spectra vs. plane-wavecutoff, SnS unit cell relaxations and supercell phonon spectrasimulations were repeated with 500, 600, and 750 eV plane-wave cutoffs; all produced the same geometry and practicallyidentical phonon spectra as shown in the supplementarymaterial Fig. S8.32 Using calculated phonon spectra, majorthermodynamic properties such as Helmholtz free energy, heatcapacity, and thermal entropy were obtained in a temperaturerange of 0-1000 K using standard principles of statisticalthermodynamics.33,47 The calculated thermodynamic propertycurves are presented in the supplementary material Figs.S3-S7.32 Gibbs energy is defined as G = U − TS + PV (U-internal energy, T-temperature, S-entropy, P-pressure, V-volume). However, under typical conditions of photovoltaicgrowth and usage, the PV term is negligible (around 10−14
eV) and can be discarded, making it possible to use thecalculated Helmholtz free energy value A = U − TS. Thisdoes not take into account the effect of thermal expansion onthe phonon frequencies. The effect of thermal expansionpotentially could be included applying quasi-harmonicapproximation, however, it is much beyond the scope of thispaper.
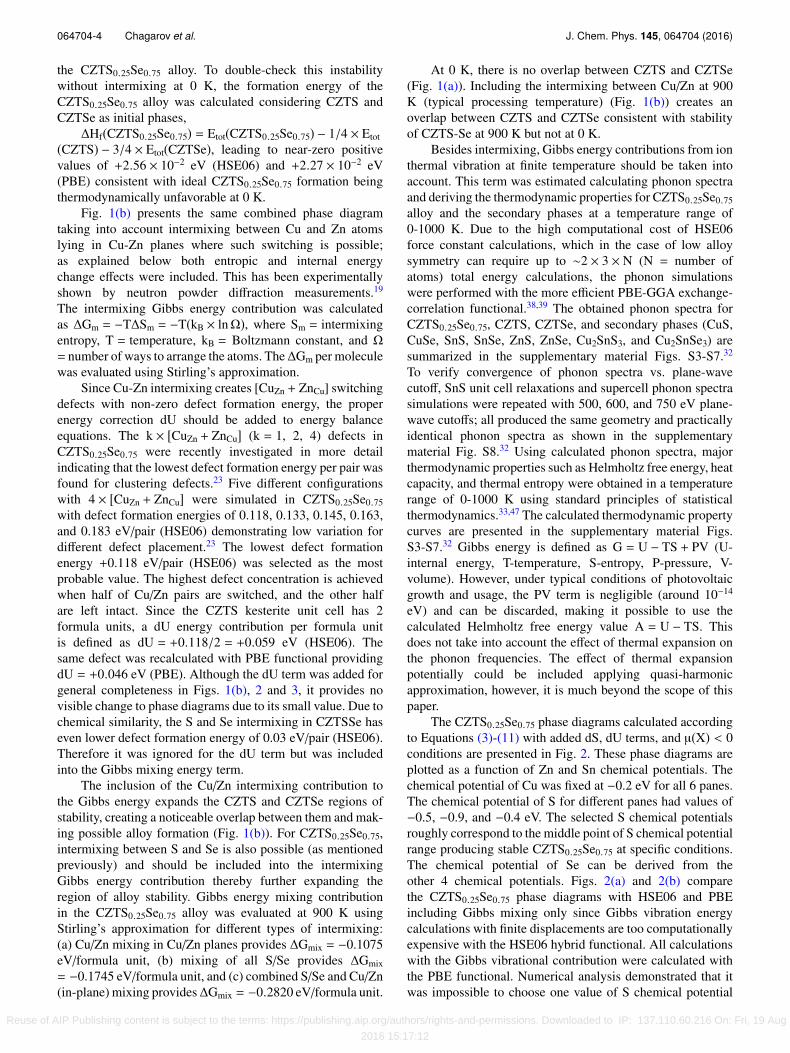
The CZTS0.25Se0.75 phase diagrams calculated accordingto Equations (3)-(11) with added dS, dU terms, and µ(X) < 0conditions are presented in Fig. 2. These phase diagrams areplotted as a function of Zn and Sn chemical potentials. Thechemical potential of Cu was fixed at −0.2 eV for all 6 panes.The chemical potential of S for different panes had values of−0.5, −0.9, and −0.4 eV. The selected S chemical potentialsroughly correspond to the middle point of S chemical potentialrange producing stable CZTS0.25Se0.75 at specific conditions.The chemical potential of Se can be derived from theother 4 chemical potentials. Figs. 2(a) and 2(b) comparethe CZTS0.25Se0.75 phase diagrams with HSE06 and PBEincluding Gibbs mixing only since Gibbs vibration energycalculations with finite displacements are too computationallyexpensive with the HSE06 hybrid functional. All calculationswith the Gibbs vibrational contribution were calculated withthe PBE functional. Numerical analysis demonstrated that itwas impossible to choose one value of S chemical potential
Reuse of AIP Publishing content is subject to the terms: https://publishing.aip.org/authors/rights-and-permissions. Downloaded to IP: 137.110.60.216 On: Fri, 19 Aug
2016 15:17:12
064704-5 Chagarov et al. J. Chem. Phys. 145, 064704 (2016)
FIG. 2. Phase diagram for CZTS0.25Se0.75 (black) (a) Gibbs mixing only, HSE06, T= 900 K; (b) Gibbs mixing only, PBE, T= 900 K; (c) Gibbs mixing andvibrational, PBE, T= 300 K; (d) Gibbs mixing and vibrational, PBE, T= 900 K; (e) the same as (c) but with CZTS and CZTSe added; (f) the same as (d) butwith CZTS and CZTSe added.
with the available stable CZTS0.25Se0.75 phase for all 6 panesof Fig. 2, since intervals of S chemical potential for differentpanes with stable CZTS0.25Se0.75 had no overlapping interval.As shown below in the 3D phase diagrams (Fig. 3), whileat higher temperature there is a larger range of S chemicalpotential over which CZTS0.25Se0.75 is stable, there is no valueof S chemical potential which is common for the equilibrium
regions of phase stability for CZTS0.25Se0.75 at both 300 Kand 900 K. Although CZTS and CZTSe are not observed assecondary phases probably due to likely high kinetic barriers,the panes in Figs. 2(e) and 2(f) include CZTS and CZTSelimiting lines for general comparison.48,49 For the panes inFigs. 2(e) and 2(f), possible Cu/Zn intermixing in CZTSand CZTSe was taken into account. It is noted that these
Reuse of AIP Publishing content is subject to the terms: https://publishing.aip.org/authors/rights-and-permissions. Downloaded to IP: 137.110.60.216 On: Fri, 19 Aug
2016 15:17:12
064704-6 Chagarov et al. J. Chem. Phys. 145, 064704 (2016)
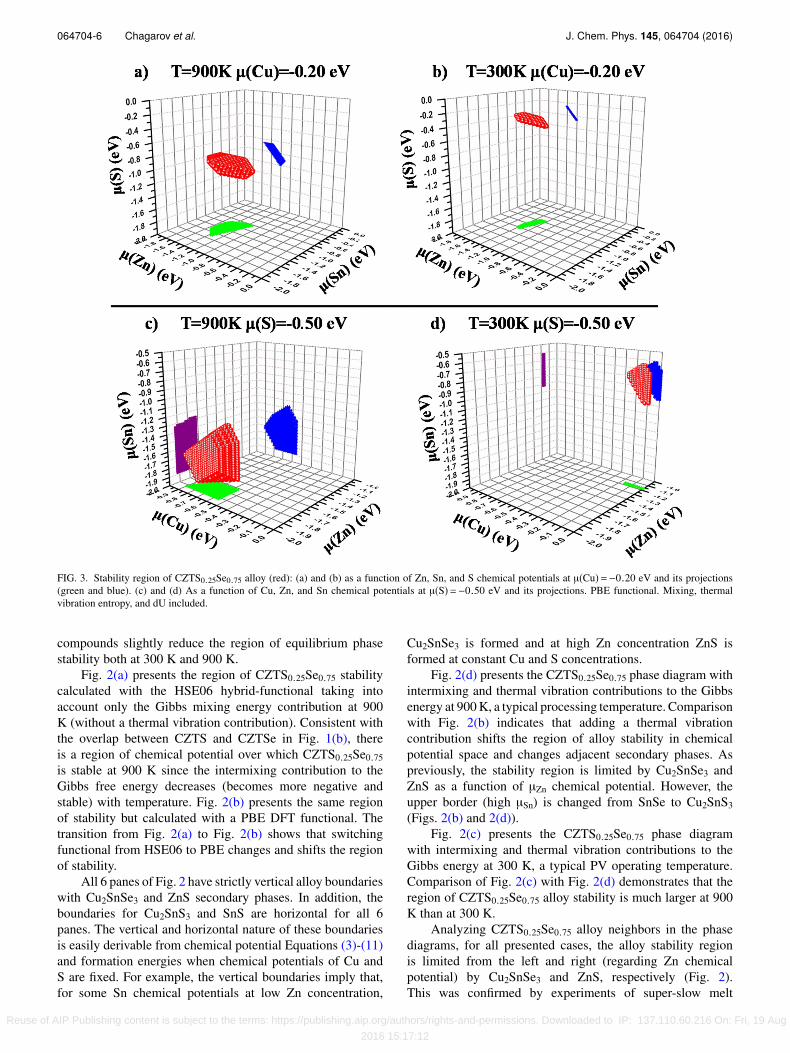
FIG. 3. Stability region of CZTS0.25Se0.75 alloy (red): (a) and (b) as a function of Zn, Sn, and S chemical potentials at µ(Cu)=−0.20 eV and its projections(green and blue). (c) and (d) As a function of Cu, Zn, and Sn chemical potentials at µ(S)=−0.50 eV and its projections. PBE functional. Mixing, thermalvibration entropy, and dU included.
compounds slightly reduce the region of equilibrium phasestability both at 300 K and 900 K.
Fig. 2(a) presents the region of CZTS0.25Se0.75 stabilitycalculated with the HSE06 hybrid-functional taking intoaccount only the Gibbs mixing energy contribution at 900K (without a thermal vibration contribution). Consistent withthe overlap between CZTS and CZTSe in Fig. 1(b), thereis a region of chemical potential over which CZTS0.25Se0.75is stable at 900 K since the intermixing contribution to theGibbs free energy decreases (becomes more negative andstable) with temperature. Fig. 2(b) presents the same regionof stability but calculated with a PBE DFT functional. Thetransition from Fig. 2(a) to Fig. 2(b) shows that switchingfunctional from HSE06 to PBE changes and shifts the regionof stability.
All 6 panes of Fig. 2 have strictly vertical alloy boundarieswith Cu2SnSe3 and ZnS secondary phases. In addition, theboundaries for Cu2SnS3 and SnS are horizontal for all 6panes. The vertical and horizontal nature of these boundariesis easily derivable from chemical potential Equations (3)-(11)and formation energies when chemical potentials of Cu andS are fixed. For example, the vertical boundaries imply that,for some Sn chemical potentials at low Zn concentration,
Cu2SnSe3 is formed and at high Zn concentration ZnS isformed at constant Cu and S concentrations.
Fig. 2(d) presents the CZTS0.25Se0.75 phase diagram withintermixing and thermal vibration contributions to the Gibbsenergy at 900 K, a typical processing temperature. Comparisonwith Fig. 2(b) indicates that adding a thermal vibrationcontribution shifts the region of alloy stability in chemicalpotential space and changes adjacent secondary phases. Aspreviously, the stability region is limited by Cu2SnSe3 andZnS as a function of µZn chemical potential. However, theupper border (high µSn) is changed from SnSe to Cu2SnS3(Figs. 2(b) and 2(d)).
Fig. 2(c) presents the CZTS0.25Se0.75 phase diagramwith intermixing and thermal vibration contributions to theGibbs energy at 300 K, a typical PV operating temperature.Comparison of Fig. 2(c) with Fig. 2(d) demonstrates that theregion of CZTS0.25Se0.75 alloy stability is much larger at 900K than at 300 K.
Analyzing CZTS0.25Se0.75 alloy neighbors in the phasediagrams, for all presented cases, the alloy stability regionis limited from the left and right (regarding Zn chemicalpotential) by Cu2SnSe3 and ZnS, respectively (Fig. 2).This was confirmed by experiments of super-slow melt
Reuse of AIP Publishing content is subject to the terms: https://publishing.aip.org/authors/rights-and-permissions. Downloaded to IP: 137.110.60.216 On: Fri, 19 Aug
2016 15:17:12
064704-7 Chagarov et al. J. Chem. Phys. 145, 064704 (2016)
cooling.16,24,50 For the bottom boundaries, at lower Sn contentand chemical potential, the alloy stability region is mainlylimited by ZnSe (magenta) and CuSe (brown) secondarycompounds, except in Figs. 2(b) and 2(c) where only ZnSelimits alloy formation for lower Sn chemical potential andexcept for the more hypothetical case in Fig. 2(e) whereCZTSe forms a low boundary. For the upper boundaries, athigh Sn content and chemical potential, the alloy stabilityregion is limited by various secondary phases for differentpresented cases: by Cu2SnS3 (green) for the cases in Figs. 2(a)and 2(d), by SnSe (violet) for the cases in Figs. 2(b), 2(c),and 2(e), and by both CZTS (red) and Cu2SnS3 (green) forthe not very realistic case in Fig. 2(f) due to likely kineticlimitations.48,49
Figs. 3(a) and 3(b) present stability regions of theCZTS0.25Se0.75 alloy in 3D as a function of Zn, Sn, andS chemical potentials at 900 K and 300 K. The chemicalpotential of Cu is fixed at −0.20 eV, while the Se chemicalpotential can be derived from the other four and the alloyformation energy. Note that although chemical potentialscan change, the correct stoichiometry of CZTS, CZTSe,and CZTS0.25Se0.75 is maintained by the chemical potentialmultipliers in Eqs. (1)-(11).
Figs. 3(c) and 3(d) present the same CZTS0.25Se0.75alloy stability region but as a function of Cu, Zn, and Snchemical potentials at the fixed µ(S) = −0.50 eV. In thiscase Cu, Zn, and Sn chemical potentials are independentwith the fixed µ(S) and dependent (derived) µ(Se). Aspreviously stated, the stability regions were calculated for300 K and 900 K temperatures. The 2-D projections providevisual representation of chemical potentials at alloy stability.Stability regions of Fig. 3 correspond to phase diagramspresented in Figs. 2(c) and 2(d).
In general, the phase diagrams presented in Fig. 2and stability regions in Fig. 3 demonstrate that highertemperature significantly expands the alloy stability regionagainst possible secondary phases. These diagrams alsoprovide a guide to the experimentalists on how to adjust growthand cooling conditions to maximize the probability of formingCZTS0.25Se0.75 at high temperature and cooling withoutphase decomposition. The phase diagrams in Figs. 2(c)and 2(d) and stability regions in Fig. 3 can be usedas a guide to choose the proper chemical environmentfor CZTS0.25Se0.75 synthesis and subsequent processing.In simple terms, the chemical potential has logarithmicdependence as a function of chemical concentrations andthereby related to flux in MBE with chemical potential ofzero corresponding to the bulk concentration of each element.The main challenge is that CZTS0.25Se0.75 stability regionin Fig. 3 is small and shifts in the multi-dimensional spaceof chemical potentials when the temperature is changed.Figure 3 reveals a major experimental challenge: there areno overlapping regions of stability of CZTS0.25Se0.75 withconstant S chemical potential. This implies that if the systemwere in chemical equilibrium while cooling from 900 K to300 K, there would be some secondary phase formation.However, due to diffusion barriers, it is possible that the singlephase CZTS0.25Se0.75 could be kinetically frozen at lowertemperatures.
The three dimensional phase diagrams suggest how toimprove the probability of maintaining phase stability duringcooling. For example, as shown in Figs. 3(a) and 3(b) forCu = −0.2 eV, there is overlap in the regions of phasestability for points near µ(Zn) = −1.4 eV and µ(Sn) = −1.0eV but there are no overlapping points for the S chemicalpotential. Instead at 900 K, the maximum stable point isµ(S) = −0.85 eV while at 300 K the minimum stable point isµ(S) = −0.45 eV. This suggests that as cooling progresses, theflux/concentration of S should be increased in MBE growth.Figs. 3(c) and 3(d) further illustrate the challenge of constantsulfur chemical potential if the material stays in equilibriumwhile cooling. Here the chemical potential of sulfur is fixed,and the regions of phase stability at 900 K and 300 K have nooverlap in chemical potentials for Sn, Cu, or Zn. This impliesthat one would need to raise the flux/concentration of all threewhile cooling to main phase stability. It is noted that kineticfreezing may occur during cooling before the material leavesthe region of phase stability; the phase diagram suggests theregion which should have the highest probability of preventingphase instability in growth is near the maximum possible sulfurflux/concentration since this is closest to the region of phasestability at low temperature.
Several possible decomposition reactions were investi-gated by calculating the change of Gibbs energy as a functionof temperature. Four possible decomposition reactions wereinvestigated,
CZTS0.25Se0.75 → 1/4CZTS + 3/4CZTSe, (12)
CZTS0.25Se0.75 → 1/4[ZnS + Cu2SnS3]+ 3/4[ZnSe + Cu2SnSe3],
(13)
CZTSe → ZnSe + Cu2SnSe3, (14)CZTS → ZnS + Cu2SnS3. (15)
The change of Gibbs energy ∆G = Gproducts − Greactantswas plotted as a function of temperature taking into account(a) the G mixing term (without thermal vibration), (b) thethermal vibration term (without the mixing term), and (c) bothmixing and thermal vibration terms. Note that enthalpy offormation was included in each curve for every compound,which makes these curves non-additive. The obtained curvesare presented in Fig. 4; note these contain both the contributionof entropy and dU from intermixing.
The decomposition reaction (12) is energetically unfavor-able at full entropy (mixing + thermal vibration) at tempera-tures above 100 K (Fig. 4(a)). Below∼100 K, CZTS0.25Se0.75 isthermodynamically favored to decompose by at most−0.02 eV.The low exothermicity and likely kinetic barriers at 100 K willmake this decomposition difficult to observe experimentally.The curve for the same reaction with only the thermal vibra-tion entropy contribution (green) shows minor decompositionfavorability around −0.02 eV or less at higher temperatures.
The decomposition reaction (13) is energetically unfa-vorable at all temperatures in the range of 80-1000 K forall 3 combinations of entropy contributions (Fig. 4(b)).It shows limited stability less than 0.02 eV below 80K with mixing and thermal entropy contributions. TheCZTS0.25Se0.75 alloy has much lower symmetry due to random
Reuse of AIP Publishing content is subject to the terms: https://publishing.aip.org/authors/rights-and-permissions. Downloaded to IP: 137.110.60.216 On: Fri, 19 Aug
2016 15:17:12

064704-8 Chagarov et al. J. Chem. Phys. 145, 064704 (2016)
FIG. 4. Change of Gibbs energy for possible decomposition reactions as a function of temperature. The entropy and dU contributions are included.
placement of atoms relative to much more ordered secondaryphases in reactions (12) and (13). Since intermixing entropycontributions to Gibbs energy stabilize the alloy, it is logicalthat at higher temperatures CZTS0.25Se0.75 becomes more andmore stable relative to more structurally simple and moreordered secondary phases.
The decomposition reaction (14) is energetically unfavor-able in the 0-1000 K temperature range for all combinationsof components: mixing only, “mixing + vibration” andvibration only entropy contributions (Fig. 4(c)). Howeverat 900 K, the “mixing + vibration” stability is only 0.075eV which is about 30% of the stability of CZTS0.25Se0.75.Since the stability is less than the thermal energy at typicalprocessing temperatures, formation of secondary phases isalmost impossible to avoid at equilibrium.
The decomposition reaction (15) is energetically unfa-vorable in the 0-1000 K range for all 3 entropy combinations(Fig. 4(d)). However, the thermal stability is less than 0.1 eV attypical processing temperatures which is ∼40% of the thermalstability of CZTS0.25Se0.75 making secondary phase formationfar more likely at equilibrium for CZTS than CZTS0.25Se0.75.
IV. CONCLUSION
The DFT-calculated phase diagrams for theCZTS0.25Se0.75 alloy have been determined with various
exchange-correlation functionals as a function of temperatureand chemical potentials. Formation of the CZTS0.25Se0.75alloy vs. pure CZTS and CZTSe is stabilized not byenthalpy of formation, which has almost zero gain, but byentropy contributions to the Gibbs energy primarily fromintermixing. In multidimensional chemical potential space,CZTS0.25Se0.75 is stable in a small region, which shifts as afunction of temperature. It demonstrated for CZTS0.25Se0.75that the chemical potentials for stability differ betweentypical processing temperature (∼900 K) and operatingtemperature (300 K). This implies that as cooling progresses,the flux/concentration of S should be increased in MBE growthto maintain the CZTS0.25Se0.75 in a thermodynamically stablestate to minimize phase decomposition. As the temperatureincreases, the CZTS0.25Se0.75 stability region increasesconsistent with the stabilization effects of mixing. Severaldecomposition reactions of CZTS0.25Se0.75, pure CZTS andCZTSe to secondary phases were investigated, demonstratingthat CZTS0.25Se0.75, CZTS, and CZTSe are stable attemperatures above 100 K when taking into account fullthermal vibration and mixing entropy contributions; however,at typical processing temperatures CZTS0.25Se0.75 has morethan 2.5× the thermodynamic stability of CZTS and more than3× the thermodynamic stability of CZTSe. The presented DFTsimulated data strongly correlate to experimental measure-ments.
Reuse of AIP Publishing content is subject to the terms: https://publishing.aip.org/authors/rights-and-permissions. Downloaded to IP: 137.110.60.216 On: Fri, 19 Aug
2016 15:17:12
064704-9 Chagarov et al. J. Chem. Phys. 145, 064704 (2016)
ACKNOWLEDGMENTS
The information, data, or work presented herein wasfunded in part by the U.S. Department of Energy, EnergyEfficiency and Renewable Energy Program, under Award No.DE- EE0006334. The information, data, or work presentedherein was funded in part by an agency of the UnitedStates Government. Neither the United States Governmentnor any agency thereof, nor any of their employees, make anywarranty, express or implied, or assume any legal liability orresponsibility for the accuracy, completeness, or usefulnessof any information, apparatus, product, or process disclosed,or represent that its use would not infringe privately ownedrights. Reference herein to any specific commercial product,process, or service by trade name, trademark, manufacturer,or otherwise does not necessarily constitute or imply itsendorsement, recommendation, or favoring by the UnitedStates Government or any agency thereof. The views andopinions of authors expressed herein do not necessarily stateor reflect those of the United States Government or any agencythereof.
1D. B. Mitzi, O. Gunawan, T. K. Todorov, and D. A. R. Barkhouse, Philos.Trans. R. Soc., A 371, 20110432 (2013).
2C. A. Wolden, J. Kurtin, J. B. Baxter, I. Repins, S. E. Shaheen, J. T. Torvik,A. A. Rockett, V. M. Fthenakis, and E. S. Aydil, J. Vac. Sci. Technol., A 29,030801 (2011).
3D. B. Mitzi, O. Gunawan, T. K. Todorov, K. Wang, and S. Guha, Sol. EnergyMater. Sol. Cells 95, 1421 (2011).
4T. K. Todorov, K. B. Reuter, and D. B. Mitzi, Adv. Mater. 22, E156 (2010).5C. Wadia, A. P. Alivisatos, and D. M. Kammen, Environ. Sci. Technol. 43,2072 (2009).
6J. B. Li, V. Chawla, and B. M. Clemens, Adv. Mater. 24, 720 (2012).7A. Walsh, S. Y. Chen, S. H. Wei, and X. G. Gong, Adv. Energy. Mater. 2,400 (2012).
8W. Wang, M. T. Winkler, O. Gunawan, T. Gokmen, T. K. Todorov, Y. Zhu,and D. B. Mitzi, Adv. Energy Mater. 4, 1301465 (2014).
9K. Yu and E. A. Carter, Chem. Mater. 27, 2920 (2015).10T. Gokmen, O. Gunawan, T. K. Todorov, and D. B. Mitzi, Appl. Phys. Lett.
103, 103506 (2013).11S. Y. Chen, J. H. Yang, X. G. Gong, A. Walsh, and S. H. Wei, Phys. Rev. B
81, 245204 (2010).12I. D. Oleksseyuk, I. V. Dudchak, and L. V. Piskach, J. Alloys Compd. 368,
135 (2004).13H. Du, F. Yan, M. Young, B. To, C. S. Jiang, P. Dippo, D. Kuciauskas, Z. H.
Chi, E. A. Lund, C. Hancock, O. O. W. M. Hlaing, M. A. Scarpulla, and G.Teeter, J. Appl. Phys. 115, 173502 (2014).
14E. A. Lund, H. Du, W. M. H. Oo, G. Teeter, and M. A. Scarpulla, J. Appl.Phys. 115, 173503 (2014).
15J. J. Scragg, T. Ericson, T. Kubart, M. Edoff, and C. Platzer-Bjorkman, Chem.Mater. 23, 4625 (2011).
16X. Fontane, L. Calvo-Barrio, V. Izquierdo-Roca, E. Saucedo, A. Perez-Rodriguez, J. R. Morante, D. M. Berg, P. J. Dale, and S. Siebentritt, Appl.Phys. Lett. 98, 181905 (2011).
17J. Just, D. Luzenkirchen-Hecht, R. Frahm, S. Schorr, and T. Unold, Appl.Phys. Lett. 99, 262105 (2011).
18K. Wang, B. Shin, K. B. Reuter, T. Todorov, D. B. Mitzi, and S. Guha, Appl.Phys. Lett. 98, 051912 (2011).
19S. Y. Chen, A. Walsh, X. G. Gong, and S. H. Wei, Adv. Mater. 25, 1522(2013).
20A. J. Jackson and A. Walsh, J. Mater. Chem. A 2, 7829 (2014).21J. M. Skelton, A. J. Jackson, M. Dimitrievska, S. K. Wallace, and A. Walsh,
APL Mater. 3, 041102 (2015).22P. Sarker, M. M. Al-Jassim, and M. N. Huda, J. Appl. Phys. 117, 035702
(2015).23E. Chagarov, K. Sardashti, A. Kummel, Y. Lee, R. Haight, and T. Gershon,
J. Chem. Phys. 144, 104704 (2016).24J. J. S. Scragg, L. Choubrac, A. Lafond, T. Ericson, and C. Platzer-Bjorkman,
Appl. Phys. Lett. 104, 041911 (2014).25S. Schorr, Sol. Energy Mat. Sol. Cells 95, 1482 (2011).26G. Kresse and J. Hafner, Phys. Rev. B 47, 558 (1993).27G. Kresse and J. Hafner, Phys. Rev. B 49, 14251 (1994).28G. Kresse and J. Furthmüller, Comput. Mater. Sci. 6, 15 (1996).29G. Kresse and J. Furthmüller, Phys. Rev. B 54, 11169 (1996).30P. E. Blochl, Phys. Rev. B 50, 17953 (1994).31G. Kresse and D. Joubert, Phys. Rev. B 59, 1758 (1999).32See supplementary material at http://dx.doi.org/10.1063/1.4959591 for
detailed description of phonon spectra, calculated thermodynamic curves,and simulation parameters.
33A. Togo, F. Oba, and I. Tanaka, Phys. Rev. B 78, 134106 (2008).34A. Togo and I. Tanaka, Scr. Mater. 108, 1 (2015).35J. Heyd, G. E. Scuseria, and M. Ernzerhof, J. Chem. Phys. 118, 8207
(2003).36J. Heyd and G. E. Scuseria, J. Chem. Phys. 121, 1187 (2004).37J. Heyd, G. E. Scuseria, and M. Ernzerhof, J. Chem. Phys. 124, 219906
(2006).38J. P. Perdew, K. Burke, and M. Ernzerhof, Phys. Rev. Lett. 77, 3865
(1996).39J. P. Perdew, K. Burke, and M. Ernzerhof, Phys. Rev. Lett. 78, 1396
(1997).40R. Haight, X. Shao, W. Wang, and D. B. Mitzi, Appl. Phys. Lett. 104, 033902
(2014).41S. Chen, X. G. Gong, A. Walsh, and S.-H. Wei, Appl. Phys. Lett. 94, 041903
(2009).42S. Bag, O. Gunawan, T. Gokmen, Y. Zhu, T. K. Todorov, and D. B. Mitzi,
Energy Environ. Sci. 5, 7060 (2012).43M. Ichimura and Y. Nakashima, Jpn. J. Appl. Phys. 48, 090202
(2009).44H. Katagiri, K. Saitoh, T. Washio, H. Shinohara, T. Kurumadani, and S.
Miyajima, Sol. Energy Mater. Sol. Cells 65, 141 (2001).45B. Shin, O. Gunawan, Y. Zhu, N. A. Bojarczuk, S. J. Chey, and S. Guha,
Prog. Photovoltaics: Res. Appl. 21, 72 (2013).46J. E. Moussa, P. A. Schultz, and J. R. Chelikowsky, J. Chem. Phys. 136,
204117 (2012).47J. W. Ochterski, “Thermochemistry in Gaussian,” http://www.gaussian.com/
g_whitepap/thermo.htm, 17 June 2015.48J. J. Scragg, P. J. Dale, D. Colombara, and L. M. Peter, ChemPhysChem 13,
3035 (2012).49W.-C. Hsu, B. Bob, W. Yang, C.-H. Chung, and Y. Yang, Energy Environ.
Sci. 5, 8564 (2012).50A. Redinger, K. Hönes, X. Fontané, V. Izquierdo-Roca, E. Saucedo, N.
Valle, A. Pérez-Rodríguez, and S. Siebentritt, Appl. Phys. Lett. 98, 101907(2011).
Reuse of AIP Publishing content is subject to the terms: https://publishing.aip.org/authors/rights-and-permissions. Downloaded to IP: 137.110.60.216 On: Fri, 19 Aug
2016 15:17:12