deng - permeability characterization and alteration due to reactive transport
TRANSCRIPT

Permeability characterization and
alteration due to reactive transport
Hang Deng
Department of Civil and Environmental Engineering
Princeton University
For PECS
March 13th, 2012
1

Backgrounds for CCS
Geological storage • Easy accessibility • Large storage capacity (IPCC SRCCS, 2005)
Carbon Capture and Sequestration
(CCS) Challenges • Leakage • Proper legal framework (property rights etc.) • Public acceptance • . . . (IPCC SRCCS, 2005)
(Socolow and Pacala, 2005)

Backgrounds for CCS
(IPCC, 2005)

Backgrounds for CCS
? ? Leak
age
Ris
k
Time Injection stops
Geochemical-induced sealing may reduce leakage risk
Mineral dissolution may enlarge flow pathways over time
Leakage risk due to pressure changes
(From Prof. Catherine A. Peters)

(Li et al., 2009)
CCS in China
• Willingness
• C Capture
• Subsurface environments – Deep saline aquifers - 160~1451 Gt
– Depleted oil and gas reservoirs - 4.1~30.5 Gt
– Coal beds - 12.1~48.4 Gt
• Technologies – Gaobeidian Project & Shidongkou
Project
– EOR (enhanced oil recovery) - Liaohe oil field
– IGCC

(Seligsohn et al., 2010)
• Opportunities v.s. Challenges
CCS in China

Motivations for me to study CCS
• Opportunities v.s. Challenges
‘COAL-POWER CONFLICT’
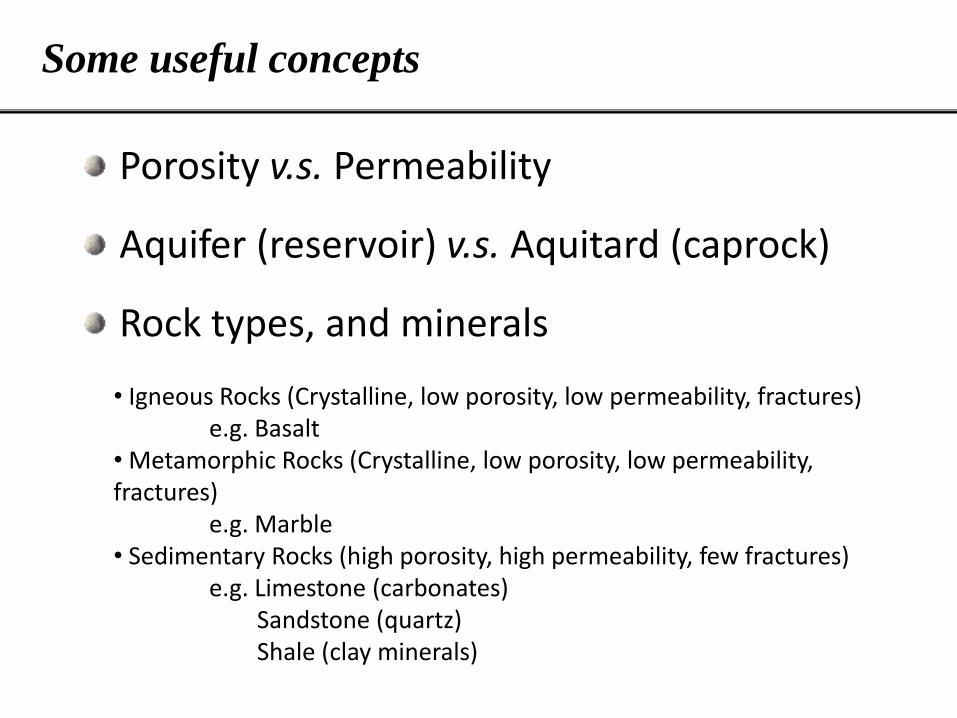
Porosity v.s. Permeability
Aquifer (reservoir) v.s. Aquitard (caprock)
Rock types, and minerals
• Igneous Rocks (Crystalline, low porosity, low permeability, fractures) e.g. Basalt • Metamorphic Rocks (Crystalline, low porosity, low permeability, fractures) e.g. Marble • Sedimentary Rocks (high porosity, high permeability, few fractures) e.g. Limestone (carbonates) Sandstone (quartz) Shale (clay minerals)
Some useful concepts

Porosity v.s. Permeability
Aquifer (reservoir) v.s. Aquitard (caprock)
Rock types, and minerals
Some useful concepts
Brine Chemistry
(Gherardi et al., 2007)

Some useful concepts
Geothermal gradient, hydrostatic pressure, CO2 dissolution and pH
20 30 40 50 60 700
200
400
600
800
1000
1200
1400
1600
1800
2000
Temperature [C]
De
pth
[m
]
0 50 100 150 2000
200
400
600
800
1000
1200
1400
1600
1800
2000
Pressure [bar]0 0.5 1
0
200
400
600
800
1000
1200
1400
1600
1800
2000
CO2 solubility [mol/kgw]
2 3 4 5 60
200
400
600
800
1000
1200
1400
1600
1800
2000
pH
Surface temperature
20 C
Geothermal gradient
25 C/km
Surface pressure
1 bar
Pressure gradient
100 bar/km

Some useful concepts
Relevant chemical reactions Carbonic acid formation CO2 + H2O HCO3
- + H+
Reactions with aluminosilicates – slow
Mg5Al2Si3O10(OH)8 + 5 CO2 5 MgCO3 + H4SiO4 + Al2Si2O5(OH)4
Reactions with carbonates and sulfates – fast
CaCO3 + H2O + CO2(aq) Ca2+ + 2 HCO3-
Reactions with cements
CaO SiO2H2O + CO2 CaCO3 + SiO2H2O Ca(OH)2 + CO2 CaCO3 + H2O
Fractures: mechanical v.s. hydraulic aperture

Hydrogeological characterization of Ottawa County, Michigan
Impacts of microfracture network geometry on permeability
Reactive transport in fractured rock and its impact on permeability
Overview of past, present and future research

Shales and mudstones
(caprock above Viking formation – Alberta)
(Image sources: Prof. Peters) (Image sources: Ellis et al., 2011)
13
Overview of past, present and future research

1.Hydrogeological characterization
—— target formation
Target formation: Mount Simon Sandstone (Cambrian) • Medium to coarse quartz sandstone, high porosity (12.89 ± 0.05%, Barnes et al., 2009) and permeability (2.0687 ± 2.448 logmd, Barnes et al., 2009) • Overlain by Eau Claire, relatively non-permeable (5.9 ± 0.06%, − 2.22 ± 1.16 logmd, Barnes et al., 2009) • High Capacity (Michigan State >600,000 MM tons, Medina et al., 2010)
(source: Medina et al., 2010)
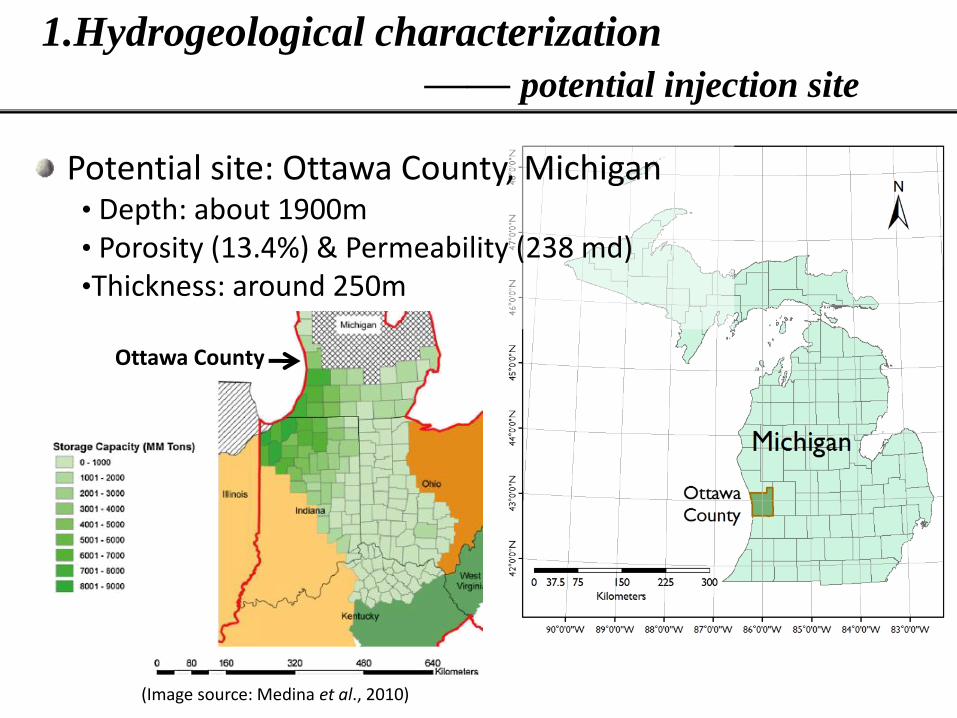
Potential site: Ottawa County, Michigan • Depth: about 1900m • Porosity (13.4%) & Permeability (238 md) •Thickness: around 250m
1.Hydrogeological characterization
—— potential injection site
(Image source: Medina et al., 2010)
Ottawa County

16
1.Hydrogeological characterization
—— summary permeability
10-8 102 10-6 10-4 100 10-2 104 5×10⁵
K – C K – T
Permeability k (mD)
Depth (m) 0
2170.8 + Mineralogical data
Geophysical well logs (gamma, neutron,
density and resistivity \
conductivity) from 22 wells in Ottawa County (DNRE)

• Sampling from the distribution
• Both Lognormal and Generalized Extreme Value (GEV) distributions pass Kolmogorov-Smirnov test (α=0.01), and GEV captures permeability at the two tails better.
• Large variability within one formation, largely accounted for by vertical variability.
105
0.05
0.1
0.25
0.5
0.75
0.9
0.95
Lognormal
Data Points
GEV
Probability plot for Lognormal V.S. GEV distribution, MNSMProbability plot for lognormal V.S. GEV distribution, MNSM
105
0.9
0.75
0.95
0.25
0.5
0.1
0.05
Permeability k (mD)
1.Hydrogeological characterization
—— summary permeability

2.The impacts of microfractures on permeability
——backgrounds
Shales and mudstones
(caprock above Viking formation – Alberta)
Image source: Prof. Peters Graphic source: Smith et al. Int. J. Greenhouse Gas Control 5 (2011) 226–240

• Impacts of geometrical properties of microfracture network on permeability
e.g. Aperture Roughness
X
Z
Shales and mudstones
(caprock above Viking formation – Alberta)
(Image sources: Prof. Peters)
ai
li
Flo
w d
irectio
n
2.Impacts of microfracture network on
permeability
19 0 0.2 0.4 0.6 0.8 1 1.2 1.4 1.6 1.8 2
-17
-16
-15
-14
-13
-12
-11
-10
-9
-8
Roughness / am
Lo
g k
22 (
log
m2)

Shales and mudstones
(caprock above Viking formation – Alberta)
(Image sources: Prof. Peters) (Image sources: Ellis et al., 2011)
20
3.Reactive transport in a single fracture

Q: What are the impacts of mineralogy and brine chemistry on
integrity of fractured caprocks?
• Often neglected at large-scale simulations
• High reactivity in the case of CO2 storage
0.85
0.9
0.95
100 105 110 115 120 125 130 135 140 145 1503.15
3.16
3.17
PCO2 [bar]
CO
2 s
olu
bili
ty [
mo
l/L]
pH
Forcing reactions out of equilibrium • Carbonates and sulfates (e.g. calcite, dolomites) • Silicates (e.g. anorthite) • Cements
Enhancing reaction rate
CaCO3 Ca2+ + CO32- • Calcite:
Fractured Caprock (Gherardi et al., 2007)
Caprock layer 1 (0.001m)
Caprock layer 2 (0.003m)
Sealed Caprock (Gherardi et al., 2007)
Sealing after 6.6 yr
21
3.Reactive transport in a single fracture
—— Motivation and backgrounds

Fractured Caprock (Gherardi et al., 2007)
Q: What are the impacts of mineralogy and brine chemistry on
integrity of fractured caprocks?
• Natural and induced fractures
• Generally, fast flow rate and high reactivity
Caprock layer 1 (0.001m)
Caprock layer 2 (0.003m)
Sealed Caprock (Gherardi et al., 2007)
Sealing after 6.6 yr
22
3.Reactive transport in a single fracture
—— Motivation and backgrounds

High Da Transport-controlled
t = 7 hr (Detwiler 2008)
Low Da Reaction rate-controlled
∆ a Precipitation/dissolution pattern in a fracture depends on:
Mineralogy
Brine Chemistry
Fracture Geometry
Reaction Rate
Flow Rate
Confining Pressure
23
3.Reactive transport in a single fracture
—— Motivation and backgrounds

3.Reactive transport in a single fracture
—— Approaching from two ends
Numerical tools (CFD & Reactive transport) to
inform the experiments
Building the experimental
set-up!!!

2.54cm
3.8
cm
0
50
100
150
200
250
300
350
400
450
500
0
50
100
150
200
250
300
350
400
450
500
Before After
-300
-200
-100
0
100
200
300
400
500
Change
Ap
erture/ch
ange o
f apertu
re (µm
)
Flo
w d
irec
tio
n
25
Standard deviation of aperture ( ) is a measure of aperture roughness. The last term in the equation corrects for the tortuosity due to contact area.
3.Reactive transport in a single fracture
—— 1D transport

2.54cm
3.8
cm
0
50
100
150
200
250
300
350
400
450
500
0
50
100
150
200
250
300
350
400
450
500
Before After
-300
-200
-100
0
100
200
300
400
500
Change
Ap
erture/ch
ange o
f apertu
re (µm
)
Flo
w d
irec
tio
n
0.5
1
1.5
2
2.5
3
3.5
0.5
1
1.5
2
2.5
3
3.5
Flo
w d
irec
tio
n V
elocity (m
/s)
Before After
0.02
0.04
0.06
0.08
0.1
0.12
0.14
0.16
0.18
0.2
0.22
2D steady state (James and Chrysikopoulos, 2000)
26
3.Reactive transport in a single fracture
—— 2D transport

27
y
x
a b
y
x
a b
Transverse roughness Scenario 1
x
y
z
Flow Rate
Transverse roughness Scenario 2
1/43/74/51
0.96
0.98
1
1.02
1.04
1.06
1.08
1.1
1.12
1.14
x 10-5
a/b
hyd
rau
lic a
pert
ure
(m
)
1/43/74/51
1
1.05
1.1
1.15
1.2
1.25x 10
-5
a/b
hyd
rau
lic a
pert
ure
(m
)
3.Reactive transport in a single fracture
—— 3D CFD

y
z
y
z
12
34
56
78
910
-1200
-1000
-800
-600
-400
-200 0
200
Grid
s
Amount of mineral dissolution (-) / precipitation (+)
10
00
00
s
Calcite Dolomite
0 2 4 6 8 10 12 14 16 18 20
0
5
10
15
20
25
30
35
Percentage volume increase
Pe
rce
nta
ge
hyd
rau
lic a
pe
rtu
re in
cre
ase
3.Reactive transport in a single fracture
—— 3D CFD

Thank you! Comments? Questions!
29