demystifying p6 eppm dashboards
TRANSCRIPT
REMINDERCheck in on the
COLLABORATE mobile app
Demystifying P6 EPPMDashboards
Prepared by:Marie GunnersonGlobal Primavera ManagerParsons Brinckerhoff
Session ID#: 200620
@MarieGunnerson
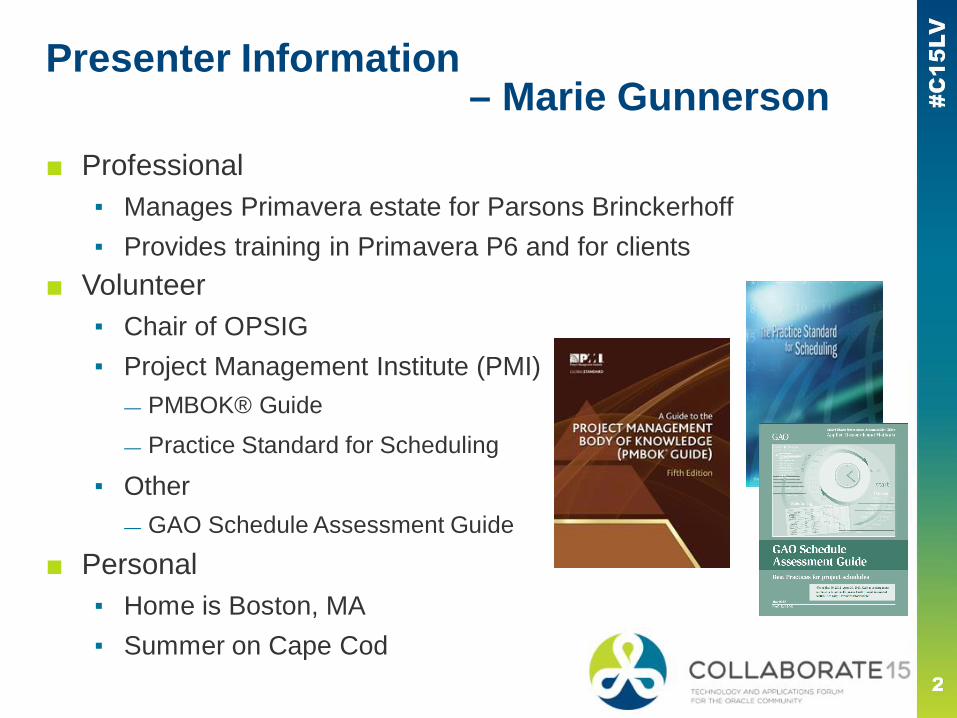
Presenter Information– Marie Gunnerson
■ Professional▪ Manages Primavera estate for Parsons Brinckerhoff▪ Provides training in Primavera P6 and for clients
■ Volunteer▪ Chair of OPSIG▪ Project Management Institute (PMI)
— PMBOK® Guide
— Practice Standard for Scheduling
▪ Other— GAO Schedule Assessment Guide
■ Personal▪ Home is Boston, MA▪ Summer on Cape Cod
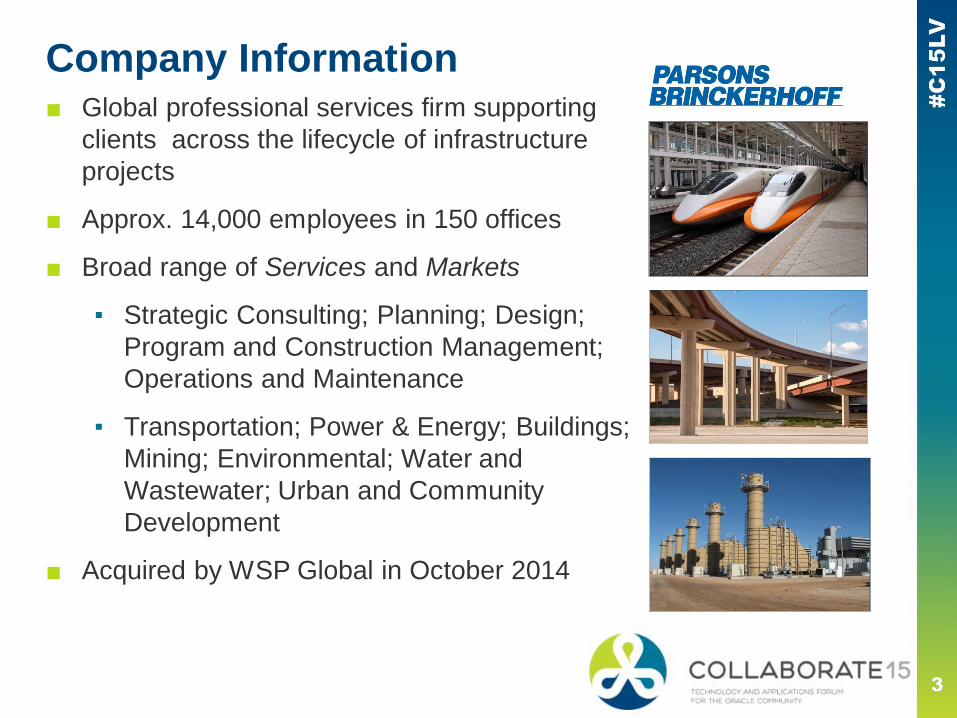
Company Information■ Global professional services firm supporting
clients across the lifecycle of infrastructureprojects
■ Approx. 14,000 employees in 150 offices
■ Broad range of Services and Markets
▪ Strategic Consulting; Planning; Design;Program and Construction Management;Operations and Maintenance
▪ Transportation; Power & Energy; Buildings;Mining; Environmental; Water andWastewater; Urban and CommunityDevelopment
■ Acquired by WSP Global in October 2014
Presentation Outline
■ Why use dashboards?
■ Overview of dashboard space
■ What is required for dashboard views
■ How to configure P6 EPPM dashboards
■ What is included in P6 EPPM dashboards

Introduction
For many, P6 EPPM interface still a mystery
■ It looks different,
■ Complicated, and
■ Unknown.
■ Hic sunt dracones(here be dragons)
Olaus Magnus’s Carta marina of 1539, (1572 edition image)
So why venture forth with dashboards?
■ Dashboards and Portfolio views provide a summarized viewof project information not available in the PPM client
■ Strategic views
■ Accessibility
■ Transparency
■ Communication
■ Collaboration
How might weshare data
with others?
Tactical VS Strategic
■ Tactical▪ P6 PPM Client▪ P6 EPPM Project and Resource sections
■ Strategic▪ P6 EPPM Portfolios section▪ P6 EPPM Dashboards section
How can Isee the big
picture?
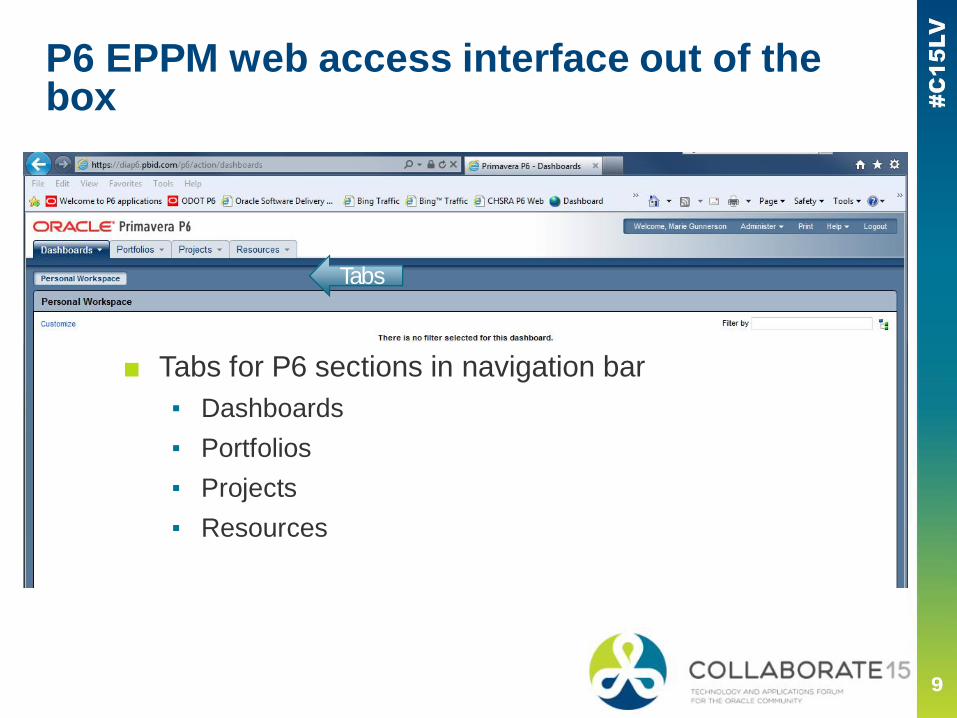
P6 EPPM web access interface out of thebox
■ Tabs for P6 sections in navigation bar▪ Dashboards▪ Portfolios▪ Projects▪ Resources
TabsTabs
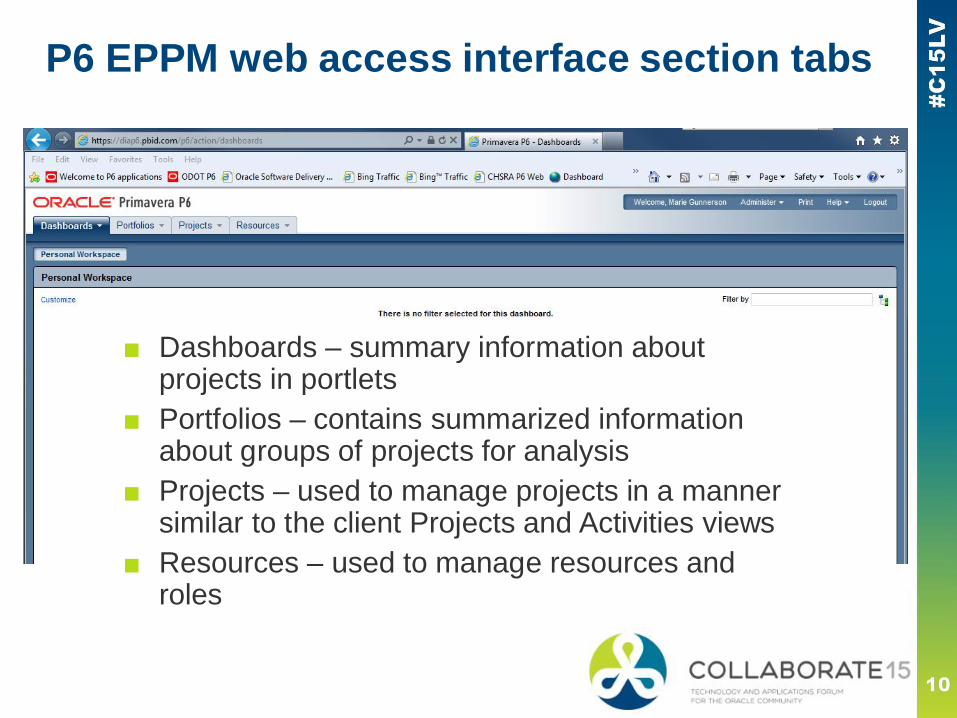
P6 EPPM web access interface section tabs
■ Dashboards – summary information aboutprojects in portlets
■ Portfolios – contains summarized informationabout groups of projects for analysis
■ Projects – used to manage projects in a mannersimilar to the client Projects and Activities views
■ Resources – used to manage resources androles
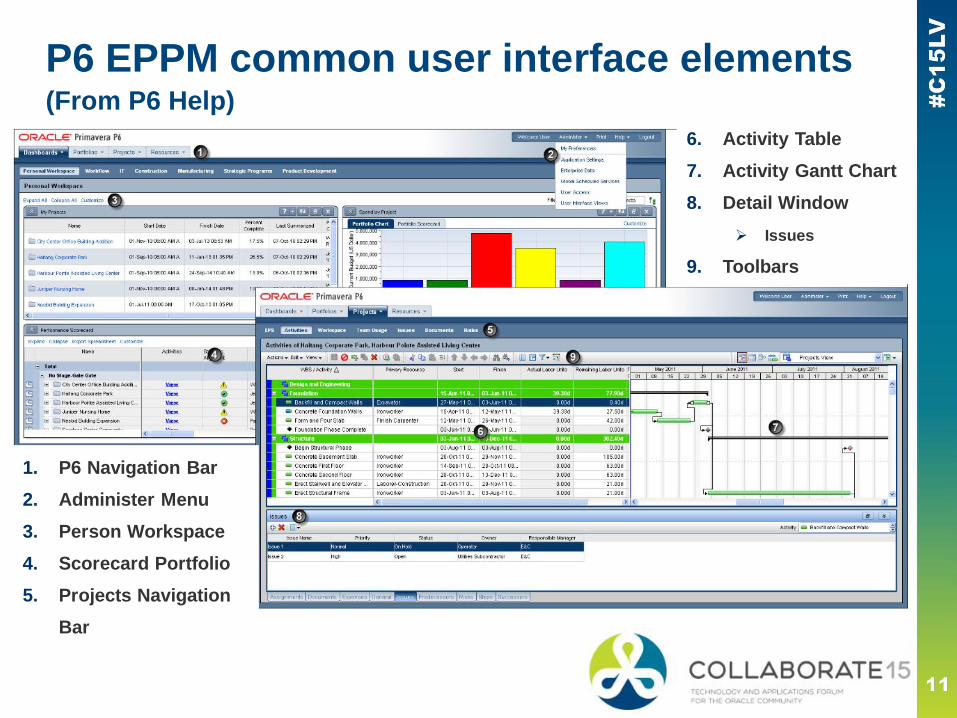
P6 EPPM common user interface elements(From P6 Help)
1. P6 Navigation Bar2. Administer Menu3. Person Workspace4. Scorecard Portfolio5. Projects Navigation
Bar
6. Activity Table7. Activity Gantt Chart8. Detail Window
Ø Issues
9. Toolbars
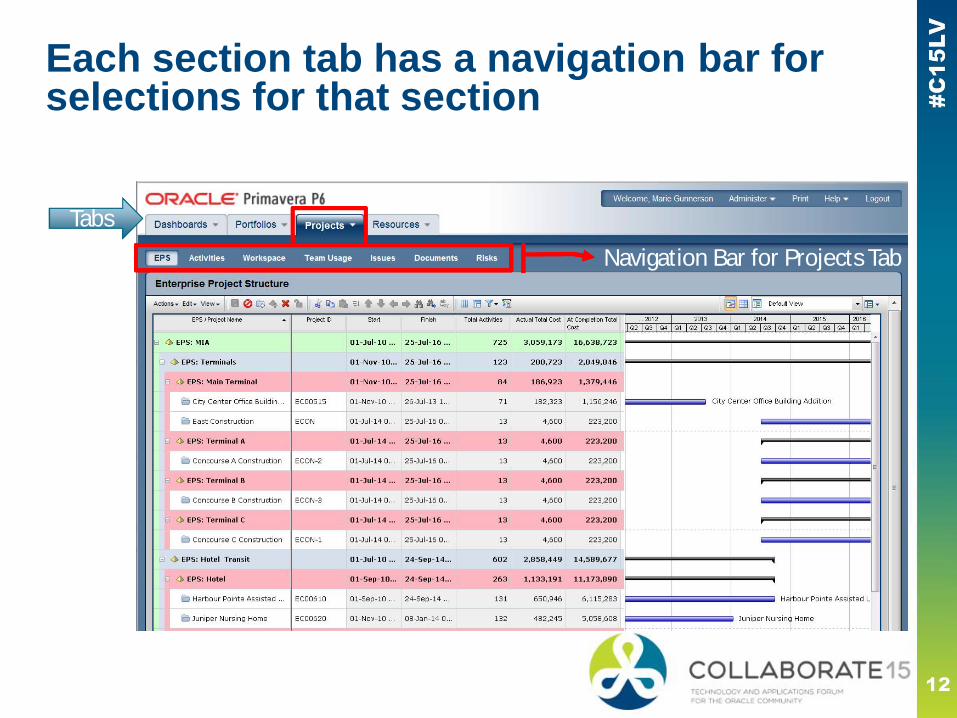
Each section tab has a navigation bar forselections for that section
TabsTabs
Navigation Bar for Projects Tab
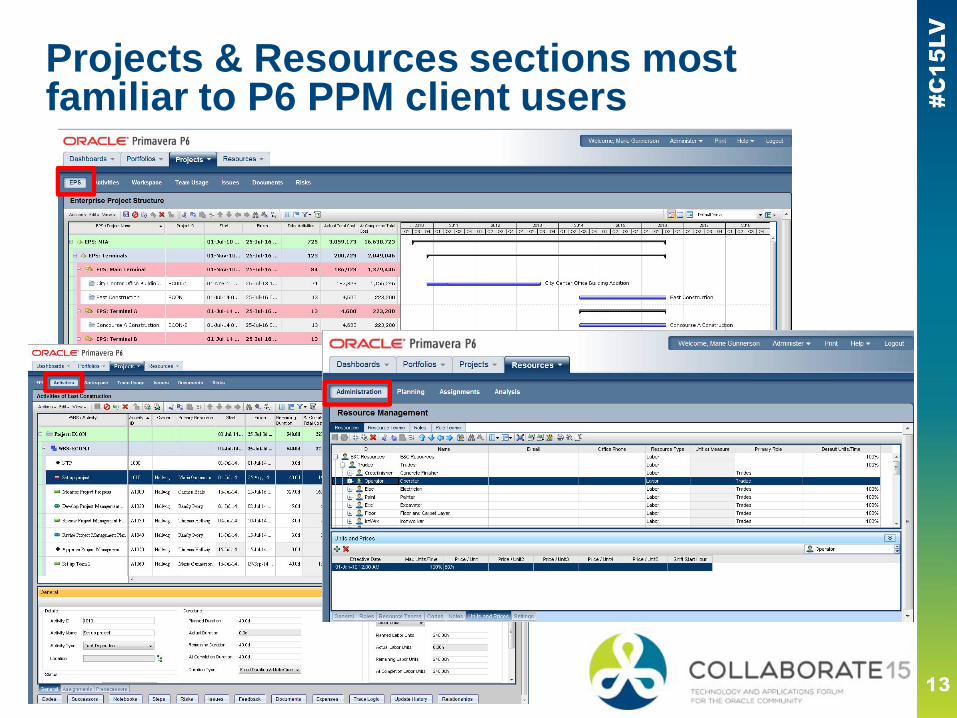
Projects & Resources sections mostfamiliar to P6 PPM client users
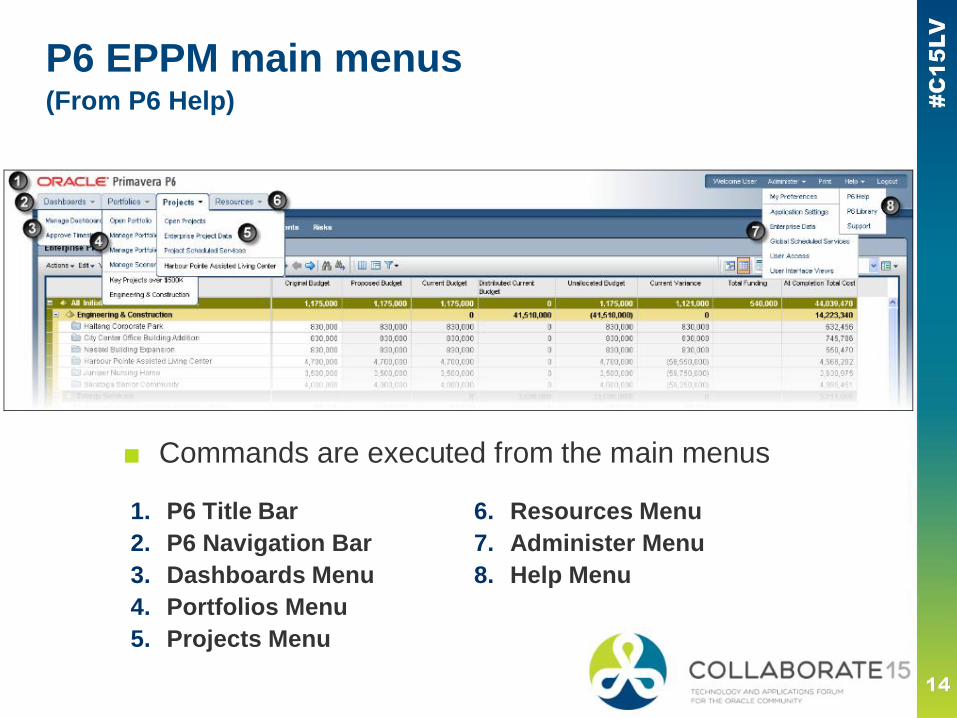
P6 EPPM main menus(From P6 Help)
1. P6 Title Bar2. P6 Navigation Bar3. Dashboards Menu4. Portfolios Menu5. Projects Menu
6. Resources Menu7. Administer Menu8. Help Menu
■ Commands are executed from the main menus
What is needed to get started withdashboards?■ P6 EPPM web interface■ EPS■ Projects with shared characteristics■ Project details to aggregate:
▪ WBS▪ Activities▪ Cost▪ Resources▪ Roles
■ An idea of what information would support your organization
For Dashboards We NeedPortfolios
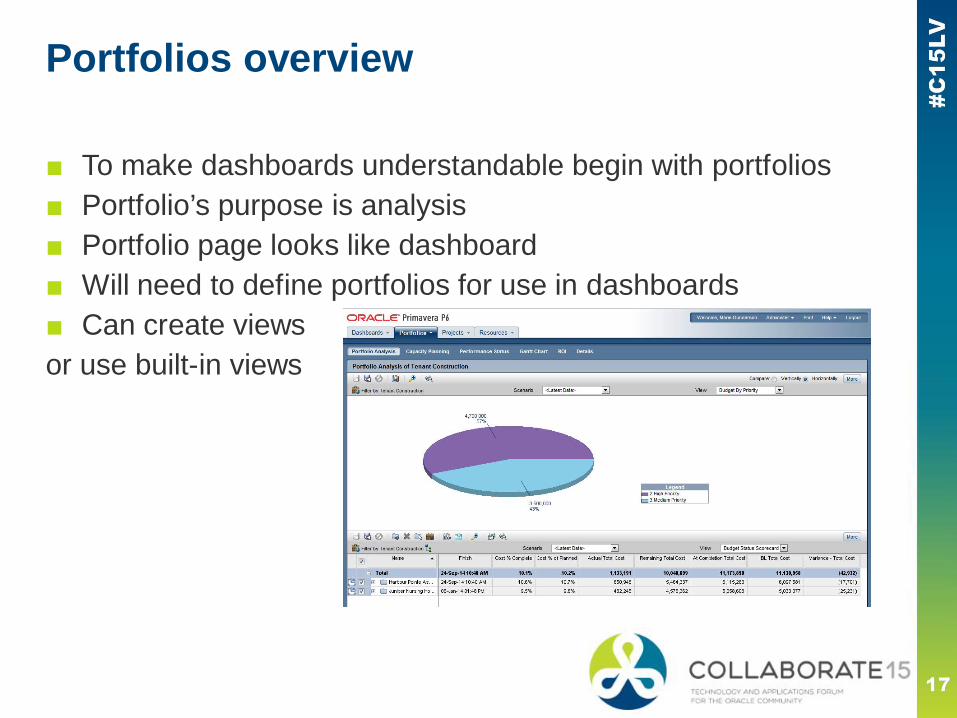
Portfolios overview
■ To make dashboards understandable begin with portfolios■ Portfolio’s purpose is analysis■ Portfolio page looks like dashboard■ Will need to define portfolios for use in dashboards■ Can create viewsor use built-in views
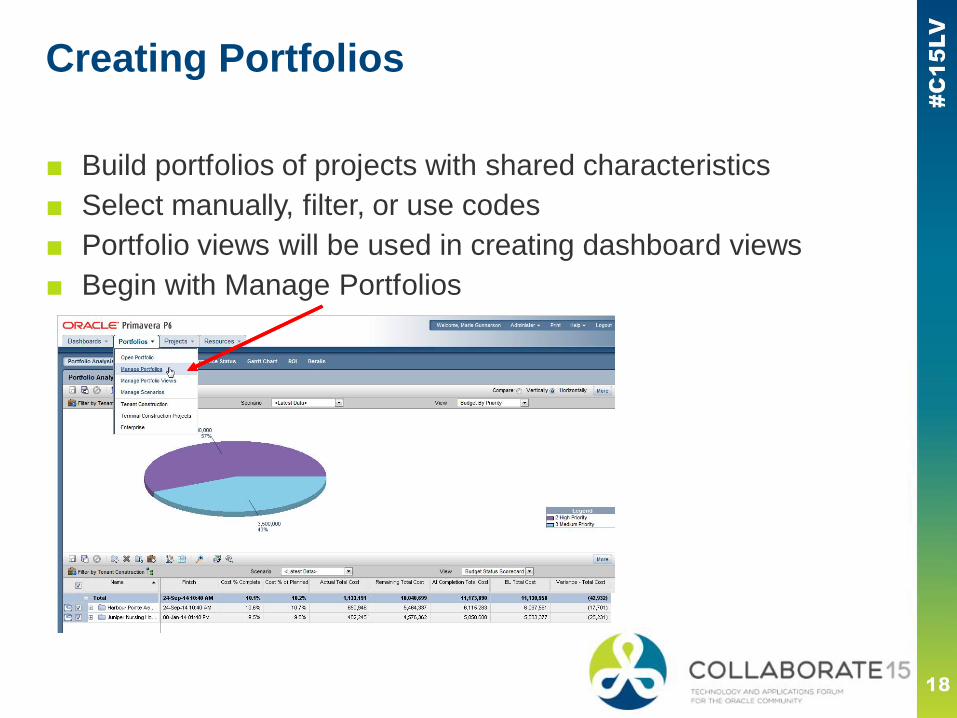
Creating Portfolios
■ Build portfolios of projects with shared characteristics■ Select manually, filter, or use codes■ Portfolio views will be used in creating dashboard views■ Begin with Manage Portfolios
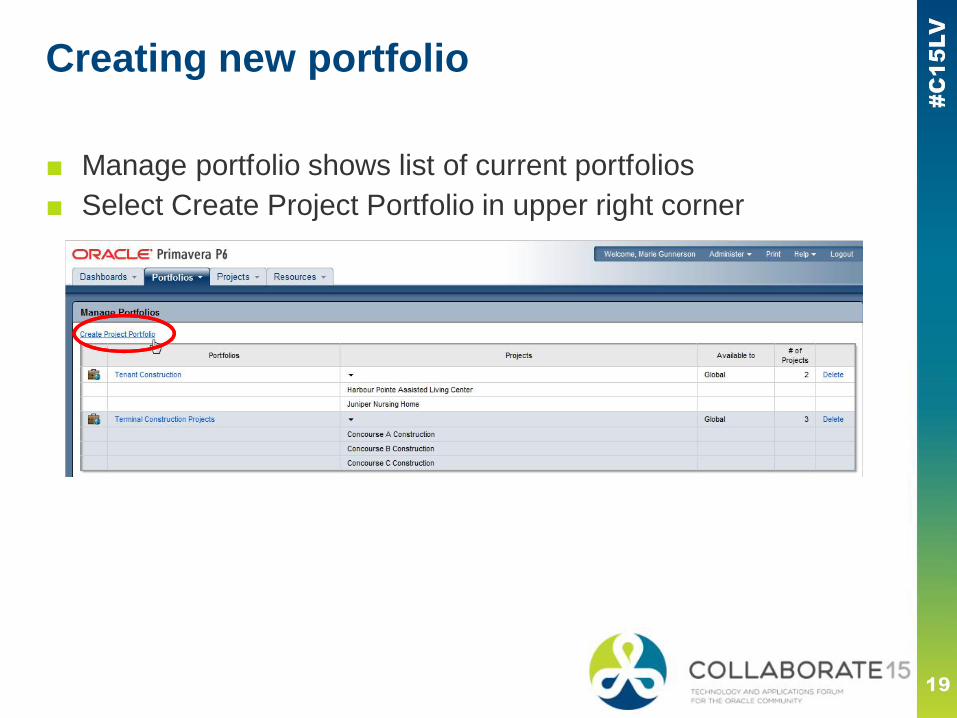
Creating new portfolio
■ Manage portfolio shows list of current portfolios■ Select Create Project Portfolio in upper right corner
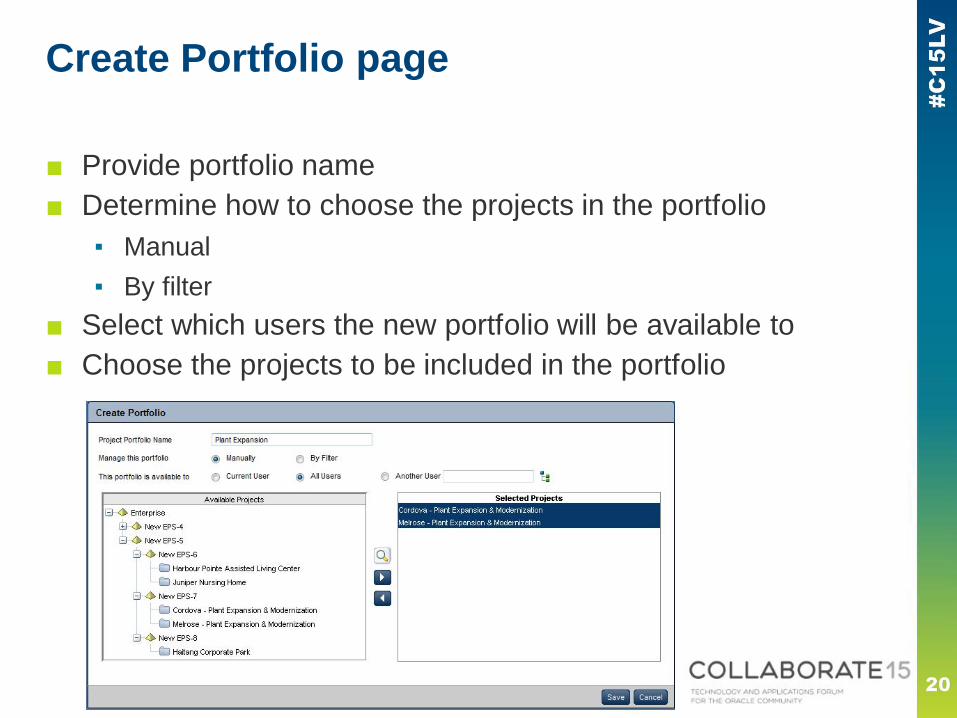
Create Portfolio page
■ Provide portfolio name■ Determine how to choose the projects in the portfolio
▪ Manual▪ By filter
■ Select which users the new portfolio will be available to■ Choose the projects to be included in the portfolio
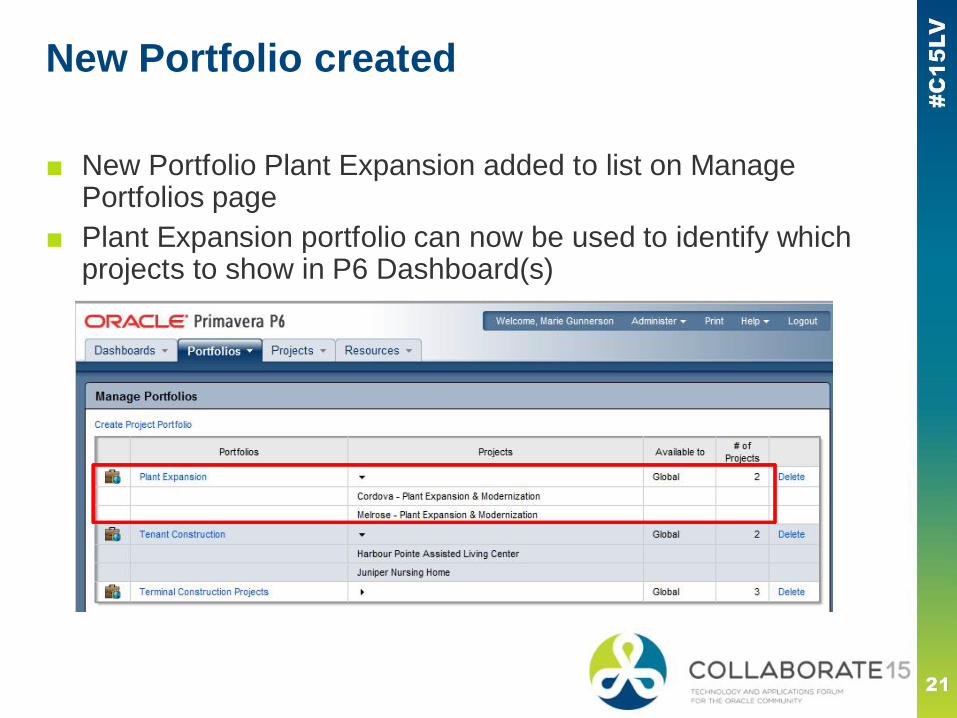
New Portfolio created
■ New Portfolio Plant Expansion added to list on ManagePortfolios page
■ Plant Expansion portfolio can now be used to identify whichprojects to show in P6 Dashboard(s)
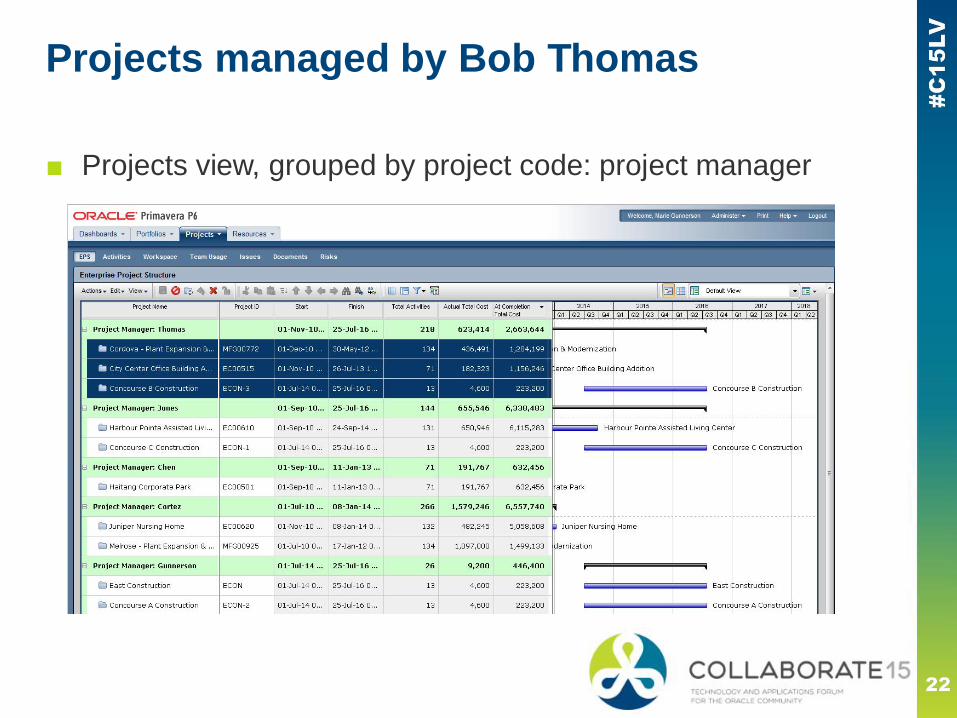
Projects managed by Bob Thomas
■ Projects view, grouped by project code: project manager
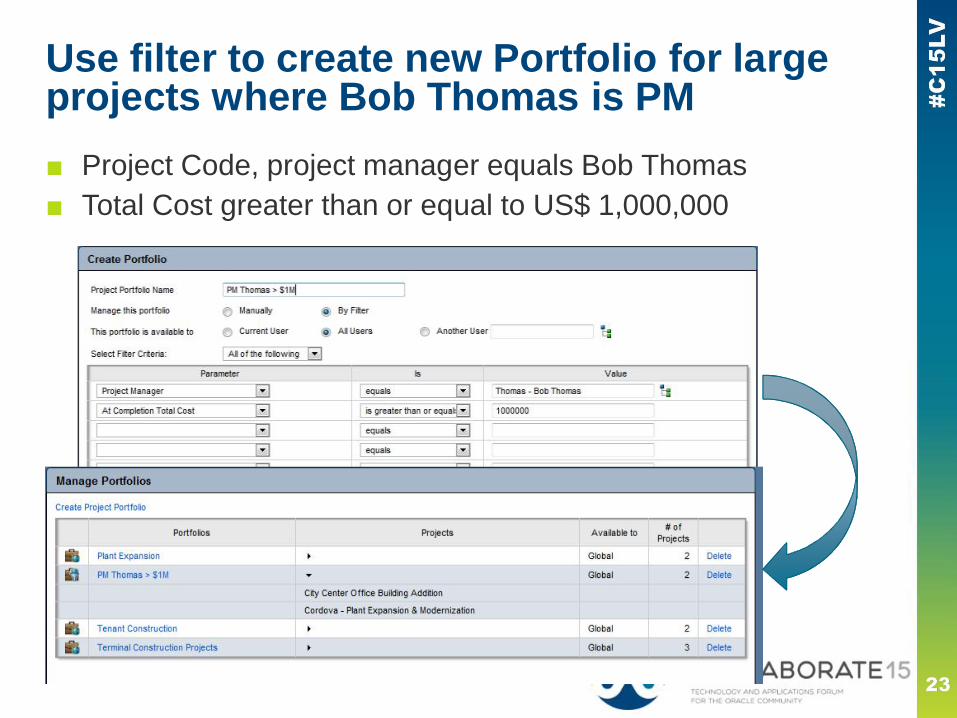
Use filter to create new Portfolio for largeprojects where Bob Thomas is PM■ Project Code, project manager equals Bob Thomas■ Total Cost greater than or equal to US$ 1,000,000
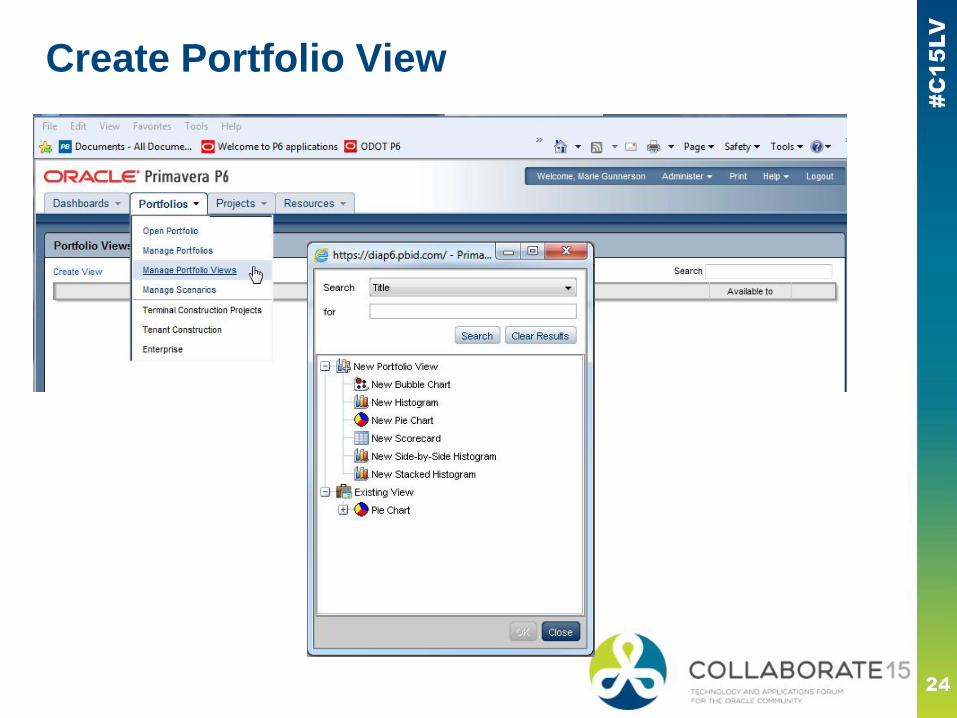
Create Portfolio View
Building Portfolio Views
■ Manage portfolio views from Portfolios main menu■ Manage Portfolio Views command■ Create View in upper left corner■ The types of views that are available include:
▪ Scorecard: Similar to tables or spreadsheets,▪ Bubble Chart: A bubble chart displays four project data fields.▪ Pie Chart: Useful for analyzing relative parts of a whole▪ Basic Histogram: Project data in a vertical bar chart format▪ Side-by-Side Histogram: A histogram where categorized data
can be grouped, side-by-side, to assist with comparisons▪ Stacked Histogram: Categorized data is grouped, or stacked.
A stacked histogram is useful when analyzing relative parts of awhole.
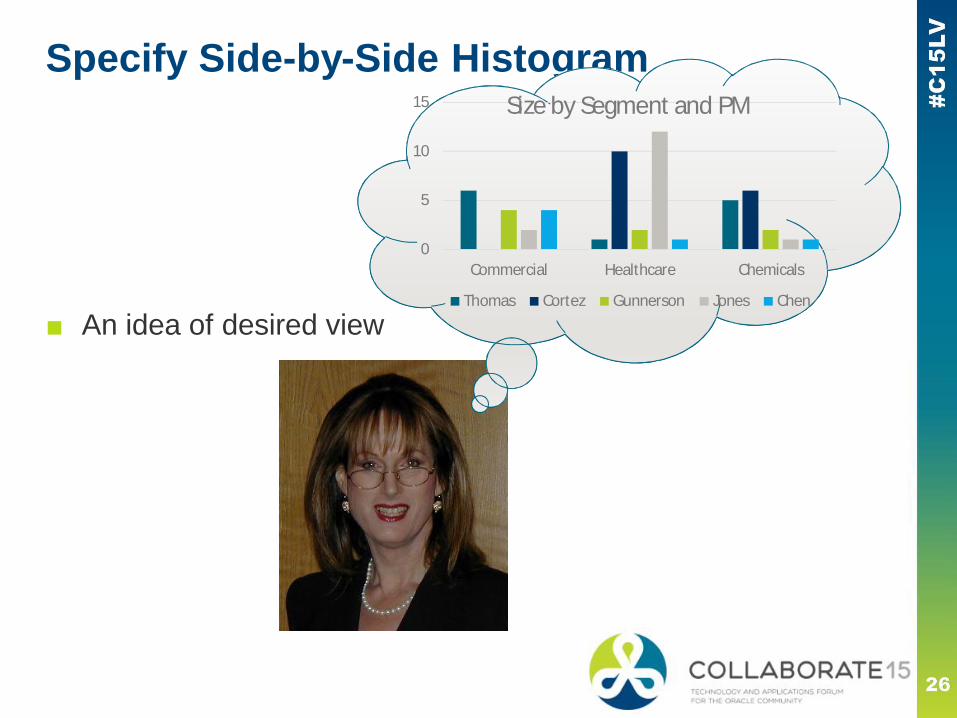
Specify Side-by-Side Histogram
0
5
10
15
Commercial Healthcare Chemicals
Size by Segment and PM
Thomas Cortez Gunnerson Jones Chen
■ An idea of desired view
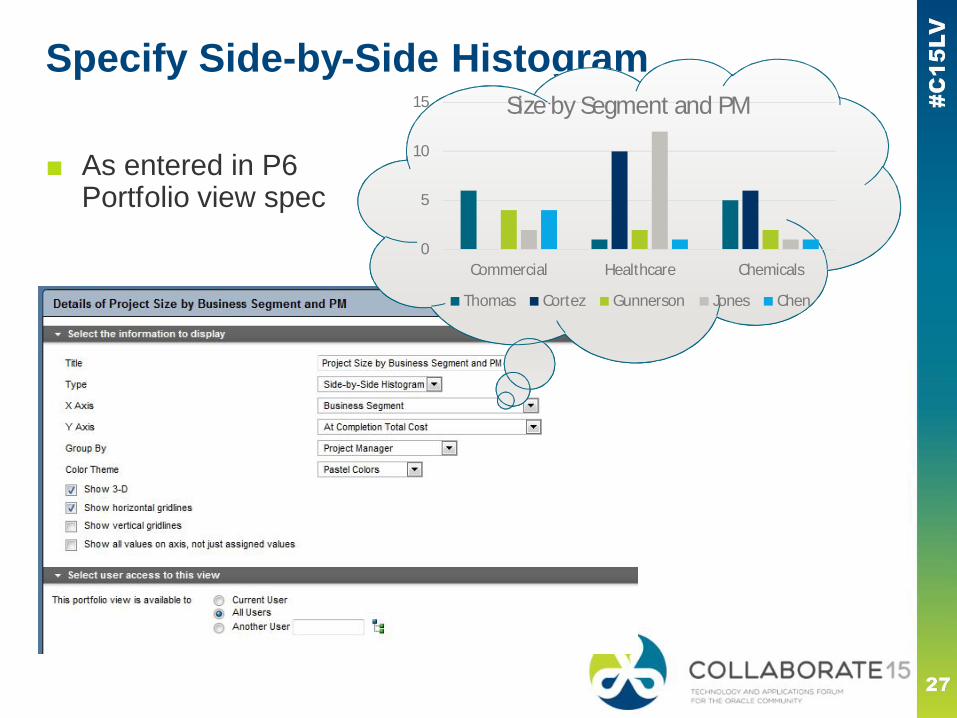
Specify Side-by-Side Histogram
0
5
10
15
Commercial Healthcare Chemicals
Size by Segment and PM
Thomas Cortez Gunnerson Jones Chen
■ As entered in P6Portfolio view spec
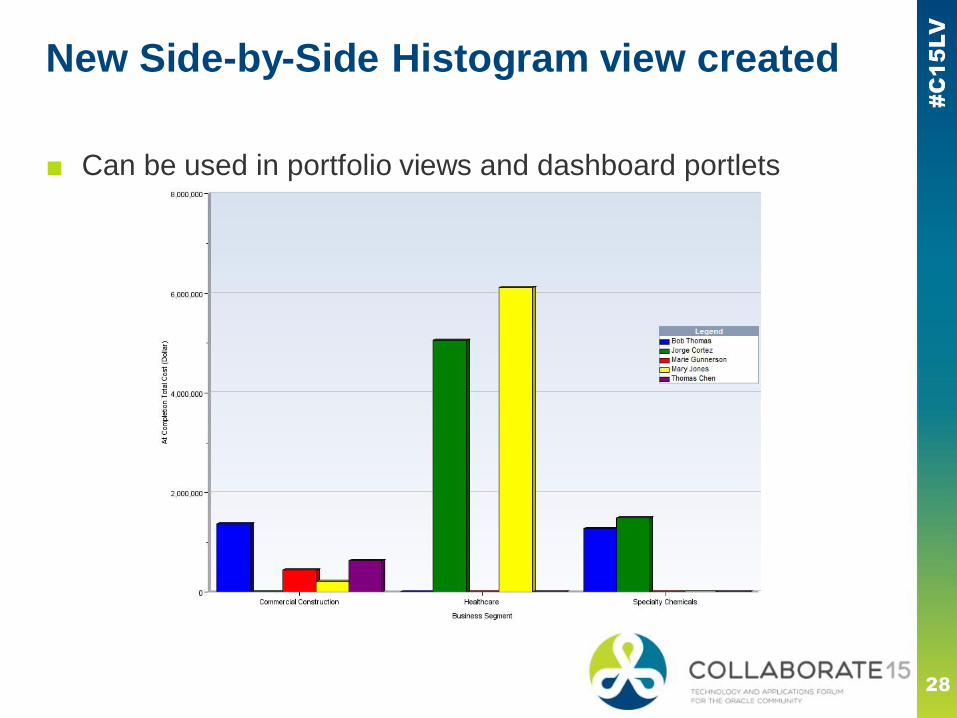
New Side-by-Side Histogram view created
■ Can be used in portfolio views and dashboard portlets
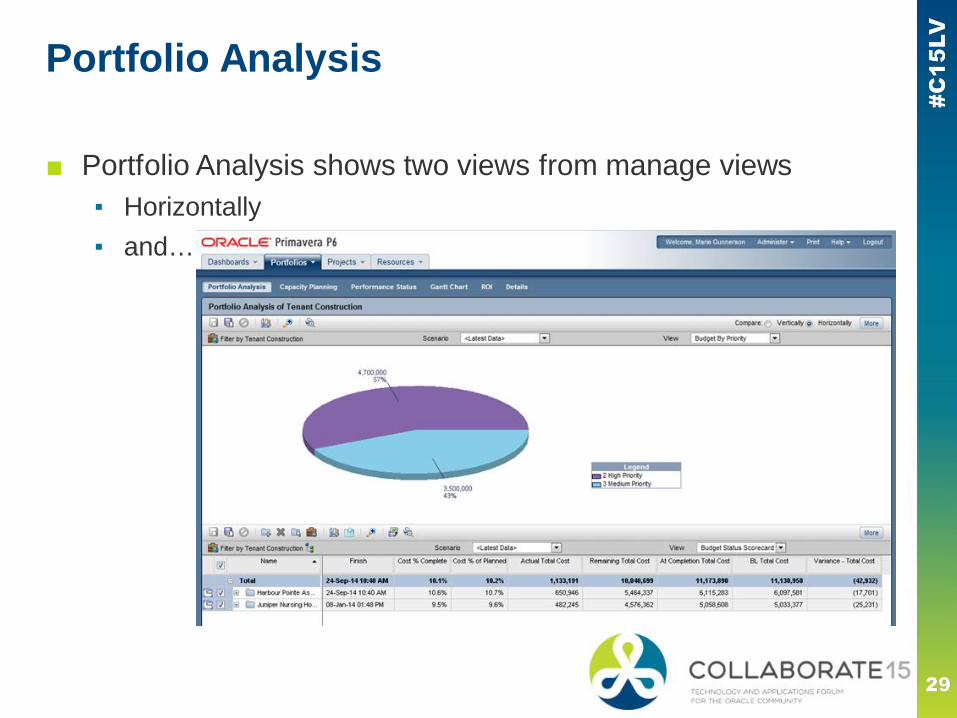
Portfolio Analysis
■ Portfolio Analysis shows two views from manage views▪ Horizontally▪ and…
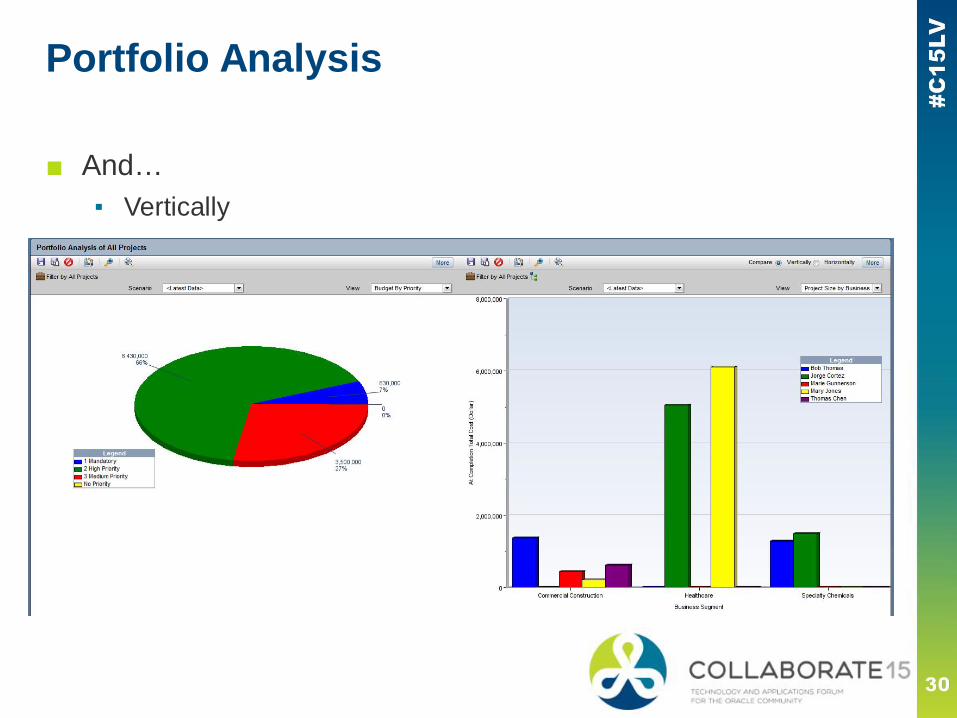
Portfolio Analysis
■ And…▪ Vertically
P6 Dashboards
P6 EPPM Dashboards
■ P6 Dashboards put it all together in a customizable form■ Consolidates information for strategic decision making■ Develop specific dashboard views to meet the needs of:
▪ Entire organization▪ Functions▪ Groups▪ Individuals
■ Provide shared or personal views■ I.e, flexible
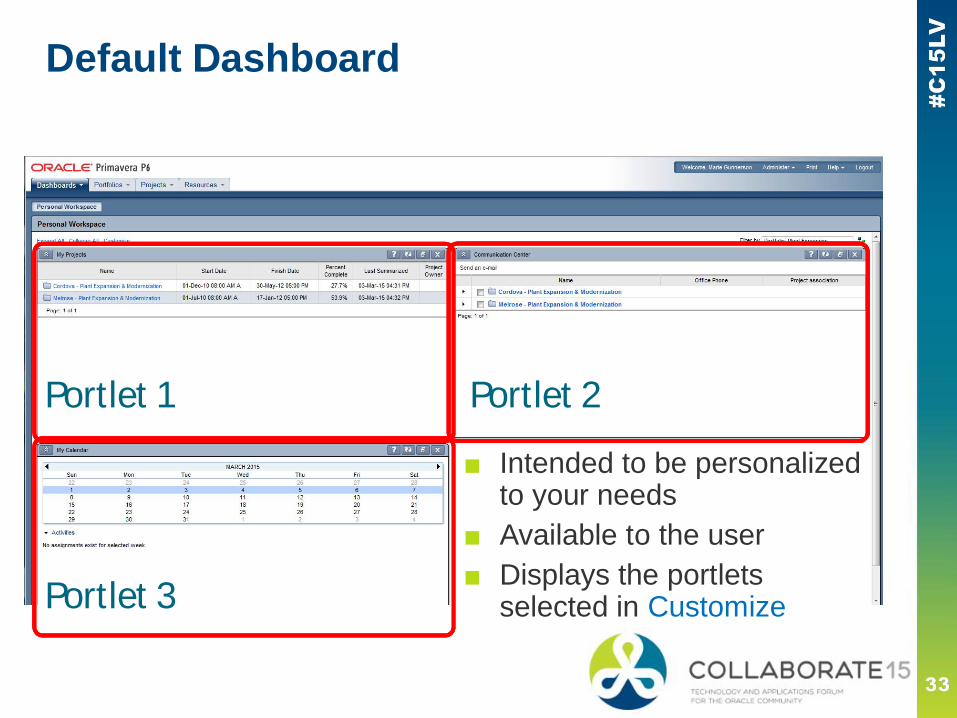
Default Dashboard
■ Intended to be personalizedto your needs
■ Available to the user■ Displays the portlets
selected in Customize
Portlet 1 Portlet 2
Portlet 3
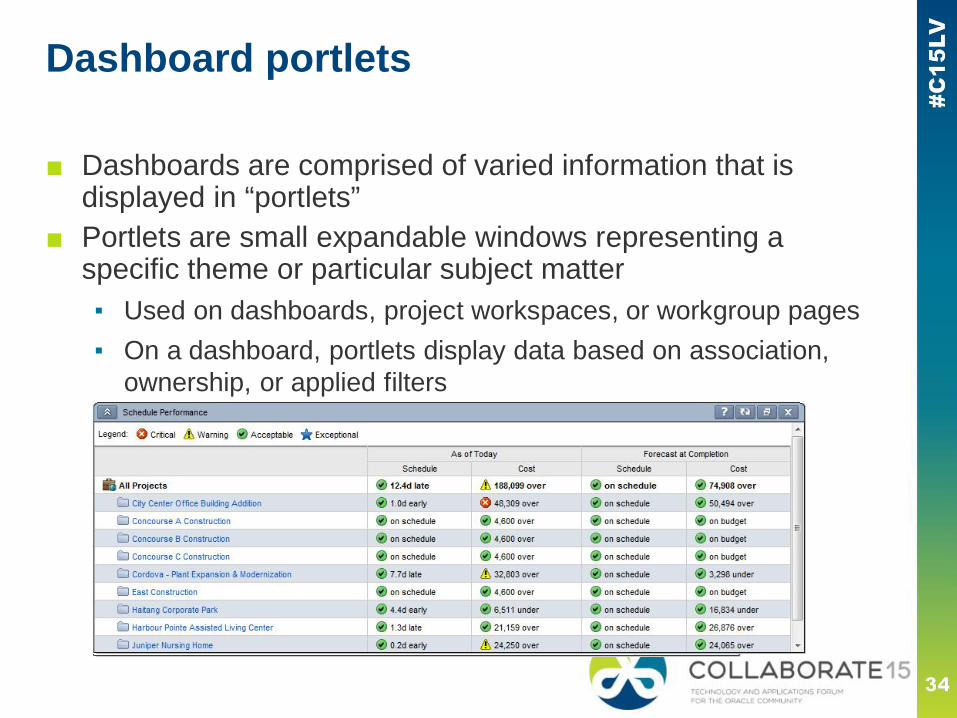
Dashboard portlets
■ Dashboards are comprised of varied information that isdisplayed in “portlets”
■ Portlets are small expandable windows representing aspecific theme or particular subject matter▪ Used on dashboards, project workspaces, or workgroup pages▪ On a dashboard, portlets display data based on association,
ownership, or applied filters
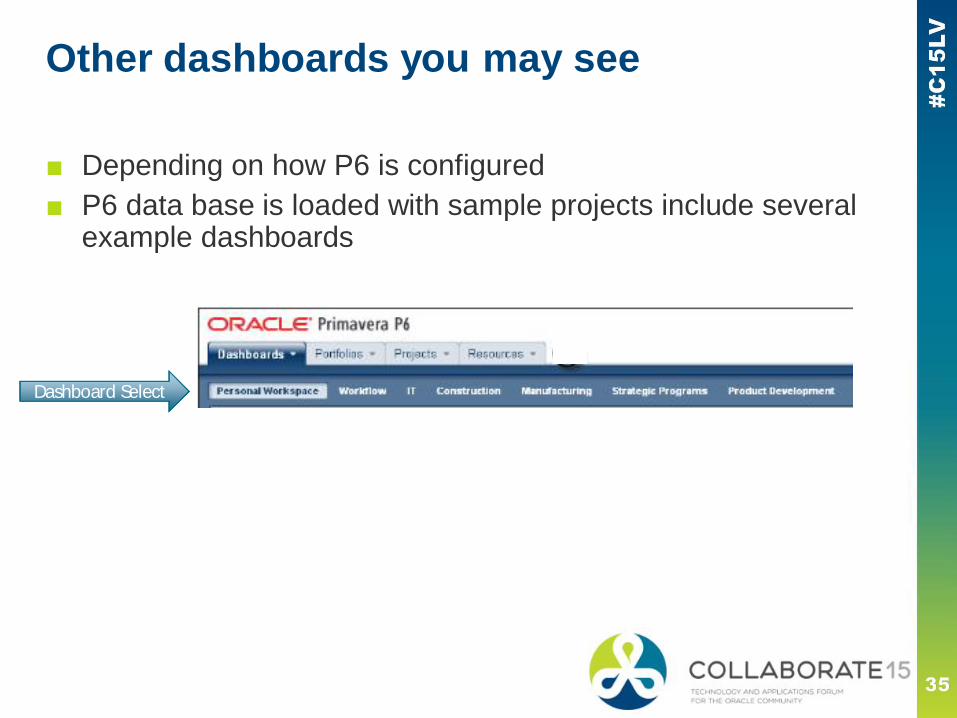
Other dashboards you may see
■ Depending on how P6 is configured■ P6 data base is loaded with sample projects include several
example dashboards
Dashboard SelectDashboard Select
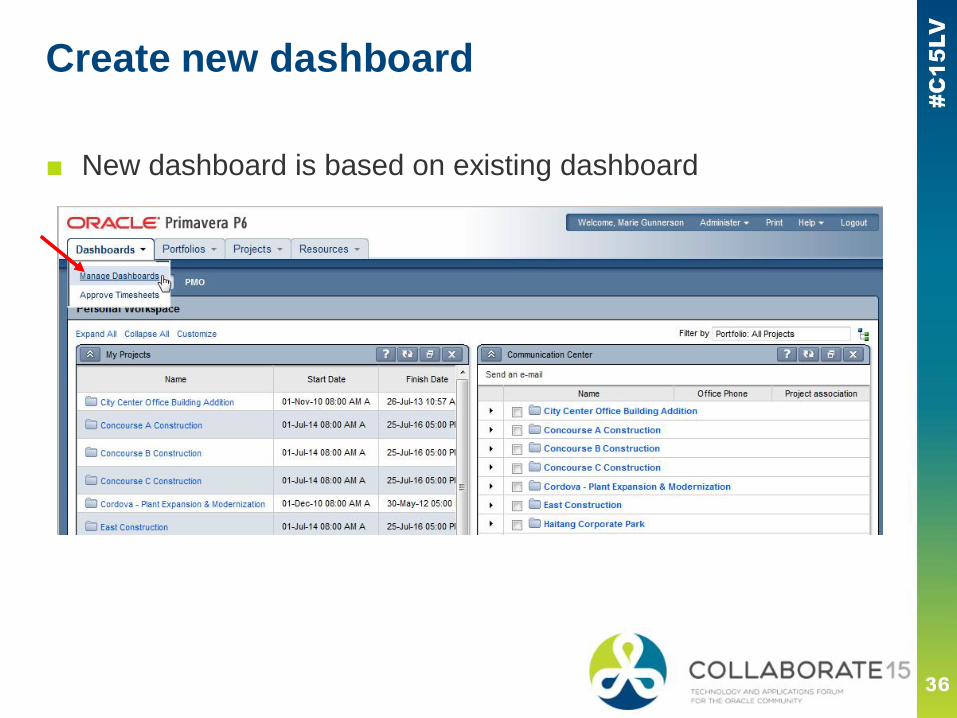
Create new dashboard
■ New dashboard is based on existing dashboard
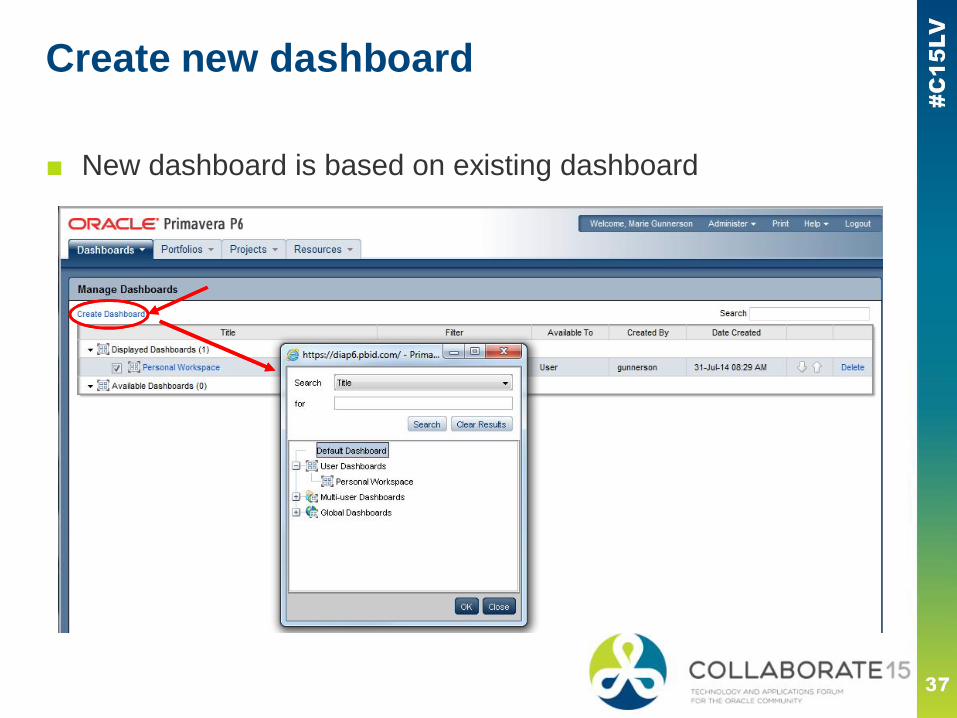
Create new dashboard
■ New dashboard is based on existing dashboard
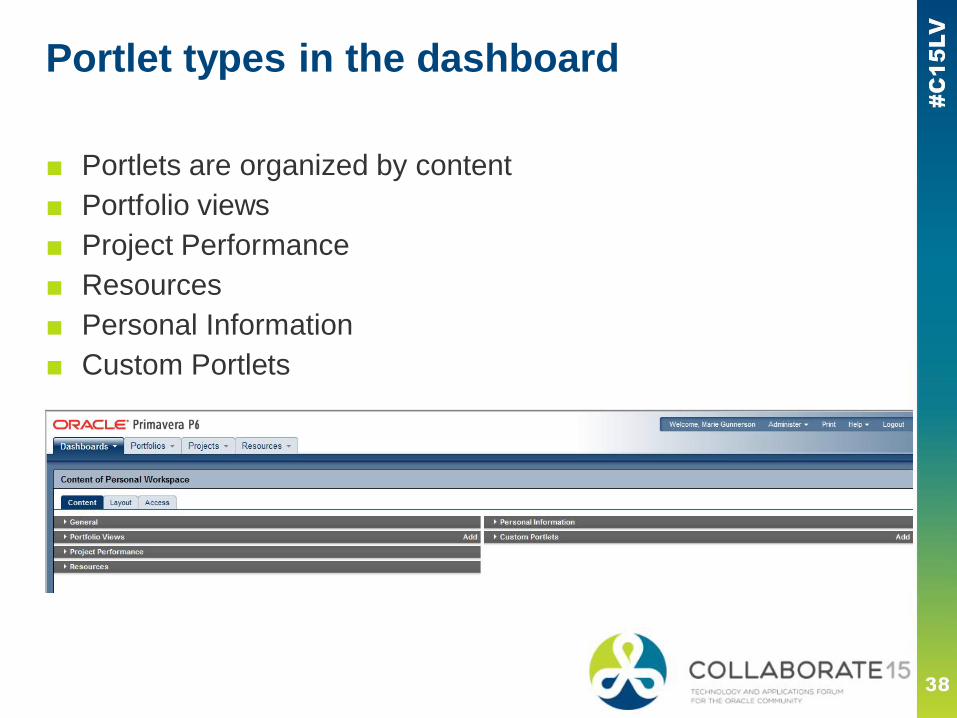
Portlet types in the dashboard
■ Portlets are organized by content■ Portfolio views■ Project Performance■ Resources■ Personal Information■ Custom Portlets
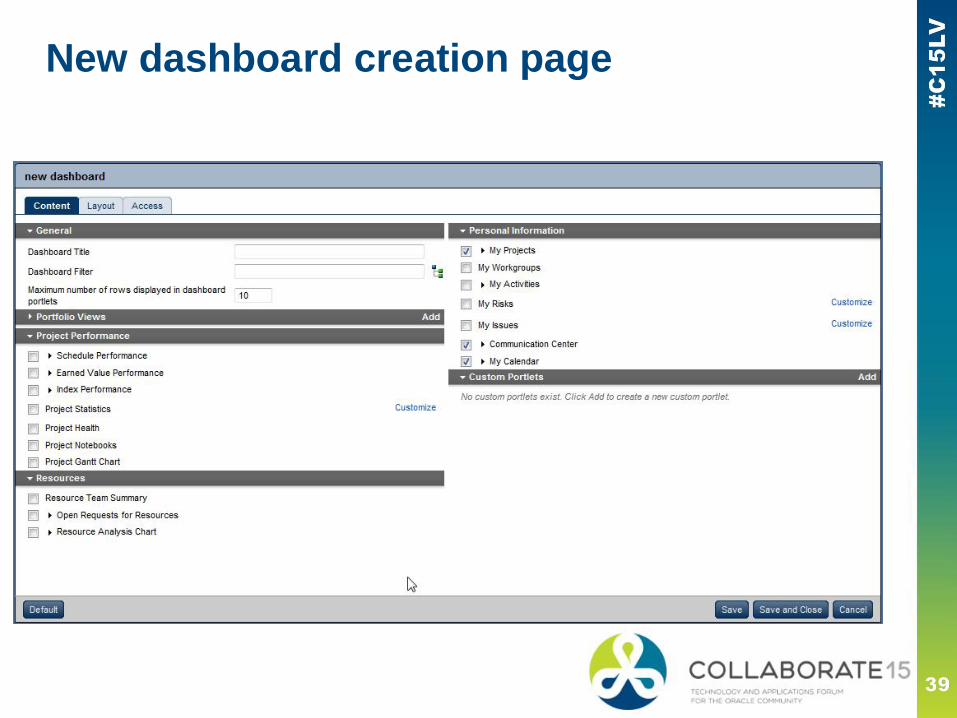
New dashboard creation page
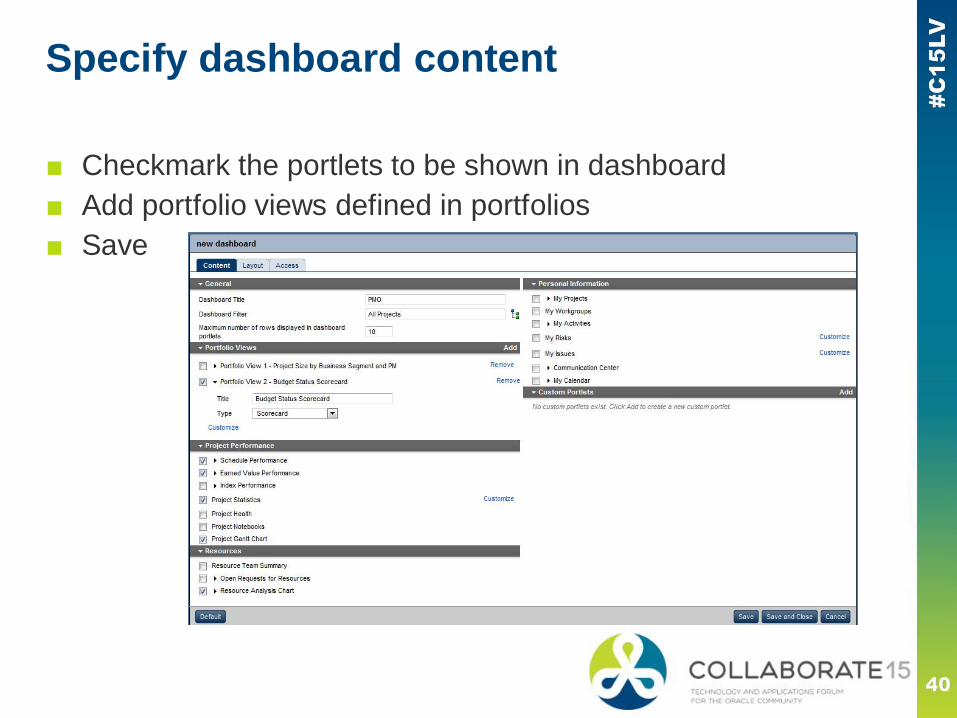
Specify dashboard content
■ Checkmark the portlets to be shown in dashboard■ Add portfolio views defined in portfolios■ Save
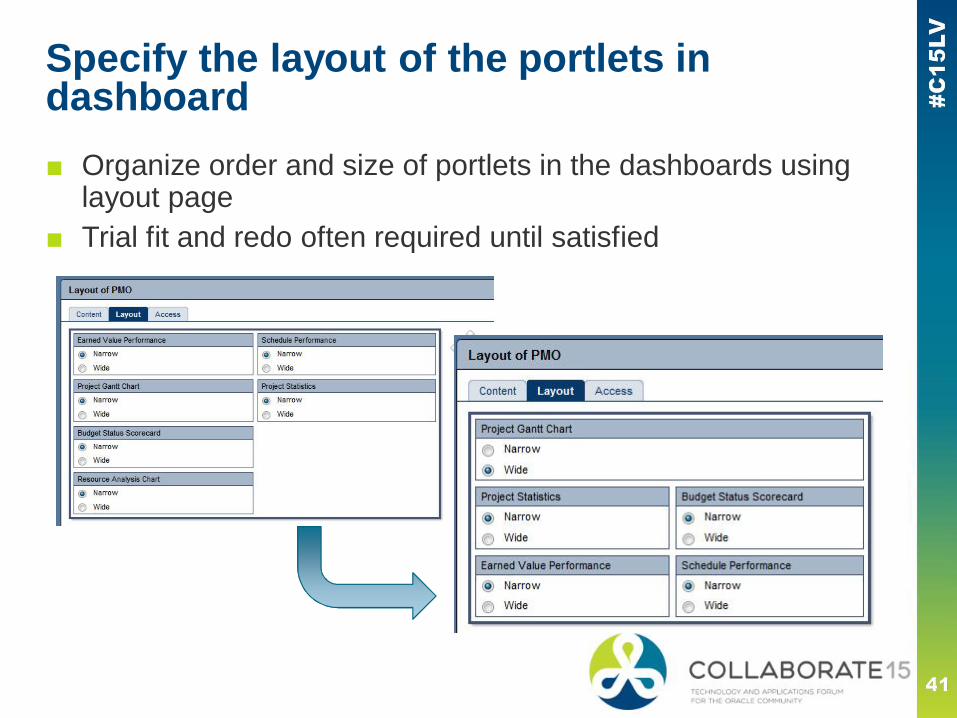
Specify the layout of the portlets indashboard■ Organize order and size of portlets in the dashboards using
layout page■ Trial fit and redo often required until satisfied

Define access to new dashboard
■ Select who can see the new dashboard▪ You as the user▪ All the users▪ Specific users
■ Save
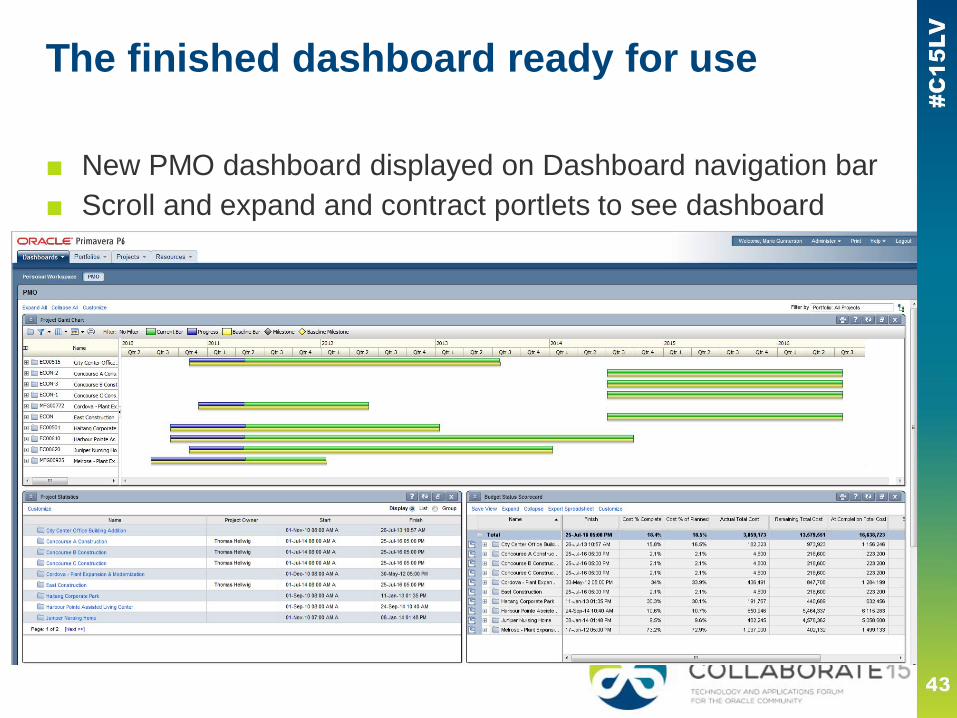
The finished dashboard ready for use
■ New PMO dashboard displayed on Dashboard navigation bar■ Scroll and expand and contract portlets to see dashboard
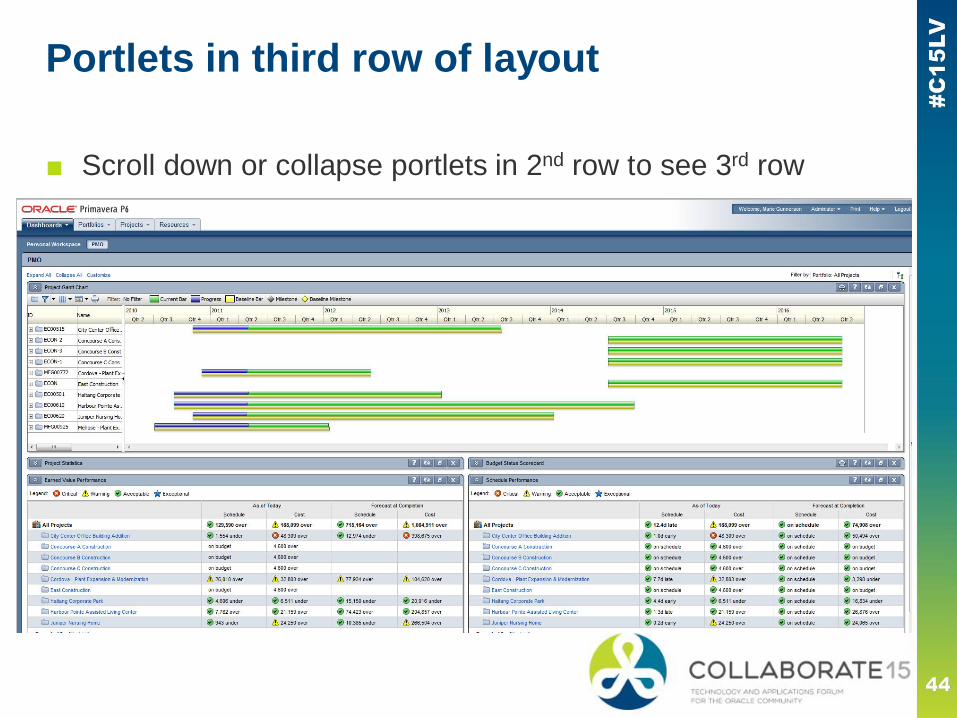
Portlets in third row of layout
■ Scroll down or collapse portlets in 2nd row to see 3rd row
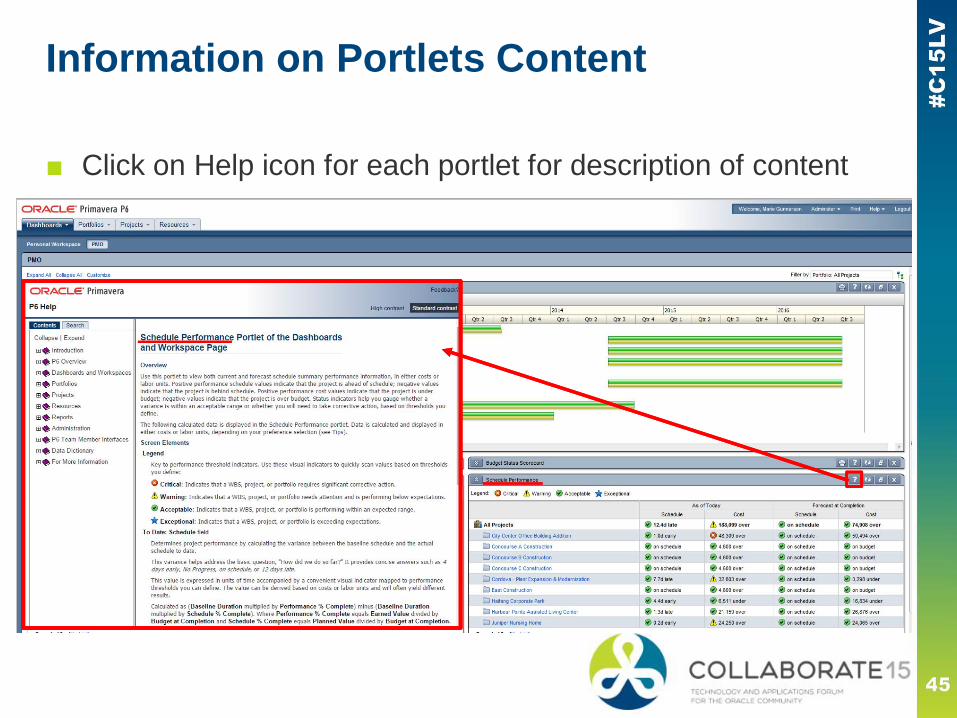
Information on Portlets Content
■ Click on Help icon for each portlet for description of content
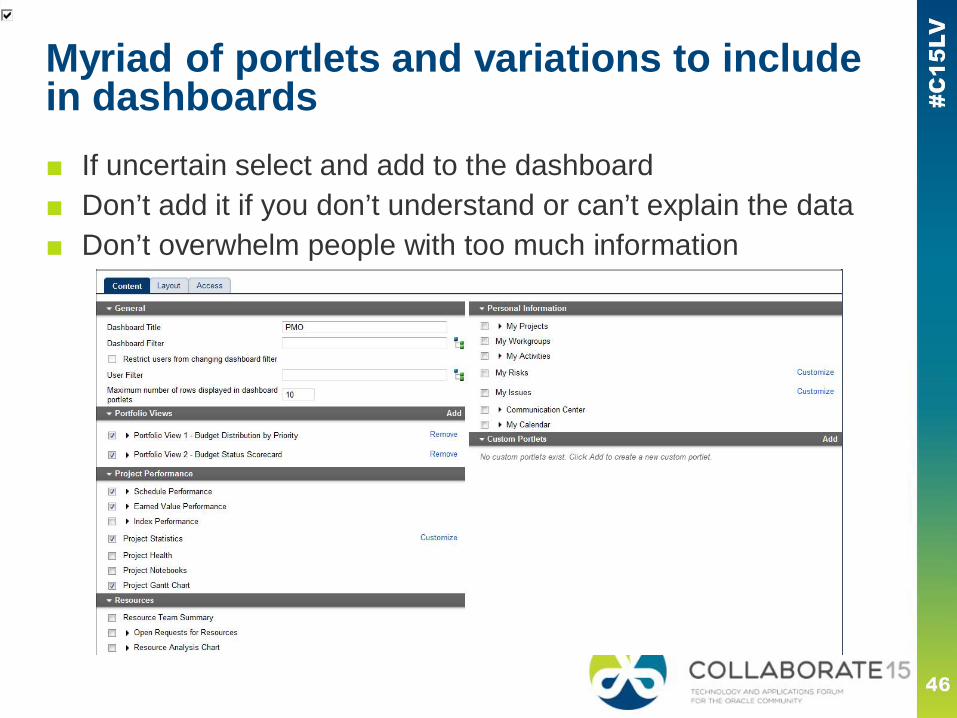
Myriad of portlets and variations to includein dashboards■ If uncertain select and add to the dashboard■ Don’t add it if you don’t understand or can’t explain the data■ Don’t overwhelm people with too much information
ResourceNameSO_ASCtruetrue
Live Demonstration
Last thoughts
■ Accept inevitable change■ Helps to have cheerleader – if not a champion■ Program / portfolio level steering committee■ Training for data creators and consumers■ Don’t stop training■ Transparency
How might weengage
everyone?
Thank you for attending- early in the day!
■ Marie Gunnerson
■ +1-617-960-4884
■ Chair OPSIG▪ www.primaverasig.com
Speaker Contact Info:

Please complete the sessionevaluationWe appreciate your feedback and insight
You may complete the session evaluation eitheron paper or online via the mobile app
■ Our purpose is to inform and educate our members on current and futurefunctionality of Oracle Primavera products, while offering a forum for peers toshare their experience and knowledge in the use of Primavera.
■ Educational opportunities across the Primavera product suite
■ Online Learning Series August 17th – September 4th
■ Call for presentation opening April 27th
■ Monthly Community Calls
■ 3rd Thursday of the month at 1:00 pm ET
■ Networking with other users within the Primavera community
■ Partnering with Oracle Primavera to meet the needs of our diversemembership.
■ Membership is open to anyone with an interest in the Oracle Primavera products,with no dues for membership. All members can vote on matters brought beforethe OPSIG. Membership requests may be reviewed by the OPSIG board.
OPSIG is the home forPrimavera Users