demonstration of the realeyes intrusion detection system
TRANSCRIPT
Demonstration ofThe Realeyes Intrusion Detection System
Jim SansingMay 14, 2008
For more information, see the project website and blog:
http://realeyes.sourceforge.nethttp;//realeyestech.blogspot.com

The Realeyes project consists of an analysis library that is used to build a network Intrustion Detection System (IDS). This paper describes a live demonstration that was presented to the Columbia Area Linux Users Group (http://www.calug.org) at the monthly meeting.
The project designers have used several security tools for monitoring networks and wanted to incorporate the most useful features of them, and some unique ones, in a single application. These features include:
● Collection of enough data to provide context for reported detects● Reduction of false positives by supporting rule definitions that include both halves of
TCP sessions● Playback of both halves of TCP sessions● Statistics collection● The capability to save serious incidents for trends analysis and reporting● Built in reports
The Realeyes IDS system consists of four components:
● IDS sensor● Database● Database – IDS interface (database daemon or DBD)● User interface
All four were running on the demonstration host, but may be installed in separate hosts or other reasonable combinations. The demonstration did not include an installation of the system, but at the end the IDS installation script was run partially as an example of how the scripts eliminate the need for editing configuration files.
This demonstration was intended to show the current status of the project, which is in Beta testing. The members of CALUG in attendance were mostly familiar with security tools in general and network IDSes in particular, so the focus was on the specifics of the application.
The following screenshots were taken after the presentation, to give a sense of what was covered. A few screenshots have been added of material that was not covered during the demonstration.

The demonstration began by running the IDS, which is a C application. In these screenshots of top, the columns to notice are NI, RES, and %CPU. The 'Nice' values of the rids_* processes are modified according to the number of buffers or structures queued for each process, versus the number that have been handled. The values are relative to each other, so that processes which are falling behind are given the most (lowest) priority.

This screenshot shows the console output of the IDS. Every 32K packets, the Collector displays the total number of packets it has processed. The MAIN LOOP shows the number of 1Meg segments allocated, out of the total memory allocated (in Meg).
The Streams information is displayed each minute, and the interesting fields are New, Current and Largest. For the IDS, a Stream is ½ of a TCP session, so this display shows that approximately 5,000 sessions are active. The maximum number that has been recorded is just over 70,000 streams = 35,000 TCP sessions, and that is using a 733 MHz CPU and 1Gig of memory.
Near the bottom is a line that starts with GCB. This indicates that the 'Get Circular Buffer' function has been called, which means that a report is being generated for a session and needs additional buffer space.

The next part of the demo was to show the results in the user interface, which is a Java application. The information for each record reported is inserted into the database, and the user interface displays it on a single line. The total number of incidents is indicated at the bottom. The maximum number displayed can be set in the preferences.
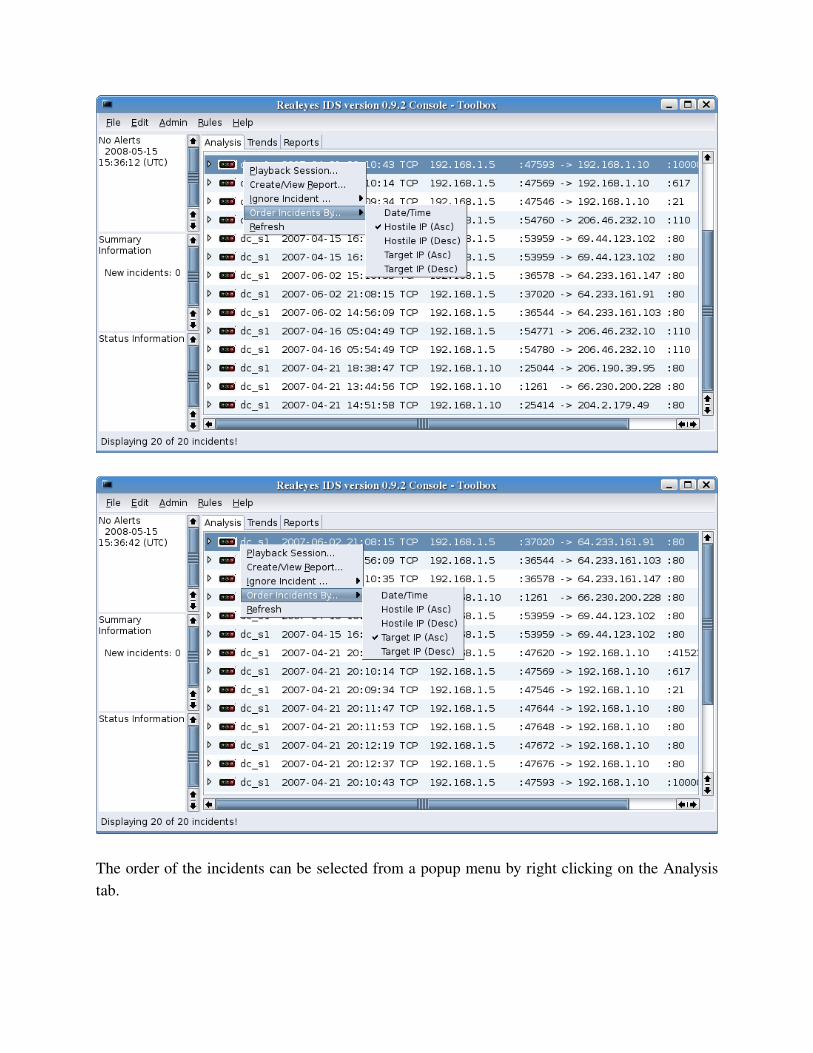
The order of the incidents can be selected from a popup menu by right clicking on the Analysis tab.
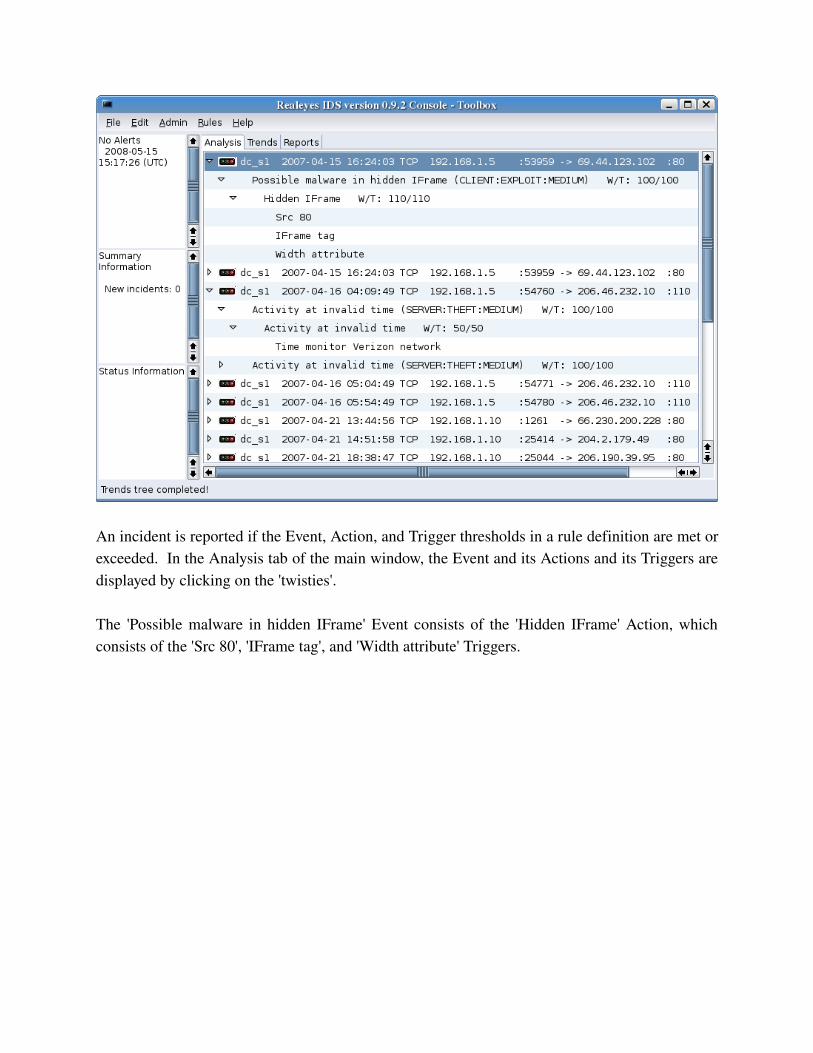
An incident is reported if the Event, Action, and Trigger thresholds in a rule definition are met or exceeded. In the Analysis tab of the main window, the Event and its Actions and its Triggers are displayed by clicking on the 'twisties'.
The 'Possible malware in hidden IFrame' Event consists of the 'Hidden IFrame' Action, which consists of the 'Src 80', 'IFrame tag', and 'Width attribute' Triggers.

By selecting 'Playback Session' from the Analysis tab popup menu, the data captured from the TCP session is displayed. By scrolling down through the server data, the Triggers that caused the record to be reported are found to be highlighted.
Also notice that the width of the frames have been adjusted by moving the center scroll bar.
Two of the Triggers that were defined for this rule are displayed on the next page. The Plugin name defines which IDS process uses the definition, which in these cases are rids_stra_data and rids_stra_tcp. The Function allows Triggers to be organized into groups. The Trigger type defines whether it is matching on any string in a packet payload or a specific location in a TCP/IP header.
The only condition flag set for the 'IFrame tag' Trigger is to allow Mixed case. The Global flag set for the 'Dest 80' Trigger indicates that it is true for the entire session and should be reported only once.


The playback for the 'Activity at invalid time' is displaying the session headers after clicking on the 'Show Headers' button at the bottom of the window (which then becomes the 'Show Payload' button). The Trigger that was detected for this session is a Special Trigger, and is shown on the next page. It looks for activity occurring between certain times and reports everything detected.
The headers display the timestamp of the packet, the IP header, and any other appropriate header data. In this case, there are TCP headers which have options.

Special Triggers are created by writing code in the IDS plugin processes to search for conditions that are not simple string or location matches. In this case, the IPTIME Trigger looks for any activity occurring between 11:00 pm and 2:00 am, local time, on the network 206.46.232.0.

Another Special Trigger parses the TCP options field for invalid use. This screenshot is of a few of the incidents that have been reported on this Trigger. They may be buggy code, or they may be crafted packets doing OS fingerprinting.
The first example displays a hex dump of the TCP header (minus the ports field). The 7 at the beginning of the third word is the number of 4 octet words in the header, including options. But the last word, '01020402' is extending beyond that length:
● 01 = NOP● 02 = Maximum segment size option● 04 = Length (including option and length)● 02 = First octet of MSS value
The second example option field has an invalid length in the last word, '04020802':● 04 = SACK permitted● 02 = Length● 08 = Time Stamp option● 02 = Length (should be 10 or x0A)
The third example has End of Line (EOL) options followed by more options.

Included in the user interface help are some reference files, including the list of registered (and unregistered, ie. 33 and 76) TCP options. Any reference data may be added to the system by creating a text file, naming it something.ref, and copying it to the directory where the application code is located.

The Action definitions are more complicated because they associate Triggers with an Action. The 'Hidden IFrame' Action has six Triggers associated with it.
The highlighted 'IFrame tag' Trigger definition has a weight of 50. The total weights of detected Triggers must equal or exceed the threshold weight of 110 defined in the Action for it to be reported. This Trigger also has a sequence number defined. On the right panel, it can be seen that the 'Height attribute' Triggers have a sequence number of 2. This means that the attributes must follow the tag to be counted.
Finally, the 'IFrame tag' Trigger has the Same line flag set. The Action End of line field defines what characters end a line, in this case the end of an IFrame tag, so the attribute Triggers must be between the start and end IFrame tags.
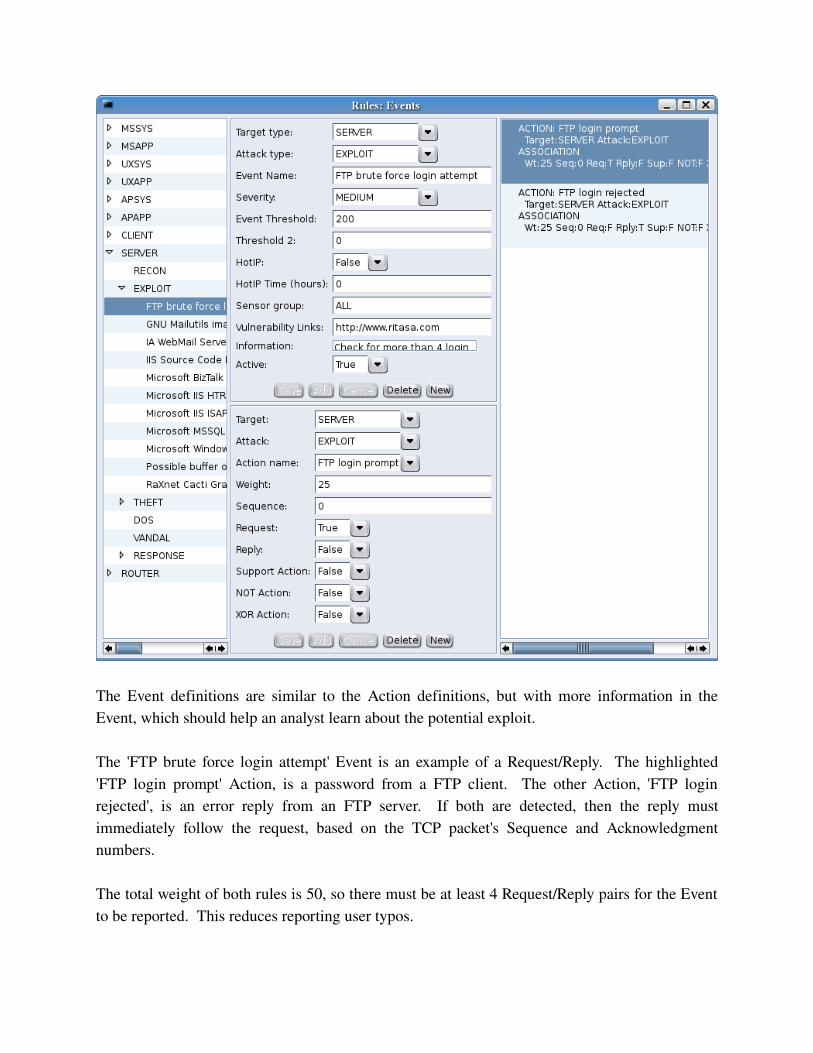
The Event definitions are similar to the Action definitions, but with more information in the Event, which should help an analyst learn about the potential exploit.
The 'FTP brute force login attempt' Event is an example of a Request/Reply. The highlighted 'FTP login prompt' Action, is a password from a FTP client. The other Action, 'FTP login rejected', is an error reply from an FTP server. If both are detected, then the reply must immediately follow the request, based on the TCP packet's Sequence and Acknowledgment numbers.
The total weight of both rules is 50, so there must be at least 4 Request/Reply pairs for the Event to be reported. This reduces reporting user typos.
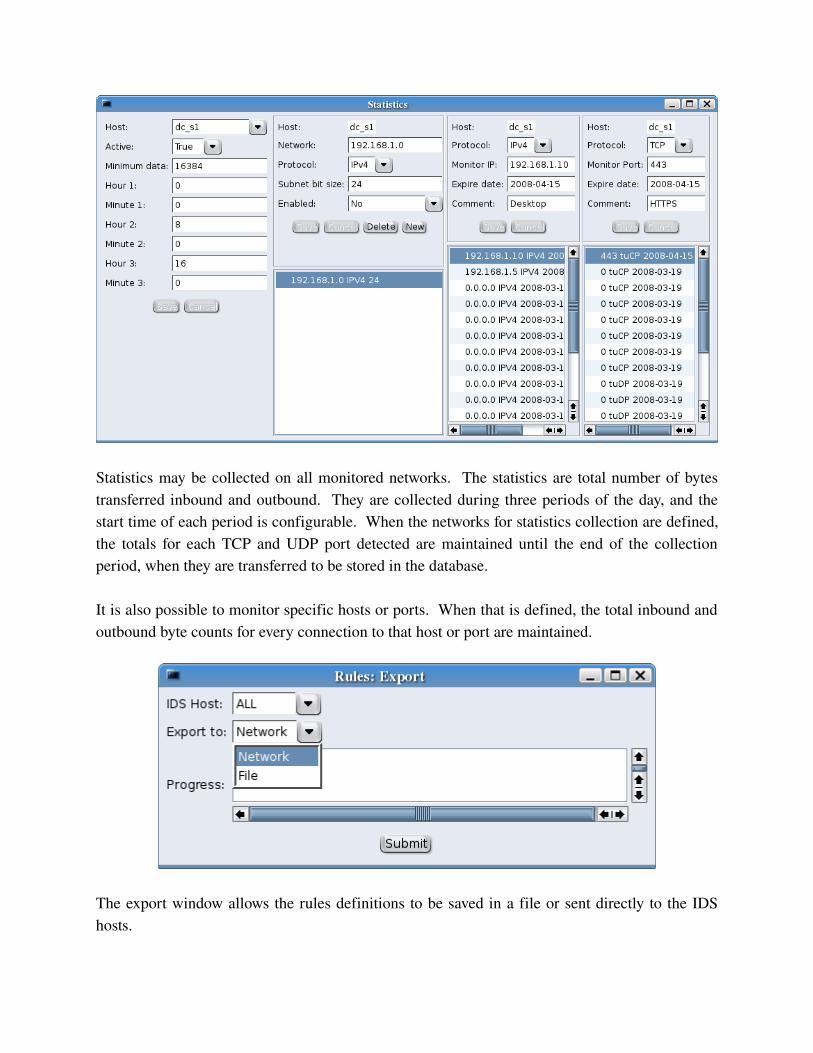
Statistics may be collected on all monitored networks. The statistics are total number of bytes transferred inbound and outbound. They are collected during three periods of the day, and the start time of each period is configurable. When the networks for statistics collection are defined, the totals for each TCP and UDP port detected are maintained until the end of the collection period, when they are transferred to be stored in the database.
It is also possible to monitor specific hosts or ports. When that is defined, the total inbound and outbound byte counts for every connection to that host or port are maintained.
The export window allows the rules definitions to be saved in a file or sent directly to the IDS hosts.

If an incident is serious, it may be saved in a report for trends analysis. This is done by selecting the Create/View Report button on the Analysis tab. The report window has three tabs, and the Whois tab is shown in this screenshot. A whois query is run in the background to determine where both IP addresses in the reported session are registered.
The information in the left frame is automatically added, but may be modified by an analyst. Then the Save Report button is clicked to save the report to the database.

In the Trends tab of the main window, the reports may be displayed based on a variety of search criteria. The From/To dates are mandatory, but the reports may be limited to specific hosts or ports. The playback window may be displayed by using the same popup window as found n the Analysis tab.

The Report tab on the main window provides several predefined reports. The reports may display the information from the Analysis tab or Trends tab.
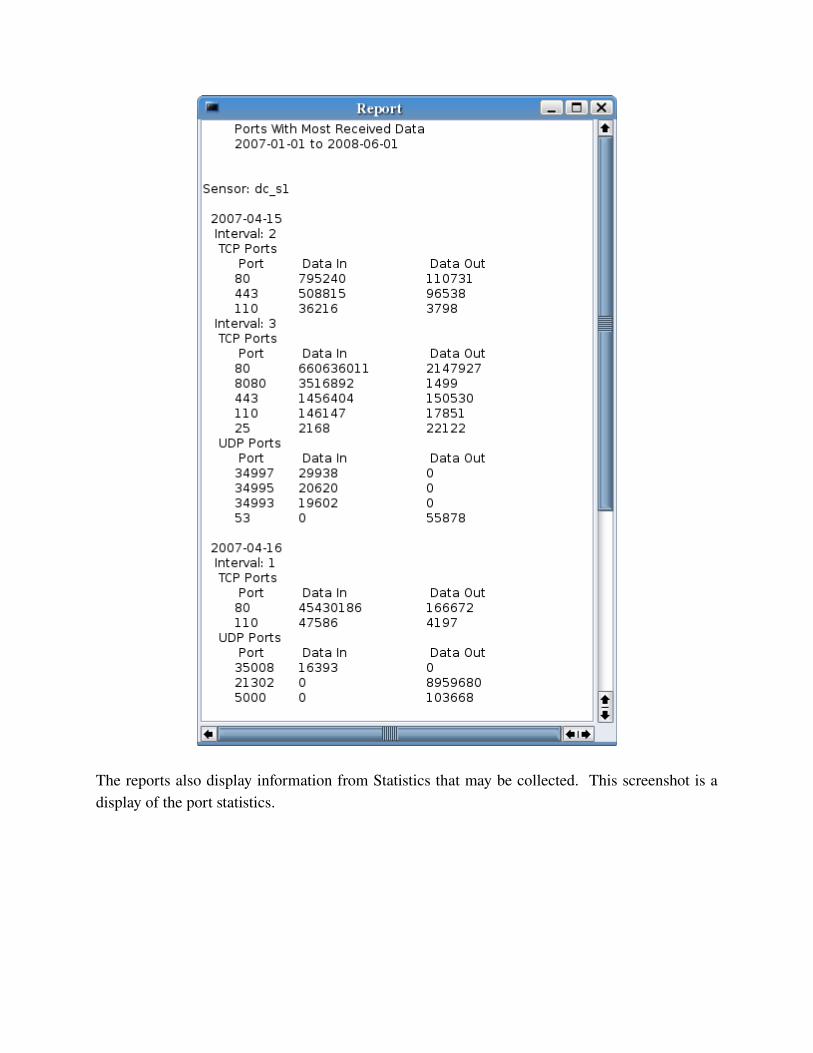
The reports also display information from Statistics that may be collected. This screenshot is a display of the port statistics.

This screenshot shows the results of monitoring a host. It is for the second monitoring interval of one day. This allows detailed information to be collected on connections being made to a host.

This screenshot shows the results of monitoring a port. It shows all hosts external to the monitored networks that made connections using the monitored port.

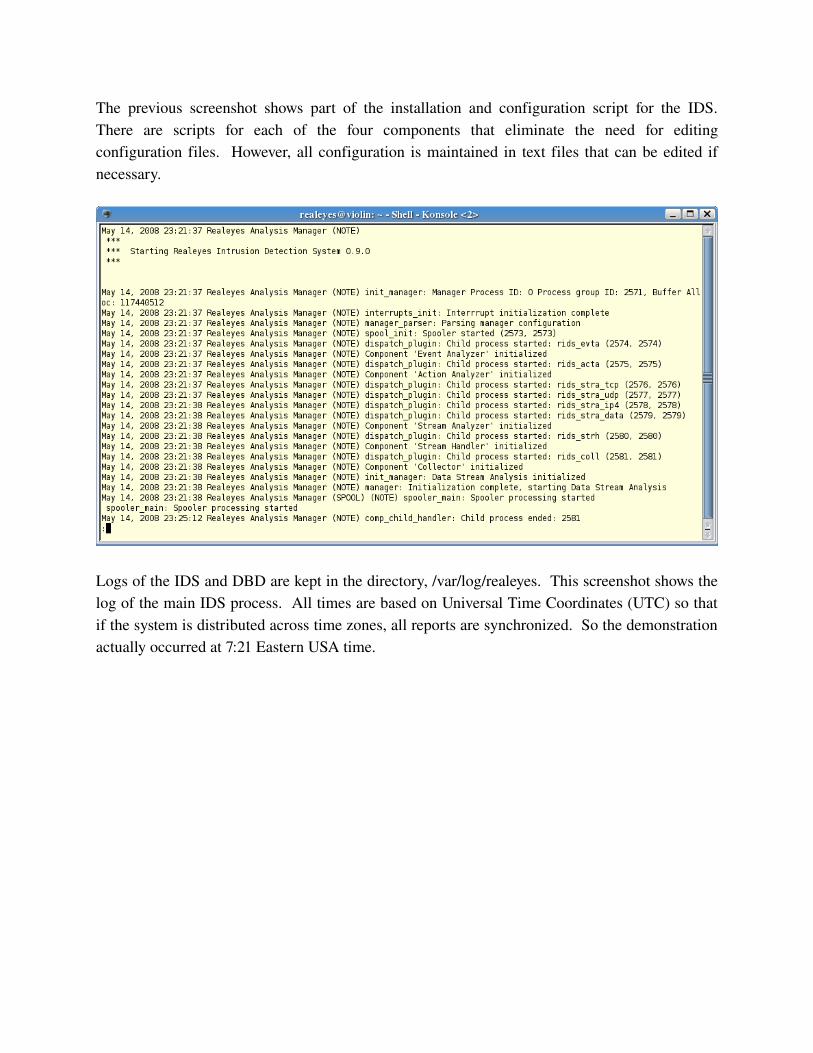
The previous screenshot shows part of the installation and configuration script for the IDS. There are scripts for each of the four components that eliminate the need for editing configuration files. However, all configuration is maintained in text files that can be edited if necessary.
Logs of the IDS and DBD are kept in the directory, /var/log/realeyes. This screenshot shows the log of the main IDS process. All times are based on Universal Time Coordinates (UTC) so that if the system is distributed across time zones, all reports are synchronized. So the demonstration actually occurred at 7:21 Eastern USA time.

This screenshot shows the man page for IDS configuration files. The following man pages for the IDS and the DBD are included in the packages:
● Configuration scripts● Configuration files● Startup scripts

Demonstration ofThe Realeyes Intrusion Detection System
Jim SansingMay 14, 2008
For more information, see the project website and blog:
http://realeyes.sourceforge.nethttp;//realeyestech.blogspot.com