demonstration of a rapidly strain tuned er 3+ laser for sensitive gas detection · ·...
TRANSCRIPT

SR-946
DEMONSTRATION OF A RAPIDLY STRAIN TUNED Er3+ DOPED FIBERLASER FOR SENSITIVE GAS DETECTION
Eric T. Wetjen, David M. Sonnenfroh, and Mark G. AllenPhysical Sciences Inc.
20 New England Business CenterAndover, MA 01810
and
Theodore F. MorseLaboratory for Lightwave Technology
Division of EngineeringBrown University
Providence RI 02912.
Applied Optics 38(15) 3370-3375 (1999)
Copyright © 1999 Optical Society of America.
Reproduced from Applied Optics by permission of the Optical Society of America and theauthors. Downloading or copying articles not for personal use is subject to copyright payments of$15.00/article, payable to: Copyright Clearance Center, Inc. (CCC), 22 Rosewood Drive,Danvers, MA 01823

1
DEMONSTRATION OF A RAPIDLY STRAIN TUNED Er3+ DOPED FIBER
LASER FOR SENSITIVE GAS DETECTION
Eric T.Wetjen, David M.Sonnenfroh, Mark G. Allen, and Theodore F. Morse
Author Affiliations:
E.T. Wetjen, D.M. Sonnenfroh, and M.G. Allen are with Physical Sciences Inc., Andover, MA
01810. E.T. Wetjen was with Brown University at the time this work was performed. T.F. Morse
is with the Laboratory for Lightwave Technology, Division of Engineering, Brown University,
Providence RI 02912.
Abstract
This paper describes a novel combination of a diode-pumped, wavelength modulated Er3+
doped fiber laser light source with a sensitive noise cancellation circuit for detection of acetylene
and ammonia. The laser tuning element, a fiber Bragg grating, was mounted in such a way that it
could be strained controllably and rapidly, allowing noise cancellation techniques to be applied to
the wavelength modulated output of the fiber laser. The experimental setup is relatively simple
and can be extended to other fiber laser wavelengths where semiconductor lasers are not readily
available by selecting a different fiber Bragg grating and gain medium.
OCIS Codes: 140.3510, 140.3600, 300.1030.
1. Introduction
Highly sensitive techniques for the measurement of gas concentrations by absorption
spectroscopy have been a subject of interest for many years. In previous publications, we have
demonstrated highly sensitive absorption measurements using a balanced detection scheme which

2
allows near shot-noise-limited measurements without high-speed wavelength modulation
techniques.1,2 In this work, we adapt this technique to sensitive absorption measurements using
fiber lasers where the laser wavelength is tuned repeatedly and controllably at bandwidths up to a
few hundred Hertz.
Fiber lasers are attractive for absorption spectroscopy because they can be operated at
wavelengths where semiconductor lasers are not readily available. For example, rare earth doped
heavy metal fluoride glasses have been demonstrated in the 2 to 3 µm region. This wavelength
region contains strong overtone transitions from technically important species such as CO and
NO. Specifically, Tm3+ lasers have been demonstrated from 1700 to 2015 nm in silica or fluoride
fibers and from 2250 to 2400 nm in fluoride fibers.3 Lasers based on Ho3+-doped fluoride fibers
have been demonstrated from 2 to 4 µm.3-5
Although near-IR fiber lasers have been available for several years, they have only shown
limited use in absorption spectroscopy due to a lack of controlled tuning methods. All-fiber
tuning methods based on temperature tuned fused couplers have been demonstrated with tuning
ranges over 40 nm, although the slow response of this method make it unsuitable for rapid
scanning.6,7 Sputter deposited piezoelectric coatings on a fiber Bragg grating have also been
investigated.8 The feasibility of temperature tuning of a fiber Bragg grating in a Tm3+ doped silica
fiber laser cavity has been demonstrated, where the laser was used to detect methane near
1.68 µm.9 More recently, an external grating tuning mechanism has been used in a Tm 3+ doped
fluoride fiber laser to detect methane at 2.31 µm.10
We demonstrate here an all-fiber wavelength modulation strategy for tuning at rates up to
several hundred Hertz. This is combined with a sensitive balanced detection technique to achieve

3
a detection sensitivity comparable to a conventional diode laser-based sensor system as a first step
in the eventual development of longer wavelength sources using the materials described above.
The technique is demonstrated here in the near-IR using an Er3+ doped fiber laser. To obtain
quantitative results and to gather more information about the fiber laser's properties, we compared
our results with those we obtained with an external cavity diode laser.
Various properties of the tuning method and fiber laser were investigated with regard to
applications to gas sensing. Among them are static and dynamic tuning rates, the effect of multi-
longitudinal mode operation, and the ultimate degree of noise cancellation possible using a
balanced detector. We focused our spectroscopic studies on acetylene and ammonia as they have
absorption lines accessible to an Er3+ doped fiber laser operating near 1.55 µm.
2. Experimental Setup
The experimental setup used in this investigation is shown in Figure 1. The fiber laser was
pumped by a 975 nm pigtailed, grating stabilized laser diode. The maximum pump output power
was approximately 100 mW. The fiber coupled pump radiation was then fusion spliced onto a 2 x
2 fused coupler designed to have a 3 dB split ratio at 1550 nm. About 75% of the pump radiation
was coupled into the fiber laser while the remaining power was embedded in index-matching gel.
The fiber laser cavity itself consisted of a fiber Bragg grating (FBG), a 20 cm length of fiber with
an Er3+ doping level of 3500 parts in 106 and a 65 cm long gold tipped section of single mode
telecommunications fiber. There were large core to core mismatches between the fiber containing
the Bragg grating (7 µm core diameter) and the active fiber (4 µm core diameter) resulting in a
large cavity loss. The typical output power of the fiber laser was on the order of 10 µW. Ideally,
the output power of the fiber laser cavity could be increased to the milliwatt range if the core

4
8B ' 2neff 7 (1)
mismatch losses between the active fiber and the other two fibers (grating fiber and mirror fiber)
were eliminated and the fiber were designed to maximize coupling from the pigtailed pump laser
diode. Such an increase in power would improve the shot noise limited detection; but as we will
show here, the sensitivity is usually limited first by weak interference fringes from elements in the
system which cannot be cancelled by balanced detection. When using a low noise current source
to excite the pump diode at 980 nm, we have observed fluctuations of ~4% in the output power
of the fiber laser when detected over a 100 ms period and this noise level was independent of the
tuning rate of the laser. At the present time, the source of this amplitude noise is not well
understood and may be related to mode competition or opto-mechanical instabilities in the laser
cavity.
The FBG was written with a 1.07 µm period phase mask which, for the fiber used
(neff = 1.449 at 1550 nm), corresponds to a grating reflective wavelength of 1551 nm. This was a
phase mask that we had on hand and was not the ideal period phase mask for detection of
acetylene or ammonia. The effective refractive index, neff, of the fiber was found from the Bragg
condition for peak reflection given below where 7, the index modulation period in the fiber, is
one half the period of the phase mask:
If the fiber is exposed to the excimer UV laser pulses while in tension, the period of the
index modulation and the peak reflective wavelength will be reduced when the tension
is removed.11 We use this effect to produce a grating at a slightly shorter wavelength because the
acetylene absorption lines at room temperature are most intense in the 1530 to 1540 nm range.

5
The grating used in the experiment had a peak reflectivity of 90% near 1547.5 nm and a Full
Width Half Maximum (FWHM) of 0.3 nm. This reflectivity was measured actively during
exposure to the UV pulses by launching a 1550 nm LED into the fiber being exposed and
measuring the transmitted light with an optical spectrum analyzer.
The spacing of the resonant longitudinal modes, which is a function of the cavity length, is
approximately 120 MHz. Since this spacing is less than the FWHM of the FBG reflectivity
spectrum, the fiber laser oscillated on more than one longitudinal mode. Thus, the absorption
lineshape obtained by scanning the fiber laser across an absorption line will be source broadened
in addition to the Doppler and collisional broadening. As described below, this laser linewidth
was extracted from the measured absorption lineshapes assuming a nominal Gaussian laser profile.
The output of the fiber laser was taken from the remaining port of the 2 x 2 coupler. It
was passed through an isolator, collimated and split into signal and reference beams which were
detected by InGaAs photodiodes. The photodiodes were incorporated into low-noise Balanced
Ratiometric Detector (BRD) system described in detail in previous publications.1,2,12 A 50 cm
long absorption cell was filled with varying gas pressures of the species of interest and absorption
scans were recorded.
3. Wavelength Modulation Technique
In order to sweep the laser wavelength across the absorption line shape, we relied on the
fact that the FBG center wavelength is sensitive to temperature and strain.13 As illustrated in
Figure 2, one end of the grating was immobilized in epoxy while the other end was attached using
the same epoxy to a preloaded PZT actuator (a multilayer PZT stack capable of extension at low
applied voltages) with a total extension range of 90 µm. The epoxy (Tracon BAF120) we used

6
was the same epoxy that is commonly used to fix fiber in ceramic ferrule connectors. The epoxy
was allowed to cure for 12 hours before tension was applied. This method of straining the grating
allowed the fiber laser to be tuned across approximately 3 nm or 15 cm-1. It was possible to dither
the laser about a certain wavelength at a rate of several hundred Hz by applying a triangle wave to
the PZT driver. The static (dc) tuning curve is shown in Figure 3 and was obtained using an
optical spectrum analyzer. From this data, a static tuning coefficient of approximately 4 GHz/ V
is deduced.
To investigate the effect of the modulation on the tuning rate, the fiber laser's output was
observed at various modulation frequencies with a scanning Fabry-Perot interferometer. The
resolution of the interferometer was not sufficient to resolve the individual longitudinal modes,
but it was possible to monitor the total wavelength excursion of the unresolved group of
oscillating modes as a function of frequency. We found that triangle waves of 1, 2, 5 and 10 Hz
all gave tuning coefficients of approximately 2.6 ± 0.2 GHz/V. This reduction in the dynamic
tuning rate compared to the static value was also verified by matching the observed acetylene
absorption features to their known positions.14 This reduction cannot be attributed to the PZT
actuator itself; we believe it arises from the compliance of the epoxy because we have also
observed that the overall tuning range increases with the stiffness of the glue.
4. Absorption Measurements
The absorption cell was filled with pure acetylene to a pressure of 56.6 Torr. The PZT
drive voltage was scanned with a 10 Hz, 4 V p-p triangle wave which was added to a dc drive
voltage of about 40 V. Figure 4 (a) shows the raw digital oscilloscope data obtained from the
BRD as a function of the ac voltage applied to the PZT. The absorption features appear as dips in
7
the BRD output. The data points are connected with solid lines for the purpose of displaying a
large number of points (528) without cluttering the plot. Figure 4 (b) shows reduced absorption
lineshape data; the solid curve is obtained with the wavelength modulated fiber laser (raw data
shown in Figure 4 (a)) and the dashed curve was obtained with a wavelength modulated single
frequency External Cavity Diode Laser (ECDL; New Focus Model 6262) at a reduced acetylene
pressure of 16.9 Torr. Both curves have been baseline corrected and the absorption axis of the
ECDL trace has been scaled for easy comparison with the fiber laser trace. The linewidth of the
ECDL is less than 1 MHz and shows the Doppler-limited absorption lineshape whereas the
lineshape acquired with the fiber laser includes both laser and collisional broadening contributions.
The stronger absorption line in the fiber laser scan has an absorption of 10%. We have
assigned the stronger of the two observed absorption lines to be the P(35) line of the <1 + <3
combination band of 12C2H2. This band is denoted by 101000070000000 and we will call it Band A.
The second, weaker line is the P(28) line of the 12C2H2 hot band denoted by 1010011e7 0000011e
which we call Band B. The P(35) line is centered at 6459.0938 cm-1 and is predicted to have a
Voigt (FWHM) linewidth of 0.026 cm-1 at 56 Torr, using the pressure broadening coefficient
given in the HITRAN database for the fundamental <3 absorption lines.15 Note that the ECDL
trace shows one additional very weak line on the short wavelength side of the P(35) line. This
line is not resolvable by the fiber laser but the slight asymmetry in the fiber laser scan of the P(35)
line can be attributed to this unresolved feature.

8
S 'F
gobs <0(2)
Using the spectral atlas and line listing in References 14, 16 and 17, we were able to apply
a frequency scale to the absorption traces obtained as a function of PZT drive voltage. This was
accomplished by matching the known 4.48 GHz frequency difference between the P(28) line of
Band B and the P(35) line of Band A to our measurement.
To compare our observed absorption measurements to the fundamental transition
linestrengths and thereby verify the quantitativeness of the sensor measurements, we need to have
an estimate for the laser lineshape. This can be done by direct measurement with a high resolution
Fabry-Perot interferometer or it can be inferred from the absorption lineshapes that are being
scanned. We chose the latter method and assumed that the fiber laser oscillates on many
longitudinal modes with a Gaussian intensity distribution. Each longitudinal mode was modeled
as a Gaussian with FWHM of 5 MHz. This estimate corresponds to the width of longitudinal
mode beat signals we have observed with a high speed photodetector and a radio frequency
spectrum analyzer. To determine the laser FWHM , we numerically forced a Gaussian intensity
distribution of longitudinal modes to minimize the error between the convolution of the laser
distribution with the known Voigt profile and observed feature.
Figure 5 compares the best fit convolution profile to the observed feature with a laser
linewidth of 650 MHz (0.022 cm-1). The slight deviation from the theoretical profile in the wings
is attributed to the unresolved feature shown in Figure 4 which was not included in the analysis.
With this laser lineshape, we can convert absorption cross section, F, to linestrength through the
relation

9
where the units for the absorption cross section are cm2/molecule and the units for gobs are in
centimeters. For the 56.6 Torr measurement, we can estimate the cross section for the 10%
absorption at the peak of the P(35) line to be (1.2 ± 0.5) x 10-21 cm2/molecule, which for the
source broadened Voigt lineshape gives a linestrength S = (5.2 ± 0.5) x 10-23 cm/molecule where
we have taken into account the line broadening due to the laser's longitudinal mode spectrum by
dividing the absorption cross-section by gobs(<0) = 22.93 cm. This value was determined from the
theoretical expression for the observed lineshape after estimating the average laser lineshape. The
same line using the ECDL exhibited an 8% peak absorption at 16.9 Torr which gives a
linestrength of (6.5 ± 1.0) x 10-23 cm/molecule. In this case, gobs(<0) = 46.2 cm and the single
frequency laser is treated as a delta function because its width is much smaller than the width of
the feature. The linestrengths obtained from both lasers agree reasonably well and indicate that
the absorption recorded from the fiber laser is absolutely quantitative. We note that if extremely
high resolution measurements are required, the linewidth could be narrowed further (at the
expense of system and tuning complexity) by introducing an intracavity etalon or using a
distributed feedback structure. In this paper, however, we focus on the simplicity and utility of a
slightly multimode fiber laser.
When the absorption cell pressure is reduced to 900 mTorr, the fiber laser absorption
spectrum appeared as in Figure 6. This is again with respect to the P(35) rovibrational line of
Band A. The S/N ratio for this single scan was approximately 74 if we consider the small scale
variations and approximately 8 if we consider the larger variations believed to arise from
unsuppressed étalons in the system. The residual reflections from the anti-reflection coated
windows forming the absorption cell are likely the predominant étalon source. As a conservative
10
measure, we will choose the smaller S/N ratio of 8 to predict an ultimate absorbance sensitivity
for the fiber laser. It follows from the measured peak absorption of 3.25 x 10⁻³ and the 470 Hz
detection bandwidth that the minimum detectable absorption will be 4.1 x 10⁻⁴ or 1.9 x 10⁻⁵ Hz-1/2
for a S/N ratio of 1. This value is comparable to a typical limit for a fiber-coupled current-tuned
laser based sensor18 and to previously reported values using an ECDL.19
Given that the fiber laser output power was on the order of 10 µW, and the photodetector
had a responsivity of 0.75 A/W, we calculate that the shot-noise-equivalent absorbance is 2.9 x
10-7 Hz-1/2 and we see that we are a factor of 65 above the shot noise limited absorbance. This
excess noise is attributed to the etalons in the optical system rather than to the performance of the
laser or detector system and could presumably be lowered using an improved setup.
To evaluate the effect of pressure broadening on the sensor repsonse, we filled the
absorption cell to 49 Torr with C2H2 and then added nitrogen until a total pressure of 777 Torr
was attained. The measured linewidth at 777 Torr was 2.5 GHz or 0.083 cm-1, from which we
determine a nitrogen pressure broadening coefficient (FWHM) of 0.066 cm-1/atm. In this case,
the laser linewidth is less than that of the absorption feature so it has a small effect in determining
the linewidth at 1 atm. For a fixed small number of absorbers (i.e., the regime where
self-broadening is negligible), we can compute gobs(<0) = 8.8 cm for a 1 atm nitrogen broadened
line. In comparison, the same line observed in a low pressure Doppler broadened regime will only
show Doppler and source broadening and gobs(<0) = 37 cm. Because the peak value of absorption
equals SNL gobs(<0), it follows that concentrations near the sensitivity limit of the fiber gas sensor
will have peak absorptions reduced by a factor of 4.2 over their Doppler values. If we use an
average linestrength from our measurements, we can compute an ambient pressure detection limit

11
of 15 ppmv-m (parts in 106 by volume in a 1 m path) operating on this line with a 1 Hz
bandwidth.
The particular absorption line accessed with the present laser is approximately 200 times
weaker than stronger lines originating from rotational levels with peak population at room
temperature. For example, the P(11) line of Band A at 1531.59 nm would be easily accessible
with another fiber laser and would allow a detection limit of 75 ppbv-m (parts in 109 by volume in
a 1 m path) using the present setup.
Finally, we applied the laser to detect NH3 which also has many absorption lines in the
operating region of our laser.20,21 The observed lineshape for a line near 1548 nm after baseline
correction is shown in Figure 7 and the peak absorption is 5.8%. For this measurement, the
pressure in the 50 cm long cell was 19.7 Torr and the data was acquired at room temperature.
The integrated absorption signal is shown in Figure 8 as a function of NH3 concentration in the
cell. We attribute the deviations at low concentrations to unreliable pressure measurements in the
presence of unsteady adsorption/desorption effects in the cell. If we assume a pressure self-
broadening coefficient of 0.8 cm-1/atm, a common value listed by HITRAN for the fundamental
band,<3, we can deduce a linestrength of (9.5 ± 1) x 10-23 cm/molecule. This value is found from
the measured peak cross section at 19.7 Torr and takes into account laser linewidth. For
comparison, we also obtained a linestrength for this line using the single frequency ECDL. With
the ECDL, the peak absorption is about 2% for a pressure of 2.6 Torr and gobs(<0) = 43.07 cm.
This gives a linestrength of (11 ± 1) x 10-23 cm/molecule which shows reasonable agreement with
the fiber laser. The line that we measured has been observed at 6459.459 cm-1, but has not been
spectroscopically assigned so there is no theoretical value with which to compare our
12
measurements.22 We also note that this was the strongest line that we could find in the three
nanometer tuning range of the fiber laser. Using the value of minimum detectable absorption
obtained from our acetylene scans, we predict a detection limit at ambient pressure of 18 ppmv-m
on this line.
5. Ultimate Sensitivity And Conclusions
For the laser system we used to demonstrate the technique, any molecule which absorbs in
the Er3+ gain region may be detected simply by selection of an appropriate fiber grating.
Sensitivities in ambient air on the order of 10's ppmv-m are predicted for several gases which
absorb under the Er3+ bandwidth. The strongest lines with linestrengths of 2 x 10-21 cm/molecule
or greater should give detectivities of below 1 ppmv-m. This technique can be combined with
multipass cells if higher detectivity is required. Quantitative spectroscopic information was
obtained using a reasonable estimate for the lineshape of the fiber laser. In addition to acetylene
and ammonia detected here, there are other gases which have absorption lines in the region
accessible to an Er3+ fiber laser; they include CO2, OH, CO, HCN and HI. Numerous additional
species such as NO and N2O and H2CO are accessible with Tm3+ fiber lasers in silica glass.
We believe this combination balanced detector and wavelength modulated fiber laser may
have general appeal for compact sensitive gas sensors when applied to wavelengths where
conventional diodes are not available. Species having strong lines in wavelength regions
accessible to fluoride fibers should also benefit from this all-fiber rapid wavelength modulated
balanced detector configuration. In a well designed fluoride fiber laser system, diode pumping
should be possible, allowing the potential for compact gas sensing in wavelength regions
inaccessible to diode lasers.

13
Acknowledgment
The authors would like to acknowledge Lucent Technologies Inc. for providing the rare
earth doped fiber.

14
References
1. Mark G. Allen, Karen L. Carleton, Steven J. Davis, William J. Kessler, Charles E. Otis,
Daniel A. Palombo, and David M. Sonnenfroh, "Ultrasensitive Dual-Beam Absorption and
Gain Spectroscopy: Applications for Near-Infrared and Visible Diode Laser Sensors,"
Appl. Opt. 34, 3240-3249 (1995).
2. Sonnenfroh, D.M. and Allen, M.G., "Ultrasensitive, visible tunable diode laser detection of
NO2", App. Opt. 35(21), pp. 4053-4058 (1996).
3. M. F. Digonnet, ed., Rare Earth Doped Fiber Lasers and Amplifiers, Marcel Dekker,
New York, p. 20 (1993).
4. Carbonnier, C. Tobben, H., and Unrau, U.B., "Room temperature cw fibre laser at
3.22 µm," Elect. Lett. 34(9), pp. 893-894, (1998).
5. Schneider, J., "Fluoride fibre laser operating at 3.9 µm," Elect. Lett. 31(15), pp.
1250-1251, (1995).
6. V.A. Kozlov, R.L. Shubochkin, A. Kotze, E. Wetjen, A.L.G. Carter, H. Kung, D.A.
Brown, and T.F. Morse, "Technique for continuous tuning of optical fiber lasers," Appl.
Opt. 37, 4897-4901 (1998).
7. R.L. Shubochkin, V.A. Kozlov, A.L.G. Carter, and T.F. Morse, "Tunable thulium-doped
all-fiber laser," IEEE Photonics Technology Letters, 10, 944-945 (1998).
8. G. Fox, C. A. Muller, N. Setter, D. M. Costantini, N. H. Ky and H.G. Limberger,
"Wavelength tunable fiber bragg grating devices based on sputter deposited resistive and
piezoelectric coatings," J. Vac. Sci. Technol. A 15, 1791-1795 (1997).

15
9. W. L. Barnes, J. P. Dakin, H.O. Edwards, L. Reekie, and J. E. Townsend, "Tunable fibre
source for methane detection at 1.68 µm," Proc. SPIE 1796 (1992).
10. Fergal J. McAleavy, James O'Gorman, John F. Donegan, Brian D. MacCraith, John
Hegarty and Gwenael Maze, "Narrow linewidth, tunable Tm3+ doped fluoride fiber laser
for optical-based hydrocarbon sensing," IEEE J. Selected Topics Quantum Electron. 3,
1103-1110 (1997).
11. Q. Zhang, D. A. Brown, L. Reinhart, T. F. Morse, J. Q. Wang, and G. Xiao, "Tuning
Bragg wavelength by writing gratings on pre-strained fibers," IEEE Photon. Technol.
Lett. 6, 839-841 (1994).
12. P. C. D. Hobbs, "Shot-noise limited optical measurements at baseband with noisy laser,"
in Laser Noise, R.Roy, ed., Proc. SPIE 1376, 216-221 (1990).
13. A.T. Alavie, S.E. Karr, A. Othonos, and R.M. Measures, "A multiplexed Bragg grating
fiber laser sensor system," IEEE Photonics Technology Letters 5, 1112-1114 (1993).
14. Q. Kou, G. Guelachvili, M. Abbouti Temsamani, and M. Herman, "The absorption
spectrum of C2H2 around <1 + <3: energy standards in the 1.5 µm region and vibrational
clustering," Can. J. Phys. 72, 1241-1250 (1994).
15. L.S. Rothman, R.R. Gamache, A. Goldman, L. R. Brown, R. A. Toth, H. M. Pickett, R.
L. Poynter, J.-M. Flaud, C. Camy-Peret, A. Barbe, N. Husson, C. P. Rinsland, and M. A.
H. Smith, "The HITRAN database: 1986 edition," Appl. Opt. 26, 4058-4097 (1987).
16. G. Guelachvili and K. Narahari Rao, Handbook of Infrared Standards II, Academic Press,
Inc., San Diego, California, 564 (1993).

16
17. K.A. Keppler, G.Ch. Mellau, S. Klee, B.P. Winnewisser, M. Winnewisser, J. Pliva, and K.
Narahari Rao, "Precision measurements of acetylene spectra at 1.4-1.7 µm recorded with
352.5 m pathlength," J. Molec. Spectrosc. 175, 411-420 (1996).
18. D. M. Sonnenfroh and M. G. Allen, "Absorption measurements of the second overtone
band of NO in ambient and combustion gases with a 1.8 µm room temperature diode
laser," Appl. Opt. 36, 7979-7976 (1997).
19. D. B. Oh and D. C. Hovde, "Wavelength modulation detection of acetylene with a
near-infrared external-cavity diode laser," Appl. Opt. 34, 7002-7005 (1995).
20. H.J. Unger, "Infrared Absorption Bands of Ammonia," Physical Review 43, 123-128
(1933).
21. T. Wu, H. An, P. Jiang, Y. Fang, S. Tao, and P. Ye, "Spectral Measurements of NH3
absorption lines by a 1.5-µm grating-external-cavity semiconductor laser," Optics Letters
18, 729-731 (1993).
22. L. Lundsberg-Nielsen, F. Hegelund, and F.M. Nicolaisen, "Analysis of the high-resolution
spectrum of ammonia (14NH3) in the near-infrared region, 6400-6900 cm-1," J. Molec.
Spectrosc. 175, 411-420 (1996).

17
Figure 1. Experimental setup used to detect acetylene and ammonia.

18
Figure 2. Mounting details for PZT controllable Bragg wavelength modulation.
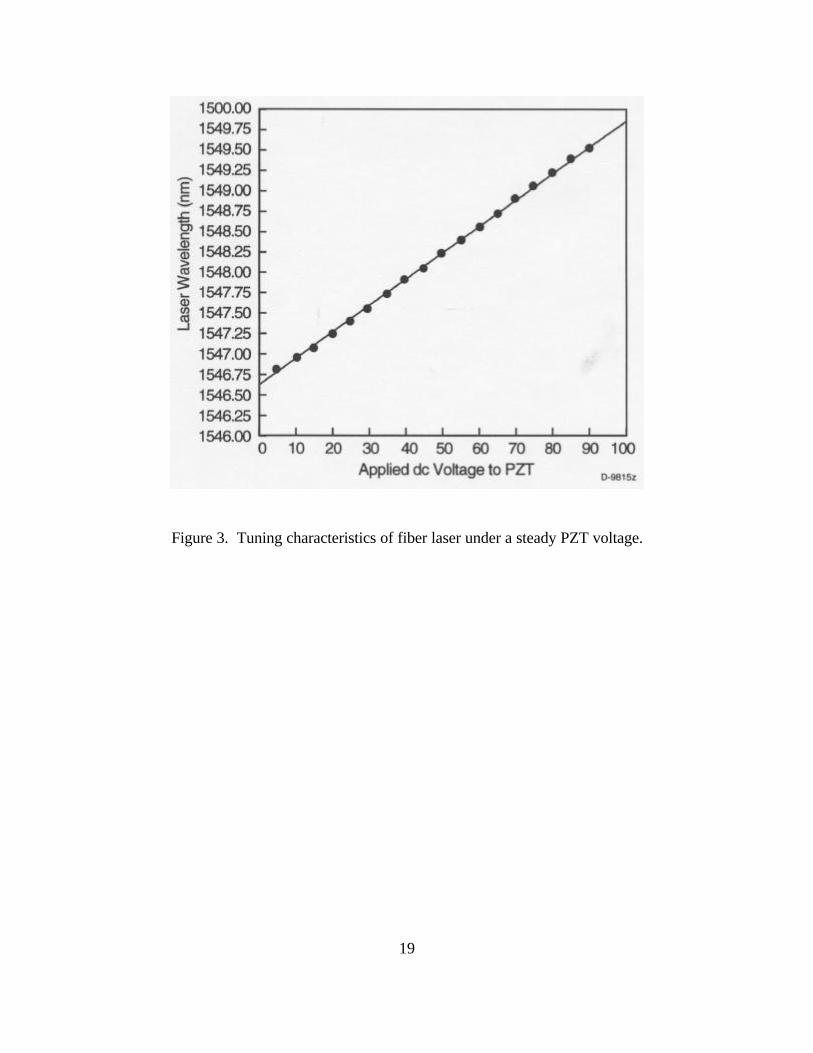
19
Figure 3. Tuning characteristics of fiber laser under a steady PZT voltage.

20
Figure 4. (a) Raw acetylene absorption data obtained from the fiber laser/balancedratiometric detector with triangular wave PZT wavelength modulationvoltage depicted.
(b) Acetylene spectra of P(35) line from Band A and the P(28) line from BandB. Solid curve - fiber laser. Dashed curve- ECDL. Other conditions: T = 296K, pathlength = 50 cm, and acquisition time = 100 ms.

21
Figure 5. Theoretical lineshape (FWHM = 650 MHz) which best fitsthe experimental lineshape of the acetylene P(35) line in BandA. Pathlength is 50 cm.

22
Figure 6. Observed acetylene absorption spectrum at 900 mTorr in a50 cm path with S/N estimates. T = 296 K and acquisitiontime = 100 ms.

23
Figure 7. Ammonia spectrum at 19.7 Torr near 1548 nm in a 50 cmpath, with T = 296 K and 100 ms acquisition time.

24
Figure 8. Integrated absorption signal as a function of ammonia concentration.