demonstrating test‐retest reliability of
TRANSCRIPT
Demonstrating test-retest reliability of electrophysiological
measures for healthy adults in a multisite study of biomarkers of
antidepressant treatment response
CRAIG E. TENKE,a J€URGEN KAYSER,a PIA PECHTEL,b CHRISTIAN A. WEBB,b DANIEL G. DILLON,b
FRANZISKA GOER,c LAURA MURRAY,c PATRICIA DELDIN,d BENJI T. KURIAN,e PATRICK J. MCGRATH,a
RAMIN PARSEY,f MADHUKAR TRIVEDI,e MAURIZIO FAVA,b,g MYRNA M. WEISSMAN,a
MELVIN MCINNIS,d KAREN ABRAHAM,a JORGE E. ALVARENGA,a DANIEL M. ALSCHULER,a
CRYSTAL COOPER,e DIEGO A. PIZZAGALLI,b AND GERARD E. BRUDERa
aDepartment of Psychiatry, Columbia University College of Physicians & Surgeons and New York State Psychiatric Institute, New York, NY, USAbDepartment of Psychiatry, Harvard Medical School and McLean Hospital, Belmont, Massachusetts, USAcCenter For Depression, Anxiety and Stress Research, McLean Hospital, Belmont, Massachusetts, USAdDepartments of Psychology and Psychiatry, University of Michigan Health System, Ann Arbor, Michigan, USAeDepartment of Psychiatry, UT Southwestern Medical Center, Dallas, Texas, USAfDepartment of Psychiatry, SUNY Stony Brook, Stony Brook, New York, USAgDepression Clinical and Research Program, Massachusetts General Hospital, Boston, Massachusetts, USA
Abstract
Growing evidence suggests that loudness dependency of auditory evoked potentials (LDAEP) and resting EEG alpha
and theta may be biological markers for predicting response to antidepressants. In spite of this promise, little is known
about the joint reliability of these markers, and thus their clinical applicability. New standardized procedures were
developed to improve the compatibility of data acquired with different EEG platforms, and used to examine test-retest
reliability for the three electrophysiological measures selected for a multisite project—Establishing Moderators and
Biosignatures of Antidepressant Response for Clinical Care (EMBARC). Thirty-nine healthy controls across four
clinical research sites were tested in two sessions separated by about 1 week. Resting EEG (eyes-open and eyes-closed
conditions) was recorded and LDAEP measured using binaural tones (1000 Hz, 40 ms) at five intensities (60–100 dB
SPL). Principal components analysis of current source density waveforms reduced volume conduction and provided
reference-free measures of resting EEG alpha and N1 dipole activity to tones from auditory cortex. Low-resolution
electromagnetic tomography (LORETA) extracted resting theta current density measures corresponding to rostral
anterior cingulate (rACC), which has been implicated in treatment response. There were no significant differences in
posterior alpha, N1 dipole, or rACC theta across sessions. Test-retest reliability was .84 for alpha, .87 for N1 dipole,
and .70 for theta rACC current density. The demonstration of good-to-excellent reliability for these measures provides
a template for future EEG/ERP studies from multiple testing sites, and an important step for evaluating them as
biomarkers for predicting treatment response.
Descriptors: EEG, Evoked potentials, Surface Laplacian, LORETA, Biomarkers, Reliability
Electrophysiological Markers for Predicting Antidepressant
Treatment Response
Despite the availability of pharmacologic treatments for major
depressive disorder (MDD), high failure rates for specific treat-
ments can introduce significant delays before relief is obtained
from depression. Fortunately, there is growing evidence that
electrophysiological measures of brain function show potential
value as biological markers for predicting subsequent clinical
response to antidepressants (Bruder, Tenke, & Kayser, 2013). Of
clinical relevance, measures such as the EEG and evoked or event-
related potentials (ERPs) provide the advantages of being noninva-
sive, widely applicable, and economical, while providing informa-
tion about neuronal generator patterns at scalp on a millisecond
scale.
Resting EEG. Resting measures of spontaneous brain activity in
the alpha and theta bands have shown particular promise as predic-
tors of response to a range of antidepressants (see Alhaj,
Address correspondence to: Craig E. Tenke, New York State Psychi-atric Institute, Division of Cognitive Neuroscience, Unit 50, 1051 River-side Drive, New York, NY 10032, USA. E-mail: [email protected]
34
Psychophysiology, 54 (2017), 34–50. Wiley Periodicals, Inc. Printed in the USA.Copyright VC 2016 Society for Psychophysiological ResearchDOI: 10.1111/psyp.12758
Wisniewski, & McAllister-Williams, 2011; Bruder et al., 2013, for
reviews). Greater alpha power prior to treatment, particularly iden-
tifiable at posterior scalp locations, is more likely to be observed in
patients who subsequently respond to antidepressants than in non-
responders (Bruder et al., 2008; Prichep et al., 1993; Tenke et al.,
2011; Ulrich, Renford, & Frick., 1986). Some studies have also
found that responders to a selective serotonin reuptake inhibitor
(SSRI) differ from nonresponders in pretreatment alpha asymmetry
(Arns et al., 2015; Bruder et al., 2001, 2008), although this is not a
universal finding (Tenke et al., 2011). Greater alpha over right
compared to left frontal (Arns et al., 2015) or across frontal, cen-
tral, and parietal regions (Bruder et al., 2001) was found in women
who responded to a SSRI compared to nonresponders, and Bruder
et al. (2008) found this difference in alpha asymmetry between
SSRI responders and nonresponders over occipital locations. Great-
er alpha in SSRI responders, particularly over right posterior
regions, may be indicative of reduced cortical arousal, which has
been hypothesized to be associated with depression (Heller, Eti-
enne, & Miller, 1995; Heller, Nitschke, Etienne, & Miller, 1997).
EEG alpha. The EEG alpha rhythm is a posterior oscillation at
8–13 Hz that is characteristic of a relaxed, wakeful state, and
blocked (desynchronized) when visual processes are engaged by
opening the eyes. However, the specific topography that is
observed depends to no small degree on the chosen EEG reference,
the impact of which may be irreversible (Figure 1 of Tenke &
Kayser, 2005; Tenke & Kayser, 2015). Feige et al. (2005) reported
an inverse association between posterior alpha and the fMRI blood
oxygenation level-dependent (BOLD) response in cortical visual
regions. Alpha is also generated within the ventral visual stream,
but its organization differs across regions (Bollimunta, Chen,
Schroeder, & Ding, 2008).
The stability of resting EEG alpha is consistent with a trait char-
acteristic (Allen, Urry, Hitt, & Coan, 2004; Bruder et al., 2008;
Hagemann, Hewig, Seifert, Naumann, & Bartussek, 2005; Smit,
Posthuma, Boomsma, & Geus, 2005; Stewart, Coan, Towers, &
Allen, 2014). While alpha differs between depressed patients and
healthy control subjects, these differences persist following antide-
pressant treatment (Bruder et al., 2008; Pollock & Schneider,
1989). Condition-dependent posterior alpha (i.e., greater for eyes
closed than eyes open) has also been observed to be greatest in
individuals with a strong familial risk for depression (i.e., both
parents having MDD; Bruder et al., 2005). In view of the success
of antidepressants with serotonergic mechanisms, it is noteworthy
that the inverse association between posterior alpha and physiologi-
cal or emotional arousal (Heller et al., 1995, 1997) parallels the
association between serotonergic activity and behavioral arousal
(Jacobs & Azmitia, 1992).
EEG theta. In contrast to alpha, EEG theta is classically linked
to limbic activity. This association is clearest in nonhuman rodent
models, in which a highly regular theta rhythm is observed during
active exploration (Vanderwolf, 1969), when it is synchronized to
vibrissae movements (Semba & Komisaruk, 1984). However, mid-
line frontal theta has also been studied in humans in demanding
cognitive tasks and has been shown to be reliable across testing ses-
sions (Iramina, Ueno, & Matsuoka, 1996; McEvoy, Smith, &
Gevins, 2000). In the resting EEG, frontal midline theta may also
appear in close association with posterolateral low-frequency alpha
(Tenke & Kayser, 2005).
For EEG theta, early conflicting reports on the direction of the
difference predictive of a favorable treatment response have been
supplemented by more consistent findings obtained using a model-
dependent inverse, called low-resolution electromagnetic tomogra-
phy (LORETA; Pascual-Marqui, Michel, & Lehmann, 1994),
which has been used to infer current density through the rostral
anterior cingulate cortex (rACC). Using this measure, patients who
eventually responded to antidepressants showed increased pretreat-
ment theta when compared to nonresponders (Korb, Hunter, Cook,
& Leuchter, 2009; Mulert et al., 2007; Pizzagalli et al., 2001;
although see Arns et al., 2016). In addition, a multisite study
(Leuchter et al., 2009) reported that an Antidepressant Treatment
Response (ATR) index derived from a weighted combination of
alpha and theta obtained before and 1 week after treatment onset
5)Blink correction
retain uncorrected bipolar EOGs
4) Data Interpolation from good electrodes
recording errors
test for bridging
2) Raw data evaluation
Data integrity &
channel exclusion
runtime notes & visual inspection
1) File format unification (EEGlab)
Convert to bdf
3) Montage unification &
preprocessing (Polyrex)
Common
electrode locations polynomial filter
reference
Amplitude scaling
Convert to cnt
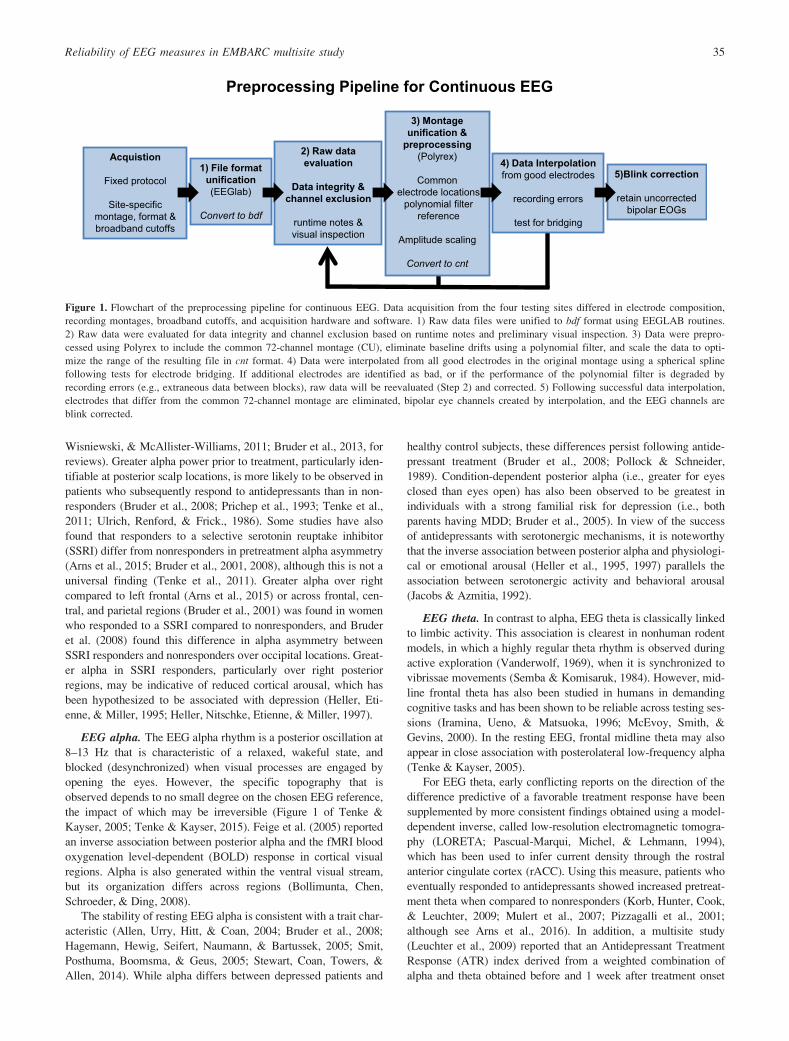
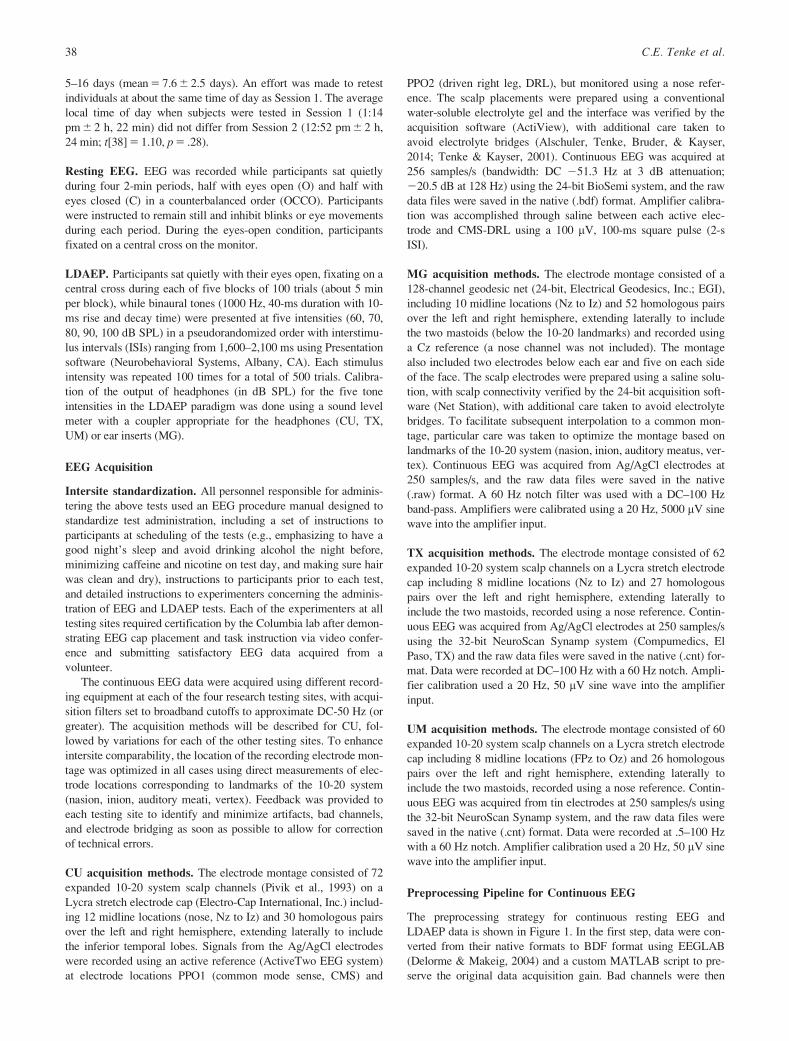
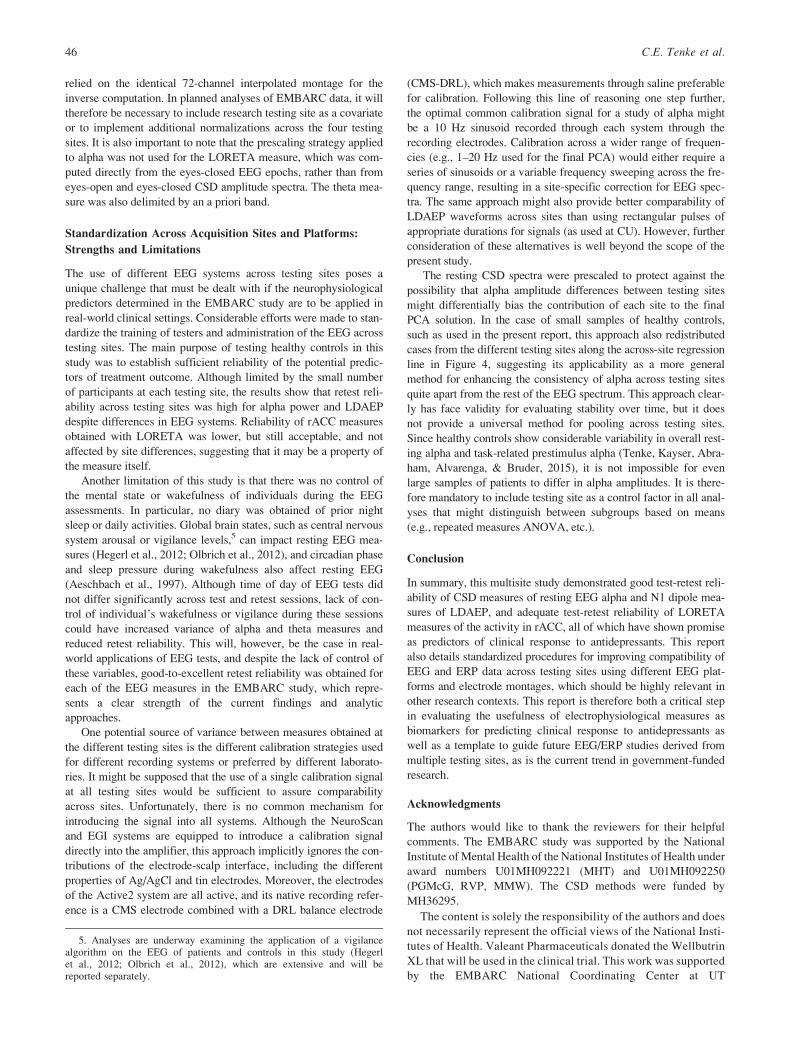
Preprocessing Pipeline for Continuous EEG
Acquistion
Fixed protocol
Site-specific montage, format & broadband cutoffs
Figure 1. Flowchart of the preprocessing pipeline for continuous EEG. Data acquisition from the four testing sites differed in electrode composition,
recording montages, broadband cutoffs, and acquisition hardware and software. 1) Raw data files were unified to bdf format using EEGLAB routines.
2) Raw data were evaluated for data integrity and channel exclusion based on runtime notes and preliminary visual inspection. 3) Data were prepro-
cessed using Polyrex to include the common 72-channel montage (CU), eliminate baseline drifts using a polynomial filter, and scale the data to opti-
mize the range of the resulting file in cnt format. 4) Data were interpolated from all good electrodes in the original montage using a spherical spline
following tests for electrode bridging. If additional electrodes are identified as bad, or if the performance of the polynomial filter is degraded by
recording errors (e.g., extraneous data between blocks), raw data will be reevaluated (Step 2) and corrected. 5) Following successful data interpolation,
electrodes that differ from the common 72-channel montage are eliminated, bipolar eye channels created by interpolation, and the EEG channels are
blink corrected.
Reliability of EEG measures in EMBARC multisite study 35
may allow a differential prediction of response to a SSRI antide-
pressant as opposed to a noradrenaline-dopamine reuptake inhibitor
(bupropion). However, this particular index is proprietary, and is
only derived from forehead and earlobe electrodes, leaving its bio-
physical origins unknown.
Loudness dependency of auditory evoked potentials (LDAEP).
In addition to resting EEG markers, ERP measures of brain activity
elicited during sensory or cognitive processing (e.g., N1 or P3)
have also been linked to clinical response to antidepressants
(Bruder et al., 2013). The most replicated finding has been for the
LDAEP, which refers to the monotonic increase in amplitude of
N1 or P2 potentials with increasing tone intensity. These compo-
nents predominantly reflect processing in modality-specific cortical
regions (Kayser & Tenke, 2006a,b; Tenke & Kayser, 2012; Tenke,
Kayser, Stewart, & Bruder, 2010; Vaughan & Ritter, 1970). The
change in component amplitude across intensities is viewed as an
index of the gain of the auditory system to loudness (Hegerl &
Juckel, 1993), thereby serving as a more selective measure of
responsivity than that provided by resting alpha desynchronization.
Hegerl and Juckel (1993) reviewed evidence showing that the
slope of the function relating tone loudness to the amplitude differ-
ence between successive component peaks N1 and P2 provides an
indicator of serotonergic activity. In this model, serotonergic neu-
rons originating in dorsal raph�e modulate activity in auditory cor-
tex: a low firing rate in dorsal raph�e is associated with a strong
loudness dependency (steep LDAEP function), whereas a high fir-
ing rate is related to weak loudness dependency (shallow LDAEP
function; Juckel, Hegerl, Molnar, Csepe, & Karmos, 1999).
Depressed patients with pronounced LDAEP (putatively low sero-
tonergic activity) prior to treatment responded better to a SSRI
compared to patients with weak LDAEP (Gallinat et al., 2000;
Hegerl, Gallinat, & Juckel, 2001; Lee, Yu, & Chen, 2005; Paige,
Fitzpatrick, Kline, Balogh, & Hendricks, 1994). Studies have not,
however, found LDAEP to be related to severity of current depres-
sive symptoms, and improvement of depression following treat-
ment was not associated with a change in LDAEP, which suggests
that it is not state dependent (Gallinat et al., 2000; Linka, Sartory,
Wiltfang, & M€uller, 2009). Likewise, the specificity of LDAEP for
predicting response to SSRI as opposed to antidepressants with a
different mode of action is still in question. As a result, LDAEP is
a promising predictor of response even to nonserotonergic treat-
ments (O’Neill, Croft, & Nathan, 2008). Some studies have sug-
gested that LDAEP may differentially predict clinical response to a
SSRI as opposed to a noradrenaline reuptake inhibitor (reboxetine;
Linka, M€uller, Bender, & Sartory, 2004; Linka, M€uller, Bender,
Sartory, & Gastpar, 2005; Mulert et al., 2007), but further study is
needed concerning its specificity for SSRI antidepressants.
Reliability of Electrophysiological Measures
Resting EEG. The gross morphology and local topography of
EEG waveforms are useful for applications in clinical neurology,
but more nuanced neurologic and psychopathologic applications
require equally nuanced quantitative methods and measures (e.g.,
Duffy, Hughes, Miranda, Bernad, & Cook, 1994). For a marker of
clinical response to be viable, the measure must also have good
test-retest reliability. Classifications of EEG spectral patterns have
been reported to be stable at 12- to 40-month retest (N€apflin, Wildi,
& Sarnthein, 2007), and high test-retest correlations have been
reported for broad-band spectral amplitude measures (r 5 .92 at 5
min, .84 at 12–14 weeks; Salinsky, Oken, & Morehead, 1991).
Resting EEG alpha and theta power at frontal and more posterior
electrodes have shown high test-retest reliability (between .82 and
.97) in both healthy adults (Smit et al., 2005; Tomarken, Davidson,
Wheeler, & Kinney, 1992) and depressed patients (Bruder et al.,
2008). In a report of alpha as a predictor of antidepressant treat-
ment response, alpha amplitude and asymmetry were unchanged
following treatment (Bruder et al., 2008). Retest reliability of alpha
asymmetry has, however, been found to be lower (between .41 and
.76) in both healthy adults (Debener et al., 2000; Hagemann, Nau-
mann, Thayer, & Bartussek, 2002; Tomarken et al., 1992) and
depressed patients (Allen et al., 2004; Bruder et al., 2008). Inas-
much as the measures for the present study are based on EEG
amplitudes, asymmetry measures are of secondary interest and will
therefore be presented as online supporting information (Table S1).
LDAEP. Hegerl, Gallinat, and Mrowinski (1994) quantified N1/
P2 as the strength of the tangential equivalent dipole corresponding
to superior temporal cortex within the Sylvian fissure (cf. Tenke &
Kayser, 2012). The loudness dependency of this measure showed
high reliability (r 5 .88) when retested after 3 weeks. A more
recent study (Hensch, Herold, Diers, Armbruster, & Brocke, 2008)
reported comparable high reliability for nose-referenced vertex
AEP measures. For 62 healthy adults, test-retest reliability of the
N1/P2 peak-to-peak amplitude ranged from .59 to .89, and N1/P2
LDAEP slope showed reliability between .78 and .87. Beauducel,
Debener, Brocke, and Kayser (2000) reported that the use of tem-
poral principal components analysis (tPCA) to derive ERP compo-
nent measures for N1 and P2 at midcentral sites improved test-
retest reliability over a 2- to 4-week interval when compared to
baseline-to-peak ERP measures (for N1, .42 to .52 vs. .06 to .38;
for N1/P2, .76 to .80 vs. .59 to .77).
LORETA rACC theta. Cannon et al. (2012) reported high test-
retest reliabilities after 30 days for total resting EEG power and
coherence in traditional EEG bands. In the same study, reliabilities
for LORETA-based measures across frequency bands and partici-
pants was also high, including measures for left rACC (BA 32;
Cronbach’s alpha 5 0.65 and 0.98 for eyes closed and eyes open,
respectively).
Rationale for present study and selection of measures. The
aim of this study was to evaluate the test-retest reliability of the
electrophysiological predictors used in an ongoing multisite study
of antidepressant treatment response, Establishing Moderators and
Biosignatures of Antidepressant Response for Clinical Care
(EMBARC); Trivedi et al. (2016). It was important to first establish
the test-retest reliability of all of the electrophysiological measures
in healthy adults, in order to preclude the possible impact of change
in clinical state of patients over time (spontaneous or treatment
related). Moreover, EEG predictors in at least one report (Leuchter
et al., 2009) rely on EEG changes between baseline and Week 1 of
treatment, making the test-retest reliability at Week 1 of critical
importance.
For resting EEG alpha and LDAEP, current source density
(CSD) measures were derived to avoid problems associated with
the choice of a recording reference. This approach reduces volume
conduction from distant locations, while representing the strength
of the current generators underlying the topography (Kayser &
Tenke, 2006a, 2006b; Tenke & Kayser, 2005, 2012).
For EEG alpha, the corresponding CSD topographies are pre-
dominantly posterior (Tenke et al., 2011), without the computation-
al bias that causes various reference schemes to misallocate it to
36 C.E. Tenke et al.
anterior regions (Tenke & Kayser, 2015). These CSD measures
were then quantified using frequency-based PCA (fPCA) methods.
In a similar manner, tPCA provided component measures for the
LDAEP paradigm, yielding measures with larger effect sizes and
increased reliability when compared to peak or time window esti-
mates (Beauducel et al., 2000; Kayser & Tenke, 2015b; Kayser,
Tenke, & Bruder, 1998).
In addition to CSD-fPCA measures, LORETA was also applied
to the resting EEG data to derive measures of current density attrib-
utable to the region of the rACC. Although different versions of the
LORETA algorithm have been described (Pascual-Marqui, 2002,
2007), we elected to use the one originally described (Pascual-Mar-
qui et al., 1994), since this was the method used in prior studies
linking rACC theta current density to antidepressant response
(Korb, Hunter, Cook, & Leuchter, 2009; Mulert et al., 2007; Pizza-
galli et al., 2001).
Data Unification Across EEG Platforms
Multisite studies pose a number of difficult challenges for efforts to
pool or equate data across testing sites, which may have different
EEG acquisition hardware systems and which may rely on distinct
software and technical methods to acquire, quantify, and analyze
the EEG data. As a result, findings in the literature are frequently
embedded in hardware-specific domains, with little or no effort to
generalize them across platforms. This oversight imposes implicit
limits on the clinical applicability of reported findings. The present
multisite study addressed these challenges by developing (a) a stan-
dardized EEG procedure manual to maximize the comparability of
data collected at four laboratories across the United States with dif-
ferent EEG recording montages and platforms, (b) data interpola-
tion to a common montage and sample rate, and (c)
implementation of a single, standardized analysis pipeline to pro-
cess these data.
Methods
Participants
A total of 39 healthy adults (24 female) were tested as part of the
EMBARC project (Trivedi et al., 2016), with participants locally
recruited and tested at each of four research testing sites: Columbia
University Medical Center (CU) in New York (n 5 10, 6 female),
University of Texas Southwestern Medical Center (TX) in Dallas
(n 5 10, 5 female), Massachusetts General Hospital (MG) in Bos-
ton (n 5 10, 6 female),1 and University of Michigan (UM) in Ann
Arbor (n 5 9, 7 female). The participants at these testing sites did
not differ significantly in mean age, F(3,35) 5 1.00, p 5 .40, or
gender ratio. Participants were recruited using advertisements in
local newspapers or online, and flyers or posters. After a telephone
screening, adults aged 18–65 of all races and ethnicities were invit-
ed to participate. A trained rater administered the Structured Clini-
cal Interview for DSM-IV Axis I Disorders, Nonpatient Edition
(First, Spitzer, Gibbon, & Williams, 1996), obtained information
about psychiatric and medical history, reviewed eligibility,
explained study procedures, and answered questions about the
study. Blood samples were drawn from eligible participants to test
for hematology, liver, thyroid, and kidney function, and urinalysis
was used as a drug screen and as a pregnancy test for women of
child-bearing age. Participants also completed self-rating scales,
including the Quick Inventory of Depressive Symptoms (QIDS-
SR; Rush et al., 2003), Antidepressant Treatment History Question-
naire (ATRQ; Chandler, Iosifescu, Pollack, Targum, & Fava,
2010), and Edinburgh Inventory (Oldfield, 1971) to assess handed-
ness. The study was approved by the institutional review board at
each testing site, and all participants signed an informed consent
form.
Inclusion criteria included 18–65 years old, QIDS-SR score of
less than 8, fluent in English, and capacity to understand the nature
of the study and provide written informed consent. Exclusion crite-
ria included (a) current or lifetime history for major depression,
bipolar disorder, schizophrenia, or other Axis I psychotic disorders,
(b) any current Axis I or Axis II diagnoses except for nicotine or
caffeine dependence, (c) meeting DSM-IV criteria for substance
dependence in the last 6 months (except for nicotine) or substance
abuse in the last 2 months, (d) positive urine drug screen at evalua-
tion, (e) any current history of an unstable general medical condi-
tion deemed to be clinically significant, (f) epilepsy or other
conditions requiring an anticonvulsant, (g) any clinically significant
abnormal laboratory results. The 39 participants (24 female/15
male) who met the inclusion criteria had a mean age of 37.6 years
(SD 5 14.8) and mean education of 15.7 years (SD 5 4.4). Their
mean handedness laterality quotient (LQ) on the Edinburgh Hand-
edness Inventory (Oldfield, 1971) was 70.6 (SD 5 51.4), with all
but five being right-handed (LQ> 0).
Procedures
Although wave-shape distortion caused by the use of filters with
different properties are primary concerns for ERP, its impact can
be mitigated by coupling broadband acquisition methods with off-
line filtering using narrow parameters sufficient for the final mea-
sures. However, resting EEG measures may also be influenced by
the signal-to-noise properties of the disparate platforms. Since one
of the aims of EMBARC is to increase sample sizes by pooling
across testing sites, we developed methods to uniquely counter or
account for differences between testing sites. This approach there-
by maximizes the impact of individual differences and participant
groupings across consecutive EEG recordings.
The most fundamental distinction between recording systems is
between those capable of recording low frequency EEG activity
down to 0 Hz (i.e., DC) and those that cannot. These differences
are not merely reflections of amplifier construction, since they
require unique electrodes as well (e.g., Ag-AgCl instead of tin).
Such fundamental distinctions affect the low-frequency content of
EEG spectra by their differential sensitivity to slow drifts, both
physiological (e.g., skin conductance) and artifactual (e.g., elec-
trode polarization) in origin. The present generation of EEG sys-
tems adds to this the distinction between acceptable electrode-to-
scalp impedances required of high- and low-impedance amplifiers,
as well as passive versus active electrodes (i.e., sources followers,
with or without balancing currents). Even though recording sys-
tems have considerably improved over time, it is clearly preferable
to completely eliminate testing site-based noise differences wher-
ever possible. For resting EEG alpha, this goal is facilitated by the
use of testing site-independent methods, coupled with the use of
testing site control factor. In contrast to resting EEG, signal averag-
ing alone is generally sufficient for LDAEP.
Test-retest sessions. Electrophysiological tests were administered
in a baseline session of 1–2 h, and the tests were repeated after1. EEG for MG participants was collected at McLean Hospital in
Belmont.
Reliability of EEG measures in EMBARC multisite study 37
5–16 days (mean 5 7.6 6 2.5 days). An effort was made to retest
individuals at about the same time of day as Session 1. The average
local time of day when subjects were tested in Session 1 (1:14
pm 6 2 h, 22 min) did not differ from Session 2 (12:52 pm 6 2 h,
24 min; t[38] 5 1.10, p 5 .28).
Resting EEG. EEG was recorded while participants sat quietly
during four 2-min periods, half with eyes open (O) and half with
eyes closed (C) in a counterbalanced order (OCCO). Participants
were instructed to remain still and inhibit blinks or eye movements
during each period. During the eyes-open condition, participants
fixated on a central cross on the monitor.
LDAEP. Participants sat quietly with their eyes open, fixating on a
central cross during each of five blocks of 100 trials (about 5 min
per block), while binaural tones (1000 Hz, 40-ms duration with 10-
ms rise and decay time) were presented at five intensities (60, 70,
80, 90, 100 dB SPL) in a pseudorandomized order with interstimu-
lus intervals (ISIs) ranging from 1,600–2,100 ms using Presentation
software (Neurobehavioral Systems, Albany, CA). Each stimulus
intensity was repeated 100 times for a total of 500 trials. Calibra-
tion of the output of headphones (in dB SPL) for the five tone
intensities in the LDAEP paradigm was done using a sound level
meter with a coupler appropriate for the headphones (CU, TX,
UM) or ear inserts (MG).
EEG Acquisition
Intersite standardization. All personnel responsible for adminis-
tering the above tests used an EEG procedure manual designed to
standardize test administration, including a set of instructions to
participants at scheduling of the tests (e.g., emphasizing to have a
good night’s sleep and avoid drinking alcohol the night before,
minimizing caffeine and nicotine on test day, and making sure hair
was clean and dry), instructions to participants prior to each test,
and detailed instructions to experimenters concerning the adminis-
tration of EEG and LDAEP tests. Each of the experimenters at all
testing sites required certification by the Columbia lab after demon-
strating EEG cap placement and task instruction via video confer-
ence and submitting satisfactory EEG data acquired from a
volunteer.
The continuous EEG data were acquired using different record-
ing equipment at each of the four research testing sites, with acqui-
sition filters set to broadband cutoffs to approximate DC-50 Hz (or
greater). The acquisition methods will be described for CU, fol-
lowed by variations for each of the other testing sites. To enhance
intersite comparability, the location of the recording electrode mon-
tage was optimized in all cases using direct measurements of elec-
trode locations corresponding to landmarks of the 10-20 system
(nasion, inion, auditory meati, vertex). Feedback was provided to
each testing site to identify and minimize artifacts, bad channels,
and electrode bridging as soon as possible to allow for correction
of technical errors.
CU acquisition methods. The electrode montage consisted of 72
expanded 10-20 system scalp channels (Pivik et al., 1993) on a
Lycra stretch electrode cap (Electro-Cap International, Inc.) includ-
ing 12 midline locations (nose, Nz to Iz) and 30 homologous pairs
over the left and right hemisphere, extending laterally to include
the inferior temporal lobes. Signals from the Ag/AgCl electrodes
were recorded using an active reference (ActiveTwo EEG system)
at electrode locations PPO1 (common mode sense, CMS) and
PPO2 (driven right leg, DRL), but monitored using a nose refer-
ence. The scalp placements were prepared using a conventional
water-soluble electrolyte gel and the interface was verified by the
acquisition software (ActiView), with additional care taken to
avoid electrolyte bridges (Alschuler, Tenke, Bruder, & Kayser,
2014; Tenke & Kayser, 2001). Continuous EEG was acquired at
256 samples/s (bandwidth: DC 251.3 Hz at 3 dB attenuation;
220.5 dB at 128 Hz) using the 24-bit BioSemi system, and the raw
data files were saved in the native (.bdf) format. Amplifier calibra-
tion was accomplished through saline between each active elec-
trode and CMS-DRL using a 100 mV, 100-ms square pulse (2-s
ISI).
MG acquisition methods. The electrode montage consisted of a
128-channel geodesic net (24-bit, Electrical Geodesics, Inc.; EGI),
including 10 midline locations (Nz to Iz) and 52 homologous pairs
over the left and right hemisphere, extending laterally to include
the two mastoids (below the 10-20 landmarks) and recorded using
a Cz reference (a nose channel was not included). The montage
also included two electrodes below each ear and five on each side
of the face. The scalp electrodes were prepared using a saline solu-
tion, with scalp connectivity verified by the 24-bit acquisition soft-
ware (Net Station), with additional care taken to avoid electrolyte
bridges. To facilitate subsequent interpolation to a common mon-
tage, particular care was taken to optimize the montage based on
landmarks of the 10-20 system (nasion, inion, auditory meatus, ver-
tex). Continuous EEG was acquired from Ag/AgCl electrodes at
250 samples/s, and the raw data files were saved in the native
(.raw) format. A 60 Hz notch filter was used with a DC–100 Hz
band-pass. Amplifiers were calibrated using a 20 Hz, 5000 mV sine
wave into the amplifier input.
TX acquisition methods. The electrode montage consisted of 62
expanded 10-20 system scalp channels on a Lycra stretch electrode
cap including 8 midline locations (Nz to Iz) and 27 homologous
pairs over the left and right hemisphere, extending laterally to
include the two mastoids, recorded using a nose reference. Contin-
uous EEG was acquired from Ag/AgCl electrodes at 250 samples/s
using the 32-bit NeuroScan Synamp system (Compumedics, El
Paso, TX) and the raw data files were saved in the native (.cnt) for-
mat. Data were recorded at DC–100 Hz with a 60 Hz notch. Ampli-
fier calibration used a 20 Hz, 50 mV sine wave into the amplifier
input.
UM acquisition methods. The electrode montage consisted of 60
expanded 10-20 system scalp channels on a Lycra stretch electrode
cap including 8 midline locations (FPz to Oz) and 26 homologous
pairs over the left and right hemisphere, extending laterally to
include the two mastoids, recorded using a nose reference. Contin-
uous EEG was acquired from tin electrodes at 250 samples/s using
the 32-bit NeuroScan Synamp system, and the raw data files were
saved in the native (.cnt) format. Data were recorded at .5–100 Hz
with a 60 Hz notch. Amplifier calibration used a 20 Hz, 50 mV sine
wave into the amplifier input.
Preprocessing Pipeline for Continuous EEG
The preprocessing strategy for continuous resting EEG and
LDAEP data is shown in Figure 1. In the first step, data were con-
verted from their native formats to BDF format using EEGLAB
(Delorme & Makeig, 2004) and a custom MATLAB script to pre-
serve the original data acquisition gain. Bad channels were then
38 C.E. Tenke et al.
identified from runtime notes and visual inspection of the continu-
ous data, as was the overall integrity of the data, taking particular
note of block transitions, missing or unusable periods within
blocks, or nonstandard blocks or files owing to technical errors. In
the third step, PolyRex (Kayser, 2013a) was used to remove DC
offsets, remove drift across each block via a polynomial filter, rere-
ference to a nose-tip reference, optimize data scaling if data repre-
sentation of the native acquisition format exceeded the range for a
common 16-bit A/D conversion, and convert to 16-bit NeuroScan
(.cnt) format that included the CU 72-channel montage.
After the channel montage has been created, missing or bad
channels, including those identified as bridged (Alschuler et al.,
2014; Tenke & Kayser, 2001), were replaced by spherical spline
interpolation (Perrin, Pernier, Bertrand, & Echallier, 1989) from
the remaining electrode locations (fourth step). Interpolated chan-
nels included all CU channels that were not in the UM and TX
montages and all 72 channels for the overlapping 128-channel MG
data. EEG data were not further analyzed if 20% or more of the
electrodes were bad. Note that the backward paths in Figure 1 indi-
cate possible breaks in the processing stream for iterative interac-
tive data handling by the technician in the case of recording errors
that required the removal of data between blocks or the flagging of
additional channels as bad due to excessive drift or intermittent
contact.
The final preprocessing step for continuous EEG data was blink
correction using a spatial, singular value decomposition (Neuro-
Scan). Bipolar electrooculogram (EOG) recordings (horizontal: lat-
eral to outer canthi; vertical: above and below right eye) were
interpolated using spherical splines (Perrin et al., 1989) as an aid in
identifying blinks and eye movements during visual inspection and
validation of rejected artifacts (see Footnote 1 in Kayser & Tenke,
2015b).
Data Segmentation and Processing of Resting EEG and
LDAEP Epochs
Blink-corrected data were segmented into 2-s epochs (75% over-
lap) for the resting EEG, or into stimulus-locked epochs (2200 to
1,000 ms) for the LDAEP. Resting EEG data were band-passed at
1–60 Hz (24 dB/octave), and LDAEP data low-passed at 50 Hz (24
dB/octave). Channels containing artifacts or noise for any given
epoch were identified using a semiautomated reference-free
approach to identify isolated EEG channels containing amplifier
drift, residual eye activity, muscle or movement-related artifacts on
a trial-by-trial basis (Kayser & Tenke, 2006d). If 25% or more of
all channels were identified as containing artifact, the trial was
rejected. Otherwise channels containing artifact were replaced by
spline interpolation (Perrin et al., 1989). For LDAEP, ERP aver-
ages were computed for all accepted trials, baseline corrected, and
low passed at 12.5 Hz (12 dB/octave). If required, epoched data
were adjusted to 256 samples/s using a temporal spline interpola-
tion. For the resting EEG, an additional automated step was includ-
ed to reject any remaining epochs exceeding a 100 lV threshold on
any channel (including uncorrected EOG channels), thereby
removing from consideration epochs containing well-defined
blinks.
CSD. EEG epochs and ERPs were transformed into reference-free
CSD estimates (mV/cm2) using a spherical spline surface Laplacian
(m 5 4; k 5 1025; Kayser & Tenke, 2006a; Perrin et al., 1989;
Tenke et al., 2011). CSD estimates represent the magnitude of the
radial current flow entering and leaving the skull and scalp from
the subjacent dura (Nunez, 1981; Nunez & Srinivasan, 2006), and
thereby identify the direction, location, and intensity of current
generators underlying a surface potential topography (Mitzdorf,
1985; Nicholson, 1973; Tenke & Kayser, 2012). CSD is a true
reference-free technique in that any EEG reference scheme pro-
vides identical CSD estimates, which resolves the ubiquitous prob-
lem of arbitrarily choosing a reference (Kayser & Tenke, 2010,
2015a).
PCA. The averaged EEG/CSD spectra and ERP/CSD waveforms
were separately submitted to frequency (spectra) or temporal
(waveforms) PCA derived from the covariance matrix, followed by
unrestricted varimax rotation of the covariance loadings (Kayser &
Tenke, 2003, 2006a; Tenke & Kayser, 2005). This approach deter-
mines common sources of variance in the original EEG/ERP data
or their reference-free transformations in the form of distinctive
PCA components (factor loadings) and corresponding weighting
coefficients (factor scores), and thereby provides a concise, effi-
cient simplification of the spectral or temporal pattern and spatial
distribution of surface potentials (EEG/ERP) or their neuronal gen-
erators (CSD). PCA-based estimates provide superior measures
(e.g., larger effect sizes, increased internal consistency, better test-
retest reliability) when compared to peak-to-peak amplitudes
(Beauducel et al., 2000; Beauducel & Debener, 2003) or integrated
time window amplitudes (Kayser et al., 1997, 1998; Kayser &
Tenke, 2015b).
The correspondence between the spectral pattern or time course
and topography of the extracted orthogonal factors, in conjunction
with the observed CSD spectra or waveforms, allows identification
and measurement of complex, physiologically relevant CSD com-
ponents for further analysis (i.e., only a limited number of mean-
ingful, high variance CSD factors are retained for further statistical
analysis; for complete rationale, see Kayser & Tenke, 2003, 2005,
2006a, 2006c). At the same time, the CSD-PCA approach provides
additional protection against artifacts (i.e., extracting EMG and
EOG as distinct components), reduces the impact of noise, and
eliminates reference-related errors (e.g., reversed local asymmetries
with weak rhythmicity; Tenke & Kayser, 2005).
CSD-fPCA for resting EEG. Data from one participant were
eliminated because of topographic distortion owing to excessive
electrolyte bridging, and another one due to abnormal EEG spectra.
Data from two additional participants were eliminated for poor
EEG quality (excessive artifact) in one or both of the two condi-
tions (eyes closed, eyes open). For the remaining 35 participants,
the total number of epochs was Session 1: eyes closed 5 331.8 6
73.0; eyes open 5 377.8 6 86.1; Session 2: eyes closed 5 330.1 6
82.4; eyes open 5 373.7 6 89.1. The 2-s CSD epochs were tapered
using a 50% Hanning window and padded with zeros (1 s at each
end) to yield a fast Fourier transformed spectral resolution of .25
Hz. This is consistent with the resolution of Tenke et al. (2011; 1-s
epochs padded to 4 s; 1,024 points/epoch), but relies on less spec-
tral interpolation. Mean power spectra were then computed for
accepted trials.
Our CSD-fPCA implementation uses CSD amplitude (root
mean squared power) spectra to obtain factors with an alpha struc-
ture that simply subdivided the alpha band, while preserving a line-
ar relationship to the amplitudes of the underlying current
generators (Tenke & Kayser, 2005). Due to the likelihood that the
unique characteristics of the different acquisition systems at each
testing site would degrade the comparability of the spectra across
testing site, additional steps were taken to eliminate site differences
Reliability of EEG measures in EMBARC multisite study 39
for alpha. First, since low-frequency drift, high-frequency noise,
and differences in the band-pass properties were known to differ,
the spectral data were limited to 1–40 Hz (data points 5–161).
However, for the present sample from each testing site, there were
noticeable differences between testing sites in the alpha band, with
MG showing lowest and TX the largest amplitude (see supporting
information, Figure S1)2. Although this is of less concern when the
sample is large, as would be the case in the upcoming analysis of
patient data, it was important to preclude the possibility that differ-
ential variance contributions from each testing site might lead to a
bias in the description and quantification of alpha by the PCA. For
this reason, scale factors were computed for each testing site to
equate the standard deviation of the CSD amplitude spectrum
waveforms in alpha (8–12 Hz) for all participants and recording
sessions at 19 posterior locations where alpha is greatest (P9/10,
P7/8, P5/6, P3/4, P1/2, Pz, PO7/8, PO3/4, POz, O1/2, Oz). The
complete CSD amplitude spectra for the full montage were then
scaled, thereby matching posterior CSD alpha across testing sites
without distorting the association between activity at each electrode
for the rest of the spectra.
After scaling, the CSD amplitude spectra (1–40 Hz) were sub-
mitted to unrestricted fPCA based on the covariance matrix, with
varimax rotation of the covariance loadings (Tenke & Kayser,
2005; Tenke et al., 2011), yielding three dominant factors repre-
senting EEG alpha (49.1% variance of amplitude spectra). These
factors were used as a spectral filter (Tenke et al., 2011) to recon-
struct the alpha amplitude spectra without the influence of high-
variance noise (e.g., EMG: broad peak at 28 Hz, 20.6%; EOG: 1.25
Hz peak, 20.3%) or other low-variance activity (remaining
factors< 2.5%). A second PCA with varimax rotation was con-
fined to 1–20 Hz (see Figure S2), resulting in a low alpha factor
(47.9%), a high alpha factor (36.1%), and a residual factor includ-
ing low beta (16.0%).
Based on prior EEG studies evaluating posterior alpha power as
a marker of antidepressant response (Tenke et al., 2011), estimates
of low-frequency alpha were computed as regional means across
three posterolateral locations on each hemisphere (P7/8, P9/10,
PO7/PO8). The high-frequency alpha factor score topography like-
wise included posteromedial and midline locations, although the
variability across testing sites required a broader region for confi-
dent quantification (P7/8, P5/6, P3/4, P1/2, PO7/8, PO3/4, POz,
O1/2, Oz). The resulting estimates were then averaged to examine
the reliability of overall posterior alpha (mean of eyes closed and
eyes open). For comparison with the alpha asymmetry literature,
these posterior measures were supplemented by medial and lateral
parietal (P3/4, P7/8) and frontal (F3/4, F7/8) electrodes to examine
the reliability of alpha amplitude (mean of homologous electrodes)
and asymmetry (right hemisphere minus left hemisphere) at these
locations.
CSD-tPCA for LDAEP. Acceptable LDAEP averages were
available for 38 participants. To optimize the identification and
quantification of N1, latency jitter (M€ocks, 1986) was eliminated
between participants by temporally adjusting CSD waveforms for
N1 sink peak latency (Kayser et al., 2012). This was accomplished
by computing mean CSD waveforms across all five intensities,
pooling them across 8 medial frontocentral locations (FC1/2, FC3/
4, C1/2, C3/4) and across four lateral temporoparietal locations
(TP7/8, P9/10) to provide an optimized estimate for N1 sink activi-
ty at frontocentral locations and its opposite (i.e., source) side of
the underlying N1 dipole at temporoparietal locations. The most
negative deflection of the corresponding difference waveform (i.e.,
frontocentral minus temporoparietal pooled CSDs) was determined
between 0 and 200 ms after stimulus onset, resulting in N1 sink
peak latencies between 90 and 195 ms (188 6 15 ms). These indi-
vidual N1 sink peak latencies were used to jointly align all 72 CSD
waveforms for each stimulus intensity.
The optimized CSD waveforms were submitted to unrestricted
tPCA as described above for fPCA (Kayser & Tenke, 2003,
2006a), in order to determine common sources of variance related
to N1 sink activity and to quantify its amplitude. The input matrices
consisted of 257 variables (samples between 2101 and 898 ms)
and 27,360 observations stemming from 38 participants, two tests,
five intensities, and 72 electrode locations. Because this approach
provides a concise, efficient simplification of the temporal pattern
and spatial distribution of neuronal generators (Kayser & Tenke,
2003, 2006a), the present analysis focused on the PCA factor repre-
senting N1 sink.
To further minimize the problem of spatial component jitter
between participants, bihemispheric N1 sink maxima and minima
were determined from the individual N1 sink topographies (i.e.,
mean PCA factor scores across all five intensities for each partici-
pant). The most negative location within an array of 12 frontocen-
tral and centroparietal locations (i.e., locations for the left
hemisphere were F1, F3, F5, FC1, FC3, FC5, C1, C3, C5, CP1,
CP3, CP5; homologous locations were used for the right hemi-
sphere) and the most positive location within an array of seven lat-
eral frontotemporal and temporoparietal locations (i.e., FT7, FT9,
T7, TP7, TP9, P7, P9 for the left hemisphere, and homologous
locations for the right hemisphere) were determined, and these
locations were then used to compute an estimate of N1 sink dipole
strength for each hemisphere (i.e., difference between maximum
and minimum) and intensity (see Figure 3A in Tenke & Kayser,
2012, p. 2335, for a comparison between ERP and CSD topogra-
phies of N1 during LDAEP). For the present report, N1 dipoles
computed for left and right hemisphere were averaged to obtain a
single estimate for the tangentially oriented N1 dipole in the vicini-
ty of primary auditory cortex (Hegerl, Wilk, Olbrich, Schoen-
knecht, & Sander, 2001; highly similar but less robust reliabilities
were observed for other quantifications of N1 amplitude, including
PCA-based N1 amplitudes measured at C3 and C4 only).
The number of artifact-free trials included in the computation of
the LDAEP averages did not differ between Session 1 (mean 6 SD,
90.0 6 13.7) and Session 2 (88.7 6 6.8), yielding similar means
across intensities (range from 87.6 6 7.8 to 88.3 6 7.6) and more
than sufficient means for each testing site (CU: 92.6 6 3.1; MG:
87.9 6 3.3; TX: 86.5 6 5.9; UM: 84.2 6 12.1), despite a marginally
significant difference between testing sites, F(3,34) 5 2.36,
p 5 .09. However, there were no significant interactions between
session, intensity, or testing site (all ps> .29).
LORETA analysis of resting EEG. Although LORETA data
were processed in parallel with those described for the resting
EEG, only the eyes-closed condition was used, in line with prior
studies linking rACC theta current density to treatment response
(e.g., Pizzagalli et al., 2001). Acceptable data were available for 37
participants. Consecutive 2-s, nose-referenced EEG epochs, pre-
cisely matching those subjected to CSD-fPCA, were processed
using LORETA (Pascual-Marqui et al., 1999) following the
2. Although TX and UM share a higher peak frequency than the oth-er sites in Figure S1, they had widely different recording environments,owing to the distinction between DC with Ag/AgCl electrodes versus a.5 Hz filter with tin electrodes.
40 C.E. Tenke et al.
elimination of overlapping data (i.e., one out of four epochs
retained). This approach mimics analyses from prior LORETA
studies implicating rACC theta current density in predicting antide-
pressant response (e.g., Mulert et al., 2007; Pizzagalli et al., 2001).
LORETA computed the three-dimensional intracerebral current
density distribution of EEG theta (6.5–8 Hz) based on the assump-
tion that similar levels of activation characterize neighboring neu-
rons, but with no assumptions about the number of generating
sources. LORETA partitions the solution space into 2,394 cubic
“voxels” (voxel dimension: 7 mm3) limited to cortical gray matter
and hippocampi, according to the digitized MNI probability atlases
available from the Montreal Neurologic Institute (MNI). This dis-
tributed source localization technique has received cross-modal vali-
dation from studies combining LORETA with fMRI (Mulert et al.,
2004; Vitacco, Brandeis, Pascual-Marqui, & Martin, 2002), structur-
al MRI (Cannon et al., 2011; Worrell et al., 2000), intracranial EEG
recordings (Zumsteg, Friedman, Wioeser, & Wennberg, 2006), and
PET (Pizzagalli et al., 2004; Zumsteg, Wennberg, Treyer, Buck, &
Wieser, 2005; but see Gamma et al., 2004). Given that prior research
has implicated theta current density in the rACC as a predictor of
treatment response to antidepressant medication (Korb et al., 2009;
Mulert et al., 2007; Pizzagalli et al., 2001; Rentzsch, Adli, Wiethoff,
de Castro, & Gallinat, 2014), analyses were restricted to this band
(6.5–8 Hz) and a predefined rACC region of interest involving 13
voxels (Korb et al., 2009; Pizzagalli et al., 2001).
For the baseline session, the mean number of artifact-free
epochs included was 83.4 6 16.5—amounting to an average of
170.8 6 33.7 s of artifact-free EEG data available for analyses. For
the Week 1 session, 82.2 6 16.5 artifact-free epochs were available
(168.3 6 37.7 s). No significant differences emerged across testing
sites or across sessions with respect to the number of artifact-free
EEG epochs available for the LORETA analyses, all ps> .45. Con-
sistent with established procedures (e.g., Pizzagalli et al., 2004),
LORETA activity was normalized to a total power of 1 before sta-
tistical analyses. To minimize variations in signal-to-noise ratios
across testing sites, over-smoothing was used (option TM04 in the
LORETA transformation matrix module).
Results
Resting EEG Alpha
CSD-fPCA of the resting EEG yielded expected low- and high-
frequency alpha factors, identifiable by their factor loadings spec-
tra, their distinct posterior topographies, and their condition depen-
dency (greater alpha for eyes-closed than for eyes-open conditions;
see Figure S2). A residual alpha factor primarily reflected beta, and
showed the opposite condition dependency (maximal for eyes
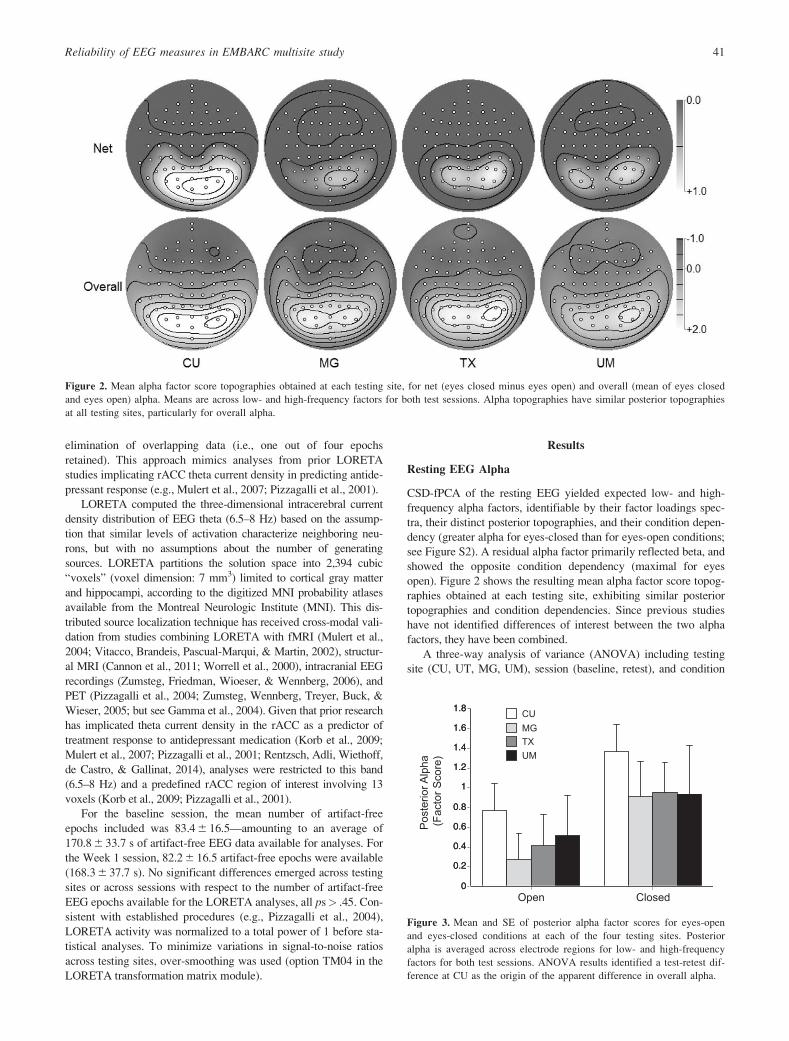
open). Figure 2 shows the resulting mean alpha factor score topog-
raphies obtained at each testing site, exhibiting similar posterior
topographies and condition dependencies. Since previous studies
have not identified differences of interest between the two alpha
factors, they have been combined.
A three-way analysis of variance (ANOVA) including testing
site (CU, UT, MG, UM), session (baseline, retest), and condition
Figure 2. Mean alpha factor score topographies obtained at each testing site, for net (eyes closed minus eyes open) and overall (mean of eyes closed
and eyes open) alpha. Means are across low- and high-frequency factors for both test sessions. Alpha topographies have similar posterior topographies
at all testing sites, particularly for overall alpha.P
oste
rior A
lpha
(F
acto
r Sco
re)
0
0.2
0.4
0.6
0.8
1
1.2
1.4
1.6
1.8
0
0.2
0.4
0.6
0.8
1
1.2
1.4
1.6
1.8 CUMGTXUM
Open Closed
Figure 3. Mean and SE of posterior alpha factor scores for eyes-open
and eyes-closed conditions at each of the four testing sites. Posterior
alpha is averaged across electrode regions for low- and high-frequency
factors for both test sessions. ANOVA results identified a test-retest dif-
ference at CU as the origin of the apparent difference in overall alpha.
Reliability of EEG measures in EMBARC multisite study 41
(eyes open, eyes closed) yielded the expected condition effect with
posterior alpha (averaged across low and high alpha factors; 8–12
Hz) being greater with eyes closed than eyes open at each testing
site, F(1,31) 5 30.80, p< .001, gp2 5 .50. Figure 3 illustrates this
effect for each testing site, and supports the impression by Figure 2
of greater alpha for CU than the other sites. However, the only sig-
nificant testing site effect was an overall Testing Site x Session
interaction, F(3,31) 5 3.93, p 5 .02, gp2 5 .275.
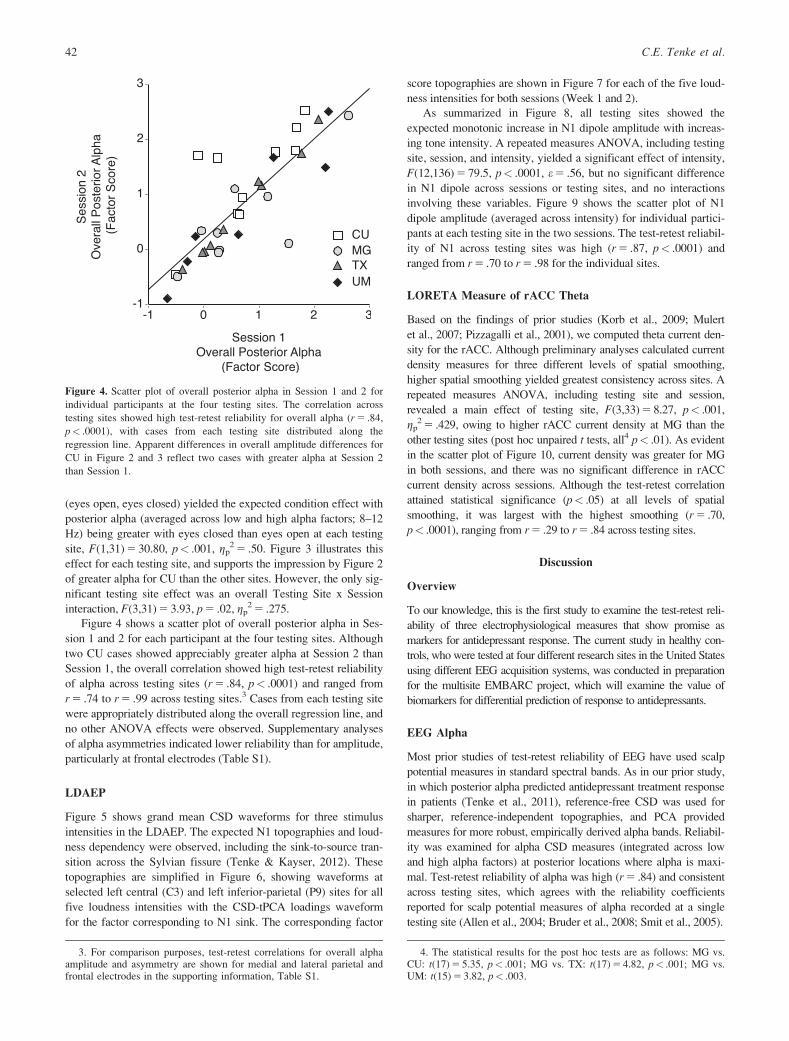
Figure 4 shows a scatter plot of overall posterior alpha in Ses-
sion 1 and 2 for each participant at the four testing sites. Although
two CU cases showed appreciably greater alpha at Session 2 than
Session 1, the overall correlation showed high test-retest reliability
of alpha across testing sites (r 5 .84, p< .0001) and ranged from
r 5 .74 to r 5 .99 across testing sites.3 Cases from each testing site
were appropriately distributed along the overall regression line, and
no other ANOVA effects were observed. Supplementary analyses
of alpha asymmetries indicated lower reliability than for amplitude,
particularly at frontal electrodes (Table S1).
LDAEP
Figure 5 shows grand mean CSD waveforms for three stimulus
intensities in the LDAEP. The expected N1 topographies and loud-
ness dependency were observed, including the sink-to-source tran-
sition across the Sylvian fissure (Tenke & Kayser, 2012). These
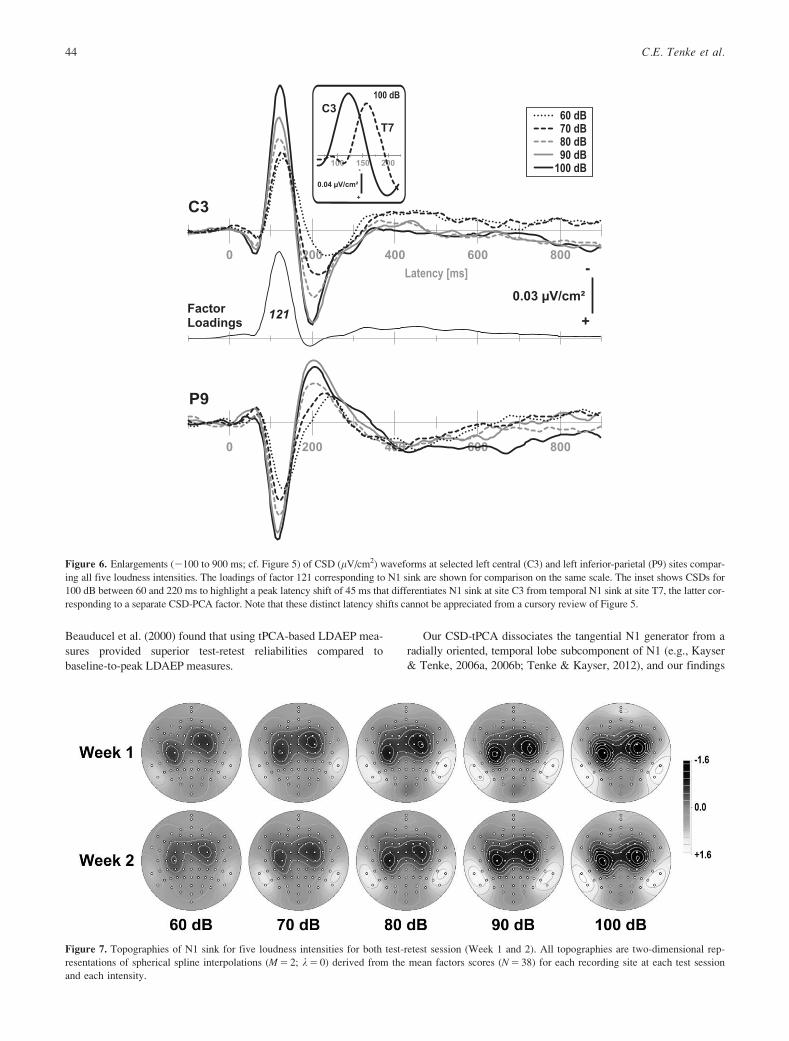
topographies are simplified in Figure 6, showing waveforms at
selected left central (C3) and left inferior-parietal (P9) sites for all
five loudness intensities with the CSD-tPCA loadings waveform
for the factor corresponding to N1 sink. The corresponding factor
score topographies are shown in Figure 7 for each of the five loud-
ness intensities for both sessions (Week 1 and 2).
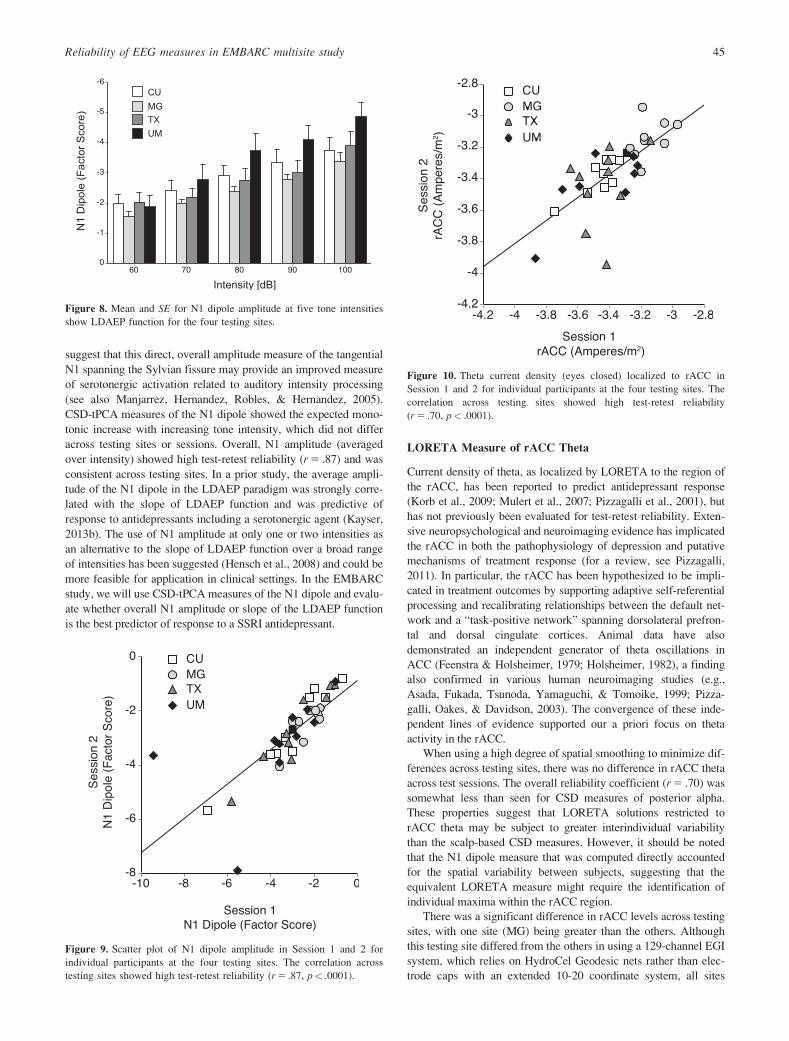
As summarized in Figure 8, all testing sites showed the
expected monotonic increase in N1 dipole amplitude with increas-
ing tone intensity. A repeated measures ANOVA, including testing
site, session, and intensity, yielded a significant effect of intensity,
F(12,136) 5 79.5, p< .0001, e 5 .56, but no significant difference
in N1 dipole across sessions or testing sites, and no interactions
involving these variables. Figure 9 shows the scatter plot of N1
dipole amplitude (averaged across intensity) for individual partici-
pants at each testing site in the two sessions. The test-retest reliabil-
ity of N1 across testing sites was high (r 5 .87, p< .0001) and
ranged from r 5 .70 to r 5 .98 for the individual sites.
LORETA Measure of rACC Theta
Based on the findings of prior studies (Korb et al., 2009; Mulert
et al., 2007; Pizzagalli et al., 2001), we computed theta current den-
sity for the rACC. Although preliminary analyses calculated current
density measures for three different levels of spatial smoothing,
higher spatial smoothing yielded greatest consistency across sites. A
repeated measures ANOVA, including testing site and session,
revealed a main effect of testing site, F(3,33) 5 8.27, p< .001,
gp2 5 .429, owing to higher rACC current density at MG than the
other testing sites (post hoc unpaired t tests, all4 p< .01). As evident
in the scatter plot of Figure 10, current density was greater for MG
in both sessions, and there was no significant difference in rACC
current density across sessions. Although the test-retest correlation
attained statistical significance (p< .05) at all levels of spatial
smoothing, it was largest with the highest smoothing (r 5 .70,
p< .0001), ranging from r 5 .29 to r 5 .84 across testing sites.
Discussion
Overview
To our knowledge, this is the first study to examine the test-retest reli-
ability of three electrophysiological measures that show promise as
markers for antidepressant response. The current study in healthy con-
trols, who were tested at four different research sites in the United States
using different EEG acquisition systems, was conducted in preparation
for the multisite EMBARC project, which will examine the value of
biomarkers for differential prediction of response to antidepressants.
EEG Alpha
Most prior studies of test-retest reliability of EEG have used scalp
potential measures in standard spectral bands. As in our prior study,
in which posterior alpha predicted antidepressant treatment response
in patients (Tenke et al., 2011), reference-free CSD was used for
sharper, reference-independent topographies, and PCA provided
measures for more robust, empirically derived alpha bands. Reliabil-
ity was examined for alpha CSD measures (integrated across low
and high alpha factors) at posterior locations where alpha is maxi-
mal. Test-retest reliability of alpha was high (r 5 .84) and consistent
across testing sites, which agrees with the reliability coefficients
reported for scalp potential measures of alpha recorded at a single
testing site (Allen et al., 2004; Bruder et al., 2008; Smit et al., 2005).
Figure 4. Scatter plot of overall posterior alpha in Session 1 and 2 for
individual participants at the four testing sites. The correlation across
testing sites showed high test-retest reliability for overall alpha (r 5 .84,
p< .0001), with cases from each testing site distributed along the
regression line. Apparent differences in overall amplitude differences for
CU in Figure 2 and 3 reflect two cases with greater alpha at Session 2
than Session 1.
3. For comparison purposes, test-retest correlations for overall alphaamplitude and asymmetry are shown for medial and lateral parietal andfrontal electrodes in the supporting information, Table S1.
4. The statistical results for the post hoc tests are as follows: MG vs.CU: t(17) 5 5.35, p< .001; MG vs. TX: t(17) 5 4.82, p< .001; MG vs.UM: t(15) 5 3.82, p< .003.
42 C.E. Tenke et al.
LDAEP
Although studies have found LDAEP predicts response to SSRI
antidepressants, there is less agreement on the best way of measur-
ing it. A variety of different methods have been used to measure
LDAEP, including scalp potential, dipole source analysis, or LOR-
ETA measures of N1, P2, or N1/P2 difference waveforms. The
model of Hegerl and Juckel (1993) related LDAEP of N1/P2 to
serotonergic neurotransmission in primary auditory cortex. The tan-
gentially oriented N1 dipole within the superior temporal gyrus in
the vicinity of primary auditory cortex is thought to be uniquely
important (Hegerl & Juckel, 1993; Hegerl et al., 1994), and Galli-
nat et al. (2000) found evidence that LDAEP of the tangential
dipole of N1/P2 predicts response to a SSRI better than LDAEP
scalp potentials from a single electrode (Cz). Simultaneous mea-
surement of EEG and fMRI showed a high correlation of loudness
dependence of activity in primary auditory cortex between fMRI
and LORETA measures (Mulert et al., 2005). Both dipole source
analysis and LORETA measures of LDAEP were found to predict
response to a SSRI to the same degree, but were not highly corre-
lated (Mulert, Juckel, Augustin, & Hegerl, 2002). Moreover,
Figure 5. Grand mean (N 5 38) CSD (lV/cm2) waveforms (2100 to 900 ms, 100 ms prestimulus baseline) comparing stimuli of low (60 dB), medi-
um (80 dB), and high (100 dB) loudness intensity (pooled across testing site and test-retest session) at all 72 scalp recording locations. CSDs had
been individually adjusted for N1 sink peak latency (see text).
Reliability of EEG measures in EMBARC multisite study 43
Beauducel et al. (2000) found that using tPCA-based LDAEP mea-
sures provided superior test-retest reliabilities compared to
baseline-to-peak LDAEP measures.
Our CSD-tPCA dissociates the tangential N1 generator from a
radially oriented, temporal lobe subcomponent of N1 (e.g., Kayser
& Tenke, 2006a, 2006b; Tenke & Kayser, 2012), and our findings
Figure 6. Enlargements (2100 to 900 ms; cf. Figure 5) of CSD (lV/cm2) waveforms at selected left central (C3) and left inferior-parietal (P9) sites compar-
ing all five loudness intensities. The loadings of factor 121 corresponding to N1 sink are shown for comparison on the same scale. The inset shows CSDs for
100 dB between 60 and 220 ms to highlight a peak latency shift of 45 ms that differentiates N1 sink at site C3 from temporal N1 sink at site T7, the latter cor-
responding to a separate CSD-PCA factor. Note that these distinct latency shifts cannot be appreciated from a cursory review of Figure 5.
Figure 7. Topographies of N1 sink for five loudness intensities for both test-retest session (Week 1 and 2). All topographies are two-dimensional rep-
resentations of spherical spline interpolations (M 5 2; k 5 0) derived from the mean factors scores (N 5 38) for each recording site at each test session
and each intensity.
44 C.E. Tenke et al.
suggest that this direct, overall amplitude measure of the tangential
N1 spanning the Sylvian fissure may provide an improved measure
of serotonergic activation related to auditory intensity processing
(see also Manjarrez, Hernandez, Robles, & Hernandez, 2005).
CSD-tPCA measures of the N1 dipole showed the expected mono-
tonic increase with increasing tone intensity, which did not differ
across testing sites or sessions. Overall, N1 amplitude (averaged
over intensity) showed high test-retest reliability (r 5 .87) and was
consistent across testing sites. In a prior study, the average ampli-
tude of the N1 dipole in the LDAEP paradigm was strongly corre-
lated with the slope of LDAEP function and was predictive of
response to antidepressants including a serotonergic agent (Kayser,
2013b). The use of N1 amplitude at only one or two intensities as
an alternative to the slope of LDAEP function over a broad range
of intensities has been suggested (Hensch et al., 2008) and could be
more feasible for application in clinical settings. In the EMBARC
study, we will use CSD-tPCA measures of the N1 dipole and evalu-
ate whether overall N1 amplitude or slope of the LDAEP function
is the best predictor of response to a SSRI antidepressant.
LORETA Measure of rACC Theta
Current density of theta, as localized by LORETA to the region of
the rACC, has been reported to predict antidepressant response
(Korb et al., 2009; Mulert et al., 2007; Pizzagalli et al., 2001), but
has not previously been evaluated for test-retest reliability. Exten-
sive neuropsychological and neuroimaging evidence has implicated
the rACC in both the pathophysiology of depression and putative
mechanisms of treatment response (for a review, see Pizzagalli,
2011). In particular, the rACC has been hypothesized to be impli-
cated in treatment outcomes by supporting adaptive self-referential
processing and recalibrating relationships between the default net-
work and a “task-positive network” spanning dorsolateral prefron-
tal and dorsal cingulate cortices. Animal data have also
demonstrated an independent generator of theta oscillations in
ACC (Feenstra & Holsheimer, 1979; Holsheimer, 1982), a finding
also confirmed in various human neuroimaging studies (e.g.,
Asada, Fukada, Tsunoda, Yamaguchi, & Tomoike, 1999; Pizza-
galli, Oakes, & Davidson, 2003). The convergence of these inde-
pendent lines of evidence supported our a priori focus on theta
activity in the rACC.
When using a high degree of spatial smoothing to minimize dif-
ferences across testing sites, there was no difference in rACC theta
across test sessions. The overall reliability coefficient (r 5 .70) was
somewhat less than seen for CSD measures of posterior alpha.
These properties suggest that LORETA solutions restricted to
rACC theta may be subject to greater interindividual variability
than the scalp-based CSD measures. However, it should be noted
that the N1 dipole measure that was computed directly accounted
for the spatial variability between subjects, suggesting that the
equivalent LORETA measure might require the identification of
individual maxima within the rACC region.
There was a significant difference in rACC levels across testing
sites, with one site (MG) being greater than the others. Although
this testing site differed from the others in using a 129-channel EGI
system, which relies on HydroCel Geodesic nets rather than elec-
trode caps with an extended 10-20 coordinate system, all sites
Figure 8. Mean and SE for N1 dipole amplitude at five tone intensities
show LDAEP function for the four testing sites.
Figure 9. Scatter plot of N1 dipole amplitude in Session 1 and 2 for
individual participants at the four testing sites. The correlation across
testing sites showed high test-retest reliability (r 5 .87, p< .0001).
Figure 10. Theta current density (eyes closed) localized to rACC in
Session 1 and 2 for individual participants at the four testing sites. The
correlation across testing sites showed high test-retest reliability
(r 5 .70, p< .0001).
Reliability of EEG measures in EMBARC multisite study 45
relied on the identical 72-channel interpolated montage for the
inverse computation. In planned analyses of EMBARC data, it will
therefore be necessary to include research testing site as a covariate
or to implement additional normalizations across the four testing
sites. It is also important to note that the prescaling strategy applied
to alpha was not used for the LORETA measure, which was com-
puted directly from the eyes-closed EEG epochs, rather than from
eyes-open and eyes-closed CSD amplitude spectra. The theta mea-
sure was also delimited by an a priori band.
Standardization Across Acquisition Sites and Platforms:
Strengths and Limitations
The use of different EEG systems across testing sites poses a
unique challenge that must be dealt with if the neurophysiological
predictors determined in the EMBARC study are to be applied in
real-world clinical settings. Considerable efforts were made to stan-
dardize the training of testers and administration of the EEG across
testing sites. The main purpose of testing healthy controls in this
study was to establish sufficient reliability of the potential predic-
tors of treatment outcome. Although limited by the small number
of participants at each testing site, the results show that retest reli-
ability across testing sites was high for alpha power and LDAEP
despite differences in EEG systems. Reliability of rACC measures
obtained with LORETA was lower, but still acceptable, and not
affected by site differences, suggesting that it may be a property of
the measure itself.
Another limitation of this study is that there was no control of
the mental state or wakefulness of individuals during the EEG
assessments. In particular, no diary was obtained of prior night
sleep or daily activities. Global brain states, such as central nervous
system arousal or vigilance levels,5 can impact resting EEG mea-
sures (Hegerl et al., 2012; Olbrich et al., 2012), and circadian phase
and sleep pressure during wakefulness also affect resting EEG
(Aeschbach et al., 1997). Although time of day of EEG tests did
not differ significantly across test and retest sessions, lack of con-
trol of individual’s wakefulness or vigilance during these sessions
could have increased variance of alpha and theta measures and
reduced retest reliability. This will, however, be the case in real-
world applications of EEG tests, and despite the lack of control of
these variables, good-to-excellent retest reliability was obtained for
each of the EEG measures in the EMBARC study, which repre-
sents a clear strength of the current findings and analytic
approaches.
One potential source of variance between measures obtained at
the different testing sites is the different calibration strategies used
for different recording systems or preferred by different laborato-
ries. It might be supposed that the use of a single calibration signal
at all testing sites would be sufficient to assure comparability
across sites. Unfortunately, there is no common mechanism for
introducing the signal into all systems. Although the NeuroScan
and EGI systems are equipped to introduce a calibration signal
directly into the amplifier, this approach implicitly ignores the con-
tributions of the electrode-scalp interface, including the different
properties of Ag/AgCl and tin electrodes. Moreover, the electrodes
of the Active2 system are all active, and its native recording refer-
ence is a CMS electrode combined with a DRL balance electrode
(CMS-DRL), which makes measurements through saline preferable
for calibration. Following this line of reasoning one step further,
the optimal common calibration signal for a study of alpha might
be a 10 Hz sinusoid recorded through each system through the
recording electrodes. Calibration across a wider range of frequen-
cies (e.g., 1–20 Hz used for the final PCA) would either require a
series of sinusoids or a variable frequency sweeping across the fre-
quency range, resulting in a site-specific correction for EEG spec-
tra. The same approach might also provide better comparability of
LDAEP waveforms across sites than using rectangular pulses of
appropriate durations for signals (as used at CU). However, further
consideration of these alternatives is well beyond the scope of the
present study.
The resting CSD spectra were prescaled to protect against the
possibility that alpha amplitude differences between testing sites
might differentially bias the contribution of each site to the final
PCA solution. In the case of small samples of healthy controls,
such as used in the present report, this approach also redistributed
cases from the different testing sites along the across-site regression
line in Figure 4, suggesting its applicability as a more general
method for enhancing the consistency of alpha across testing sites
quite apart from the rest of the EEG spectrum. This approach clear-
ly has face validity for evaluating stability over time, but it does
not provide a universal method for pooling across testing sites.
Since healthy controls show considerable variability in overall rest-
ing alpha and task-related prestimulus alpha (Tenke, Kayser, Abra-
ham, Alvarenga, & Bruder, 2015), it is not impossible for even
large samples of patients to differ in alpha amplitudes. It is there-
fore mandatory to include testing site as a control factor in all anal-
yses that might distinguish between subgroups based on means
(e.g., repeated measures ANOVA, etc.).
Conclusion
In summary, this multisite study demonstrated good test-retest reli-
ability of CSD measures of resting EEG alpha and N1 dipole mea-
sures of LDAEP, and adequate test-retest reliability of LORETA
measures of the activity in rACC, all of which have shown promise
as predictors of clinical response to antidepressants. This report
also details standardized procedures for improving compatibility of
EEG and ERP data across testing sites using different EEG plat-
forms and electrode montages, which should be highly relevant in
other research contexts. This report is therefore both a critical step
in evaluating the usefulness of electrophysiological measures as
biomarkers for predicting clinical response to antidepressants as
well as a template to guide future EEG/ERP studies derived from
multiple testing sites, as is the current trend in government-funded
research.
Acknowledgments
The authors would like to thank the reviewers for their helpful
comments. The EMBARC study was supported by the National
Institute of Mental Health of the National Institutes of Health under
award numbers U01MH092221 (MHT) and U01MH092250
(PGMcG, RVP, MMW). The CSD methods were funded by
MH36295.
The content is solely the responsibility of the authors and does
not necessarily represent the official views of the National Insti-
tutes of Health. Valeant Pharmaceuticals donated the Wellbutrin
XL that will be used in the clinical trial. This work was supported
by the EMBARC National Coordinating Center at UT
5. Analyses are underway examining the application of a vigilancealgorithm on the EEG of patients and controls in this study (Hegerlet al., 2012; Olbrich et al., 2012), which are extensive and will bereported separately.
46 C.E. Tenke et al.

Southwestern Medical Center, Madhukar H. Trivedi, M.D.,
Coordinating PI, and the Data Center at Columbia and Stony
Brook Universities. Dr. Kurian has received grant support from
the following additional sources: Targacept, Inc.; Pfizer, Inc.;
Johnson & Johnson; Evotec; Rexahn; Naurex; and Forest Phar-
maceuticals. Dr. Trivedi is or has been an advisor/consultant to
Abbott Laboratories, Inc., Abdi Ibrahim, Akzo (Organon Phar-
maceuticals Inc.), Alkermes, AstraZeneca, Axon Advisors,
Bristol-Myers Squibb Company, Cephalon, Inc., Cerecor, Con-
cert Pharmaceuticals, Inc., Eli Lilly & Company, Evotec, Fabre
Kramer Pharmaceuticals, Inc., Forest Pharmaceuticals, GlaxoS-
mithKline, Janssen Global Services, LLC, Janssen Pharmaceu-
tica Products, LP, Johnson & Johnson PRD, Libby, Lundbeck,
Meade Johnson, MedAvante, Medtronic, Merck, Mitsubishi
Tanabe Pharma Development America, Inc., Naurex, Neuro-
netics, Otsuka Pharmaceuticals, Pamlab, Parke-Davis Pharma-
ceuticals, Inc., Pfizer Inc., PgxHealth, Phoenix Marketing
Solutions, Rexahn Pharmaceuticals, Ridge Diagnostics, Roche
Products Ltd., Sepracor, SHIRE Development, Sierra, SK Life
and Science, Sunovion, Takeda, Tal Medical/Puretech Venture,
Targacept, Transcept, VantagePoint, Vivus, and Wyeth-Ayerst
Laboratories. In addition, he has received research support from
Agency for Healthcare Research and Quality (AHRQ), Corcept
Therapeutics, Inc., Cyberonics, Inc., National Alliance for
Research in Schizophrenia and Depression, National Institute of
Mental Health, National Institute on Drug Abuse, Novartis,
Pharmacia & Upjohn, Predix Pharmaceuticals (Epix), and Sol-
vay Pharmaceuticals, Inc. For a comprehensive list of lifetime
disclosures of Dr. Fava, see http://mghcme.org/faculty/faculty-
detail/maurizio_fava. Dr. McGrath has received research grant
support from Forest Research, Naurex, and Sunovion. Over the
past 3 years, Dr. Pizzagalli has received honoraria/consulting
fees from BlackThorn Therapeutics, Otsuka America Pharma-
ceutical, and Pfizer for activities unrelated to this project. All
other authors have no biomedical financial interests or potential
conflicts of interest.
References
Aeschback, D., Matthews, J. R., Postolache, T. T., Jackson, M. A., Giesen,H. A., & Wehr, T. A. (1997). Dynamics of the human EEG during pro-longed wakefulness: Evidence for frequency-specific circadian andhomeostatic influences. Neuroscience Letters, 239, 121–124. doi:10.1016/S0304-3940(97)00904-X
Alhaj, H., Wisniewski, G., & McAllister-Williams, R. H. (2011). The useof the EEG in measuring therapeutic drug action: Focus on depressionand antidepressants. Journal of Psychopharmacology, 25, 1175–1191.doi: 10.1177/0269881110388323
Allen, J. J., Urry, H. L., Hitt, S. K., & Coan, J. A. (2004). The stability ofresting frontal electroencephalographic asymmetry in depression. Psy-chophysiology, 41, 269–280. doi: 10.1111/j.1469-8986.2003.00149.x
Alschuler, D. M., Tenke, C. E., Bruder, G. E., & Kayser. J. (2014). Identi-fying electrode bridging from electrical distance distributions: A surveyof publicly-available EEG data using a new method. Clinical Neuro-physiology 125, 484–490. doi: 10.1016/j.clinph.2013.08.024
Arns, M., Bruder, G., Hegerl, U., Spooner, C., Palmer, D. M., Etkin, A., . . .Gordon, E. (2016). EEG alpha asymmetry as a gender-specific predic-tor of outcome to acute treatment with different antidepressant medica-tions in the randomized iSPOT-D study. Clinical Neurophysiology,127, 509–519. doi: 10.1016/j.clinph.2015.05.032
Arns, M., Etkin, A., Hegerl, U., Williams, L. M., DeBattista, C., Palmer,D. M., . . . Gordon, E. (2015). Frontal and rostral anterior cingulate(rACC) theta EEG in depression: Implications for treatment outcome?European Neuropsychopharmacology, 25, 1190–1200. doi: 10.1016/j.euroneuro.2015.03.007
Asada, H., Fukuda, Y., Tsunoda, S., Yamaguchi, M., & Tonoike, M.(1999). Frontal midline theta rhythms reflect alternative activation ofprefrontal cortex and anterior cingulate cortex in humans. NeuroscienceLetters, 274, 29–32. doi: 10.1016/S0304-3940(99)00679-5
Beauducel, A., Debener. S., Brocke, B., & Kayser, J. (2000). On the reliabili-ty of augmenting/reducing: peak amplitudes and principal componentsanalysis of auditory evoked potentials. Journal of Psychophysiology, 14,226–240.
Beauducel, A., & Debener, S. (2003). Misallocation of variance in event-related potentials: Simulation studies on the effects of test power,topography, and baseline-to-peak versus principal component quantifi-cations. Journal of Neuroscience Methods, 124, 103–112. doi: 10.1016/S0165-0270(02)00381-3
Bollimunta, A., Chen, Y., Schroeder, C. E., & Ding, M. (2008). Neuronalmechanisms of cortical alpha oscillations in awake-behaving macaques.Journal Neuroscience. 28(40), 9976–9988. doi: 10.1523/JNEURO-SCI.2699-08.2008
Bruder, G. E., Sedoruk, J. P., Stewart, J. W., McGrath, P. J., Quitkin, F.M., & Tenke, C. E. (2008). Electroencephalographic alpha measurespredict therapeutic response to a selective serotonin reuptake inhibitorantidepressant: Pre- and post-treatment findings. Biological Psychiatry,63, 1171–1177. doi: 10.1016/j.biopsych.2007.10.009
Bruder, G .E., Stewart, J. W., Tenke, C. E., McGath, P. J., Leite, O.,Bhattacharya, N., & Quitkin, F. M. (2001). Electroencephalographic
and perceptual asymmetry differences between responders and nonres-ponders to an SSRI antidepressant. Biological Psychiatry, 48, 416–425.doi: 10.1016/S0006-3223(00)01016-7
Bruder, G. E., Tenke, C. E., & Kayser, J. (2013). Electrophysiological pre-dictors of clinical response to antidepressants. In J. J. Mann, P. J.McGrath, & S. P., Roose (Eds.), The Clinical Handbook for the Man-agement of Mood Disorders (pp. 380–393). Cambridge, UK: Cam-bridge University Press.
Bruder, G. E., Tenke, C. E., Warner, V., Nomura, Y., Grillon, C., Hille, J.,. . . Weissman, M. M. (2005) Electroencephalographic measures ofregional hemispheric activity in offspring at risk for depressive disor-ders. Biological Psychiatry, 57, 328–335. doi: 10.1016/j.biopsych.2004.11.015
Cannon, R. L., Baldwin, D. R., Shaw, T. L., Diloreto, D. J., Phillips, S. M.,Scruggs, A. M., & Riehl, T. C. (2012). Reliability of quantitative EEG(qEEG) measures and LORETA current source density at 30 days. Neu-roscience Letters, 518, 27–31. doi: 10.1016/j.neulet.2012.04.035
Cannon, R. L., Crane, M. K., Campbell, P. D., Dougherty, J. H., Jr.,Baldwin, D. R., Effler, J. D., . . . Di Loreto, D. J. (2011). A 9-year-oldboy with multifocal encephalomalacia: EEG LORETA and lifespandatabase, magnetic resonance imaging and neuropsychological agree-ment. Journal of Neurotherapy, 15, 3–17.
Chandler, G. M., Iosifescu, D. V., Pollack, M. H., Targum, S. D., & Fava,M. (2010). Validation of the Massachusetts General Hospital antide-pressant treatment history questionnaire (ATRQ). CNS Neuroscience &Therapeutics 16, 322–325. doi: 10.1111/j.1755-5949.2009.00102.x
Debener, S., Beauducel, A., Nessle, R. D., Brocke, B., Heilemann, H., &Kayser, J. (2000). Is resting anterior EEG alpha asymmetry a traitmarker for depression? Neuropsychobiology, 41, 31–37. doi: 10.1159/000026630
Delorme, A., & Makeig, S. (2004). EEGLAB: An open source toolbox foranalysis of single-trial EEG dynamics including independent compo-nent analysis. Journal of Neuroscience Methods, 134,:9–21. doi:10.1016/j.jneumeth.2003.10.009
Duffy, F. H., Hughes, J. R., Miranda, F., Bernad, P., & Cook, P. (1994).Status of quantitative EEG (QEEG) in clinical practice. Clinical Elec-troencephalography, 25, VI–XXII.
Feenstra, B. W., & Holsheimer, J. (1979). Dipole-like neuronal sources oftheta rhythm in dorsal hippocampus, dentate gyrus and cingulate cortexof the urethane-anesthetized rat. Electroencephalography & ClinicalNeurophysiology, 47, 532–538.
Feige, B., Scheffler, K., Esposito, F., Di Salle, F., Hennig, J., & Seifritz, E.(2005) Cortical and subcortical correlates of electroencephalographicalpha rhythm modulation. Journal of Neurophysiology, 93,:2864–2872.doi: 10.1152/jn.00721.2004
First, M. B., Spitzer, R. L., Gibbon, M., & Williams, J. B. W. (1996).Structured clinical interview for DSM-IV-TR Axis-I disorders—Nonpa-tient edition (SCID-NP). Biometrics Research Department, New YorkState Psychiatric Institute, New York, NY.
Reliability of EEG measures in EMBARC multisite study 47
Gallinat, J., Bottlender, R., Juckel, G., Munke Puchner, A., Stotz, G., Kuss,H. J., . . . Hegerl, U. (2000). The loudness dependency of the auditoryevoked N1/P2-component as a predictor of the acute SSRI response indepression. Psychopharmacology (Berlin), 148, 404–411.
Gamma, A., Lehmann, D., Frei, E., Iwata, K., Pascual-Marqui, R. D., &Vollenweider, F. X. (2004).Comparison of simultaneously recorded[H2(15)O]-PET and LORETA during cognitive and pharmacologicalactivation. Human Brain Mapping, 22, 83–96. doi: 10.1002/hbm.20015
Hagemann, D., Hewig, J., Seifert, J., Naumann, E., & Bartussek D. (2005).The latent state-trait structure of resting EEG asymmetry: Replicationand extension. Psychophysiology, 42, 740–752. doi: 10.1111/j.1469-8986.2005.00367.x
Hagemann, D., Naumann E., Thayer, J. F., & Bartussek, D. (2002). Doesresting EEG asymmetry reflect a trait? An application of latent state-trait theory. Journal of Personality and Social Psychology, 82, 619–641. doi. 10.1037/0022-3514.82.4.619
Hergerl, U., Gallinat, J., & Juckel, G. (2001). Event-related potentials: Dothey reflect central serotonergic neurotransmission and do they predictclinical response to serotoin agonists? Journal of Affective Disorders,62, 93–100.
Hegerl, U., Gallinat, J., & Mrowinski, D. (1994). Intensity dependence ofauditory evoked dipole source activity. International Journal of Psy-chophysiology, 171, 1–13.
Hegerl, U., & Juckel, G. (1993). Intensity dependence of auditory evokedpotentials as an indicator of central serotonergic neurotransmission: Anew hypothesis. Biological Psychiatry, 33, 173–187.
Hegerl, U., Wilk, K., Olbrich, S., Schoenknecht, P., & Sander, C. (2012).Hyperstable regulation of vigilance in patients with major depressivedisorder. World Journal of Biological Psychiatry, 13, 436–446. doi:10.3109/15622975.2011.579164
Heller, W., Etienne, M. A., & Miller, G. A. (1995). Patterns of perceptualasymmetry in depression and anxiety: Implications for neuropsycholog-ical models of emotion and psychopathology. Journal of Abnormal Psy-chology, 104, 327–333. doi. 10.1037/0021-843X.104.2.327
Heller, W., Nitschke, J. B., Etienne, M. A, & Miller, G. A. (1997). Patternsof regional brain activity differentiate types of anxiety. Journal ofAbnormal Psychology, 106, 376–385.
Hensch, T., Herold, U., Diers, K., Armbruster, D., & Brocke, B. (2008).Reliability of intensity dependence of auditory-evoked potentials. Clini-cal Neurophysiology, 119, 224–236. doi: 10.1016/j.clinph.2007.09.127
Holsheimer, J. (1982). Generation of theta activity (RSA) in the cingulatecortex of the rat. Experimental Brain Research, 47, 309–312.
Iramina, K., Ueno, S., & Matsuoka, S. (1996). MEG and EEG topographyof frontal midline theta rhythm and source localization. Brain Topogra-phy, 8, 329–331.
Jacobs, B. L., & Azmitia, E. C. (1992). Structure and function of the brainserotonin system. Physiology Review, 72, 165–229.
Juckel, G., Hegerl, U., Molnar, M., Csepe, V., & Karmos, G. (1999). Audi-tory evoked potentials reflect serotonergic neuronal activity—A studyin behaving cats administered drugs acting on 5-HT1A autoreceptors inthe dorsal raphe nucleus. Neuropsychopharmacology, 21, 710–716. doi:10.1016/S0893-133X(99)00074-3
Kayser, J. (2013a). Polygraphic recording data exchange—Polyrex (Ver-sion 2.3, Build 1.3). Retrieved from http://psychophysiology.cpmc.columbia.edu/Software/PolyRex. New York State Psychiatric Institute,Division of Cognitive Neuroscience.
Kayser, J. (2013b). Current source density (CSD) measures of auditoryintensity modulation and EEG at rest as predictors for serotonergic anti-depressant response. Biological Psychiatry, 73, 138S.
Kayser, J., & Tenke, C. E. (2003). Optimizing PCA methodology for ERPcomponent identification and measurement: Theoretical rationale andempirical evaluation. Clinical Neurophysiology, 114, 2307–2325. doi:10.1016/S1388-2457(03)00241-4
Kayser, J., & Tenke, C. E. (2005). Trusting in or breaking with convention:Towards a renaissance of principal components analysis in electrophys-iology. Clinical Neurophysiology, 116, 1747–1753. doi: 10.1016/j.clinph.2005.03.020
Kayser, J., & Tenke, C. E. (2006a). Principal components analysis of Lap-lacian waveforms as a generic method for identifying ERP generatorpatterns: I. Evaluation with auditory oddball tasks. Clinical Neurophysi-ology, 117, 348–368. doi: 10.1016/j.clinph.2005.08.034
Kayser, J., & Tenke, C. E. (2006b). Principal components analysis of Lap-lacian waveforms as a generic method for identifying ERP generatorpatterns: II. Adequacy of low-density estimates. Clinical Neurophysiol-ogy, 117, 369–380. doi: 10.1016/j.clinph.2005.08.033
Kayser J., & Tenke, C. E .(2006c). Consensus on PCA for ERP data, andsensibility of unrestricted solutions. Clinical Neurophysiology, 117,703–707. doi: 10.1016/j.clinph.2005.11.015
Kayser, J., & Tenke, C. E. (2006d). Electrical distance as a reference-freemeasure for identifying artifacts in multichannel electroencephalogram(EEG) recordings. Psychophysiology, 43, S51.
Kayser, J., & Tenke, C. E. (2010). In search of the Rosetta Stone for scalpEEG: Converging on reference-free techniques. Clinical Neurophysiol-ogy, 121, 1973–1975. doi: 10.1016/j.clinph.2010.04.030
Kayser, J., & Tenke, C. E. (2015a). Issues and considerations for using thescalp surface Laplacian in EEG/ERP research: A tutorial review. Inter-national Journal of Psychophysiology, 97(3), 189–209. doi: 10.1016/j.ijpsycho.2015.04.012
Kayser, J., & Tenke, C. E. (2015b). Hemifield-dependent N1 and event-related theta/delta oscillations: An unbiased comparison of surfaceLaplacian and common EEG reference choices. International Journalof Psychophysiology, 97(3), 258–270. doi: 10.1016/j.ijpsycho.2014.12.011
Kayser, J., Tenke, C. E., & Bruder, G. E. (1998). Dissociation of brainERP topographies for tonal and phonetic oddball tasks. Psychophysiol-ogy, 35, 576–590. doi: 10.1017/S0048577298970214
Kayser, J., Tenke, C. E., Kroppmann, C. J., Alschuler, D. M., Fekri, S.,Gil, R., . . . Bruder, G. E. (2012). A neurophysiological deficit in earlyvisual processing in schizophrenia patients with auditory hallucinations.Psychophysiology, 49, 1168–1178. doi: 10.1111/j.1469-8986.2012.01404.x
Kayser, J., Tenke, C., Nordby, H., Hammerborg, D., Hugdahl, K., &Erdmann, G. (1997). Event-related potential (ERP) asymmetries toemotional stimuli in a visual half-field paradigm. Psychophysiology,34, 414–426. doi: 10.1023/A:1022261226370
Korb, A. S., Hunter, A, M., Cook, I. A., & Leuchter, A. F. (2009). Rostralanterior cingulate cortex theta current density and response to antide-pressants and placebo in major depression. Clinical Neurophysiology,120, 1313–1319. doi: 10.1016/j.clinph.2009.05.008
Lee, T. W., Yu, Y. W, & Chen, T. J. (2005). Loudness dependence of theauditory evoked potential and response to antidepressants in Chinesepatients with major depression. Journal of Psychiatric Neuroscience,30, 202–205.
Leuchter, A. F., Cook, I. A., Marangell, L. B., Gilmer, W. S., Burgoyne, K.S, Howland, R. H., Greenwald, S. (2009). Comparative effectiveness ofbiomarkers and clinical indicators for predicting outcomes of SSRItreatment in major depressive disorder: Results of the BRITE-MDstudy. Psychiatry Research, 169, 124–131. doi: 10.1016/j.psychres.2009.06.004
Linka, T., M€uller, B. W, Bender, S., & Sartory, G. (2004). The intensitydependence of the auditory evoked N1 component as a predictor ofresponse to Citalopram treatment in patients with major depression.Neuroscience Letters, 367(3), 375–378. doi: 10.1016/j.neulet.2004.06.038
Linka, T., M€uller, B. W., Bender, S., Sartory, G., & Gastpar, M. (2005).The intensity dependence of auditory evoked ERP components predictsresponsiveness to reboxetine treatment in major depression. Pharma-copsychiatry, 38, 139–143. doi: 10.1055/s-2005-864126
Linka, T., Sartory, G., Wiltfang, J., & M€uller, B. W. (2009). Treatmenteffects of serotonergic and noradrenergic antidepressants on the intensi-ty dependence of auditory ERP components in major depression. Neu-roscience Letters, 463, 26–30. doi: 10.1016/j.neulet.2009.07.038
Manjarrez, G., Hernandez, E., Robles, A., & Hernandez, J. (2005). N1/P2component of auditory evoked potential reflect changes of the brainserotonin biosynthesis in rats. Nutritional Neuroscience, 8, 213–218.doi: 10.1080/10284150500170971
McEvoy, L. K., Smith, M. E., & Gevins, A. (2000). Test-retest reliabilityof cognitive EEG. Clinical Neurophysiology, 111, 457–463. doi:10.1016/S1388-2457(99)00258-8
Mitzdorf, U. (1985). Current source-density method and application in catcerebral cortex: Investigation of evoked potentials and EEG phenome-na. Physiology Review, 65, 37–100.
M€ocks, J. (1986). The influence of latency jitter in principal componentanalysis of event related potentials. Psychophysiology, 23, 480–484.
Mulert, C., Jager, L., Propp, S., Karch, S., Stormann, S., Pogarell, O., . . .Hegerl, U. (2005). Sound level dependence of the primary auditory cor-tex: Simultaneous measurement with 61-channel EEG and fMRI. Neu-roImage, 28, 49–58. doi: 10.1016/j.neuroimage.2005.05.041
Mulert, C., Jager, L., Schmitt, R., Bussfeld, P., Pogarell, O., Moller, H. J.,. . . Hegerl, U. (2004). Integration of fMRI and simultaneous EEG:
48 C.E. Tenke et al.
Towards a comprehensive understanding of localization and time-course of brain activity in target detection. NeuroImage, 22, 83–94. doi:10.1016/j.neuroimage.2003.10.051
Mulert, C., Juckel, G., Augustin, H., & Hegerl, U. (2002). Comparisonbetween the analysis of the loudness dependency of the auditory N1/P2component with LORETA and dipole source analysis in the predictionof treatment response to the selective serotonin reuptake inhibitor cita-lopram in major depression. Clinical Neurophysiology, 113, 1566–1572. doi: 10.1016/S1388-2457(02)00252-3
Mulert, C., Juckel, G., Brunnmeier, M., Karch, S., Leicht, G., Mergl, R.,. . . Pogarell, O. (2007). Rostral anterior cingulate cortex activity in thetheta band predicts response to antidepressive medication. ClinicalEEG and Neuroscience, 38, 78–81.
N€apflin, M., Wildi, M., & Sarnthein, J. (2007). Test-retest reliability ofresting EEG spectra validates a statistical signature of persons.Clinical Neurophysiology, 118, 2519–2524. doi: 10.1016/j.clinph.2007.07.022
Nicholson, C. (1973). Theoretical analysis of field potentials in anisotropicensembles of neuronal elements. IEEE Transactions on BiomedicalEngineering, 20, 278–288. doi: 10.1109/TBME.1973.324192
Nunez, P. L. (1981). Electric fields of the brain: The neurophysics of EEG.New York, NY: Oxford University Press.
Nunez, P. L., & Srinivasan, R. (2006). Electric fields of the brain: Theneurophysics of EEG (2nd ed.). New York, NY: Oxford UniversityPress.
Olbrich, S., Sander, C., Minkwitz, J., Chittka, T., Mergl, R., Hegerl, U., &Himmerich, H. (2012). EEG vigilance regulation patterns and their dis-criminative power to separate patients with major depression fromhealthy controls. Neuropsychobiology, 65, 188–194. doi: 10.1159/000337000
Oldfield, R. C. (1971). The assessment and analysis of handedness: TheEdinburgh inventory. Neuropsychologia, 9, 97–113.
O’Neill, B. V., Croft, R. J., & Nathan, P. J. (2008). The loudness depen-dence of the auditory evoked potential (LDAEP) as an in vivo biomark-er of central serotonergic function in humans: Rationale, evaluation andreview of findings. Human Psychopharmacology, 23, 355–370. doi:10.1002/hup.940
Paige, S. R., Fitzpatrick, D. F., Kline, J. P., Balogh, S. E., & Hendricks, S.E. (1994). Event-related potential amplitude/intensity slopes predictresponse to antidepressants. Neuropsychobiology, 30, 197–201.
Pascual-Marqui, R. D. (2002). Standardized low-resolution brainelectromagnetic tomography (sLORETA): Technical details. Methodsand Findings in Experimental Clinical Pharmacology, 24(Suppl D),5–12.
Pascual-Marqui, R. D. (2007). Discrete, 3D distributed, linear imagingmethods of electric neuronal activity. Part 1: Exact, zero error localiza-tion. Retrieved from http://arxiv.org/abs/0710.3341
Pascual-Marqui, R. D., Lehmann, D., Koenig, T., Kochi, K., Merlo, M. C.,Hell, D., & Koukkou, M. (1999). Low resolution brain electromagnetictomography (LORETA) functional imaging in acute, neuroleptic-naive,first-episode, productive schizophrenia. Psychiatric Research Neuroim-aging, 90, 169–179.
Pascual-Marqui, R. D., Michel, C. M., & Lehmann, D. (1994). Low resolu-tion electromagnetic tomography: A new method for localizing electri-cal activity in the brain. International Journal of Psychophysiology, 18,49–65. doi: 10.1016/0167-8760(84)90014-X
Perrin, F., Pernier, J., Bertrand, O., & Echallier, J. F. (1989). Sphericalsplines for scalp potential and current density mapping. Electroenceph-alography & Clinical Neurophysiology, 72, 184–187.
Pivik, R. T., Broughton, R. J., Coppola, R., Davidson, R. J., Fox, N., &Nuwer, M. R. (1993). Guidelines for the recording and quantitativeanalysis of electroencephalographic activity in research contexts.Psychophysiology, 30, 547–558. doi: 10.1111/j.1469-8986.1993.tb02081.x
Pizzagalli, D. A. (2011). Frontocingulate dysfunction in depression:Toward biomarkers of treatment response. Neuropsychopharmacology,36, 183–206. doi: 10.1038/npp.2010.166
Pizzagalli, D. A., Oakes, T. R., Fox, A. S., Chung, M. K., Larson, C. L.,Abercrombie, H. C., . . . & Davidson, R. J. (2004). Functional but notstructural subgenual prefrontal cortex abnormalities in melancholia.Molecular Psychiatry, 9, 393–405. doi: 10.1038/sj.mp.4001469
Pizzagalli, D. A., Oakes, T. R., & Davidson, R. J. (2003). Coupling of thetaactivity and glucose metabolism in the human rostral anterior cingulatecortex: An EEG/PET study of normal and depressed subjects. Psycho-physiology, 40, 939–949. doi: 10.1111/1469-8986.00112
Pizzagalli, D., Pascual-Marqui, R. D., Nitschke, J. B., Oakes, T. R.,Larson, C .L., Abercrombie, H. C., . . . Davidson, R. J. (2001). Anteriorcingulate activity as a predictor of degree of treatment response inmajor depression: Evidence from brain electrical tomography analysis.American Journal of Psychiatry, 158, 405–415. doi: 10.1176/appi.ajp.158.3.405
Pollock, V. E., & Schneider, L. S. (1989). Topographic electroencephalo-graphic alpha in recovered depressed elderly. Journal of Abnormal Psy-chology, 98, 268–273.
Prichep, L. S., Mas, F., Hollander, E., Liebowitz, M., John, E. R., Almas,M., . . . Levine, R. H. (1993). Quantitative electroencephalographic sub-typing of obsessive-compulsive disorder. Psychiatry Research, 50,25–32.
Rentzsch, J., Adli, M., Wiethoff, K., de Castro, A. G. C., & Gallinat, J.(2014). Pretreatment anterior cingulate activity predicts antidepressanttreatment response in major depressive episodes. European Archives ofPsychiatry and Clinical Neuroscience 264, 213–223. doi: 10.1007/s00406-013-0424-1
Rush, A. J., Trivedi, M. H., Ibrahim, H. M, Carmody, T. J., Arnow, B.,Klein, D. N., . . . Keller, M. B. (2003). The 16-item quick inventory ofdepressive symptomatology (QIDS) clinician rating (QIDS-C) and self-report (QIDS-SR): A psychometric evaluation in patients with chronicmajor depression. Biological Psychiatry, 54, 573–583. doi: 10.1016/S0006-3223(02)01866-8
Salinsky, M. C., Oken, B. S. & Morehead, L. (1991). Test-retest reliabilityin EEG frequency analysis. Electroencephalography & Clinical Neuro-physiology, 79, 382–392.
Semba, K., & Komisaruk, B. R. (1984). Neural substrates of two differentrhythmical vibrissal movements in the rat. Neuroscience, 12, 761–74.doi: 10.1016/0306-4522(84)90168-4
Smit, D. J., Posthuma, D., Boomsma, D. I., & Geus, E. J. (2005). Heritabil-ity of background EEG across the power spectrum. Psychophysiology,42,:691–697. doi: 10.1111/j.1469-8986.2005.00352.x
Stewart, J. L., Coan, J. A., Towers, D. N., & Allen, J. J. (2014). Restingand task-elicited prefrontal EEG alpha asymmetry in depression: Sup-port for the capability model. Psychophysiology, 51, 446–455. doi:10.1111/psyp.12191
Tenke, C. E., & Kayser, J. (2001). A convenient method for detecting elec-trolyte bridges in multichannel electroencephalogram and event-relatedpotential recordings. Clinical Neurophysiology, 112, 545–550. doi:10.1016/S1388-2457(00)00553-8
Tenke, C. E., & Kayser, J. (2005). Reference-free quantification of EEGspectra: Combining current source density (CSD) and frequency princi-pal components analysis (fPCA). Clinical Neurophysiology, 116, 2826–2846. doi: 10.1016/j.clinph.2005.08.007
Tenke, C. E., & Kayser, J. (2012). Generator localization by current sourcedensity (CSD): Implications of volume conduction and field closure atintracranial and scalp resolutions. Clinical Neurophysiology, 123,2328–2345. doi: 10.1016/j.clinph.2012.06.005
Tenke, C. E. & Kayser, J. (2015). Surface Laplacians (SL) and phase prop-erties of EEG rhythms: Simulated generators in a volume-conductionmodel. International Journal of Psychophysiology, 97, 285–298. doi:10.1016/j.ijpsycho.2015.05.008
Tenke, C. E., Kayser, J., Abraham, K., Alvarenga, J. E., & Bruder, G. E.(2015). Posterior EEG alpha at rest and during task performance: Com-parison of current source density and field potential measures. Interna-tional Journal of Psychophysiology, 97, 299–309.
Tenke, C. E., Kayser, J., Manna, C. G., Fekri, S., Kroppmann, C. J.,Schaller, J. D., . . . Bruder, G. E. (2011). Current source density mea-sures of EEG alpha predict antidepressant treatment response. Biologi-cal Psychiatry,70, 388–394. doi: 10.1016/j.biopsych.2011.02.016
Tenke, C .E., Kayser, J., Stewart, J. W., & Bruder, G. E. (2010). NoveltyP3 reductions in depression: Characterization using principal compo-nents analysis (PCA) of current source density (CSD) waveforms.Psychophysiology, 47, 133–146. doi: 10.1111/j.1469-8986.2009.00880.x
Tomarken, A. J., Davidson, R. J., Wheeler, R. E., & Kinney, L. (1992).Psychometric properties of resting anterior EEG asymmetry: Temporalstability and internal consistency. Psychophysiology, 29, 576–592. doi:10.1111/j.1469-8986.1992.tb02034.x
Trivedi, M. H., McGrath, P. J., Fava, M., Parsey, R. V., Kurian, B. T.,Phillips, M. L., . . . Weissman, M. M. (2016). Establishing moderatorsand biosignatures of antidepressant response in clinical care(EMBARC): Rationale and design. Journal of Psychiatric Research,78, 11–23. doi: 10.1016/j.jpsychires.2016.03.001
Reliability of EEG measures in EMBARC multisite study 49

Ulrich, G., Renfordt, E., & Frick, K. (1986). The topographical distributionof alpha-activity in the resting EEG of endogenous-depressive inpa-tients with and without clinical-response to pharmacotherapy. Pharma-copsychiatry, 19, 272–273.
Vanderwolf, C. H. (1969). Hippocampal electrical activity and voluntarymovement in the rat. Electroencephalography & Clinical Neurophysi-ology, 26, 407–418.
Vaughan, H. G., Jr., & Ritter, W. (1970). The sources of auditory evokedresponses recorded from the human scalp. Electroencephalography &Clinical Neurophysiology, 28, 360–367.
Vitacco, D., Brandeis, D., Pascual-Marqui, R., & Martin, E. (2002). Corre-spondence of event-related potential tomography and functional mag-netic resonance imaging during language processing. Human BrainMapping 17,4–12. doi: 10.1002/hbm.10038
Worrell, G. A., Lagerlund, T. D., Sharbrough, F. W., Brinkmann, B. H.,Busacker, N. E., Cicora, K. M., & O’Brien, T. J. (2000). Localizationof the epileptic focus by low-resolution electromagnetic tomography inpatients with a lesion demonstrated by MRI. Brain Topography, 12,273–282.
Zumsteg, D., Friedman, A., Wieser, H. G., & Wennberg, R. A. (2006).Propagation of interictal discharges in temporal lobe epilepsy: Correla-tion of spatiotemporal mapping with intracranial foramen ovale
electrode recordings. Clinical Neurophysiology, 117, 2615–2626. doi:10.1016/j.clinph.2006.07.319
Zumsteg, D., Wennberg, R. A., Treyer, V., Buck, A., & Wieser, H. G.(2005). H215O or 13NH3 PET and electromagnetic tomography (LOR-ETA) during partial status epilepticus. Neurology, 65, 1657–1660. doi:10.1212/01.wnl.0000184516.32369.1a
(RECEIVED March 28, 2016; ACCEPTED August 16, 2016)
Supporting Information
Additional Supporting Information may be found in the online
version of this article:
Figure S1: Grand mean CSD amplitude spectra for the alpha
band across 19 posterior electrodes for all participants and
recordings, separated by testing site.
Figure S2: CSD-fPCA of prefiltered CSD amplitude spectra.
Table S1: Test-retest correlations of overall alpha at parietal
and frontal electrodes.
50 C.E. Tenke et al.