demonstrated reserve base of coal by state and rank, 1997 (million short tons)...
TRANSCRIPT


Demonstrated Reserve Base of Coal by State and Rank, 1997 (Million Short Tons)
State Anthracite Bituminous Subbituminous LigniteAlabama 3464 - 1083Alaska - 698 5414 14Arizona - 161 - -Arkansas 104 288 - 25.4Colorado 25.5 8,711 3,830 4,190Georgia - 3.6 - -Idaho - 4.4 - -Illinois - 105069 - -Indiana - 9916 - -Iowa - 2190 - -Kansas - 975 - -Kentucky - 32041 - -Louisana - - - 463Maryland - 717 - -Michigan - 128 - -Missouri - 5994 - -Montana - 1385 102531 15760New Mexico 2.3 3,706 8,804 -North Carolina - 10.7 - -North Dakota - - - 9395Ohio - 23664 - -Oklahoma - 1575 - -Oregon - - 17.5 -Pennsylvania 7220 21427 - -South Dakota - - - 366Tennessee - 816 - -Texas - - - 12931Utah - 5850 1.1 -Virginia 125.5 2077 - -Washington - 304 1078 8.1West Virginia - 35397 - -Wyoming - 4343 63472 -U.S. Total 7,477.30 270,914.70 185,147.60 44,235.50
Sources: EIA Coal Reserves Data Base Program, State geological and mineral resource surveys, and other geological reports.

U.S. COAL RESERVES
RECOVERABLE - 10% U.S.G.S - 50% DOE
“UNRECOVERABLE” - TECHNOLOGICALLY - ECONOMICALLY - (EXTRACTION, RECLAMATION COSTS)

SUPPLIES OF COAL
UNITED STATES - 3 TRILLION TONS (50% IN WYOMING, MONTANA, NORTH DAKOTA)
WESTERN COAL - 60% LOW SULFUR (0.7%S) - AT STRIP MINING DEPTH - >1000 MILES FROM DEMAND CENTERS - $5- $7/TON

World Coal Reserves, 1995
From Shepherd and Shepherd, 1998


Coal Deposits and Production for the World in Million Tons of Coal (1980-2004)
CountryTotal Resources Reserves Cumulative Production
Australia660795 86531 6,187
Canada355767 7251 1764
China1583753 126215 30969
Germany271807 7428 3739
India89228 101903 6922
Poland153910 15432 5227
South Africa79295 53738 5741
Former Soviet Union5352435 250505 15816
United Kingdom209252 243 2006
United States2830403 270718 24679
Other Countries 252384 207163 21,970
Total World11839029 1000912 125020
*Data is reported in million short tons (2000lb = 1 ton)

AVAILABLE COAL ENERGY
3 TRILLION TONS X 50% RECOVERABLE X 2000 LB/TON X 10,000 BTU/LB = 3 X 10¹⁹ BTU
- 1980 U.S. CONSUMPTION = 80X1015 BTU (TOTAL) - 375 YEAR SUPPLY
AT PRESENT COAL CONSUMPTION RATES (20 X 1015 BTU/YEAR) - 1500 YEAR SUPPLY

Surface
Underground
Lignite Anthracite
Subbi-tuminous Bituminous
Gulf Coast
unk
> < Western
Appalachian
Interior(midwest)


Distribution of Coal Producers' Output By Company Type In The U.S.
Industry Number of Companies Coal Production 106 tons 106 tons/ Company Percent
Coal 12 17231 1436 17.3
Oil and Gas 14 31175 2227 31.3
Utility 10 14442 1444 14.5
Steel 2 3386 1693 3.4
Other 11 33266 3024 33.4
Total 49 996
-
100


Atomic H/C Ratios
From Wiser, 2000
Arrow in direction of…
•Solid-liquid-gas
•Ease of transport
•Less solids pollution
•Less air contamination

COAL RANK
1. ANTHRACITE -14,000 BTU/LB
2. BITUMINOUS -12,000 BTU/LB
3. SUB-BITUMINOUS -9,000 BTU/LB
4. LIGNITE (30% WATER) - 7,000 BTU/LB
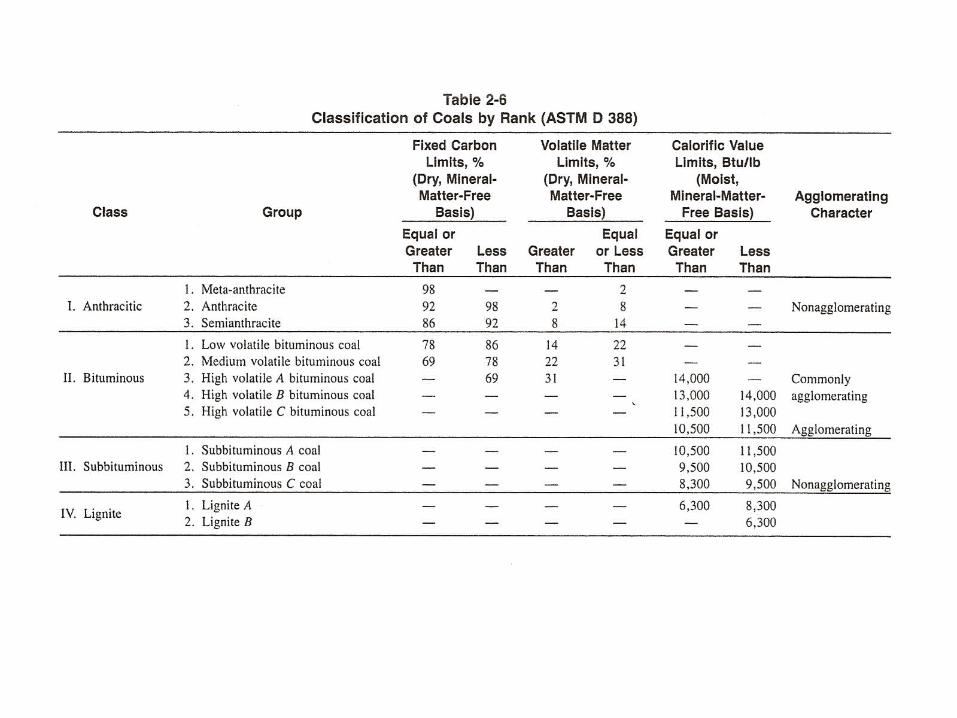


TABLE 4Representative Composition of Western Lignite
(As Received)
Proximate Analysis Ultimate analysisFixed carbon 27.2% Carbon 44.9 %Ash 11.7% Hydrogen 3.4%Water 25.4% Oxygen 13.2%Volatiles 34.5% Nitrogen 0.2%Sulfur 1.2% Sulfur 1.2%
Heating value 7500 Btu/lb Ash 11.7%
Water 25.4%


Coal Summary…..
• The good news….– High energy content– We have a lot of it
• The bad news….– Solids, air pollution issues– Mine safety– Not easy to transport

EXTRACTION
TRANSPORTATION
PREPARATION
CONVERSION - GASIFICATION- LIQUEFACTION- COMBUSTION
POLLUTION CONTROL - PARTICULATES- SO2
- H2S- NOX