demographics is destiny (isn’t it) “socioeconomic factors structure a state government’s...
TRANSCRIPT
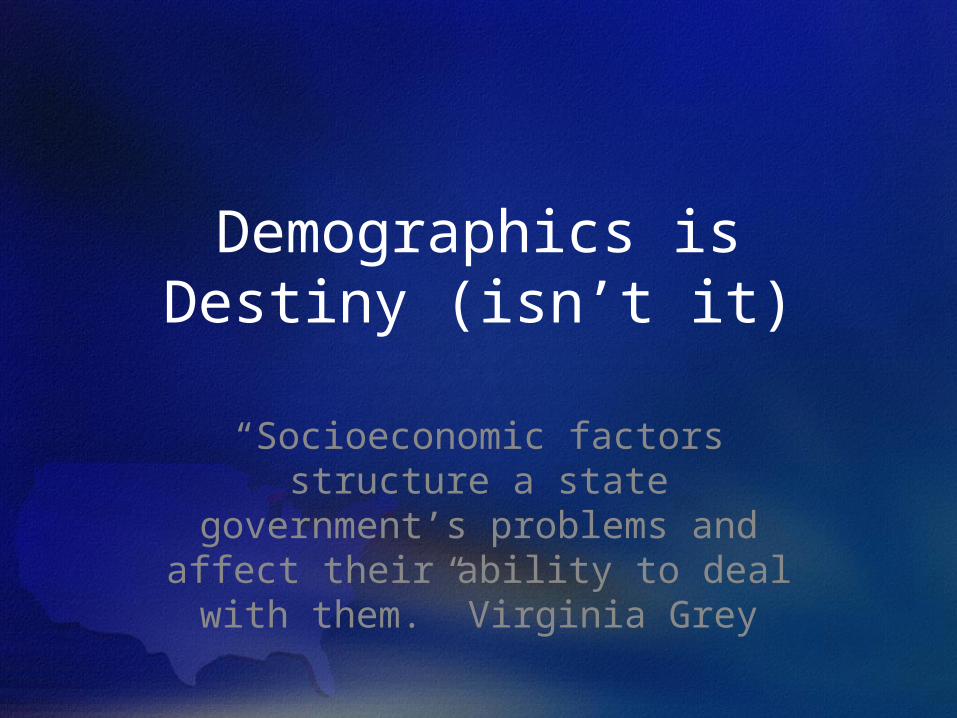
Demographics is Destiny (isn’t it)
“Socioeconomic factors structure a state government’s problems and affect their ability to deal with them.” Virginia Grey
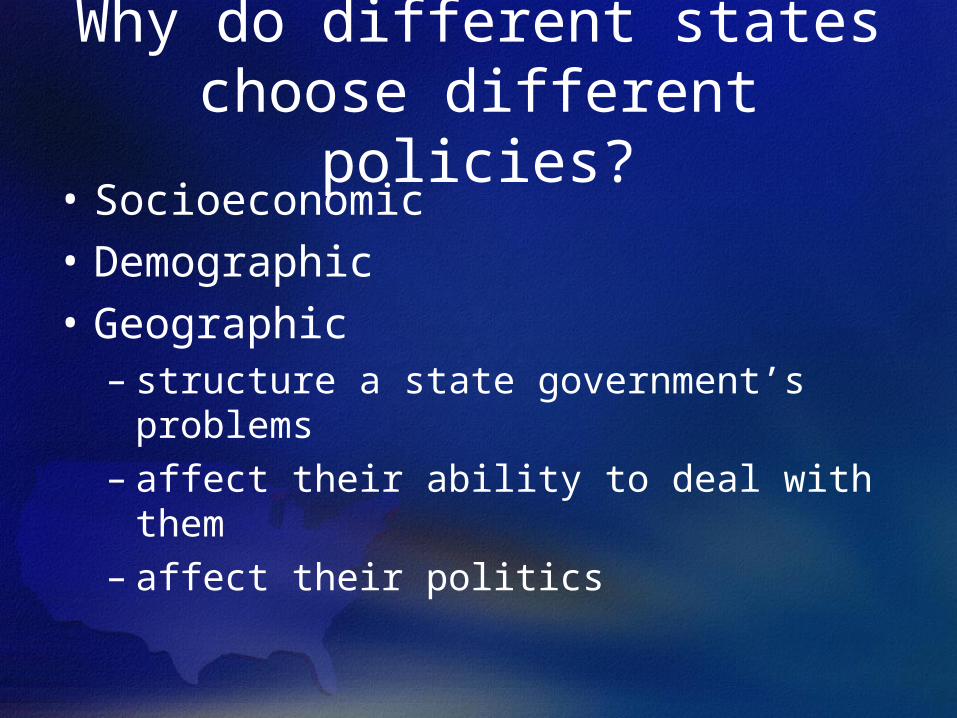
Why do different states choose different policies?
• Socioeconomic• Demographic• Geographic
– structure a state government’s problems
– affect their ability to deal with them– affect their politics
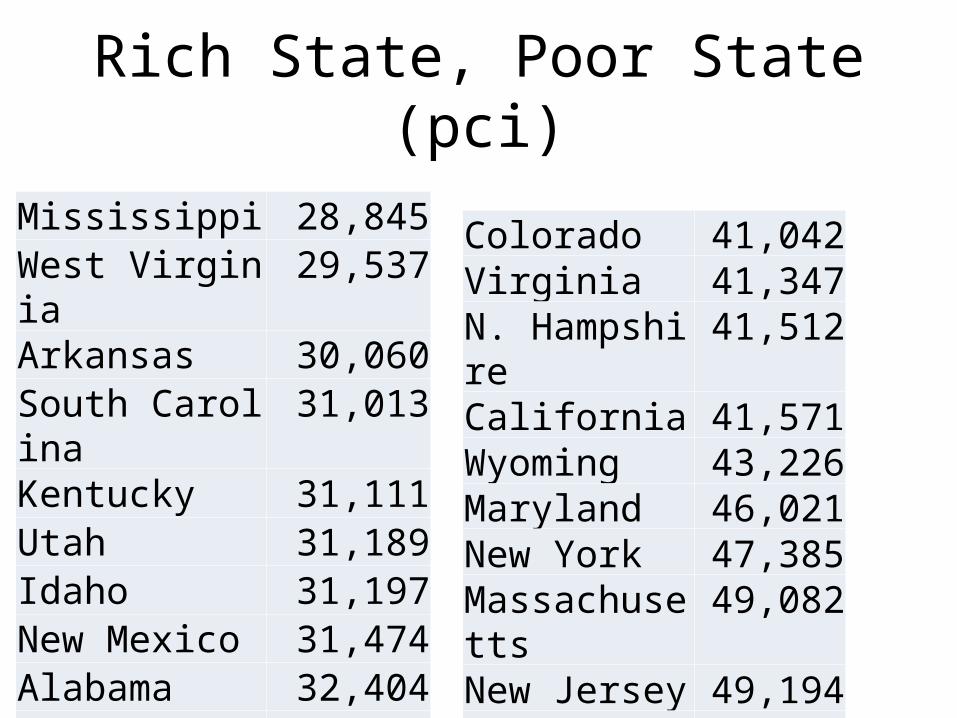
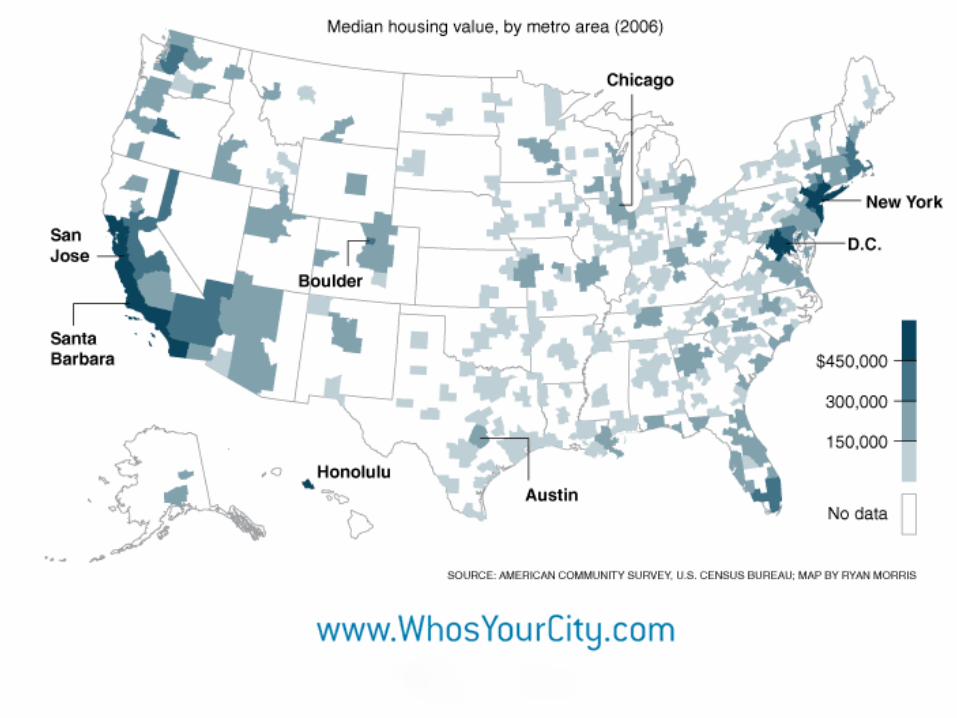
Rich State, Poor State (pci)
Mississippi 28,845West Virginia 29,537Arkansas 30,060South Carolina 31,013
Kentucky 31,111Utah 31,189Idaho 31,197New Mexico 31,474Alabama 32,404Montana 32,458
Colorado 41,042Virginia 41,347N. Hampshire 41,512
California 41,571Wyoming 43,226Maryland 46,021New York 47,385Massachusetts 49,082New Jersey 49,194Connecticut 54,117
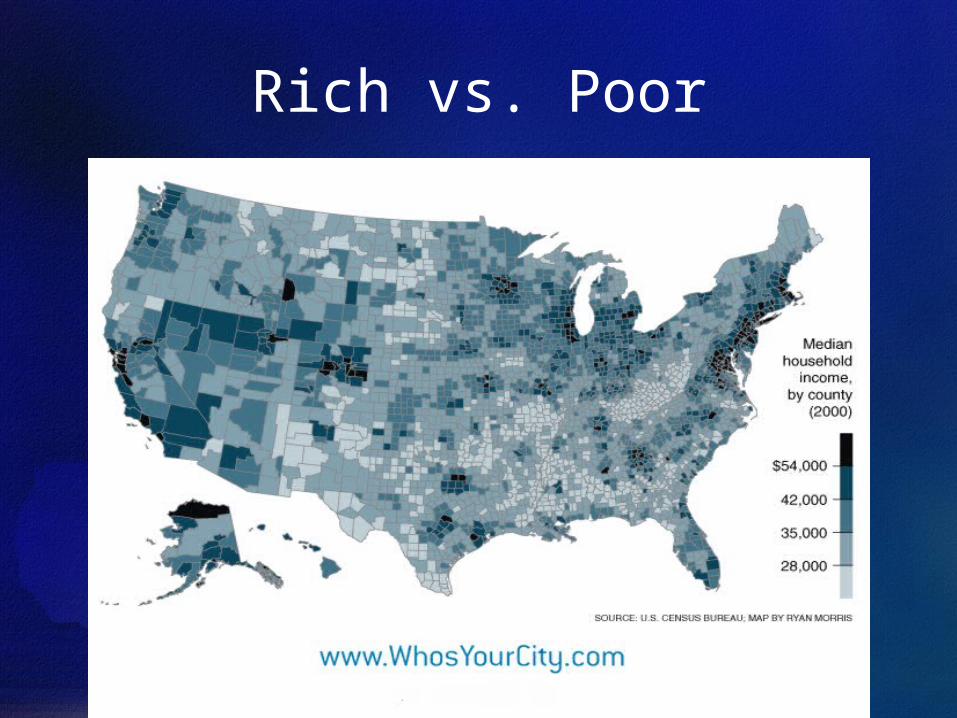
Rich vs. Poor

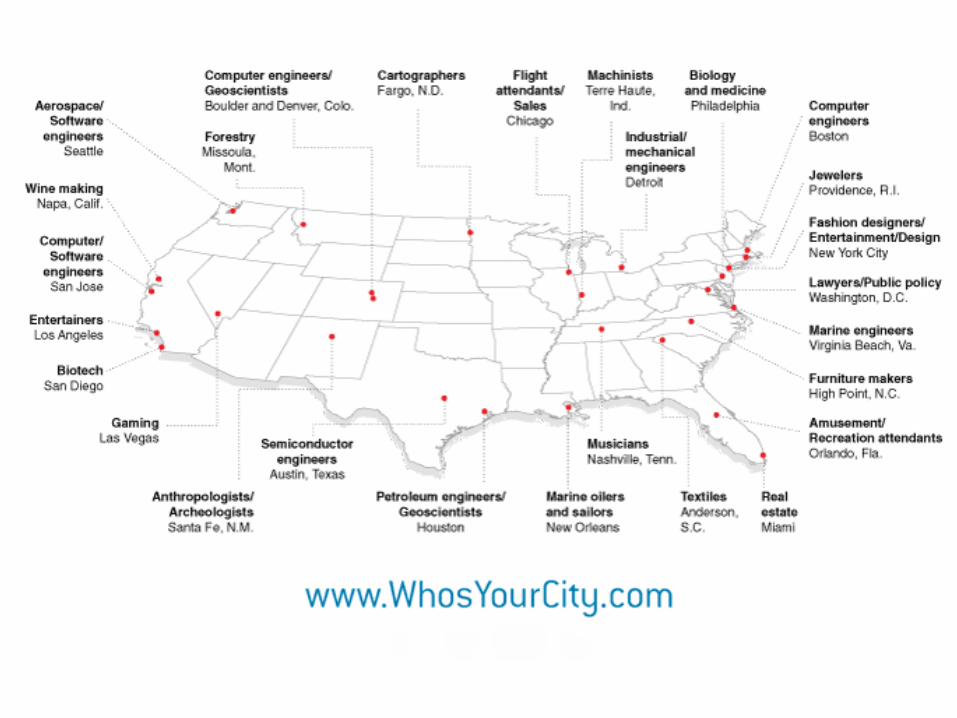
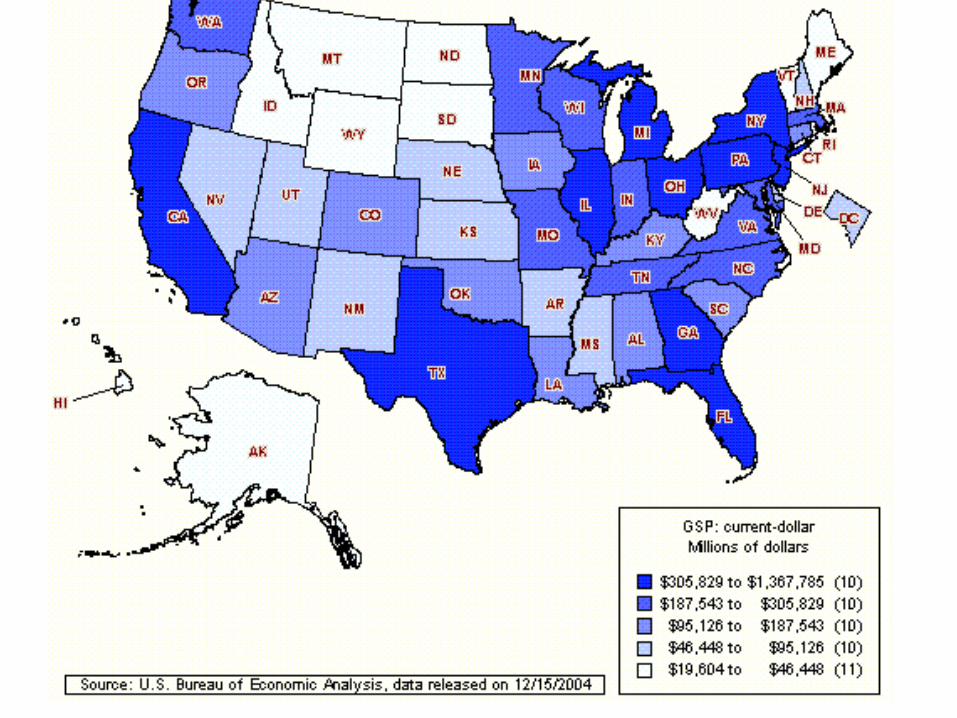
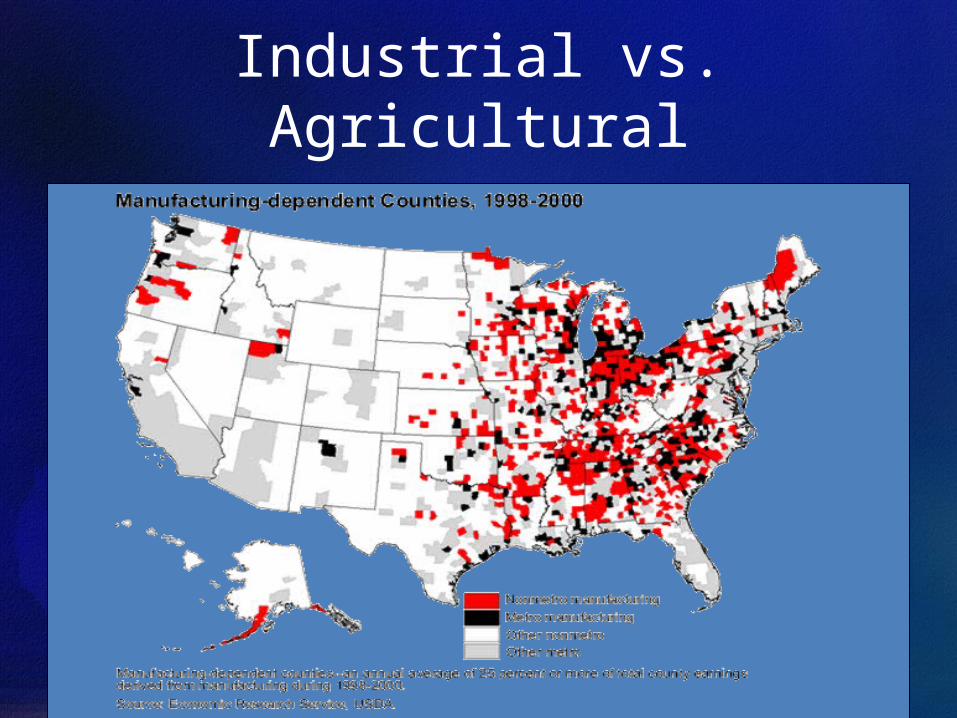
Industrial vs. Agricultural
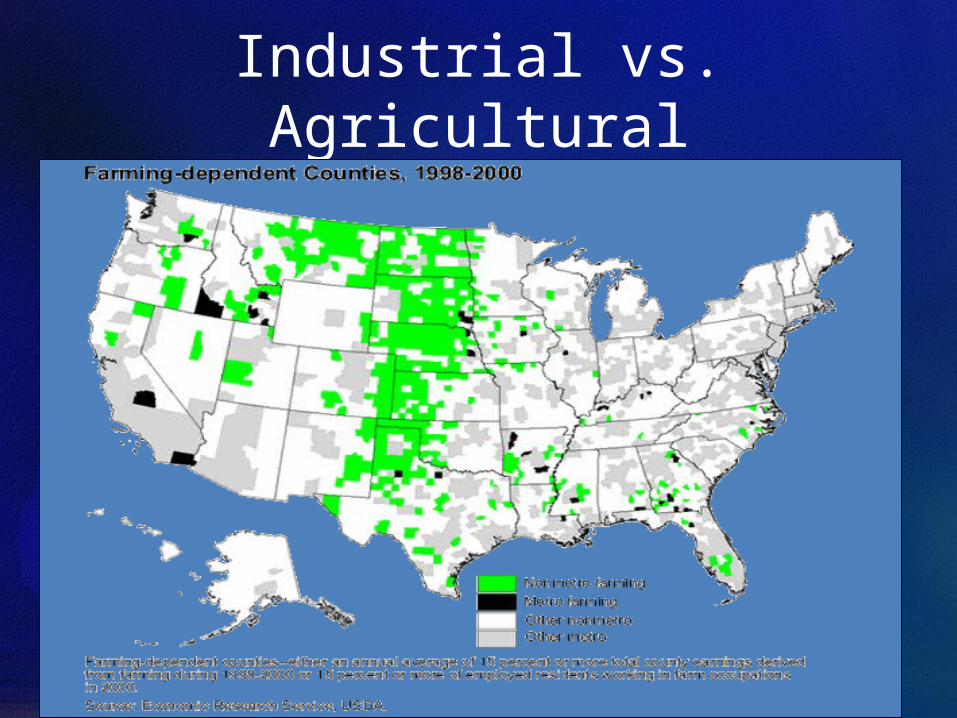
Industrial vs. Agricultural

Growing or Shrinking?
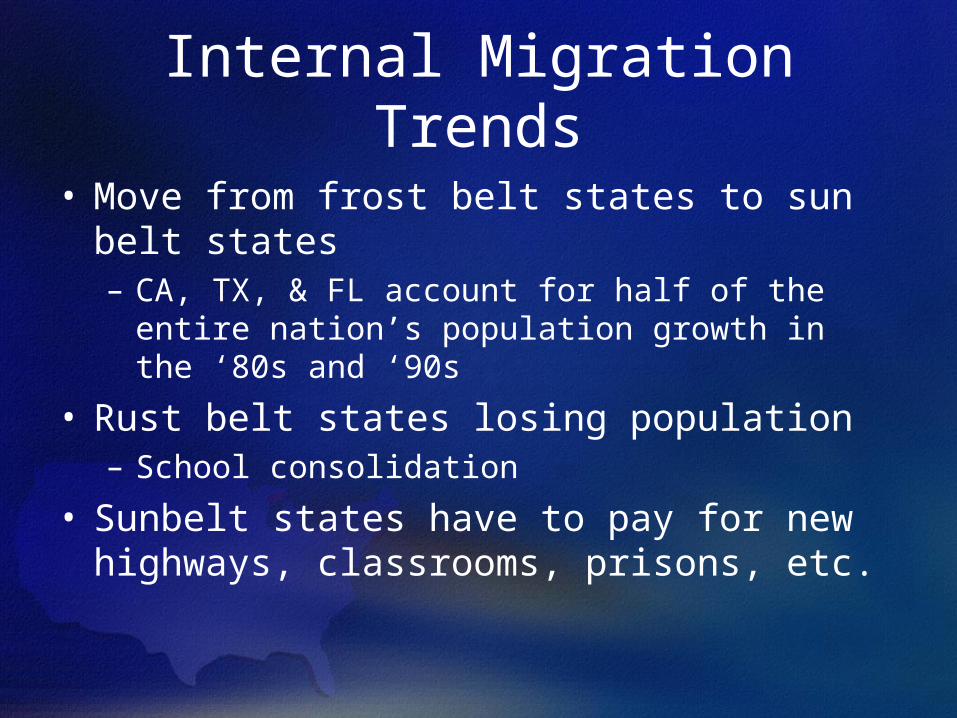
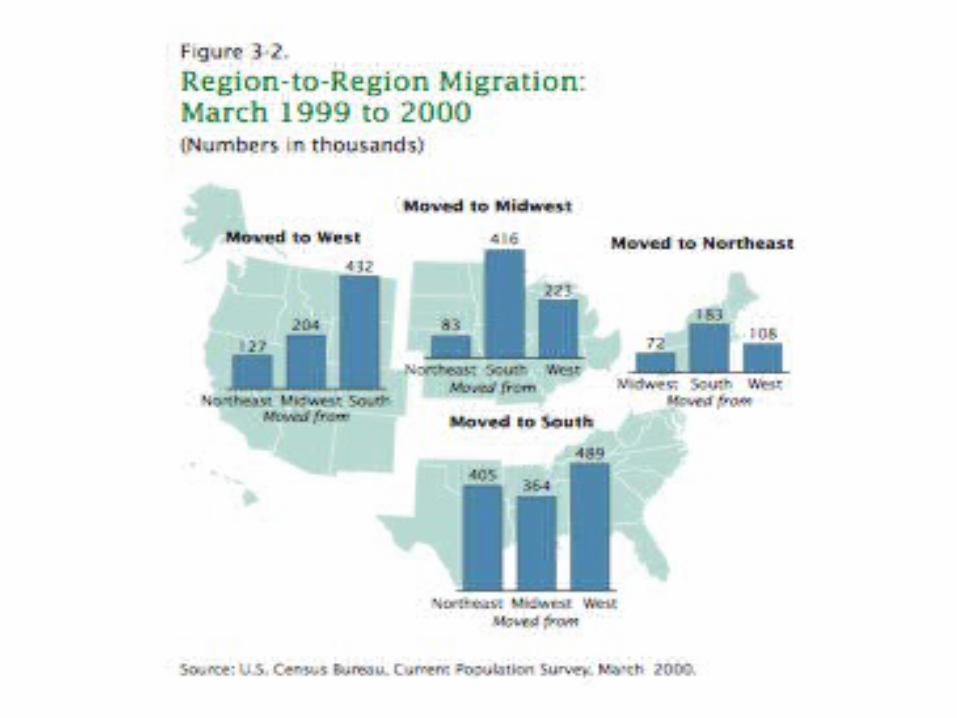
Internal Migration Trends
• Move from frost belt states to sun belt states– CA, TX, & FL account for half of the entire
nation’s population growth in the ‘80s and ‘90s
• Rust belt states losing population – School consolidation
• Sunbelt states have to pay for new highways, classrooms, prisons, etc.


Internal Migration Trends
• Flight from central cities to suburbs– White flight– Population density
• Coastal states densely populated• Rural urbanized splits within states like IL
– 64% live in Chicago area versus downstate
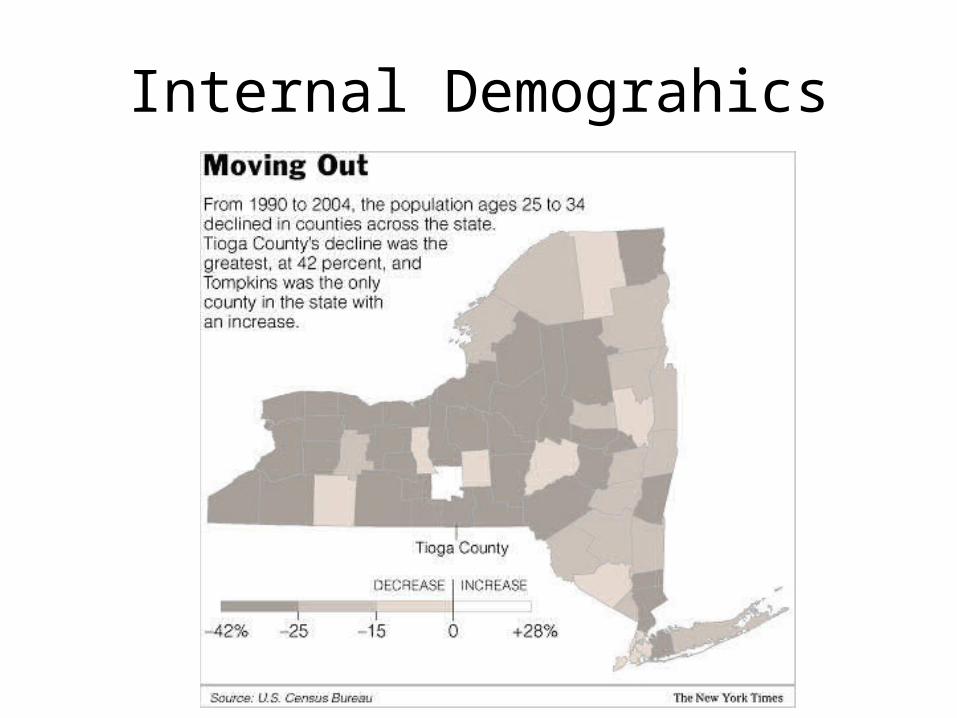
Internal Demograhics

Urban vs. Rural
Urbanization
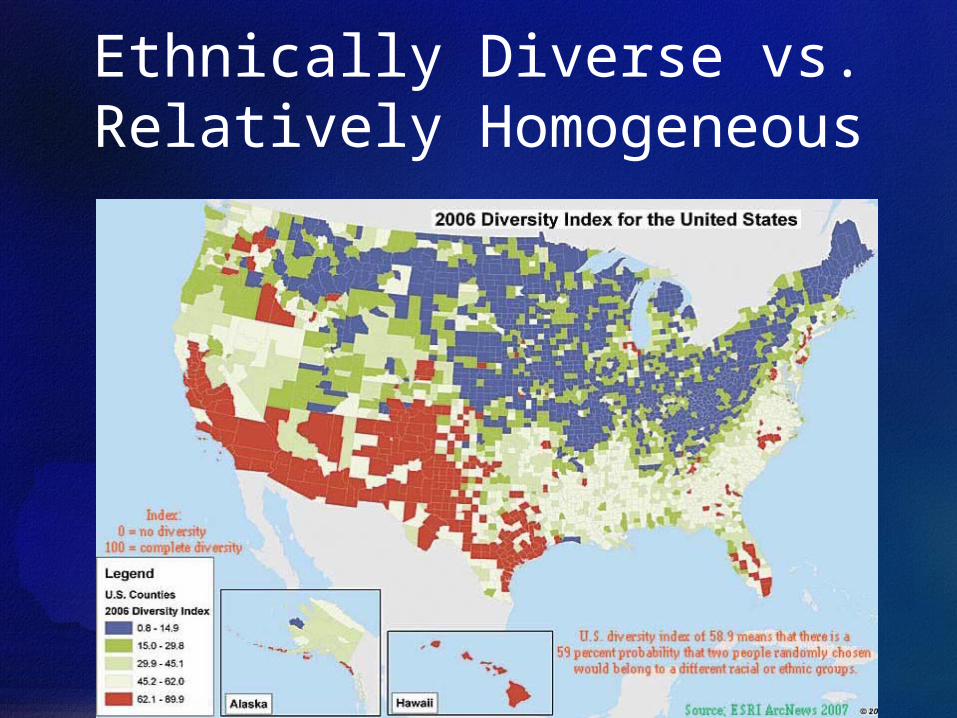
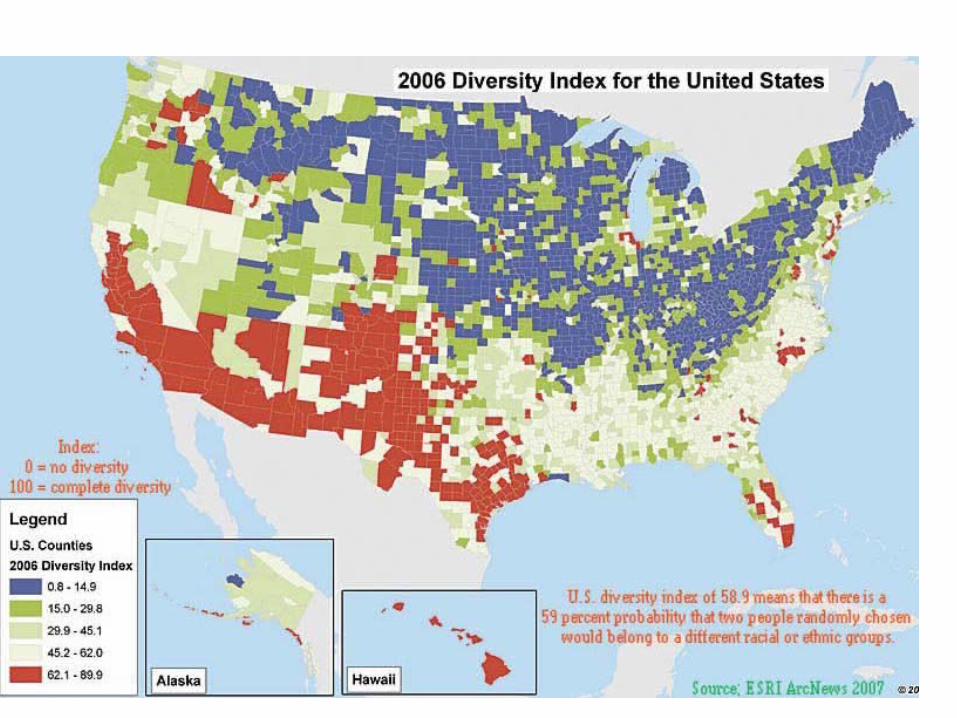
Ethnically Diverse vs. Relatively Homogeneous

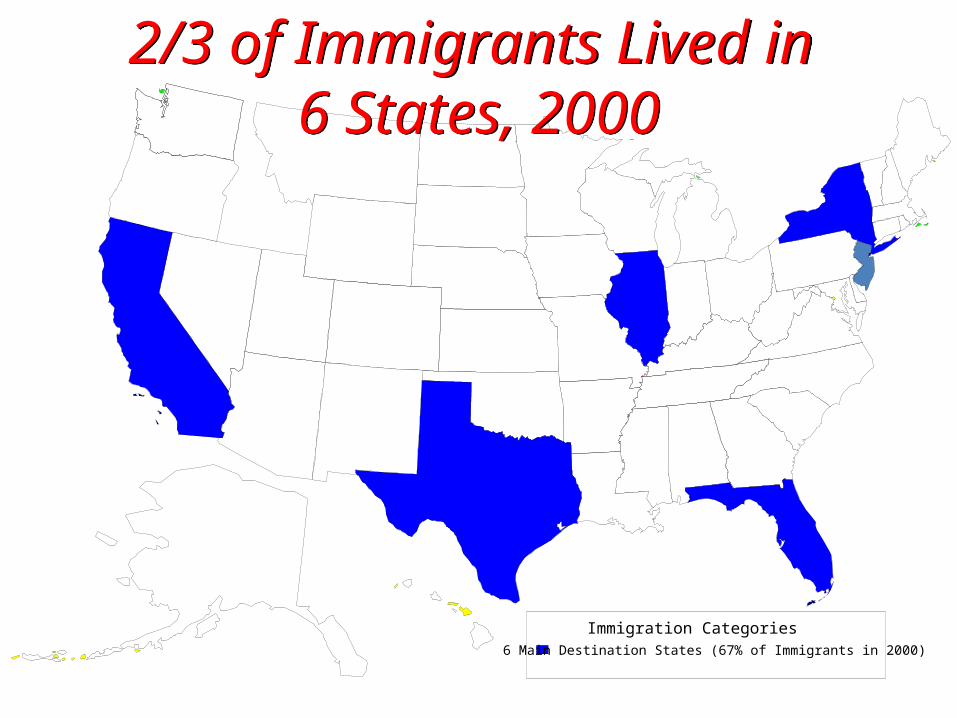
2/3 of Immigrants Lived in 6 States, 2000
2/3 of Immigrants Lived in 6 States, 2000
Immigration Categories6 Main Destination States (67% of Immigrants in 2000)
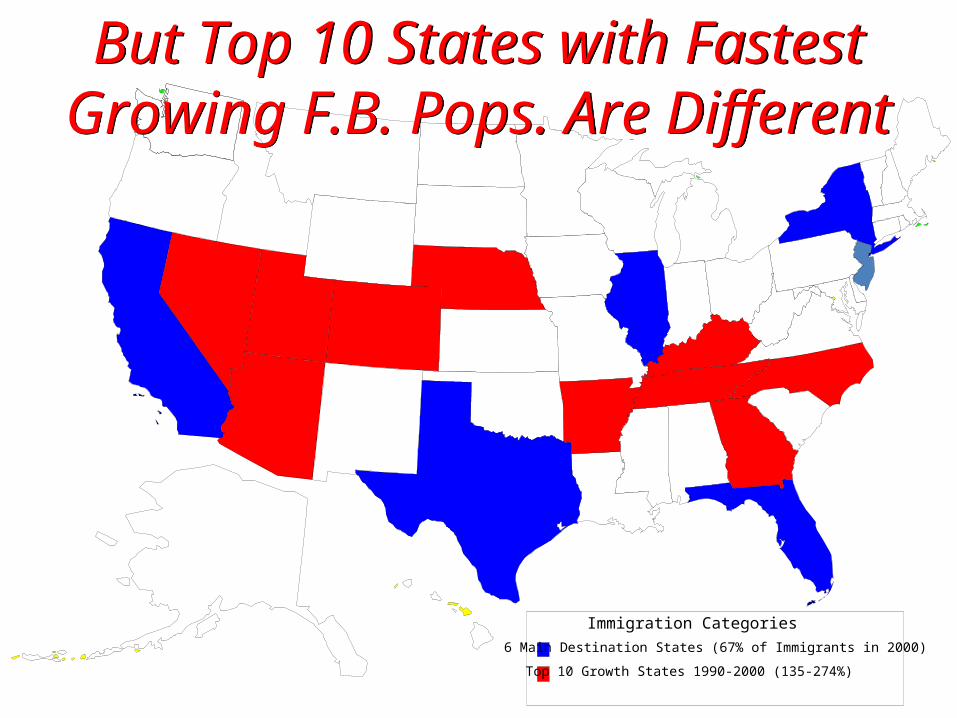
But Top 10 States with FastestGrowing F.B. Pops. Are DifferentBut Top 10 States with Fastest
Growing F.B. Pops. Are Different
Immigration Categories6 Main Destination States (67% of Immigrants in 2000)
Top 10 Growth States 1990-2000 (135-274%)

© 2006 POPULATION REFERENCE BUREAUSource: U.S. Census Bureau, 1990 decennial census.
In 1990, Almost Half of All U.S. Counties Had Less Than 1% Foreign-Born, and Only One-Tenth Had 5% or More.
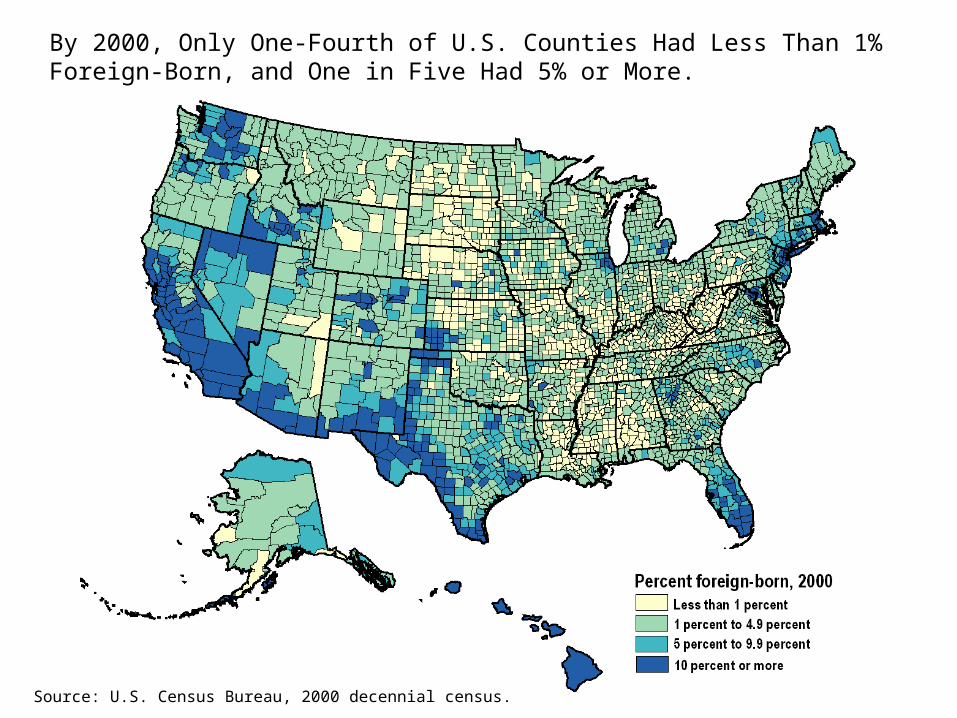
© 2006 POPULATION REFERENCE BUREAUSource: U.S. Census Bureau, 2000 decennial census.
By 2000, Only One-Fourth of U.S. Counties Had Less Than 1% Foreign-Born, and One in Five Had 5% or More.


nd
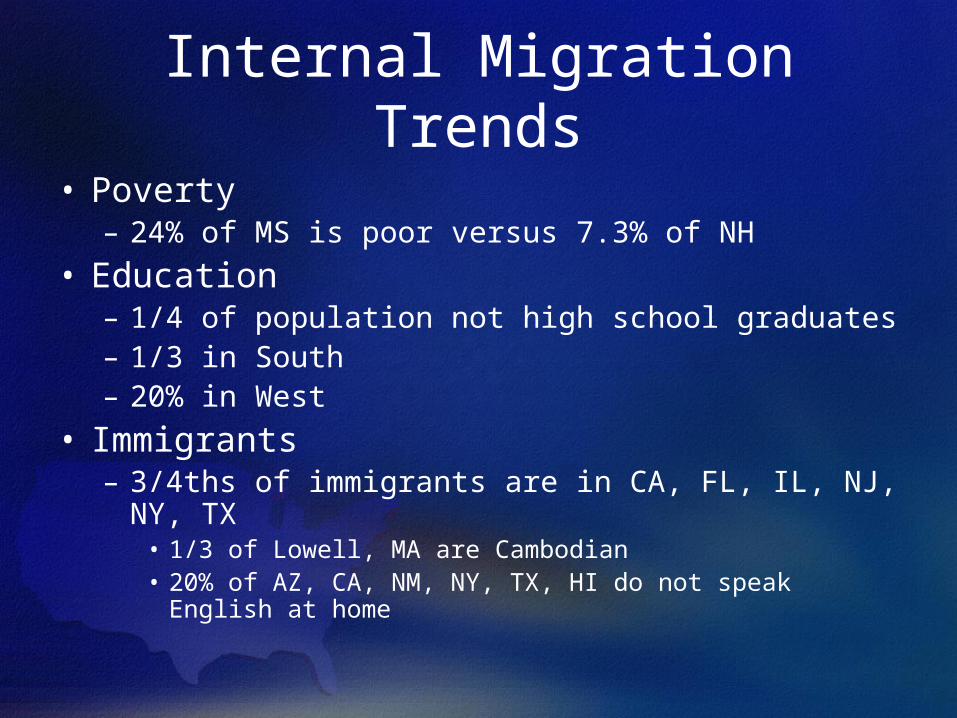
Internal Migration Trends
• Poverty– 24% of MS is poor versus 7.3% of NH
• Education– 1/4 of population not high school graduates– 1/3 in South– 20% in West
• Immigrants– 3/4ths of immigrants are in CA, FL, IL, NJ, NY, TX
• 1/3 of Lowell, MA are Cambodian• 20% of AZ, CA, NM, NY, TX, HI do not speak English at
home


Place• States are constrained by natural resource
endowments– Land
• Larger states like TX have larger legislative districts, harder to campaign
• NH has small districts, can one-on-one campaign– Location and Climate
• Location: Near ocean or waterway have advantage– Example: FedEx in Memphis
• Climate: People prefer warm to cold– Natural Resources
• Oil, minerals, agricultural producers– Oil and mineral producers are more dependent on
prices– WY, AL, LA


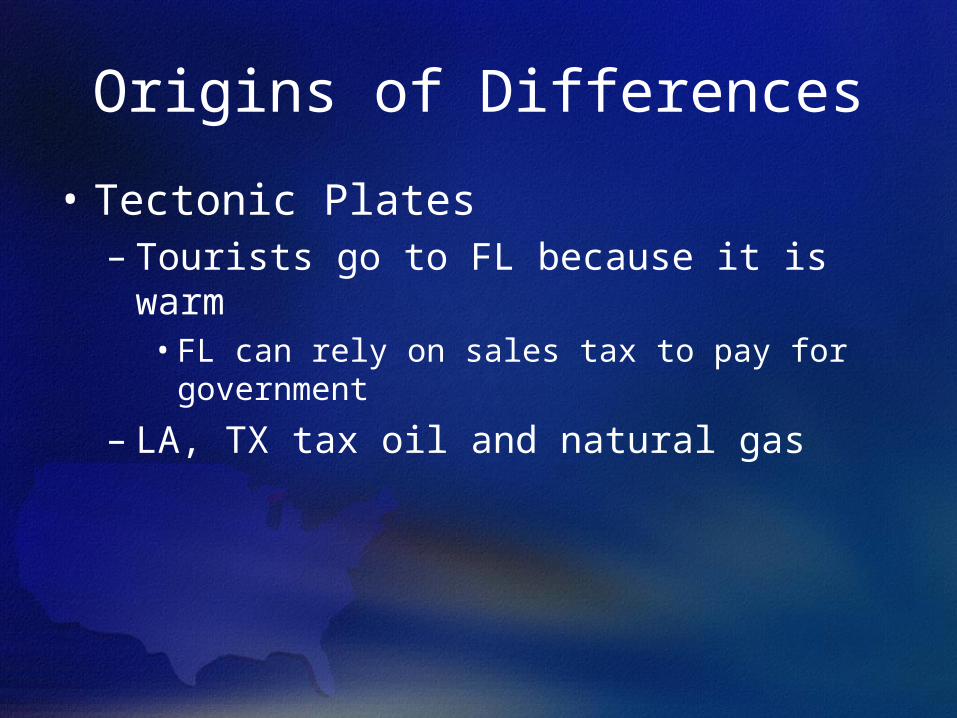
Origins of Differences
• Tectonic Plates– Tourists go to FL because it is warm
• FL can rely on sales tax to pay for government
– LA, TX tax oil and natural gas
Origins of Differences
• Rivers of New England powered the region in 19th century to build manufacturing economy– Urban living– Labor unions– Political machines
Origins of Differences
• Soil and climate of Southwest led to cotton and tobacco farming– Big plantations– Slavery– Jim Crow
Origins of Differences
• Interstate differences– Geographic variation based on who lives
near coasts or rivers
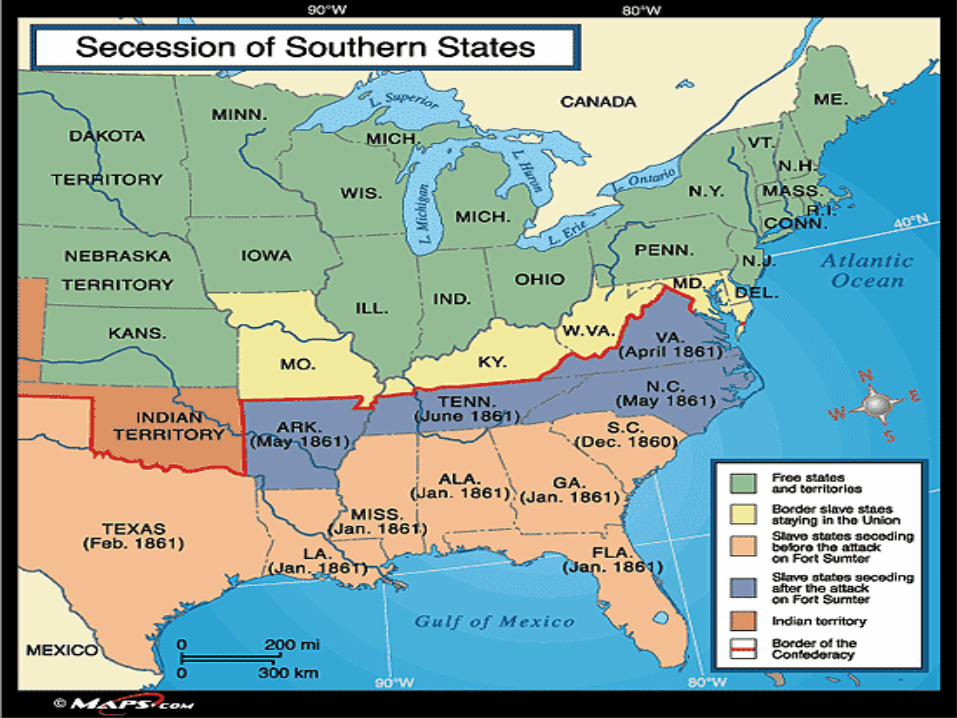
Origins of Differences
• History– 11 states seceded during Civil War– Politics of these states still have unique
qualities– Resentment of Union occupation during
Reconstruction instilled hostility for national government
– Even though very conservative, have been dominated by Democratic Party since Lincoln was a Republican


1888, 2000, 1976, 1892
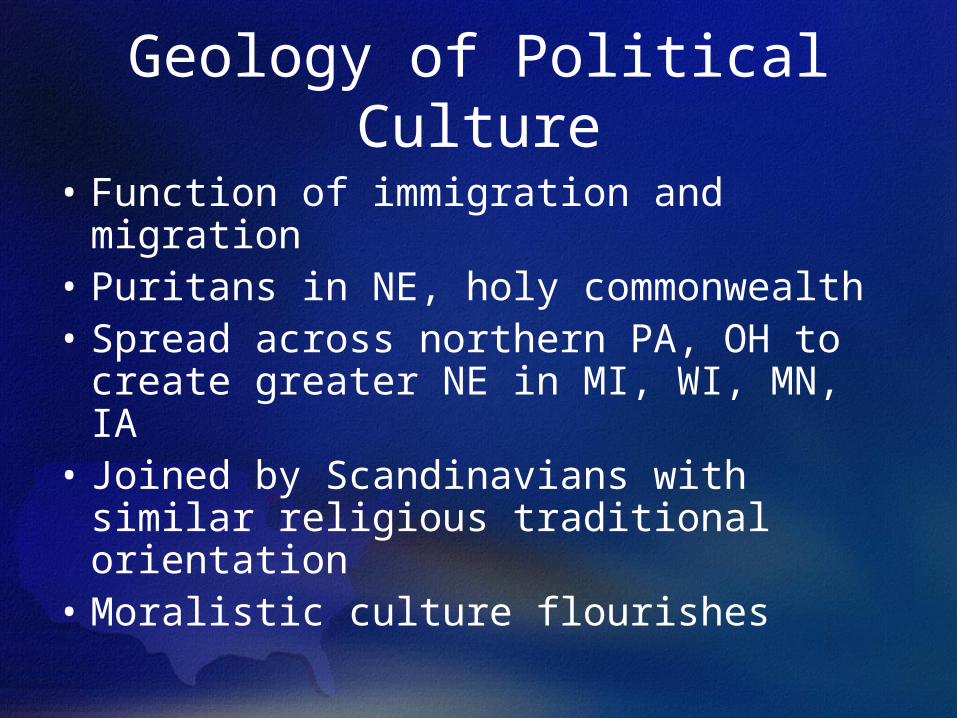
Geology of Political Culture
• Function of immigration and migration
• Puritans in NE, holy commonwealth• Spread across northern PA, OH to
create greater NE in MI, WI, MN, IA• Joined by Scandinavians with similar
religious traditional orientation• Moralistic culture flourishes

Geology of Political Culture
• Different ethnic and religious backgrounds setting in middle parts of nation– NY, NJ, DE, MD– Diverse groups searching for individual
opportunity – Pursuit of private ends, individualistic goals– Move into OH, IL– Move to gold fields of CA and filling out states
in-between

Geology of Political Culture
• Southern states– Seek commercial gain– Plantation centered agricultural system based
on anti-commercial orientation and slavery – Landed gentry: development of traditional
political culture, landed gentry occupies greater roles at expense of small landholders
– VA people settle KY, NC, influences in TN, etc.
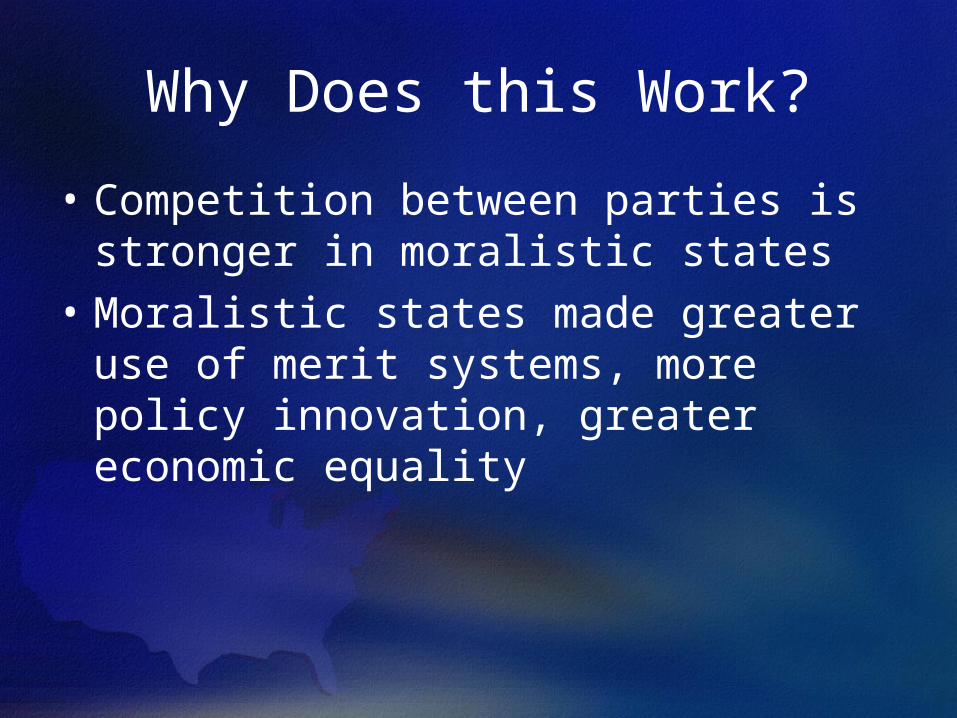
Why Does this Work?
• Competition between parties is stronger in moralistic states
• Moralistic states made greater use of merit systems, more policy innovation, greater economic equality
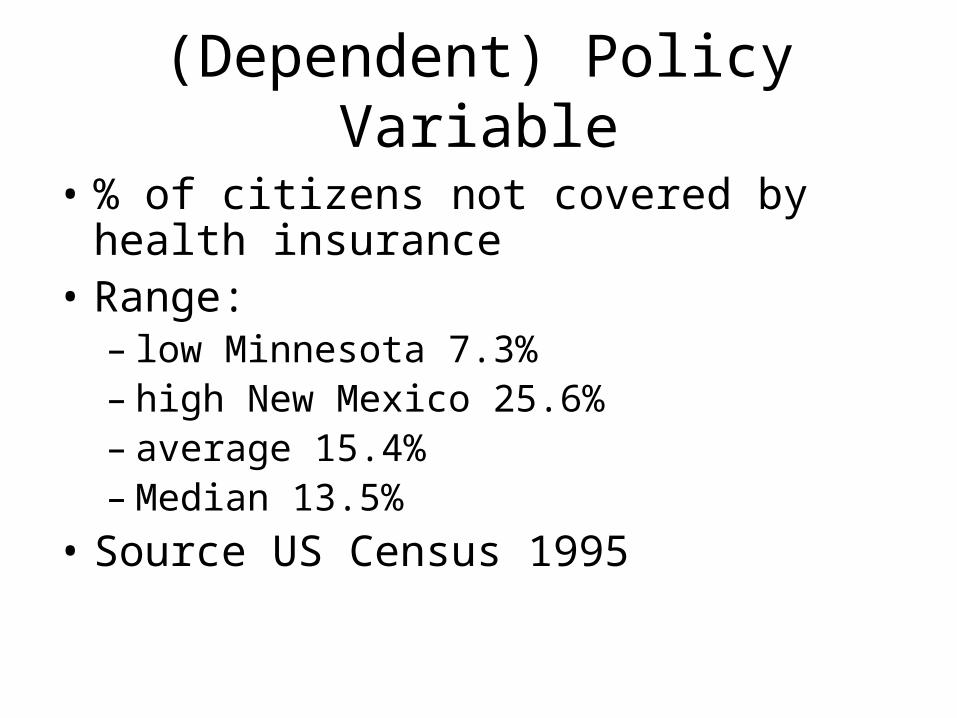
(Dependent) Policy Variable
• % of citizens not covered by health insurance• Range:
– low Minnesota 7.3%– high New Mexico 25.6%– average 15.4%– Median 13.5%
• Source US Census 1995
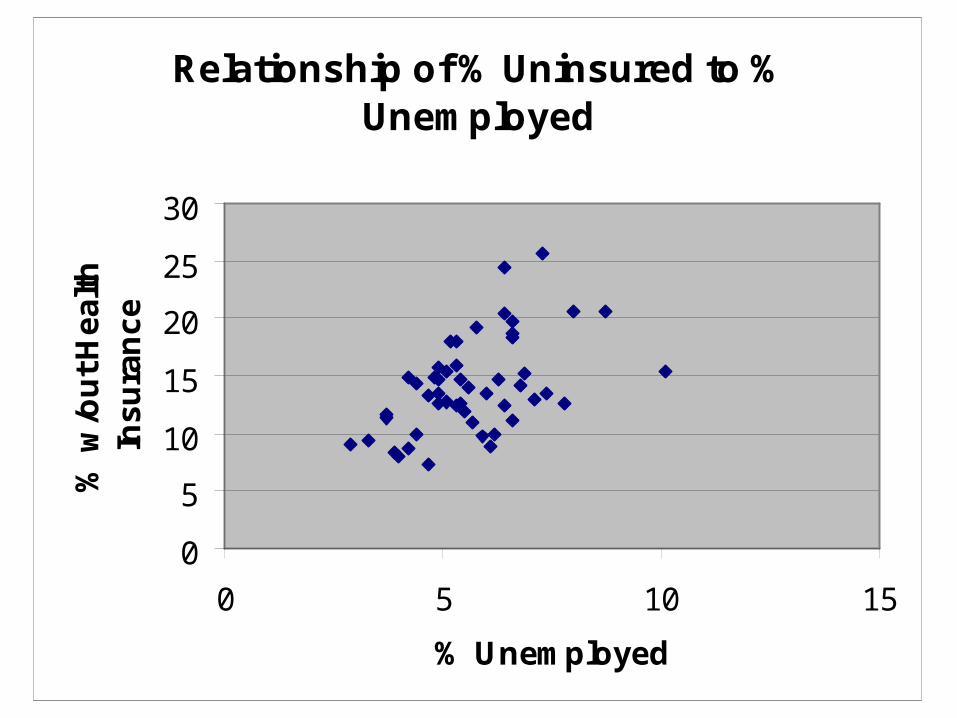
Relationship of % Uninsured to % Unemployed
0
5
10
15
20
25
30
0 5 10 15
% Unemployed
% w
/ou
t H
ea
lth
In
su
ran
ce

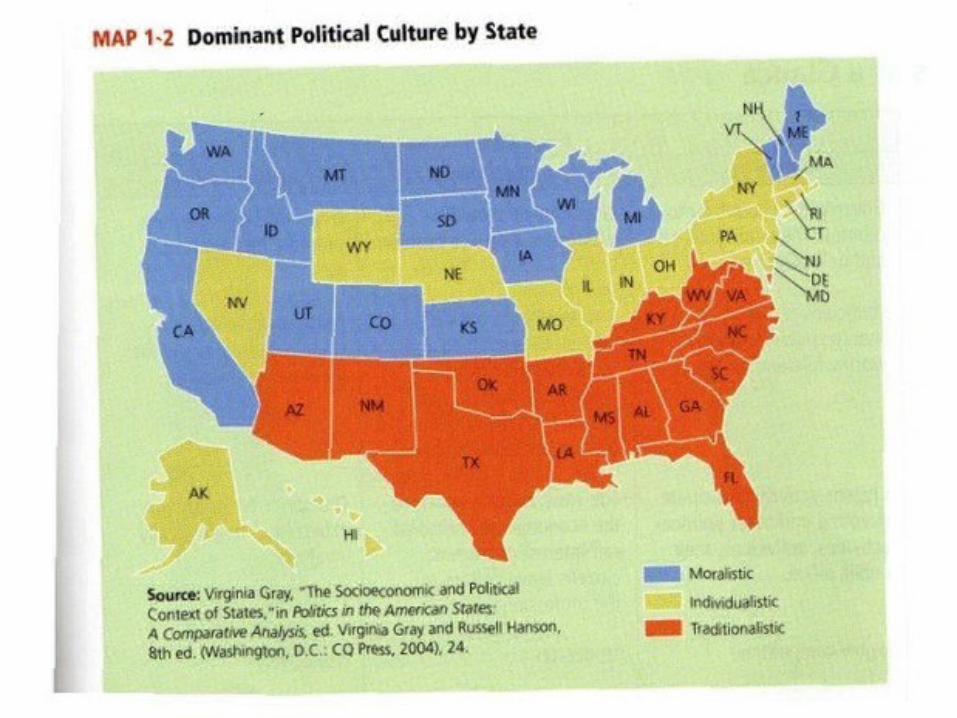
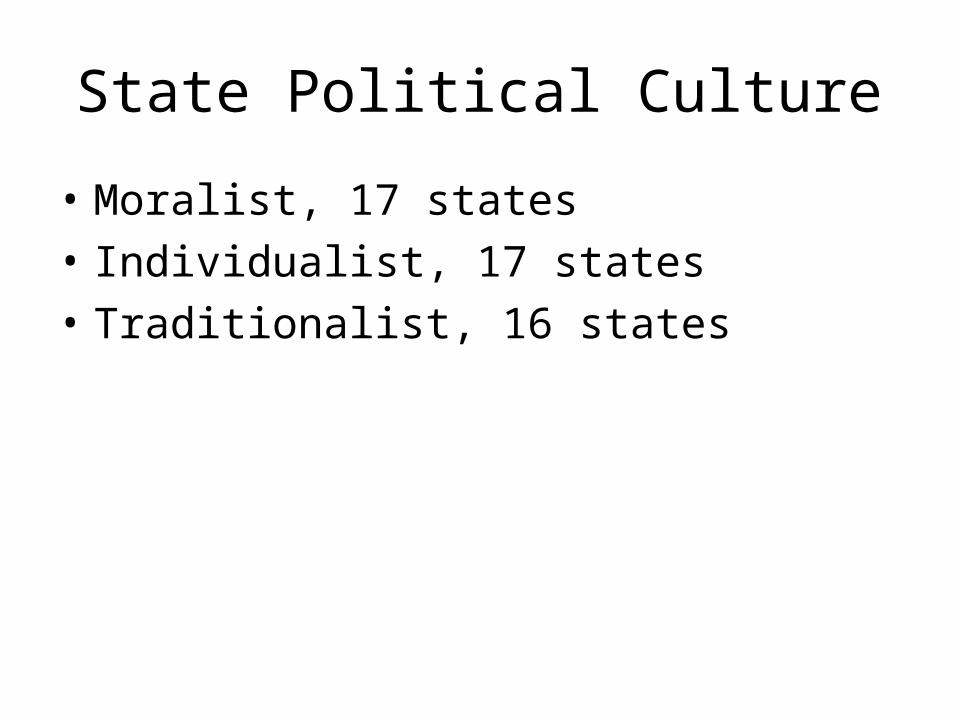
State Political Culture
• Moralist, 17 states• Individualist, 17 states• Traditionalist, 16 states
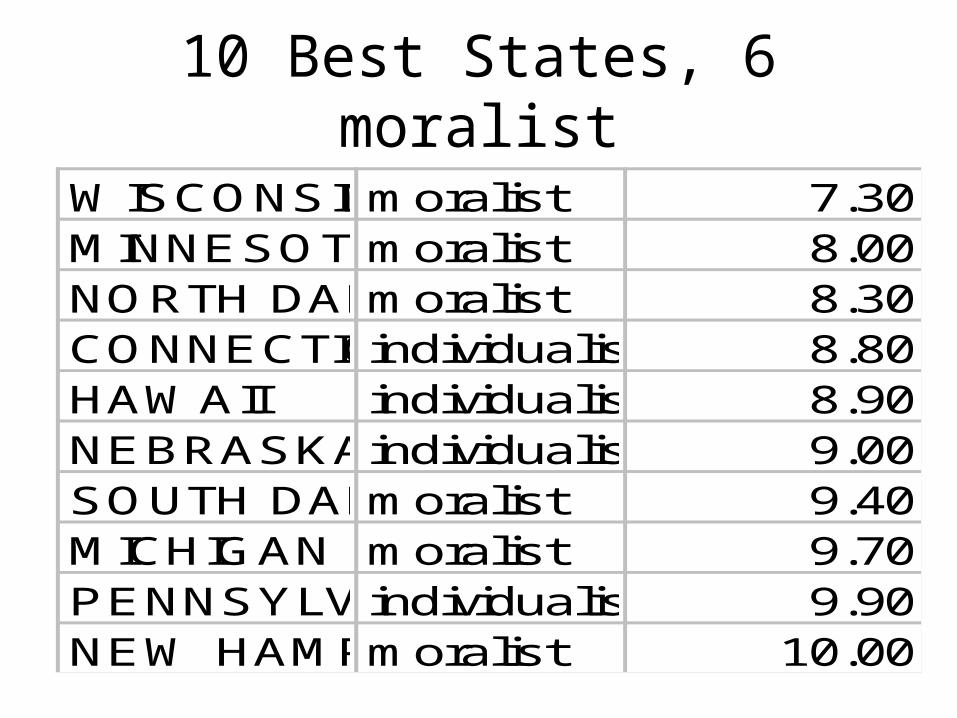
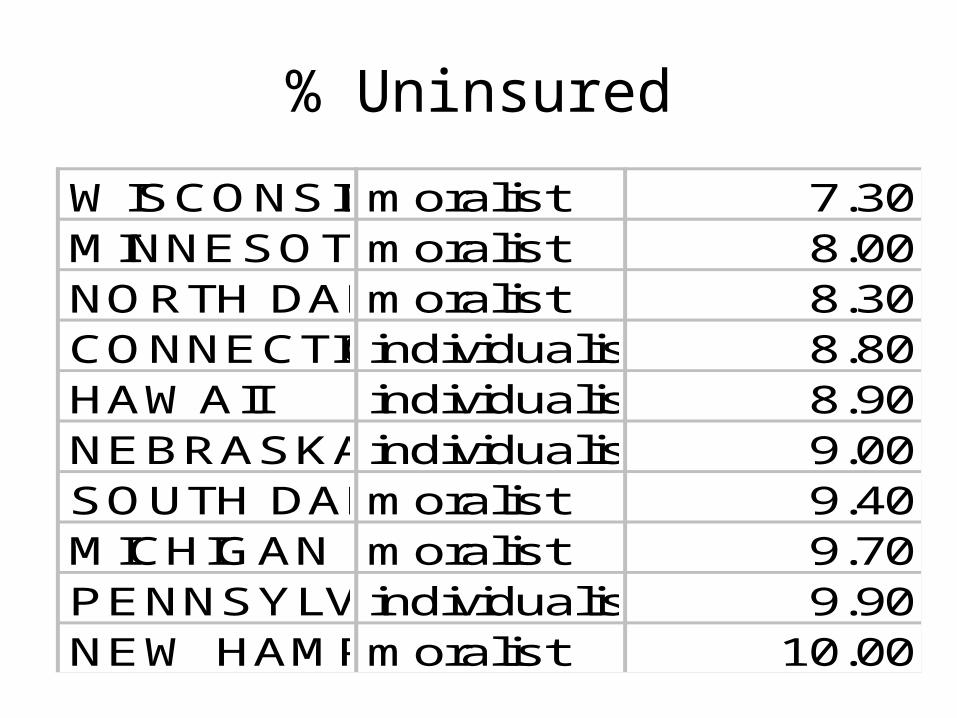
10 Best States, 6 moralist
WISCONSINmoralist 7.30MINNESOTAmoralist 8.00NORTH DAKOTAmoralist 8.30CONNECTICUTindividualist 8.80HAWAII individualist 8.90NEBRASKAindividualist 9.00SOUTH DAKOTAmoralist 9.40MICHIGAN moralist 9.70PENNSYLVANIAindividualist 9.90NEW HAMPSHIREmoralist 10.00
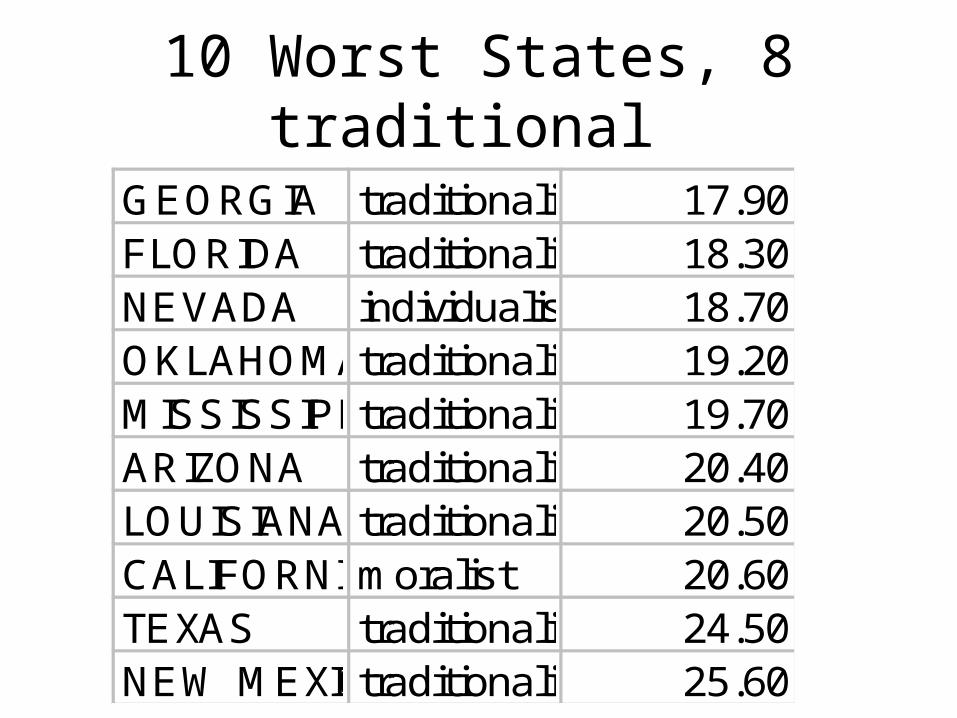
10 Worst States, 8 traditional
GEORGIA traditionalist 17.90FLORIDA traditionalist 18.30NEVADA individualist 18.70OKLAHOMAtraditionalist 19.20MISSISSIPPItraditionalist 19.70ARIZONA traditionalist 20.40LOUISIANA traditionalist 20.50CALIFORNIAmoralist 20.60TEXAS traditionalist 24.50NEW MEXICOtraditionalist 25.60
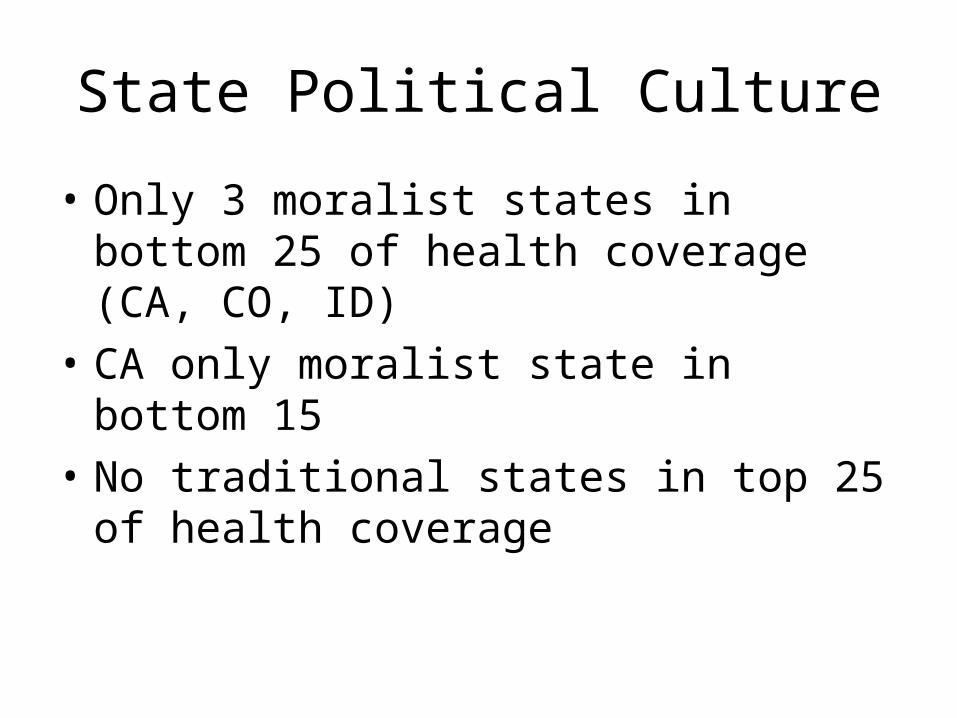
State Political Culture
• Only 3 moralist states in bottom 25 of health coverage (CA, CO, ID)
• CA only moralist state in bottom 15• No traditional states in top 25 of health
coverage
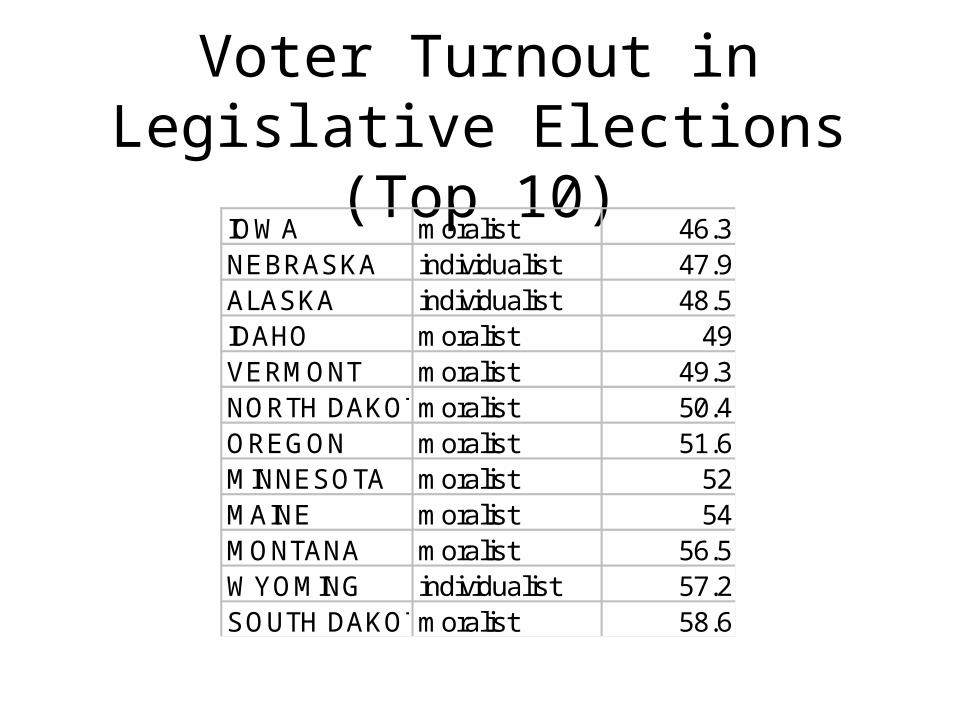
Voter Turnout in Legislative Elections (Top 10)
IOWA moralist 46.3NEBRASKA individualist 47.9ALASKA individualist 48.5IDAHO moralist 49VERMONT moralist 49.3NORTH DAKOTAmoralist 50.4OREGON moralist 51.6MINNESOTA moralist 52MAINE moralist 54MONTANA moralist 56.5WYOMING individualist 57.2SOUTH DAKOTAmoralist 58.6
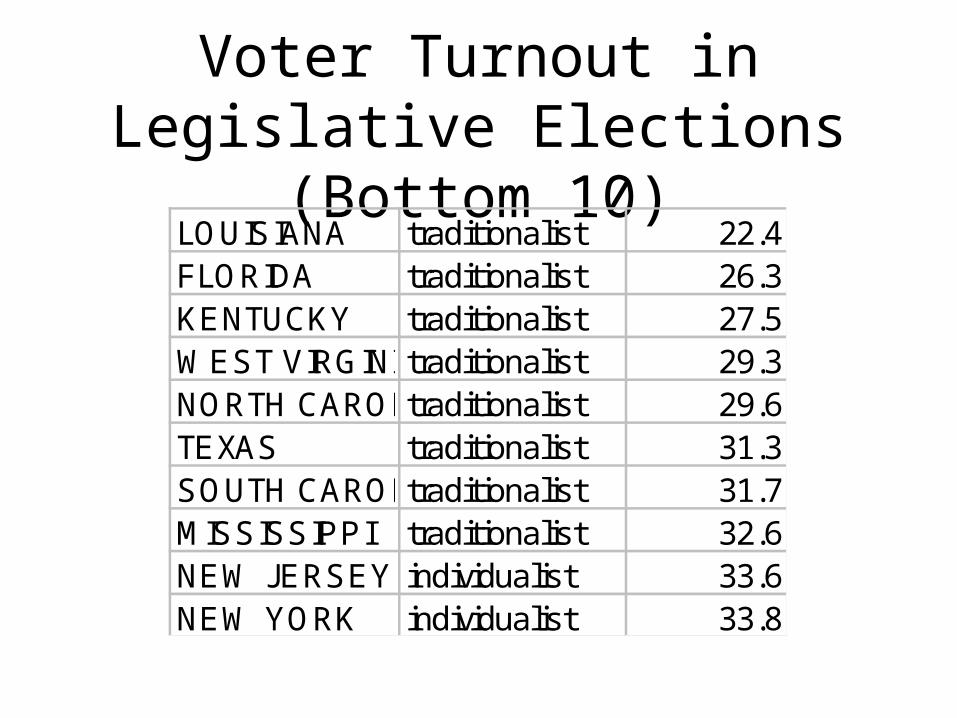
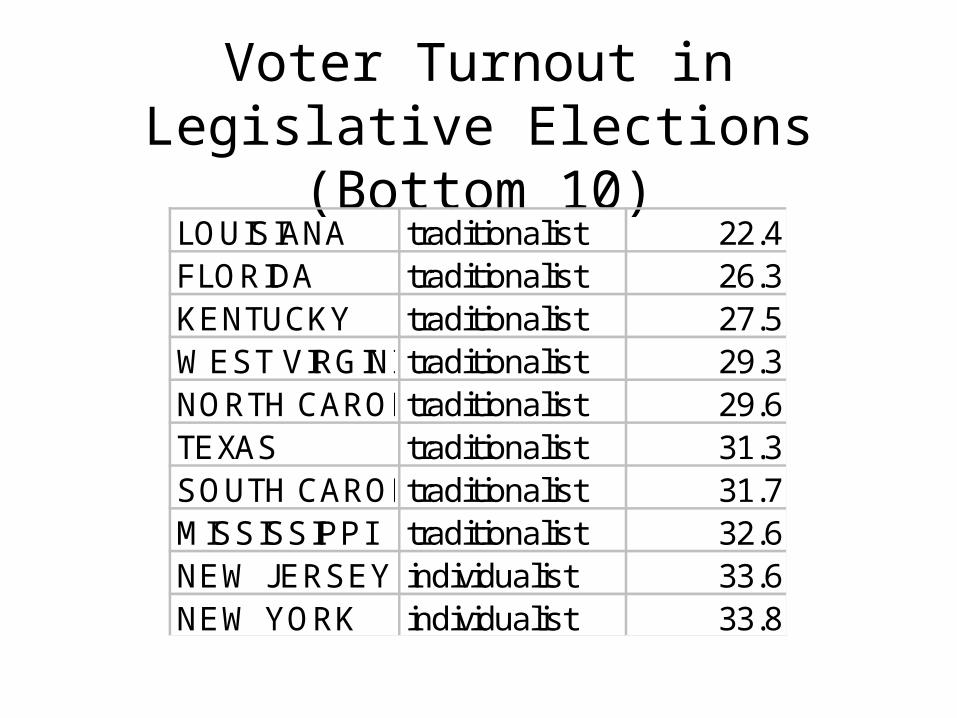
Voter Turnout in Legislative Elections (Bottom 10)
LOUISIANA traditionalist 22.4FLORIDA traditionalist 26.3KENTUCKY traditionalist 27.5WEST VIRGINIAtraditionalist 29.3NORTH CAROLINAtraditionalist 29.6TEXAS traditionalist 31.3SOUTH CAROLINAtraditionalist 31.7MISSISSIPPI traditionalist 32.6NEW JERSEY individualist 33.6NEW YORK individualist 33.8
State Minority Population• Equals % Hispanic + % black
– High NM, TX 42%– Low ME, VT 1%– Average 16%
• State Hispanic population– Low West Virginia .6%– High New Mexico 40.7%– Average 6.9%
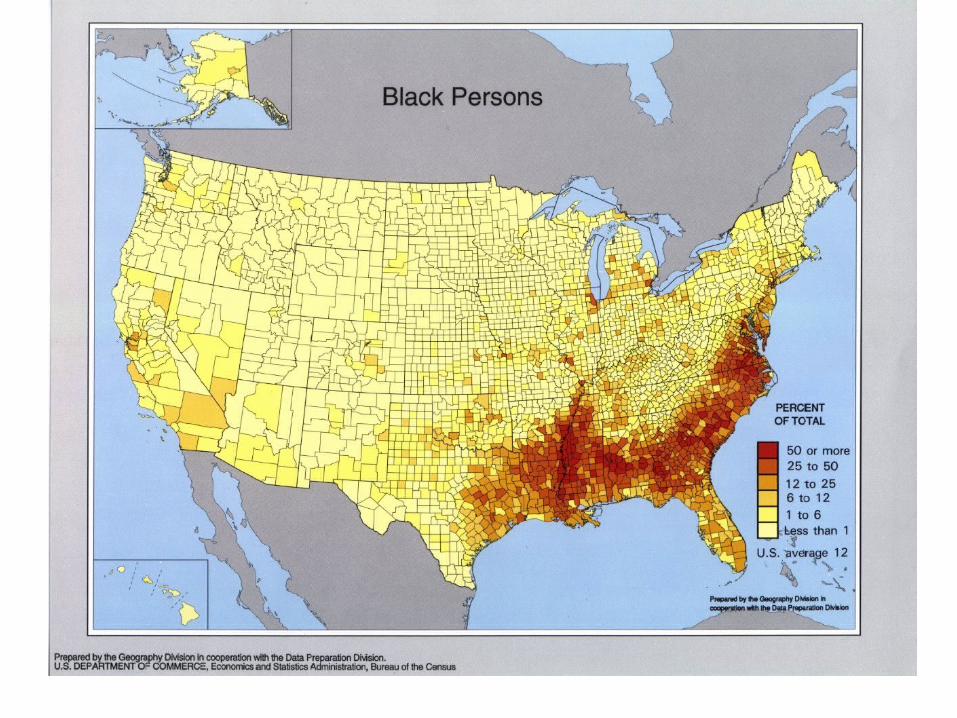
• State Black Population– Low Montana, 2.4%– High Mississippi 36.8%– Average 9.9%
Demographic Variables (cont)
• State Hispanic population– Low West Virginia .6%– High New Mexico 40.7%– Average 6.9%– Median 3.9%
• State Black Population– Low Montana, 2.4%– High Mississippi 36.8%– Average 9.9%– Median 6.9%

Relationship of % Minority % of Uninsured
0
5
10
15
20
25
30
0 10 20 30 40 50
% of Color (% black + % hispanic)
% o
f R
es
ide
nts
wit
h N
o
He
alt
h In
su
ran
ce
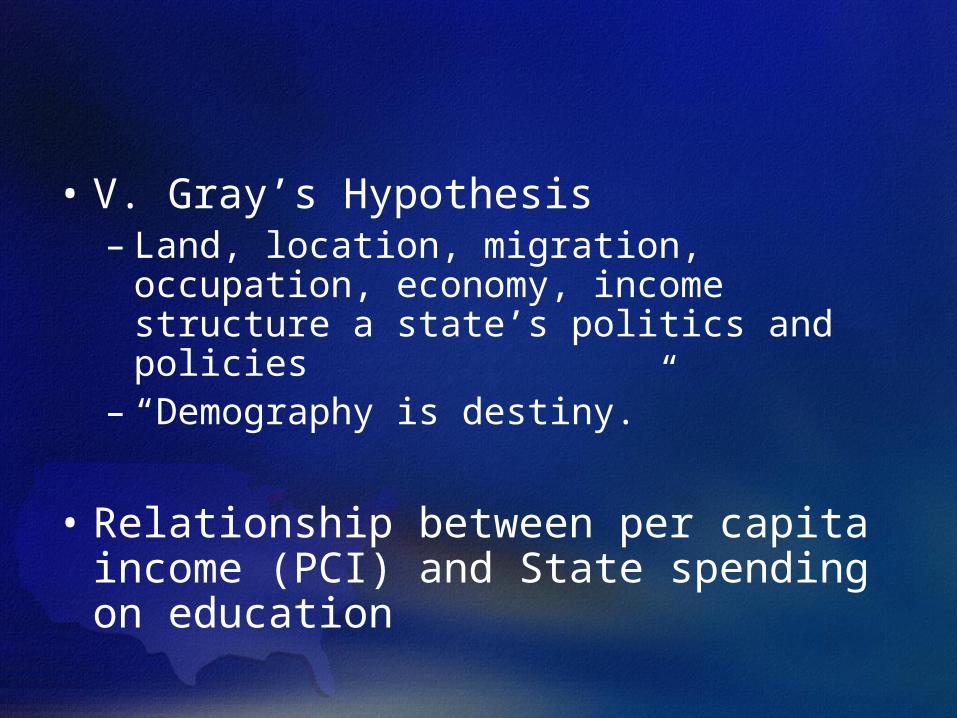
• V. Gray’s Hypothesis– Land, location, migration, occupation,
economy, income structure a state’s politics and policies
– “Demography is destiny.”
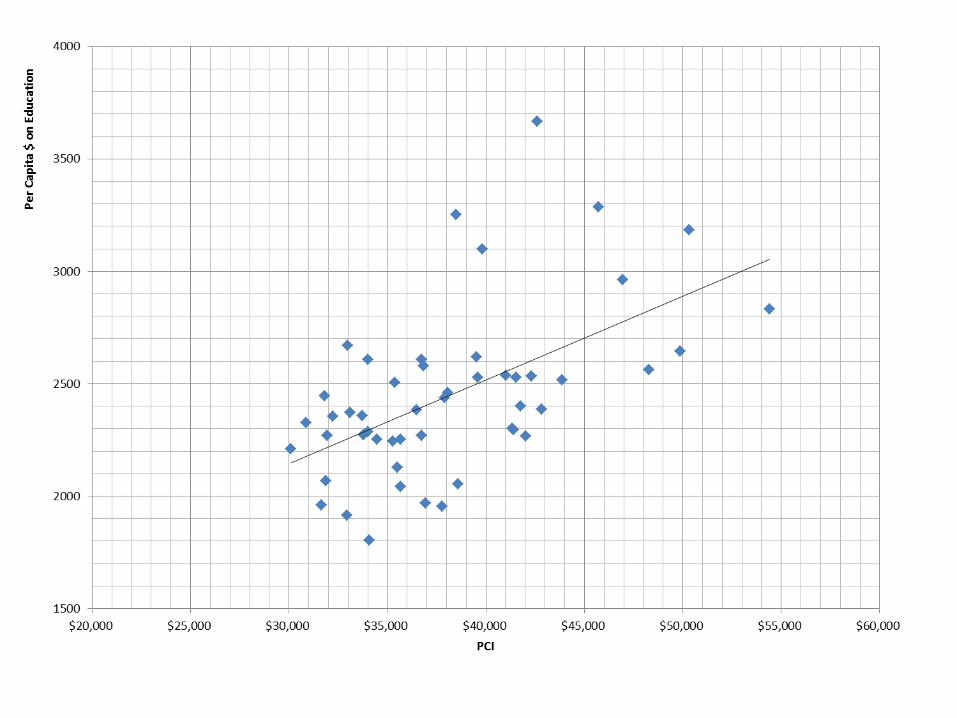
• Relationship between per capita income (PCI) and State spending on education
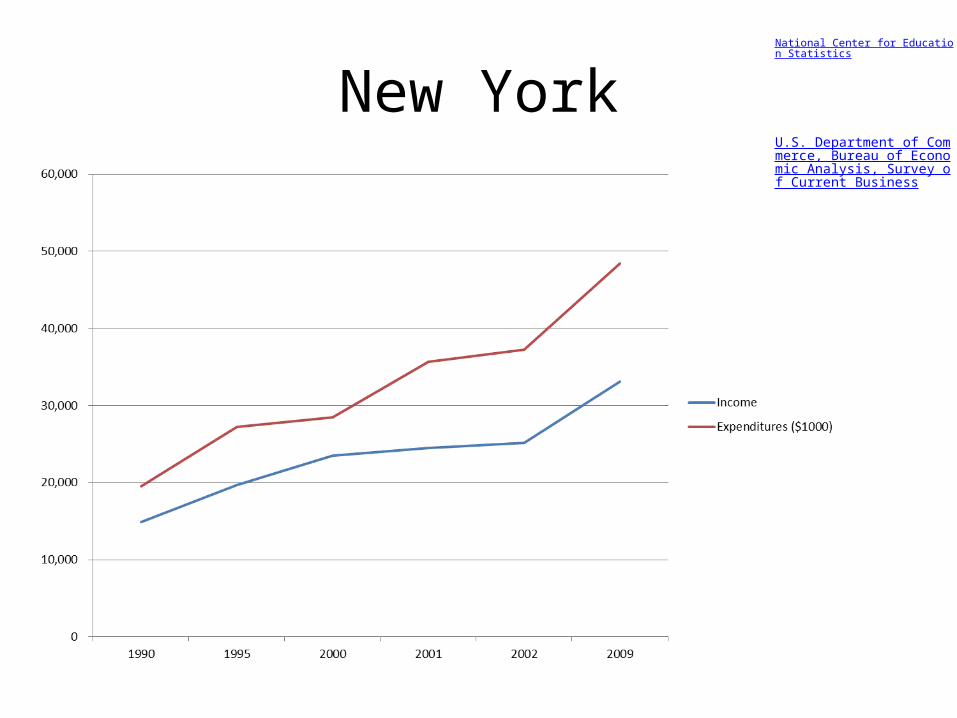
New YorkNational Center for Education Statistics
U.S. Department of Commerce, Bureau of Economic Analysis, Survey of Current Business

Alabama


State PCI Rank Rank, per-capita higher ed $ Rank, per-capita E&S $
Georgia 39 47 19
Iowa 28 7 25
Massachusetts 3 42 9
New Jersey 2 39 2
South Dakota 26 41 45Wisconsin 27 14 18Utah 49 6 46Alabama 41 13 39
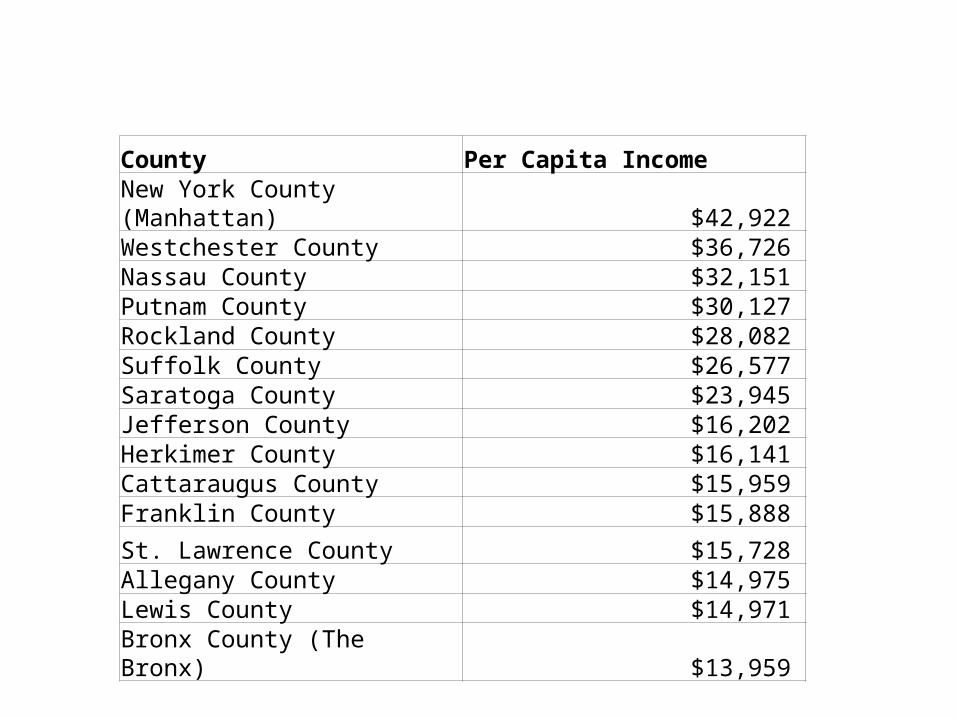
County Per Capita Income
New York County (Manhattan) $42,922 Westchester County $36,726 Nassau County $32,151 Putnam County $30,127 Rockland County $28,082 Suffolk County $26,577 Saratoga County $23,945 Jefferson County $16,202 Herkimer County $16,141 Cattaraugus County $15,959 Franklin County $15,888
St. Lawrence County $15,728 Allegany County $14,975 Lewis County $14,971
Bronx County (The Bronx) $13,959

Average teacher salary (Y) vs. PCI for NY
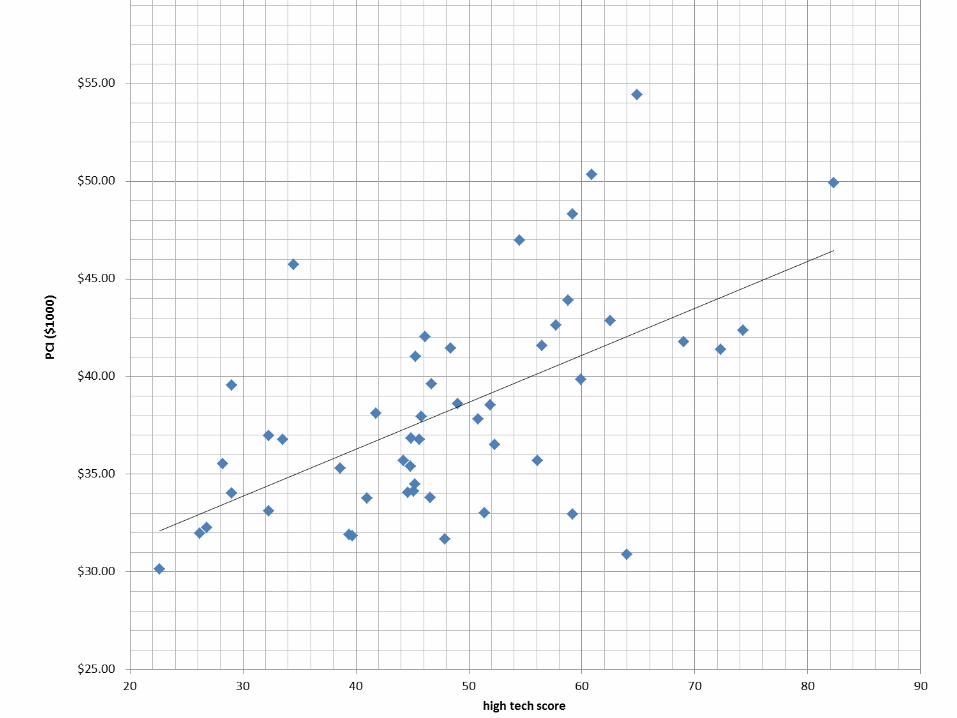
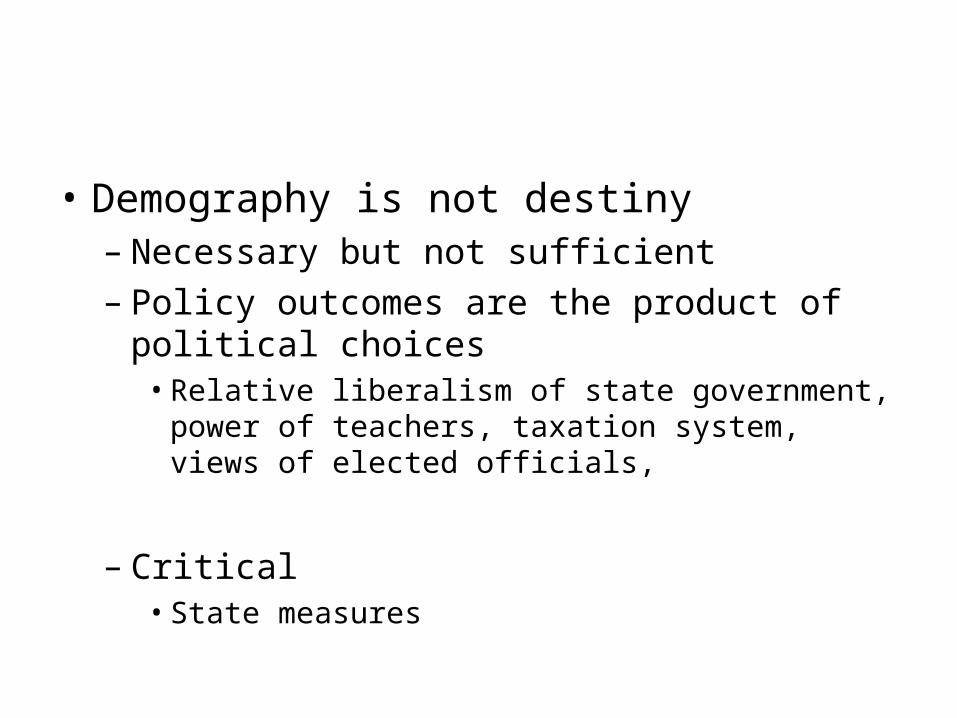
• Demography is not destiny– Necessary but not sufficient– Policy outcomes are the product of political
choices• Relative liberalism of state government, power of
teachers, taxation system, views of elected officials,
– Critical• State measures
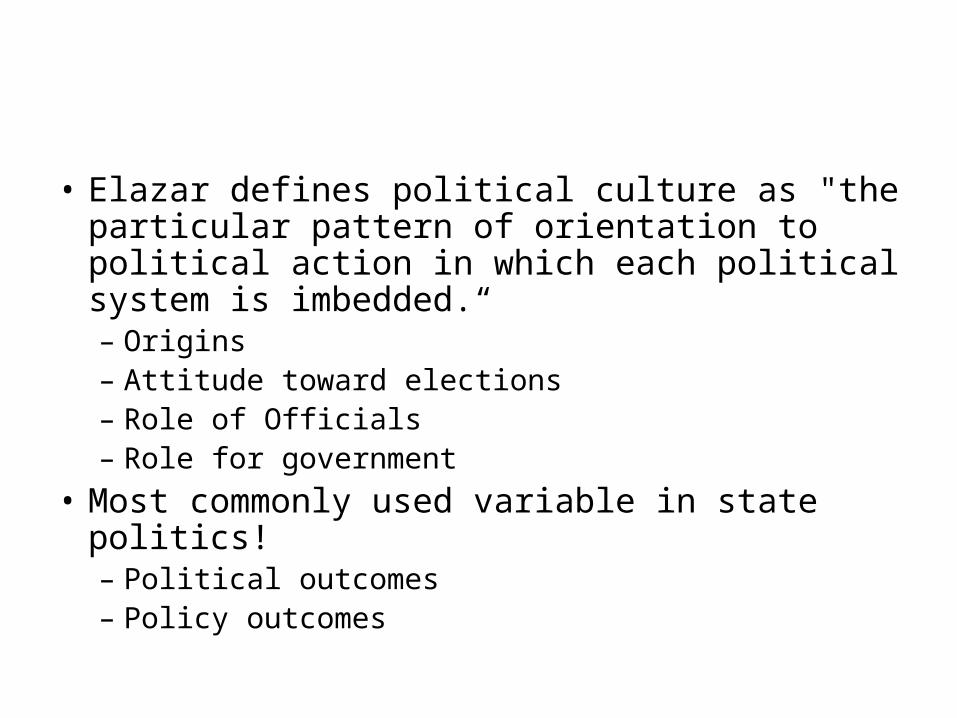
• Elazar defines political culture as "the particular pattern of orientation to political action in which each political system is imbedded.“– Origins– Attitude toward elections– Role of Officials– Role for government
• Most commonly used variable in state politics! – Political outcomes– Policy outcomes

(Dependent) Policy Variable
• % of citizens not covered by health insurance• Range:
– low Minnesota 7.3%– high New Mexico 25.6%– average 15.4%– Median 13.5%
• Source US Census 1995

Relationship of % Uninsured to % Unemployed
0
5
10
15
20
25
30
0 5 10 15
% Unemployed
% w
/ou
t H
ea
lth
In
su
ran
ce
State Political Culture
• Moralist, 17 states• Individualist, 17 states• Traditionalist, 16 states
% Uninsured
WISCONSINmoralist 7.30MINNESOTAmoralist 8.00NORTH DAKOTAmoralist 8.30CONNECTICUTindividualist 8.80HAWAII individualist 8.90NEBRASKAindividualist 9.00SOUTH DAKOTAmoralist 9.40MICHIGAN moralist 9.70PENNSYLVANIAindividualist 9.90NEW HAMPSHIREmoralist 10.00

10 Worst States, 8 traditional
GEORGIA traditionalist 17.90FLORIDA traditionalist 18.30NEVADA individualist 18.70OKLAHOMAtraditionalist 19.20MISSISSIPPItraditionalist 19.70ARIZONA traditionalist 20.40LOUISIANA traditionalist 20.50CALIFORNIAmoralist 20.60TEXAS traditionalist 24.50NEW MEXICOtraditionalist 25.60

State Political Culture
• Only 3 moralist states in bottom 25 of health coverage (CA, CO, ID)
• CA only moralist state in bottom 15• No traditional states in top 25 of health
coverage

Voter Turnout in Legislative Elections (Top 10)
IOWA moralist 46.3NEBRASKA individualist 47.9ALASKA individualist 48.5IDAHO moralist 49VERMONT moralist 49.3NORTH DAKOTAmoralist 50.4OREGON moralist 51.6MINNESOTA moralist 52MAINE moralist 54MONTANA moralist 56.5WYOMING individualist 57.2SOUTH DAKOTAmoralist 58.6
Voter Turnout in Legislative Elections (Bottom 10)
LOUISIANA traditionalist 22.4FLORIDA traditionalist 26.3KENTUCKY traditionalist 27.5WEST VIRGINIAtraditionalist 29.3NORTH CAROLINAtraditionalist 29.6TEXAS traditionalist 31.3SOUTH CAROLINAtraditionalist 31.7MISSISSIPPI traditionalist 32.6NEW JERSEY individualist 33.6NEW YORK individualist 33.8
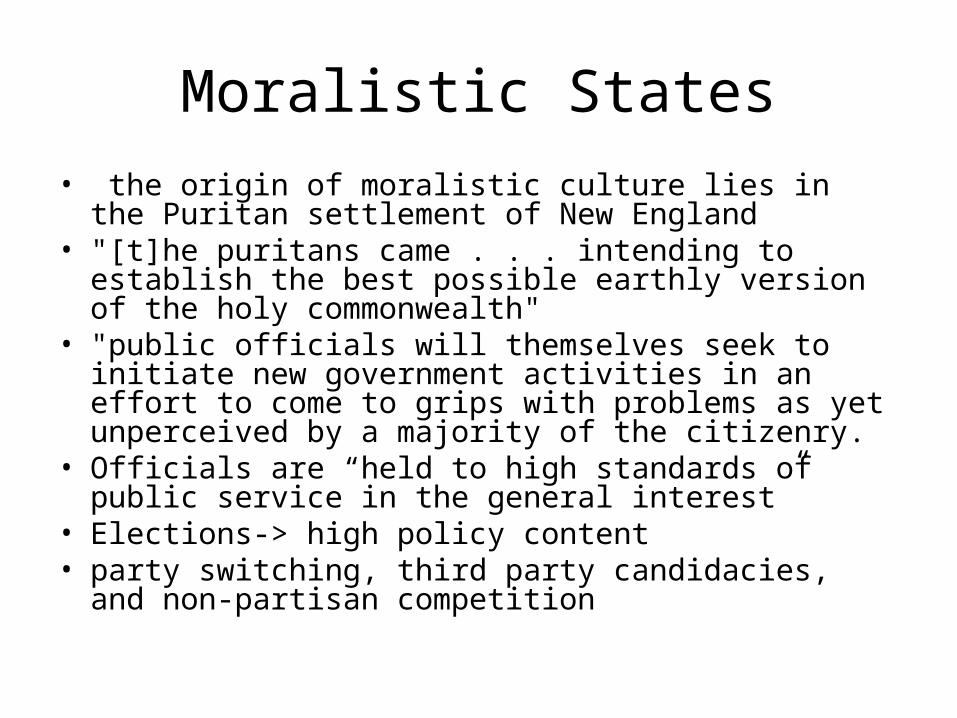
Moralistic States• the origin of moralistic culture lies in the Puritan
settlement of New England• "[t]he puritans came . . . intending to establish the best
possible earthly version of the holy commonwealth" • "public officials will themselves seek to initiate new
government activities in an effort to come to grips with problems as yet unperceived by a majority of the citizenry.
• Officials are “held to high standards of public service in the general interest”
• Elections-> high policy content• party switching, third party candidacies, and non-partisan
competition

Socio-Economic and Demographic Analysis of your States
• http://www.skidmore.edu/~bturner/