demographic structure of local councils 2015
TRANSCRIPT
as of 07.12.2015
[email protected]+(38044) 221-4407
Demographic Structure of Local Councils 2015Demographic Structure of Local Councils 2015

Information and Analytical Centre “RATING Pro” has analyzed the composition of regional councils formed after the local elections 2015, in terms of gender, age, education, and employment. According to the research, the following conclusions have been made:
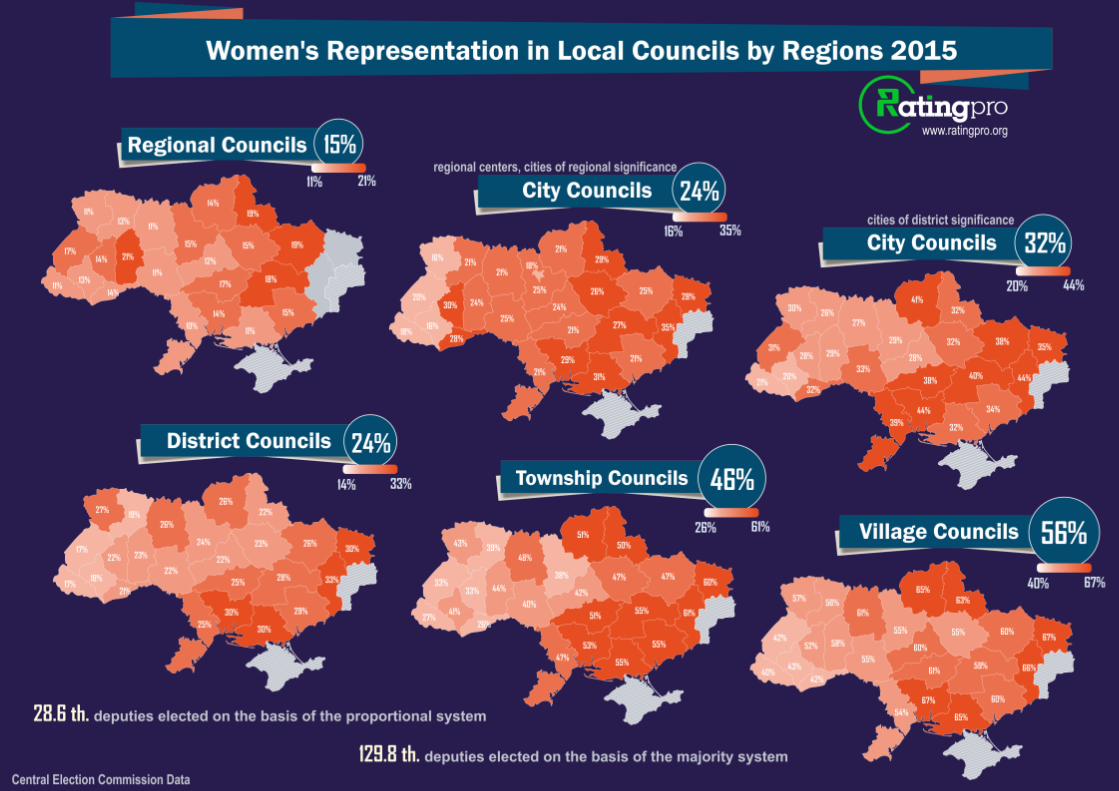
· Comparing to the local elections 2010 women’s representation in regional councils increased, considerable growth noticed in regional and district councils. The number of female deputies in regional councils increased from 12% to 15%, in city councils – from 28% to 29%, in district councils – from 23% to 24%, in township councils – remained unchanged (46%), in village councils – grew from 51% to 56%. However, remarkably stable is the trend that the higher the level of the council, the fewer women are represented there.
· The regional breakdown also showed some interesting trends. In particular, the farther to the East, the more women are represented in local councils at all levels, especially in the district, township and village councils (the absolute majority of deputies). In terms of women’s representation in councils, the leaders are the following regions: Donetsk, Luhansk, Mykolaiv, Kherson, Chernihiv, Sumy, Dnipropetrovsk, Kharkiv, and Zaporizhzhia. The smallest number of women is represented in the local councils of Transcarpathian, Ivano-Frankivsk, Chernivtsi, Rivne, and Lviv Regions. At the same time, Lviv Region provided a relatively high level of women’s representation in regional and city councils, whereas, at the level of district, township and village councils – the region is among obvious outsiders.
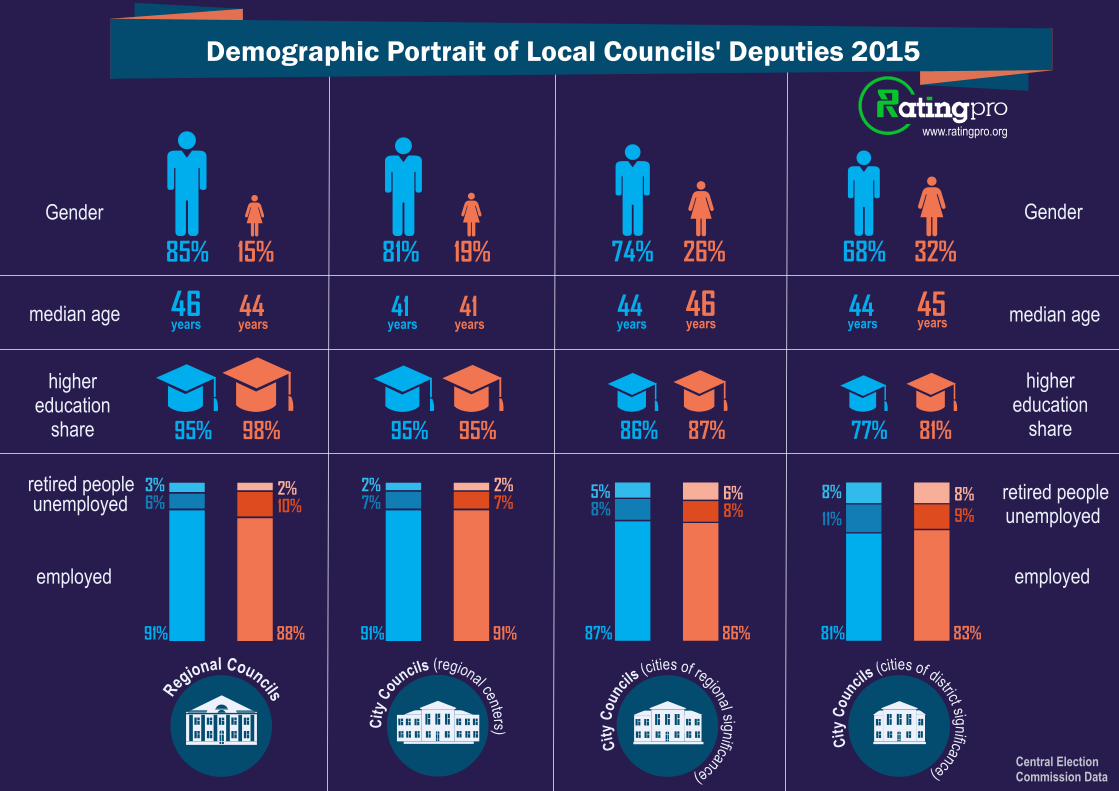
· The analysis of list of candidates showed that almost all parties kept within the law of at least one-third women’s representation but it did not allow for the appropriate level of women’s representation among the elected deputies. This is particularly true for the local councils at the higher level. For example, in the lists of candidates for regional councils, the proportion of women amounts to 30%, but the proportion of women among the elected deputies is twice as small as 15%. In the lists of candidates for city councils of regional centers the proportion of women amounts to 33%, but the share of deputies elected among women was only 19%, in the city councils of cities of regional significance – 36% and 26% respectively, in district councils – 36% and 24% respectively. At the level of city councils of district significance, the actual representation of women was equal to 32%.
· Among the parties with 400 and more mandates (on proportional basis), the highest share of women’s representation among the deputies was provided by Opposition bloc (30%) Nash Kray (30%), Vidrodzhennya (28%), and Batkivshchyna (28%). The smallest number of female deputies is represented in Petro Poroshenko Bloc "Solidarity" (22%), Hromadianska Pozitsiya (22%), Svoboda (22%), and the Agrarian Party of Ukraine (21%).
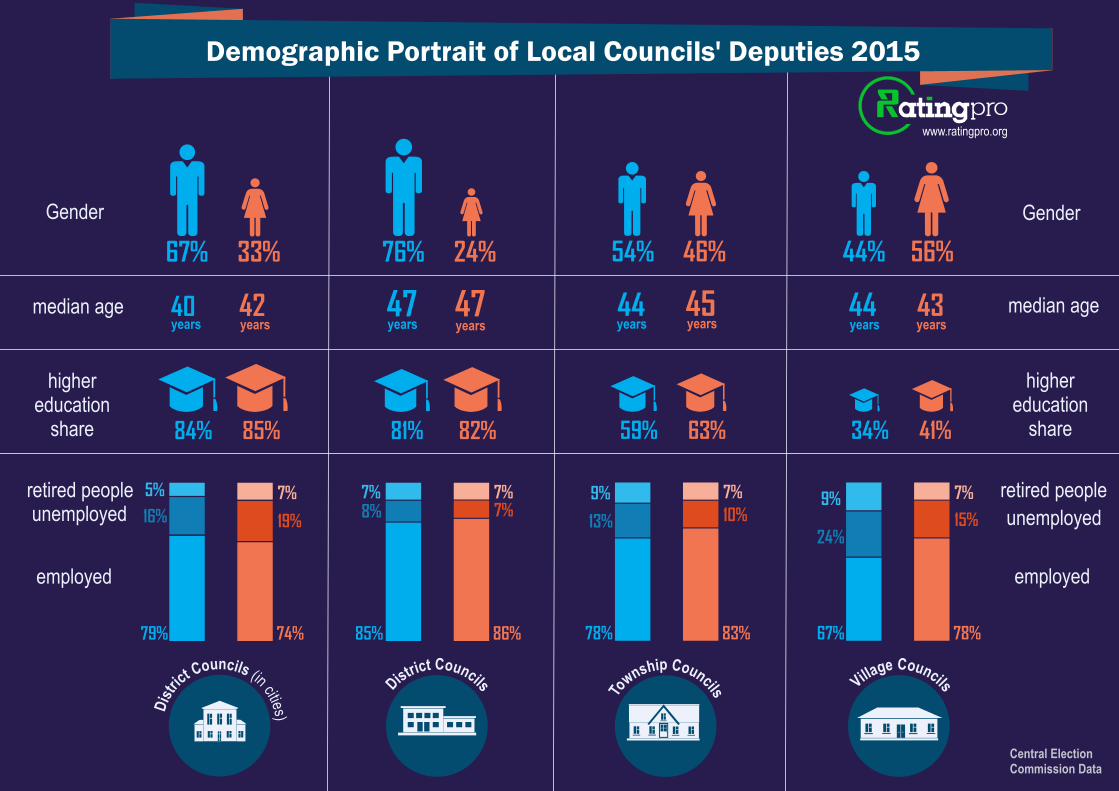
· The higher the council, the higher the level of deputies’ education is. 94-95% of the elected to the regional councils, Kyiv city council and city councils of regional centers have higher education. In the councils of regional significance cities the share makes 86%, in the district councils – 81%, in the city councils of district significance cities – 78%, in the township councils – 61%. However, the number of deputies with higher education in the village councils makes only 38%. A half of the deputies to the village councils have either secondary or vocational education. Whereas, in the vast majority of local councils, female deputies have a higher level of education than male deputies do. For example, at the level of regional councils the share of deputies with higher education among women is 98% compared to 95% - among the male deputies; at the level of village councils – 41% compared to 34% respectively. The largest number of deputies with higher education is represented in Samopomich, Nash Kray, and Petro Poroshenko Bloc "Solidarity".
· The vast majority (76%) of local deputies have a permanent job, retired – 7%, temporarily unemployed – 17%. The highest number of the unemployed is among the deputies of village councils: without permanent job – every fifth electee, of which every fourth is a male deputy and only every sixth is a female deputy. In the township councils the temporarily unemployed make 12%, in councils of district significance cities – 10%, district councils and the regional significance cities – 8%, regional councils and regional centers councils – 7%. Most employed belong to Petro Poroshenko Bloc "Solidarity", Agrarian Party of Ukraine, and Samopomich; unemployed – to Svoboda, Radical party of Oleg Lyashko, and UKROP, retired – to Opposition Bloc.
· The youngest deputies are represented in the city councils of regional centers – the median age is 41; the oldest members – in regional and district councils – 46 years old. The youngest members of the parties belong to Samopomich, Svoboda, UKROP, and Radical party of Oleg Lyashko. The oldest – to the Agrarian Party of Ukraine, Vidrodzhennya, and Nash Kray.
Igor Tyshchenko Chairman of “Rating Pro”,
Founder of Sociological Group “Rating”
Liubomyr Mysiv Political Expert of “Rating Pro”, PhD in Public Administration
www.ratingpro.org

Verkhovna Rada
2014
2012 50%
50%
Regional Councils
2015
2010 50%
50%
City Councils
2015
2010 50%
50%
District Councils
2015
2010 50%
50%
Township Councils
2015
2010 50%
50%
Village Councils
2015
2010 50%
50%
11%
10%
15%
12%
29%
28%
24%
23%
46%
46%
56%
51%
Women's Representation in Local Councils at All Levels (in trend)
www.ratingpro.org
Central Election Commission Data
17%
11%
17%
11%13%
14% 21%
13%11%
11%
14%
12%
15% 15% 19%
18%
15%
11%
14%
10%
14%
19%
Regional Councils
21%
16%
20%
18%16%
30% 24%
21%21%
25%
28%
24%
25%
18%
26% 25%
27%
21%
31%
29%
21%
21%
29%
28%
35%
City Councils
38%
30%
31%
21%20%
28% 29%
26%27%
33%
32%
28%
29% 32% 38%
40%
34%
32%
44%
39%
41%
32%
35%
44%
25%
27%
17%
17%18%
22% 23%
19%26%
22%
21%
22%
24% 23% 26%
28%
29%
30%
30%
25%
26%
22%
30%
33%
District Councils
61%
57%
42%
40%43%
52% 58%
56%61%
55%
42%
60%
55% 55% 60%
59%
60%
65%
67%
54%
65%
63%
67%
66%
Village Councils
51%
43%
33%
27%41%
33% 44%
39%48%
40%
26%
42%
38% 47% 47%
55%
55%
55%
53%
47%
51%
50%
60%
61%
Township Councils
15%
24%
56%
46%
regional centers, cities of regional significance
City Councils 32%cities of district significance
24%
www.ratingpro.org
11% 21%
16% 35%
20% 44%
14% 33%
26% 61%
40% 67%
Women's Representation in Local Councils by Regions 2015
28.6 th. deputies elected on the basis of the proportional system
129.8 th. deputies elected on the basis of the majority system
Central Election Commission Data

Gender Quotas (30 %) Adherence Analysis and its Effectiveness
www.ratingpro.org
female share in the list of candidates
female share in the list of the elected deputies
24%
32%
26%
19%
15%
36%
39%
36%
33%
30%
21%
22%
22%
22%
25%
26%
26%
28%
28%
30%
30%
31%
33%
34%
32%
35%
35%
36%
37%
39%
38%
39%
САМОПО МІЧО Б Є ДН А НН Я
УКРАЇНСЬКЕ ОБ’ЄДНАННЯ ПАТРІОТІВ
ГРОМАДЯНСЬКАПОЗИЦІЯ
АГРАРНА ПАРТІЯ УКРАЇНИ
Батьківщина
Parties with 400 or more mandates (proportional basis)
Central Election Commission DataStructure analysis of candidates and deputies to the local councils 2015 (proportional basis)
Opposition bloc
Nash Kray
Vidrodzhennya
Batkivshchyna
Samopomich
UKROP
Radical party of Oleg Lyashko
Petro Poroshenko Bloc "Solidarity"
Hromadianska Pozitsiya
Svoboda
Agrarian Party of Ukraine
85%
46 years
15%
years44
95% 98%
91%
3%6%
88%
2%10%
81%
41 years
19%
years41
95% 95%
91%
2%7%
91%
2%7%
74%
44 years
26%
years46
86% 87%
87%
5%8%
86%
6%8%
68%
44 years
32%
years45
77% 81%
81%
8%
11%
83%
8%9%
unemployed retired people
employed
higher education
share
median age
Gender
unemployed retired people
employed
higher education
share
median age
www.ratingpro.org
Demographic Portrait of Local Councils' Deputies 2015
Central Election Commission Data
Gender
67%
40 years
33%
years42
84% 85%
79%
5%
16%
74%
7%
19%
76%
47 years
24%
years47
81% 82%
85%
7%8%
86%
7%7%
54%
44 years
46%
years45
59% 63%
78%
9%
13%
83%
7%
10%
44%
44 years
56%
years43
34% 41%
67%
9%
24%
78%
7%
15%unemployed retired people
employed
higher education
share
median age
Gender
unemployed
retired people
employed
higher education
share
median age
Gender
www.ratingpro.org
Central Election Commission Data
Demographic Portrait of Local Councils' Deputies 2015

www.ratingpro.org
Демографічна структура депутатського складу партій
www.ratingpro.org
Demographic Portrait of Local Councils' Deputies in terms of Parties
49 years
90%
higher education
share
median age
higher education
share
median age48 years
87%
48 years
87%
47 years
85%
47 years
85%
46 years
84%
46 years
83%
43 years
80%
43 years
78%
42 years
74%
40 years
74%
92% 92% 91% 88% 85% 85% 84% 80% 79% 78% 75%
5% 4% 7% 6% 7% 9% 8% 9% 15% 16% 18%
3% 4% 2% 6% 8% 6% 8% 11% 6% 7% 7%
САМОПО МІЧО Б Є ДН А НН Я
УКРАЇНСЬКЕ ОБ’ЄДНАННЯ ПАТРІОТІВГРОМАДЯНСЬКА
ПОЗИЦІЯАГРАРНА ПАРТІЯ УКРАЇНИ
Батьківщина
САМОПО МІЧО Б Є ДН А НН Я
ГРОМАДЯНСЬКАПОЗИЦІЯ
АГРАРНА ПАРТІЯ УКРАЇНИ
Батьківщина
УКРАЇНСЬКЕ ОБ’ЄДНАННЯ ПАТРІОТІВ
САМОПО МІЧО Б Є ДН А НН Я
ГРОМАДЯНСЬКАПОЗИЦІЯ
АГРАРНА ПАРТІЯ УКРАЇНИ Батьківщина УКРАЇНСЬКЕ ОБ’ЄДНАННЯ ПАТРІОТІВ
unemployed retired people
employed
unemployed retired people
employed
Central Election Commission DataStructure analysis of deputies to the local councils 2015 (proportional basis)