demographic and health consequences of c...
TRANSCRIPT

WORLD DEVELOPMENT REPORT 2011 BACKGROUND PAPER
DEMOGRAPHIC AND HEALTH CONSEQUENCES OF
CIVIL CONFLICT
Debarati Guha-Sapir†, Olivia D’Aoust
†
October 2010
The findings, interpretations, and conclusions expressed in this paper are entirely those of the authors. They do not necessarily represent the views of the World Development Report 2011 team, the World Bank and its affiliated organizations, or those of the Executive Directors of the World Bank or the governments they represent.
We thank the UK Department for International Development and the Canadian International Development Agency for the financial support of the complex emergency database project. We are grateful to Gary Milante, Femke Vos, Beth Daponte, Elisabeth David, Martin David and anonymous referees for providing comments on drafts of this paper. Any opinions, findings, and conclusions or recommendations expressed in this publication are those of the authors. †Centre for Research on the Epidemiology of Disasters, Université catholique de Louvain, School of Public
Health, Brussels, Belgium

Abstract
After a steady decline since the end of the Cold War, the number of ongoing civil conflicts in poor countries increased for the first time, to 30, in 2007, according to the Uppsala Conflict Data Programme (UCDP) (Gleditsch et al., 2002). Within countries, the scale and the intensity of civil conflict differ, together with the needs of the affected population. These conflicts subject the civilian population, including women and children, to arbitrary violence and to systematic and long-term deprivations of food and public health services, except as provided by humanitarian organisations. The size and profile of this population is not well known, and neither are essential characteristics-such as demographic data, and health and nutritional status-that help set priorities for interventions both during and after the conflict. The main premise of this paper is that the well-being of individuals and families in conflict and post-conflict situations is a key condition for sustainable peace and long-term development. Factors such as infant health, maternal care, food and nutrition, and basic sanitation are among the top priorities of the affected people. Development programming for post-conflict countries should be firmly rooted in an accurate and timely evidence base to justify the priorities selected.

It is not the peace that brings the food, it is the food that brings the peace

Introduction
Communities amid civil wars often exist in extreme destitution, as public ser-
vices are rarely effective or even functional. Refugees and displaced populations
may also be excluded from available services in the host community. Persistent
and widespread insecurity inevitably results in a breakdown of health services ulti-
mately leading to the degradation of the health status of affected populations. In
many cases, government disinterest in the welfare of these populations further ag-
gravates the decline of their condition.
Definitions of civil war vary widely, differing among international law, political
science, international relations and economics, each overlapping but not necessarily
comparable. Epidemiologists, who have recently taken on the challenge of measur-
ing the human impact of conflicts, define the phenomenon strictly according to its
effects on non-combatant or civilian populations. A recent quote from New York
Times describes a situation that a public health community would consider a situ-
ation of civil conflict.
“You need to let the world know there’s a civil war here in Iraq,” said Adel
Ibrahim, 44, a sheik in the Subiah tribe. “It’s a crushing civil war. Mortars kill chil-
dren in our neighborhoods. We’re afraid to travel anywhere because we’ll be killed in
buses. We don’t know who our enemy is and who our friend is.” (Edward Wong,
“A Matter of Definition: What Makes a Civil War, and Who Declares It So?”, The
New York Times, 26 November 2006.)
Apart from the political, economic, or human characteristics that define the type
and extent of their impacts, civil conflicts are also unique because of their spatial
and temporal characteristics. In some cases, such as Somalia, entire countries are
engulfed by civil conflict. In others, violent conflict can rage in selected areas while
the rest of the country carries on in relative stability (as in Kenya). Many conflicts
have carried on for years or even decades with sporadic and violent outbursts, creat-
1

ing a new order of society into which generations are born and bred in “normalised”
conditions. Sustainable peaceful settlements and resumption of normal development
are rare in these circumstances (Collier et al., 2003; Collier, 2007).
This paper is built on the premise that the health and well-being of a community
is a key precondition for sustainable peace and long-term development. Unless the
resident population sees it as in their interest to withdraw support from guerilla
or rebel fighters or resist hostilities, stability of any sort will be short-lived. Peace
must bring tangible and visible dividends. Also, in post-conflict or unstable coun-
tries where major demographic and socio-economic changes have occurred, decisions
need a strong evidence base to justify selection of programme priorities. The costs of
failure are high and the opportunities for redress are low. Such evidence will require
objective and timely data for the post-conflict development policies to be relevant
and effective. In these fragile situations, policies that rely on standard development
models risk missing the target and failing to maintain peace.
This paper examines actionable demographic and health factors that drive social
stability at community levels. Other factors such as socio-economic, political, or
cultural changes in conflict settings are beyond the scope of this paper.
The first chapter presents the available data on the demographic consequences
of conflict. In this chapter, we examine the recent research on conflict-related
deaths, including the methodological debates on direct mortality through violence
and trauma, and on indirect mortality as a result of infrastructure breakdown and
the collapse of primary health care. We also discuss changes in fertility behaviors,
both as a means to enable generational survival and as a result of high child mortality.
The second chapter covers the impact of conflicts on the health status of affected
populations as a key factor that jeopardises sustainable peace and development, as
well as the risk factors that define vulnerability.
The third chapter addresses data challenges and the monitoring of Millennium
Development Goals (MDGs) in conflict-affected countries. Chapter four concludes
and presents policy recommendations.
2

Chapter 1
Demographic consequences of
conflict
In 2003, the International Union for the Scientific Study of Population (IUSSP)
organised a working group on the demography of conflict and violence. It was an
early look by demographers, political scientists, and other academics at how and why
people die in conflicts (Brunborg and Urdal, 2005; Brunborg and Tabeau, 2005).
Since then, many studies have documented both the demographic causes-ethnic
fractionalisation, social inequalities, youth bulges, migration-and consequences of
conflict-forced migration and changes in fertility behaviors and mortality (Homer-
Dixon, 1991; Urdal, 2004; Neupert and Prum, 2006; de Walque, 2005; Heuveline,
1998; Verwimp and Bavel, 2005). More recently, epidemiologists have taken an ac-
tive interest in conflict-related mortality, especially in relation to causes of death.
In this chapter, we summarise the discussion on the consequences of conflict from
an epidemiologic perspective through two main demographic pathways: mortality
and fertility. Migration will be studied in the section discussing forced displacement.
1.1 Mortality in conflict: a demographic phenom-
ena
The ultimate human consequence of conflict is death, or, on a population level,
mortality. This may be further distinguished between direct combat deaths and
indirect deaths caused by the consequent disease, hunger, or lack of care. These are
commonly referred to as excess deaths, that is, those deaths that would not have
3

occurred had there not been a conflict1. Indirect deaths are of course difficult to
estimate, leading to intense debate around the approximation of death tolls due to
conflicts in Iraq, the Democratic Republic of Congo, Darfur, Bosnia, or Cambodia
(Heuveline, 1998; Degomme and Guha-Sapir, 2010; Coghlan et al., 2006; Tabeau
and Bijak, 2005; Burnham et al., 2006; Lambert and Lohle-Tart, 2008). Indeed,
estimating excess mortality will remain a controversial and sensitive exercise, not
only because of the variety of data sources and methodologies2 used but also due
to the major advocacy or legal implications of the death estimates. Prosecutions
in international courts of justice or release of humanitarian funds may depend on
studies that count up or estimate how many non-combatants have died due to a civil
war. Although precise point estimates of the number of dead will inevitably generate
debate, few will disagree that armed conflict leaves behind significant demographic
shifts and gaps among combat-age men or across the entire population. Patterns of
death at community levels are discussed further in section 2.1.
The genocides in Rwanda and Cambodia are good examples of the highly visible
demographic deficit of combat-aged men after civil war. The shape of the Cam-
bodian pyramid clearly shows that in 1979 most of the deaths were concentrated
in people ages 20 to 40, indicating violence as the main cause of mortality (Figure
1.1(a)). This deficit has led to “missing males” moving up the age ladder of the
population distribution as years pass.
Figure 1.1(b) plots the masculinity ratio by age group for Cambodia (1998 cen-
sus). When compared to a counterfactual from 1965, a significant deficit among the
males in the 20- to 40-year-old age group is evident in 1979, at the end of the Khmer
Rouge period.
A closer look at the patterns of mortality in Cambodia provides lessons for the
study of more recent conflicts. Heuveline (1998) estimated that there were 2.52 mil-
lion deaths from 1970 to 1979, ranging from a low estimate of 1.17 million to a high
estimate of 3.42 million. The main uncertainty in his estimate was related to migra-
tion, as data on population movements were not available. Mortality increased from
1974 until the early 1980s, a period characterised by intense violence and regime
1The excess deaths are given by the difference between an observed mortality rate and a baselinemortality rate (expected in a non-crisis situation) multiplied by the population at risk and the timeperiod.
2Many data sources and methods exist that are aimed at estimating mortality in crises: pop-ulation projections from censuses, retrospective surveys, prospective surveillance, forensic investi-gation, multiple systems estimation, and media reports (Ratnayake et al., 2009).
4

Figure 1.1: Male deficit following the Khmer Rouge Genocide in Cambodia(1975-1979)
(a) Projected Population Pyramid, Cambodia, 2010 (b) Masculinity Ratio, Cambodia, 1998 (inthousands)
Source: IDB (2010)
shift (de Walque, 2005). The generations that bore the brunt of the mortality were
those born between 1940 and 1959, who would have been between 20 to 40 years
of age. Both Heuveline (1998) and de Walque (2005) agree that the probability of
dying was significantly higher among men at those ages. The mortality differential
resulted in important discontinuities in the population distribution of Cambodia,
which are still visible today in the country’s population pyramid (Figure 1.1(a)).
These early studies of the demographic impact of conflict revealed patterns that
have since been observed elsewhere. A demographic deficit of men is also observed
in Darfur; its population pyramids can be created from the 2005 World Health Orga-
nization (WHO) survey (Figure 1.2). The survey was conducted in the three Darfur
states, dividing the population in three groups according to their location type and
population status: Internally Displaced Persons (IDPs) living inside camps, IDPs
living outside camps, and the resident population. The population pyramids in all
three Darfur states show significant deficits of males in the 15-49 age group (WHO,
2005).
The missing males in these populations are only partly attributable to excess
deaths. Mass migration for employment-even as mercenaries-is also likely to be a
5

Figure 1.2: Age, sex disparities among populations exposed to conflict in Darfur(2005)
(a) Greater Darfur (b) West Darfur
(c) South Darfur (d) North Darfur
Source: WHO (2005)
significant contributor to this gap. In the case of Darfur, the data from a previous
Multiple Indicator Cluster Survey (MICS) in 2000 indicate that there was already
a deficit of men before the onset of the conflict, probably due to emigration further
aggravated by the breakout of hostilities.
Finally, in contrast to the examples above, the Democratic Republic of Congo’s
population pyramid (Figure 1.3) presents an evenly dispersed profile: high mortal-
ity among the conflict-affected population was mainly due to extremely poor living
conditions and high morbidity which caused excess deaths in all age and sex groups.
Targeted violence against men was less common and everyone faced higher risks of
mortality. The situation in the Democratic Republic of Congo is also controversial
as the conditions leading to excess deaths in that country can be attributed both to
6

the current conflict and to the past Mobutu regime, where desperate living condi-
tions were the main cause of excess mortality at all ages.
Figure 1.3: Normal population pyramid due to equal distribution of excessmortality in DR Congo (2010)
Source: IDB (2010)
Identification and causes of unusual deficits in specific age-sex groups are im-
portant pieces of information for policy and programme development. In the first
instance, it is important to establish if there is an age-sex deficit. In the examples
cited above, the deficits are often among combat-aged men and whether the deficit
of males is due to death or migration, the consequence to families is important.
Deficits may result in an increase in women- or child-headed households (Bruck and
Schindler, 2009). Family revenues decline in exiguous circumstances as sons and
husbands die or leave, and households that were faring well in the last census or
survey may have slipped to the margins after the war. In exceptionally fragile situ-
ations, these households-often hard to identify-require targeted action.
In the second instance, the cause of the deficit can be important for policy mak-
ing. Interventions in the case of mass migration are different from those if the deficit
is due to mass deaths. In poor but peaceful settings, remittances can offset the rev-
enue loss from migration; in conflict-affected regions, remittance channels may not
be functional. If most of the loss is due to deaths, then social problems related to
inheritances and the place of widows can develop. Moreover, labour force availabil-
ity or the establishment of electoral lists are often demographic projections based
on mortality estimates.
7

Information on the cause of gaps in population pyramids is therefore key for
providing services that are appropriate for that community, given its history.
1.2 Fertility
The previous section reviewed the impact of war on mortality, which in many
circumstances changes the population pyramid significantly from its normal distri-
bution. Fertility differs in its dynamics from mortality as it is partly determined by
individual choices. The implications of changed fertility patterns for post-conflict
development policies are important for assessing the health of the population but
critical for short-term social stabilisation.
Many of the poorest countries have high fertility rates but the highest are con-
sistently among the conflict countries in Sub-Saharan Africa, where neither fertility
behaviour has not changed significantly since 2000. On a longer term, the conflict
and fragile state countries do not share the drop in fertility experienced in most
countries in the last fifty years (Figure 1.4).
Plotting death rates against birth rates for all countries illustrates that conflict-
affected countries are outliers among all developing countries even by these crude
indicators (Figure 1.5).
Studies on fertility among conflict-affected populations by and large emphasise
the complexity of reproductive responses and behaviours to violence and adversity,
including both biological and socio-economic factors. They show that fertility pat-
terns are not stable through protracted conflicts and change significantly during the
course of the war.
On the one hand, fertility rates have been observed to decrease due to conflict-
related insecurity: the general increase in violence, psychological stress, wealth un-
certainty, and poor health. These factors determine age at marriage, the frequency
of sexual intercourse, and labor migration, all of which can change fertility to reduce
the number of children per woman (Lindstrom and Berhanu, 1999; Agadjanian and
Prata, 2002; Blanc, 2004).
On the other hand, conflicts and ensuing massacres can also boost fertility,
8

Figure 1.4: High fertility in conflict-affected countries and fragile states
●
●
●●
●
●
●●
● ●●
●
●● ● ●
● ● ●●● ●
●●
●●● ●● ● ●
●●● ●●●
●
●●●●● ●● ●●●
●●●● ●
●● ● ●
● ●● ●●●
●●● ●● ● ●
● ●● ●●● ●● ● ●● ●●
●●● ● ●●●● ●●●●
●● ● ●●● ● ●● ●●● ● ●● ●
●● ●● ● ●
● ● ●● ●●●●●●
● ●●
●
●●
●
1 2 3 4 5 6 7 8
0.0
0.2
0.4
0.6
0.8
Fertility Rate (2008)
Per
cent
age
decr
ease
in fe
rtilit
y (1
960−
2008
)
1 2 3 4 5 6 7 8
0.0
0.2
0.4
0.6
0.8
1 2 3 4 5 6 7 8
0.0
0.2
0.4
0.6
0.8
1 2 3 4 5 6 7 8
0.0
0.2
0.4
0.6
0.8
DR Congo NigerChad
MaliGuinea−BissauSierra Leone
UgandaSomalia
Afghanistan
LiberiaAngola
NigeriaCentral African Rep.
Ethiopia
Guinea
Average fertility rate
●
Conflict Affected, SSAConflict Affected, not SSAFragile state (excl. conflict affected)All other countries
Note: Timor Leste is not represented in this chart as it is the onlycountry for which fertility has increased compared to 1960 (2%).
Source: World Development Indicators (2009)
through what is sometimes called an “insurance effect”. As uncertainty about the
future increases, having more children secures the preservation of a minimum level
of income. It acts as a coping strategy against shocks and ensures financial support
in old age (Verwimp and Bavel, 2005; Agadjanian and Prata, 2002). As fertility
transition is generally explained, high fertility compensates for the increased proba-
bility of losing a child in protracted conflict conditions where child mortality is high
(Kalemli-Ozcan, 2002).
Although hunger and malnutrition are inescapable conditions of living in conflict
settings, these do not necessarily lead to lowered fertility. Indeed, malnutrition is
observed to have a minor effect, if any, on fecundity (reproductive capacity) and fer-
tility (actual reproduction) of women. Reproductive capacity can actually increase
as sexual receptivity increases in females with chronic, moderate malnutrition. Stud-
ies of starvation during the Dutch famines of World War II and in other famine-like
conditions have shown increased fertility among underfed females in order to re-
9

Figure 1.5: Highest birth and death rates in conflict-affected countries
●
●
●
●
●
●
●
●
●
●
●
●
●
●
●
●
●
●
●
●
●●
●
●
●
●
●
●●●
●
●
●
●●
●●
●
●
●●
●
●
●
●
●●●
●●●
●
●
●
●
●
●●
●●
●
●●
●
●
●●●
●
●
●
●●●
●
●
●
●
●●
●●
●
●●
●
●
●
●
●
●●●
●●
●
●
●●●
●
●
●●●●
●
●
●●
●●●
●●●
●●
●●●
●●
●
●●
●●
●●●
●
●●
●
●
●
●
●
●
●●●
●
●
●
0 10 20 30 40 50 60
05
1015
20
Birth rate (/1,000/year)
Dea
th ra
te(/1
,000
/yea
r)
0 10 20 30 40 50 60
05
1015
20
0 10 20 30 40 50 60
05
1015
20
0 10 20 30 40 50 60
05
1015
20
●
Conflict Affected, SSAConflict Affected, not SSAFragile state (excl. conflict affected)All other countries
Afghanistan
ChadDR Congo
Angola
Guinea−Bissau
CAR
SomaliaMaliNigeriaSierra Leone
Zimbabwe
Niger
RwandaBurundi
Uganda
Source: World Development Indicators (2009)
plenish the group before death. However, increases in fertility linked to decreased
nutritional status have limits: if nutritional status falls below a critical level, fer-
tility will decline (Bongaarts, 1980). There are not many studies exploring fertility
responses in situations of genocides, massacres, or conflicts. But, a population-based
study among women refugees who escaped the Rwandan genocide showed higher fer-
tility rates than their non-refugee counterparts (Verwimp and Bavel, 2005). More
studies should be done to establish these fertility responses to conflicts and insecurity.
Changes in fertility patterns also occur for structural reasons. Reduced or ab-
sence of emergency reproductive health services, minimum pediatric care or access
to family planning also influences fertility behaviour.
The absence of such services increases maternal mortality in conflict settings
(Figure 1.6), which in turn engenders higher mortality among young children. Fer-
tility also increases as a measure of replacement when lack of pediatric services such
as immunisation or supplementary feeding leads to high neonatal mortality. Al-
though detailed studies on these have not been undertaken yet, we observe from the
WHO statistics, all but one of the 15 countries worldwide with the highest neonatal
mortality have recently experienced, or are in the midst of, a civil conflict. The
10

worst cases in this category are Liberia, Cote d’Ivoire, Iraq, and Afghanistan with
neonatal mortality rates above 60 deaths per 1,000 live births in 2005.
The classic demographic cycle of the 18th century, where lack of health services
led to high child mortality which in turn led to high birth rates, once again becomes
the reality in conflict settings.
Figure 1.6: Maternal Mortality: comparative ratios across regions and between
conflict and non conflict-affected countries
Africa
Asia
Centraland
SouthAmerica
Europeand
NorthAmerica
Oceania
Maternal mortality ratio (/100,000 livebirths)
0 200 400 600 800 1000
Peaceful countriesConflict−affected countries
Nr. of countries
Peace Conflict
Africa 32 20
Asia 28 19
Central and South America 35 3
Europe and North America 39 1
Oceania 15 0
Source: World Development Indicators (2009)
In general, understanding fertility shifts among a conflict-affected population
provides key information for reproductive health needs. For example, breakdown in
even minimal reproductive services severely affect women’s ability to cope with daily
challenges, and should be a programme priority in conflict settings. High fertility
rates lead to a very rapid increase in the youngest age groups, requiring clear target-
ing of development programmes. A case in point is expected schooling needs, which
depend on accurate estimations of future age distributions. Along with mortality
patterns, accuracy of electoral lists also relies on an understanding of current and
future fertility rates.
Peaks and troughs in fertility patterns, common in conflict-affected populations,
have wide ranging policy implications for long-term stability. Accurate understand-
ing of fertility behaviour allows policies to be targeted toward the right age groups
and their needs. It should therefore be a key consideration in planning development
programmes for populations who have been exposed to protracted hostilities.
11

Chapter 2
Profiling the vulnerable:
identification of risk factors
Armed conflict directly affects the health and nutritional status of individuals in
ways that eventually lead to death and disability. Civil wars are often defined on
the basis of combat or violent deaths; excess or indirect deaths remain uncounted.
Methodological challenges of assessing the indirect impact of conflict on populations-
such as increased morbidity, mortality, or exceptional drops in nutritional status-are
more likely the obstacles to such assessments than conceptual disagreements. Figure
2.1 sketches the main pathways by which conflict can affect the lives and health of
civilians and highlights the areas that are discussed in this chapter.
Recently there has been lively debate among epidemiologists on the appropri-
ateness of existing techniques to attribute mortality to conflicts and therefore to
identify risks and vulnerabilities. The conflicts in Darfur, Iraq, and the Democratic
Republic of Congo are the focus of some of the better-known debates on how to
assess mortality in these circumstances (Human Security Report, 2010; Degomme
and Guha-Sapir, 2010; Coghlan et al., 2006; Burnham et al., 2006).
This recent preoccupation with better data and statistics from conflict-affected
populations stems from the priority given to developing policy based on evidence
rather than on assumptions. In the case of conflict-affected countries, post-conflict
policies can draw only partially from models or assumptions from other non-conflict
but economically similar countries.
As vital registration or other systematic reporting systems are dysfunctional in
conflict areas, these regions are black holes of statistics where there is little or no
12
knowledge of most human development indicators. Sample surveys provide the only
source of information. The most widely known of these are the nationwide De-
mographic and Health Surveys 1 (DHS), the Multiple Indicator Cluster Surveys2
(MICS-UNICEF) and the Living Standards Measurement Study Surveys3 (LSMS)
rich sources of information and baseline statistics for many countries where data
reporting is poor. As data sources for conflict countries, DHS or MICS can be prob-
lematic for two reasons. First, nationwide surveys often drop the insecure areas,
mentioning that particular provinces were not included due to insecurity. Second,
most do not include displaced persons or refugees in their surveys.
Smaller-scale surveys done by operational agencies, on the other hand, are a
fertile source of data that are seriously underused by development programmers
(Setel et al., 2007). These surveys produce increasingly better quality data on the
health, nutrition, and mortality status of conflict-affected populations. Use of stan-
dard methods and definitions are used widely, including the one proposed by the
Standard Monitoring and Assessment in Relief and Transition (SMART) initiative
(SMART, 2010). Field organisation are also systematically reporting methodological
details of their surveys which allow global repositories like the Complex Emergency
database4 to validate data and assess survey quality. They can provide invaluable
evidence for policy making (Degomme and Guha-Sapir, 2007). Typically, they focus
on mortality, morbidity, and nutrition, and more occasionally on livelihood issues.
These surveys provide insights into the reality of the direct impact of the conflict on
affected populations.
In this chapter, we will use data from the CE-DAT Database to examine the
impact of conflicts on the health and well-being of communities.
1See http://www.measuredhs.com/ for country survey reports and datasets.2See http://www.childinfo.org/mics.html3See http://www.worldbank.org/lsms/4The Complex Emergency Database (CE-DAT), developed and run by the Centre of Research
on the Epidemiology of Disasters (CRED), is an international initiative to monitor and evaluate thehealth status of populations affected by complex emergencies. The aim was to develop a databaseof mortality and acute malnutrition rates, the most commonly used public health indicators ofthe severity of a humanitarian crisis. CE-DAT currently compiles more than 2,500 epidemiologicalsurveys from 51 countries. Field agencies use mortality and nutrition indicators to identify andmeasure the severity of needs in order to prioritize human and financial resources. These indicatorshave been shown to be useful in monitoring the extent to which the relief system is meeting theneeds of vulnerable populations and thus the overall impact and effectiveness of the relief system.
13
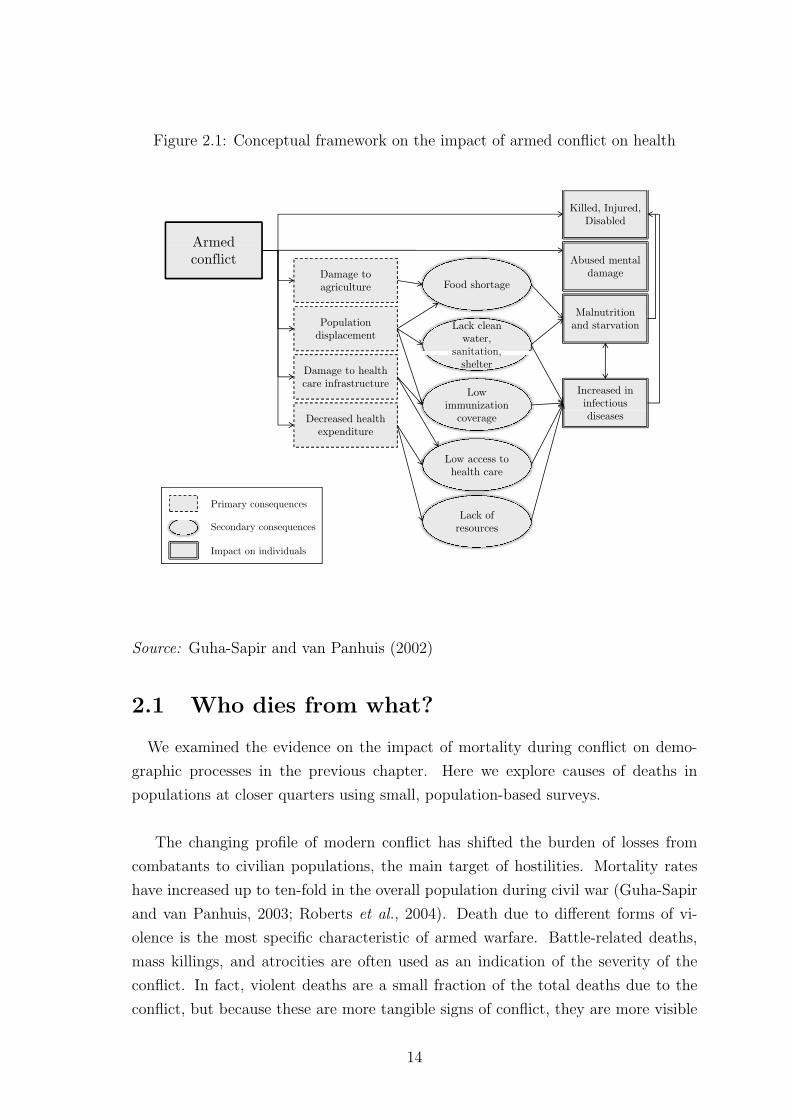
Figure 2.1: Conceptual framework on the impact of armed conflict on health
Armed
Killed, Injured, Disabled
Armed conflict
Damage to agriculture Food shortage
Abused mental damage
Population displacement
Lack clean water,
sanitation,
Malnutrition and starvation
Damage to health care infrastructure
,shelter
Low immunization
Increased in infectious
Decreased health expenditure
coverage
Low access to
diseases
health care
Lack of Primary consequences
resources
Impact on individuals
Secondary consequences
Source: Guha-Sapir and van Panhuis (2002)
2.1 Who dies from what?
We examined the evidence on the impact of mortality during conflict on demo-
graphic processes in the previous chapter. Here we explore causes of deaths in
populations at closer quarters using small, population-based surveys.
The changing profile of modern conflict has shifted the burden of losses from
combatants to civilian populations, the main target of hostilities. Mortality rates
have increased up to ten-fold in the overall population during civil war (Guha-Sapir
and van Panhuis, 2003; Roberts et al., 2004). Death due to different forms of vi-
olence is the most specific characteristic of armed warfare. Battle-related deaths,
mass killings, and atrocities are often used as an indication of the severity of the
conflict. In fact, violent deaths are a small fraction of the total deaths due to the
conflict, but because these are more tangible signs of conflict, they are more visible
14

to media and policy makers alike.
In armed civil war, violent deaths tend to be elevated at the start of the conflict
during the intense fighting phase, and then quickly decrease, giving way to disease
and malnutrition related deaths. (Table 2.1, Figure 2.2).
Table 2.1: Violence as a minor cause of mortality
Conflict theatreViolent deaths as percent-age of total excess deaths(%)
Northern Uganda, 2005 15Democratic Republic of Congo, 1998-2002
< 10
Congo-Brazzaville, Pool Region, 2003 17Burundi, 2002-2003 22Sierra Leone, 1991-2002 6Darfur, Sudan, 2003-2005 30South Sudan, 1999-2005 < 10Angola, 1975-2002 11East Timor, 1974-1999 18Iraq, 1991 War 32-37
Source: Geneva Declaration (2008)
In Darfur, Degomme and Guha-Sapir (2010) estimated that, although violence
was a much cited cause of death in 2004, 80% of the 298,271 estimated deaths (95%
CI 178,258-461,520) were due to disease during the period 2004-2008.
By far, children experience more of the burden of conflict-related deaths. Diar-
rhoeal diseases and acute respiratory infections are the main causes of death among
children in conflicts, just as they are in peaceful poor communities. On many oc-
casions, nonviolent deaths may also consist of other infectious diseases, linked to
epidemics that often remain unidentified until too late. Civil conflict leads to break-
downs in vaccination programs, which plays havoc among children as a lack of min-
imal vaccination coverage for herd immunity5 aggravates death tolls. The frequent
incidences of measles outbreaks in refugee camps and among IDP populations are
often a result of measles vaccination coverage below the minimum 80% required for
5Herd immunity describes a type of immunity that occurs when the vaccination of a portion ofthe population (or herd) provides protection to unprotected individuals.
15

Figure 2.2: Violent vs disease-related mortality in Darfur, Sudan(Sept. 2003 - Dec. 2008)
Source: Degomme and Guha-Sapir (2010)
outbreak protection.
In addition, food system collapse severely affects maternal health leading to
undernutrition during pregnancy and lactation and, as a consequence, increased
neonatal deaths. The lack of government interest in conflict-affected regions leads
to a breakdown of the health infrastructure, which quickly loses key equipment and
supplies. Qualified personnel also leave the region creating a human resource chal-
lenge for service provision. In Iraq, for example, of the 34,000 registered doctors in
1990, 20,000 doctors have left since 2003. About 2,500 doctors and nurse were killed
and some kidnapped in this period6 (ICRC, 2008).
Nonviolent mortality, especially among children, is a very sensitive indicator of
the overall well-being of the community and is therefore chosen as an MDG indicator.
Child mortality is also commonly used in situations of high insecurity to maintain a
pulse on community welfare. Primary material to calculate mortality rates7 is often
6Unfortunately, lack of data impedes our ability to compare this loss to a measure of the numberof international doctors that have been sent to Iraq to fill the vacuum.
7A mortality rate is the number of deaths in a given time period divided by the amount of
16

provided by small surveys done on populations living in conflict, about whom little
is known. These rates allow for appropriate comparisons (see for example Figure
2.3), monitoring trends in the populations and assessing whether the population is
faring better or worse compared to a previous period or to neighbouring regions.
These rates will reveal the severity of the situation, assess the impact of ongoing
programmes, or provide baselines against which to measure performance.
Figure 2.3: Disparity of mortality rates across regions within conflict settings
Angola − Lunda Norte (2006)
DR Congo − Equateur (2007)
DR Congo − Katanga (2008)
DR Congo − Kinshasa (2007)
DR Congo − North Kivu (2008)
Ethiopia − Oromia (2008)
Ethiopia − SNNP (2008)
Kenya − Nairobi (2008)
Kenya − North Eastern (2009)
Kenya − Rift Valley (2008)
Somalia − Bari (2004)
Somalia − Gedo (2008)
Somalia − Middle Shabelle (2008)
Sudan − North Darfur (2006)
Sudan − Upper Nile (2008)
Uganda − Katawik (2007) ProvincialNational
Crude mortality (/1,000 per year)
0 10 20 30 40 50 60 70
National mortality rates are national estimates provided by the World Development Indica-tors. Provincial mortality rates are average mortality rates by province and year, as reportedin the Complex Emergency Database.
Source: CE-DAT (2010); World Development Indicators (2009)
There are two important caveats in the use of mortality rates. First of all, mor-
tality is a late indicator: by the time the mortality rates spike, the conditions are
likely to be serious and redress can be difficult or impossible. As mortality and
hunger rises, internal displacement will begin, accompanied by renewed turbulence.
time the population is exposed to the risk during the time period. Two main indicators, generallyexpressed in deaths/10,000/day over a specific recall period in emergency situations, are the under-5 mortality rate (U5MR), assessing the number of deaths among children under age five and thecrude mortality rate (CMR), assessing the number of deaths in the entire population.
17

Secondly, surveys may suffer from a ’survivor bias’ and produce encouragingly low
mortality rates that are, in reality, due to high rates in the previous months, culling
the weak members of the community. But if used with information on causes of
death, risk factors can be correctly identified and resources targeted appropriately
(Degomme and Guha-Sapir, 2010; de Walque, 2005; de Walque and Verwimp, 2009).
Despite these caveats, survey data is invaluable for displaying differences between
population groups within conflict-affected areas. Flagrant differences in the health
and nutritional conditions between groups are a source of social tension, especially
in post-conflict conditions where political stability is fragile.
Peace accords are a political tool and may not necessarily entail better conditions
for the population. On the other hand, the lack of real or even perceived improve-
ments in living conditions will jeopardise the sustainability of any peace agreement.
In Angola, survey data of mortality showed no improvement for at least one year
after the peace accords were signed. Figure 2.4 shows mortality rates in Sudan, the
Democratic Republic of Congo, Ethiopia, and Somalia along with political events,
illustrating the long-term adverse health impacts of conflict, which last long after
peace agreements.
Mortality rates also indicate the severity of a crisis and are therefore useful as
advocacy tools. In recent years, mortality estimations in Darfur, Iraq, and the
Democratic Republic of Congo have spurred debate, both in academia and in the
media, largely due to the political context of these wars. Issues related to biases
that over and under estimate deaths have been widely discussed particularly in the
epidemiological literature (Checchi and Roberts, 2007). But as death rates are a
lagging indicator of crisis severity, the efforts should focus on early indicators for
which effective action can be taken: vaccination coverage and causes of death and
malnutrition. The impacts of these actions are not only critical to bring down
population death rates but sow the seeds of a healthy population for the evolving
peace and development process.
2.2 Protecting children against diseases
The spread of disease, especially infectious disease, and vaccination coverage are
good indicators of how resilient the population is to degradation of the local system.
In this section, we briefly explore the available vaccination data from conflict-affected
18

Figure 2.4: Mortality rates and political events across time in Sudan, DR Congo,Ethiopia and Somalia
●
●●●●
●
●
●●
●●●
●●●
●
●●●●●●●
●●●
●● ● ●●●● ● ●●●● ●●●
●● ●●●● ●● ●●●●● ●●●● ● ●●● ●●●●●●●●●●● ●●● ● ● ●●●●●● ● ●●●●●●● ●●● ●●●● ●●● ●●● ●● ● ●●●●●●●●●●●●●●● ●●● ● ●●●● ●●●●● ●●●●●● ●●●●●●●● ●● ●●● ●●●● ●●●● ●●●●● ●●●●● ●●●●● ● ● ●●●●●●●●●● ●●●● ●●●●●● ●●●● ●●●● ●●● ●●●●●● ●●●●●●●● ●●●● ●●●●●● ●●● ●●●● ●●● ●●●●● ●● ●●●●●●●●●●● ●●● ● ●● ●●●●●●●●●● ●●● ●● ●●● ●●●●● ●●●● ● ●●●●●●● ●●●● ●●● ● ●●●●●●●●●●●●●● ●●● ●●●●●●● ● ●● ●●●●●● ●●●● ●●●●●●●●● ●●●●●●●● ●● ●●●●●●●●●●●●●● ●●● ●●●●●●● ●●●●● ●●●●●● ●● ●●●●●●●●●●●●●●●●●●●●●● ●●●●●●●●●●●●●● ●●●● ●●●●●●●● ●●●●●●●●●●●●●●●● ● ●●●●● ●●● ●●●●● ●●●●●● ● ●●●●●●●●● ●● ● ●●●● ●●●●●●● ●● ●●●●●●●● ●● ●● ●●●●●●●●● ● ●●●●0
510
1520
25
CM
R (/
10,0
00/d
ay)
1998 2000 2002 2004 2006 2008 2010
Emergency threshold
Famine
Start Darfur Conflict
Comprehensive Peace Agreement
Darfur Peace Agreement
Elections
(a) Sudan (nr. surveys = 305)
●
●
●
● ●
●
●
●●
●
●
●
●
●
●
●
●
●●
●●●
●
●●
●
●
●
●●
●
●
●
●
●
●
●
●
●
●
●
●
●
●
●
●●●
●
●
●
●
●
●
●
●
●
●●
●●●
●
●
●
●
●
●
●
●
●●
●
●
●
●
●●
●
●
●
●
●
●●●
●
●
●●
●
●
●
●
●
●
●●
●
●
●
●
● ●●
●
●
●
●
●
●
●
●
●
●
●
●
●
●
●
●
●●
●
●●
●
●
●●
●
●●
●
●●
●
●
●
●●
●
●
●
●
●
●
●
● ●
●
●
●●
●
●
●
●
●
●●
●
●
●
●
●
●
●
●
●
●
●
●
●
●
●
●
●
●
●
●
●
●
●
●
●
●●
●
●
●
●
01
23
45
CM
R (/
10,0
00/d
ay)
1998 2000 2002 2004 2006 2008 2010
Emergency threshold
2nd Congo War
Joseph Kabila
Transitional Government
Elections
(b) DR Congo (nr. surveys = 186)
●●
●
●●●
●●
●
●
●●
●●
●●
●
●
●
●
● ●
●
●●●
●
●●
●
●
●●
●
●
●●
●●●●
●●
●●
●
●
●●
●
●
●
●●●●●
●
●●●●●
●
●
●●
●
●●●●●●
●●
●
●●
●
●●
●
●●●
●●
●●
●
●● ●
●● ●
●●
●
●
●●
●
●●
●●●●
●●●
●
●
●
●●●●●
●●●●●
●●●
●
●
●
●
●
●
●
●
●●
●
●
●●
●●●●
●●●
●●
●●●
●●●●
●●●
●●●
●●●●
●
●●●
●●
●●
●●
●
●●
●
●●●
●●
● ●
●
●
●
●●
●
●
●●
●
●● ●
●
●
●
●●
●
●
●●
● ●
●
●●
●
●●
●●●
●
●● ●●●●●●
●
●●●●●
●●
●●
●
●●●●
● ●
●●●
●●
●●●●
●
●
●
●
●●●
●●●●
●
●
●●●
●●●
●●●
●●
●
●
●
●
02
46
810
CM
R (/
10,0
00/d
ay)
1998 2000 2002 2004 2006 2008 2010
Emergency threshold
Famine
Elections Elections
Food crisis
Algiers Agreement
(c) Ethiopia (nr. surveys = 251)
●
●
●●
●●
●●●
●
●●
●●●
●●
●
●●
●●
●●
●●●●●
●●●●
●●
●●
●●
●●
●●●
●●●●
●●●●
●●●
●●
●●
●●
●
●●
●
●
●●●●●
●
●●●●
●●
●
●
●
●●
●
●●
●●
●
●●
●●●
●●
●
●
●●
●●
●●
●●●
●
●
●
●
●●●●●
●●●
●
●
●●●
●●●
●
●
●
●●
●
●
●
●
●
●
●●
●
●
●
●●
●●
●●
●●●●
●●
●
●
●
●
●
●
●●●
●
●●
●
●●●●
●●
●
●
●●
●●
●
●
●
●
●●●●
●●
●●
●●●
●
●
●●
●●
●●
●
●●
●●
●
●●
●
●
●
●
●
●
●
●
●●
●●●●
●●
●●
●●
●●
●
●
●
●
●
●
0.0
0.5
1.0
1.5
2.0
2.5
3.0
CM
R (/
10,0
00/d
ay)
1998 2000 2002 2004 2006 2008 2010
Emergency threshold
Transitional Government
Battle of Mogadishu
Djibouti Peace Agreement
Elections
(d) Somalia (nr. surveys = 152)Those crude mortality rates apply to a recall period (the interval of time to which the mortality rate inthe surveyed population refers) up to one year.
Source: CE-DAT (2010)
children and barriers to vaccination.
In recent years, vaccination indicators are commonly collected in surveys done
by service providers (typically humanitarian NGOs). In addition, they also report
on the prevalence of diarrhoea and acute respiratory infections during the two weeks
19

before the survey and provide a morbidity profile of the surveyed population.
In normal settings, vaccinations are often delivered in routine clinic visits as
part of primary health care. In emergencies, they are usually provided through
campaigns that aim to rapidly provide maximum protection to a population. An
exception is in established camps where service delivery is organised for routine care.
The vaccine-preventable disease of greatest concern is measles, especially among dis-
placed populations who live in dense settlements where transmission can be quite
high. Such outbreaks can have a case-fatality rate8as high as 10 to 20% among mal-
nourished children. These high rates are not only individually tragic, but they have
a significant collective impact on social morale and hopes for the future. To avoid
these alarming mortality rates, efforts strive to reach and maintain herd immunity
at the WHO recommended 80% coverage or at the 95% threshold recommended by
SPHERE9 for conflict situations.
Available data on measles vaccination coverage from communities living in con-
flict areas is not encouraging. Of the 135 surveys undertaken and validated by the
CE-DAT project in 2009, only eight surveys reported measles vaccination coverage
above 95% and only 53% reported coverage above the WHO recommended threshold
of 80%.
In most conflict-affected countries, significant disparities in vaccination coverage
exist between different regions. These differences depend on many factors, such
as concentrated humanitarian aid attention or government-favoured regions. Chad,
Ethiopia, and Sudan illustrate such variations (Figure 2.5). The effectiveness of
health policies during or after conflicts will depend on an in-depth understanding of
the factors that determine these disparities.
2.3 Fighting hunger
Closely related to the incidence of disease is the nutritional status of a popula-
tion. In times of conflict, nutritional status and hunger are not only influenced by
the standard channels in any poor setting but also aggravated by additional factors.
Broadly speaking, there are two ways through which food is available to people:
local production and imported food. In conflicts, systematic destruction of crops
8Defined as the percentage of persons diagnosed as having a specified disease who die as a resultof that illness within a given period.
9Providing humanitarian charter and minimum standards in disaster response.
20

Figure 2.5: Inequity in Measles Vaccination Coverage (MCV) among residentsacross conflict areas (2009)
Chad, Kachimel−abecheChad, Nokou
DR Congo, Haut−lomamiDR Congo, Kwilu
DR Congo, South KivuDR Congo, Tanganyka
Ethiopia, BorenaEthiopia, East Harerghe
Ethiopia, SidamaEthiopia, South Wollo
Haiti, CentreHaiti, NorthHaiti, South
Kenya, GarissaKenya, Marsabit
Kenya, NairobiKenya, Taita Taveta
Kenya, TurkanaNiger, Illela
Niger, TahouaSudan, Gogrial West
Sudan, IkotosSudan, MellitSudan, Twic
Uganda, NakawaYemen, Ash Sshati
Measles vaccination coverage
0 20 40 60 80 100S
PH
ER
E T
resh
old
WH
O T
resh
old
The chart present average measles vaccination coverage for 2009 in selected locations fromthe CE-DAT database.
Source: CE-DAT (2010)
and killing of livestock decimates local production and can effectively starve whole
communities or push them to move towards urban centres in hopes of food. The
interlinked effects of governance failure and insecurity leads to a collapse of trade,
affecting food importation and its distribution. This scenario is further aggravated
by a crowding-out of public and private investments in the region. More specifically,
in conflict, food stocks are often seized or destroyed on purpose, while agricultural
land is mined and food supplies cut off. Besides reduced food availability, lack of
access to the little food that there is, remains a major factor influencing the emer-
gence of malnutrition.
In emergencies, malnutrition among children from 6 to 59 months is used as a
proxy indicator for the general health and welfare of a community. Different in-
21

dices of malnutrition exist. While undertaking a survey, humanitarian NGOs record
age, weight, height, and the presence of edema. In conflict settings, the indicator
used to evaluate the crisis is Global Acute Malnutrition (GAM). This indicator is a
short-term indicator, capturing punctual nutritional stress due to sporadic episodes
of violence or natural disasters events such as drought or floods. Another indica-
tor is chronic malnutrition, also called stunting, which is due to long-term food
deprivation and which can be seen as a structural problem. Most international
agencies also monitor the percentage of underweight children, notably for tracking
the Millennium Development Goals, measuring a combination of chronic and acute
malnutrition. While humanitarian needs should be assessed by acute malnutrition
levels, child undernutrition can be seen as a major challenge for human development
(SMART, 2010).
In many of the Sub-Saharan countries affected by conflicts, the causes are a mix
of man-made actions and frequent droughts and floods. In Somalia, about 1.5 million
people are conflict- and drought-displaced and 3.25 million are entirely dependent
on food aid (IDMC, 2009). The critical levels of malnutrition in Somalia are a direct
consequence not only of the conflict but also of failing harvests.
In the last ten years, acute malnutrition has been spreading in subnational re-
gions of the Horn of Africa and in neighboring countries (Table 2.2). The surveys
report high levels of malnutrition in regions of countries, often contradicting nation-
ally aggregated statistics on nutritional status. As national statistics represent only
those populations in secure areas where statistical reporting systems function, the
indicators are usually better than those obtained from population sample surveys.
For example about 25% of the surveys in Kenya and Sudan report both child mor-
tality and acute malnutrition at levels well above emergency thresholds, suggesting
a precarious health situation and high burden of disease.
The map presented in Figure 2.6 shows the distribution of GAM below and
above the emergency threshold over the last ten years in the Democratic Republic
of Congo, Somalia, Ethiopia, and Sudan. The red clusters, reporting GAM above
10%, are located in Darfur, South Sudan, Southern Somalia, and Eastern Ethiopia.
A closer look at Somalian crude mortality rates allows us to see corridors of stress.
Mortality profiles are very different across livelihood groups; the non-uniform strips
that cross provincial borders represent vulnerability differences among those groups
(Figure 2.7).
22

Table 2.2: Percentage of surveys reporting critical U5MR and/or GAM (1998-2009)
DRC Uganda Ethiopia Kenya Somalia SudanGAM > 10% 0.34 0.04 0.54 0.9 0.88 0.89nr. surveys 170 57 244 84 164 440U5MR > 2/10,000/day 0.36 0.43 0.17 0.24 0.31 0.28nr. surveys 247 51 207 55 116 311GAM, U5MR > threshold 0.11 0.04 0.14 0.24 0.27 0.25nr. surveys 152 57 214 55 122 316
Source: CE-DAT (2010)
It is commonly assumed that political events, such as elections or peace agree-
ments reduce insecurity and lead to better living conditions. These events are there-
fore expected to improve basic livelihood indicators such as malnutrition. Alhough
political events are unquestionnably building blocks toward stability, the available
evidence does not indicate a clear association between these milestones and improve-
ment in nutritional status. This can be partially explained by the fact the political
events do not reduce insecurity in any substantial ways and hence does not lead
to an improvement in the availability and access to food. Figure 2.8 presents data
from nutritional surveys in four countries along with important events over the last
decade. None of these countries indicate significant positive trends in nutritional
levels. Although the data from surveys undetaken in Ethiopia show a decrease over
time, the peaks of the early 2000 can mostly be attributed to IDPs in the Gode area
(Somali Region). Since then, GAM remained around the 10% alert level. This line
of thinking clearly requires more investigation on the basis of a stronger conceptual
framework and robust trend analyses.
Malnutrition is an early indicator of stress in poor communities and especially
in populations dealing with conflict. Fortunately, methods for measuring nutritional
status - at least for monitoring and operational purposes - are well developed and
adapted specifically for insecure conditions. Moreover, malnourished small children
respond quickly to food intake and therefore present an intervention that has both
real and perceived benefits. There are, of course, many contextual complexities
in providing food to undernourished children, but in an immediate post-conflict
situation, this probably presents the most practical intervention for which there
exists a wealth of experiences of best practices.
23
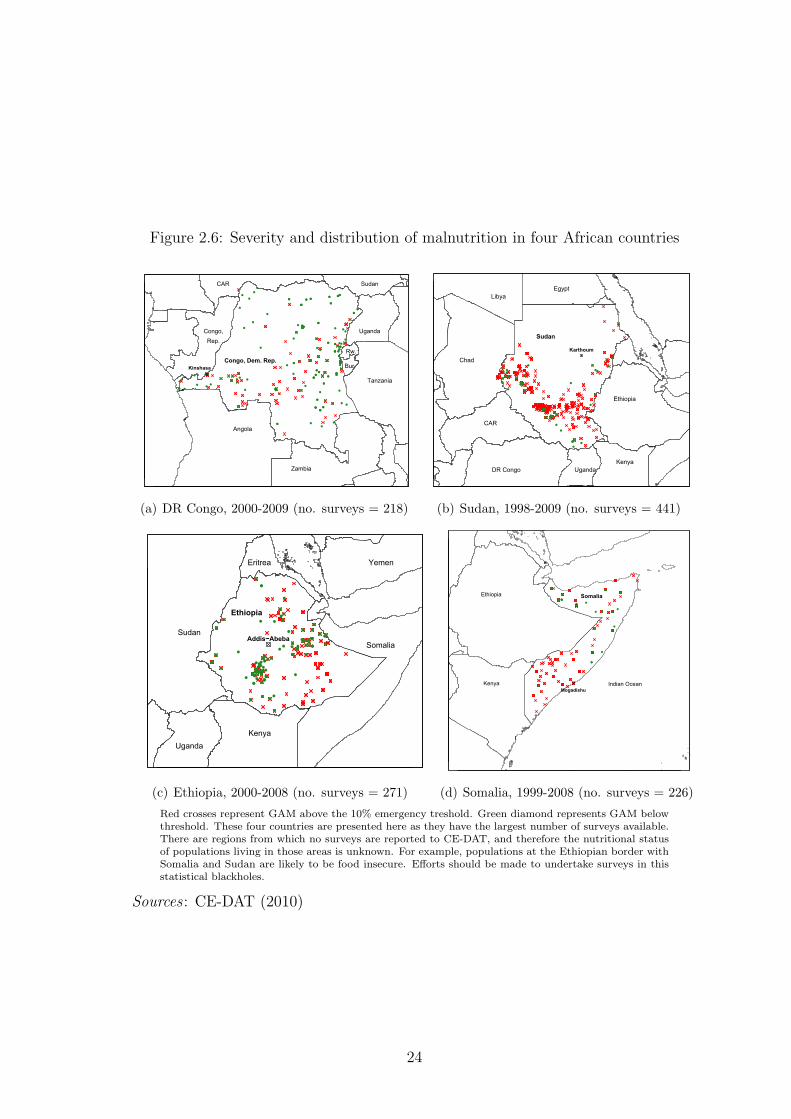
Figure 2.6: Severity and distribution of malnutrition in four African countries
●
●
●
●
●
●
●
●
●
●●
●
● ●
●
●●
●
●
●
●
●
●
●●
●●
●
●
●
●
●
● ●
●
●
●
●
●
●
●●
●
●
●
●
●
● ●
●●
●
●
●●
●●
●
●
●
●
●
●
●
●
●
●
●
●
●
●
●
●
●
●
●●
●●
●●
●
●●
●
●
●
●
●
●
●●
●
●
●
●
●
●
●
●
●
●
●
●
●
●
●
●●
●
●
●
●
●
●●
●
●
●
●
●●
●
●
●
●
●
●
●
●
●
●
●
●
●
●
●
●
●●
●●
●
●
●
●
●
●
●
●
●
● ●
●
●
●
●
●
●
●●
●
●●●
●●
●
●
●
●
●
●
●●
●●●●
●
●●●
●
Congo, Dem. Rep.Kinshasa
Angola
Zambia
Tanzania
Uganda
Rw.
Bur.
SudanCAR
Congo,Rep.
(a) DR Congo, 2000-2009 (no. surveys = 218)
●
●
●●
●
●
●
●●
●
●
●
●
●
●
●●●
●
●
●
●●
●
●
●●
●
●
●
●
●
●
●
●
●●●
●
●●●
●
●
●●
●
●
●
●
●
●
●●●
●
●
●
●
●
●
●
●●●●●
Sudan
Karthoum
Chad
CAR
KenyaUgandaDR Congo
Ethiopia
EgyptLibya
(b) Sudan, 1998-2009 (no. surveys = 441)
●
●
●●
●● ●●
●
●
●
●
●
●
●
●
●
●
●●
●
●
●
●
●
●
●
●●
●
●
●
●●
●
● ●
●
●
●
●
●
●
●
●
●
●
●
●
●● ●
●
●●
●
● ●
●
●
●
●
●
●●
●
●
●
●
●
●
●●
●●
●
●●
●
●
●
●
●
●
●
●●
●
●
●
●●
●
●
●
●
●●
●
●
●
●●
●
●
●●
●
● ●
●
●●
●
●
●●
●
●
●
●●
●
●
●
●●
●●
●
●
●
●●
●
●●●
●
●
●
●
●
●
●
●
● ●●●
●
●
●
●
●●
●
Ethiopia
Addis−Abeba
Kenya
Somalia
Uganda
Sudan
Eritrea Yemen
(c) Ethiopia, 2000-2008 (no. surveys = 271)
●
●
●
●
●
●
●
●
●
●
●
●
●●
●● ●
●●
●
●
●
●
●
●
●
●
●●
●
●● ●
●●●
●
●
●
●
●
●
●
●
●
●
●
●
●
●
●
●
●
●
●
●
●
●
●●●
●
●
●
Somalia
Mogadishu
Ethiopia
Kenya Indian Ocean
(d) Somalia, 1999-2008 (no. surveys = 226)
Red crosses represent GAM above the 10% emergency treshold. Green diamond represents GAM belowthreshold. These four countries are presented here as they have the largest number of surveys available.There are regions from which no surveys are reported to CE-DAT, and therefore the nutritional statusof populations living in those areas is unknown. For example, populations at the Ethiopian border withSomalia and Sudan are likely to be food insecure. Efforts should be made to undertake surveys in thisstatistical blackholes.
Sources : CE-DAT (2010)
24

Figure 2.7: Geographical distribution of mortality in Somalia
Sources : CE-DAT (2010), Guha-Sapir and Ratnayake (2009)
2.4 Refugees, residents, and IDPs: who is most
at risk?
Millions are living in hostilities and wars. Of these, most cannot leave and so
remain tied to an uncertain life, some leave the area to make a living in another
region of the country, and yet others leave the country altogether.
Before 1990 and the end of the Cold War, the largest share of conflict-affected
populations left the country and became refugees. At that time, they numbered
around 40 to 50 million; and some had a right to UNHCR protection. At that time,
the international community did not look very closely at situations inside sovereign
countries, however bad the conditions were. Today, the number of refugees has de-
clined to a quarter of the number during the Cold War. By and large, the conditions
of refugees are not only satisfactory, they are often better than the host country’s
populations. Of course, that in itself is occasionally a source of local tensions.
25

Figure 2.8: Trends in malnutrition and political events in Sudan, DR Congo,Ethiopia and Somalia
●
●●●●
●
●
●
● ●●●●●●●●● ●
●● ●●●●
●● ●●●●●● ●●● ●● ●●● ● ●● ●● ●●●●● ●● ●●●●●● ●●●● ●●● ● ●●● ● ●● ●●● ● ●●● ●●●●●●●●●●● ●●●●● ●●●●●● ● ●●●●● ●●●●● ●●●●●● ●●●●●●●●●●● ●●●●●● ●●●●●●● ●●●●●●● ●●● ●●●●●●●●●●● ●●●● ●●● ● ●●●●●●● ● ●●●●●● ●●● ●● ●●●●●●●● ●●● ●● ●●● ●●●●●●●● ●●● ● ●● ●●●●● ●●●●●● ●●● ●●●● ●●●●●●●●● ●● ● ●●●● ●●●●● ●●●●● ●●●●●● ● ●●● ●●● ●●●●●●● ● ●● ●●●● ●●● ●● ●●● ●●●●●●●● ●●● ●●●● ●●● ● ● ●● ●●● ●●●●● ●●●●● ●● ●● ● ●●●●● ●●● ●●●●●● ●● ●●● ● ●● ●●●●●● ●●●● ●●● ●●●●●●●● ●●● ●●● ●● ●●● ●●●●●● ● ●●●● ●●●●●●● ●●● ●● ●●●●● ●●●● ●● ● ● ●●● ●●●●●● ●●●●●●●●●● ● ●●●● ●●● ●●●● ●●●● ●●●●● ●●●●● ● ● ●●●●● ● ●● ●● ●●●●●● ●●● ● ●●● ● ● ● ●●●●● ●●● ●●●●● ●●●●●●● ●●●●●●●● ●●●●●●●● ●● ● ●●●● ●●● ●●●●● ●●●●● ●●●●● ●● ●●●● ●● ●●● ●●●●●● ●● ●●● ●●●●●●●● ●●●●●● ● ●● ●●● ●●●●●●●● ●● ●●● ●●● ●●●●● ● ●●●● ● ●●● ●●● ●●● ●●● ●● ●●●●● ● ● ●● ●● ●●●●● ●● ●●●●● ●● ●●● ●● ●●●●● ●●● ● ●● ●●● ●●● ●●● ●● ●● ● ●●●●●●●● ●● ●●●● ●● ●● ●●●●●● ●●● ●
●●●●●
020
4060
80
GA
M (%
)
1998 2000 2002 2004 2006 2008 2010
Emergency threshold
Famine
Start Darfur Conflict
Comprehensive Peace Agreement
Darfur Peace Agreement
Elections
(a) Sudan (no. surveys = 441)
●
●
● ●
●●
●
●●● ●●
●
●●●● ●●
●●●●● ●
●●●● ●● ●● ●
● ●●●●● ●●●●●●●●● ●
●● ● ●●●●● ●● ●● ●● ●●●● ●●●● ●●● ●●●● ● ● ●● ●●● ● ●●●●
●●● ●● ●●● ●● ● ●●● ●● ● ●
●●● ●●●● ●● ●●● ● ●● ● ●● ●● ●● ●●● ●● ●● ● ● ● ●●●●●● ●●● ●● ●● ●● ●● ●● ● ●● ●●●
● ●● ●● ●● ● ● ●●●●● ●● ●● ●●●●●● ●● ●● ●●● ●●
●● ●●● ● ●
●●●●●
●●
05
1015
20
GA
M (%
)1998 2000 2002 2004 2006 2008 2010
Emergency threshold
2nd Congo War
Joseph Kabila
Transitional Government
Elections
(b) DR Congo (no. surveys = 218)
●●
●
●
●
●
●
●●●
●●
●
●
●
●
●
●
●
●
●
●●
●
●
●
●
●
●
●
●
●
●
●●
●
●
●●
●●
●
●●●●
●
●
●
●●
●
●●●
●●
●
●●●●●
●●●
●
●
● ●●
●
●
●
●
●
●
●
●
●
●●
●●
●
●
●
●
●
●
●
●
●
●
●●
●●
●
●
●●
●
●●
●
●
●
●
●
●
●●
●
●●●●●
●
●●
●
●
●●
●
●
●
●
●●
●●●●
●●●
●●
●
●●
●●
●
●
●
●
●
●
●
●●
●
●
●
●
●
●
●
●
●
●●
●
●
●
●
●
●
●
●
●
●
●●
●
●
●● ●
●●
●●
●
●
●●
●●
●
●
●
●
●
●
●
●
●
●
●●
●
●
●
●
●
●
●
●
●
●
●
●
●
●
● ●
●
●
●●
●
●
●
●
●●
●
●
●
●
●
●
● ●
●
●
●
●●
●
●●
●●
●
●●●●
●
●●
●
●
●
●
●
●
●
●
●
●●●
●●
●
●●●
●
●
●
●
●
●●
●●
●●
●
●●
●
●
●●●●●●●●
●
●●
●
●
●●
●
●
●●●
●
●
●
●
●
010
2030
4050
60
GA
M (%
)
1998 2000 2002 2004 2006 2008 2010
Emergency threshold
FamineAlgiers Agreement
Elections
Elections
Food crisis
(c) Ethiopia (no. surveys = 271)
●
●
●
●
●●
●● ●●
●●
● ●●●● ●●●
●● ●●●●●● ●
●● ● ●● ●●●●●●● ●● ●● ●● ●●●● ●●●●● ●●● ● ●●●●●●●● ●●●●● ●● ●●
●●● ●●●● ●● ●●● ●●●●● ●●●●● ●●● ●●●●● ●●●●● ● ●● ●● ●● ●●●● ●● ●● ●● ●●●● ●●● ●● ●● ●●● ●●●●● ●●●●●●●●●●●● ● ●●● ● ●● ●●● ●●●●●● ● ● ●●●●●●●●● ●●●●● ●●●●●●●● ● ●●●● ●●● ●●●●●● ● ● ●● ●●●●● ●●●●●●●
● ● ●● ● ●● ●●●● ●● ●● ●●● ●●●●●● ● ●●●●● ●●●●
● ●●● ●●● ●● ●●●●● ● ●● ●●●● ●●●●● ●● ● ●●
●●●●●●●●●
●● ●●●
●●●
010
2030
40
GA
M (%
)
1998 2000 2002 2004 2006 2008 2010
Emergency threshold
Transitional Government
Battle of Mogadishu
Djibouti Peace Agreement
Elections
(d) Somalia (no. surveys = 226)
Sources : CE-DAT (2010)
Those who are unable to cross the border frequently settle in inhospitable condi-
tions within their own country; they are known as the internally displaced (IDPs).
IDPs, not having crossed a state border, remain at the mercy of host villages and
the generosity of local administrations. They continue to live amid hostilities or
move out of their villages, often en masse, to seek refuge further away from conflict-
26

affected areas while remaining within national borders. Access to these populations
is often compromised as most do not live in camps, and are located closer to the
conflict areas or are dispersed over large regions. This impedes their access to health
services, including vaccination coverage and food distribution, and makes them more
vulnerable to diseases.
Those who were unable to leave, live on as residents, and represent the biggest
share of the total victims of conflict. At this time, no estimates exist regarding how
many people currently live in areas affected by conflict. Methodological problems
in making such estimations are undoubtedly daunting, but this lack excludes these
communities from adequate consideration in regular development programming10.
Residents present the very worst condition of nutrition and health, rivaling or sur-
passing those in the poorest areas of their own country.
In fragile post-conflict conditions, the needs of specific sub-groups such as re-
turnees or the displaced should be adequately addressed to avoid creating pockets
of exclusion. These target groups should be identified based on disaggregated data
from the region and not on hearsay or the judgment of the local administration.
The latter may be upward or downward biased according to political agenda, and
therefore not reflecting the reality and associated needs.
This is illustrated in Figure 2.9. During the conflict and transition period (be-
tween 1999 and November 2002), 74% (95% among IDPs) of surveys undertaken in
Angola showed rates above emergency thresholds. The mortality in Angola wors-
ened significantly after the peace agreement was signed, especially among the IDPs
in camps and transit centers. Surveys reported rates of 7.2 (CI 95% 5.3-9.1) deaths
per 10,000 per day in Luena among IDPs in the Muacanhica and Muahimbo camps
and in transit centres, which exceed by sevenfold the emergency threshold. The
likely explanation for these high rates is that peace agreements allowed humanitar-
ian organisations access to affected populations who had not benefit from relief aid
before. Once humanitarian aid flowed into the country, the proportion of surveys
reporting critical mortality rates decreased from 74 to 33%, showing a net improve-
ment in the situation (Guha-Sapir and Teran Gomez, 2006).
Camp settings are often characterised by a very high population density, bolster-
10An attempt at such estimation is available as a working document by Guha-Sapir and D’Aoust(2009)
27

Figure 2.9: Decrease of crude mortality rates in Angola, 2000-2008
●●
●
●
●●
●● ●●
●●●
●●
●
● ●
●●●●
●● ●●●
●●
●●
02
46
8
Cru
de m
orta
lity
Rat
e (/1
0,00
0/da
y)
2000 2002 2004 2006 2008
02
46
8
Cru
de m
orta
lity
Rat
e (/1
0,00
0/da
y)
2000 2002 2004 2006 2008
02
46
8
Cru
de m
orta
lity
Rat
e (/1
0,00
0/da
y)
2000 2002 2004 2006 2008
02
46
8
Cru
de m
orta
lity
Rat
e (/1
0,00
0/da
y)
2000 2002 2004 2006 2008
02
46
8
Cru
de m
orta
lity
Rat
e (/1
0,00
0/da
y)
2000 2002 2004 2006 2008
● IDPIDP−residentIDP−resident−returneeresidentresident−returnee
Muacanhica & Muachimbo
Fazenda Tomba & Katjanguite
Kuito Kuito
Kuito
Muacanhica & Muachimbo
Emergency threshold
Conflict
(1999 − Apr. 2002)
Transition
(Apr. − Nov.)
Post−conflict
(From November 2002)
Those crude mortality rates apply to a recall period from 2 to 6 months. Thelabels corresponds to surveys undertaken in IDP camps.
Source: CE-DAT (2010)
ing the transmission of diseases and leading to a higher risk of diarrhoea one of the
major causes of child morbidity and mortality in complex emergencies and other in-
fectious diseases. Moreover, the often precarious conditions in camps-e.g. the lack of
appropriate shelter, clean water, and hygiene-are also factors leading to an increased
morbidity. In Kenya, the refugee population from Dadaab camp had exceeded its
capacity by 270% in early 2009. In order to prevent epidemics, camps often provide
services to support the living conditions of the displaced, such as health facilities,
vaccinations, food distributions, shelter, access to safe water, sanitation, education
etc. If these services are continuously provided, refugees tend to be better off than
the displaced population outside camps. Figure 2.10 plots average mortality rates
among children under the age of five from surveys in conflict countries. While mor-
tality has decreased among IDPs and residents, all three populations are, on average,
converging towards mortality rates under the emergency threshold of 2 deaths per
10,000 per day.
28

Figure 2.10: Children under the age of five: mortality rates by population status(no. surveys = 1,477)
Und
er 5
mor
talit
y R
ate
/10,
000/
day
1
2
3
4
5
● ●●
●
●
●
●
●
●
●
emergency thresholdemergency thresholdemergency thresholdemergency thresholdemergency thresholdemergency thresholdemergency thresholdemergency thresholdemergency thresholdemergency thresholdemergency thresholdemergency thresholdemergency thresholdemergency thresholdemergency thresholdemergency thresholdemergency thresholdemergency thresholdemergency thresholdemergency thresholdemergency thresholdemergency thresholdemergency thresholdemergency thresholdemergency thresholdemergency thresholdemergency thresholdemergency thresholdemergency threshold
2000 2002 2004 2006 2008
status● IDP
refugeeresident
Source: CE-DAT (2010); DCD-DAC (2009)
The better condition of residents compared to the internally displaced can further
be seen in Figure 2.11. This chart shows the average percentage of children who are
acutely malnourished during the conflict, transition, and the post-conflict period in
Angola. The proportion of malnourished children was 14.9% on average during the
conflict and the transition period, exceeding the 10% emergency threshold and in-
dicating a serious situation. It reached 46% in Cuemba camp (Bi province) in April
2001; among surveys undertaken in Angola before November 2002, 38.5% showed
malnutrition above the level of 15%, well over the emergency threshold of 10%.
Inequities between population subgroups can be a persistent problem that should
not be ignored. A simple example can be drawn from the use of medical consultation
rates as a sensitive indicator of service effectiveness in two refugee camps in Gam-
bela, Ethiopia. The service providers were alerted to potential problems in Fugnido
camp where consultation rates were a quarter of those in Bonga. Persistent underuse
of available medical services alerted the authorities to problems of erratic food and
medical supplies, inappropriate living arrangements, and disregard for an unusual
demographic imbalance (a large proportion of adolescents). Standardised rates of
29

Figure 2.11: Global Acute Malnutrition by status and period, Angola
Source: CE-DAT (2010)
consultations in the camp health centre remained the one easy-to-monitor indicator
to compare performance between camps and over time as well as monitoring how
well infants fared in each camp.
Today, refugees and IDPs, when they are taken under the care of UNHCR, fare
better than all residents in conflict-affected populations. Overall, the worst off are
the IDPs outside camps, who globally outnumber the refugees by far and face the
worst challenges among all those who are exposed to conflict. By moving out, they
lose their support from local networks or family structures but do not receive the
protection of UNHCR. The local community, whose resources do not extend to cov-
ering the needs of the newcomers, often resents them. Displacement also exposes
them to new pathogens that were not present in their area of origin and for which
they have not developed immunity. High malaria-related deaths among refugees in
Ethiopia have been associated with migrations from highlands with low malaria en-
demicity to lowlands where malaria was endemic (Toole, 1995). On the other hand,
studies have shown that displaced persons carry pathogens that are unknown to host
populations and accelerate the spread of diseases (Connolly et al., 2004).
Policies in conflict-affected countries must account for the needs of the displaced
and those who have been long-term residents in areas of armed violence. The basic
needs of these groups can be different from most other poor communities and the
provision of services should be given as high a priority as political negotiations or
retribution at distant courts.
30

Chapter 3
Global challenges for better health
data
Approximately half a billion people live in precarious conditions created by civil
conflict (Guha-Sapir and D’Aoust, 2009). Among these, a majority is internally
displaced or resides in insecure regions where they are deprived of schooling, health
services, or basic means of livelihood. Most of these conflict-affected countries have
had varying degrees of insecurity for years and many for decades. While we broadly
recognise that social and economic development is a precursor to peace, only a
third of the total Official Development Aid (ODA) is disbursed in conflict-affected
countries. In most cases, the share of humanitarian aid continues to increase at the
cost of development aid (DCD-DAC, 2009). Moreover, this substantial “short-term”
aid are renewed over several years, often without adequate planning or a sufficient
evidence base to make the policies effective or appropriate to these situations. The
use of national statistics from these countries as a basis for aid further compounds
the problem.
3.1 The Millennium Development Goals (MDG)
One of the principal tools of monitoring development is the Millennium Devel-
opment Goals (MDGs).
In September 2000, leaders from 189 nations agreed on nine goals aimed at freeing
a major portion of humanity from the shackles of extreme poverty, hunger, illiteracy,
and disease by 2015. They established targets for achieving gender equality and the
empowerment of women, environmental sustainability, and a global partnership for
development (Ban Ki-moon, Secretary-General, United Nations, 2009).
31

Each goal is associated with different targets and indicators to monitor progress.
Health indicators such as child and maternal mortality, vaccination coverage, and
nutrition are central to the MDGs. In this section we take a closer look at the health
indicators of goals 1, 4, 5, and 6 and their data sources, and discuss the difficulties
of monitoring MDGs in conflict.
Millennium Development Goals
1. Eradicate extreme poverty and hunger
2. Achieve universal primary education
3. Promote gender equality and empower women
4. Reduce child mortality
5. Improve maternal health
6. Combat HIV/AIDS, malaria and other diseases
7. Ensure environmental sustainability
8. Develop a global partnership for development
1. Eradicate extreme
poverty and hunger Tar-
get 1.C is to halve, between
1990 and 2015, the propor-
tion of people that suffer
from hunger. There are
two indicators to monitor
progress: the prevalence of
underweight children under-
five years of age and the pro-
portion of population below
the minimum level of dietary
energy consumption. The
former has decreased by 10% from 1990 to 2007 in Sub-Saharan Africa compared to
a 60% decrease in Eastern Asia (UN, 2009).
4. Reduce child mortality The only target associated with this goal is to re-
duce the under-five mortality rate by two-thirds, between 1990 and 2015. There are
three indicators monitoring progress towards this objective: the infant and under-
five mortality rates as well as the proportion of one-year-old children immunised
against measles. Measles is indeed one of the leading causes of death among chil-
dren. Between 2000 and 2007, measles deaths dropped by 74 per cent, with the
largest reduction in Sub-Saharan Africa, thanks to the expansion of routine vac-
cination campaigns. Since 1990, deaths of children under five have decreased by
28%, dropping from 12.5 million to 9 million. In Sub-Saharan Africa, mortality
has decreased by 20%, in Eastern and Southern Asia it decreased by 51% and 36%
respectively (United Nations, 2009).
5. Improve maternal health By 2015, the maternal mortality ratio should
be reduced by two-thirds as measured by the maternal mortality ratio itself and
32
the proportion of births attended by skilled health personnel. A second objective
is universal access to reproductive health measured by the contraceptive prevalence
rate, adolescent birth rate, antenatal care coverage (at least one visit and at least
four visits), and unmet needs for family planning.
6. Combat HIV/AIDS, malaria and other diseases The spread of both
HIV-AIDS and malaria is expected to have begun to reverse by 2015 though universal
access to treatment. Ten other indicators such as condom use, school attendance of
orphans, and malaria-specific death rates, will help monitoring progress1.
3.2 Reporting on MDG from conflict theatres
The global monitoring process receives national statistics that are either drawn
from nationwide surveys or from national surveillance systems. Nationwide surveys
sometimes exclude surveying areas where insecurity is an issue and do not include
refugees or the internally displaced in their sampling frames. National surveillance
systems draw their data from institutional reporting networks (such as hospitals or
clinics), therefore only capturing data on those who have contact with hospitals or
die in them. Hospitals and dispensaries in developing countries are famously con-
centrated in urban centres. There are very few functioning health service centres
in rural areas, let alone in areas where there are hostilities. In many countries, the
conflict is between government and rebel forces, so public sector services are even
less likely to operate in those parts.
The national sources used for the MDGs have many weaknesses that make them
inappropriate for monitoring development in conflict-affected countries.
First, they are often outdated, especially for certain key MDG indicators. Measles
vaccination coverage (MVC) is an indicator whose value is often repeated from year
to year, raising questions about its reliability. For example, Mozambique and Chad
reported the same coverage for six and five years, respectively, until 2007.
1Those are: HIV prevalence among those aged 15-24; condom use at last high-risk sex; theproportion of those aged 15-24 years with comprehensive correct knowledge of HIV/AIDS; the ratioof school attendance of orphans to school attendance of non-orphans aged 10-14; the proportionof population with advanced HIV infection with access to antiretroviral drugs; the incidence anddeath rates associated with malaria, the proportion of children under 5 sleeping under insecticide-treated bed nets; the proportion of children under 5 with fever who are treated with appropriateanti-malarial drugs; the incidence, prevalence and death rates associated with tuberculosis and theproportion of tuberculosis cases detected and cured under directly observed treatment.
33

Somalia provides a good illustration of the weakness in a global reporting system
for mortality. There, the World Development Indicators report about 0.44 deaths
per 10,000 persons per day (the average Sub-Saharan mortality rate) over the last
six years, probably in the absence of any vital registration system. In reality, nearly
150 surveys from Somalia indicate results near emergency thresholds for the last two
years and in some areas well beyond them (CE-DAT, 2010).
Another example is the Democratic Republic of Congo, for which infant and
under-five mortality rates per 1,000 live births are only available for five years (1990,
1995, 2000, 2005, 2007). When these are transformed into mortality rates per 10,000
persons per day2 and plotted against CE-DAT data (Figure 3.1), almost all of the
survey estimates are not only above the MDG statistics but most are above the
emergency threshold. This paints a very different picture of the situation in the
Democratic Republic of Congo than is reflected using the MDG indicator.
Second, MDG reports rely mainly on MICS, DHS, and LSMS as data sources.
While these are invaluable sources of data from countries that otherwise lack proper
vital registration and reporting, they do not include IDPs, refugee populations, or
indeed, conflict areas. Since conflict-affected population subgroups can represent not
only a substantial part of the country’s population but often some of its poorest,
MDG indicators may therefore be misleading for certain countries.
Third, there is high variability of health indicators reported by humanitarian
NGOs within conflict-affected regions.
For example, measles vaccination coverage can vary from 20% (which is tan-
tamount to no vaccination program) to 95% coverage (which is higher than the
WHO recommended threshold) in different parts of the same region (Figure 3.2,
Table 3.1). Recall that to reduce the risk of measles outbreaks, measles vaccination
coverage should reach and be maintained at the 95% threshold recommended by
SPHERE, especially in crowded emergency settings, or when there are large popu-
lation displacements and high levels of malnutrition.
These differences are critical pieces of information that are not captured in the
2Assuming an even distribution of deaths by age between birth and 12 months and between 12months and 5 years and little change in under-five mortality in the past five years.
34
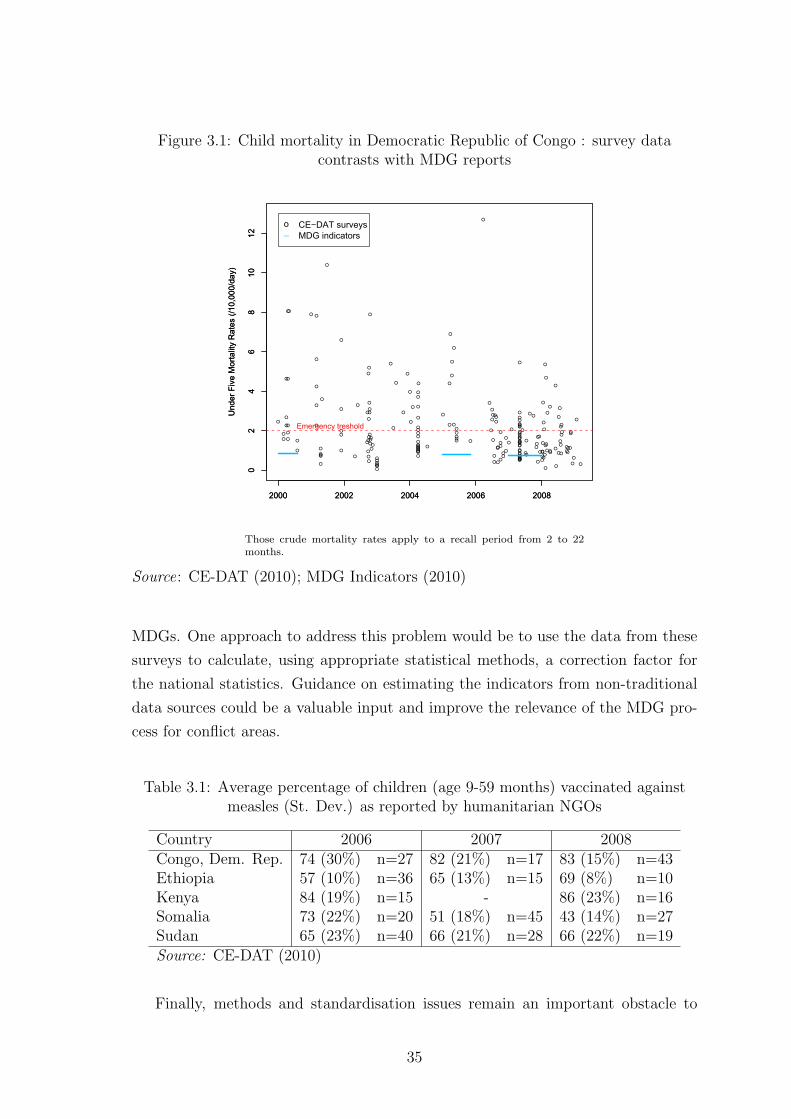
Figure 3.1: Child mortality in Democratic Republic of Congo : survey datacontrasts with MDG reports
●
●●
●
●
●
●
●
●
●
●
●
●
●
● ●
●
●
●
●
●
●●●
●
●
●
●
●
●●
●
●
●
●
●
●
●
●
●
●
●
●
●
●
●●
●
●
●●●
●●
●●●●●●●
●
●
●
●
●
●
●
●
●●
●
●
●●●●●●●●●●●●●●●
●
●
●
●
●
●
●
●
●
●
●●●●● ●
●
●
●
●
●●
●
●
●
●●●
●●
●
●
●●
●
●●
●
●
●
●
●
●●●●●●●●●●●●●●●●●●●●●●●●●●●●●●
●
●
●
●
●●
●●
●
●
●
●
●
●●●
●
●
●
●
●
●
●
●
●
●
●
●
●
●
●●
●
●
●
●
●
●
●●
●
●
●
●●
●●●●●
●●
●
●
●
●
02
46
810
12
Und
er F
ive
Mor
talit
y R
ates
(/10
,000
/day
)
2000 2002 2004 2006 2008
02
46
810
12
Und
er F
ive
Mor
talit
y R
ates
(/10
,000
/day
)
2000 2002 2004 2006 2008
o_
CE−DAT surveysMDG indicators
Emergency treshold
Those crude mortality rates apply to a recall period from 2 to 22months.
Source: CE-DAT (2010); MDG Indicators (2010)
MDGs. One approach to address this problem would be to use the data from these
surveys to calculate, using appropriate statistical methods, a correction factor for
the national statistics. Guidance on estimating the indicators from non-traditional
data sources could be a valuable input and improve the relevance of the MDG pro-
cess for conflict areas.
Table 3.1: Average percentage of children (age 9-59 months) vaccinated againstmeasles (St. Dev.) as reported by humanitarian NGOs
Country 2006 2007 2008Congo, Dem. Rep. 74 (30%) n=27 82 (21%) n=17 83 (15%) n=43Ethiopia 57 (10%) n=36 65 (13%) n=15 69 (8%) n=10Kenya 84 (19%) n=15 - 86 (23%) n=16Somalia 73 (22%) n=20 51 (18%) n=45 43 (14%) n=27Sudan 65 (23%) n=40 66 (21%) n=28 66 (22%) n=19Source: CE-DAT (2010)
Finally, methods and standardisation issues remain an important obstacle to
35

Figure 3.2: Measles vaccination coverage among children 9-59 months in selectedconflict-affected countries, 2006-2008
0 20 40 60 80 100
0.0
0.2
0.4
0.6
0.8
1.0
MC
V c
over
age
0 20 40 60 80 100
0.0
0.2
0.4
0.6
0.8
1.0
Index
0 20 40 60 80 100
0.0
0.2
0.4
0.6
0.8
1.0
0 20 40 60 80 100
0.0
0.2
0.4
0.6
0.8
1.0
0 20 40 60 80 100
0.0
0.2
0.4
0.6
0.8
1.0
WHO treshold
SPHERE treshold
DR CongoSudanKenyaSomaliaEthiopia
Vaccination coverages sorted from highest to lowest.
Source: CE-DAT (2010)
data analysis for conflict countries. Comparisons between surveys are difficult as
age ranges differ between those used by the NGOs (6-59 months) and MICS or DHS
(0-59 months). The same problem arises for statistics on measles vaccination where
NGOs report on vaccination coverage from 9 to 59 months and MDGs report for 12
to 23 months. In addition, to further confuse matters, while acute malnutrition is
the more appropriate indicator for early warning in severe food shortage situations,
underweight is the most widely used indicator for development measurement pur-
poses. This makes it difficult to monitor changes in nutritional conditions during
transition periods using trend analyses. While MICS or DHS are conducted every
5 to 10 years and the smaller sample surveys are undertaken almost continuously,
agreement on methods and definitions would provide some statistical continuity and
comparability over time and space.
36

Chapter 4
Conclusion
Warring factions in several countries have recently signed peace agreements, such
as Burundi, Angola, and Sierra Leone. The glimmer of light after long years of fe-
rocious civil conflict is slightly dimmed by a prognosis of a 50% success rate of
sustained peace (Collier, 2007). Relapse into conflict is common despite energetic
peace negotiations and large-scale development aid. Easterly (2009) suggests that
aid in Africa suffers from a lack of learning: development aid remains in a cycle of
reinventing old ideas instead of testing and discarding failed ones. In a broad sense,
this approach also applies to post-conflict situations where the development or peace
building strategies have often been unable to stabilise societies in a lasting manner
or to provide communities with a reason not to resume fighting. The challenge here
is to learn and apply from the past.
Current post-conflict reconstruction includes programs dealing with democrati-
sation, elections, and other peace process actions that are valued Western concepts
but not necessarily valued across all cultures. Leadership and governance are impor-
tant for stable and free societies but are not, by any stretch of the imagination, low
hanging fruits, especially as these concepts vary across cultures. In contrast, man-
agement of grievances, which can be major drivers in prolonging conflict, can play
a role in reducing inequities and should be addressed appropriately. Particularly,
monitoring key indicators that provide early warning on growing inequities can be
a valuable complement to the political efforts to maintain peace. In the immediate
post-conflict period, where peace agreements are signed and guerrilla warfare has
come to a fragile halt, needs of civil community should be immediately addressed in
order to legitimise the ruling power and provide a reason for the community to stop
supporting the rebels.
37
A reasonable approach for post-conflict development would be to immediately
launch interventions that are visible and tangible to the civil community as peace
dividends. Concrete and practical programmes that improve chances of survival and
livelihoods are such visible signs (Zwi and Grove, 2006; Rushton, 2005; MacQueen,
2000). Community-based health care delivery in post-war Mozambique was success-
fully perceived by the civil population as a sign of normalization of life and encour-
aged the peace process (Pavignani and Colombo, 2001). There are also instances
of ceasefires where warring parties agreed to stop hostilities and allow implementa-
tion of vaccination campaigns (WHO, 2010). Grass roots services - such as garbage
collection and child healthcare - have been observed to be key factors for social sta-
bilisation (Zoellick, 2008). Functioning services such as community health centres
can confer legitimacy on a new local government whose interest in the welfare of its
people becomes tangible.
The main condition for this paradigm to be successful is a better evidence base
for planning and programming in conflict-affected regions.
Firstly, demographic information on conflict-affected communities is invaluable
and critical for post-conflict peace. Effective post-conflict planning also requires
sound evidence on whether major demographic changes have occurred in the pop-
ulation, such as youth bulges, male deficits, uncommonly high fertility rates, male
migration, labour shortages, or increases in women-headed households. Timely data
on mortality, fertility and migration can provide rich insights for post-conflict ac-
tion. Demographic patterns can help identify effective interventions and target the
right subgroups. Equally importantly, population distribution provides the neces-
sary denominators without which rates are not statistically valid or comparable.
Up-to-date demographic data can accurately estimate future population distribu-
tions, which can then be used to build electoral lists or sampling frames for surveys.
Finally, even if census or large-scale surveys cannot be conducted, small-scale sur-
veys, representative of the conflict-affected population, should be one of the very
first steps taken before drawing up development plans.
Secondly, an in-depth understanding of essential livelihood needs, in particular
those pertaining to health and nutrition are essential for effective post-conflict pro-
grammes. Hunger, death and illness should be recognised as central preoccupations
of an individual’s and a community’s sense of well-being, especially in populations
who have experienced or are experiencing armed hostilities. In order to identify the
38

specific needs of conflict-affected communities and appropriately target the services,
much better use can be made of existing data. Creative statistical techniques used in
meta-analyses can piece together data from different sources and could allow a better
understanding of the dynamics of these situations. Furthermore, increased collabo-
ration between initiatives such as MDGs, MICS, DHS and LSMS, and humanitarian
NGOs would substantially enhance the completeness and quality of the data. In
particular, inter-institutional agreements on definitions, methods and standards for
surveys in conflict settings should be a priority. Representativeness of nationwide
surveys in conflict-affected countries would be greatly enhanced with the addition of
an optional module in the survey questionnaire, making them truly representative
of these countries.
The conflict-affected populations, which still number in hundreds of millions,
represent some of the poorest and the most marginalized communities in the world.
They have typically received little attention except for humanitarian relief, which
may have exacerbated their poverty and reduced their options for independent liv-
ing. A development plan that is still rooted in emergency actions but incorporates
progressively long-term policies could provide quick results while supplying building
blocks for sustainable development. Finally, the main barrier to progress is lack of a
knowledge base on the survival needs of these communities, where long-term stability
is underpinned by tangible improvements in household livelihoods - an unmistakable
sign of good governance.
39

Bibliography
Agadjanian, V. and N. Prata (2002), “War, Peace, and Fertility in Angola”,
Demography, 39(2), 215–231.
Blanc, A. K. (2004), “The Role of Conflict in the Rapid Fertility Decline in Eritrea
and Prospects for the Future”, Studies in Family Planning, 35(4), 236–245.
Bongaarts, J. (1980), “Does malnutrition affect fecundity? A summary of evi-
dence”, Science, 208(4444), 564–569.
Bruck, T. and K. Schindler (2009), “The Impact of Violent Conflicts on House-
holds: What Do We Know and What Should We Know about War Widows?”,
Oxford Development Studies, 37(3), 289–309.
Brunborg, H. and E. Tabeau (2005), “Demography of Conflict and Vio-
lence: An Emerging Field”, European Journal of Population/Revue europeenne
de Demographie, 21(2), 131–144.
Brunborg, H. and H. Urdal (2005), “The Demography of Conflict and Violence:
An Introduction”, Journal of Peace Research, 42(4), 371–374.
Burnham, G., R. Lafta, S. Doocy and L. Roberts (2006), “Mortality after the
2003 invasion of Iraq: a cross-sectional cluster sample survey”, Lancet, 368(9545),
1421–8. PMID: 17055943.
CE-DAT (2010), “Complex Emergency Database, Centre for Research on the Epi-
demiology of Disasters (CRED)”, www.cedat.org.
Checchi, F. and L. Roberts (2007), “Interpreting and using mortality data in hu-
manitarian emergencies - A primer for non-epidemiologists”, Humanitarian Prac-
tice Network, (52).
Coghlan, B., R. J. Brennan, P. Ngoy, D. Dofara, B. Otto, M. Clements
and T. Stewart (2006), “Mortality in the Democratic Republic of Congo: a
nationwide survey”, Lancet, 367(9504), 44–51.
40

Collier, P. (2007), The Bottom Billion. Why the poorest countries are failing and
what can be done about it, Oxford Univeristy Press, New York.
Collier, P., H. Hegre, A. Hoeffler, V. L. Elliot, M. Reynal-Querol and
N. Sambanis (2003), Breaking the conflict trap: civil war and development policy,
World Bank and Oxford University Press, Washington, DC.
Connolly, M. A., M. Gayer, M. J. Ryan, P. Salama, P. Spiegel and D. L.
Heymann (2004), “Communicable diseases in complex emergencies: impact and
challenges”, Lancet, 364(9449), 1974–83.
DCD-DAC (2009), “Development Co-operation Directorate, Query Wizard for In-
ternational Development Statistics (QWIDS)”, www.oecd.org/dac/stats/qwids.
de Walque, D. (2005), “Selective Mortality During the Khmer Rouge Period in
Cambodia”, Population and Development Review, 31(2), 351–368.
de Walque, D. and P. Verwimp (2009), “The Demographic and Socio-Economic
Distribution of Excess mortality during the 1994 Genocide in Rwanda”, World
Bank Policy Research Working Paper, (4850).
Degomme, O. and D. Guha-Sapir (2007), “Mortality and nutrition surveys
by Non-Governmental organisations. Perspectives from the CE-DAT database”,
Emerging Themes in Epidemiology, 4(1), 11.
——— (2010), “Patterns of mortality rates in conflict”, The Lancet, 375(9711),
294–300.
Easterly, W. (2009), “Can the West save Africa”, Journal of Economic Literature.
Geneva Declaration (2008), “Global Burden of Armed Violence”, .
Gleditsch, N. P., P. Wallensteen, M. Eriksson, M. Sollenberg and
H. Strand (2002), “Armed Conflict 1946-2001: A New Dataset”, Journal of
Peace Research, 39(5), 615–637.
Guha-Sapir, D. and O. D’Aoust (2009), “The Uncounted Million”, Report,
CRED.
Guha-Sapir, D. and R. Ratnayake (2009), “Consequences of Ongoing Civil
Conflict in Somalia: Evidence for Public Health Responses”, PLoS Med, 6(8).
41

Guha-Sapir, D. and V. Teran Gomez (2006), “Angola: The Human Impact of
War. A data review of field surveys in Angola between 1999 and 2005”, Report,
Centre for Research on the Epidemiology of Disasters.
Guha-Sapir, D. and W. G. van Panhuis (2002), “Armed conflict and public
health”, Report 186, Centre for Research on the Epidemiology of Disasters.
——— (2003), “The importance of conflict-related mortality in civilian popula-
tions”, The Lancet, 361(9375), 2126–2128.
Heuveline, P. (1998), “Between one and three million: towards the demographic
reconstruction of a decade of cambodian history”, Population studies, 52(1), 49–
65.
Homer-Dixon, T. F. (1991), “On the Threshold: Environmental Changes as
Causes of Acute Conflict”, International Security, 16(2), 76–116.
Human Security Report (2010), “The Shrinking Costs of War”, Report.
ICRC (2008), “Iraq: No let-up in the humanitarian crisis”, http://www.icrc.org/.
IDB (2010), “International Data Base, US Census bureau, Population Division”,
http://www.census.gov/ipc/www/idb/.
IDMC (2009), “Internal Displacement Monitoring Centre”, http://www.internal-
displacement.org/.
Kalemli-Ozcan, S. (2002), “A Stochastic Model of Mortality, Fertility, and Human
Capital Investment”, Macroeconomics 0212009, EconWPA.
Lambert, A. and L. Lohle-Tart (2008), “La surmortalite au Congo (RDC) durant
les troubles de 1998-2004 : une estimation des decs en surnombre, scientifiquement
fondee partir des methodes de la demographie”, Report, ADRASS.
Lindstrom, D. P. and B. Berhanu (1999), “The Impact of War, Famine, and
Economic Decline on Marital Fertility in Ethiopia”, Demography, 36(2), 247–261.
MacQueen, G. (2000), “Conflict and health: Peace building through health ini-
tiatives”, BMJ, 321(7256), 293–296.
MDG Indicators (2010), “Millenium Development Goals Indicators”,
http://unstats.un.org/.
42
Neupert, R. and V. Prum (2006), “Cambodia: reconstructing the demographic
stab of the past and forecasting the demographic scar of the future”, dans “The
demography of armed conflict”, , edite par H. Brunborg, E. Tabeau and H. Urdal,
Springer, The Netherlands, p. 247 – 277.
Pavignani, E. and A. Colombo (2001), “Providing health services in countries
disrupted by civil wars: a comparative analysis of Mozambique and Angola”, .
Ratnayake, R., O. Degomme and D. Guha-Sapir (2009), “Coming together to
document mortality in conflict situations: proceedings of a symposium”, Conflict
and Health, 3(1), 2.
Roberts, L., R. Lafta, R. Garfield, J. Khudhairi and G. Burnham (2004),
“Mortality before and after the 2003 invasion of Iraq: cluster sample survey”, The
Lancet, 364(9448), 1857–1864.
Rushton, S. (2005), “Health and Peacebuilding: Resuscitating the Failed State in
Sierra Leone”, International Relations, 441 – 456.
Setel, P. W., S. B. Macfarlane, S. Szreter, L. Mikkelsen, P. Jha, S. Stout
and C. AbouZahr (2007), “A scandal of invisibility: making everyone count by
counting everyone”, Lancet, 370(9598), 1569–1577.
SMART (2010), “Standardized Monitoring and Assessment in Relief and Transi-
tion”, www.smartmethodology.org.
Tabeau, E. and J. Bijak (2005), “War-related Deaths in the 1992-1995 Armed
Conflicts in Bosnia and Herzegovina: A Critique of Previous Estimates and Recent
Results”, European Journal of Population/Revue europeenne de Demographie,
21(2), 187–215.
Toole, M. J. (1995), “Mass population displacement. A global public health chal-
lenge”, Infectious disease clinics of North America, 9(2), 353–66.
UN (2009), “The Millennium Development Goals Report”, Report 12, United Na-
tions.
United Nations (2009), “The Millennium Development Goals Report”, Report,
United Nations.
Urdal, H. (2004), “The Devil in the demographics: the effect of youth bulges
on domestic armed conflict, 1950 - 2000”, Report, Social Development Papers,
Conflict, prevention and Reconstruction.
43
Verwimp, P. and J. V. Bavel (2005), “Child Survival and Fertility of Refugees
in Rwanda”, European Journal of Population/Revue Europeenne de Demographie,
21(2), 271–290.
WHO (2005), “Mortality survey among Internally Displaced Persons and other
affected populations in Greater Darfur, Sudan”, Report.
——— (2010), “Health as Bridge for Peace”,
http://www.who.int/hac/techguidance/hbp/en/index.html.
World Development Indicators (2009), “Data - WDI, GDF & ADI Online
Databases”, www.worldbank.org/data/.../onlinedatabases.html.
Zoellick, R. B. (2008), “Fragile states, securing development”, Geneva, Switzer-
land.
Zwi, A. and N. Grove (2006), Challenges to Human Security: Reflections on
Health, Fragile States and Peacebuilding, Gidlunds frlag, Hedemora, Sweden.
44