“democratic institutions and the regime in taiwan: a study
TRANSCRIPT

“Democratic institutions and the regime in Taiwan: A study of the
similarities and differences of support and approval”
by
Howard B Sanborn, IV
Virginia Military Institute
Prepared for presentation at the Annual Meeting for the American Association for
Chinese Studies, Orlando, FL, October 17, 2009

2
Introduction, Review, and Expectations
The role of legislatures has largely varied across new democracies over the last
few centuries. Many of these bodies have been utilized by opposition parties as the
instruments for change, much as was the case in Taiwan prior to the Second Legislative
Yuan of 1992 and Chen Shui-bian’s victory in 2000. In this way, the population becomes
comfortable with the parliament and accepts its role in the political environment.
Contrast this to new regimes in Eastern Europe, where new regimes instituted legislatures
as the natural consequence of democratic reform. Citizens have less experience with
these institutions and are, subsequently, influenced by a number of factors (Mishler, et al
2007).
It stands to reason, though, that there are indicators of support for the democratic
regime and the Legislative Yuan despite their familiarity to the people of Taiwan. After
all, the island is still a relatively new democracy and legislatures are the fundamental
organs of democratic politics (Loewenberg 2007). However, the Legislative Yuan has
existed in some form since the 1950s. Even though it could do very little to block the
policies of Chiang Kai-shek, it still served as a repository for dissent and allowed for the
emergence of the competitive party system that exists today (Nathan 1993). Opponents
of the Kuomintang (KMT) could not run as an organized opposition, but they were
allowed to serve as outsiders to the party (Tangwai). This opposition later formed the
basis of the Democratic Progressive Party (DPP).
The DPP used its position in the Legislative Yuan to call attention to the excesses
and corruption of the powerful KMT. This included uncovering shady dealings with
corrupt, local officials and collusion with big business. Many KMT members, innocent

3
of these practices yet unwilling to lose favor with their constituents, began to side with
the DPP’s members on legislation. These defections, when combined with a unified
opposition, contributed to the new, competitive party system (Lin, et al 1996; Solinger
2001).
Legislative politics, then, are very familiar to the citizens of Taiwan. In fact, it
can be argued that the Legislative Yuan played a pivotal role in bringing about the
consolidation of democracy (Solinger 2001). Well-functioning democracy may be
relatively new to the island, but party competition (at least in practice) and debate is not.
As noted above, previous scholars have determined that there are certain factors
that predict support (or lack, thereof) of the regime (Mishler and Rose 1994; Mishler et al
2007). In Eastern Europe, these factors are generally related to the economy.
Respondents to the New Democracies Barometer were asked to evaluate the overall
health of the economy in their country, how it has changed, and what they believed the
future would hold. They also evaluated this in relation to their own economic situation.
This was in contrast to the factors that predicted legislative support. These were
often generational in nature, reflecting demographic differences rather than competing
economic perspectives (Rose, et al 2006). However, views of the legislature were subject
to these indicators precisely because these institutions were brand new. The Legislative
Yuan may have only allowed opposition parties in 1985, but it had been in existence for
over thirty years prior.
I come, then to the expectations of my analyses. In relating this prior evaluation
of Eastern Europe to the present analysis of Taiwan, we should expect similarities in the
predictors of regime support but differences in the indicators of legislative support.

4
Respondents in Eastern Europe were guided by their economic evaluations in judging
their support for democracy. Given that the transition to democracy occurred at roughly
the same time, we should expect the support for democracy in Taiwan to be a, largely,
economic consideration.
However, given the history of the Legislative Yuan, we should not expect much
variation in its popularity. Residents of Taiwan have long become accustomed to a
legislature as part of the functions of government. Therefore, I have little expectation for
the predictors of legislative support. Most residents will support the legislature,
regardless of demographic characteristics.
I make one, last methodological note. Regime support and legislative support are
often thought to be reciprocally related (Mishler and Rose 1994). This non-recursive
relationship proves estimation difficult, as the dependent variables are often categorical in
nature. This precludes the use of two stage least squares estimation, as OLS regression
cannot be used to correct for the potential correlation in error terms. Likewise, the use of
an instrumental variable generated with a first stage equation will most likely produce an
inconsistent estimate in the second stage.
I have attempted a number of ways to correct for this potential problem. I have
not been able to produce strong enough instruments to warrant their inclusion in this
paper. Nor, have I been able to produce a more appropriate simultaneous equation model
or use a powerful technique like general method of moments. In the short term, I simply
include the offending variables for each model (regime support to predict legislative
support, and vice versa) and then drop it out. I find that the results largely hold up across
this rudimentary test and I reproduce them here. Suffice it to say, in future iterations of

5
this paper, I will make a more concerted effort to correct for this potentially serious
estimation problem
Analysis
Regime Support
The determinants of regime support differ across the options offered to
respondents in the Asiabarometer poll. Participants were asked which of the following
came closest to their view: “Democracy is always preferable to any other kind of
government,” “under some circumstances, an authoritarian government can be preferable
to a democratic one,” or “for people like me, it does not matter whether we have a
democratic or a nondemocratic regime.” They were also given the option to decline an
answer or not to choose, but I have coded these as missing responses.
At first glance, it is easy to see that democracy is favored, at least in part, by a
good deal of Taiwan’s population. A simple frequency distribution illustrates this.
About half of all valid respondents support democracy as their preferred regime choice,
with another 27% noting that they have no real preference (Table 1). Only about 22%
note a preference for authoritarianism, under certain conditions.
To determine what factors contribute to these regime preferences, I use
multinomial logistic regression. The dependent variable is categorical, which renders
traditional OLS regression inappropriate for this analysis. I do consider using an ordered
logistic regression, since the three categories of the dependent variable range from
authoritarian to indifferent to democracy. However, multinomial logit makes no
assumption about the ordering of the categories, so I use it to present my assessment of

6
regime support. I do confirm the substantive findings from this analysis across these
many statistical techniques.
The results for the multinomial logit are presented in Table 2. I highlight in bold
the variables that are significant at the .10 level, using a two-tailed test. We can note a
number of interesting findings. First, there are a few factors that predict both an
authoritarian preference and democratic preference reasonably well. These variables
include how fair the respondent considered the previous election, how much of an impact
the government has in the respondent’s daily life, how well the respondent views his
own, individual economic circumstances and how satisfied the respondent is with
democracy.
Second, preference for authoritarianism is conditioned by additional economic
considerations, namely a retrospective evaluation of the macro economy. In addition, age
seems to condition support for authoritarianism. Third, democratic preference is
influenced by an initial preference for democracy over economic gains, as well as the
education level of the respondent.
Multinomial logit coefficients are notoriously difficult to interpret. While
something may appear significant, it is near impossible to determine the magnitude of
effect. Therefore, to illustrate the varying importance of each of these significant
predictors, I present the predicted probabilities for each value of the dependent variable.
This represents the likelihood a respondent, by selecting a particular value of the
independent variable of interest, would be to choose a particular category of the
dependent variable, holding all other values constant.

7
Of the significant variables noted above, I first assess the effect of the satisfaction
with democracy variable. The predicted probabilities of this indicator for all three
categories of the regime support variable are presented in Table 3. Here, the magnitude
of effect is easy to see; generally, as satisfaction increases the likelihood of preferring
democracy increases. A respondent who noted that he was “very satisfied” with the way
democracy works in Taiwan would be 71% likely to prefer democracy. Contrast this to a
respondent who said he was “not at all satisfied” with democracy. He would only be
33% likely to select democracy and 28% likely to prefer an authoritarian regime.
This finding makes sense; those satisfied with democracy are surely more likely
to select democracy. However, it is interesting to note that, as satisfaction increases,
indifference moves from the second most likely category to the third most likely
category. In other words, it appears that there is a strong contingent of respondents that
prefer an authoritarian government under certain conditions, and this is somewhat
influence by democratic satisfaction. Most of the movement in the dependent variable
occurs between the democracy and indifferent categories. The implication is that limited
satisfaction with democracy is not driving individuals to support authoritarianism in large
numbers. Instead, respondents are simply more likely to be indifferent as satisfaction
level decreases.
Support for a democratic regime also rises drastically as government impact is
believed to increase (Table 4). Those who say government has “a great deal of impact”
on their daily lives are 62% likely to choose democracy. By contrast, those who say the
government has “no impact at all” are only 44% likely to select democracy. Democratic

8
regime support, then, seems to be partially conditioned by how much respondents
perceive the government to take an active role in everyday activities.
In addition, education is a significant predictor of democratic support.
Respondents with no formal education were only 32% likely to choose this option.
Contrast this to those that have completed high school (56%) and university (63%).
Finally, democratic support is conditioned by how a respondent rated the priority
of economic development in relation to democracy. Those respondents who noted
economic development was “definitely more” important than democracy were only 47%
likely to prefer democracy. Those who said both were “equally important” were 60%
likely to choose democracy, while respondents who said democracy was “definitely
more” important were over 71% likely to prefer a democratic regime.
As for support for authoritarian regime preference (Table 5), respondents seemed
to be influenced by their perceived trust in the pan-green and pan-blue coalitions to
effectively rule. Those respondents that offered a “great deal of trust” in parties were
only 15% likely to prefer an authoritarian regime. This likelihood doubled (30%) when
the respondent noted that they had no trust in parties at all.
Additionally, a retrospective evaluation of macroeconomic conditions led to a
similar change in likelihood. Respondents that thought the economy was performing
better over the previous five years were between 18% and 20% likely to choose
authoritarianism. Those who believed the economy had performed worse over this
period were between 25% and 28% likely, an increase of 10%.
Finally, age was a significant predictor of authoritarian preference. Respondents
in the youngest age category were the most likely to choose an authoritarian regime;
9
those individuals in their twenties were between 34% and 37% likely to select this
preference. Meanwhile, individuals in their seventies were over 20% less likely to
choose authoritarianism.
This is an interesting finding. One might expect that younger individuals would
be more socialized into democratic norms and, thus, more likely to reject authoritarianism
than older respondents. The reverse, however, is true. Older respondents are less likely
to offer support for an authoritarian option than their younger counterparts.
What makes this even more peculiar is that older respondents are less likely to say
they are satisfied with democracy than younger respondents (Table 6). One potential
reason for this finding is that, rather than be socialized into democratic support, younger
respondents have limited or no memory of the authoritarian regime that dominated
Taiwan into the 1990s. Older respondents would remember this regime well, and are
subsequently unwilling to entertain a return to a government of this sort.
There are a few conclusions we can reach about regime support in Taiwan.
Satisfaction with democracy is a highly significant predictor of regime choice. If
respondents report they are happy with democracy, they are much more likely to support
the democratic regime than those who are not very satisfied. While this is an important
finding, it raises more questions than it answers. Most notably, it begs the question:
What makes people in Taiwan support democracy?
Certainly, there are three general findings in this regard. First, the perceived
impact of the government affects the support for democracy; there is a 20% decrease in
support from those who see a great impact of the government to those who see no impact
at all. Second, education drastically influences support for democracy, with a swing of
10
over 30% from the least educated to the most educated. Third, the prioritization of
democracy in relation to the economy matters a great deal. Those that pressed for
economic development were roughly 25% less likely to choose democracy than those that
believed preserving democracy was most important.
In some ways, these findings reflect prior literature on regime support. While the
macro and sociotropic evaluations of the economy do not seem to have as much of an
impact on regime support in Taiwan as in other countries, perceptions of the economy do
matter. More specifically, those respondents that put the economy ahead of democracy
were much less likely to support a democratic regime. So, even though evaluations of
economic performance did not greatly influence regime choice, the a priori preference of
economic development over democratic governance strongly affected the likelihood a
respondent would select democracy as their preferred governmental structure.
Legislative Support
To determine why individuals supported the removal of parliament, I include
many of the same measures in a model of legislative support that were included above to
explain regime support. The dependent variable is clearly scaled, however, which allows
for the use of ordered logistic regression. As before, the substantive findings here are the
same across a number of estimation techniques.
The dependent variable is whether a respondent approves or disapproves of the
following statement: “We should get rid of parliament and elections and have a strong
leader decide things.” There are four categories of response: strongly agree, agree,
disagree, and strongly disagree. For my purposes, I combine the first two categories, as

11
there is no substantive difference in the analysis between these two and because so few
respondents chose strongly agree as an answer choice. A lower score on this scale means
agreement with the statement and less support for the legislature. Higher scores mean
disagreement and more support for the legislature.
This is a less than ideal proxy for a more traditional legislative support variable. I
would prefer to use a more direct measure of whether one supports the actions of the
legislature or not. Additionally, I would also want a measure of how optimistic the
respondent would be of meaningful legislative activity into the future. Though, there is a
measure of whether the legislature should be allowed to check the actions of the
government, it, like this question, may more reflect the views of the strong leader being
checked than the legislature.
I present the results of the ordered logit in Table 7. As before, I bold and italicize
the variables that are significant at the .10 level, two-tailed. Many of these variables were
significant in the regime support model, and there is some support for prior research
models. At first glance, support for the legislature.is determined in part by demographic
characteristics, like religiosity, identity, and education. Also, as above, a priori
preferences about the role of government, and democracy specifically, have a significant
influence on legislative support. Finally, trust in parties and the institution itself are
reliable indicators of legislative support.
All of these indicators, though, offer little in the way of explaining the
disapproval category. They do help illustrate variations in strong support for the
legislature (strongly disapprove) and little to no support for the legislature (approve).
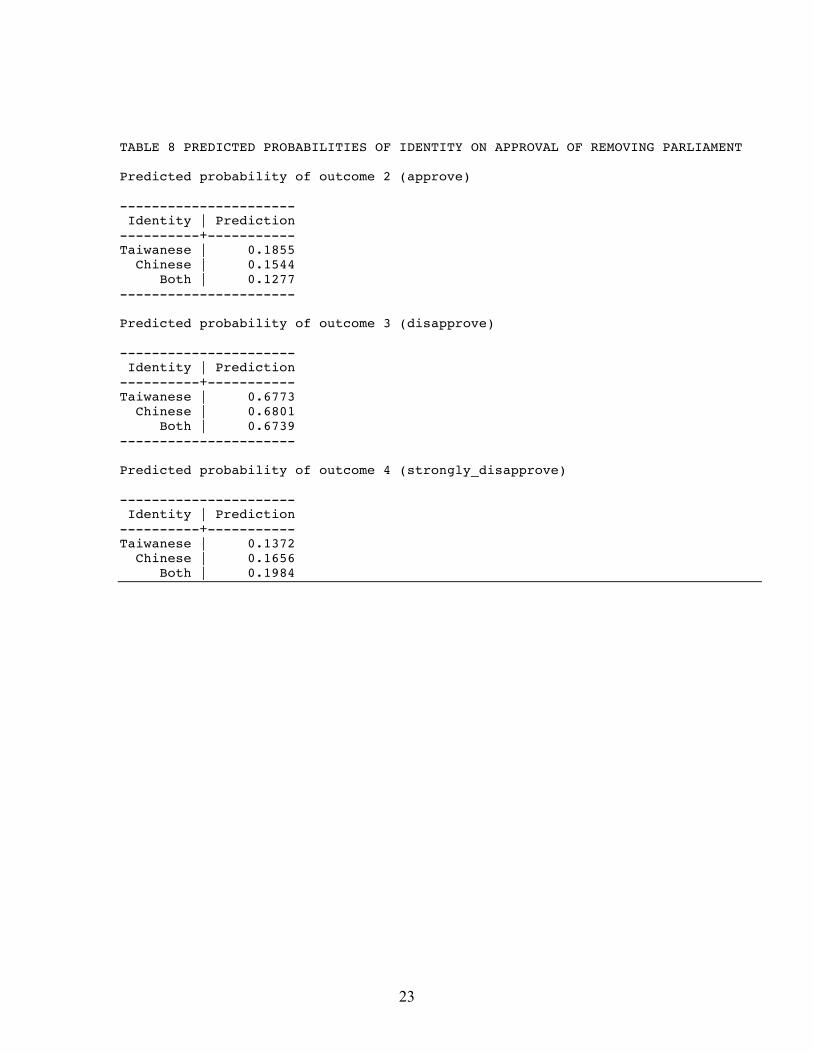
This is evidenced by the demographic characteristics noted above. Identity does not have

12
a large effect, in magnitude, on legislative support even though it is highly significant.
What’s more, the probability of the disapproval category remains largely unchanged.
There is only movement in the approve category and strongly disapprove category, a 6%
swing for each (Table 8). The same is true for both of these categories using the
religiosity variable (Table 9; 7% swing)
There is more support for education as a meaningful predictor of legislative
support (Table 10). Those respondents with no formal education would be 30% likely to
approve the removal of the parliament, and only 8% likely to strongly disapprove.
Contrast this to those who completed high school; they would only be 15% likely to
approve of the legislature’s removal. This drops to 11% for respondents that have
completed college.
Turning to attitudes toward democracy, we find similar results. Using the
indicator from before that asked respondents to prioritize economic development or
democracy (Table 11), I find a significant fluctuation across all three categories of the
dependent variable. For the approval of legislative removal category, there is over a 10%
decrease in the likelihood as one moves from selecting economic development as a
priority to selecting democracy. For the strongly disapprove category, we see a 20%
increase in likelihood as we move from economic development to democracy.
For the middle, disapprove category, there is some movement – a roughly 8%
swing. However, the highest likelihood of choosing this category, of disapproving of
removing parliament, occurs amongst those that prioritize economic development over
democracy! While the approve and strongly disapprove categories follow expectations,
the findings for the likelihood of choosing disapprove imply that there are people who

13
believe more in the primacy of economic development yet are hesitant to part with
democratic institutions in the name of furthering this goal. Overall, while disapproval is
the most popular option, it means something very different for the individuals that
selected it than the strongly disapprove option did for the respondents that chose it.
We see similar movements as before with regard to whether the legislature should
serve as a check on government (Table 12), how much impact the government has on
respondents’ daily lives (Table 13), and how respondents’ view the past economic
performance of the government (Table 14). In all three cases, there are small swings in
likelihood of the approve and strongly disapprove categories, while the disapprove
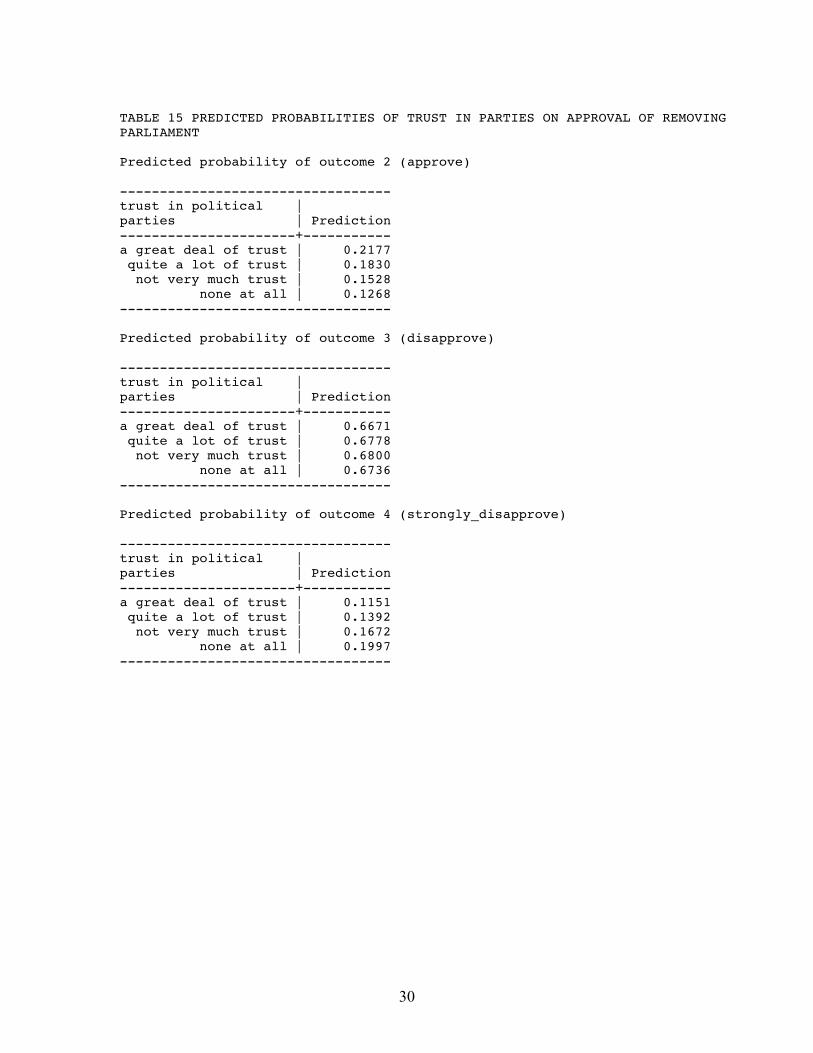
category remains largely unchanged. This also is true of the trust indicators. There are
roughly 10% swings in the approve and strongly disapprove categories (Tables 15 and
16).
Generally speaking, the main finding is that legislative support remains consistent
and robust across all indicators. Respondents in Taiwan generally do not want their
parliament removed in favor of a strong leader. This follows from my expectations noted
in the introductory section; the Legislative Yuan’s familiarity to the residents of Taiwan
leaves it largely immune to variations in support. Where there is fluctuation is on the
tails of the distribution; the indicators above can predict changes in approval to remove
parliament, as well as a strong disapproval of removing parliament. The one indicator
that provides some intrigue is the economic prioritization variable. While there is not
much change, it demonstrates that there is limited support for legislatures despite the
drive to unfetter economic progress. Ultimately, further work is needed to determine
why this support for the legislature is so static.

14
Conclusion
The determinants of legislative and regime support still remain somewhat elusive
in the case of Taiwan. There is much that is similar here that is true of support for these
institutions in other countries. However, there are enough differences to make Taiwan an
interesting case for further study in the future. Indicators related to the economy are the
strongest predictors of regime and legislative support, yet not in the manner that has been
found in cases in Eastern Europe. Evaluations of economic performance matter in
Taiwan but, more importantly, where respondents place democracy in relation to the
economy on their list of priorities is a telling indicator. This aside, it appears that the
democratic regime, and especially the Legislative Yuan, received a great deal of support
and will most likely continue to do so into the future.

15
Bibliography Loewenberg, G. 2007. “Paradoxes of Legislatures.” Daedalus 136 (Summer): 56-66. Mishler, W. and Rose, R. 1994. “Support for Parliaments and Regimes in the Transition toward Democracy in Eastern Europe.” Legislative Studies Quarterly XIX (February): 5-32. Mishler, W, Loewenberg, G, and Sanborn, IV, H. “Developing Attachments to New Political Institutions: A Multi-Level Model of Attitude Formation in Post-Communist Europe.” Presented at the Annual Meeting of American Political Science Association, September 2007, Chicago, IL. Nathan, A. 1993. “The Legislative Yuan Elections in Taiwan: Consequences of the Electoral System.” Asian Survey 33 (April): 424-438. Rose, R, Mishler, W, and Munro, N. 2006. Russia Transformed? Developing Popular Support For A New Regime. Cambridge University Press: Cambridge, UK Solinger, D. 2001 “Ending One-Party Dominance: Korea, Taiwan, Mexico” Journal of Democracy 12 (January). Lin, T, Chu, Y, and Hinich, M. 1996. “Conflict Displacement and Regime Transition in Taiwan: A Spatial Analysis.” World Politics 48 (July): 453-481.

16
TABLE 1 FREQUENCY DISTRIBUTION OF REGIME SUPPORT which of the following statements comes | closest to your own opinion | Freq. Percent Cum. ----------------------------------------+----------------------------------- democracy is always preferable to any o | 754 50.95 50.95 under some circumstances, an authoritar | 327 22.09 73.04 for people like me, it does not matter | 399 26.96 100.00 ----------------------------------------+----------------------------------- Total | 1,480 100.00

17
TABLE 2: REGIME SUPPORT USING MULTINOMIAL LOGIT Multinomial logistic regression Number of obs = 1027 LR chi2(36) = 194.95 Prob > chi2 = 0.0000 Log likelihood = -952.80554 Pseudo R2 = 0.0928 ------------------------------------------------------------------------------ orderedreg~t | Coef. Std. Err. z P>|z| [95% Conf. Interval] -------------+---------------------------------------------------------------- AUTHORITARIAN econordemoc | .1194385 .0977327 1.22 0.222 -.0721142 .3109911 macropresent | -.0065808 .1137589 -0.06 0.954 -.2295442 .2163825 macropast | .1735098 .095366 1.82 0.069 -.0134041 .3604238 macrofuture | -.0082097 .1048931 -0.08 0.938 -.2137964 .197377 sociopresent | -.2096035 .1251891 -1.67 0.094 -.4549697 .0357627 sociopast | .0290108 .1128981 0.26 0.797 -.1922654 .250287 sociofuture | -.0829295 .1233001 -0.67 0.501 -.3245932 .1587342 trustPM | -.1860243 .1747361 -1.06 0.287 -.5285007 .1564521 trustGOV | -.1513617 .1870182 -0.81 0.418 -.5179107 .2151873 trustPARTY | .4237912 .1808522 2.34 0.019 .0693274 .778255 trustPARL | .0607746 .1600318 0.38 0.704 -.252882 .3744313 education | .0694646 .05392 1.29 0.198 -.0362167 .1751458 agegroup | -.1273181 .0435964 -2.92 0.003 -.2127656 -.0418707 religiosity | -.011584 .0379974 -0.30 0.760 -.0860575 .0628895 voteforwin~r | -.1522538 .1228044 -1.24 0.215 -.392946 .0884385 fairnessof~n | .3181509 .1118691 2.84 0.004 .0988914 .5374104 govimpact | -.2706708 .1156413 -2.34 0.019 -.4973236 -.044018 democsatis~d | -.3002684 .1545273 -1.94 0.052 -.6031363 .0025994 _cons | .4980035 1.016693 0.49 0.624 -1.494678 2.490685 -------------+---------------------------------------------------------------- DEMOCRACY econordemoc | .3237815 .08609 3.76 0.000 .1550483 .4925147 macropresent | .0727765 .1011371 0.72 0.472 -.1254486 .2710016 macropast | .0312796 .0831513 0.38 0.707 -.1316939 .1942531 macrofuture | -.1323884 .0943419 -1.40 0.161 -.3172951 .0525183 sociopresent | -.2422545 .1112248 -2.18 0.029 -.4602511 -.0242579 sociopast | -.1021353 .1005685 -1.02 0.310 -.299246 .0949754 sociofuture | -.1494347 .1113104 -1.34 0.179 -.3675991 .0687296 trustPM | -.0928751 .1548541 -0.60 0.549 -.3963835 .2106333 trustGOV | -.1851147 .1671271 -1.11 0.268 -.5126777 .1424483 trustPARTY | .1640022 .1580086 1.04 0.299 -.145689 .4736934 trustPARL | .2062895 .1394148 1.48 0.139 -.0669585 .4795374 education | .19779 .0468515 4.22 0.000 .1059627 .2896173 agegroup | .0530357 .0368781 1.44 0.150 -.019244 .1253154 religiosity | .0252633 .0334205 0.76 0.450 -.0402395 .0907662 voteforwin~r | -.0060763 .1118424 -0.05 0.957 -.2252832 .2131307 fairnessof~n | .2172569 .0995074 2.18 0.029 .022226 .4122877 govimpact | -.3936306 .1044384 -3.77 0.000 -.5983261 -.188935 democsatis~d | -.6931813 .1406141 -4.93 0.000 -.9687799 -.4175827 _cons | 1.584481 .8992264 1.76 0.078 -.1779707 3.346932 ------------------------------------------------------------------------------ (orderedregimesupport==For people like me, it does not is the base outcome)

18
TABLE 3 PREDICTED PROBABILITIES OF REGIME SUPPORT BASED ON SATISFACTION WITH DEMOCRACY AUTHORITARIAN --------------------------------- on the whole, how | satisfied or | dissatisfied are you | with the way | democracy works | Prediction ---------------------+----------- very satisfied | 0.1825 fairly satisfied | 0.2268 not very satisfied | 0.2617 not at all satisfied | 0.2772 --------------------------------- DEMOCRACY --------------------------------- on the whole, how | satisfied or | dissatisfied are you | with the way | democracy works | Predictio ---------------------+----------- very satisfied | 0.7133 fairly satisfied | 0.5984 not very satisfied | 0.4660 not at all satisfied | 0.3333 --------------------------------- INDIFFERENT --------------------------------- on the whole, how | satisfied or | dissatisfied are you | with the way | democracy works | Prediction ---------------------+----------- very satisfied | 0.1042 fairly satisfied | 0.1748 not very satisfied | 0.2723 not at all satisfied | 0.3895 ---------------------------------

19
TABLE 4 PREDICTED PROBABILITIES OF DEMOCRATIC REGIME SUPPORT GOVERNMENT IMPACT ----------------------------------- how much impact do you | feel government | politics have on your | daily life | Prediction -----------------------+----------- a great deal of impact | 0.6234 quite some impact | 0.5673 a little impact | 0.5048 no impact at all | 0.4378 ----------------------------------- EDUCATION | Prediction -----------------------------------------+----------- no formal education | 0.3200 incomplete primary/elementary | 0.3573 complete primary/elementary | 0.3962 incomplete secondary/high school: techni | 0.4362 complete secondary/high school: technica | 0.4767 incomplete secondary/high school | 0.5172 complete secondary/high school | 0.5572 some university education | 0.5962 university education completed | 0.6337 post-graduate degree | 0.6694 ----------------------------------------------------- ECONOMY VERSUS DEMOCRACY ----------------------------------------------------- if you had to choose between democracy | and economic development, which would | you | Prediction -----------------------------------------+----------- economic development is definitely more | 0.4684 economic development is somewhat more im | 0.5339
they are both equally important | 0.5974 democracy is somewhat more important | 0.6570 democracy is definitely more important | 0.7113 -----------------------------------------------------

20
TABLE 5 PREDICTED PROBABILITIES OF AUTHORITARIAN REGIME SUPPORT TRUST IN PARTIES ---------------------------------- trust in political | parties | Prediction ----------------------+----------- a great deal of trust | 0.1451 quite a lot of trust | 0.1886 not very much trust | 0.2405 none at all | 0.3002 ---------------------------------- AGE ---------------------- group of | age | Prediction ----------+----------- 20-24 | 0.3724 25-29 | 0.3350 30-34 | 0.2995 35-39 | 0.2661 40-44 | 0.2351 45-49 | 0.2066 50-54 | 0.1806 55-59 | 0.1572 60-70 | 0.1363 71-75 | 0.1177 above76 | 0.1013 ---------------------- MACROECONOMIC PAST ---------------------------- how would you | describe the | change in the | economic | condition of | our country | over | Prediction ----------------+----------- much better | 0.1761 a little better | 0.1992 about the same | 0.2244 a little worse | 0.2518 much worse | 0.2812 ----------------------------

21
TABLE 6 CROSSTABULATION OF AGE AND DEMOCRATIC SUPPORT, in percents | on the whole, how satisfied or dissatisfied group of | are you with the way democracy works age | very sati fairly sa not very not at al | Total -----------+--------------------------------------------+---------- 20-24 | 4.49 61.54 30.77 3.21 | 100.00 25-29 | 4.17 57.74 31.55 6.55 | 100.00 30-34 | 2.45 58.90 34.97 3.68 | 100.00 35-39 | 5.19 56.49 29.22 9.09 | 100.00 40-44 | 3.16 51.90 37.97 6.96 | 100.00 45-49 | 3.85 51.10 40.11 4.95 | 100.00 50-54 | 3.47 46.53 41.67 8.33 | 100.00 55-59 | 3.39 52.54 40.68 3.39 | 100.00 60-70 | 5.96 56.95 31.13 5.96 | 100.00 71-75 | 7.55 49.06 39.62 3.77 | 100.00 above76 | 4.84 51.61 40.32 3.23 | 100.00 -----------+--------------------------------------------+---------- Total | 4.17 54.61 35.59 5.63 | 100.00

22
TABLE 7 ORDERED LOGISTIC REGRESSION OF SUPPORT FOR PARLIAMENT Ordered logistic regression Number of obs = 951 LR chi2(20) = 129.94 Prob > chi2 = 0.0000 Log likelihood = -806.65606 Pseudo R2 = 0.0745 ------------------------------------------------------------------------------ newlegelec~t | Coef. Std. Err. z P>|z| [95% Conf. Interval] -------------+---------------------------------------------------------------- econordemoc | .2966385 .0637609 4.65 0.000 .1716695 .4216076 goodlegcheck | .2777416 .1139516 2.44 0.015 .0544005 .5010826 macropresent | -.0043939 .0822715 -0.05 0.957 -.165643 .1568552 macropast | .162085 .0664935 2.44 0.015 .0317601 .2924099 macrofuture | -.0414014 .0760969 -0.54 0.586 -.1905486 .1077457 sociopresent | -.0709244 .0914184 -0.78 0.438 -.2501011 .1082523 sociopast | -.0752257 .0816233 -0.92 0.357 -.2352044 .084753 sociofuture | .0181637 .089757 0.20 0.840 -.1577568 .1940841 trustPM | .0072333 .1243289 0.06 0.954 -.2364468 .2509134 trustGOV | .101985 .1341196 0.76 0.447 -.1608846 .3648546 trustPARTY | .2169764 .1313674 1.65 0.099 -.0404991 .4744518 trustPARL | .2557363 .1155619 2.21 0.027 .0292391 .4822335 partyrecode3 | -.0085287 .10144 -0.08 0.933 -.2073474 .1902901 identity | .2210498 .0787032 2.81 0.005 .0667944 .3753053 education | .1556361 .0389158 4.00 0.000 .0793626 .2319097 agegroup | -.0092878 .0286652 -0.32 0.746 -.0654705 .0468949 religiosity | -.0514841 .0277801 -1.85 0.064 -.1059321 .0029638 fairnessof~n | .0938026 .0838056 1.12 0.263 -.0704534 .2580586 govimpact | -.2085702 .0829028 -2.52 0.012 -.3710568 -.0460836 democsatis~d | -.0762377 .1116535 -0.68 0.495 -.2950745 .1425991 -------------+---------------------------------------------------------------- /cut1 | 2.002752 .7635689 .5061844 3.49932 /cut2 | 5.3209 .7856706 3.781014 6.860786 ------------------------------------------------------------------------------
23
TABLE 8 PREDICTED PROBABILITIES OF IDENTITY ON APPROVAL OF REMOVING PARLIAMENT Predicted probability of outcome 2 (approve) ---------------------- Identity | Prediction ----------+----------- Taiwanese | 0.1855 Chinese | 0.1544 Both | 0.1277 ---------------------- Predicted probability of outcome 3 (disapprove) ---------------------- Identity | Prediction ----------+----------- Taiwanese | 0.6773 Chinese | 0.6801 Both | 0.6739 ---------------------- Predicted probability of outcome 4 (strongly_disapprove) ---------------------- Identity | Prediction ----------+----------- Taiwanese | 0.1372 Chinese | 0.1656 Both | 0.1984

24
TABLE 9 PREDICTED PROBABILITIES OF RELIGIOSITY ON APPROVAL OF REMOVING PARLIAMENT Predicted probability of outcome 2 (approve) ----------------------------------------------------- religiosity | Prediction -----------------------------------------+----------- several times a day | 0.1150 once a day | 0.1204 several times a week | 0.1259 once a week | 0.1317 several times a month | 0.1377 once a month | 0.1439 only during festivals (or several times | 0.1504 less often (once a year) | 0.1571 less often | 0.1640 practically never | 0.1712 ----------------------------------------------------- Predicted probability of outcome 3 (disapprove) ----------------------------------------------------- religiosity | Prediction -----------------------------------------+----------- several times a day | 0.6670 once a day | 0.6703 several times a week | 0.6732 once a week | 0.6755 several times a month | 0.6774 once a month | 0.6788 only during festivals (or several times | 0.6797 less often (once a year) | 0.6802 less often | 0.6801 practically never | 0.6796 ----------------------------------------------------- Predicted probability of outcome 4 (strongly_disapprove) ----------------------------------------------------- religiosity | Prediction -----------------------------------------+----------- several times a day | 0.2179 once a day | 0.2093 several times a week | 0.2009 once a week | 0.1928 several times a month | 0.1849 once a month | 0.1772 only during festivals (or several times | 0.1699 less often (once a year) | 0.1627 less often | 0.1558 practically never | 0.1492 -----------------------------------------------------

25
TABLE 10 PREDICTED PROBABILITIES OF EDUCATION ON APPROVAL OF REMOVING PARLIAMENT Predicted probability of outcome 2 (approve) ----------------------------------------------------- education | Prediction -----------------------------------------+----------- no formal education | 0.3032 incomplete primary/elementary | 0.2714 complete primary/elementary | 0.2417 incomplete secondary/high school: techni | 0.2144 complete secondary/high school: technica | 0.1893 incomplete secondary/high school | 0.1666 complete secondary/high school | 0.1461 some university education | 0.1277 university education completed | 0.1113 post-graduate degree | 0.0969 ----------------------------------------------------- Predicted probability of outcome 3 (disapprove) ----------------------------------------------------- education | Prediction -----------------------------------------+----------- no formal education | 0.6199 incomplete primary/elementary | 0.6400 complete primary/elementary | 0.6562 incomplete secondary/high school: techni | 0.6685 complete secondary/high school: technica | 0.6764 incomplete secondary/high school | 0.6800 complete secondary/high school | 0.6792 some university education | 0.6740 university education completed | 0.6644 post-graduate degree | 0.6507 ----------------------------------------------------- Predicted probability of outcome 4 (strongly_disapprove) ----------------------------------------------------- education | Prediction -----------------------------------------+----------- no formal education | 0.0768 incomplete primary/elementary | 0.0886 complete primary/elementary | 0.1020 incomplete secondary/high school: techni | 0.1172 complete secondary/high school: technica | 0.1343 incomplete secondary/high school | 0.1534 complete secondary/high school | 0.1747 some university education | 0.1983 university education completed | 0.2242 post-graduate degree | 0.2525 -----------------------------------------------------

26
TABLE 11 PREDICTED PROBABILITIES OF ECONOMY VERSUS DEMOCRACY PREFERENCE ON APPROVAL OF REMOVING PARLIAMENT Predicted probability of outcome 2 (approve) ----------------------------------------------------- if you had to choose between democracy | and economic development, which would | you | Prediction -----------------------------------------+----------- economic development is definitely more | 0.2007 economic development is somewhat more im | 0.1573 they are both equally important | 0.1218 democracy is somewhat more important | 0.0935 democracy is definitely more important | 0.0712 ----------------------------------------------------- Predicted probability of outcome 3 (disapprove) ----------------------------------------------------- if you had to choose between democracy | and economic development, which would | you | Prediction -----------------------------------------+----------- economic development is definitely more | 0.6733 economic development is somewhat more im | 0.6802 they are both equally important | 0.6711 democracy is somewhat more important | 0.6466 democracy is definitely more important | 0.6079 ----------------------------------------------------- Predicted probability of outcome 4 (strongly_disapprove) ----------------------------------------------------- if you had to choose between democracy | and economic development, which would | you | Prediction -----------------------------------------+----------- economic development is definitely more | 0.1261 economic development is somewhat more im | 0.1626 they are both equally important | 0.2071 democracy is somewhat more important | 0.2600 democracy is definitely more important | 0.3210 -----------------------------------------------------

27
TABLE 12 PREDICTED PROBABILITIES OF LEGISLATIVE CHECK PREFERENCE ON APPROVAL OF REMOVING PARLIAMENT Predicted probability of outcome 2 (approve) ------------------------------ if the government | is constantly | checked by the | legislature, it | cannot possibly a | Prediction ------------------+----------- strongly agree | 0.2063 somewhat agree | 0.1645 somewhat disagree | 0.1298 strongly disagree | 0.1015 ------------------------------ Predicted probability of outcome 3 (disapprove) ------------------------------ if the government | is constantly | checked by the | legislature, it | cannot possibly a | Prediction ------------------+----------- strongly agree | 0.6714 somewhat agree | 0.6801 somewhat disagree | 0.6748 strongly disagree | 0.6557 ------------------------------ Predicted probability of outcome 4 (strongly_disapprove) ------------------------------ if the government | is constantly | checked by the | legislature, it | cannot possibly a | Prediction ------------------+----------- strongly agree | 0.1223 somewhat agree | 0.1554 somewhat disagree | 0.1954 strongly disagree | 0.2428 ------------------------------

28
TABLE 13 PREDICTED PROBABILITIES OF GOVERNMENT IMPACT ON APPROVAL OF REMOVING PARLIAMENT Predicted probability of outcome 2 (approve) ----------------------------------- how much impact do you | feel government | politics have on your | daily life | Prediction -----------------------+----------- a great deal of impact | 0.1178 quite some impact | 0.1413 a little impact | 0.1685 no impact at all | 0.1998 ----------------------------------- Predicted probability of outcome 3 (disapprove) ----------------------------------- how much impact do you | feel government | politics have on your | daily life | Prediction -----------------------+----------- a great deal of impact | 0.6688 quite some impact | 0.6783 a little impact | 0.6799 no impact at all | 0.6735 ----------------------------------- Predicted probability of outcome 4 (strongly_disapprove) ----------------------------------- how much impact do you | feel government | politics have on your | daily life | Prediction -----------------------+----------- a great deal of impact | 0.2134 quite some impact | 0.1804 a little impact | 0.1516 no impact at all | 0.1267 -----------------------------------

29
TABLE 14 PREDICTED PROBABILITIES OF PAST MACRO ECONOMIC PERFORMANCE ON APPROVAL OF REMOVING PARLIAMENT Predicted probability of outcome 2 (approve) ---------------------------- how would you | describe the | change in the | economic | condition of | our country | over | Prediction ----------------+----------- much better | 0.2162 a little better | 0.1900 about the same | 0.1663 a little worse | 0.1450 much worse | 0.1261 ---------------------------- Predicted probability of outcome 3 (disapprove) ---------------------------- how would you | describe the | change in the | economic | condition of | our country | over | Prediction ----------------+----------- much better | 0.6677 a little better | 0.6762 about the same | 0.6800 a little worse | 0.6790 much worse | 0.6732 ---------------------------- Predicted probability of outcome 4 (strongly_disapprove) ---------------------------- how would you | describe the | change in the | economic | condition of | our country | over | Prediction ----------------+----------- much better | 0.1161 a little better | 0.1338 about the same | 0.1537 a little worse | 0.1760 much worse | 0.2007 ----------------------------
30
TABLE 15 PREDICTED PROBABILITIES OF TRUST IN PARTIES ON APPROVAL OF REMOVING PARLIAMENT Predicted probability of outcome 2 (approve) ---------------------------------- trust in political | parties | Prediction ----------------------+----------- a great deal of trust | 0.2177 quite a lot of trust | 0.1830 not very much trust | 0.1528 none at all | 0.1268 ---------------------------------- Predicted probability of outcome 3 (disapprove) ---------------------------------- trust in political | parties | Prediction ----------------------+----------- a great deal of trust | 0.6671 quite a lot of trust | 0.6778 not very much trust | 0.6800 none at all | 0.6736 ---------------------------------- Predicted probability of outcome 4 (strongly_disapprove) ---------------------------------- trust in political | parties | Prediction ----------------------+----------- a great deal of trust | 0.1151 quite a lot of trust | 0.1392 not very much trust | 0.1672 none at all | 0.1997 ----------------------------------

31
TABLE 16 PREDICTED PROBABILITIES OF TRUST IN PARLIAMENT ON APPROVAL OF REMOVING PARLIAMENT Predicted probability of outcome 2 (approve) ---------------------------------- trust in parliament | Prediction ----------------------+----------- a great deal of trust | 0.2311 quite a lot of trust | 0.1888 not very much trust | 0.1527 none at all | 0.1225 ---------------------------------- Predicted probability of outcome 3 (disapprove) ---------------------------------- trust in parliament | Prediction ----------------------+----------- a great deal of trust | 0.6614 quite a lot of trust | 0.6765 not very much trust | 0.6800 none at all | 0.6715 ---------------------------------- Predicted probability of outcome 4 (strongly_disapprove) ---------------------------------- trust in parliament | Prediction ----------------------+----------- a great deal of trust | 0.1075 quite a lot of trust | 0.1347 not very much trust | 0.1673 none at all | 0.2061 ----------------------------------