democracy and foreign education - imf.org · afghanistan), luc ferry (minister of education,...
TRANSCRIPT

WP/07/51
Democracy and Foreign Education
Antonio Spilimbergo

© 2007 International Monetary Fund WP/07/51 IMF Working Paper Research Department
Democracy and Foreign Education
Prepared by Antonio Spilimbergo1
Authorized for distribution by Arvind Subramanian
March 2007
Abstract
This Working Paper should not be reported as representing the views of the IMF. The views expressed in this Working Paper are those of the author(s) and do not necessarily represent those of the IMF or IMF policy. Working Papers describe research in progress by the author(s) and are published to elicit comments and to further debate.
Do foreign-educated individuals play a role in promoting democracy in their home countries? Despite the large amount of private and public resources spent on foreign education, there is no systematic evidence that foreign-educated individuals foster democracy in their home countries. Using a unique panel dataset on foreign students starting from 1950, I show that, indeed, foreign-educated individuals promote democracy in their home country, but only if the foreign education is acquired in democratic countries. The results are robust to reverse causality, country-specific omitted variables, and inclusion of a variety of control variables. The results are stronger for small countries. JEL Classification Numbers: D72, D74, H11 Keywords:
Education, democracy, development, institutions, international students
Author’s E-Mail Address:
1 I thank my colleagues at the IMF for useful discussions and the participants to the 2006 National Bureau of Economic Research (NBER) summer institute group on national security; I am particularly indebted to Daron Acemoglu, Olivier Blanchard, Charles Clotfelter, Steven Davis, Martin Feldstein, Simon Johnson, Kala Krishna, James Rauch, Andy Rose, and Arvind Subramanian for useful suggestions, and to Pierre Yared and Ben Jones for sharing their data. José Romero provided excellent research assistantship.

2
Contents Page I. Introduction ........................................................................................................................... 3 II. Literature Review................................................................................................................. 5 III. Stylized Facts on Foreign Education and Democracy ........................................................ 6 IV. Results................................................................................................................................. 9 V. Determinants of Foreign Education and Reverse Causality .............................................. 11 VI. Robustness ........................................................................................................................ 15
A. Omitted Variables .......................................................................................................... 15 B. First Differences............................................................................................................. 17 C. Long-Run Differences.................................................................................................... 17 D. Alternative Specification for Foreign Students.............................................................. 18 E. Heterogeneity in Sample: Time...................................................................................... 18 F. Heterogeneity in Sample: Country Size ......................................................................... 19 G. Stay Rates....................................................................................................................... 19
VII. Interpretation and Conclusions........................................................................................ 20 Appendix I. Data..................................................................................................................... 24 References............................................................................................................................... 47 Figures 1. Total Foreign Students........................................................................................................ 26 2. Host Countries .................................................................................................................... 27 3. Chile.................................................................................................................................... 28 4. Argentina............................................................................................................................. 29 5. Iran ...................................................................................................................................... 30 6. Republic of Korea ............................................................................................................... 31 7. Democracy in Home Versus Host Countries ...................................................................... 32 Tables 1a. Dependent Variable: Freedom House Index of Political Freedom—Level ...................... 33 1b. Dependent Variable: Freedom House Index of Political Freedom—Differences ............ 34 2a. Dependent Variable: Polity2 ............................................................................................. 35 2b. Dependent Variable: Polity2—Differences ...................................................................... 36 3a. Dependent Variable: Przeworski and others (2000), Democracy Index........................... 37 3b. Dependent Variable: Przeworski and others (2000), Democracy Index—Differences.... 38 4. Flows of International Students: Dependent Variable Ln................................................... 39 5. Alternative Specification of Student Variables................................................................... 40 6. Earlier Versus Later Periods (Cutoff 1985) ........................................................................ 40 7. Small Versus Large Countries (Cutoff 2 million)............................................................... 41 8. Stay Rates of Foreign Doctorate Recipients in United States............................................. 41 9. Summary Statistics.............................................................................................................. 42 10. Education of World Leaders in 1990 ................................................................................ 43

3
I. INTRODUCTION
Do foreign-educated individuals play an important role in fostering democracy in their home countries? Despite the large amount of resources spent on financing foreign education, there is no systematic study on the effects of foreign education on democracy. This paper fills this gap using a large dataset of foreign students that includes almost all receiving and sending countries and spans over 50 years. The idea that foreign-educated students promote democracy in their countries of origin has motivated a number of important policy initiatives and large investment in the United States and elsewhere. Through the Fulbright Program, the U.S. government has financed more than 158,000 foreigners studying in the United States.2 With an endowment of over $12 billion, the Ford Foundation has similarly pursued the goal of “strengthening democratic values, reducing poverty and injustice, promoting international cooperation, and advancing human achievement,” since 1936.3 The U.S. government not only actively finances the education of foreign students in the United States but also annually issues more than 600,000 nonimmigrant visas for foreign students, which provides one of the main ways of entering the country; more than five million individuals have received visas to study in the United States since 1971.4 The U.S. efforts to educate foreign students (and future leaders) have produced impressive results. It is estimated that 46 current and 165 former heads of governments are products of U.S. higher education.5 In addition to the United States, a number of other Western countries fund foreign students. For instance, the German Academic Exchange Service (or DAAD), which was founded in 1925, “currently awards more than 65,000 fellowships a year and is the largest grantor of international academic mobility support in the world.” Its goals include “to enable young academic elites from around the world to become leaders in the fields of science, culture, economics, and politics—as well as friends and partners of Germany” and “to support the
2 “The Fulbright Program supports educational exchanges that strengthen understanding and communication between the United States and over 140 countries. It is an effective and prestigious form of public diplomacy.” “Many Fulbrighters are young professionals who will return to responsible positions in their home countries. They often are involved in building institutions and government service when they return home.” Excerpts from the Fulbright program website (http://exchanges.state.gov/education/fulbright/). (italics added by the author.) 3 From the Ford Foundation website (http://www.fordfound.org/). 4 The U.S. Immigration and Naturalization Service (INS) estimates that in any given day in 2004 more than 600,000 foreign students were present in the United States; from the INS website http://www.uscis.gov/graphics/shared/statistics/publications/NIM_2004.pdf.
5 From the website of the American Immigration Law Foundation (http://www.ailf.org/). Well-known foreign leaders who studied in the United States include, among many others, Benazir Bhutto (Pakistan), Carlos Salinas de Gortari and Vicente Fox (Mexico), Ehud Barak (Israel), Corazon Aquino (Philippines), Hamid Karzai (Afghanistan), and Michelle Bachelet (Chile).

4
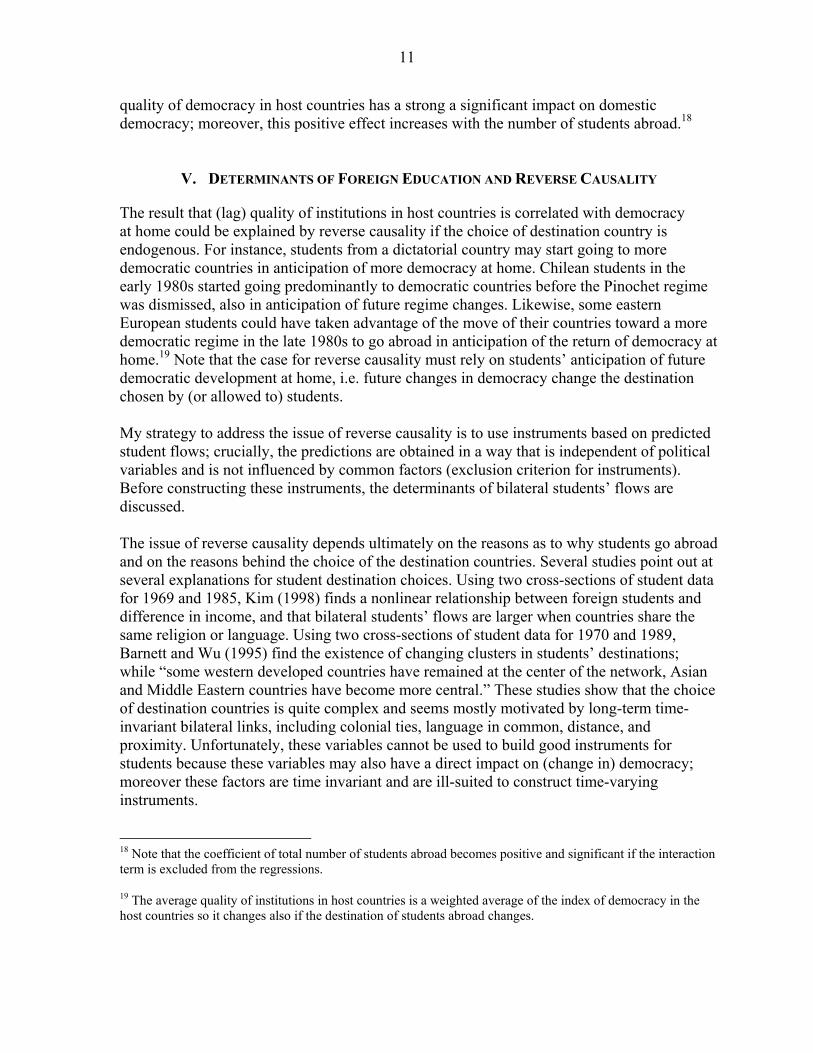
process of economic and democratic reform in developing countries and in the transition countries of Middle and Eastern Europe by supporting their academic research and progress.”6 Besides those of Western countries, many governments have actively financed foreign education in the hope of molding future ruling classes and spreading specific ideas. Socialist countries had an active policy to attract and indoctrinate future leaders (Bollag, 1990); the Moscow-based People’s Friendship University (formerly known as Patrice Lumumba University) was founded in 1960 with the explicit mandate to prepare future socialist leaders in Africa, Asia, and Latin America. South African President Thabo Mbeki considers hosting foreign students from other African countries as a primary way to spread his vision of “African Renaissance” (Malan, 2001). Finally, several Arab scholars see Islamic education as a way to form future leaders in Islamic countries. The large amount of resources invested in foreign education and the anecdotic evidence on foreign-educated leaders suggest that, indeed, foreign education plays an important role in many aspects of the economic and political life of the sending countries. Although there are many issues involved in foreign education, this paper focuses only on the question of whether foreign education is associated with the spreading of democracy in sending countries.7 This paper also makes a contribution to the literature on the role of leaders in nations’ economic and political outcomes. Foreign-educated individuals are, at best, a small minority of the population—in recent years, foreign students have been between 2 and 3 individuals per million of their native populations on average (see Figure1); nevertheless, they seem to matter in the transition toward democracy (see Table 10). Similarly, Jones and Olken (2005) have shown that even individual leaders matter for economic growth. The present paper represents a contribution to this literature because it investigates the role of a very restricted but influential minority in changing political regimes.
6 From the DAAD website (Deutscher Akademischer Austauch Dienst, German Academic Exchange Service); http://www.daad.de/en/index.html. Among world leaders who have been benefited from DAAD funds are Mahmoud Hamdi Zakzouk (minister of religion, Egypt), Amin Farhang (minister for reconstruction, Afghanistan), Luc Ferry (minister of education, France), Vassilios Skuris (president of the Court of Justice of the European Communities), Andrei Marga (minister of education, Romania), Leoluca Orlando (mayor of Palermo, Italy), Wladyslaw Bartoszewski (foreign minister, Poland), and Wangari Maathai (deputy-secretary for environment, Kenya). 7 Foreign education sometimes may have the opposite effect of rejection of modern values of the host country. For instance, Sayyid Qutb, the spiritual leader of the Islamic fundamentalism, who studied between 1948 and 1950 in the Colorado State College of Education on a scholarship to study educational systems, concluded that major aspects of American life were “primitive” and shocking, including the mixing of the sexes, the enthusiasm for sports, and the love for jazz. He, in particular, argued that Western freedom and democracy were manifestation of “Jahiliyya” (ignorance of divine guidance). Armstrong (2000) argues that religious fundamentalisms are the consequence of dramatic contacts between modernity and traditional society. Foreign education may provide the opportunities for these dramatic contacts. This paper does not deal with this issue.

5
The rest of the paper is organized as follows. Section II provides an overview of the literature, with a focus on the current debate on the relationship between democracy and education. Section III presents stylized facts on foreign education and democracy. Section IV shows econometric evidence on the relationship between education and democracy. Section V explores the determinants of the choice of destination countries for foreign students and analyzes the issue of reverse causality. Section VI presents several robustness tests, including the presence of omitted variables that could explain the correlation between democracy and foreign education, heterogeneity of the sample, and stay rates of foreign students. Section VII discusses the results and concludes.
II. LITERATURE REVIEW
The relationship between education and democracy has been studied for a long time. At least since Lipset (1959), political scientists have speculated that education leads to more democratic regimes. Starting with Barro (1999), economists have found a strong empirical correlation between levels of education and democracy. While nobody disputes the strong positive correlation between democracy and education, there has been disagreement on the methodology to control for other factors that may influence both education and democracy and, consequently, on the interpretation of this correlation. Glaeser, Ponzetto, and Shleifer (2006) claim that there is a good deal of empirical support showing that higher level of education attainment leads to more democratic politics.8 According to Glaeser, Ponzetto, and Shliefer, (2006), the real question is to understand which specific mechanisms explain the causal link from education to democracy. They argue that schooling teaches people to interact with others; therefore, education, by lowering the cost of interaction and political engagement, enlarges the constituency for democracy. For the present paper, which focuses on foreign education, two aspects of this view are important. First, for Glaeser, Ponzetto, and Shliefer, (2006) the content of education (e.g. democratic values, technical knowledge, or political indoctrination) matters less than the socializing experience of studying together and learning how to interact. Second, average education and not the level of education of the elites matters.9 Acemoglu, Jonhson, Robinson, and Yared (2005a) claims that the strong cross-sectional correlation between democracy and education is due to omitted factors more than to a causal relationship. In a companion paper, Acemoglu and others (2005b) argues that long-term parallel evolution of democracy and education may be explained by institutional developments, including settlers’ mortality in the colonies, density of indigenous population 8 See also Glaeser, La Porta, Lopes-de-Silanes, and Shleifer (2004), and Papaioannou and Siourounis (2005).
9 Castelló-Climent (2006) finds evidence that an increase in the average years of schooling of the majority of population matters more for democracy than the average yours of schooling of total population. This reinforces the view that the education level of the median voter is more relevant for democracy than the generic level of education. Milligan, Moretti, and Oreopoulos, and Dee (2004) also find evidence that education increases participation in election and support for free speech.
6
and early experiences with democracy. Beside the specific conclusions, these papers make some important methodological points that are relevant for this paper. First, showing the correlation between level of democracy and (lagged) level of education attainment is not enough to claim causation if underlying third variables are not properly controlled for. Second, a panel regression of democracy on education should always contain time variables to control for common trend which cause spurious correlations. Third, that long-run difference may also be used to explore causation. Despite their different conclusions, both Glaeser, Ponzetto, and Shliefer (2006) and Acemoglu, Johnson, Robinson, and Yared (2005a) share some common features. First, both studies assume that the quality of education is the same in all countries (so educational attainment or enrollments are sufficient statistics for the level of education). However, the quality of education, especially at tertiary level, is heterogeneous across countries, creating a problem of error in variables (Hanushek and Kimko, 2000). Second, even leaving education quality aside, another source of measurement error is due to the fact that the primary sources for international data on education are national agencies. These agencies are not all equally reliable and may have bias in providing education data. Third, the data on educational attainment supply the average years of education and provide no information on the distribution of education; therefore, we do not know if a restricted group of highly educated individuals is more influential than a large mass of moderately educated individuals. Data on foreign students can solve these issues. First, the quality of tertiary education, especially in universities where foreign students go, is presumably more homogeneous than tertiary education at home. Second, data on international students are collected by host universities and countries, which often require visa to admit foreign students; this leads to better quality data. In addition, host countries do not have any incentive to misreport data from any particular country. Finally, the data on international students is for tertiary education, a relatively homogenous group. In addition to the literature on democracy and education, there is a growing interest in foreign education. The United States being the largest recipient country of foreign students, most studies focus on the United States (for a recent review, see Aslambeigui and Montecinos, 1998). The increasing number of foreign students has also its critics. Borjas (2002) has argued that the foreign student visa program is “littered with corruption and fraud” and that the economic “benefits from the program are greatly exaggerated, and the program may well generate a net economic loss for the country.” The present paper does not deal with these issues but shows that there are some clear benefits from foreign education in terms of increasing the spreading of democracy in home countries.
III. STYLIZED FACTS ON FOREIGN EDUCATION AND DEMOCRACY
Democracy is a difficult concept to define and several indices have been proposed to measure it. For the purpose of this study, I consider three indices currently used: the Freedom House Index, the polity II index, and the index proposed by Przeworski, Alvarez, Cheibub, and

7
Limongi (1990). For the sake of space, I will not discuss the advantages and the limits of various indices or the vast literature which uses them here.10 The only point that is important to make here is that the trend toward more democratic regimes has not been linear. There was significant retrenchment of democracy not only in single countries but also in several regions of the world. For instance, there was a general decrease in democracy in Asia in the 1950s and 1960s, a marked decline in Latin America in 1960s and 1970s, and a prolonged stasis in Africa since the 1960s (Acemoglu and Robinson, 2005). The unequal march toward democracy begs the question of which factors explain the different paths. The most complete dataset on foreign education comes from the United Nations Educational, Scientific, and Cultural Organization (UNESCO) database on foreign students.11 This database reports the bilateral students’ flows at the tertiary level from 1950 to 2003. Some industrialized countries are covered from 1950 and almost all countries are represented as sending or receiving starting in 1960. The data are gathered from host countries’ authorities, which, in turn, get the primary data from local universities and/or immigration databases. The total number of foreign students has increased substantially in the last 50 years from about 50,000 to more than 2 million in 2002. The number of students abroad has grown more than the population, though it has declined slightly as share of enrollment in tertiary education (Figure1). The steady increase in the aggregate data masks some noticeable heterogeneity in the origin and host countries (Figure 2). The United States has traditionally been the main host country with a share of approximately 30 percent. The second tier destination countries includes France, Germany, and United Kingdom, each with a share of about 10 percent; in the last 20 years, there was a marked increase in the shares of Germany and United Kingdom , accompanied by a relative decline of France’s share. The share of students going to predominantly Muslim countries, which was over 10 percent in 1970, has steadily declined in the last 30 years. Finally, the countries belonging to the former Soviet bloc commanded a share of almost 10 percent between 1970 and 1990, but this has disappeared since the fall of the Soviet Union. The source countries also show considerable heterogeneity. The top panels of Figures 3 to 6 show the total number of foreign students for a selected number of countries from different continents and very different experiences with democracy. The number of foreign students is quite different from country to country. For instance, the number of Chilean foreign students 10 The data appendix describes them in more details. For an exhaustive discussion of these indices, see Przeworski, Alvarez, Cheibub, and Limongi (2000) or Acemoglu and Robinson (2005).
11 The UNESCO database has been used before only as a cross-section or as a panel with two cross-sections but not for the entire period which starts in the 1950s. Part of the problem is that the database is available only in hard copy except for the last few years. The other reason is that the database requires a considerable amount of preparatory work to clear it from evident mistakes (see data appendix for description). Note also that there are occasional discrepancies with the data for the U.S. provided by Open doors.

8
only recently surpassed 6,000 while Iranian students abroad reached almost 80,000 at their peak in 1978 but it was below 18,000 in 2000. As argued in the previous section, the number of students abroad (normalized by population) may be a misleading indicator of exposure to democratic ideas if students go to countries with undemocratic regimes. For instance, students going to Patrice Lumumba University in the 1970s were taught a quite different concept of democracy than students going to Western Europe. In order to capture this heterogeneity, I construct an index of average democracy in host countries, which is defined as the weighted average of democracy indices in host countries where a country’s weight is the share of students going to that country over all foreign students from the origin country (see data appendix for formula and details). By construction, this index lies between 0 and 1; the index is 1 if all students abroad are in democratic countries and 0 if all students abroad are in dictatorial regimes.12 On average, the level of democracy in host countries is much higher than in home countries, a sign that on average democratic countries attract more students (Table 9). Trade seems more concentrated in relatively more democratic partners than in host countries (compare average democracy in trading partner and in students’ host countries in Table 9). The bottom panels of Figures 3−6 show the index of democracy at home and in host countries for Chile, Argentina, Iran, and the Republic of Korea. These countries have very different profiles with respect to democracy. Chile started as a very democratic country until the coup d’état in 1973; after that, democracy was gradually restored in the late 1980s. It is interesting that the average democracy in foreign countries seems to anticipate domestic democracy. Chilean students tended to go to relatively undemocratic countries in the late 1960s, a possible sign of a polarized society at home; immediately after the coup d’état, there was a large surge in foreign students, especially to democratic countries, an indication that many students were unhappy with the new regime and preferred to study abroad, especially in democratic countries. After that, the total number of students abroad remained constant until 2000 but the composition shifted even more toward democratic countries. In the early 1980s, five years before the change of regime at home, Chilean students started going to more democratic countries. A similar pattern happened in Argentina and the Republic of Korea; in both cases, the change in the composition of student destination toward more democratic regimes clearly anticipated the introduction of democracy at home while the total number of students does not seem to anticipate the domestic change. Finally, the average democracy in host countries of students from Iran seems to accompany (and slightly anticipate) the downward trend in democracy at home. It is peculiar that, despite major changes in the number of Iranian students abroad, the downward trend of democracy in host countries has remained unaltered in the last 50 years. 12 The assumption that foreign students in democratic countries absorb democratic ideas is a first approximation; there are unfortunate examples of the contrary. Saloth Sar, better known as Pol Pot, the Communist dictator of Cambodia, studied engineering in France between 1949 and 1952. Moreover, Gregory H. Stanton wrote that “key officials of Pol Pot's regime had read André Gunder Frank’s Marxist theory that cities are parasitic on the countryside” and this provided the theoretical basis for the genocide. Another example is Sayyid Qutb, the influential Islamic thinker, who studied for two years in Colorado (see note 7). In conclusion, foreign education, even in democratic countries, does not always lead to democratic ideas.
9
The experiences of the four countries discussed previously strongly suggest that the number of foreign students and especially the level of democracy in host countries predict future changes in the level of democracy at home. In order to study this correlation more systematically, the following section presents econometric evidence from all countries.
IV. RESULTS
In order to study the correlation between democracy and foreign education, I use mainly dynamic panel regressions. As in previous studies on democracy and education, including Barro (1999), Acemoglu et al., (2005a), and Glaeser et al., (2006), my main specification features level of democracy as the dependent variable. The explanatory variables are: past level of democracy, number of students abroad as a share of total population in the sending country, average level of democracy in the host countries, and the interaction between the two latter terms.13 All explanatory variables are lagged five years.14 In addition, all regressions have time and country fixed effects except when otherwise specified. The sources of the data are explained in the data appendix. The normalized number of students lagged five years is meant to capture the effect of foreign education. Following the discussion in the previous section, I use as a control the average index of democracy in host countries, which is meant to capture the type of democracy to which foreign students are exposed. Finally, the interaction term measures if the marginal effect of foreign students depends on the level of democracy in host countries. This specification while parsimonious allows to investigate the different channels through which foreign education may have an impact on democracy.15 The basic specification is as follows:
5 5 5
5 5( * )it it it it
it it
i t it
d d students abroad index of democracy in receiving countries
students abroad index of democracy in receiving countries
country fixed effects time fixed effects
α β γ
δ
ε
− − −
− −
= + +
+
+ + +
Where itd is the index of democracy in time t in country i. The same specification is estimated for three different indices of democracy: the Freedom House’s Political Rights
13 In principle, the number of students should be normalized using the number of “potential foreign students,” i.e. the number of people in the relevant cohort or with a secondary education or tertiary education. However, using these data would limit the sample considerably.
14 I choose the 5-year interval to follow the previous literature on education and democracy. However, I also tried a 10-year interval. While the number of observation sample in the sample is halved, the results discussed below are all confirmed; interestingly, the coefficients on democracy in host countries are usually larger in magnitude.
15 I try different specifications in the robustness section.
10
Index, the composite polity index from the Polity IV dataset, and democracy index proposed by Przeworski, Alvarez, Cheibub, and Limongi (1990). I use three different estimation techniques: pooled OLS, fixed effects OLS, and system GMM. The pooled OLS give a first idea of how the data are correlated without controlling for country fixed effects and, therefore, overestimates the coefficient on the lag dependent variable. The fixed effects estimator controls for country effects but biases downward the coefficients on the lagged dependent variable. The GMM estimators provide consistent and unbiased estimates but depend on the particular set of instruments used; in this particular case, with very persistent dependent variables (democracy is constant for long period), system GMM should be used (Blundell and Bond, 1998; Bond, 2002).16 The first three columns of Table 1a present the results for the Freedom House’s index of political freedom using the techniques described above. As expected, democracy is very persistent; the coefficient on past democracy ranges between .847 in pooled OLS, which usually has upward bias, and .442 for the fixed effects, which usually displays downward bias. As expected, the unbiased GMM estimator .541 is within this range. The coefficients on student abroad are insignificant in all the specifications. Democracy in host countries is always positive and highly significant across different estimation techniques. Moreover, the interaction between democracy in host country and foreign is positive and highly significant in the GMM specification, which is consistent and unbiased. These results do not depend on the specific index of democracy. The results discussed above are based on the Freedom House index of democracy, which has the wider coverage. Regressions that use Polity II and the Przeworski et al. indices of democracy gives the same results (see the first three columns of Tables 2a and 3a).17 All specifications, except the pooled OLS, include fixed country and fixed time effects; therefore, the results are robust to all county-specific time-invariant characteristics, including ethnic composition, religions, language, colonial ties, geographical variables, and many other unobservable characteristics, and to all world-wide trends, including higher income, trade, and education. In conclusion, the results from these regressions show that (lagged) total number of students abroad (normalized by the population) has no clear impact on democracy at home; however,
16 In unreported regressions, I also experimented with difference GMM with qualitatively similar results.
17 Glaeser et al., (2004) notes that several measures of democracy, including the polity II index from polity IV database, are in fact ‘outcome’ measures, which do not properly measure the constraint on government, which is the feature the ‘institutionalists’ would like to measure (North, 1981). To address this issue, I try also the variable ‘constraint on the executive’ from the polity IV database in unreported regressions; the results are confirmed.
11
quality of democracy in host countries has a strong a significant impact on domestic democracy; moreover, this positive effect increases with the number of students abroad.18
V. DETERMINANTS OF FOREIGN EDUCATION AND REVERSE CAUSALITY
The result that (lag) quality of institutions in host countries is correlated with democracy at home could be explained by reverse causality if the choice of destination country is endogenous. For instance, students from a dictatorial country may start going to more democratic countries in anticipation of more democracy at home. Chilean students in the early 1980s started going predominantly to democratic countries before the Pinochet regime was dismissed, also in anticipation of future regime changes. Likewise, some eastern European students could have taken advantage of the move of their countries toward a more democratic regime in the late 1980s to go abroad in anticipation of the return of democracy at home.19 Note that the case for reverse causality must rely on students’ anticipation of future democratic development at home, i.e. future changes in democracy change the destination chosen by (or allowed to) students. My strategy to address the issue of reverse causality is to use instruments based on predicted student flows; crucially, the predictions are obtained in a way that is independent of political variables and is not influenced by common factors (exclusion criterion for instruments). Before constructing these instruments, the determinants of bilateral students’ flows are discussed. The issue of reverse causality depends ultimately on the reasons as to why students go abroad and on the reasons behind the choice of the destination countries. Several studies point out at several explanations for student destination choices. Using two cross-sections of student data for 1969 and 1985, Kim (1998) finds a nonlinear relationship between foreign students and difference in income, and that bilateral students’ flows are larger when countries share the same religion or language. Using two cross-sections of student data for 1970 and 1989, Barnett and Wu (1995) find the existence of changing clusters in students’ destinations; while “some western developed countries have remained at the center of the network, Asian and Middle Eastern countries have become more central.” These studies show that the choice of destination countries is quite complex and seems mostly motivated by long-term time-invariant bilateral links, including colonial ties, language in common, distance, and proximity. Unfortunately, these variables cannot be used to build good instruments for students because these variables may also have a direct impact on (change in) democracy; moreover these factors are time invariant and are ill-suited to construct time-varying instruments. 18 Note that the coefficient of total number of students abroad becomes positive and significant if the interaction term is excluded from the regressions.
19 The average quality of institutions in host countries is a weighted average of the index of democracy in the host countries so it changes also if the destination of students abroad changes.
12
Focusing more on cyclical fluctuations, Sakellaris and Spilimbergo (2000) find that the enrollment of foreign students from low-income countries is positively correlated with the business cycle in home countries while enrollment from rich countries is negatively correlated with the business cycle in home countries. This suggests that the decision to study abroad is conditioned by economic factors as much as by political views. This study also shows that availability of grants is a crucial factor limiting the movement of students from low-income countries. This point constitutes the crucial motivation for the instrumental variable strategy as described below. Note that the literature has focused only on long-term bilateral determinants or on economic fluctuations while political reasons for studying abroad have not studied, probably because it was perceived less relevant. To understand the reasons behind bilateral student flows and to address the issue of reverse causality in a systematic way, I run the following regression:
ln( ) ln( ) ln( ) ln(Distance )ijt it jt ij
ij ij ij
ij
Bilateral students flows Population Population
Contiguity Colonial ties Official language in common
de facto language in common institutions in receiving countries
α β γ
δ φ φ
φ λ
= + +
+ + +
+ + it
jt ijt
j t ijt
institutions in sending countries Difference in institutional quality
receiving country fixed effects time fixed effects
μ ν
ε
+ +
+ + +
The control variables, which are suggested by the papers mentioned above, belong to four groups. A first set of variables, including distance, contiguity, colonial ties, and official language in common, language in common spoken by more than 9 percent of the population, measure long term bilateral ties. A second set of variable—populations in both countries—are included as scale variables. Finally, a third set of variable are included to measure how political considerations play in the students’ destination preferences: democracy in the sending country, democracy in the receiving country, and the absolute difference in democracy indices between the two countries. Fourth, in order to capture how open a country is to foreign students, I include a variable defined as the (log of) total students coming to
country j, excluding students from country i ⎥⎦
⎤⎢⎣
⎡⎟⎠
⎞⎜⎝
⎛≡ ∑
≠ issjtStudentsln . This variable measures
the popularity of country j, which may include the availability of grants, the easiness to enter the country, and the tradition in local universities, but avoids any tautological definition excluding bilateral student from i to j. Finally, I control for year and receiving country fixed effects to capture common trend and long-term time invariant characteristics of destination countries. The equation above is estimated using bilateral student flow database described in the appendix, which comprises more than 140,000 yearly bilateral observations. The results are reported in column 1 of Table 4.20 All variables have the expected sign as in a trade gravity 20 Note that the large number of observations reduces significantly the size of the standard errors

13
equation. The three variables measuring political factors are particularly interesting for this paper. Less democratic countries send and receive fewer students; this captures the fact that the nondemocratic countries, especially the former soviet bloc, discouraged migration in general and, in particular, student flows.21 The coefficient on ‘political distance,’ measured by the absolute difference in democratic indices in sending and receiving countries, is strongly negative, indicating that students tend to go to countries with similar degrees of democracy as at home. Finally, the variable measuring the popularity of countries is positive and significant as expected. The R-squared of this gravity equation is .54, which is somewhat lower than what is commonly found in gravity equations in trade, but it is still quite high Column (2) reports the same specification excluding the three variables that are directly related to political preferences—levels of democracy in sending and receiving countries and absolute difference in the level of democracy. The sign and the significance of all coefficients do not change and the R-squared decreases only marginally, showing that the political variables, even if significant, do not play a main role in explaining bilateral student flows. This is an indication that the problem of reverse causality is, in practice, limited. Beside political variables, a set of other bilateral variables, including distance, colonial ties, language in common, are possible determinants of democracy and bilateral students flows. For this reason, these variables cannot be used to construct the ‘predicted student flows’ to be used to explain democracy—their inclusion would violate the exclusion principle for instruments. The last column of Table 4 presents a minimal specification in which only variables that have no impact on democracy at home, including population in the sending and receiving countries and the popularity of receiving countries among foreign students. In addition, I control for receiving country and year fixed effects. The R-squared decreases substantially to .30. I use the predicted bilateral student flows from this specification to construct two variables: the predicted total annual students abroad, which is simply a sum over country of destination of the predicted bilateral flows, and the average democracy in receiving countries, which uses the actual democracy in host country weighted by predicted students according to the following formula:
∑∑
≡ d dtDo odtS
odtSotcountrieshostindemocracy ˆPredicted ,
where odtS is the predicted bilateral student flow from country o to country d at time t, using
the specification of Table 4 column c; dtD is the degree of democracy in host countries. Note
that this is the same formula used to calculate actual democracy in host countries with the only innovation of predicted bilateral student flows rather than actual.
21 The fact that dictators have traditionally discouraged (or impeded) the migration of students to democratic countries suggests that indeed dictators were fully aware of the `destructive’ power of foreign education, even before reading the robustness tests in this paper!

14
These two predicted variables are used in the GMM regressions as instruments for student flows and democracy in the host countries. Column 4 of Table 1a reports the result of the freedom house index. Despite the fact that the instruments are only weakly correlated with the instrumented variable, (lagged) average democracy in host countries has an impact on democracy at home.22 This result is robust to different indices of democracy (see column 4 in Tables 2a and 3a). In conclusion, these regressions, which use constructed students’ flow in a way that only exogenous variations are considered, show that political changes at home follow foreign education and not vice versa.
As a further robustness test, I tried another set of instrumental variables using the fact that student flows tend to be persistent over time. I constructed the variable average democracy in host country using as weights student flows 20 years before. This is not a perfect instrument because, for instance, a certain colonial heritage could determine both the distribution of students abroad and the (change in) democracy home. In addition, using a variable so lagged reduces substantially the number of observations. I use this variable both as an instrument for current democracy in host countries and directly in the baseline regression with the same results that (lagged) democracy in host countries remains strongly correlated with democracy at home.
Overall, there is no evidence from the previous literature and from the student gravity regressions presented in this paper that destination of students abroad is determined mostly by political considerations. In addition, the quality of education in host countries is strongly significant even in an equation using instrumental variables. This suggests that possibility of reverse causality is limited.
22 Note that in unreported regressions, I replicate the exercise using the predicted students flows based on the specification of column 2 Table 4, which has many more bilateral variables to explain bilateral student flows. The significance of the coefficients but the Hansen’s specification test is lowered confirming that these instruments may be correlated with the dependent variable directly.
15
VI. ROBUSTNESS
The robustness tests focus on eight areas: omitted variables, first difference, long-run differences, alternative specification for the student variables, country size, heterogeneity of the sample, and stay rates of foreign students.
A. Omitted Variables
The strong correlation between (past) level of democracy in host countries and democracy in the sending country is surprising and begs the question of whether omitted variables may be responsible for this correlation. To address this issue, I include various plausible control variables that could cause a spurious correlation between foreign education and democracy at home. Regional patterns in democracy are well known. For instance, Asian countries displayed less democracy in the 1950s and 1960s, Latin American countries had a wave of dictatorships in the 1960s and 1970s, and African countries have had a long period of undemocratic regimes starting in the 1960s (Acemoglu and Robinson, 2005). The existence of regional trends begs the question of whether the variable democracy in host is mainly capturing regional trend; the question is even more justified given that bilateral student flows are strongly dependent on distance and contiguity (see Table 4). In order to address this issue, I add to the baseline regression (column 3 in Table 1a) a variable measuring democracy in neighboring countries (see appendix for the construction of this variable). The results, which are shown in column 5 Table 1a for the freedom house index, show that democracy in neighboring countries is indeed significant but democracy in host countries remains positive and strongly significant. Similar results are obtained using the other two indices of democracy, polity II and Przeworski et al. (Tables 2a and 3a). Column 6 includes the variable educational attainment, which is available only for a sub-sample of countries for which students abroad are available. As a consequence, the sample decreases substantially. Education attainment is the variable on which the previous literature on domestic education and democracy (e.g. Acemoglu et al., 2005a, and Glaeser et al., 2006) has focused. In this specification, the variables measuring the quality of democracy in host country and education attainment are both positive and strongly significant. These results are similar using the polity II and the Przeworski et al. indices of democracy (results reported in Tables 2a and 3a respectively). This is partly because these measures of democracy reduce the sample and partly because of differences in the construction of the indices (see Acemoglu and Robinson, 2005). One possible omitted variable may be trade and, generally, long-term relationships with other nations. The idea that economic and political integration and democracy are intertwined has been suggested previously but has received only mixed empirical confirmation (Li and Reuvey, 2003; Rigobón and Rodrik. 2005; and López-Córdova and Meissner, 2005). If studying abroad especially in democratic countries is only a particular aspect of globalization, the significance of the coefficient on lagged democracy of host countries could be due to a spurious correlation. In order to check this hypothesis, I construct the variable

16
“democracy in trading partner,” which is an average of the democracy index in the trading partners using as weight export share. Column 7 of Table 1a presents the results of a regression in which this variable is added as a control. Despite the high correlation between democracy in trading partners and democracy in host countries (the correlation between democracy in trading partners and democracy in host countries is about .45 in the sample), average democracy in host countries and the interaction term remains highly significant, indicating that foreign education plays a role even controlling for international trading ties.23 Another possible concern is that foreign students are really proxying for the flow of domestic students with tertiary education. Usually, the studies on democracy and education, including Acemoglu et al., (2004) and Glaeser et al., (2006), use a stock variable such as average attainment as a proxy for education because the theoretical explanations on the link between democracy and education emphasize that the stock of education is important (e.g. Lipset, 1959). In line with these papers, specification 8 of Tables 1 to 3 controls only for the stock of education (education attainment) and not for the flow (tertiary enrollment).24 The coefficients on democracy in host countries and interaction term remain positive and highly significant when including domestic enrollment while enrollment is generally significant. Another important omitted could be income per capita. Several authors (Barro, 1999) have found that income and democracy appear to be correlated at least in the long run; however, the interpretation on this correlation is controversial (Acemoglu et al., 2005). Even controlling for income per capita, the results do not change (column 9 of Table 1a). The same results hold using the other definition of democracy (Tables 2 and 3). As a further robustness test, specification 10 in Tables 1 to 3 includes all of the control variables mentioned above (democracy in neighboring countries, education attainment, democracy in trading partners, tertiary enrollment, and GDP per capita). The coefficient on level of democracy in host countries remains positive and significant. In this specification the number of observations is more than halved with respect to the baseline and many explanatory variables are highly correlated; the reason the coefficients on GDP per capita and tertiary enrollment become insignificant is most likely multicollinearity. While the existence of country-specific time-varying omitted variables cannot be ruled out, the correlation is robust to a variety of tests, including the use of variables controlling for geographic proximity, commercial ties, tertiary enrollment, country specific trends, income per capita.
23 Note that López-Córdova and Meissner (2005) using the polity IV dataset finds an effect of globalization of trade on democracy especially in the period before World War II; the evidence after World War II is more nuanced. In an unreported regression, I ran democracy against democracy in trading partners controlling only for domestic education using system GMM and I found that democracy in trading partners becomes significant.
24 I use domestic tertiary enrollment so that domestic data are comparable to the variable for foreign students, which refers only to tertiary education.

17
B. First Differences
In order to further investigate the issue of omitted variable, I estimate the baseline specification in differences:25
itititit countriesreceivinginnsinstitutioofqualityabroadstudentsd εδγ +Δ+Δ=Δ −− 1010 and
iti
ititit
effectsfixedcountrycountriesreceivinginnsinstitutioofqualityabroadstudentsd
εδγ
++Δ+Δ=Δ −− 1010
The first specification controls for country fixed effects by taking differences; the second specification also controls for country specific trends (the fixed effects in differences). In addition, I try differences of 5 and 10 years. To avoid simultaneity bias, in this specification has explanatory variables lagged five years in the 5-year specifications as well. The results are displayed in the first four columns Table 1b. The coefficients on democracy in host countries remain positive and significant but the interaction term loses significance. Note that specifications 2 and 4 are quite demanding given that they are in difference and with country specific effects.
C. Long-Run Differences
Acemoglu et al., (2005) discusses the possibility that the link between education and democracy operates only with very long lags and suggests looking at long-run differences to find evidence of these effects. With long-run differences it is not possible to control for country fixed effects. However, idiosyncratic country shocks should be less relevant in the long-run. I try the longest difference available with the present data using the following specification:
iti
ii
countriesreceivingindemocofqualityabroadstudentsd
εδγα
+Δ+
Δ+=Δ
−
−−
19652005,
19652005,19652000,
The results for this specification are reported in column (5) of Table 1b; column (6) reports the same regression with the inclusion of (changes in) educational attainment. The coefficient on (changes in) democracy in host countries is always positive; when education attainment is introduced, the sample is reduced but the coefficient on democracy remains significant. Figure 7, presents the scatter plot of changes in domestic democracy and changes in host countries’ average democracy. The figure confirms that the significant correlation found in the regressions is not due to outliers. 25 Note that fixed effects estimator assumes that the error terms are serially uncorrelated; in this case, the fixed effect estimators is more efficient than the first difference estimator. However, if only the first differences in the errors are uncorrelated, the first difference estimator should be used (Wooldridge, 2002).

18
D. Alternative Specification for Foreign Students
So far, I have used three variables measuring the effects of students abroad on democracy at home—the number of students abroad, the average level of democracy in host countries and an interaction term. While this is a way to summarize the plethora of data on bilateral student flows, other aggregation are possible. In particular, foreign students could be classified into two categories: students going to fully democratic countries (for which the democracy index is 1) and students going to less than democratic countries (for which the index is less than 1). To check if my results depend on the specification proposed, I try this two-group specification.26 Using this classification, I replicate the baseline regression. Table 5 reports the results for various indices of democracy; in addition, I replicate the regression using the instruments discussed above for the number of students.27 All regressions confirm my basic results: democracy is positively associated with the number of students going to democratic countries but is clearly unrelated to the number of students going to non-democratic countries. Note that this classification has the serious drawback that it does not distinguish between different degrees of democracy. The Freedom House and the Polity II indices provide a detail range of democracy, which is lost by aggregating foreign students into two categories. For instance, a student going to an almost democratic country with a score slightly below 1 is grouped together with a student going to a clearly dictatorial regime. For this reason, I prefer to use a weighted average of democracy in host countries rather than a category based on an arbitrary cut-off.
E. Heterogeneity in Sample: Time
Before the eighties, when the cold war was raging, foreign education had a large political component (Richmond, 2003); while after the fall of Soviet Union, foreign education has lost the strong political association. In order to check for a structural break, I run the benchmark regression for the sub-periods before and after 1985. The results are in Table 6. For the years before 1985, the coefficients on democracy in host countries and the interaction terms are positive and highly significant. On the other hand, for the years after 1985 these coefficients lose significance when using the freedom house and the Przeworski et al., index.
26 As before, in order to make the number comparable among countries, the number of students is normalized by population. 27 The instruments for students to democratic and non democratic countries are constructed as before using predicted bilateral flows in a regression based on the specification in column 3 Table 4. The predicted bilateral flows are aggregated in two groups; students going to democratic and students going to non-democratic countries.

19
These results suggest that the role foreign education on democracy was more important before 1985. 28 This is not surprising given that the political component of foreign education was more important during the cold war period. This result should also be put in the framework of general trends in democracy. In the most recent decade, democratic status has been more stable (i.e., democratic countries remain democratic and dictatorships remain dictatorships) as it is clear comparing the coefficients on lagged democracy before and after 1985. In this context of relatively stability, foreign education is less relevant.
F. Heterogeneity in Sample: Country Size
Foreign education may be more relevant in small countries in which few individuals can make the difference than in large countries. Table 7 reports the results using 2 million as a cut-off figure. The evidence on country size and the effects of foreign education on democracy is unclear: using the Freedom house and the Przeworski indices, there is evidence that foreign education is more important in small countries while using the polity II index, the evidence is inconclusive.
G. Stay Rates
Foreign-educated students may have an impact on the democracy of their home country both if they stay abroad and if they return home. For instance, expatriate communities have played a large role in the politics of Iraq or Afghanistan. However, the effect of foreign-educated students on the democracy of their home countries is probably larger when students come back to their own countries. For this reason, I take a closer look at stay rates of foreign students. Unfortunately, there is no systematic dataset on return rates of foreign students, but several sources may help. Usually, host countries give foreign students only temporary visas, which are not automatically converted in other types of visa, and this limits the legal stay rate; for instance, Borjas (2002) reports that between 1971 and 1991, over 3 million people receive student visas but only 393,000 received permanent visa status at the end of the studying period.29 These estimates are probably the most accurate available. In addition to the visa counting, there are three methods to estimate stay rates, although they have several limitations. The first method is looking at the level of education of foreign-born individuals in the U.S. census data (Carrington and Detragiache, 1998); this method, however, has the drawback that the census does not specify where the individuals were educated and so cannot be used in the present study. The second method uses data from tax
28 Note that the number of observations considerably smaller in the two sub-samples, especially for the Polity II and Przeworski indices after 1985. The reduced time dimension also reduces the feasibility of GMM; most of the specifications do not pass the Hansen’s J test.
29 Borjas (2002) also observes that many student visa recipients could have stayed illegally. For instance, about 300,000 illegal aliens who received amnesty after IRCA had temporary visas, including student visas.

20
authorities on foreign graduates who pay social security after graduation; using this methodology, Baker and Finn (2003) estimate that 51 percent of the foreigners who graduated in the United States in 1994/95 paid taxes in 1999, with a peak at 63 percent for students in computer science and engineering and much less for other disciplines. Using this method, Finn (2001) provides estimates of stay rates by country of origin (see Table 8). China and India, the two most populous countries, have by far the highest rates of stay; excluding China and India, the stay rate for graduates’ decreases from 53 to 39 percent. The third method uses a survey of students’ future plans (Doctorate Recipients from U.S. Universities, 2004) and is likely the most imprecise because it is based on stated intentions. Column 3 of Table 8 reports the staying intentions of non-U.S. citizen doctorate recipients from different countries. Despite the fact that intentions to stay are always higher than actual stay rates, the broad patterns across countries are reproduced—students from India and China have a disproportionate staying rate. Note that the data using the last two methods cover only graduate students. Finally, there is evidence that the stay rate was increasing until the mid-1990s and has leveled off since (Finn, 2003). For instance, Glaser (1979) noted that “...the commitment to home country is very strong. Most students from developing countries plan to return home.” One interesting observation from Table 8 is that the stay rates seem to be much higher for students coming from very populous countries such as China and India. This suggests that graduating students have more incentives to go back to relatively small countries where they can ‘make the difference’ participating in the political life, while there may only be an economic incentive to go back to a very large country. The third largest stay rate is for Canada, for which returning students do not make a difference given the established democratic tradition. I take this as a further evidence that foreign-educated students return especially to countries in which they “make the difference.” In conclusion, even in the United States, with a relatively flexible labor market and with a buoyant demand for highly skilled individuals, the stay rates have not surpassed 50 percent for the majority of sending countries. Other receiving countries probably have much lower stay rates.
VII. INTERPRETATION AND CONCLUSIONS
A large amount of resources are spent on foreign education with the explicit goal of educating individuals and fostering a particular system of values: Western countries have hoped to foster democracy; Socialist countries have educated future socialist leaders; and Muslim countries have financed schools with Islamic values. Were these resources spent usefully? This paper answers this question by looking at the most comprehensive existing dataset on foreign students, which spans 50 years and covers the entire world. Using this dataset and three different indices of democracy, I have found a very strong correlation between the lagged average indices of democracy in host countries and the current level of democracy in the origin country while there is only mixed evidence on the lagged total number of students abroad and the level of democracy at home.

21
These correlations are robust to the inclusion of several control variables, including education attainment at home, average level of democracy in trading partners, GDP per capita, country fixed effects, time fixed effects, different definitions of democracy, country- specific trends, and exclusion of socialist countries or particular regions. Moreover, these correlations cannot be interpreted as reverse causality, because students do not appear to select the destination countries in anticipation of changes in democracy in their own countries. Finally, these correlations generally hold even in differences with country-specific trends. The robustness of these correlations suggests that there is, in fact, a causal relationship between what students study in the host countries and democratic development at home. This finding begs three questions: 1) how a small minority can be so influential, especially considering that many foreign students do not go back to their home country?: 2) how does this paper contribute to the current debate on the relationship between education and democracy?; and 3) what are the specific mechanisms through which foreign-educated individuals bring about changes in democracy at home? The answer to the first question is part of the more general debate on the role of single leaders or restricted elites in history. The idea that elites are responsible for important changes has a long tradition in sociology; for instance, Parsons (1960) writes that “... within the existing elites, such people are most likely to be found among intellectuals, especially those who have direct contacts with the west, particularly through education abroad or under western auspices at home” (italics added). Lipset (1960) looks at the specific case of elites in Latin America.30 More recently, Jones and Olken (2005) have found that leaders do matter for countries’ income growth. This paper adds another piece of evidence to this intellectual tradition showing how foreign education of the elites may explain the course of history. Table 10 presents the levels of education and the locations where individuals who were world leaders in 1990 studied.31 Out of 115 world leaders, 66 studied abroad at a certain point; the percentage of foreign-educated leaders’ increases to more than two-thirds if one is considering only developing countries. These numbers show clearly that foreign-educated individuals do play an overwhelming role in their own home countries. The second issue is how my findings contribute to the current debate on the relationship between domestic education and democracy (see Glaeser, Ponzetto, and Shliefer, 2006, and Acemoglu and others, 2005). The evidence presented shows that quality of foreign education
30 For an interesting discussion and convincing case on how a small group of foreign-educated economists had a huge impact on Chile, see Valdés (1995).
31 Table 10 presents the level of education of world leaders in 1990. The world leaders are as identified by Jones and Olken (2005). The information was collected by checking biography of each leader. If no information was available, a missing value is indicated. Therefore, the numbers in Table 10 are a lower bound for the actual number of foreign-educated leaders.

22
matters for democracy. I have also shown, by incorporating fixed effects and showing long-run differences that foreign education is not due to long-term omitted variables. Is this the ultimate proof that education matters for democracy? No, because foreign education is very different from domestic education on which this debate is focused. First, foreign-educated people are only a restricted minority of the population, by far less numerous than domestically educated people. Second, I have shown that quality of foreign education matters, so I do not find evidence for the hypothesis that education per se matters because it teaches the value cooperation and lowers the cost of organization of civil society. This leaves open the question of how important the educational level of the elites is in explaining economic and political outcomes. The third issue is understanding through which specific mechanisms foreign-educated individuals bring about changes in democracy at home. Many hypotheses are possible and are compatible with the available evidence. First, foreign-educated technocrats are such a scarce resource in many countries that they can impose their own preferences in favor of democratic regimes; in other words, there may be no alternatives to hiring a foreign-educated minister who will accept the job only if a country has a reasonable level of democracy.32 In addition, a foreign-educated minister could give confidence to foreign investors. Second, foreign-educated leaders seem to be extremely motivated to introduce democracy and to keep up with the more developed countries where they studied; in general, the leaders’ educational levels seem to be associated with the probability of introducing structural reforms (Dreher and others, 2006).33 Third, foreign-educated individuals make it more difficult for the dictatorial regimes to maintain repression by spreading new ideas at home. Fourth, foreign- educated individuals can make repressive activities more costly for a dictatorial regime since they have easier access to external media; in addition, foreign-educated individuals may lobby foreign governments to press for changes at home. Fifth, education abroad may inculcate a sense of common identity with the international democratic community; this sense of common identity has proven to be a very powerful motivating factor (see Akerlof and Kranton, 2005).34 Future work should study which specific channels are at work.
32 In some sense, this happened where Mikhail Gorbachev decided to reform the Soviet system and during the Boris Yeltsin era. The old soviet bureaucrats simply were unable to handle the new economic challenges while the new “technocrats” were available only if democracy were introduced.
33 Based on a survey on the reasons for pursuing a Ph.D. in the United States, Aslambeigui and Montecinos (1998) find that “the significance attributed to a Ph.D. in careers in politics seemed especially strong among students from Latin America, where economists are currently playing very important political roles.”
34 Several studies have found that foreign students develop a sense of identification for the country where they study (see Sellitz and others, 1963). For instance, Ye (2001) describes how “Chinese by studying at American universities played pivotal roles in Chinese intellectual, economic, and diplomatic life upon their return to China. These former students exemplified key aspects of Chinese “modernity,” introducing new social customs, new kinds of interpersonal relationships, new ways of associating in groups, and a new way of life in general.”

23
The paper also contributes to the debate on what political power is in the twenty-first century. Influential scholars in international relations theory have argued that “soft power,” defined as the ability of a political body to influence indirectly the behavior of other political bodies through ideological or cultural means without the use of coercion, will play an important role (Nye, 2004). Foreign education is listed as one of the main instruments to exert “soft power.” Despite its popularity and appeal, “soft power” has proven remarkably difficult to test empirically. This paper provides a first quantification of an important component of “soft power.” Finally, this paper has argued that foreign education, which is only one aspect of education of the elites, matters for the type of regime. This begs the question of whether other characteristics of the elites matter for the development of countries. Future research should focus on the elites’ general educational levels and, more generally, other characteristics, including attitudes toward markets, religion, and values.

24
Appendix I. Data
As dependent variable, I use three measures of democracy. The Freedom House’s Political Rights Index ranges between 1 and 7, with 1 representing the most freedom.35 The index summarizes a number of dimensions, including the existence of free elections, of competitive parties. Following Barro (1999) and Acemoglu et al. (2004), I supplement this index with data from Bollen (1990, 2001) for 1960 and 1965. As a second measure of democracy I use the composite polity index from the Polity IV dataset, which is the difference between the Polity’s democracy and autocracy indices.36 Polity IV contains coded annual information on regime and authority characteristics for all independent states (with greater than 500,000 total population) in the global state system and covers the years 1800-2003. The third measure of democracy is the dichotomous democracy index proposed by Przeworski, Alvarez, Cheibub, and Limongi (1990) and extended by Boix and Rosato (2001); a key aspect of this index is that a country is not considered a democracy unless a political party has lost power. This index is appealing for this paper because the dichotomous nature of the index makes is clear the year of transition. In order to make the results easier to interpret, I normalize the indices so that 1 corresponds to the maximum degree of democracy and 0 to the least. My main explanatory variables—share of foreign students over population and average quality of institutions in host countries—are constructed from the cross country student migration database as reported in the UNESCO Statistical Yearbook. The database covers the time period 1950 to 2003 and refers to students’ migration at the third tier of education (university education and higher). The data are produced by the receiving countries, which typically collect information from local institutions. In the 1950s, the data are available for only few receiving countries including Australia, Austria, Belgium, Egypt, France, Germany, India, Japan, Netherlands, Spain, Switzerland, United Kingdom, and United States—countries that cover traditionally receive the majority of students- and for the 50 main sending countries. Starting with 1960, the data are available for almost all receiving countries and the majority of sending countries. Data were purged of evident outliers;37 missing data for bilateral flows for which there was sufficient non missing years were interpolated. Figure 1 shows total foreign students and foreign students normalized by world population and by tertiary enrollment. The population and the real income per capita data come from the World Bank’s WDI augmented with national sources whenever there are missing values.
35 The data updated to 2005 are available from the Freedom House’s website (http://www.freedomhouse.org/).
36 The data are available from the Polity IV’s website (http://www.cidcm.umd.edu/inscr/polity/).
37 e.g. if the number of students from country A to country B was 10000 in one year when the average for the preceding and following decades was 10.

25
The variable average democracy index in host countries is constructed as the weighted average of the institution in the host countries where the weights are given by the share of students from country j to country I over all students from country j:
∑∑
≡ d dtDo odtS
odtSotcountrieshostinDemocracy
Where dtD is one of the three democracy indices described above; odtS is the number
of students from country o to country d in year t. By construction, the three indices so constructed lies between 0 and 1; the index is 1 if all students abroad are democratic countries and 0 if all students abroad are in dictatorial regimes. In order to avoid problems of small sample, this variable is used only of there are at least 10 students abroad. Note that the countries weights are calculated for each year so the index for a specific country may change from year to year for two reasons: 1) if the level of democracy in host countries changes or 2) if the combination of students abroad changes. The other control variables include: education attainment from the Barro-Lee (2000) dataset, tertiary enrollment from the World Bank’s WDI, democracy in trading partners, and democracy in neighboring partners. The variable democracy in trading partners is constructed as the weighted average of the institution in the trading partners where the weights are given by the share of exports from country d to country o over all exports from country d:
∑∑
≡ d dtDo odtEXP
odtEXPotpartnerstradinginDemocracy
Where dtD is one of the three democracy indices described above; odtEXP is the value of
exports from country o to country d in year t. The Data on trade come from the UN’s COMTRADE database. The variable democracy in neighboring partners is constructed as the weighted average of the institution in the neighboring countries where the weights are given by the population of country i divided by the distance from country j to country i:
∑≡ d dtDod
dtPopotcountriesneighborinDemocracy
Distanceing
Where dtD is one of the three democracy indices described above; odDistance is the
distance between country o and country d. The sample include all countries for which the data are available, which were independent for at least 5 years. Table 9 presents the summary statistics.
26
Figure 1. Total Foreign Students
0
1
2
3
Sha
re o
f Pop
/ S
hare
of T
ertia
ry E
nrol
l.
0
500
1000
1500
2000 To
tal F
orei
gn S
tude
nts
(thou
sand
s)
1950 1960 1970 1980 1990 2000Year
Tot. Foreign Std. %of Pop. %of Tertiary
Note: the original data come from the UNESCO dataset revised as described in the Data Appendix. The solid line represents the total number of students abroad. The dashed line represents students abroad normalized by (millions of) individuals in the origin countries; the dotted line represents students abroad normalized by (tens of millions) of people getting tertiary education in the origin countries.

27
Figure 2. Host Countries
25
30
35
Share
1950 1960 1970 1980 1990 2000Year
US
4
68
101214
Share
1950 1960 1970 1980 1990 2000Year
Germany France UK
Major European Countries
4 6 8 10 12
Share
1970 1980 1990 2000Year
Muslim countries
4
6
8
10
Share
1960 1970 1980 1990 2000year
Soviet countries
Shares of total foreign students
Note: the original data come from the UNESCO dataset revised as described in the Data Appendix.

28
Figure 3. Chile
0
2
4
6
8 Number of Students abroad
1950 1960 1970 1980 1990 2000year
Total students abroad
0.2.4.6.81 Democ.
.75
.8
.85
.9
.95 1
Democ. in host countries
1950 1960 1970 1980 1990 2000year...
Democ. in host countries Democ. at home
Democracy
Note: the top panel shows total number of Chilean students abroad in expressed in thousands. The bottom panel shows the level of democracy in home country and in students’ host countries, i.e. the average level of democracy in countries where Chilean students are. Both indices are constructed using the Freedom House index of democracy normalized so it lies between 0 and 1. The construction of the data is described in the data appendix.
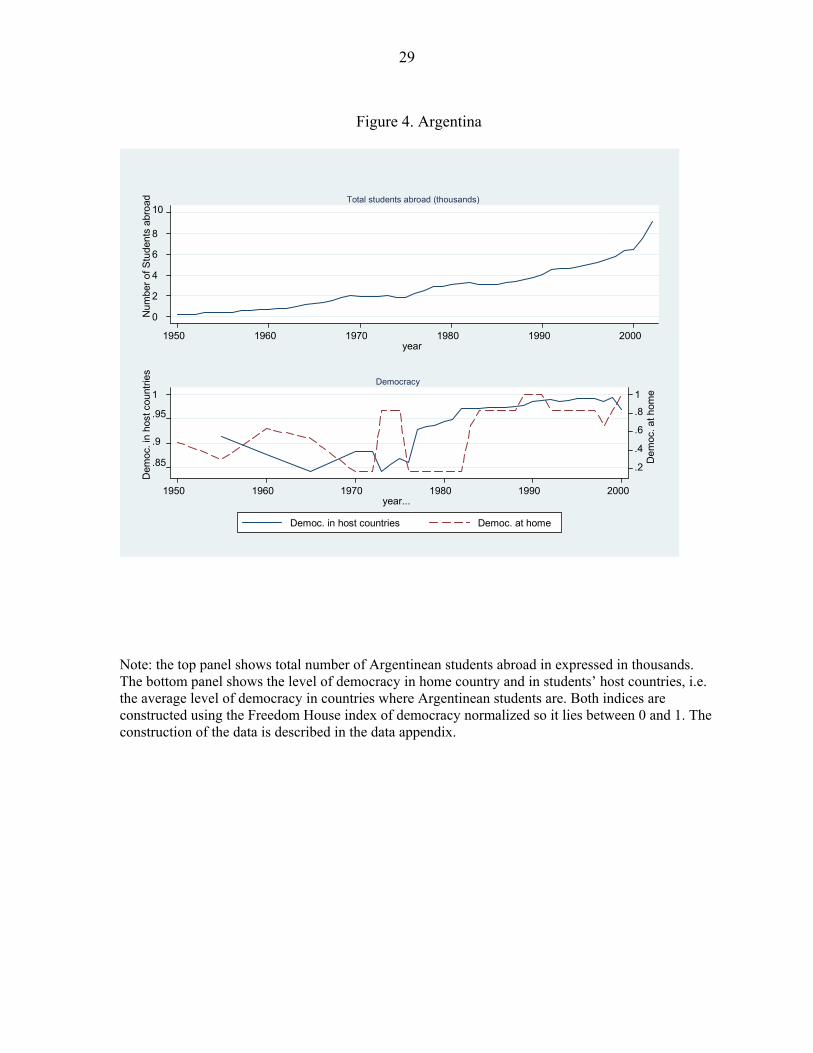
29
Figure 4. Argentina
0 2 4 6 8 10
Num
ber o
f Stu
dent
s ab
road
1950 1960 1970 1980 1990 2000 year
Total students abroad (thousands)
.2
.4
.6
.8 1
Dem
oc. a
t hom
e
.85
.9
.95 1
Dem
oc. i
n ho
st c
ount
ries
1950 1960 1970 1980 1990 2000 year...
Democ. in host countries Democ. at home
Democracy
Note: the top panel shows total number of Argentinean students abroad in expressed in thousands. The bottom panel shows the level of democracy in home country and in students’ host countries, i.e. the average level of democracy in countries where Argentinean students are. Both indices are constructed using the Freedom House index of democracy normalized so it lies between 0 and 1. The construction of the data is described in the data appendix.
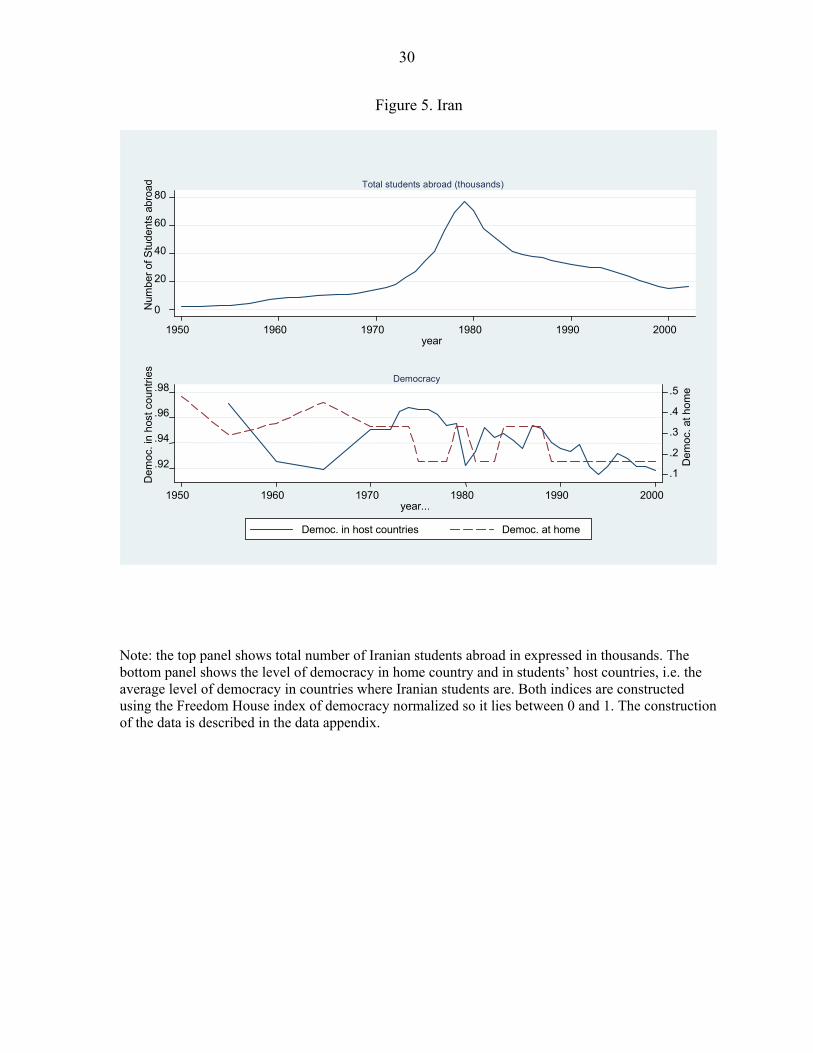
30
Figure 5. Iran
0
20
40
60
80
Num
ber o
f Stu
dent
s ab
road
1950 1960 1970 1980 1990 2000year
Total students abroad (thousands)
.1
.2
.3
.4
.5
Dem
oc. a
t hom
e
.92
.94
.96
.98
Dem
oc. i
n ho
st c
ount
ries
1950 1960 1970 1980 1990 2000year...
Democ. in host countries Democ. at home
Democracy
Note: the top panel shows total number of Iranian students abroad in expressed in thousands. The bottom panel shows the level of democracy in home country and in students’ host countries, i.e. the average level of democracy in countries where Iranian students are. Both indices are constructed using the Freedom House index of democracy normalized so it lies between 0 and 1. The construction of the data is described in the data appendix.

31
Figure 6. Republic of Korea
Note: the top panel shows total number of Korean students abroad in expressed in thousands. The bottom panel shows the level of democracy in home country and in students’ host countries, i.e. the average level of democracy in countries where Korean students are. Both indices are constructed using the Freedom House index of democracy normalized so it lies between 0 and 1. The construction of the data is described in the data appendix.
0
20 40 60 80
Number of Students abroad
1950 1960 1970 1980 1990 2000year
Total students abroad (thousands)
.3
.4
.5
.6
.7
.8 Democ. at home
.9
.95
1 Democ. in host countries
1950 1960 1970 1980 1990 2000year...
Democ. in host countries Democ. at home
Democracy

32
Figure 7. Democracy in Home Versus Host Countries
Note: the differences are taken in both cases between 1960 and 2000.
Afghanistan
AlbaniaArgentina
AustraliaAustriaBelgium
Bolivia
Brazil
Bulgaria
Cambodia
Canada
ChileChina Colombia
Costa Rica
Cuba
Cyprus
Czech Rep
Denmark
Dominican Rep
EcuadorEgypt
El Salvador
FinlandFrance
Ghana
Greece
Guatemala
Haiti
Honduras
Hungary
Iceland
India
Indonesia
IranIraq
IrelandIsrael ItalyJapan
Jordan
Korea
Lao Lebanon
Liberia
Libya
Luxembourg
Malaysia
Mexico
Mongolia
Morocco
Nepal
NetherlandsNew Zealand
Nicaragua
Nigeria
Norway
Pakistan
Panama
Paraguay
Peru Philippines
Poland
PortugalRomania
Saudi Arabia
Somalia
South Africa
Spain
Sri Lanka Sudan
SwedenSwitzerland
Syria
Thailand
Tunisia
TurkeyUKUS
UruguayVenezuela
-1
-.5
0
.5
1
Cha
nge
in A
vera
ge D
emoc
racy
in H
ost C
ount
ries
-.4 -.2 0 .2 .4 .6Change in Democracy at Home
Long-run Differences. Freedom House
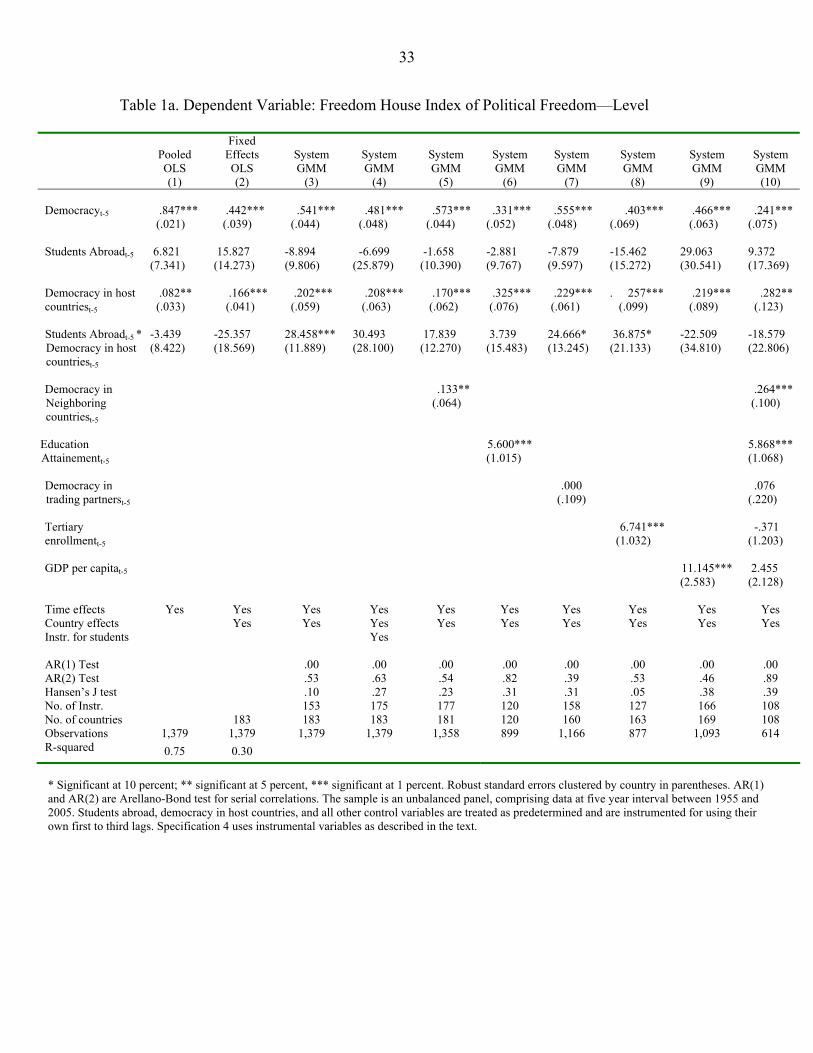
33
Table 1a. Dependent Variable: Freedom House Index of Political Freedom—Level
Pooled OLS
Fixed Effects OLS
System GMM
System GMM
System GMM
System GMM
System GMM
System GMM
System GMM
System GMM
(1) (2) (3) (4) (5) (6) (7) (8) (9) (10) Democracyt-5 .847***
(.021) .442*** (.039)
.541*** (.044)
.481*** (.048)
.573*** (.044)
.331*** (.052)
.555*** (.048)
.403*** (.069)
.466*** (.063)
.241*** (.075)
Students Abroadt-5 6.821
(7.341) 15.827 (14.273)
-8.894 (9.806)
-6.699 (25.879)
-1.658 (10.390)
-2.881 (9.767)
-7.879 (9.597)
-15.462 (15.272)
29.063 (30.541)
9.372 (17.369)
Democracy in host countriest-5
.082** (.033)
.166*** (.041)
.202*** (.059)
.208*** (.063)
.170*** (.062)
.325*** (.076)
.229*** (.061)
. 257*** (.099)
.219*** (.089)
.282** (.123)
Students Abroadt-5 * Democracy in host countriest-5
-3.439 (8.422)
-25.357 (18.569)
28.458*** (11.889)
30.493 (28.100)
17.839 (12.270)
3.739 (15.483)
24.666* (13.245)
36.875* (21.133)
-22.509 (34.810)
-18.579 (22.806)
Democracy in Neighboring countriest-5
.133** (.064)
.264*** (.100)
Education Attainementt-5
5.600*** (1.015) 5.868***
(1.068) Democracy in trading partnerst-5
.000 (.109) .076
(.220) Tertiary enrollmentt-5
6.741*** (1.032)
-.371 (1.203)
GDP per capitat-5
11.145***
(2.583) 2.455 (2.128)
Time effects Yes Yes Yes Yes Yes Yes Yes Yes Yes Yes Country effects Yes Yes Yes Yes Yes Yes Yes Yes Yes Instr. for students Yes AR(1) Test .00 .00 .00 .00 .00 .00 .00 .00 AR(2) Test .53 .63 .54 .82 .39 .53 .46 .89 Hansen’s J test .10 .27 .23 .31 .31 .05 .38 .39 No. of Instr. 153 175 177 120 158 127 166 108 No. of countries 183 183 183 181 120 160 163 169 108 Observations 1,379 1,379 1,379 1,379 1,358 899 1,166 877 1,093 614 R-squared 0.75 0.30
* Significant at 10 percent; ** significant at 5 percent, *** significant at 1 percent. Robust standard errors clustered by country in parentheses. AR(1) and AR(2) are Arellano-Bond test for serial correlations. The sample is an unbalanced panel, comprising data at five year interval between 1955 and 2005. Students abroad, democracy in host countries, and all other control variables are treated as predetermined and are instrumented for using their own first to third lags. Specification 4 uses instrumental variables as described in the text.

34
Table 1b. Dependent Variable: Freedom House Index of Political Freedom—Differences
Change in
Democracyt (5 years)
Change in Democracyt
(5 years)
Change in Democracyt (10 years)
Change in Democracyt (10 years)
Change in Democracyt (40 years)
Change in Democracyt (40 years)
OLS Fixed Effects OLS Fixed Effects OLS OLS (1) (2) (3) (4) (5) (6) 5-Year Change in Students Abroadt-5
6.699 (7.609)
6.947 (8.420)
5-Year Change Democracy in Host countriest-5
.077** (.039)
.071* (.040)
5-Year Change in (Students Abroadt-5 * Democ. in host countriest-5)
-10.357 (13.635)
-12.056 (17.494)
10-Year Change in Students Abroadt
38.209 (23.777)
37.265 (23.269)
10-Year Change in Democ. in Host Countriet
.209*** (.077)
.188** .082
10-Year Change in (Students Abroadt-10 * Democ. in Host Countriest-10)
-46.076* (26.131)
-48.623* (29.337)
40-Year Change in Students Abroadt
26.308 (75.369)
67.556 (115.848)
40-Year Change Democracy in Host Countriest
.652*** (.139)
.522*** (.162)
40-Year Change in (Students Abroadt * Democ. in Host Countriest)
-19.934 (79.571)
-64.065 (127.287)
40-Year Change in Education Attainmentt
-1.181 (2.969)
Country Effects Yes Yes No. of countries 160 160 159 159 85 68 Observations 1,073 1,073 513 513 85 68 R-squared .00 .00 .02 .02 .21 .11 * Significant at 10 percent; ** significant at 5 percent, *** significant at 1 percent. Robust standard errors clustered by country in parentheses. The sample is an unbalanced panel, comprising data between 1955 and 2005.

35
Table 2a. Dependent Variable: Polity2
Pooled OLS
Fixed Effects OLS
System GMM
System GMM
System GMM
System GMM
System GMM
System GMM
System GMM
System GMM
(1) (2) (3) (4) (5) (6) (7) (8) (9) (10) Democracyt-5 .830***
(.022) .452*** (.047)
.409*** (.064)
.445*** (.058)
.491*** (.061)
.288*** (.073)
.424*** (.065)
.338*** (.078)
.497*** (.085)
.300*** (.082)
Students Abroadt-5 2.487
(5.964) 24.229*** (8.621)
-12.382 (12.116)
-3.112 (18.947)
-9.658 (11.136)
-18.645 (12.150)
-15.735 (13.321)
-35.058*** (12.645)
-15.377 (19.694)
-53.085** (25.672)
Democracy in host countriest-5
.100*** (.036)
.116** (.052)
.355*** (.071)
.367*** (.086)
.310*** (.074)
.409*** (.098)
.349*** (.074)
.327*** (.110)
.298*** (.087)
.416*** (.125)
Students Abroadt-5 * Democracy in host countriest-5
-3.880 (7.044)
-33.712*** (12.458)
25.658** (12.904)
2.827 (25.545)
20.544* (12.274)
25.473* (13.190)
29.379** (14.635)
51.619*** (18.916)
22.729 (22.992)
56.921* (29.623)
Democracy in Neighboring countriest-5
.015 (.076)
.113 (.120)
Education Attainmentt-5
4.064*** (.844) 5.169***
(1.184) Democracy in trading partnerst-5
-.031 (.138) -.385
(.242) Tertiary enrollmentt-5
6.482*** (1.306)
.219 (1.612)
7.519** (3.303)
-1.858 (2.739)
GDP per capitat-5 Time effects Yes Yes Yes Yes Yes Yes Yes Yes Yes Yes Country effects Yes Yes Yes Yes Yes Yes Yes Yes Yes Instr. for students Yes AR(1) Test .00 .00 .00 .00 .00 .00 .00 .00 AR(2) Test .76 .70 .66 .73 .73 .49 .51 .49 Hansen’s J test .15 .24 .20 .32 .18 .05 .27 .44 No. of Instr. 139 143 142 114 135 110 132 106 No. of countries 158 158 158 157 114 150 152 147 106 Observations 1,107 1,107 1,107 1,107 1,084 781 976 724 861 528 R-squared .76 .41
* Significant at 10 percent; ** significant at 5 percent, *** significant at 1 percent. Robust standard errors clustered by country in parentheses. AR(1) and AR(2) are Arellano-Bond test for serial correlations. The sample is an unbalanced panel, comprising data at five year interval between 1955 and 2000. Students abroad, democracy in host countries, and all other control variables are treated as predetermined and are instrumented for using their own first to third lags. Specification 4 uses instrumental variables as described in the text.

36
Table 2b. Dependent Variable: Polity2—Differences
Change in
Democracyt (5 years)
Change in Democracyt
(5 years)
Change in Democracyt (10 years)
Change in Democracyt (10 years)
Change in Democracyt (40 years)
Change in Democracyt (40 years)
OLS Fixed Effects OLS Fixed Effects OLS OLS (1) (2) (3) (4) (5) (6) 5-Year Change in Students Abroadt-5
-2.913 (3.625)
-2.808 (3.580)
5-Year Change Democracy in Host countriest-5
.052 (.039)
.057 (.041)
5-Year Change in (Students Abroadt-5 * Democ. in host countriest-5)
-2.846 (6.881)
-4.231 (5.781)
10-Year Change in Students Abroadt
-2.260 (5.757)
1.027 (7.847)
10-Year Change in Democ. in Host Countriet
.184** (.076)
.285*** (.107)
10-Year Change in (Students Abroadt-10 * Democ. in Host Countriest-10)
-4.678 (10.700)
-11.803 (13.370)
40-Year Change in Students Abroadt
-179.260 (189.415)
189.408 (265.104)
40-Year Change Democracy in Host Countriest
.320* (.172)
.293 (.238)
40-Year Change in (Students Abroadt * Democ. in Host Countriest)
173.318 (195.401)
-207.936 (274.063)
40-Year Change in Education Attainmentt
-1.931 (2.958)
Country Effects Yes Yes No. of countries 138 138 135 135 Observations 846 846 340 340 97 74 R-squared .00 .00 .01 .03 .06 .04
* Significant at 10 percent; ** significant at 5 percent, *** significant at 1 percent. Robust standard errors clustered by country in parentheses. The sample is an unbalanced panel, comprising data between 1955 and 2000.
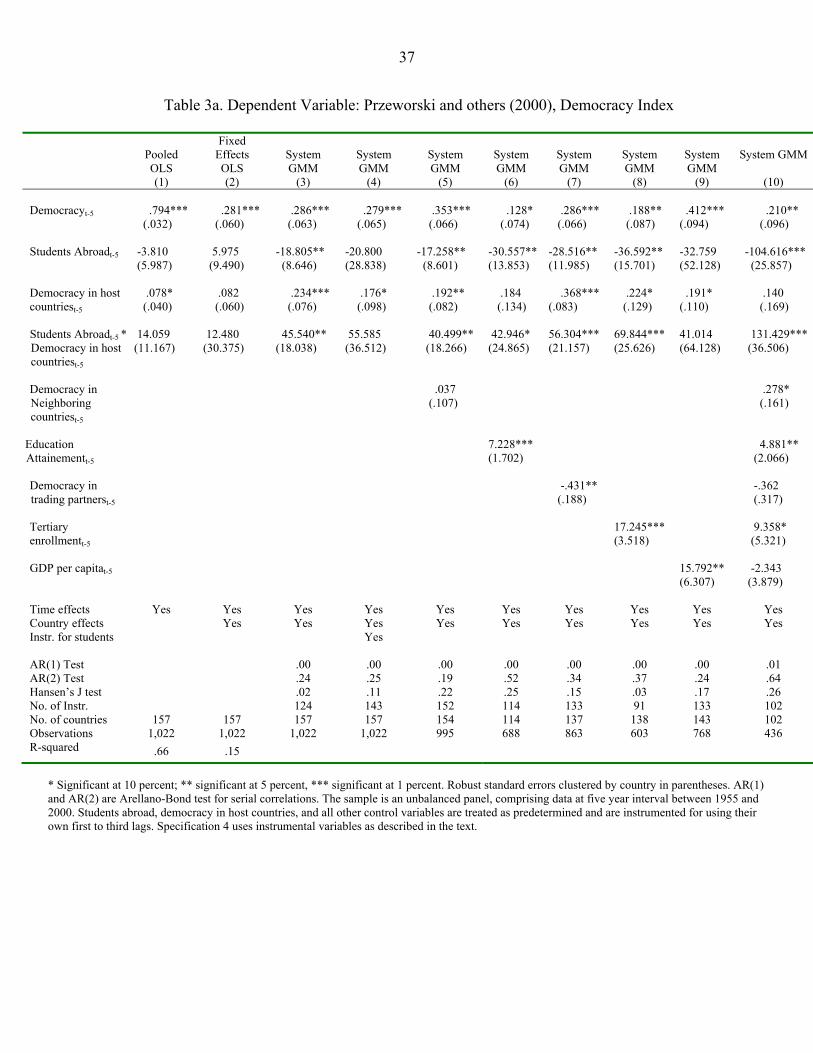
37
Table 3a. Dependent Variable: Przeworski and others (2000), Democracy Index
Pooled OLS
Fixed Effects OLS
System GMM
System GMM
System GMM
System GMM
System GMM
System GMM
System GMM
System GMM
(1) (2) (3) (4) (5) (6) (7) (8) (9) (10) Democracyt-5 .794***
(.032) .281*** (.060)
.286*** (.063)
.279*** (.065)
.353*** (.066)
.128* (.074)
.286*** (.066)
.188** (.087)
.412*** (.094)
.210** (.096)
Students Abroadt-5 -3.810
(5.987) 5.975 (9.490)
-18.805** (8.646)
-20.800 (28.838)
-17.258** (8.601)
-30.557**(13.853)
-28.516** (11.985)
-36.592** (15.701)
-32.759 (52.128)
-104.616*** (25.857)
Democracy in host countriest-5
.078* (.040)
.082 (.060)
.234*** (.076)
.176* (.098)
.192** (.082)
.184 (.134)
.368*** (.083)
.224* (.129)
.191* (.110)
.140 (.169)
Students Abroadt-5 * Democracy in host countriest-5
14.059 (11.167)
12.480 (30.375)
45.540** (18.038)
55.585 (36.512)
40.499** (18.266)
42.946* (24.865)
56.304*** (21.157)
69.844*** (25.626)
41.014 (64.128)
131.429*** (36.506)
Democracy in Neighboring countriest-5
.037 (.107)
.278* (.161)
Education Attainementt-5
7.228*** (1.702) 4.881**
(2.066) Democracy in trading partnerst-5
-.431** (.188) -.362
(.317) Tertiary enrollmentt-5
17.245*** (3.518)
9.358* (5.321)
GDP per capitat-5
15.792**
(6.307) -2.343 (3.879)
Time effects Yes Yes Yes Yes Yes Yes Yes Yes Yes Yes Country effects Yes Yes Yes Yes Yes Yes Yes Yes Yes Instr. for students Yes AR(1) Test .00 .00 .00 .00 .00 .00 .00 .01 AR(2) Test .24 .25 .19 .52 .34 .37 .24 .64 Hansen’s J test .02 .11 .22 .25 .15 .03 .17 .26 No. of Instr. 124 143 152 114 133 91 133 102 No. of countries 157 157 157 157 154 114 137 138 143 102 Observations 1,022 1,022 1,022 1,022 995 688 863 603 768 436 R-squared .66 .15
* Significant at 10 percent; ** significant at 5 percent, *** significant at 1 percent. Robust standard errors clustered by country in parentheses. AR(1) and AR(2) are Arellano-Bond test for serial correlations. The sample is an unbalanced panel, comprising data at five year interval between 1955 and 2000. Students abroad, democracy in host countries, and all other control variables are treated as predetermined and are instrumented for using their own first to third lags. Specification 4 uses instrumental variables as described in the text.

38
Table 3b. Dependent Variable: Przeworski and others (2000), Democracy Index—Differences
Change in Democracyt
(5 years)
Change in Democracyt
(5 years)
Change in Democracyt (10 years)
Change in Democracyt (10 years)
Change in Democracyt (40 years)
Change in Democracyt (40 years)
OLS Fixed Effects OLS Fixed Effects OLS OLS (1) (2) (3) (4) (5) (6) 5-Year Change in Students Abroadt-5
21.296 (21.635)
22.998 (22.022)
5-Year Change Democracy in Host countriest-5
.036 (.064)
.046 (.069)
5-Year Change in (Students Abroadt-5 * Democ. in host countriest-5)
-12.258 (14.066)
-12.880 (14.442)
10-Year Change in Students Abroadt
3.020 (6.592)
12.684 (10.782)
10-Year Change in Democ. in Host Countriet
.047 (.112)
.209 (.181)
10-Year Change in (Students Abroadt-10 * Democ. in Host Countriest-10)
11.734 (15.306)
5.494 (20.419)
35-Year Change in Students Abroadt
-238.231*** (88.980)
-120.223 (126.345)
35-Year Change Democracy in Host Countriest
.466** (.182)
.413 (.282)
35-Year Change in (Students Abroadt * Democ. in Host Countriest)
251.348*** (90.284)
149.662 (130.489)
35-Year Change in Education Attainmentt
-3.973 (3.498)
Country Effects Yes Yes No. of countries 157 157 146 146 Observations 764 764 361 361 103 78 R-squared .00 .00 .01 .02 .08 .07 * Significant at 10 percent; ** significant at 5 percent, *** significant at 1 percent. Robust standard errors clustered by country in parentheses. The sample is an unbalanced panel, comprising data between 1955 and 2000.
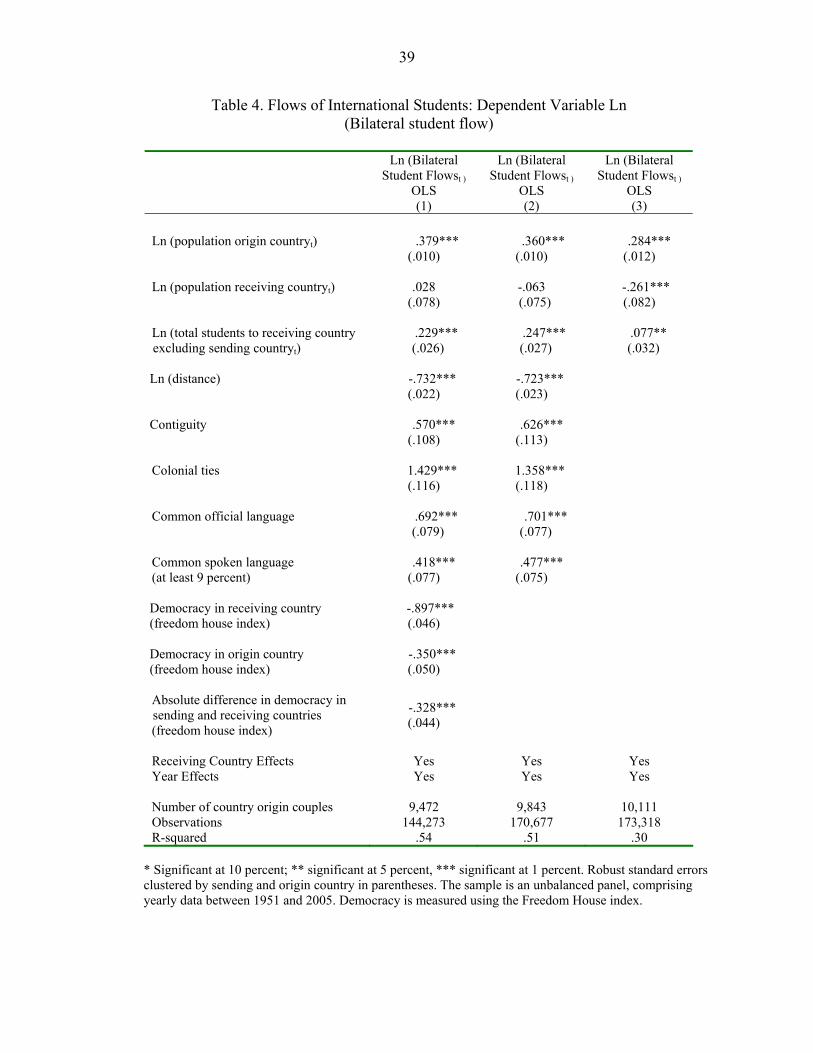
39
Table 4. Flows of International Students: Dependent Variable Ln (Bilateral student flow)
Ln (Bilateral
Student Flowst )
Ln (Bilateral Student Flowst )
Ln (Bilateral Student Flowst )
OLS OLS OLS (1) (2) (3) Ln (population origin countryt) .379***
(.010) .360***
(.010) .284***
(.012) Ln (population receiving countryt) .028
(.078) -.063
(.075) -.261***
(.082) Ln (total students to receiving country excluding sending countryt)
.229*** (.026)
.247*** (.027)
.077** (.032)
Ln (distance) -.732***
(.022) -.723***
(.023)
Contiguity .570***
(.108) .626***
(.113)
Colonial ties 1.429***
(.116) 1.358***
(.118)
Common official language .692***
(.079) .701***
(.077)
Common spoken language (at least 9 percent)
.418*** (.077)
.477*** (.075)
Democracy in receiving country (freedom house index)
-.897*** (.046)
Democracy in origin country (freedom house index)
-.350*** (.050)
Absolute difference in democracy in sending and receiving countries (freedom house index)
-.328*** (.044)
Receiving Country Effects Yes Yes Yes Year Effects Yes Yes Yes Number of country origin couples 9,472 9,843 10,111 Observations 144,273 170,677 173,318 R-squared .54 .51 .30
* Significant at 10 percent; ** significant at 5 percent, *** significant at 1 percent. Robust standard errors clustered by sending and origin country in parentheses. The sample is an unbalanced panel, comprising yearly data between 1951 and 2005. Democracy is measured using the Freedom House index.

40
Table 5. Alternative Specification of Student Variables (Dependent Variable: Democracy Indices)
Freedom
House Freedom House
Polity II
Polity II
Przeworski et al.,
Przeworski et al.,
GMM GMM GMM GMM GMM GMM (1) (2) (3) (4) (5) (6) Democracyt-5 .469***
(.051) .403***
(.054) .371***
(.078) .304***
(.076) .164**
(.067) .120* (.063)
Students to democratic countriest-5 30.438*** (6.039)
28.074*** (6.892)
28.924* (17.176)
-25.458 (33.239)
40.841*** (11.830)
56.985** (24.791)
Students to Nondemocratic countriest-5
-4.701 (7.355)
25.842 (26.521)
-12.257 (18.199)
8.893 (20.466)
-48.038*** (13.484)
-6.457 (34.135)
Time effects Yes Yes Yes Yes Yes Yes Country effects Yes Yes Yes Yes Yes Yes Instr. for students Yes Yes Yes AR(1) Test .00 .00 .00 .00 .00 .00 AR(2) Test .41 .56 .74 .93 .48 .56 Hansen’s J test .12 .08 .66 .33 .14 .20 No. of Instr. 117 117 106 106 95 95 No. of countries 184 184 158 158 157 157 Observations 1,385 1,385 1,099 1,099 1,017 1,017
* Significant at 10 percent; ** significant at 5 percent, *** significant at 1 percent. Robust standard errors clustered by country in parentheses. The sample is an unbalanced panel, comprising data between 1955 and 2005 for specifications 1 and 2, and between 1955 and 2000 for the other specifications. Students abroad are treated as predetermined and are instrumented for using their own first to third lags. Instrumental variables are described in the text.
Table 6. Earlier Versus Later Periods (Cutoff 1985)
Freedom House
Freedom House
Polity II
Polity II
Przeworski and others
(2000)
Przeworski and others
(2000) Year ≤1985 Year >1985 Year ≤1985 Year >1985 Year ≤1985 Year >1985 (1) (2) (3) (4) (5) (6) Democracyt-5 .528***
(.064) .644***
(.043) .401***
(.091) .525***
(.057) .172**
(0.084) 0.590***
(.061) Students Abroadt-5 -22.946**
(9.941) 4.739 (17.856)
-19.066 (11.958)
-34.188 (20.196)
-20.656* (11.623)
-24.980 (26.032)
Democracy in host countriest-5
.315*** (.071)
.061 (.084)
.383*** (.086)
.222** (.105)
.389*** (0.086)
.072 (.119)
Students Abroadt-5 * Democracy in host countriest-5
52.690*** (16.305)
9.147 (19.340)
39.678** (15.575)
44.768* (23.727)
60.147*** (23.046)
39.111 (30.758)
Time fixed effects Yes Yes Yes Yes Yes Yes Country fixed effects Yes Yes Yes Yes Yes Yes AR(1) Test 0 0 0 0 0 0 AR(2) Test .97 .51 .63 .18 .26 .25 Hansen’s J test .01 0 .03 0 0 .04 No. of Instruments 90 92 90 78 90 65 No. of countries 154 182 136 156 147 156 Observations 707 672 685 422 719 303
* Significant at 10 percent; ** significant at 5 percent, *** significant at 1 percent. Robust standard errors clustered by country in parentheses. AR(1) and AR(2) are Arellano-Bond test for serial correlations. The sample is an unbalanced panel, comprising data at five year interval between 1955 and 1985 for specifications (1), (2), and (3), between 1990 and 2005 for specification (2), and between 1990 and 2000 for specifications (4) and (6). Students abroad and democracy in host countries are considered predetermined and are instrumented for using their own first and second lags.
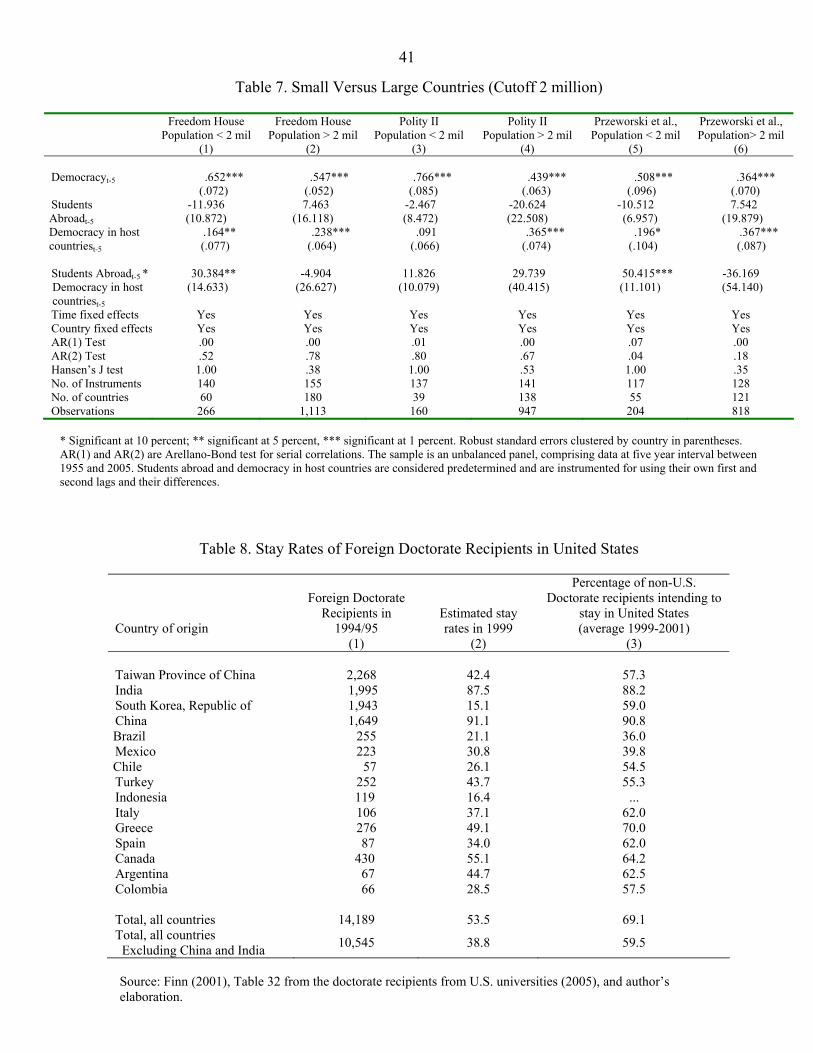
41
Table 7. Small Versus Large Countries (Cutoff 2 million)
Freedom House Freedom House Polity II Polity II Przeworski et al., Przeworski et al., Population < 2 mil Population > 2 mil Population < 2 mil Population > 2 mil Population < 2 mil Population> 2 mil (1) (2) (3) (4) (5) (6) Democracyt-5 .652***
(.072) .547***
(.052) .766***
(.085) .439***
(.063) .508***
(.096) .364***
(.070) Students Abroadt-5
-11.936 (10.872)
7.463 (16.118)
-2.467 (8.472)
-20.624 (22.508)
-10.512 (6.957)
7.542 (19.879)
Democracy in host countriest-5
.164** (.077)
.238*** (.064)
.091 (.066)
.365*** (.074)
.196* (.104)
.367*** (.087)
Students Abroadt-5 * Democracy in host countriest-5
30.384** (14.633)
-4.904 (26.627)
11.826 (10.079)
29.739 (40.415)
50.415*** (11.101)
-36.169 (54.140)
Time fixed effects Yes Yes Yes Yes Yes Yes Country fixed effects Yes Yes Yes Yes Yes Yes AR(1) Test .00 .00 .01 .00 .07 .00 AR(2) Test .52 .78 .80 .67 .04 .18 Hansen’s J test 1.00 .38 1.00 .53 1.00 .35 No. of Instruments 140 155 137 141 117 128 No. of countries 60 180 39 138 55 121 Observations 266 1,113 160 947 204 818
* Significant at 10 percent; ** significant at 5 percent, *** significant at 1 percent. Robust standard errors clustered by country in parentheses. AR(1) and AR(2) are Arellano-Bond test for serial correlations. The sample is an unbalanced panel, comprising data at five year interval between 1955 and 2005. Students abroad and democracy in host countries are considered predetermined and are instrumented for using their own first and second lags and their differences.
Table 8. Stay Rates of Foreign Doctorate Recipients in United States
Country of origin
Foreign Doctorate
Recipients in 1994/95
Estimated stay rates in 1999
Percentage of non-U.S. Doctorate recipients intending to
stay in United States (average 1999-2001)
(1) (2) (3) Taiwan Province of China 2,268 42.4 57.3 India 1,995 87.5 88.2 South Korea, Republic of 1,943 15.1 59.0 China 1,649 91.1 90.8 Brazil 255 21.1 36.0 Mexico 223 30.8 39.8 Chile 57 26.1 54.5 Turkey 252 43.7 55.3 Indonesia 119 16.4 ... Italy 106 37.1 62.0 Greece 276 49.1 70.0 Spain 87 34.0 62.0 Canada 430 55.1 64.2 Argentina 67 44.7 62.5 Colombia 66 28.5 57.5 Total, all countries 14,189 53.5 69.1 Total, all countries Excluding China and India 10,545 38.8 59.5
Source: Finn (2001), Table 32 from the doctorate recipients from U.S. universities (2005), and author’s elaboration.

42
Table 9. Summary Statistics
Obs. Mean Std. Dev. Min. Max. Foreign students as a share of population (X 1000)
1,379 1.031 2.151 0.001 20.130
Freedom House Index 1,379 .521 .376 0 1 Freedom House Index in host countries
1,379 .838 .201 .001 1
Freedom House Index in trading partners
1,166 .922 .089 .324 1
Freedom House Index in neighboring countries 1,358 .759 .160 .001 1
Polity II Index 1,107 .499 .380 0 1 Polity II Index in host countries 1,107 .826 .197 .150 1 Polity II Index in trading partners 976 .921 .092 .150 1 Polity II in neighboring countries 1,084 .774 .157 .150 1 Przeworski Index 1,022 .371 .483 0 1 Przeworski Index in host countries 1,022 .81 .243 .003 1 Przeworski Index in trading partners 863 .926 .101 .058 1
Przeworski Index in neighboring countries 995 .752 .190 .045 1
Education attainment (X 100) 899 5.055 2.837 .120 12.050 Enrollment (X 100) 877 1.502 1.651 .002 9.312 GDP per capita (X1000) 1,093 5,056 7,541 .045 46,473
The statistics refer only to the sample used in the regressions.

43
Table 10. Education of World Leaders in 1990 Country Last Name First Name Primary Secondary Tertiary Other Angola Dos Santos Jose Eduardo . . Russia . Argentina Menem Carlos Argentina Argentina Argentina . Australia Hawke Robert James
Lee Australia Australia Australia United Kingdom
Austria Vranitzky Franz Austria Austria Austria Bangladesh Ershad Hossain
Mohammad Bangladesh Bangladesh Bangladesh India
Barbados Sandiford Lloyd Erskine . . Jamaica United Kingdom Belgium Martens Wilfried . . Belgium . Benin Kerekou Mathieu France Bolivia Paz (Zamora) Jaime Bolivia Bolivia Chile . Brazil Sarnay Jose Brazil Brazil Brazil . Cameroon Biya Paul . . France . Canada Mulroney Martin Brian Canada Canada Canada . Chad Habre Hissene Chad Chad France . Chile Pinochet
(Ugarte) Augusto Chile Chile . Chile
China Xiaoping Deng China China France Russia Colombia Gaviria(Trujillo) Cesar . . Colombia . Congo, Dem. Rep.
Seko Mobutu Sese (Joseph)
Congo, Dem. Rep.
Congo, Dem. Rep.
. Belgium
Congo, Republic of
Sassou-Nguesso Denis . . . Algeria France
Costa Rica Sanchez Oscar Rafael de Jesus Arias
Costa Rica Costa Rica United States Costa Rica
Côte d'Ivoire
Houphouet-Boigny
Felix Côte d'Ivoire
Côte d'Ivoire
Senegal .
Denmark Schluter Poul Holmskov . . Denmark Denmark Dominica Charles Mary Eugenia Dominica Dominica Canada United Kingdom
Grenada Dominican Republic
Balaguer y Ricardo
Joaquin Amparo
Dominican Republic
Dominican Republic
Dominican Republic
France
Ecuador Borja (Cevallos) Rodrigo Ecuador Ecuador Ecuador Ecuador Egypt Mubarak Hosni Egypt Egypt Egypt El Salvador Burkard Alfredo Felix
Cristiani El Salvador El Salvador United States
Equatorial Guinea
Obiang Nguema Teodoro Equatorial Guinea
Equatorial Guinea
Spain
Ethiopia Haile Mariam Mengistu Ethiopia Ethiopia Ethiopia Fiji Mara Kamisese . . New Zealand United Kingdom Finland Koivisto Mauno Henrik Finland Finland Finland Finland France Mitterrand Francois France France France . Gabon Bongo Omar Congo,
Rep. of Congo, Rep. of
Chad

44
Table 10 (Continued). Education of World Leaders in 1990
Country Last Name First Name Primary Secondary Tertiary Other Gambia, The Jawara Sir Dawda . . United Kingdom . Ghana Rawlings Jerry Ghana Ghana . Ghana Greece Mitsotakis Konstantinos
Kiriakou . . Greece .
Guatemala Arevalo Marco Vinicio Cerezo
Guatemala Guatemala Guatemala .
Guinea Conte Lansana Côte d'Ivoire Honduras Romero . . . United States Hungary Antall Jozsef Hungary Hungary Hungary Iceland Hermannsson Steingrimur Iceland Iceland United States United States India Shekhar Chandra . . . India
Indonesia Suharto . . Indonesia .
Iran Khamenei Sayyed Mohammad Ali Hoseyn
Iran Iran Iran
Ireland Haughey Charles James Ireland Ireland Ireland .
Israel Shamir Yitzhak . Poland Palestine
Italy Andreotti Giulio . . Italy
Jamaica Manley Michael Norman
. . United Kingdom
Japan Kaifu Toshiki . . Japan
Jordan al-Hashimi Hussein ibn Talal
. United Kingdom
United Kingdom
Kenya Moi Daniel Arap . Kenya Kenya
Korea, Republic of
Roh Tae Woo . Korea, Republic of
Korea, Republic of
Lesotho Lekhanya Justin . . .
Liberia Doe Samuel K. . . .
Liberia Sawyer Amos . . . United States
Luxembourg Santer Jacques . . France France
Madagascar Ratsiraka Didier . Madagascar France Malawi Banda Hastings K. . United States United States United Kingdom Malaysia Mohamad Datuk Ser
Mahathir Bin . . Malaysia Singapore
Mali Traore Moussa . Mali France . Mauritania Taya Maaouya
Ould Sid'ahmed
Mauritania Mauritania Mauritania
Mauritius Jugnauth Aneerood . . United Kingdom .
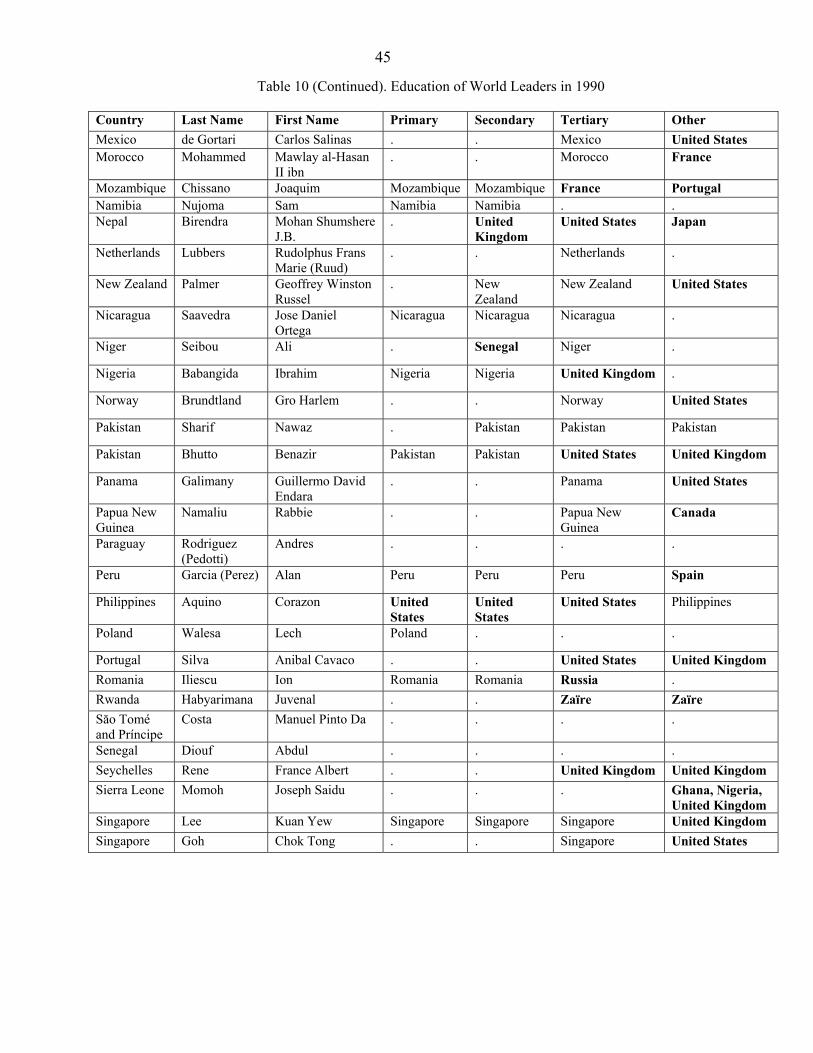
45
Table 10 (Continued). Education of World Leaders in 1990
Country Last Name First Name Primary Secondary Tertiary Other Mexico de Gortari Carlos Salinas . . Mexico United States Morocco Mohammed Mawlay al-Hasan
II ibn . . Morocco France
Mozambique Chissano Joaquim Mozambique Mozambique France Portugal Namibia Nujoma Sam Namibia Namibia . . Nepal Birendra Mohan Shumshere
J.B. . United
Kingdom United States Japan
Netherlands Lubbers Rudolphus Frans Marie (Ruud)
. . Netherlands .
New Zealand Palmer Geoffrey Winston Russel
. New Zealand
New Zealand United States
Nicaragua Saavedra Jose Daniel Ortega
Nicaragua Nicaragua Nicaragua .
Niger Seibou Ali . Senegal Niger .
Nigeria Babangida Ibrahim Nigeria Nigeria United Kingdom .
Norway Brundtland Gro Harlem . . Norway United States
Pakistan Sharif Nawaz . Pakistan Pakistan Pakistan
Pakistan Bhutto Benazir Pakistan Pakistan United States United Kingdom
Panama Galimany Guillermo David Endara
. . Panama United States
Papua New Guinea
Namaliu Rabbie . . Papua New Guinea
Canada
Paraguay Rodriguez (Pedotti)
Andres . . . .
Peru Garcia (Perez) Alan Peru Peru Peru Spain
Philippines Aquino Corazon United States
United States
United States Philippines
Poland Walesa Lech Poland . . .
Portugal Silva Anibal Cavaco . . United States United Kingdom Romania Iliescu Ion Romania Romania Russia . Rwanda Habyarimana Juvenal . . Zaïre Zaïre Săo Tomé and Príncipe
Costa Manuel Pinto Da . . . .
Senegal Diouf Abdul . . . . Seychelles Rene France Albert . . United Kingdom United Kingdom Sierra Leone Momoh Joseph Saidu . . . Ghana, Nigeria,
United Kingdom Singapore Lee Kuan Yew Singapore Singapore Singapore United Kingdom Singapore Goh Chok Tong . . Singapore United States

46
Table 10 (Concluded). Education of World Leaders in 1990
Country Last name First name primary Secondary tertiary other Somalia Barre Mohammed
Siad Italy
South Africa de Klerk F.W. . . South Africa .
Spain Marquez Felipe Gonzales
. . Spain Spain
Sri Lanka Premadasa Ranasinghe . . Sri Lanka .
St. Kitts & Nevis
Simmonds Kennedy St. Kitts & Nevis
St. Kitts & Nevis
Jamaica Bahamas
St. Lucia Compton John . . . United Kingdom
St.Vincent & Grenadines
Mitchell James Fitz-Allen
. . Trinidad &Tobago
Canada
Sudan Al-Bashir Omar . . . Egypt
Sweden Carlsson Ingvar Gosta Sweden Sweden United States .
Switzerland Koller Arnold . . . .
Syria al-Assad Abu Sulayman Hafiz
Syria Syria Syria
Taiwan, Province of China
Teng-Hui Lee Taiwan, Province of China
Taiwan, Province of China
Japan Taiwan, Province of China
Tanzania Mwinyi Ali Hassan Tanzania Tanzania Tanzania United Kingdom
Thailand Choonhavan Chatichai Thailand Thailand Thailand United States
Togo Eyadema Gnassingbe Togo Togo . .
Trinidad & Tobago
Robinson Arthur Napoleon
Trinidad & Tobago
Trinidad & Tobago
United Kingdom United Kingdom
Tunisia Ali Zine El Abidine Ben
. . France United States
Turkey Ozal Turgut Turkey Turkey Turkey United States Uganda Museveni Yoweri Uganda Uganda Tanzania . United Kingdom
Major John Roy United Kingdom
United Kingdom
. .
United Kingdom
Thatcher Margaret Hilda
UK United Kingdom
United Kingdom .
United States Bush George H. United States United States United States . Uruguay Lacalle Luis . . Uruguay . Uruguay Sanguinetti
(Cairolo) Julio . . Uruguay .
Venezuela Perez Carlos Andres . Venezuela Venezuela . Yemen al-Hashidi Ali 'Abd Allah
Saleh Yemen Yemen Yemen .
Zimbabwe Mugabe Robert . . South Africa United Kingdom Source: Author’s research. The list of leaders is from the list of world leaders from Jones and Olken (2005). The table includes leaders who were in power in 1990. The information was collected by checking biography of each leader. If no information was available a missing value is indicated.

47
References Acemoglu, Daron, Simon Johnson, James A. Robinson, and Pierre Yared, 2005a, “From
Education to Democracy,” American Economic Review, Papers and Proceedings, Vol. 95 (May), pp. 44−49.
———, 2005b, “Income and Democracy,” NBER Working Paper No. 11205, (Cambridge,
Massachusetts: National Bureau of Economic Research). Acemoglu, Daron, and James A. Robinson, 2005, Economic Origin of Dictatorship and
Democracy, (Cambridge, Massachusetts: MIT University Press). Akerlof, George A., and Rachel E. Kranton, 2005, “Identity and the Economics of
Organizations,” Journal of Economic Perspectives, Vol. 19, pp. 9−32. Arellano, Manuel, and Stephen R. Bond, 1991, “Some Specification Tests for Panel Data:
Monte Carlo Evidence and an Application to Employment Equations,” Review of Economic Studies, Vol. 58, pp. 277−98.
Armstrong, Karen, 2000, The Battle for God: Fundamentalism in Judaism, Christianity and
Islam (New York: Harper Collins, 2000). Aslambeigui, Hahid, and Verónica Montecinos, 1998, “Foreign Students in U.S. Doctoral
Programs,” Journal of Economic Perspectives, Vol. 12 No. 6, (Summer), pp. 171−82. Atkinson, Carol, 2006, “Constructivist Implications of Material Power: Military Engagement
and the Socialization of States, 1972–2000,” International Studies Quarterly, Vol. 50 No. 3 (September), pp. 509−537.
Baker, Joe G., and Michael G. Finn, 2003, “Stay Rates of Foreign National Doctoral Students
in U.S. Economics Programs,” available on the Social Science Research Network website at: http://ssrn.com/abstract=398640.
Barnett, George A., and Reggie Yingli Wu, 1995, “The International Student Exchange
Network: 1970 and 1989,” Higher Education, Vol. 30, pp. 353−68. Barro, Robert J., 1997, “The Determinants of Democracy,” Journal of Political Economy,
Vol. 107, pp. S158−83. ———, and Jong-Wha Lee, 2000, “International Data on Educational Attainment: Updates
and Implications,” Center for International Development Working Paper. Blundell, Richard, and Stephen R. Bond, 1998, “Initial Conditions and Moment Restrictions
in Dynamic Panel Data Models,” Journal of Econometrics, Vol. 87, pp. 115−43. Boix, Charles, and Sebastián Rosato, 2001, “A Complete Data Set of Political Regimes,
1800-1999,” Unpublished manuscript: Department of Political Science, (Chicago: University of Chicago).

48
Bollag, Burton, 1990, “Fall of Communist Governments Has Cut Enrollment of Third-World
Students in Eastern-Block Universities,” The Chronicle of Higher Education, Vol. 37, No. 1.
Bollen, Kenneth A., 1990, “Political Democracy: Conceptual and Measurement Traps,”
Studies in Comparative International Development, Vol. 25, pp. 7-24. ———, 2001, “Cross-National Indicators of Liberal Democracy, 1950-90,” [Computer file],
2nd CPSR version, (Chapel Hill, North Carolina: University of North Carolina [producer], Inter-University Consortium for Political and Social Research.
Bond, Stephen R., 2002, “Dynamic Panel Data Models: A Guide to Microdata Methods and
Practice,” Portuguese Economic Journal, Vol. 1, (January), pp. 141-62. Borjas , George J., 2000, “Foreign-Born Teaching Assistants and the Academic Performance
of Undergraduates,” American Economic Review, (May), pp. 355-59. ———, 2000a, “Center for Immigration Studies Backgrounder,” (June). ———, 2002b, “Rethinking Foreign Students," National Review, (June), 2nd issue. ———, 2005, “Do Foreign Students Crowd Out Native Students from Graduate Programs,”
in Science and the University, edited by Ronald G. Ehrenberg and Paula E. Stephan, forthcoming: (Wisconsin: University of Wisconsin Press).
Bratsberg, Bernt, 1995, “The Incidence of No-return Among Foreign Students in the United
States,” Economics of Education Review, Vol. 14 No. 4, pp. 373-84. Carrington, William J., and Enrica Detragiache, 1998, “How Big Is the Brain Drain?” IMF
Working Paper 98/102 (Washington: International Monetary Fund). Castelló-Climent, Amparo, 2006, “Distribution of Education and Democracy,” Manuscript:
(Valencia, Spain: University of Valencia Institute of International Economics), June. Desruisseaux, Paul, 2000, “As Exchanges Lose a Political Rationale, their Role is Debated,”
The Chronicle of Higher Education, Vol.46 Issue 23. Doctorate Recipients from United States Universities: Summary Report 2004, Survey of
Earned Doctorates, (University of Chicago: NORC National Organization for Research and Computing) from website: http://www.norc.uchicago.edu/issues/sed-2004.pdf)
Dreher, Axel, Michael Lamla, Sarah Rupprecht, and Frank Somogyi, 2006, “The impact of
political leaders’ profession and education on reforms,” mimeo. Finn, Michael G., 2001, “Stay rates of Foreign Doctorate Recipients from U.S. Universities,”
Mimeo: Oak Ridge Institute for Science and Education.

49
Freedom House, 2004, Freedom in the World, website “http://www.freedomhouse.org/”. Gardner, John W.,1952, “The Foreign Student in America,” Foreign Affairs, Vol. 30 Issue 4,
pp. 637-50. Glaeser, Edward L., Rafael La Porta, Florencio Lopez-de-Silanes, and Andrei Shleifer, 2004,
“Do Institutions Cause Growth?” Journal of Economic Growth, No. 9, pp. 271-303. Glaeser, Edward L., Giacomo A.M. Ponzetto, and Andrei Shleifer, 2006, “Why does
Democracy Need Education?” NBER Working Paper No. 12128, (Cambridge, Massachusetts: National Bureau of Economic Research).
Glaeser, William A., 1979, The Brain Drain: Emigration and Return, (New York: Pergamon
Publishers). Hanushek, A. Erik, and Dennis K. Kimko, 2000, “Schooling, Labor Force Quality, and the
Growth of Nations,” American Economic Review, Vol. 90 No. 5. pp. 1184-1208. Jones, Benjamin F., and Benjamin A. Olken, 2005, “Do Leaders Matter? National Leadership
and Growth since World War II,” Quarterly Journal of Economics, Vol. 120(3) pp. 835-64.
Kim, J., 1998, “Economic Analysis of Foreign Education and Students Abroad,” Journal of
Development Economics, Vol. 56 Issue 2, pp. 337-65. ———, Seymour M., 1959, “Some Social Requisites of Democracy: Economic
Development and Economic Legitimacy,” American Political Science Review, Vol. 53, pp. 69-105.
Lipset, Seymour M., 1967, “Values, Education, and Entrepreneurship” in Seymour M. Lipset
and Aldo Solari (eds.) Elites in Latin America (New York: Cambridge University Press)
Li, Quan, and Rafael Reuveny, 2003. “Economic Globalization and Democracy: an
Empirical Analysis,” British Journal of Political Science, Vol. 33 pp. 29-54. López-Córdova J. Ernesto, and Christopher Meissner, 2005, “The Globalization of Trade and
Democracy, 1870-2000,” NBER Working Paper 11117, (Cambridge, Massachusetts: National Bureau of Economic Research).
Malan, Stephanus, 2001, “Contributing to the African Renaissance Vision: the Role of South
African Higher Education Institutions,” Development Southern Africa, Vol. 18 No. 4, pp. 513-23.
Markoff, John, and Verónica Montecino, 1993, “The Ubiquitous Rise of Economists,”
Journal of Public Policy, Vol. 13 Issue 1. pp. 36-68.

50
Milligan, Kevin, Enrico Moretti, and Philip Oreopoulos, 2004, “Does Education Improve Citizenship? Evidence from the United States and the United Kingdom,” Journal of Public Economics, Vol. 88. pp. 1667-95.
North, Douglass C., 1981, Structure and Change in Economic History, (New York:
Norton and Company) Nye, Joseph S. Jr., 2004, Soft Power, (New York: Public Affairs). Papaioannou, Elias, and Gregorios Siourounis, 2005, “Economic and Social Factors Driving
the Third Wave of Democratization,” mimeo, (London: London Business School). Parsons, Talcott, 1960, Structure and Process in Modern Society, (New York: The Free
Press) Przeworski, Adam, Michael Alvarez, José A. Cheibub, and Fernando Limongi, 2000,
Democracy and Development: Political Institutions and Material Well-being in the World, 1950-1990, (New York: Cambridge University Press).
Richmond, Yale, 2003, Cultural Exchange and the Cold War: Raising the Iron Curtain.
(University Park, Pennsylvania: Pennsylvania State University Press). Rigobón, Roberto, and Dani Rodrik, 2005, “Rule of Law, Democracy, Openness, and
Income: Estimating the Interrelationships,” The Economics of Transition, Vol. 13 No. 3, pp. 533-64.
Rosenzweig, Mark R, 2007, “Global Differences and International Student Flows” Brookings
Trade Forum, forthcoming. Sakellaris, Plutarchos, and Antonio Spilimbergo, 2000, “Business Cycle and Human Capital
Investment: Country Evidence on University Student Flow to the United States,” Carnegie-Rochester Conference Series on Public Policy, Issue 52 No. 1, (June), pp 221-56.
Selltiz, Claire, June R. Christ, Joal Havel, and Stuart W. Cook, 1963, Attitudes and Social
Relations of Foreign Students in the United States. (Minneapolis, Minnesota: Minnesota University Press).
Valdés, Juan Gabriel, 1995, Pinochet’s Economists, The Chicago School in Chile,
(Cambridge, Massachusetts: Cambridge University Press). Wooldridge, Jeffrey M., 2002, Econometric Analysis of Cross Section and Panel Data,
(Cambridge , Massachusetts: The MIT Press). Ye, Weili, 2001, Seeking Modernity in China’s Name Chinese Students in the United States,
1900-27 (Stanford, California: Stanford University Press).