dementia research group mri, rates of atrophy and alzheimer’s disease nick fox dementia research...
TRANSCRIPT

Dementia Research GroupDementia Research Group
MRI, rates of atrophy and MRI, rates of atrophy and Alzheimer’s diseaseAlzheimer’s disease
Nick FoxNick FoxDementia Research Group Dementia Research Group
Institute of Neurology, UCLInstitute of Neurology, UCL
Queen Square, LondonQueen Square, London
EnglandEngland
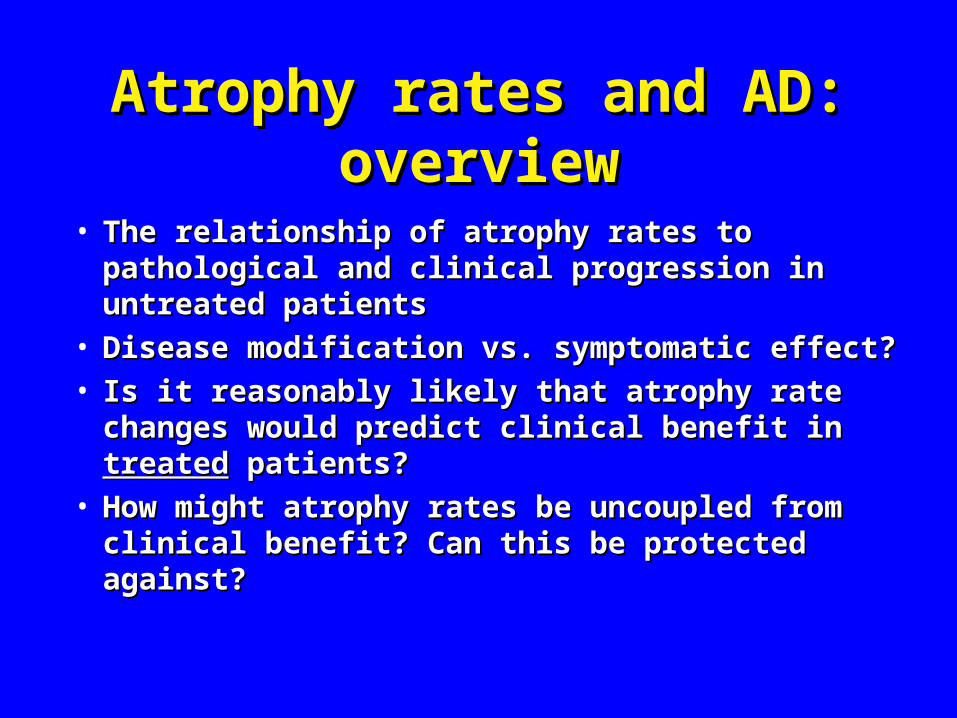
Atrophy rates and AD: Atrophy rates and AD: overviewoverview
• The relationship of atrophy rates to pathological The relationship of atrophy rates to pathological and clinical progression in untreated patientsand clinical progression in untreated patients
• Disease modification vs. symptomatic effect?Disease modification vs. symptomatic effect?• Is it reasonably likely that atrophy rate changes Is it reasonably likely that atrophy rate changes
would predict clinical benefit in would predict clinical benefit in treatedtreated patients? patients?• How might atrophy rates be uncoupled from How might atrophy rates be uncoupled from
clinical benefit? Can this be protected against? clinical benefit? Can this be protected against?

AD is characterised pathologically by AD is characterised pathologically by neurofibrillary tangles, neuritic amyloid neurofibrillary tangles, neuritic amyloid
plaques, synapse loss, dendritic pruning,cell plaques, synapse loss, dendritic pruning,cell loss and loss and atrophyatrophy……
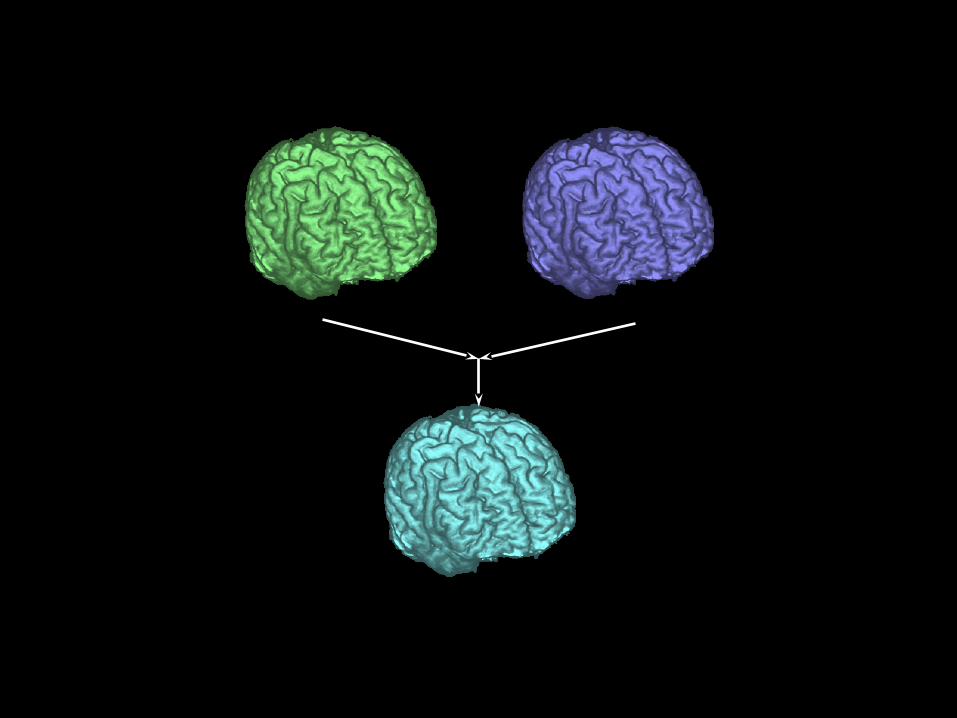
MRI can visualise and MRI can visualise and measure atrophy ratesmeasure atrophy rates

Time 0 18months 36months
H
Serial coronal MRI of an individual with initially mild AD
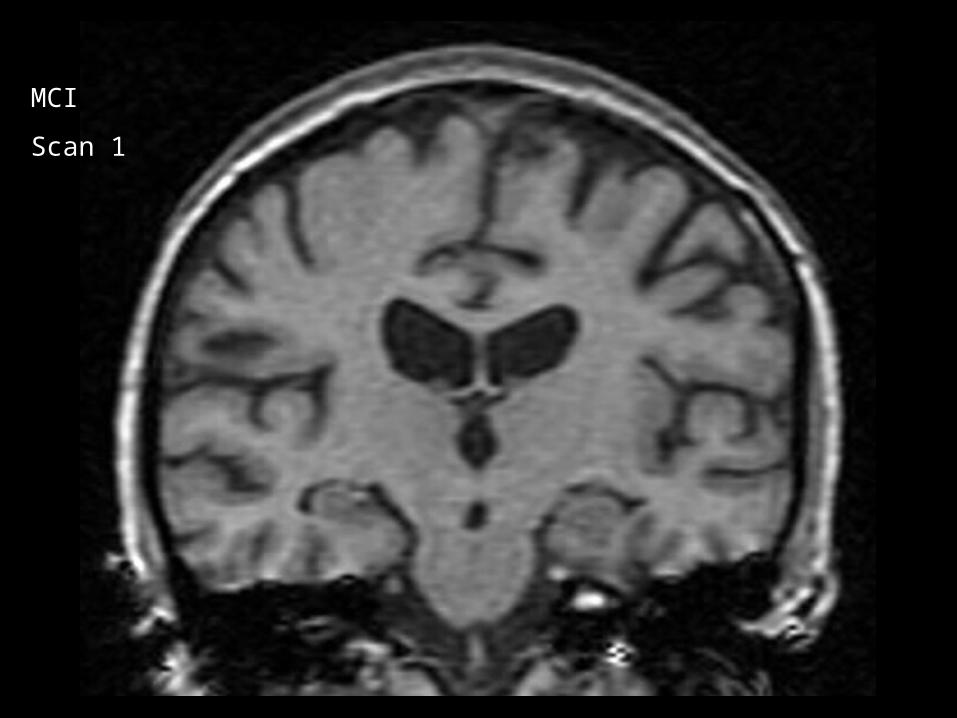
MCI
Scan 1
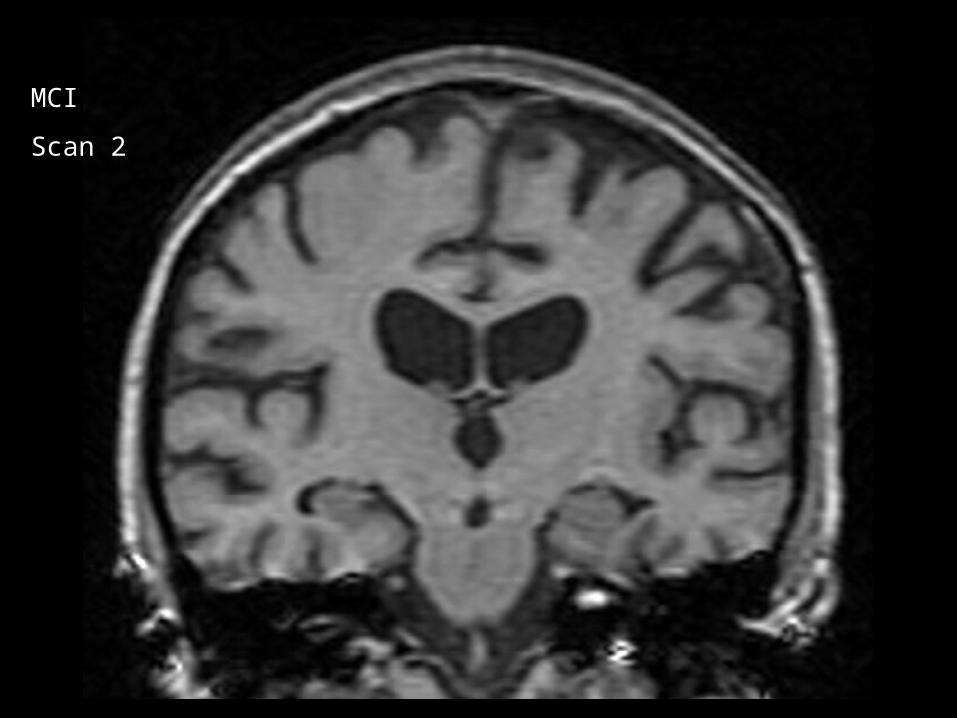
MCI
Scan 2
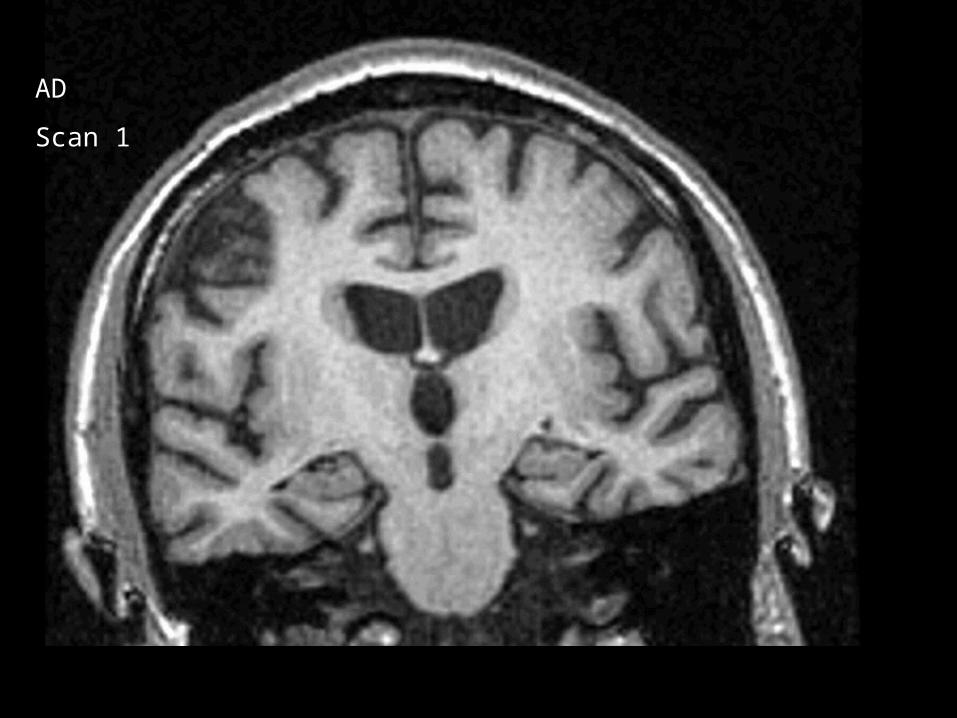
AD
Scan 1
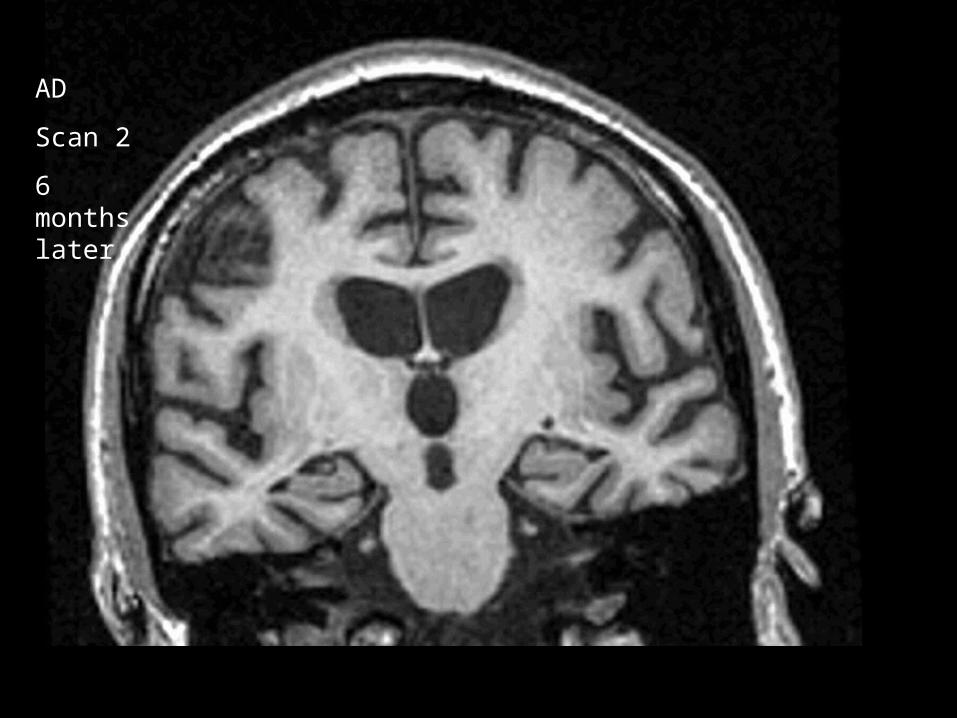
AD
Scan 2
6 months later
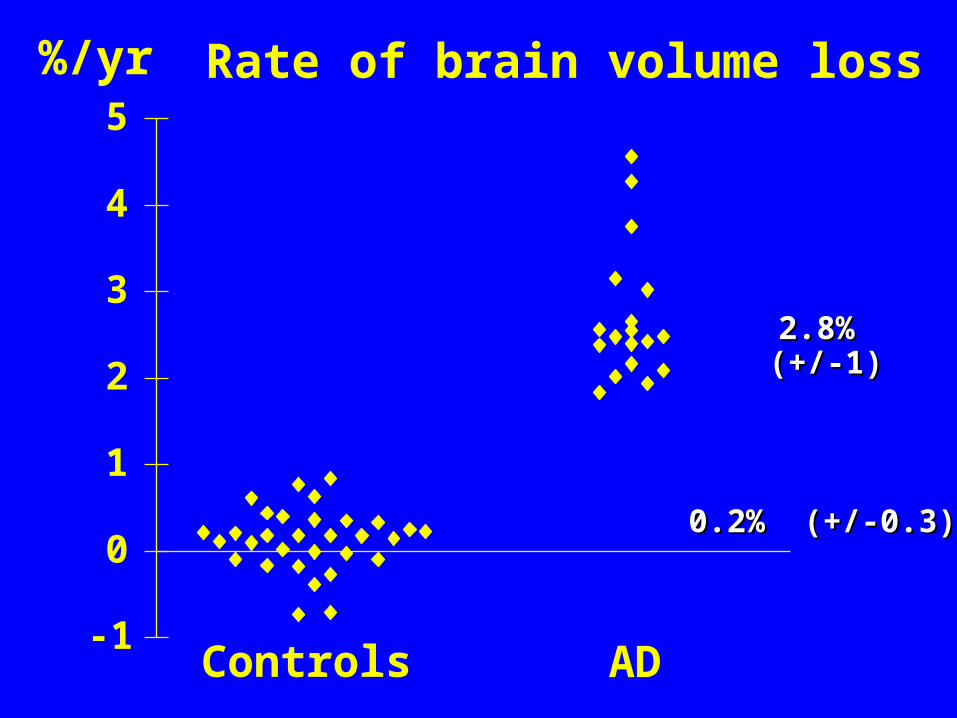
-1
0
1
2
3
4
5
Controls AD
Rate of brain volume loss%/yr
2.8% (+/-1)2.8% (+/-1)
0.2% (+/-0.3)0.2% (+/-0.3)
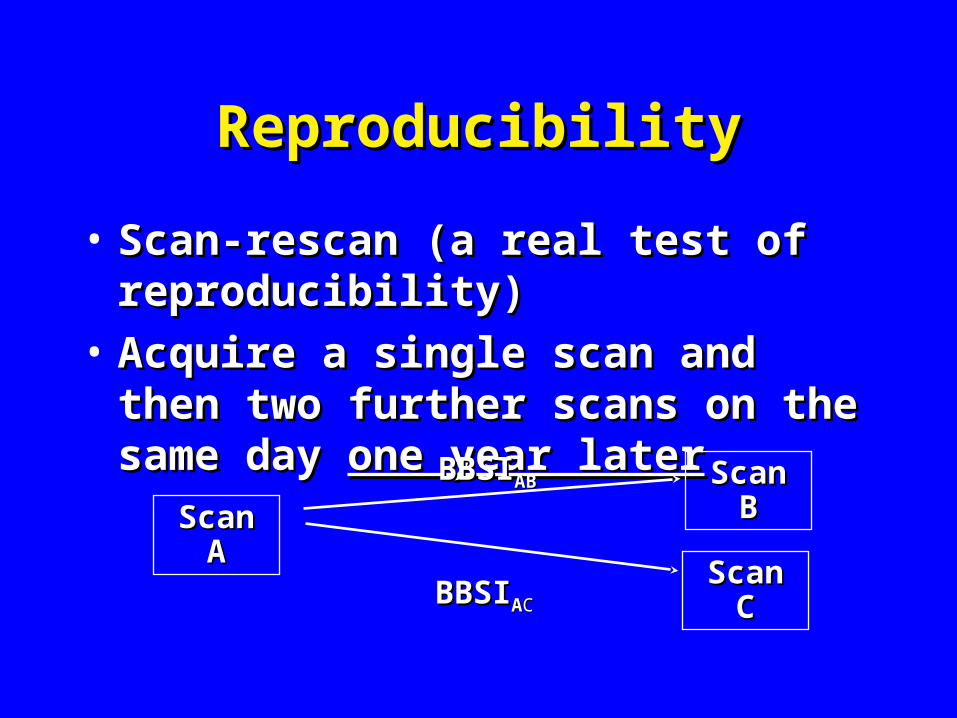
ReproducibilityReproducibility
• Scan-rescan (a real test of Scan-rescan (a real test of reproducibility)reproducibility)
• Acquire a single scan and then two Acquire a single scan and then two further scans on the same day further scans on the same day one year one year laterlater
Scan Scan AA
Scan Scan CC
Scan Scan BB
BBSIBBSIABAB
BBSIBBSIAACC
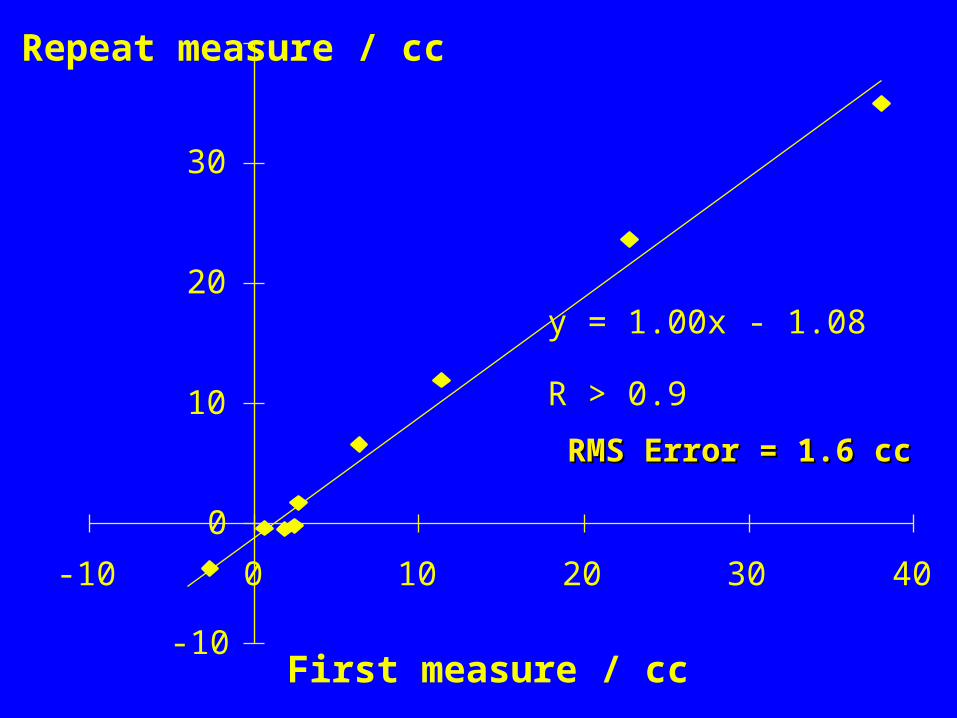
y = 1.00x - 1.08
R > 0.9
-10
0
10
20
30
-10 0 10 20 30 40
First measure / cc
Repeat measure / cc
RMS Error = 1.6 ccRMS Error = 1.6 cc
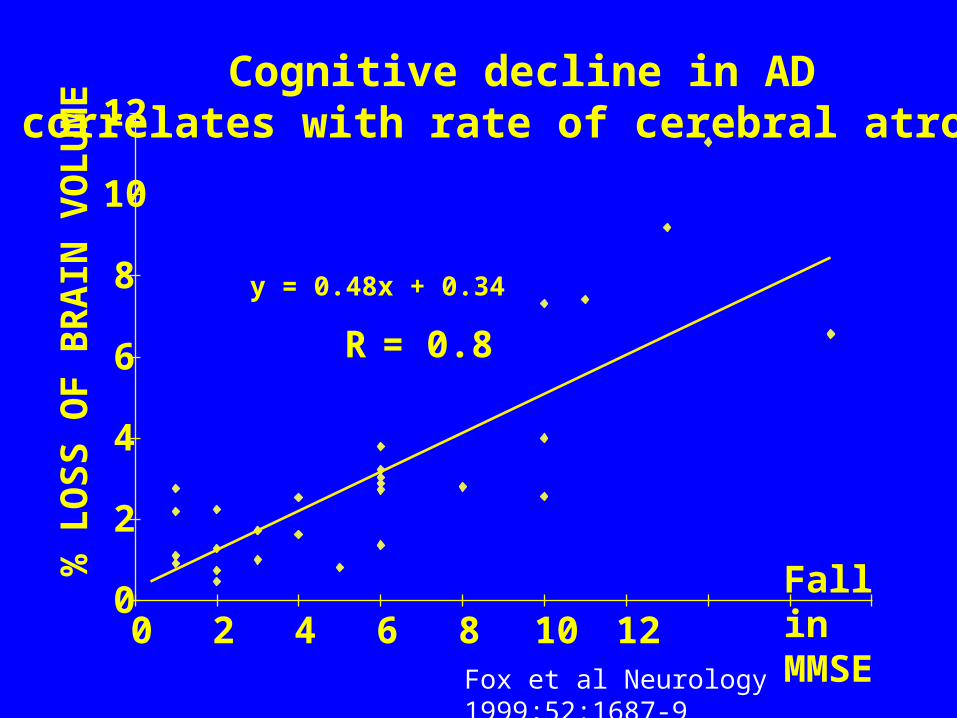
y = 0.48x + 0.34
R = 0.8
0
2
4
6
8
10
12
0 2 4 6 8 10 12Fall in MMSE
% L
OS
S O
F B
RA
IN V
OL
UM
E Cognitive decline in ADcorrelates with rate of cerebral atrophy
Fox et al Neurology 1999;52:1687-9
Dementia Research GroupDementia Research Group
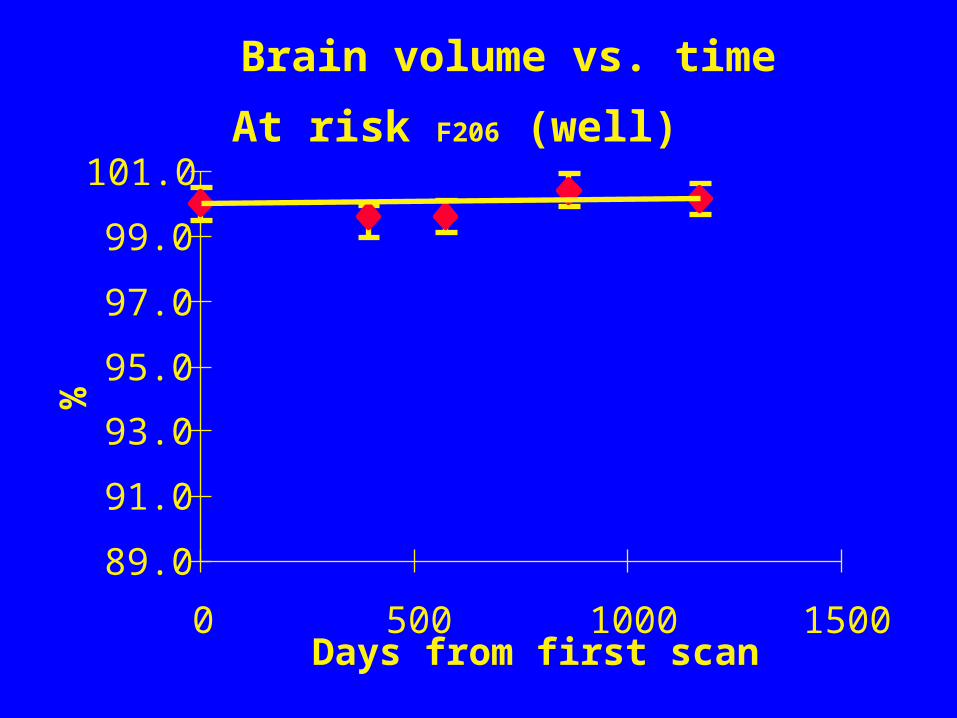
At risk F206 (well)
Brain volume vs. time
89.0
91.0
93.0
95.0
97.0
99.0
101.0
0 500 1000 1500Days from first scan
%
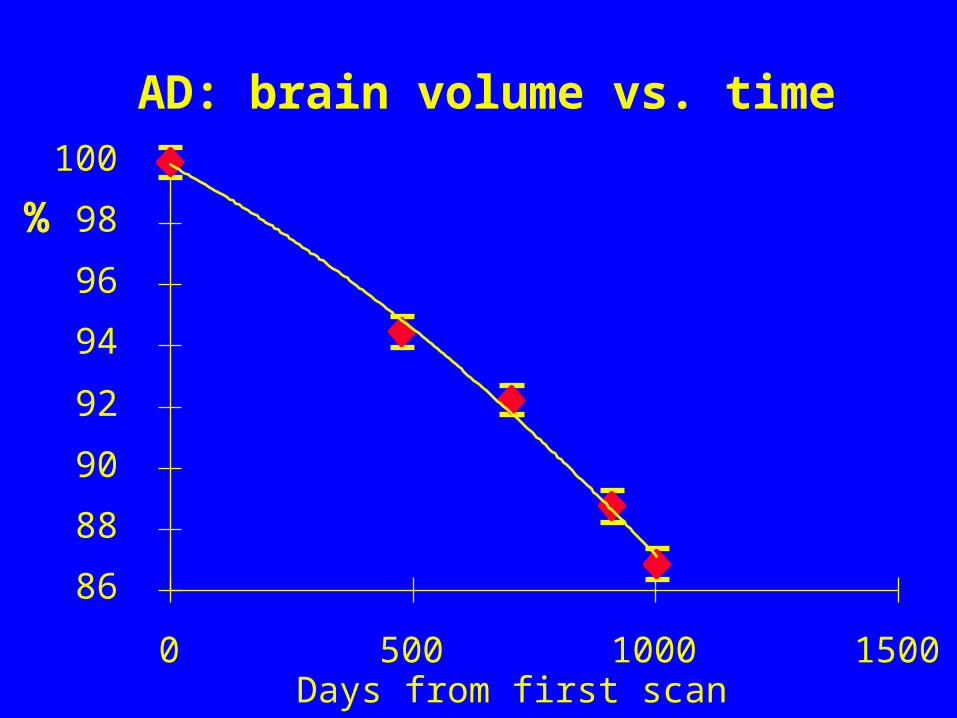
AD: brain volume vs. time
86
88
90
92
94
96
98
100
0 500 1000 1500Days from first scan
%

Rate of atrophy predicts conversion to AD Rate of atrophy predicts conversion to AD in at-risk subjectsin at-risk subjects
Fox et al The Lancet 1999; 353:2125
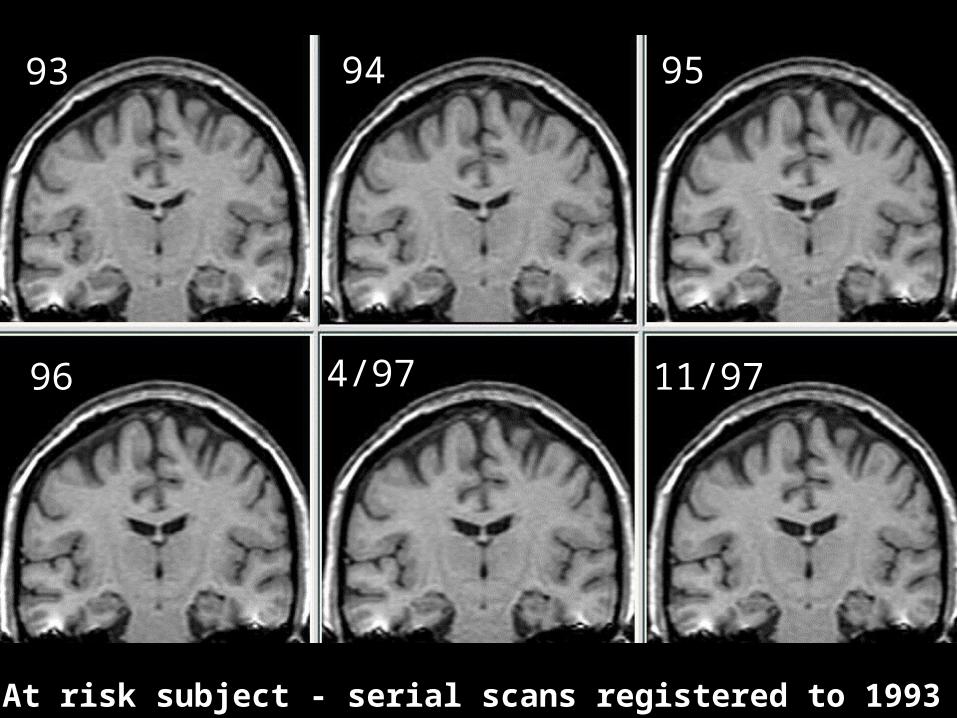
93 94 95
96 4/97 11/97
AD: At risk subject - serial scans registered to 1993 baselineAD: At risk subject - serial scans registered to 1993 baseline

93
11/97
Red = lossRed = loss
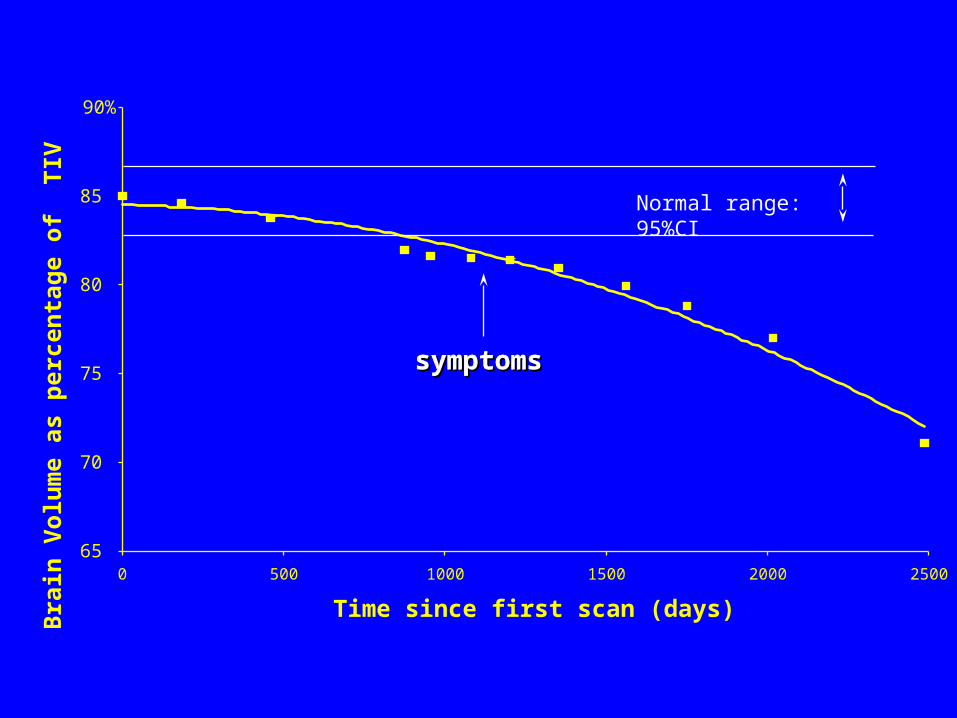
65
70
75
80
85
90%
0 500 1000 1500 2000 2500
Time since first scan (days)
Bra
in V
olu
me
as p
erce
nta
ge
of
TIV
symptomssymptomssymptomssymptoms
Normal range: 95%CI
Dementia Research GroupDementia Research Group
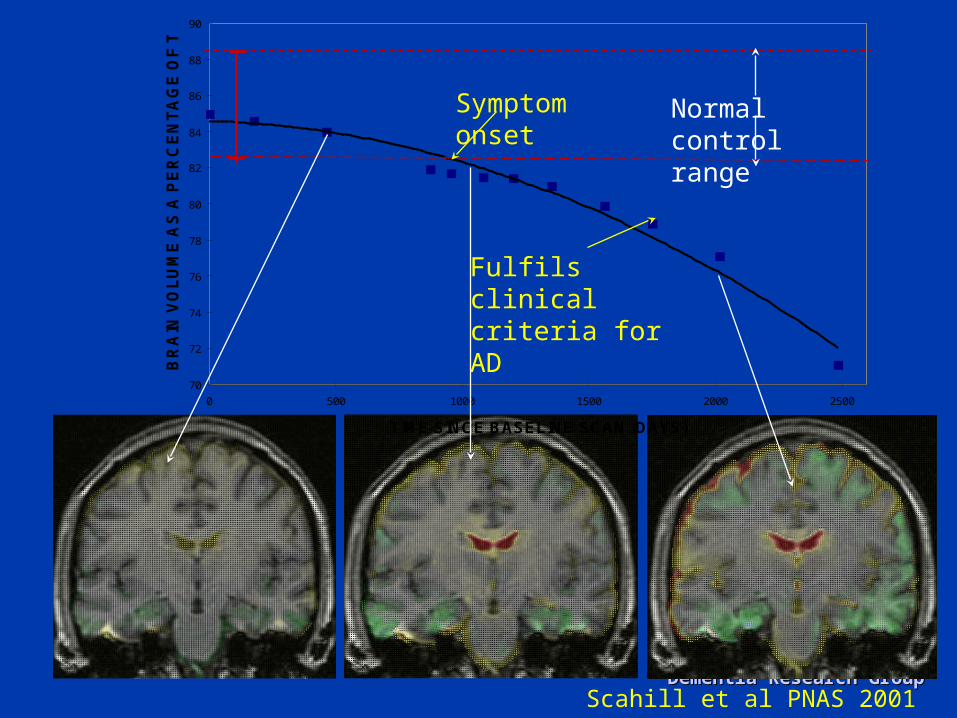
70
72
74
76
78
80
82
84
86
88
90
0 500 1000 1500 2000 2500
TIME SINCE BASELINE SCAN (DAYS)
BR
AIN
VO
LU
ME
AS
A P
ER
CE
NT
AG
E O
F T
IV
Normal control range
Symptom onset
Fulfils clinical criteria for AD
Scahill et al PNAS 2001
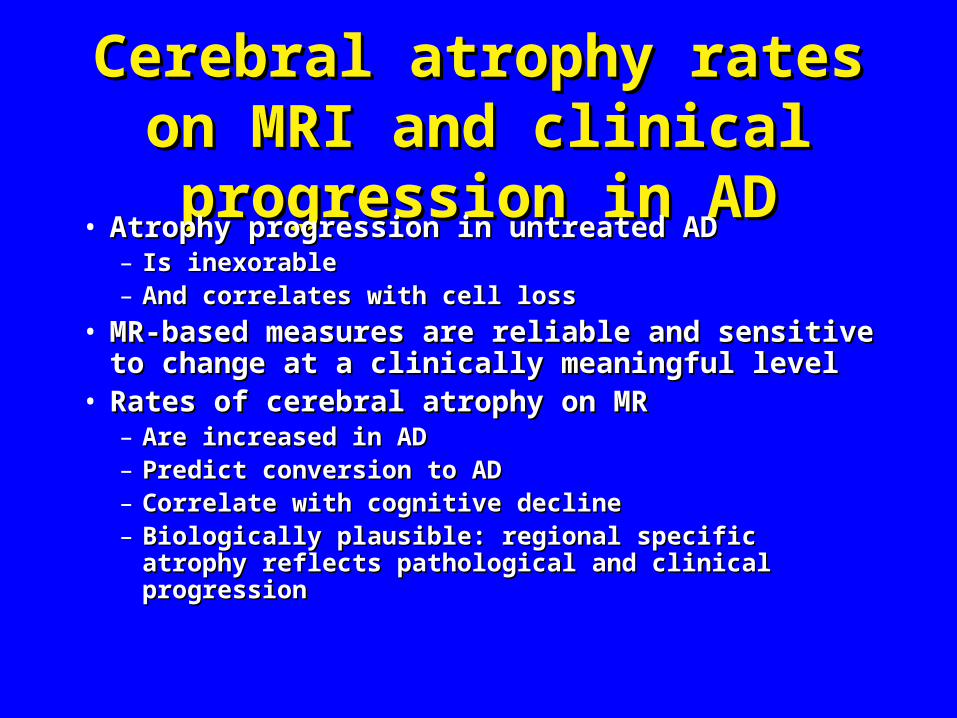
Cerebral atrophy rates on MRI Cerebral atrophy rates on MRI and clinical progression in ADand clinical progression in AD
• Atrophy progression in untreated ADAtrophy progression in untreated AD– Is inexorableIs inexorable– And correlates with cell loss And correlates with cell loss
• MR-based measures are reliable and sensitive to MR-based measures are reliable and sensitive to change at a clinically meaningful levelchange at a clinically meaningful level
• Rates of cerebral atrophy on MRRates of cerebral atrophy on MR– Are increased in ADAre increased in AD– Predict conversion to AD Predict conversion to AD – Correlate with cognitive declineCorrelate with cognitive decline– Biologically plausible: regional specific atrophy reflects Biologically plausible: regional specific atrophy reflects
pathological and clinical progressionpathological and clinical progression
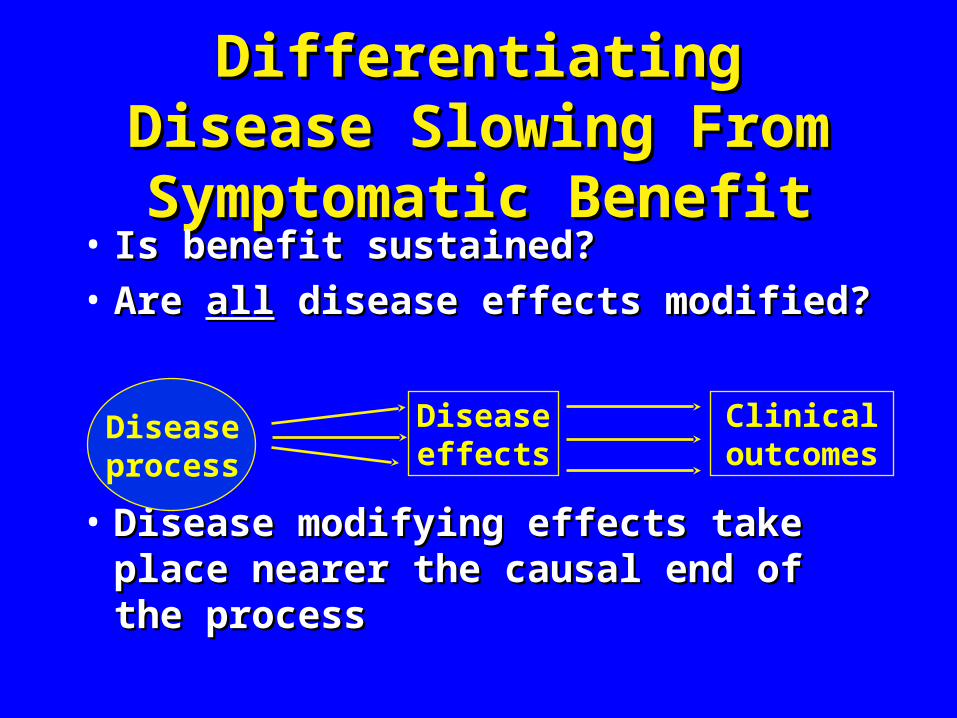
Differentiating Disease Slowing Differentiating Disease Slowing From Symptomatic BenefitFrom Symptomatic Benefit
• Is benefit sustained?Is benefit sustained?
• Are Are allall disease effects modified? disease effects modified?
• Disease modifying effects take place Disease modifying effects take place nearer the causal end of the processnearer the causal end of the process
Diseaseprocess
Diseaseeffects
Clinical outcomes
Dementia Research GroupDementia Research Group
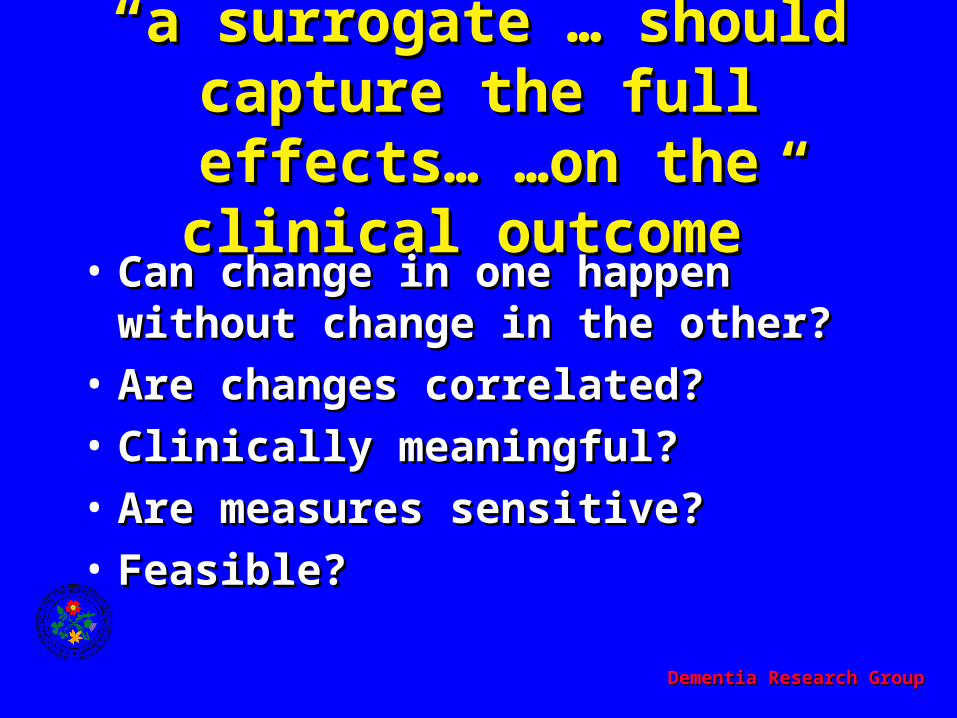
““a surrogate … should capture a surrogate … should capture the full effects… …on the the full effects… …on the
clinical outcome”clinical outcome”• Can change in one happen without Can change in one happen without
change in the other?change in the other?
• Are changes correlated?Are changes correlated?
• Clinically meaningful?Clinically meaningful?
• Are measures sensitive? Are measures sensitive?
• Feasible?Feasible?
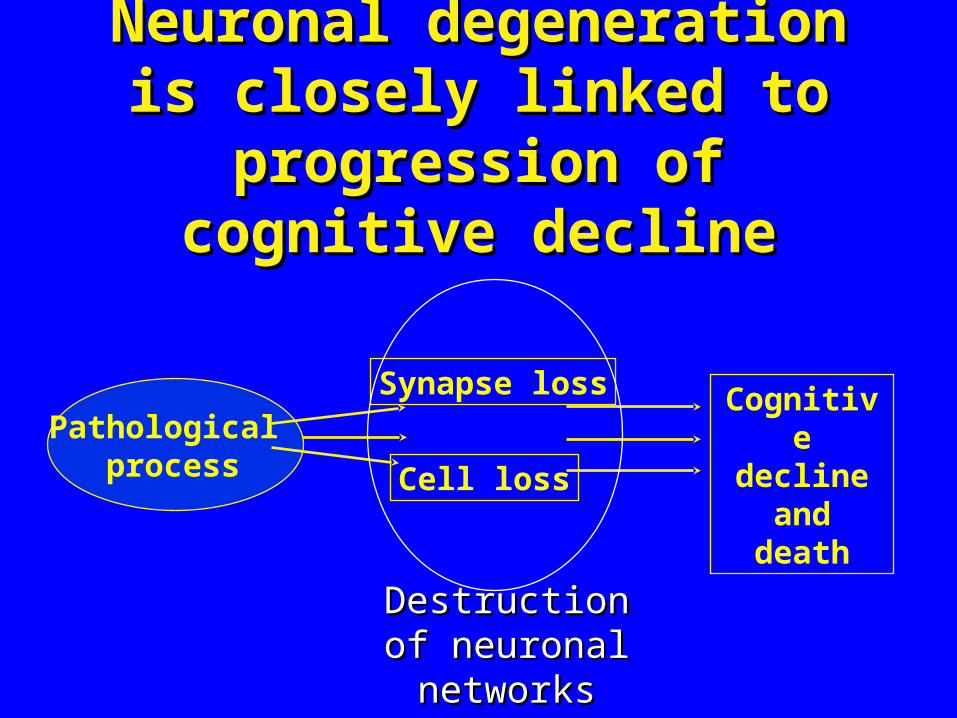
Neuronal degeneration is Neuronal degeneration is closely linked to progression of closely linked to progression of
cognitive declinecognitive decline
Pathological process Cell loss
Cognitive decline
and death
Synapse loss
Destruction of Destruction of neuronal networksneuronal networks
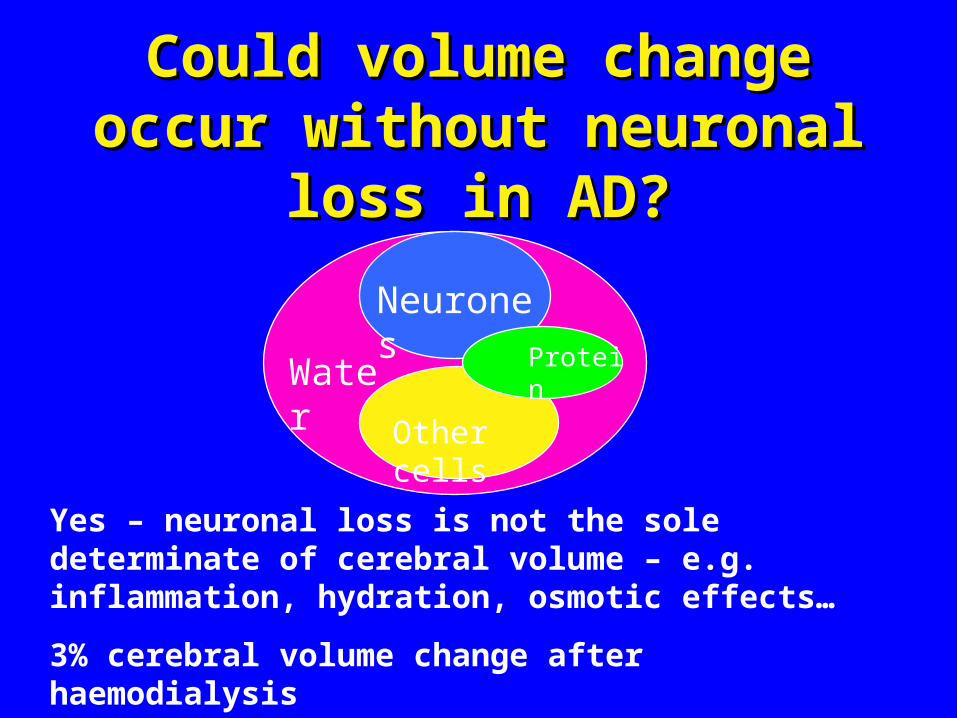
Could volume change occur Could volume change occur without neuronal loss in AD?without neuronal loss in AD?
Neurones
Other cells
Water Protein
Yes – neuronal loss is not the sole determinate of cerebral volume – e.g. inflammation, hydration, osmotic effects…
3% cerebral volume change after haemodialysis
Walters, Fox et al Nephron 2001;87:143-7

Atrophy and progressionAtrophy and progression• Neuronal changes are neither necessary Neuronal changes are neither necessary
nor sufficient to produce volume changesnor sufficient to produce volume changes
• However However progressiveprogressive volume loss is more volume loss is more likely to be related to likely to be related to progressionprogression in in neuronal lossneuronal loss
• >2 imaging time points>2 imaging time points
• Including off treatmentIncluding off treatment80
85%
50 100 150 200
Dementia Research GroupDementia Research Group
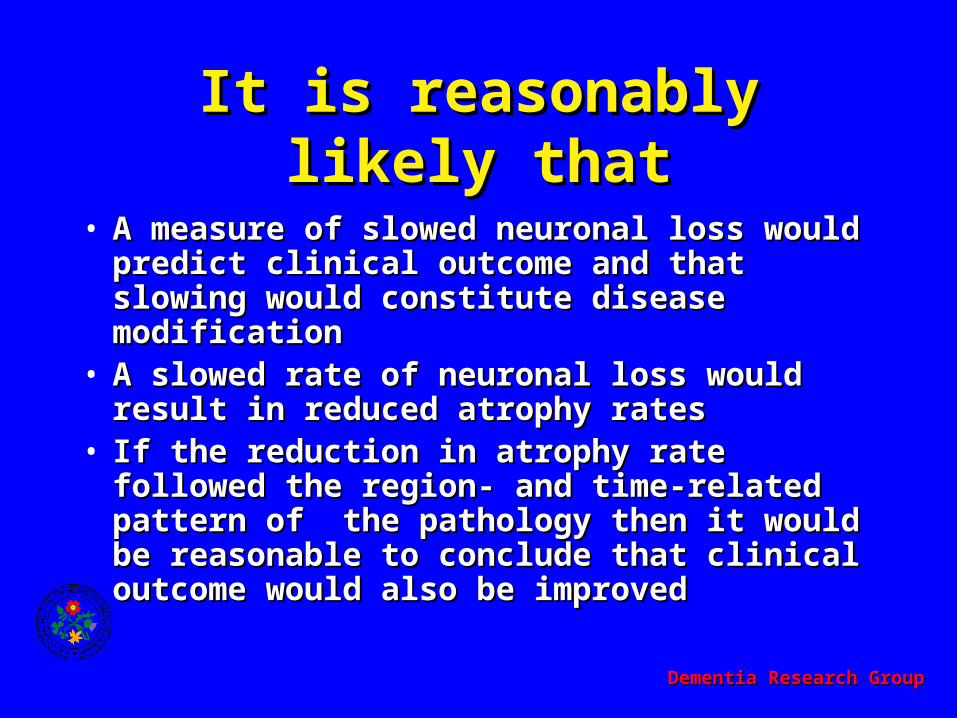
It is reasonably likely thatIt is reasonably likely that
• A measure of slowed neuronal loss would A measure of slowed neuronal loss would predict clinical outcome and that slowing predict clinical outcome and that slowing would constitute disease modificationwould constitute disease modification
• A slowed rate of neuronal loss would result in A slowed rate of neuronal loss would result in reduced atrophy ratesreduced atrophy rates
• If the reduction in atrophy rate followed the If the reduction in atrophy rate followed the region- and time-related pattern of the region- and time-related pattern of the pathology then it would be reasonable to pathology then it would be reasonable to conclude that clinical outcome would also be conclude that clinical outcome would also be improvedimproved

Dementia Research GroupDementia Research Group
SummarySummary• Atrophy rates correlate with and predict Atrophy rates correlate with and predict
progression in untreated patientsprogression in untreated patients• The causality of the link between The causality of the link between
neurodegeneration and atrophy is plausibleneurodegeneration and atrophy is plausible• It may be reasonable, with appropriate study It may be reasonable, with appropriate study
designs, to suggest changes in rate of atrophy are designs, to suggest changes in rate of atrophy are due to reduced neuronal degeneration and are due to reduced neuronal degeneration and are likely to predict clinical benefit likely to predict clinical benefit
• Inevitably disease modifying drug(s) are required Inevitably disease modifying drug(s) are required to strengthen the link between atrophy rates and to strengthen the link between atrophy rates and disease modificationdisease modification