demanding customers buy invest in souza. prefer armani ... · annual report 2010-11 7 highlights,...
TRANSCRIPT

Demandingcustomers buyHermes. Invest in Souza.Prefer Armani.Admire Swarovski.Swear by Apple. And trust Kajaria.
Kajaria Ceramics Limited | Annual report 2010-11
J-1/B-1 (Extn), Mohan Co-operative Industrial EstateMathura Road, New Delhi-110044
Phone: +91-11-26946409, Fax: +91-11-26946407E-mail: [email protected]
Website: www.kajariaceramics.com

ContentsCorporate identity 4 Financial trend 6 Highlights 2010-11 7 Strategic review by the
management 14 Shareholders’ return 18 Kajaria’s value-chain 20 Management
discussion and analysis 21 Business segment review 26 Financial analysis 31Derisking the organisation 34 5-year financials 36 Value-added statement 37Directors’ report 38 Corporate Governance report 45 Financial section 55Corporate information 90
Forward-looking statementIn this annual report we have disclosed forward-looking information to enable investors to
comprehend our prospects and take informed investment decisions. This report and other
statements that we periodically make contain forward-looking statements that set out anticipated
results based on the management’s plans and assumptions. We have tried wherever possible to
identify such statements by using words such as ‘anticipates’, ‘estimates’, ‘expects’, ‘projects’,
‘intends’, ‘plans’, ‘believes’, and words of similar substance in connection with any discussion of
future performance.
We cannot guarantee that these forward-looking statements will be realised, although we believe
we have been prudent in our assumptions. The achievement of results is subject to risks,
uncertainties and estimates taken as assumptions. Should known or unknown risks or uncertainties
materialise, or should underlying assumptions prove inaccurate, actual results could vary materially
from those anticipated, estimated or projected. Readers should bear this in mind.

At Kajaria Ceramics, our business model isconcised in three lines.Understand aspiration.Induce ownership.Accelerate returns.The year 2010-11 was proof.
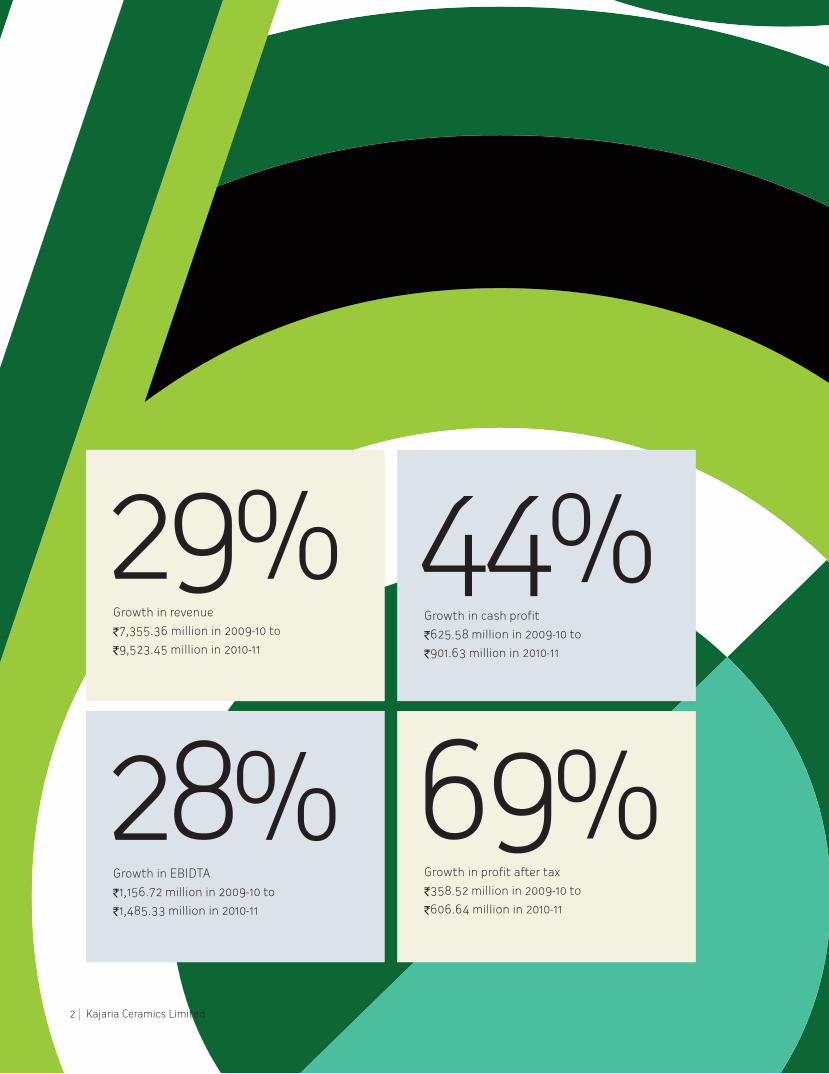
28%Growth in EBIDTA
`1,156.72 million in 2009-10 to
`1,485.33 million in 2010-11
29%Growth in revenue
`7,355.36 million in 2009-10 to
`9,523.45 million in 2010-11
44%Growth in cash profit
`625.58 million in 2009-10 to
`901.63 million in 2010-11
69%Growth in profit after tax
`358.52 million in 2009-10 to
`606.64 million in 2010-11
2 Kajaria Ceramics Limited

150 bpsGrowth in net margin
600 bpsGrowth in return on capital employed
905 bpsGrowth in return on equity
97 bpsGrowth in cash profit margin
3Annual Report 2010-11

4 Kajaria Ceramics Limited
India. Potentially, thethird largest ceramictile market in theworld. Kajaria Ceramics.India’s largest tilemanufacturer.
30.60 MSM
Capacity*
March 31, 2011
*Including subsidiary’s capacity
1,782 members
Team size
March 31, 2011

5Annual Report 2010-11
700 dealers
Distribution network
(other than sub-dealers)
March 31, 2011
5,563 million
Market capitalisation
March 31, 2011
Manufacturing units
Plant Ceramic tiles Vitrified tiles Total
Sikandrabad (UP) 3.20 5.00 8.20
Gailpur (Rajasthan) 14.10 6.00 20.10
BackgroundKajaria Ceramics Limited was
promoted by Mr. Ashok Kajaria in
technical collaboration with Todagres,
S.A., Spain and commenced the
manufacturing of ceramic floor tiles at
Sikandrabad (Uttar Pradesh) in 1988.
PresenceThe Company is headquartered in New
Delhi and possesses state-of-the-art
manufacturing facilities at Sikandrabad
(Uttar Pradesh), Gailpur (Rajasthan)
and Morbi (Gujarat). Its equity shares
are listed on the Bombay Stock
Exchange and National Stock Exchange.
GrowthThe Company’s production capacity
has grown 30-fold from 1 MSM in 1988
to 30.60 MSM in 2011. Shareholders’
funds has grown 28-fold from `80.78
million to `2,225.62 million in that
period.
ReachThe Company’s products are marketed
across India through an extensive
distribution network of dealers, sub-
dealers, own showrooms and also
through the project sale to brand-
enhancing names like Ansal, DLF,
EMAAR-MGF, Vodafone, Mantri Group,
Omaxe, Parsvnath, Magarpatta,
Prestige Group and Raheja Developers,
among others.
Product basketThe Company manufactures ceramic
wall and floor tiles, glazed and
polished vitrified tiles; it markets
international tile brands, bathware
and wooden flooring solutions as well.
CertificationsThe Company’s facilities are
ISO 9001:2000, ISO 14001, OHSAS
18001, SA 8000 and ISO 22000-
certified, testifying its process
discipline.

6 Kajaria Ceramics Limited
Financial trend
Turnover (` million)
2006
-07
2007
-08
2008
-09
2009
-10
2010-11
4,368.03
5,289.07 6
,911.99
7,667.54
10,045.71
EBIDTA (` million)20
06-07
2007
-08
2008
-09
2009
-10
2010-11
573
.25
834.35
959.26 1,156.72
1,485.33
Profit after tax (` million)
2006
-07
2007
-08
2008
-09
2009
-10
2010-11
76.74 15
0.23
88.99
358.52
606
.64
Cash profit (` million)
2006
-07
2007
-08
2008
-09
2009
-10
2010-11
293.58 386.36
338.37
625
.58
901.63
Earning per share (`)
2006
-07
2007
-08
2008
-09
2009
-10
2010-11
1.04
2.04
1.21
4.87
8.24
Book value per share (`)
2006
-07
2007
-08
2008
-09
2009
-10
2010-11
19.24 21.05
22.02
25.73
30.25
Interest cover (x)
2006
-07
2007
-08
2008
-09
2009
-10
2010-11
2.30
2.10
1.65
3.08
4.97
Debt-equity ratio (x)
2006
-07
2007
-08
2008
-09
2009
-10
2010-11
2.35
2.18
2.01
1.39
1.26

7Annual Report 2010-11
Highlights, 2010-11
Shop floor Witnessed tiles production
decline from 20.06 MSM in 2009-
10 to 19.30 MSM due to
conversion of a part of the
ceramic tile capacity to vitrified
tiles (2.60 MSM), which
commenced operations on
March 28, 2011
Commissioned the 6 MSM tile
units (polished and glazed
vitrified) at Gailpur
Replaced high-cost propane
with low-cost gas at Gailpur
Market placeRegistered an 18% increase in
sales of tiles from 25.28 MSM in
2009-10 to 29.71 MSM in 2010-11
Introduced five tile sizes and
over 200 tile designs
Introduced digitally-printed
ceramic wall tiles
Board roomCollaborated with ‘VitrA’, a
leading European brand that is
part of the US$2-billion
Eczacibasi Group to market
high-end VitrA bathware
products in India
Created a new business vertical
to market wooden flooring
solutions
Acquired a 51% stake in a floor
tile manufacturing company
(Soriso Ceramic Pvt. Ltd.) in
Gujarat for `56.20 million

8 Kajaria Ceramics Limited

9Annual Report 2010-11
Mr Shah. Ourlongstandingshareholder.Clamours for
profit growth ateach AGM.
Suddenly a bigchange. He
looks at returnson invested
capital instead.
Most shareholders like Mr. Shah have
seen through the facade of business
growth.
‘Business growth is no longer topline
and bottomline addition,’ they insist.
‘It is how much you earn from every
rupee invested in business that is
more important as it reflects on the
strength of the business model.’
The Kajaria Ceramics management is
happy to state that it had cottoned
onto this logic in the recent past.
And evolved its business model: from
a point where profit growth is a
percentage of business growth to a
point where profit growth is a
multiplier of business growth.
Mr. Shah has gone through a
personality transformation: he does
not have questions to ask at the
AGM (partly ascribed to an
information-friendly annual report),
smiles through the event, applauds
after speeches and goes home
happy.
Amen.
Moving towards producing value
added / bigger size tile, generating
higher realisation per square
metre.
Seeded new verticals (wooden
flooring solutions and bathware)
around a trading model that
leveraged its distribution and
brand for a pan-India presence and
translated revenues into
bottomline
Grew revenue 29%, profit after tax
69% and ROE and ROCE climbed
from 20% and 19% in 2009-10 to
29% and 25% in 2010-11
respectively
profitability

10 Kajaria Ceramics Limited
premiumGuptaji.
Committedgrocery-haggler.
But when hewent to buy
tiles, he turnedup his nose andsaid, ‘Show me
somethingexpensive.’
India is perhaps the most cost-price
allergic market in the world.
Consumers jettison longstanding
loyalties over nominal price
variations.
In this challenging environment, the
corporate strategist has the cushiest
job. Every year, his brief to the core
team is: make average products,
reduce prices, eat market share.
At Kajaria Ceramics, we escaped this
trap long ago. We said that a new
consumer has emerged. He wants
the best. He wants something
different. He is willing to pay well.
The whisper has travelled. More
buyers are turning up at Kajaria
stores saying ‘Give us a house we
can be proud of’ or ‘Give us flooring
that stamps the character of our
home.’
The old marketing spreadsheets
have long been fed to the paper
shredder.
Launched digitally printed tiles
replicating the natural stone look
for discerning customers
Started producing high-end
polished and glazed vitrified tiles
in Gailpur
Entered the high-end bathware
segment to reinforce our relevance
as a complete bathroom solutions
provider
Penetrated the wooden flooring
segment to provide high-value
solutions
11Annual Report 2010-11

12 Kajaria Ceramics Limited

13
availabilityMissus Bhalla
shrieked‘Ohmigod’
when she saw atile at a
Ludhiana store.Luckily, they
had smellingsalts at hand.
Many Indians who holidayed abroad
in 2010 returned with lighter pockets.
Sadly – it’s true – they ordered tiles
to be delivered home.
Quite like delivering liquid fuel to
Dammam or coals to Newcastle...
you get it, don’t you?
Because some of the best tiles in the
world are available right here in
India.
Means that the best international
standards that people see in Milan or
Madrid or Montreal are actually
available right here in India at Kajaria
outlets.
Simply so that discerning jet-setters
like Ms Bhalla don’t need to order
tiles from abroad and realise that
the same products are available just
a stone’s throw away from their
residence.
Possesses the largest chain of
imported tile showrooms in India –
‘Kajaria World’.
Marketed latest tile varieties
imported from globally recognised
brands namely Saloni, Grespania,
Argenta and Baldocer through its
Kajaria World outlets, where style,
quality and service are the DNA
Sourced high-end glazed vitrified
tiles from globally-respected
Chinese brands
Annual Report 2010-11
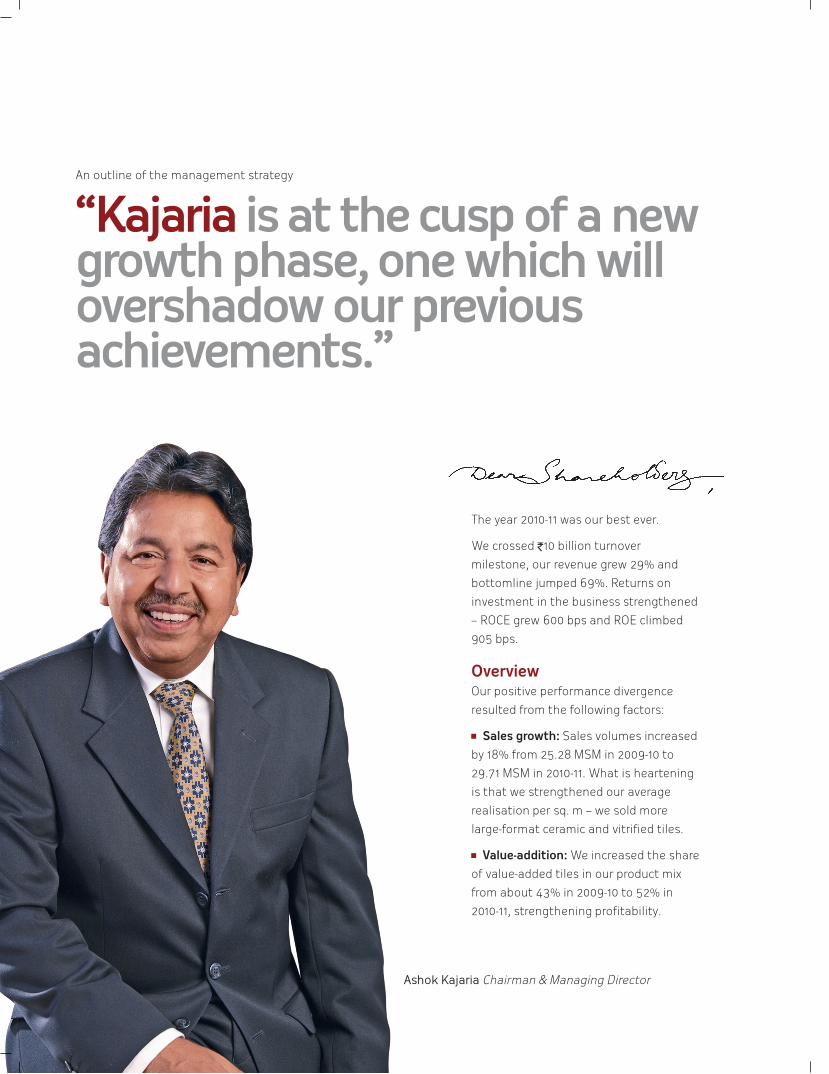
An outline of the management strategy
“Kajaria is at the cusp of a newgrowth phase, one which willovershadow our previousachievements.”
The year 2010-11 was our best ever.
We crossed `10 billion turnover
milestone, our revenue grew 29% and
bottomline jumped 69%. Returns on
investment in the business strengthened
– ROCE grew 600 bps and ROE climbed
905 bps.
OverviewOur positive performance divergence
resulted from the following factors:
Sales growth: Sales volumes increased
by 18% from 25.28 MSM in 2009-10 to
29.71 MSM in 2010-11. What is heartening
is that we strengthened our average
realisation per sq. m – we sold more
large-format ceramic and vitrified tiles.
Value-addition: We increased the share
of value-added tiles in our product mix
from about 43% in 2009-10 to 52% in
2010-11, strengthening profitability.
Ashok Kajaria Chairman & Managing Director

15Annual Report 2010-11
Cost edge: We received gas for our
Gailpur unit (major share of our
production capacity) from May 2010
replacing high-cost propane,
significantly reducing energy costs.
Operational excellence: We
operated our facilities at peak
capacity; our R&D and operation
teams strengthened material
management and production
processes to counter inflation and
increase first quality tile output.
Stronger financials: We ploughed
our cash flow into capital-intensive
growth initiatives (capacity
expansion and creation) – our total
capex in 2010-11 stood at about
`1,564.42 million, the net addition to
external debt was only `million – reducing our debt-equity
ratio. Besides, we negotiated for
better coupon rates, which reduced
interest liability in 2010-11 by 20%
even as general interest rates
climbed.
Next level Rather than merely address the
requirements of the moment, we
created the building blocks of our
future in 2010-11.
Capacity expansion: We increased
value-added capacity. We
commissioned our 6 MSM brownfield
expansion in March 2011 at Gailpur to
manufacture high-end vitrified tiles
(glazed and polished). Our additional
2.60 MSM vitrified capacity
(conversion from ceramic tiles) at
Sikandrabad also commenced
operations in March 2011. The result
is that in 14 months (February 2010
to March 2011), we added 11 MSM of
vitrified tile capacity, the largest by
any single company in India, which
will emerge as the game changer for
important reasons: selling vitrified
tiles through import impacted our
ability to cater to the market in
North India due to the logistics cost.
The manufacturing facilities will
strengthen our competitive
advantage to carve a sizeable
market share in this segment and
our shift from trading to
manufacture is expected to improve
operating margins from this business
segment.
Capacity acquisition: We acquired a
51% stake in Soriso Ceramic Pvt Ltd,
having a 2.30 MSM per annum
ceramic floor tile manufacturing
facility in Gujarat in February 2011 for
an investment of `56.20 million -- a
first in our history. This is important
for Kajaria for two reasons. Firstly,
this extended our geographical
presence with manufacturing
facilities in the North and West,
allowing us to effectively cater to
large tile consuming markets and
secondly, the unit manufactures
large format tiles, which is a fast
growing segment in ceramic tile
flooring.
A benchmark ofbenchmarks Kajaria is the only Indianceramic tile companyawarded ‘Superbrand’status for the fifthconsecutive time.

New business verticals: We initiated
new businesses – bathware and
wooden flooring – to leverage our
distribution and brand competencies.
We tied up with a leading
European brand ‘VitrA’, a brand of
Eczacibasi – one of the largest
industrial groups in Turkey – for the
marketing and sales of the
innovative product line of VitrA
products as an exclusive and sole
marketer and distributor for India.
This trading venture will enable us to
emerge as a complete bathroom
solution provider. To start with, we
opened two exclusive showrooms
showcasing the entire product range.
Wooden flooring, a high
perception-value flooring solution
has emerged as an important
lifestyle product. Its demand is
increasing rapidly driven by high
aspirations of the modern
apartment-purchasing community
(28-32 years) – the customer buying
tiles are likely to buy wooden
flooring. Hence, this business vertical
was a perfect fit in our business
model. We expect to grow this
vertical into a meaningful business
over the medium term.
New products: We developed digital
wall tiles in two sizes (30x60 cm and
15x45 cm). These products are
increasingly gaining acceptance in
the Indian market. We have
developed more than 50 unique
designs through our newly
commissioned digital printing
machine – we expect these tiles to
gain market acceptance, driving
volumes and revenue.
Branding: We expect to strengthen
our recall -- ‘Think tiles. Think Kajaria!’
– by reaching products wide and
deep, investing in print and
electronic media promotions and
earmarking a sizeable amount for
brand strengthening initiatives in
2011-12.
Kajaria – accelerated growth
March 2009 March 2010 March 2011
Ceramic tiles (MSM) 21.00 21.00 19.60
Vitrified tiles (MSM) - 2.40 11.00
Total 21.00 23.40 30.60
Chetan Kajaria Joint Managing Director

Optimism over the mediumterm The Indian tile segment is expected
to grow significantly over the coming
years. This optimism is based on
credible estimates and sectoral
realities. India’s per capita ceramic
tile consumption at 0.42 sq m is the
lowest globally while China stands at
2.26 sq m. The replacement market
is also much lower than in China,
providing tremendous growth
opportunity. This upward revision is
based on an important fact. India is
likely to remain a ‘work-in-progress’
economy in the near future on the
back of massive infrastructure and
housing space creation.
Message to shareholdersWe are on the threshold of the
second growth phase, one that we
expect will surpass our previous
achievements. The challenges are
sizeable – producing quality products
and tapping the deepest demand
pockets. The anticipated returns are
expected to be satisfying. We expect
business growth between 25% to
30% in 2011-12 with a higher growth
in profitability.
Warm regards,
The management team
Real estate demand composition (mn sq. ft.)
FY 2009 FY 2010 FY 2011 FY 2012
Residential 132 136 142 152
Commercial 47 48 50 54
Retail 19 20 21
Hospitality 14 14 15 16
Source: Crisil
20%
33%
6%
10%
9%
10%
8%4%
Mumbai
Bengaluru Pune
Kolkata Kochi
Hyderabad
NCR Chennai
Total construction of realty space
895 mn sq. ft. in metro cities
according to Eleventh Plan
Source: Crisil, Five-year Plan
Rishi Kajaria Joint Managing Director
18

18 Kajaria Ceramics Limited
Pride in ownershipInvestment opportunities for diverse
risk appetites are galore – equities,
debt, physical assets and the list
continues; the choice in each is
further mind-boggling. So what
induces an individual to stick to
equity, a highly risk-prone asset
category? It is only on two occasions
– either a colossal loss in the
investment forcing him to stick on
with the hope of recovering losses or
the organisation provided sustained
growth to shareholder value in good
times and bad.
Kajaria happens to be in the latter
category of reputed organisations
which strengthened shareholders’
pride in ownership consistently
across decades through tangible and
intangible measures.
Tangible value additionKajaria grew business and profits; it strengthened profitability; it added to its asset base and increased its dividend
payout to shareholders, and, in doing, so increased shareholders’ wealth, reflected in growing market capitalisation.
Business growth: Over three decades, the Company introduced pioneering solutions and emerged as the first-mover in
most of its products, growing its topline faster than peers in its sector. In some business segments, it continues to enjoy
undisputed leadership while in others, it strengthened competitive advantage by creating huge barriers.
2008-09 2009-10 2010-11
Revenue (` million) 6,648.83 7,355.36 9,523.45
EBIDTA (` million) 959.26 1,156.72 1,485.33
Profit after tax (` million) 88.99 358.52 606.64
Improving profitability: Over the years, the Company grew business capacities through multi-locational facilities with
dual benefits – economies of scale and proximity with the users. More importantly, the Company’s competitive
advantage lies in the application of the right technology for cost-effective operations which maintained business
profitability despite low cost variants from competition.
2008-09 2009-10 2010-11
Return on networth (%) 5.62 20.40 29.45
Return on capital employed (%) 14.50 18.94 24.94

19Annual Report 2010-11
Strengthening shareholder funds: Over the years, the Company maintained a prudent ratio between the need to reward
shareholders for their faith in the management and its own investment need to capitalise on emerging business
opportunities. On one hand, the Company increased the plough-back of operational surplus year-on-year to strengthen
the financial statements while on the other, it sustained the dividend payout.
2008-09 2009-10 2010-11
Shareholders’ fund (` million) 1,620.68 1,893.40 2,225.63
Dividend per share (`) 0.20 1.00 2.00
Gross block (` million) 5,014.92 5,435.46 6,999.88
Business stability: The intelligently devised business model, the growth in business size and profitability was reflected
in the significant growth in market capitalisation and enterprise value. This derisked the business from any takeover bids
and facilitated the Company in seamlessly implementing its strategic initiatives for growing shareholder value.
Intangible value additionThe Company strengthened its brand
recall and maintained highly ethical
business standards to ensure and
strengthen shareholder confidence
in the management’s ability to
sustain business growth over the
long term.
Top-of-mind: Over the years, the
Company undertook a plethora of
brand-strengthening initiatives in
addition to addressing critical issues
through innovative business
solutions which strengthened brand
recall on a pan-India basis – growing
shareholder pride in association with
the brand.
Awards and recognition: The
Company’s awards and recognitions
bear testimony to the organisation’s
stability and external confidence in
its management – Kajaria is the only
Indian ceramic tile company awarded
‘Superbrand’ status for a fifth
consecutive time.
Ethical practices: The Company is
recognised for its high ethical
practices, reflected in an important
reality. It has never been involved in
any litigation regarding governance
issues in its entire history, which
exudes confidence in the Company’s
management team.
2008-09 2009-10 2010-11
Market capitalisation (` million) 2,020 4,529 5,563
Enterprise Value (` million) 5,193 7,112 8,330

20 Kajaria Ceramics Limited
Kajaria’s value-chain
The size of the Indian tile industry was estimated at `120 billion with a capacity of 494MSM as on March 31, 2010. Kajaria is placed in various categories through the productsgiven in the pyramid below:
Importing from Europe and China
Commissioned a manufacturing
facility in Gailpur in March 2011
(annual capacity of 3 MSM)
Domestic: 8 MSM
Domestic: 130 MSM
Imports: 15 MSM
Importing from China
Commissioned a manufacturing
facility in Sikandrabad (UP) in
February 2010 and in Gailpur in
March 2011 to cater to high-
end segment (aggregate
capacity of 8 MSM per
annum)
Manufacturing facility in
Sikandrabad (Uttar
Pradesh), Gailpur
(Rajasthan) and Morbi
(Gujarat) for upper end
segment (aggregate
capacity 19.60
MSM per
annum)
Imports: 7 MSM
Domestic: 320 MSM
Imports: 14 MSM
Polished vitrified tiles
(145 MSM/ `47 billion)
Ceramic glazed tiles(334 MSM/ `64 billion)
Glazedvitrified tiles
(15 MSM/` 9 billion)
21Annual Report 2010-11
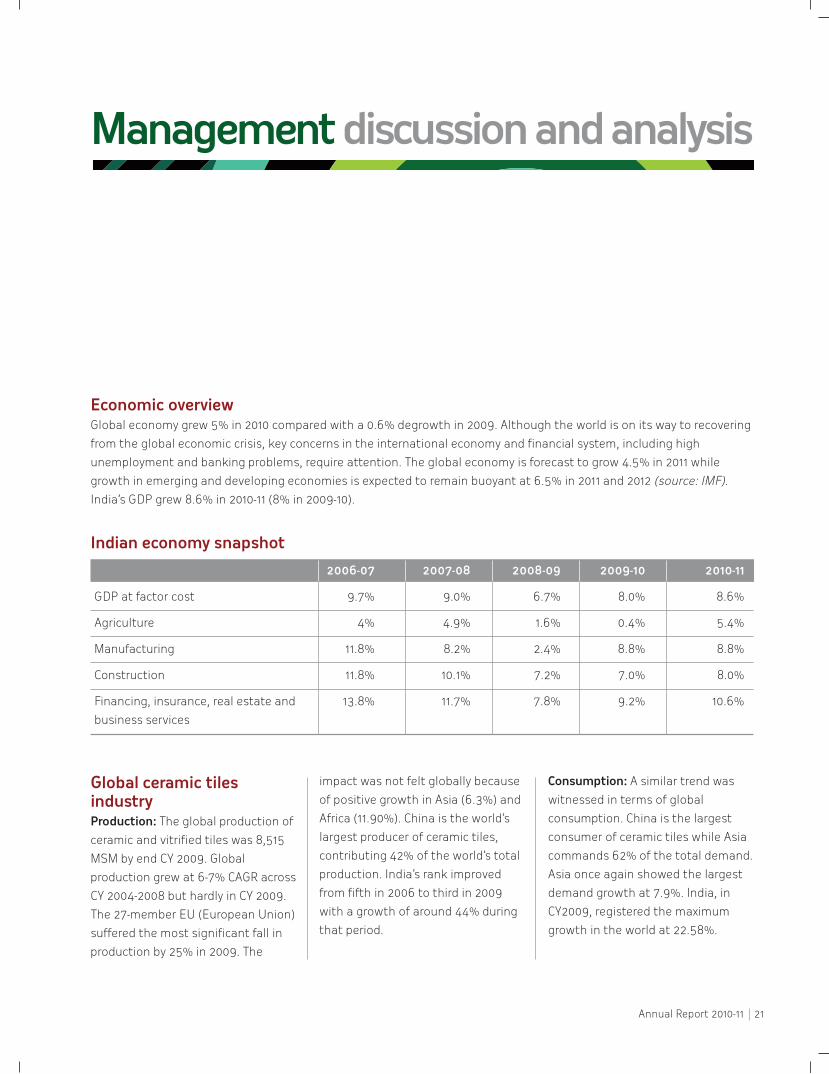
Economic overviewGlobal economy grew 5% in 2010 compared with a 0.6% degrowth in 2009. Although the world is on its way to recovering
from the global economic crisis, key concerns in the international economy and financial system, including high
unemployment and banking problems, require attention. The global economy is forecast to grow 4.5% in 2011 while
growth in emerging and developing economies is expected to remain buoyant at 6.5% in 2011 and 2012 (source: IMF).
India’s GDP grew 8.6% in 2010-11 (8% in 2009-10).
Global ceramic tilesindustryProduction: The global production of
ceramic and vitrified tiles was 8,515
MSM by end CY 2009. Global
production grew at 6-7% CAGR across
CY 2004-2008 but hardly in CY 2009.
The 27-member EU (European Union)
suffered the most significant fall in
production by 25% in 2009. The
impact was not felt globally because
of positive growth in Asia (6.3%) and
Africa (11.90%). China is the world’s
largest producer of ceramic tiles,
contributing 42% of the world’s total
production. India’s rank improved
from fifth in 2006 to third in 2009
with a growth of around 44% during
that period.
Consumption: A similar trend was
witnessed in terms of global
consumption. China is the largest
consumer of ceramic tiles while Asia
commands 62% of the total demand.
Asia once again showed the largest
demand growth at 7.9%. India, in
CY2009, registered the maximum
growth in the world at 22.58%.
Indian economy snapshot
2006-07 2007-08 2008-09 2009-10 2010-11
GDP at factor cost 9.7% 9.0% 6.7% 8.0% 8.6%
Agriculture 4% 4.9% 1.6% 0.4% 5.4%
Manufacturing 11.8% 8.2% 2.4% 8.8% 8.8%
Construction 11.8% 10.1% 7.2% 7.0% 8.0%
Financing, insurance, real estate and 13.8% 11.7% 7.8% 9.2% 10.6%
business services
Management discussion and analysis

22 Kajaria Ceramics Limited
Indian ceramic tilesindustryThe Indian ceramic tiles industry is
the world’s third largest producer as
well as consumer after China and
Brazil. The industry grew 15%
annually over the last few years
(outpacing global average growth of
6% per annum) owing to the
emergence of tiles as a durable,
cost-effective and convenient
flooring solution over natural stone.
Increasing disposable incomes,
affordability, urbanisation, brand
aspiration and home aesthetics also
catalysed the demand for high-end
variants. The 494-MSM domestic
ceramic tile industry was estimated
at around `120 billion as on March 31,
2010.
The Indian ceramic industry is equally
divided into the branded and
unbranded segments. The
unbranded segment comprises small
players concentrated in Gujarat.
Kajaria Ceramics is the largest player
in the Indian space in terms of
installed capacity.
The branded segment is gaining
market share owing to rapid capacity
World tiles production (MSM)
CY’ 06 CY’ 07 CY’ 08 CY’ 09 Share (%)
China 3,000 3,200 3,400 3,600 42.28
Brazil 594 637 713 715 8.40
India 340 385 390 490 5.75
Italy 569 559 513 368 4.32
Iran 210 250 320 350 4.11
Spain 608 585 495 324 3.81
Vietnam 199 254 270 295 3.46
Indonesia 170 235 275 278 3.27
Turkey 265 260 225 205 2.41
Egypt 122 140 160 200 2.35
Total 7,760 8,252 8,520 8,515
World tiles consumption (MSM)
CY’ 06 CY’ 07 CY’ 08 CY’ 09 Share (%)
China 2,450 2,700 2,830 3,030 35.81
Brazil 484 535 605 645 7.62
India 350 397 403 494 5.84
Indonesia 148 178 262 297 3.51
Iran 182 236 265 295 3.49
Vietnam 145 210 220 240 2.84
Egypt 103 105 140 180 2.13
USA 308 249 197 169 2.00
Spain 319 314 240 156 1.84
Italy 199 199 176 146 1.73
Total 7,450 8,060 8,350 8,460
23Annual Report 2010-11
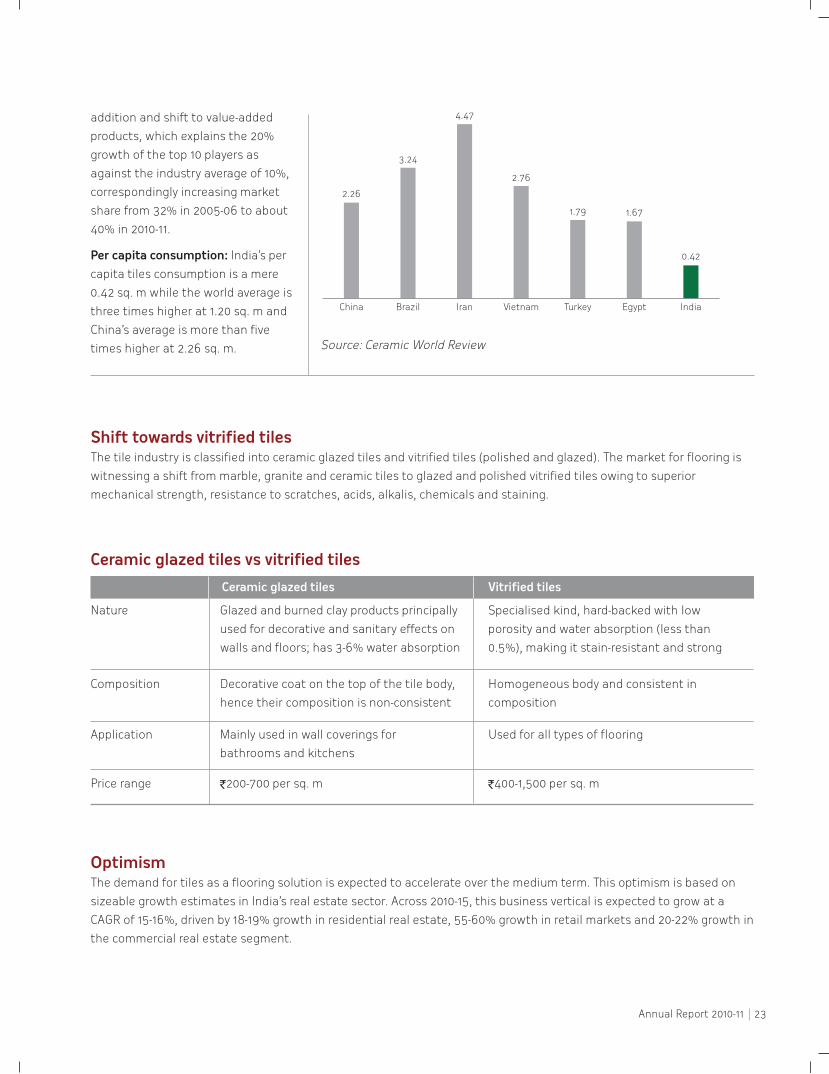
addition and shift to value-added
products, which explains the 20%
growth of the top 10 players as
against the industry average of 10%,
correspondingly increasing market
share from 32% in 2005-06 to about
40% in 2010-11.
Per capita consumption: India’s per
capita tiles consumption is a mere
0.42 sq. m while the world average is
three times higher at 1.20 sq. m and
China’s average is more than five
times higher at 2.26 sq. m. Source: Ceramic World Review
Shift towards vitrified tilesThe tile industry is classified into ceramic glazed tiles and vitrified tiles (polished and glazed). The market for flooring is
witnessing a shift from marble, granite and ceramic tiles to glazed and polished vitrified tiles owing to superior
mechanical strength, resistance to scratches, acids, alkalis, chemicals and staining.
Optimism The demand for tiles as a flooring solution is expected to accelerate over the medium term. This optimism is based on
sizeable growth estimates in India’s real estate sector. Across 2010-15, this business vertical is expected to grow at a
CAGR of 15-16%, driven by 18-19% growth in residential real estate, 55-60% growth in retail markets and 20-22% growth in
the commercial real estate segment.
Ceramic glazed tiles vs vitrified tiles
Ceramic glazed tiles Vitrified tiles
Nature Glazed and burned clay products principally
used for decorative and sanitary effects on
walls and floors; has 3-6% water absorption
Specialised kind, hard-backed with low
porosity and water absorption (less than
0.5%), making it stain-resistant and strong
Composition Decorative coat on the top of the tile body,
hence their composition is non-consistent
Homogeneous body and consistent in
composition
Application Mainly used in wall coverings for
bathrooms and kitchens
Used for all types of flooring
Price range `200-700 per sq. m `400-1,500 per sq. m
China
2.26
3.24
4.47
2.76
1.79 1.67
0.42
Brazil Iran Vietnam Turkey Egypt India

24 Kajaria Ceramics Limited
Source: Ceramic World Review
A. Retail demand The retail segment is a significantly
growing segment and is particularly
important for Kajaria as over 70% of
its tiles are distributed in this
segment (against the industry
average of about 50%), providing
superior returns. The growth in this
segment is expected to continue due
to the following reasons:
Burgeoning middle-class: India’s
middle-class is expected to account
for 85% of urban households and
70% of consumption by 2015; the
upper-class will account for 7% of
households and 28% of
consumption.
Rising population: India’s urban
population is expected to increase by
100 million over 10 years or 10 million
annually – the size of London each
year – creating a huge annual
demand for houses and flooring
solutions (Source: Morgan Stanley).
Disposable income: Improved
corporate performance and
favourable government policies
catalysed per capita incomes from
`35,430 in 2007-08 to `54,527 in
2010-11, influencing consumerist
spending. Discretionary spending in
lifestyle and premium products is
expected to increase to around 70% of
annual household expenses by 2025.
Demographics: Among BRIC, India is
projected to stay the youngest with
its working-age population estimated
to grow to 70% of its total population
by 2030 – the largest such quantum
in the world. India expects to attract
70 million new workers in five years,
expected to catalyse consumerism.
Retail consumption: The concept of
tile usage in India transformed from
convenience to fashion and lifestyle.
Tiles are increasingly emerging as
style statements and are fast
replacing carpets – growing the
demand for niche, high-end tiles
from the branded sector.
Replacement market: Growing
earnings in rural and semi-urban
markets due to government policies
(MGNREGS and higher price fixation
for agri-commodities) have fuelled
aspirations, manifested in improved
flooring solutions.
Brands in demand India ranks third on the listof brand-consciouscountries (Source: AC Nielsen)
Sources: Economist Intelligence Unit; Brazilian Institute of Geography and Statistics (IBGE);Instituto Nacional de Estadistica y Geograffa (INEGI); BCG China population and income forecastdatabase, 2010; “The Great Indian Middle Class,” National Council of Applied Economic Research(NCAER), 2004; BCG analysis.1Middle-class households are those with annual income exceeding US$5,0002Middle-class households are those with annual income exceeding US$10,000
The middle-class population of emerging-market cities is burgeoning
Approximately 170 people join the middle class every minutes
Middle-class and above-middle-class population (million)
Middle-classpopulation increase,2010-2015 (millions)
400
172
China1 India1 Russia2 Brazil2 Turkey2 Mexico2 SouthAfrica2
Indonesia1
142 180 32 21 15 9 454
314
186
366
91123
48 4869
44 5934 43
17 22
103
300
200
100
0
Approximately 460 million people in emerging-market cities will enterthe middle class between 2010 and 2015, an increase of 70%2010 2015

25Annual Report 2010-11
B. Institutional segment With the organised sector playing a
dominant role in realty creation, the
realty sector is becoming increasingly
significant for the Indian tile
industry. Going ahead, Kajaria is
working to leverage long-standing
business relations with branded
players (providing larger volumes and
superior designs) for carving a larger
share of the market.
Urbanisation: India is still in the early
stages of urbanisation, which
accounts for around 30% of its total
population. This urbanisation will
accelerate as about 91 million
households are expected to turn
middle-class (22 million today) by
2030.
Commercial real space: The Indian
commercial space is expected to
grow 20-22% over five years (Source:
Cushman & Wakefield report).
Sectors including IT/ITeS, BPO,
banking and financial services,
pharmaceutical and telecom are
expected to drive this demand,
especially in large Indian cities. The
IT/ITeS sector alone is expected to
require in excess of 250 mn sq. ft of
commercial space by 2012-13
(Source: Emkay research report).
Organised retail: The market share
of organised retail is expected to
grow from 5% to 15% by 2016
(Source: Cushman & Wakefield
report), covering 323 mn sq. ft by
2012 across 400 new malls
(Source: Fortune research).
Hospitality sector: As India emerges
as a preferred tourist destination, the
number of branded hotel rooms is
expected to double in three years.
The demand for travel and tourism in
India is expected to grow 8.2%
between 2010 and 2019, making India
the third fastest growing in this
segment. Capital investment in
India’s travel and tourism sector is
expected to grow 8.8% between 2010
and 2019 (Source: IBEF).
Healthcare sector: Over a million
beds need to be added to reach a
ratio of 1.85 per thousand, still lower
than the international average. At
the same time the industry is looking
to achieve a doctor-patient ratio of
1:1000, for which about six lakh
doctors and ten lakh nurses are
required. To support this growth, the
industry is looking at massive
capacity expansion.
Airport modernisation: As per the
Federation of Indian Airlines, the
government plans to upgrade,
redevelop and modernise around 80
Indian airports under the Airport
Development Program for `300
billion. Seven greenfield airport
projects in Tier II and Tier III cities are
planned for an indicative `100 billion
(Source: Emkay research report).
Source: McKinsey
Source: CRISIL Research
Urban demand Rural housing shortage isexpected to decline to 53.8million units by 2013-14from 59.4 million units atthe end of 2008.Interestingly, rural housingshortage is expected toreport a decline even asurban housing shortagerises owing to migrationand the incidence ofnuclear families. Urbanhousing shortage is likelyto touch 21.7 million unitsby end 2014.
1991
856
220
2001
1,040
290
2008
1,155
340
2030
1,470
26 28 30 40
590
+250
Total populationMillion
Urbanisation rate%
Housing shortage in India
40
35
30
25
Mill
ion
uni
ts
20
15
10
5
02001
15.1
34
18.4
30.1
19.3
26.7
20.5
26
21.719.7
2008 2010 20142005
Urban Rural

26 Kajaria Ceramics Limited
Business segment
Ceramic wall and floor tiles
7 wall tiles
3 floor tiles`200 - 700 Own manufacturing and
outsourced
1Sizes
545
Designs Price range per sq m Sourcing
OverviewThe Company manufactures wall and
floor tiles in diverse sizes, designs
and finishes to cater to all segments
of customers. The Company also
provides decorative additions like
highlighters and borders along with
matching floors leading to
comprehensive bathroom solutions.
The Company’s products are
marketed through a robust
distribution network of dealers and
sub-dealers and Kajaria Prima
showrooms present in every major
town of the country.
At Kajaria, wall tiles are
manufactured at its Gailpur facility
(capacity 14.10 MSM) in six different
sizes (20x20 cm, 25x40 cm, 30x20
cm, 30x45 cm, 30x 60 cm and 15x60
cm). Floor tiles are manufactured at
the Sikandrabad facility (capacity 3.2
MSM) in the 30x 30 cm size and at its
recently acquired Morbi unit (capacity
2.30 MSM) in the 60x60 cm size.
Some wall (45x90 cm) and floor tiles
(39.5 x 39.5 cm) are outsourced.
Achievements, 2010-11Improved mix of large format,
value-added tiles from 48% in 2009-10
to 53%
Received natural gas from GAIL for
the Gailpur plant, replacing high-cost
propane and resulting in significant
fuel costs
Streamlined operational processes
and introduced new check points
across the process lines, which
reduced fuel consumption and
resource wastage
Introduced state-of-the-art digital
printing technology, which allows
high definition design imprints on
any tile surfaces without shade
variations
Received the ISO 22000 for Food
Safety Management System, the first
in the Indian tile sector to receive
this accredition
Road aheadKajaria developed unique designs in
digitally printed tiles in multiple sizes
for exterior wall cladding and interior
applications. Going ahead, the
Company will continue to develop
new sizes and designs in value-
added, large-format tiles in line with
customer aspirations.
The R&D teamdevelopedunique designsin 15x45 cmdigitally printedtiles which canalso be used forexterior wallcladding,launched inApril 2011

27Annual Report 2010-11
Business segment
Polished vitrified tiles
3 `400 - 1,200 Outsourced and
own manufacturing
2Sizes
50
Designs Price range per sq m Sourcing
March 31, 2011
OverviewPolished vitrified tiles are considered
‘next generation flooring’ marked by
a polished surface, high gloss,
extraordinary quality and durability.
They are designed to withstand
abrasion, chemical and fire
resistance and staining.
Kajaria enjoys a seven-year presence
in this business, marketing imported
variants from China in three different
sizes – 60x60 cm, 80x80 cm, 120x60
cm. The Company commissioned a
2.4 MSM polished vitrified tiles
(60x60 cm) facility at its Sikandrabad
unit which commenced operations in
February 2010, its first vitrified tile
manufacturing facility.
During 2010-11, the Company
converted part of ceramic floor tile
capacity into a vitrified tile capacity by
adding balancing equipment and
another 2.60 MSM of capacity, making
the total polished vitrified capacity
5 MSM at Sikandrabad by March 2011.
The Company further added 3 MSM
high-end polished vitrified tile capacity
in Gailpur which commenced
production in March, 2011.
Kajaria launched the Solitare series
comprising technologically-advanced,
large-format tiles (80x80 cm and
120x60 cm), providing Indian
customers an authentic alternative
to natural/Italian marble. These
products are manufactured by super-
white, translucent and expensive
colour bodies fused with integrative
feeding of die and pressing.
The Company markets polished
vitrified tiles through dealer and
‘Kajaria Vitro Studio’ network, a shop-
in-shop concept for select high-
performing dealers providing
dedicated space to showcase
Kajaria’s products, facilitating
customer engagement and offtake.
Achievements, 2010-11Witnessed 80% increase in sales
volume over the 2009-10 level
Expanded reach by establishing a
presence in untapped towns and
districts; established 78 Kajaria Vitro
Studios
Road aheadKajaria will optimise capacity
utilisation of its newly commissioned
capacities at the Gailpur and
Sikandrabad plants. The marketing
team strategised to increase the
proportion of high-end tiles in the
sales volume by expanding
distribution network to establish
presence in every district in India and
introducing new product variants and
contemporary designs by way of own
production and import.
The Companymarketspolishedvitrified tilesthrough dealerand ‘KajariaVitro Studio’network, ashop-in-shopconcept forselect dealers

28 Kajaria Ceramics Limited
Business segment
Glazed vitrified tiles
3 `500 -1,500 Outsourced and
own manufacturing
3Sizes
> 60
Designs Price range per sq m Sourcing
OverviewKajaria was the first company to
introduce glazed vitrified tiles (GVT)
in India in 2007-08 in an organised
manner under the Kajaria Eternity
brand. The Company sourced
products from the two leading GVT
manufacturers in China.
Currently, the Company is the largest
importer of GVT providing the widest
product offering: in terms of sizes
(30x60 cm and 60x60 cm) and
finishes (rustic, matt, satin, wood,
stone, silk and metal, among others)
for wall and floor applications.
The Company commissioned a
3 MSM capacity to produce glazed
vitrified tiles (60x60 cm, 30x60 cm
and 45x90 cm) at its Gailpur unit
which commenced commercial
operations in March 2011.
The products are distributed through
Kajaria Eternity Studios and select
dealers. The Kajaria Eternity Studios
represent a shop-in-shop concept for
select dealers in key cities –
showrooms are upgraded, product
visibility is enhanced and additional
sales promotion schemes are offered
– leading to a win-win situation.
Improved lifestyle consequent to
increasing aspirations and
disposable incomes is driving the
demand for glazed vitrified tiles,
which provide a superior-value
proposition over natural stone.
Achievements, 2010-11Witnessed 75% increase in sales
volume over the 2009-10 level
Introduced a large format tile
(45x90 cm) for the first in India for
high-end residential and commercial
applications
Introduced the polished vitrified
glazed tile (PGVT) finish for
residential applications
Widened the dealer network,
opened 50 Kajaria Eternity Studios
(shop-in-shop floor) to showcase
glazed vitrified tiles
Road aheadThe Company’s manufacturing facility
will minimise import of glazed
vitrified tiles (about 10% of sales
volumes) and yield benefits through a
reduction in product price, consistent
supply of quality material and
customised solutions. Consequently,
the team will grow its market share
(volume and value) and enter
uncharted territories. The Company
plans to introduce digital printing on
glazed vitrified tiles and open more
studios in 2011-12 to strengthen
market share.
The Companycommissioned a 3 MSM capacityto produceglazed vitrifiedtiles at itsGailpur unitwhichcommencedcommercialoperations in March 2011.

29Annual Report 2010-11
Business segment
Retail chain - Kajaria World
12 outlets > 200 `1,000-3,000
4Network Sizes Designs Price range per sq m
Multiple
OverviewKajaria World showcases high-end
imported tiles sourced through its
alliances with European brands
(Saloni, Grespania, Argenta and
Baldocer, among others) through a
network of twelve showrooms across
the country. The brand signifies
international style and appeal and
is popular in India’s architect
fraternity.
This chain offers the widest range of
imported tiles including the large
format tiles collection (45x90 cm and
30x90 cm series) and the stone
collection series (i.e. exterior tile).
Tiles are also available in 30x60 cm
sizes with different finishes like
rustic, matt, satin, wood, metal and
fabric, among others. The price range
varies from `1,000 per sq. m to
`3,000 per sq. m.
The Company imports tiles produced
with the latest digital printing
technology, wherein the design of
each tile is different and following
commissioning, the cladding
resembles natural stone. The
Company possesses the largest
logistic support for imported tiles; its
14 warehouses ensure seamless
product supply across its network.
Achievements, 2010-11Witnessed 40% increase in sales
volume over 2009-10 level
Increased footfalls through regional
showroom promotional activities
Installed a customised design
software which demonstrated to the
customer the concept and design as
it would appear when made
Road aheadThe Company is looking to extend
the Kajaria World network to all Tier I
cities and implement new initiatives
to accelerate retail sales. Kajaria Worldshowcases high-end importedtiles sourcedthrough itsalliances withEuropeanbrands (Saloni,Grespania,Argenta andBaldocer,among others).

30 Kajaria Ceramics Limited
Business segment
Bathware5OverviewKajaria entered the bathware
segment to emerge as a one-stop
solution provider. The business
showcases bathware and wellness
products (bath tubs, Jacuzzi, shower
cubicles).
Kajaria-VitrA tie-upKajaria tied up with VitrA, a leading
European brand, in January 2011 to
market high-end bathware and bath
fittings. VitrA is a part of Eczacibasi,
one of the largest industrial groups
in Turkey, with a turnover of
`100 billion. The arrangement will
position Kajaria as an exclusive and
sole marketer and distributor of the
VitrA range in India. The alliance will
leverage the strong brand and
distribution network of Kajaria.
Kajaria and VitrA inaugurated the
first showroom (3,000-sq. ft.) of VitrA
products showroom in Gurgaon. VitrA
products will also be showcased in all
Kajaria World showrooms across
India.
Achievements, 2010-11Contributed `60 million to the
Company’s topline, within three
months of business initiation
Recruited a marketing team
dedicated to this product line
Road aheadThe real returns from the tie-up are
expected in 2011-12 after the
Company opens 10 VitrA-Kajaria
showrooms and appoints 30
exclusive dealers across India.
Business segment
Wooden flooring6OverviewKajaria entered the wooden flooring
space as a trading initiative in
November 2010, representing a neat
fit with its existing businesses for the
following reasons:
Western culture is being replicated
across Indian households faster than
before
The average age of the urban
house purchaser is declining (from
about 37-39 years to about 28-30
years) with a corresponding increase
in their receptivity to lifestyle
products
The target buyer group
(builder/architect in urban locations)
is largely the same as ceramic and
vitrified tiles.
The new product helps fill dealer
shelf-space, enhancing opportunity
and returns.
The Company procures the product
from quality-respecting Chinese
suppliers and markets it under the
Kajaria Wood brand, supported by
regional marketing teams and
incentivised dealer offtake.
Road aheadThe Company is strengthening pan-
India product visibility through
focused marketing, new product
variants and distribution network
addition and also exploring the
possibility of importing value added
products from reputed European
companies.

31Annual Report 2010-11
Financial analysis
Kajaria registered another year of improved performance where the profit growth was significantly larger
than business growth, strengthening shareholder value.
29% growth
Revenue28%
growth
EBIDTA69%
growth
PAT
A. Profit and loss account Revenue (net sales)
Grew 29.48% from `7,355.36 million
to `9,523.45 million driven by volume
growth (25.28 million to 29.71
million) and change in product mix
towards value added tiles. Besides,
an increased focus on domestic
markets strengthened realisations.
Cost analysis
Increased scale and spiralling input
cost increased absolute operational
expenses from `2009-10 to `8,009.63 million in 2010-
11. Operating cost, as a percentage of
total income, increased marginally
from 84.30% in 2009-10 to 84.36%
in 2010-11.
Power and fuel: The Company’s
Gailpur unit received the natural gas
connection in May 2010, reducing
power and fuel cost significantly.
Now all the plants operate on
low-cost natural gas resulting in
significant savings in per square
meter cost of production.
Employee cost: Increase in the team
size for managing expanded
operations and widened reach
resulted in a 23.70% increase in
employee cost. The increased
expense was more than covered by
the contribution of the team
efficiency – reflected in the following
realities:
Revenue per employee increased
14.10% from `4.68 million in
2009-10 to `5.34 million in 2010-11
EBIDTA per employee increased
12.16% from `0.74 million in
2009-10 to `0.83 million in 2010-11
Margins
EBIDTA grew from `1,156.72 million in
2009-10 to `1,485.33 million in
2010-11. The EBIDTA margin declined
marginally by 13 bps from 15.73% in
2009-10 to 15.60 % in 2010-11. This
was primarily due to a higher
proportion of trading sales in 2010-11
where the margin was lower than
manufacturing operations. Net
margin increased 150 basis points
from 4.87% in 2009-10 to 6.37% in
2010-11 owing to a sizeable decline in
interest costs.
Taxation
The provision for current tax stood
at `285.14 million in 2010-11 against
`155.90 million in 2009-10. The
average tax rate was 31.97%
in 2010-11.
Ploughback
The Company ploughed back `435.59
million into the business in 2010-11
against `272.71 million in 2009-10 – a
59.73% increase. These funds would
be deployed for capital intensive
initiatives and de-leveraging the
Balance Sheet.
6,208.84 million in

32 Kajaria Ceramics Limited
B. Balance sheet Capital employed
Capital employed in the business
increased 11.07% from `4,521.68
million in 2009-10 to `5,022.42
million in 2010-11 to fund organic and
inorganic capacity enhancing
initiatives. The average return on
capital employed climbed 600 bps
from 18.94% as on March 31, 2010 to
24.94% as on March 31, 2011.
Net worth
The Company’s net worth increased
17.55% from `1,893.40 million as on
March 31, 2010 to `2,225.63 million
as on March 31, 2011 owing to
increased reserves. Average return
on net worth stood at 29.45% for
2010-11 against 20.40% for 2009-10.
Net worth, as a percentage of capital
employed, increased marginally from
41.87% as on March 31, 2010 to
44.31% as on March 31, 2011. Book
value per share increased from
`25.73 as on March 31, 2010 to
`30.25 as on March 31 2011.
Equity capital: The equity capital
comprised 7,35,83,580 equity shares
with a face value of `2 each, as on
March 31, 2011. Promoters held
51.33% stake in the Company as on
March 31, 2011; foreign holding stood
at 3.99% as on that date.
Reserves and surplus: Reserves
represented zero-cost funds for
undertaking growth initiatives.
Reserves grew 19.03% from `1,746.23
million as on March 31, 2010 to
`2,078.46 million as on March 31,
2011 owing to reinvestment of
operational surplus in 2010-11.
External debt
The debt portfolio increased
marginally 6.41% from `2,628.28
million as on March 31, 2010 to
`2,796.79 million as on March 31,
2011 despite significant growth in
operation and capacity addition.
The debt equity declined from 1.39
to 1.26.
Interest management: Interest
liability declined 20.43% from
`375.24 million in 2009-10 to `298.56
million in 2010-11 consequent to
superior debt management. The
Company prepaid and repaid debt,
swapped high-cost debt with low-
cost options and negotiated better
for optimised coupon rates. The
average interest rate increased 116
bps from 10.50% in 2009-10 to 11.66%
in 2010-11 despite a seven-time hike
in the prime interest rates by the RBI
in 2010-11. Interestingly, interest cost,
as percentage of net sales, declined
from 5.10% in 2009-10 to 3.14% in
2010-11, reflecting superior returns
from the deployment of every rupee
borrowed. Interest cover
strengthened from 3.08 times in
2009-10 to 4.97 times in 2010-11,
reflecting the Company’s ability to
comfortably service its interest
liability.
Interest liabilitydeclined20.43% from`375.24 millionin 2009-10 to`298.56 millionin 2010-11consequent tosuperior debtmanagement.

33Annual Report 2010-11
Fixed assets
Gross block increased 28.78%
primarily due to creation of vitrified
tile manufacturing capacity. The
Company incurred a capital
expenditure of `1,564.42 million in
2010-11, expected to deliver superior
returns in 2011-12.
Depreciation: The Company
consistently charged depreciation
under the Straight Line Method as
specified in the Companies Act, 1956.
Despite the sizeable capex,
depreciation increased only
marginally from `267.06 million in
2009-10 to `294.99 million in 2010-11
due to the commissioning of the
capacities at the end of the financial
year – depreciation is expected to
increase significantly in 2011-12.
Accumulated depreciation, as a
proportion of the gross block, stood
at 31.56% as on March 31, 2011 which
represented newness of its assets.
Investments
The Company’s investment increased
during the year by `56.20 million as
on March 31, 2011 due to the
acquisition of a 51% stake in Soriso
Ceramic Private Limited.
Working capital
Working capital (net current assets)
declined significantly from `1,562.94
million as on March 31, 2010 to
`743.17 million as on March 31, 2011,
largely owing to an increase in
project liabilities, a decrease in the
inventory holding period and superior
terms of trade with debtors and
creditors, increasing liquidity in the
organisation. As a result, working
capital, as a proportion of capital
employed, declined to 14.80% as on
March 31, 2011 against 34.57% as on
March 31, 2010.
Inventory: It increased from `1,402.55
million as on March 31, 2010 to
`1,515.11 million as on March 31, 2011.
Inventory cycle declined to 58 days in
2010-11 in comparison to 70 days in
2009-10 owing to faster product
offtake.
Sundry debtors: It increased 17.57%
from `773.21 million as on March 31,
2010 to `909.04 million as on March
31,2011. Average debtors’ cycle
reduced to 31 days in 2010-11 as
compared with 35 days in 2009-10.
Loans and advances: Loans and
advances increased marginally by
6.97% from `755.76 million as on
March 31, 2010 to `808.43 million as
on March 31, 2011 mainly due to
higher advance tax payment.
Current liabilities and provisions: It
increased 78.23% from `1,413.49
million as on March 31, 2010 to
`2519.33 million as on March 31, 2011
due to project creditors totalling
`435.42 million, increased provision
for tax and dividend (`389.44 million
in 2010-11 as compared to `215.80
million in previous year) and increase
in sundry creditors.
Workingcapital (netcurrentassets)declinedsignificantlyfrom 1,562.94million as onMarch 31, 2010to `743.17million as onMarch 31, 2011

34 Kajaria Ceramics Limited
Derisking the organisation
Kajaria assesses and initiates counter-measures to minimise potential losses arising owing to particular
risks. The Company created a comprehensive risk management model implemented across the organisation.
Risk minimising factors As per the Eleventh Plan, India
faces a housing shortage of more
than 26 million units, primarily in the
low and middle income groups.
Moreover, India adds nearly 10 million
annually to its population which
needs to be housed
Huge thrust on creating world-class
infrastructure is expected to drive tile
consumption; massive demand is
expected from the commercial sector
(office space, IT&ITeS, hotels,
organised retail)
Kajaria maintains a prudent sales
mix between retail and institutional
business which derisks the business
from sectoral downturn. This model
was effectively vindicated in the
realty sector downturn in 2008-09
when the Company grew its topline
31%.
“The best we can do is size up the chances, calculate therisks involved, estimate our ability to deal with them, andthen make our plans with confidence.” – Henry Ford
Risk: A downturn in user sectors could adversely impact tile offtake
Risk minimising factors Commissioning of the new vitrified
tile capacities at Sikandrabad and
Gailpur to provide a huge volume-
value play which will accelerate
business and drive profitability
Acquisition of the ceramic tile unit
in Gujarat and the new value-added
product development in the ceramic
tiles is expected to significantly
contribute to business growth
Continuous expansion of the multi-
channel distribution network should
facilitate in capturing pan-India
opportunity pockets
Much larger allocation for brand
promotion and awareness, going
forward, should strengthen the recall
resulting in increased sales volumes
Risk: The Company may not be in a position to sustain its growth
Risk minimising factors The Indian government imposed
anti-dumping duty on Chinese
ceramic tiles coming into India.
Increased labour cost in China,
hardening of the Chinese currency
and increase in sea-borne freight
cost made imports from China cost-
ineffective
Chinese imports are particularly not
viable for the North Indian tile
markets – the Kajaria strength – due
to the additional internal logistics
The Chinese government has
indicated its intention of creating
sizeable domestic demand for its
products in its Twelfth Plan –
dissuading exports
Risk: Low-cost Chinese imports could affect market share

35Annual Report 2010-11
Risk minimising factors Significantly increased disposable
income in the hands of the average
Indian has raised his aspiration for
branded products
Delta between products from the
unbranded and branded sectors has
reduced significantly for the
following realities
• Sizeable expansion and cutting-
edge technology absorption provides
economies of scale and superior
designing capability – unmatched by
the unbranded sector
• The branded sector is better
equipped to absorb cost-push inflation
The Company’s product range
(sizes, designs, finishes and price
points) enables it to cater to almost
all customer segments.
Growing participation of organised
players in the real estate space will
further minimise the relevance of the
unbranded tile manufacturers
Risk: Competition from the unbranded sector could dent profitability
Risk minimising factors Raw material costs for all tile
manufacturers players is largely
similar; Kajaria being the second
largest tile manufacturer in India
gets the advantage of superior
negotiating power and better
economies of scale.
The Company’s long-term
agreement with GAIL for the supply
of gas to the Gailpur unit (2/3rd of
the Company’s operational capacity)
will reduce operational costs. More
importantly, it brings Kajaria at par
with other branded players in the tile
segment.
Absorption of superior technology
on manufacturing lines and robotics
at its material handling optimises
manpower requirement, controlling
costs.
Risk: Cost-push inflation could dent margins
Risk minimising factors The Company followed a prudent
policy of reinvesting operational
surpluses in equipment and debt
reduction; in 2010-11, it ploughed
71.80% of its net profit into its
business.
The Company strengthened its
debt-equity ratio from 1.39 in 2009-10
to 1.26 in 2010-11.
The Company’s efficient working
capital management reduced
reliance on external debt for working
capital requirement.
The Company’s interest liability
reduced `76.6 million and interest
cover strengthened to 4.97 in 2010-11
from 3.08 in 2009-10.
The Company’s strength in the
financial statements could be
leveraged for low-cost debt
mobilisation for expansion and for
reducing average coupon rates
through loan swap options.
Risk: Hardening interest rates could dent shareholder value creation
8
36 Kajaria Ceramics Limited
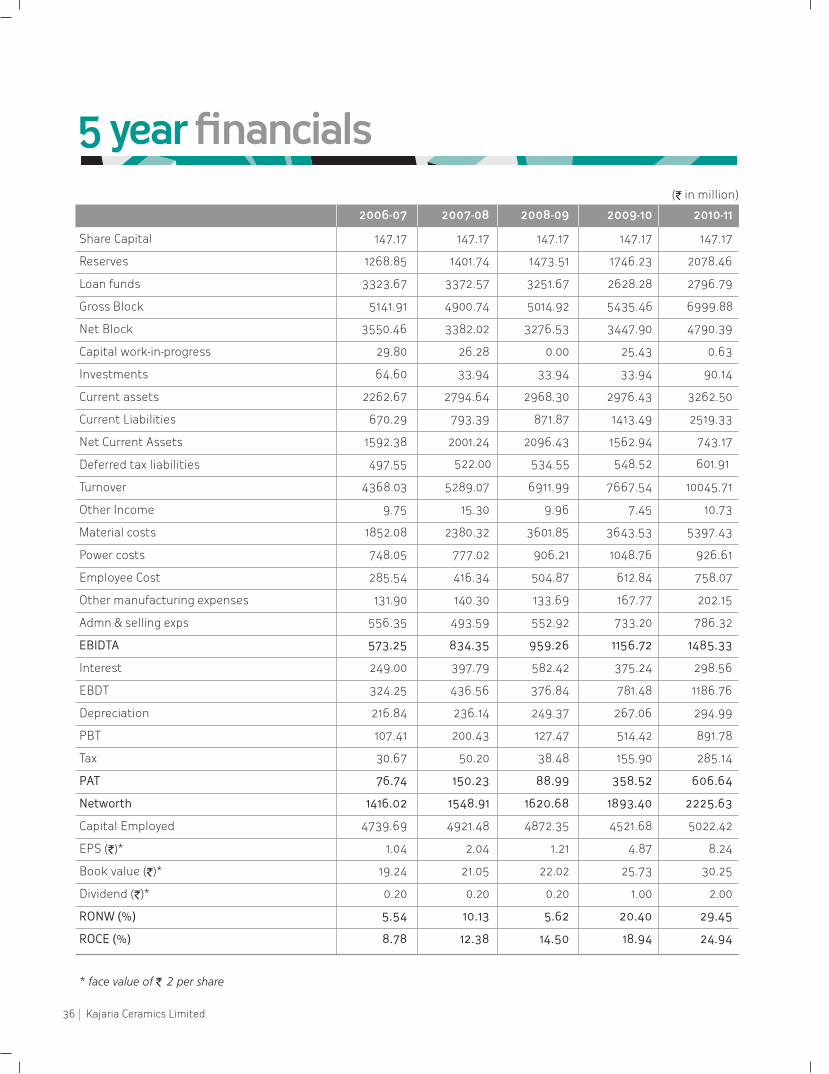
5 year financials
2006-07 2007-08 2008-09 2009-10 2010-11
Share Capital 147.17 147.17 147.17 147.17 147.17
Reserves 1268.85 1401.74 1473.51 1746.23 2078.46
Loan funds 3323.67 3372.57 3251.67 2628.28 2796.79
Gross Block 5141.91 4900.74 5014.92 5435.46 6999.88
Net Block 3550.46 3382.02 3276.53 3447.90 4790.39
Capital work-in-progress 29.80 26.28 0.00 25.43 0.63
Investments 64.60 33.94 33.94 33.94 90.14
Current assets 2262.67 2794.64 2968.30 2976.43 3262.50
Current Liabilities 670.29 793.39 871.87 1413.49 2519.33
Net Current Assets 1592.38 2001.24 2096.43 1562.94 743.17
Turnover 4368.03 5289.07 6911.99 7667.54 10045.71
Other Income 9.75 15.30 9.96 7.45 10.73
Material costs 1852.08 2380.32 3601.85 3643.53 5397.43
Power costs 748.05 777.02 906.21 1048.76 926.61
Employee Cost 285.54 416.34 504.87 612.84 758.07
Other manufacturing expenses 131.90 140.30 133.69 167.77 202.15
Admn & selling exps 556.35 493.59 552.92 733.20 786.32
EBIDTA 573.25 834.35 959.26 1156.72 1485.33
Interest 249.00 397.79 582.42 375.24 298.56
EBDT 324.25 436.56 376.84 781.48 1186.76
Depreciation 216.84 236.14 249.37 267.06 294.99
PBT 107.41 200.43 127.47 514.42 891.78
Tax 30.67 50.20 38.48 155.90 285.14
PAT 76.74 150.23 88.99 358.52 606.64
Networth 1416.02 1548.91 1620.68 1893.40 2225.63
Capital Employed 4739.69 4921.48 4872.35 4521.68 5022.42
EPS (`)* 1.04 2.04 1.21 4.87 8.24
Book value (`)* 19.24 21.05 22.02 25.73 30.25
Dividend (`)* 0.20 0.20 0.20 1.00 2.00
RONW (%) 5.54 10.13 5.62 20.40 29.45
ROCE (%) 8.78 12.38 14.50 18.94 24.94
(` in million)
* face value of 2 per share`

37Annual Report 2010-11
2006-07 2007-08 2008-09 2009-10 2010-11
Sales (gross) 4368.03 5289.07 6911.98 7667.54 10045.71
Other income 9.75 15.30 9.96 7.45 10.73
Stock adjustments 425.48 291.97 (67.38) (40.60) (16.07)
4803.25 5596.34 6854.56 7634.39 10040.37
Less:
Raw material consumed 1227.67 1169.58 1251.84 1437.91 1555.67
Trading goods 1049.89 1502.71 2282.63 2165.03 3803.95
Manufacturing expenses 879.95 917.32 1039.89 1216.53 1128.77
Other expenses 556.34 493.59 552.92 733.20 786.32
3713.85 4083.20 5127.28 5552.67 7274.71
Total value addition 1089.39 1513.14 1727.28 2081.73 2765.66
(` in million)
2006-07 2007-08 2008-09 2009-10 2010-11
To the Government
Excise duty 230.61 262.48 263.16 312.18 522.26
Dividend tax 2.08 2.50 2.50 12.22 23.87
Current tax 17.93 25.74 25.93 141.93 231.75
250.62 290.72 291.59 466.33 777.88
To the employees 285.54 416.34 504.86 612.84 758.07
To providers of finance 249.00 397.79 582.42 375.24 298.56
To shareholders 14.72 14.72 14.72 73.58 147.17
Depreciation 216.84 236.14 249.37 267.06 294.99
Deferred tax 12.74 24.45 12.55 13.97 53.39
Profit ploughed back 59.93 133.00 71.78 272.71 435.59
Retained in business 289.51 393.58 333.70 553.74 783.97
Total value addition distributed 1089.39 1513.14 1727.28 2081.73 2765.66
(` in million)
Value Added Statement
Distribution of Value-Addition

38 Kajaria Ceramics Limited
Your Directors are pleased to present the 25th Annual Report together with the audited accounts of your Company for the
financial year ended 31st March 2011.
* consolidated results include the financial results of Soriso Ceramic Pvt Ltd (subsidiary) for the period 25.2.11 to 31.03.11.
(` in million)
Particulars Standalone Consolidated
Year ended Year ended Year ended31st March 2011 31st March 2010 31st March 2011
Sales (net of excise duty) 9,523 7,355 9,523
Profit before interest, depreciation and tax 1,485 1,157 1,490
Financial charges 29 37 301
Depreciation 295 267 297
Profit before taxation 892 514 892
Tax expenses 285 156 285
Profit after tax 607 358 607
Balance brought forward from the previous year 994 819 994
Profit available for appropriation 1,601 1,177 1,601
Transferred from debenture redemption reserve (46) (2) (46)
Proposed dividend on equity shares 147 73 147
Corporate dividend tax 24 12 24
Transfer to general reserve 200 100 200
Balance carried forward 1,276 994 1,276
1,601 1,177 1,601
Directors’ Report
8 6

39Annual Report 2010-11
Financial reviewDuring the financial year under review your Company took
various strategic initiatives to improve its volume and
profitability, which helped the Company to achieve
important milestones in the history of the Company.
Gross sales grew 31% from `7,667.54 million to `10,045.71
million primarily due to increase in sales volume and
increase in the average realisation per sq mtr. The EBIDTA
increased from `1157 million in 2009-10 to `1,485 million in
2010-11.
The net profit after tax increased from `358 million to `607
million registering a 69% growth over the previous year
2009-10. The earnings per share increased from `4.87 to
`8.24 per share during the same period. The book value per
share strengthened from `25.73 as on 31st March 2010 to
`30.25 as on 31st March 2011. More importantly, every rupee
invested in business delivered much superior returns –
reflected by the improved return on employed capital from
18.94% in 2009-10 to 24.94% in 2010-11.
Dividend Considering the growth of business and the improved
profitability, the Directors recommended a 100% dividend
on equity shares (`2/- per equity share, face value of `2). The
dividend, if approved, at the forthcoming Annual General
Meeting, will be paid to all equity shareholders whose
names appear in the Register of Members as on 21st May
2011.
Corporate highlightsCapacity addition: Commissioned our 6 MSM tiles
brownfield expansion (polished and glazed vitrified) on 29th
March 2011 at Gailpur with an investment of `1,299 million
and 2.60 MSM converted capacity of ceramic floor tile into
vitrified tile manufacturing at Sikandrabad unit on 28th
March 2011 with an investment of `203 million. The total
investment is being funded by debt and internal accruals.
Inorganic growth: Acquired a 51% stake in Soriso Ceramic
Pvt. Ltd., a Gujarat-based floor tile manufacturing company
(capacity 2.30 MSM per annum) for `56.20 million which is
expected to increase the volumes of large format tiles and
strengthen the Company’s capability in catering to the West
and South markets.
Gas connection: Received the gas connection from GAIL for
our Gailpur facility replacing high-cost propane with R-LNG
– significantly reducing the power and fuel cost for your
Company.
Marketing Tie-up: The Company has entered into a
marketing tieup with Eczacibasi Yapi Gerecleri A.S., a
leading European manufacturer, for selling its high-end
‘VitrA’ bathware products in India
Recognition: Awarded the ‘Superbrand’ status for fifth
consecutive time, emerging as the only Indian tile company
to create this record.
Accounts of Subsidiaries Pursuant to the general circular no. 1/2011 issued by the
Ministry of Corporate Affairs, Government of India, the
Individual Annual Accounts of the subsidiary (M/s Soriso
Ceramic Private Limited) for the year ended on 31st March
2011, have not been attached to the Annual Report. Copies
of these Annual Accounts and related information will be
made available on request. The Annual Accounts of the
subsidiary Company will be available at the registered office
of the Company and also at the venue during the Annual
General Meeting.
Fixed depositsThe Company did not invite/accept any fixed deposit within
the meaning of Section 58A of the Companies Act, 1956,
and the rules made thereunder.

40 Kajaria Ceramics Limited
Outlook The outlook for the tile industry appears to be positive over
the medium term. This optimism stems from certain
credible estimates which highlight the likelihood of robust
demand over the medium term:
Real estate growth: Real estate plays a crucial role in the
Indian economy. It is the second largest employer after
agriculture and is slated to grow at 30% over the next
decade. The Indian real estate market size is expected to
touch $180 billion by 2020.
The housing sector alone contributes to 5-6% of the
country’s GDP. Retail, hospitality and commercial real
estate are also growing significantly, providing the much-
needed infrastructure for India’s growing needs.
According to a study by ICRA, the construction industry
ranks 3rd among the 14 major sectors in terms of direct,
indirect and induced effects in all sectors of the economy.
A unit increase in construction expenditure generates five
times the income, having a multiplier effect across the
board. With backward and forward linkages to over 250
ancillary industries, the positive effects of real estate
growth spread far and wide. Truly, real estate is a growth
engine for India’s economy.
Real estate developers play a leading role in the industry,
bridging the gap between construction ability and the
customer’s need. Developers offer value in terms of design,
cost, functionality and location. They work hard to absorb
international trends, analyse the customers’ expectations
and deliver quality realty products based on their
experience. In India, real estate developers fulfil a critical
need for infrastructure to serve a growing economy in areas
like housing, office space, retail and entertainment, among
others.
Commercial segment demand: The share of organised
retail in the total Indian retail trade pie is projected to grow
at 40% per annum. The number of shopping malls is
expected to increase at an 18.9% CAGR between 2007 and
2015. This is expected to drive the demand for large-format,
value-added tiles for flooring solutions and high-end wall
tiles for the external façade.
Social infrastructure creation: The healthcare sector is
estimated to become a US$ 280 billion industry by 2020
from the current US$ 40 billion (source: ibef). With India
emerging as a preferred destination for medical treatment,
medical tourism in the country is expected to grow at a
CAGR (2011-2013) of 26% to reach US$ 3 billion by 2013,
reflecting the necessity to create world-class health
infrastructure – accelerating the demand for value-added
tiles.
Growth drivers for the current yearYour Company expects to leverage a volume-value play in
the current year to accelerate its growth momentum and
strengthen value creation for its valued shareholders.
Volumes expansionThe product volumes are expected to expand substantially
following the commissioning of its brownfield expansion at
Gailpur and conversion of part of ceramic tile
manufacturing facility in to vitrified– adding a cumulative
8.60 MSM capacity.
Value enhancementYour Company has added 8.6 MSM of vitrified tile capacity
which provides superior realisation. Besides, the important
change from importing these tiles to in-house
manufacturing is expected to significantly strengthen
business profitability.
Your Company developed a range of new value added
products which are expected to be commercialised in 2011-
12, shoring margins. Wall tiles for exterior wall applications
is one important development; digitally printed tiles in more
than 10 designs (providing a natural stone look and feel) is
the other – strengthening realisations and margins.
In addition, the trading models for bathware and wooden
flooring solutions are expected to make sizeable
contributions to the topline and business profitability
DirectorsMr. Ashok Kajaria has been re-appointed as Chairman and
Managing Director of the Company, w.e.f 1st April 2011
subject to the approval of the members.
In accordance with Article 100 of the Articles of Association
of the Company, Mr. R.P. Goyal and Mr. R. R. Bagri, Directors
of the Company, retires by rotation at the forthcoming
Annual General Meeting and being eligible, offer
themselves for re-appointment.

41Annual Report 2010-11
The details of their re-appointment together with nature of
their expertise in specific functional areas and names of the
companies in which they hold a Director or Chairman /
membership of the committees of the Board are provided in
the notice of the ensuing Annual General Meeting.
Auditors and their observations M/s O P Bagla & Co., Chartered Accountants, the auditors
of the Company retire at the ensuing Annual General
Meeting and being eligible offer themselves for re-
appointment. The Company received a certificate from the
auditors to the effect of their re-appointment. The
observations of the auditors are suitably explained in the
notes on accounts.
PersonnelYour Company maintained cordial relations during the year
under review. The Company continued its endeavour to
grow the learning curve through regular training
programmes for its team members enabling them to attain
higher productivity and superior quality. The information
required to be furnished in terms of Section 217(2A) of the
Companies (Particulars of Employees) Rules, 1975, as
amended, is set out in the statement annexed hereto as
Annexure-I, forming part of the report.
Directors’ responsibility statementPursuant to the provisions of the Companies Act 1956, your
Directors confirm that:
i) In the preparation of the annual accounts, the
applicable accounting standards were followed along
with proper explanations relating to material departures
ii) The Directors selected such accounting policies and
applied them consistently and made judgments and
estimates that were reasonable and prudent so as to
give a true and fair view of the state of affairs of the
Company at the end of the financial year and of the
profit or loss of the Company for that period.
iii) The Directors took proper and sufficient care to
maintain adequate accounting records in accordance
with the provisions of this Act for safeguarding the
assets of the Company and for preventing and detecting
fraud and other irregularities.
iv) The Directors prepared the annual accounts on a going
concern basis.
Corporate Governance reportPursuant to Clause 49 of the Listing Agreement with the
stock exchanges, the Company has complied with the
Corporate Governance. A separate section on Corporate
Governance along with the certificate from auditors
confirming the compliance is annexed and forms part of
annual report.
Management discussion and analysisreportManagement discussion and analysis on matters related to
the business performance, as stipulated in Clause 49 of the
Listing Agreement with stock exchanges, is given as a
separate section in the annual report.
Conservation of energy, technologyabsorption and foreign exchangeearnings/outgoInformation required under Section 217(1)(e) of the
Companies Act, 1956, read with the Companies (disclosure
on particulars in the report on the Board of Directors) Rules,
1988 is given in Annexure-II and forms part of this report.
AcknowledgementThe Board greatly appreciate the commitment and
dedication of employees at all levels who have contributed
on the growth and success of the Company. The credit for
the Company’s achievement goes to them.
We would also take this opportunity to offer thanks and
deep sense of gratitude for the cooperation and support
received from the central and state government authorities,
financial institution/banks, customers, vendors,
shareholders and the society at large.
We are deeply grateful to our shareholders for the
confidence and faith reposed on us.
Your Company looks forward to their continued support in
future.
For and on behalf of the Board
Place: New Delhi Ashok Kajaria
Date: 30th April, 2011 Chairman and Managing Director

42 Kajaria Ceramics Limited
Annexure-I to the Directors’ report
A) Employed throughout the financial year and in receipt of the remuneration aggregating 6.00 million or more per annum.
Sr. Name Age Designation Qualification Experience Date of Remune- Particulars of
No. joining ration Last Employment
(` million)
1 Mr. Ashok Kajaria 64 Chairman & B.SC., BSME., 36 01.01.1987 10.70 Managing Director-
Managing Director California Kajaria Exports
Limited
2 Mr. Chetan Kajaria 37 Joint Managing BE- Pune 12 15.01.2000 8.56 Managing Director-
Director University, Kajaria Plus Limited
MBA- Boston
University, USA
3 Mr. Rishi Kajaria 33 Joint Managing B Sc (Business 8 26.07.2003 8.56 Director,
Director Admn) Boston Kajaria Infotech Ltd
University, USA
B) Employed for a part of the financial year and in receipt of remuneration NIL
aggregating to `0.50 million or more per month.
Notes:
1. Remuneration includes salary, allowances, Company’s contribution to PF, perquisites exclude contribution to Gratuity
Fund and Personal Accident Insurance as the same is paid for the Company as a whole.
2. Appointments of Mr. Ashok Kajaria, Chairman & Managing Director, Mr. Chetan Kajaria, Joint Managing Director and
Mr. Rishi Kajaria, Joint Managing Director, are contractual.
3. Mr. Ashok Kajaria, Chairman & Managing Director is relative of Mr. Chetan Kajaria and Mr. Rishi Kajaria, Joint Managing
Directors of the Company.
For and on behalf of the Board
Place: New Delhi Ashok Kajaria
Date: 30th April, 2011 Chairman & Managing Director

43Annual Report 2010-11
Annexure-II to the Directors’ report
I. Conservation of energy:The Energy Conservation efforts in the Company are being
pursued on a continuous basis. Close monitoring of power
consumption is maintained to minimise wastage and
facilitate optimum utilisation of energy. Regular
maintenance and repairs of all the equipment and
machinery are carried out to ensure optimum efficiency.
The energy conservation measures taken are -
1) Continuous maintenance of high power factor for
effective utilisation of grid power and reduction of
apparent energy consumption and in conjunction with
mitigation/reduction of harmonics by broadband
reactors resulting in reduction of apparent as well as
active energy consumption.
2) Synchronisation of gas gensets to ensure equal and
optimum load sharing for effective utilisation of genset
capacity and reduction in specific fuel consumption of
gensets.
3) Installation of latest generation energy efficient lighting
and equipment, variable frequency drives are extensively
installed and used wherever possible for lesser energy
consumption in motors by exploring their speed,
installation of BEE (Bureau of Energy Efficiency)
certified electrical items / equipment resulting in saving
of power consumption.
4) Considerable fuel saving by complete change-over to
use of RLNG (Re-gasified Liquid Natural Gas) in both the
plants.
Technology AbsorptionA. Research and Development (R&D)
(i) Specified Areas in which (R&D) carried out by the
Company:
1) Research for development of vitrified tiles and further
development of new and large wall (15 x 60 cm) and
floor (60x60 cm) tiles conforming both EN & IS
standards.
2) Developed a new tile (15x45cm) with a stone look in
matt finish and self design by using new Inkjet Digital
Printing Technology, Size (30x60cm) has a very high
glossy finish and self design by using Inkjet Digital
Printing Technology.
3) Development, evaluation, selection and optimisation of
process parameters of production lines for improvement
in yield and quality.
some of the imported glaze materials have been
replaced with indigenous materials.
tuning of formulations and operations.
(ii) Benefits derived as a result of the above R & D
1) The Company is able to offer wider range of ceramic and
vitrified tiles at competitive cost, which increases the
customer satisfaction to a great extent and becomes
more effective and preferable to all types of customers.
2) Continuous improvement in achieving the higher
standard of quality product with success in reducing the
cost of production.
(iii) Future plan of action
1) Introduction of bigger size of ceramic (wall and floor)
and polished/glazed vitrified tiles.
2) Introduction of new type of decorated tiles.
3) To continue updating technology as per advancement
and competitiveness observed from the global market.
4) To maintain with the advance infrastructure available in
the tile industry and train/educate the R&D team with
updated technology of ceramic wall tiles.
4) To get consistent and economical quality products,
5) In-house analytical steps have been taken for fine

44 Kajaria Ceramics Limited
(iv) Expenditure on (R&D) ` / in Million
Particulars 2010-11 2009-10
a) Capital 4.08 –
b) Recurring 0.43 0.82
c) Total R&D expenditure 0.05% 0.01%
as a percentage of
total turnover
[B] Technology Absorption, Adaptation andInnovation
1) The Company has fully adopted and further updating
the latest technology available for producing vitrified
and ceramic tiles at par with European / China market
of tiles
2) Our R&D / Technical expert’s visit global market for
adopting and updating the latest technology available.
Benefits derived as a result of the above
The Company is continuously updating for standardisation
and installation of required machineries in the process of
manufacturing vitrified and ceramic tiles. A considerable
amount of energy is being conserved by total use of RLNG
in both the plants (at Sikandrabad / Gailpur), and
innovation in controlling the natural mineral resources by
the use of recycled waste.
Technology Imported
Process of Monocuttura Monoporosa Vitrified
technology
- Year of import 1988 1994 2010
- Has technology YES YES YES
been fully
absorbed
Social & Community Welfare
As a national and global corporate citizen, the Company
nurtures relationships across the entire range of social and
community welfare areas. The Company intends to be
excellent in world class operational levels by maintaining
quality, health and safety, environment, social
accountability and food safety.
The Company has a long and strong tradition of supporting
its surrounding communities that it connects with – from
education, health, fire explosion, Prajapita Brahma Kumaris
Ishwaria Vishwa Vidyalaya, Jain International Sansathan,
Dosa Ashram, Dharamsala, development of employable
skills, Helpage India, to weaker sections of society.
Foreign Exchange Earning and Outgo
` in Million
2010-11 2009-10
Earned:
Exports (FOB) 138 367
Spent:
Imports (CIF):
Capital goods 573 163
Raw material 106 147
Stores & spares 95 47
Traded goods 2,176 1,107
Others
(on accrual basis) 40 37
For and on behalf of the Board
Place: New Delhi Ashok Kajaria
Date: 30th April, 2011 Chairman and Managing Director

45Annual Report 2010-11
I. The Company’s Philosophy on CorporateGovernanceCorporate governance guidelines and best practices have
evolved over a period of time. We, at Kajaria Ceramics
believe that sound corporate governance is critical in
enhancing and retaining investor trust. Accordingly, we
always seek to ensure that we attain our performance goals
with integrity. Our Board exercises its fiduciary
responsibilities in the widest sense of the term. We always
ensure timely and accurate disclosure of information
regarding the financial situation, performance, ownership
and governance of the Company. All our steps help in
protecting the long-term interests of all our stakeholders.
II. Board of DirectorsThe Board of Directors of the Company has adequate
combination of executive, non-executive and independent
Directors. As on 31st March 2011, the Company has 8
Directors on its Board, of which 4 Directors are
independent. The Company is in compliance with Clause 49
of the listing Agreement pertaining to the composition of
Board of Directors. The non-executive Directors are eminent
and experienced professionals drawn from the fields of
business, finance and public entrepreneurs. None of the
Directors on the Board is a member of more than 10
Committees and Chairman of more than 5 Committees (as
specified in Clause 49).
Corporate Governance Report
The composition of the Board, attendance of Directors at Board Meetings during the year and at the last Annual General
Meeting and the number of directorships and Committee memberships held by them in other companies are given below:
Name Status No. of Board No. of Board No. of Committee Whether
Meetings held meetings other Membership** attended
attended Directorship* the last AGM
Mr. Ashok Kajaria Chairman & Managing 6 6 5 3 YesDirector (Executive)
Mr. Chetan Kajaria Joint Managing 6 6 6 2 YesDirector (Executive)
Mr. Rishi Kajaria Joint Managing 6 6 9 1 YesDirector (Executive)
Mr. R P Goyal Director (Independent 6 5 2 1 YesNon- Executive)
Mr. Raj Kumar Bhargava Director (Independent 6 6 8 2 YesNon- Executive)
Mr. R R Bagri Director (Independent 6 6 4 4 YesNon- Executive)
Mr. D P Bagchi Director (Independent 6 6 8 1 YesNon- Executive)
Mr. B.K. Sinha Director- Technical 6 6 1 – Yes(Executive)
* includes directorship in private limited companies.
** for this purpose only the Committees namely Audit Committee, Remuneration Committee, Share Transfer and InvestorsGrievances Committee and Project Management Committee of the Company.

46 Kajaria Ceramics Limited
During the financial year ended 31st March 2011, six Board
Meetings were held on 30.04.2010, 10.07.2010, 21.08.2010,
12.10.2010, 20.01.2011 and 25.02.2011. The intervening period
between two Board Meetings was within the maximum
time gap of 4 months prescribed under corporate
governance norms. The Non-Executive Directors have no
material pecuniary relationship or transactions with the
Company in their personal capacity.
Mr. Ashok Kajaria has been re-appointed as Chairman and
Managing Director of the Company w.e.f 1st April, 2011
subject to the approval of members.
Mr. Ashok Kajaria is the father of Mr. Chetan Kajaria and
Mr. Rishi Kajaria, Joint Managing Directors of the Company.
In accordance with Article 100 of the Articles of Association
of the Company, Mr. R P Goyal and Mr. R.R. Bagri, Directors
of the Company, retires by rotation at the forthcoming
Annual General Meeting and, being eligible, offer
themselves for re-appointment. The Board recommends
their re-appointment.
The required information of all these Directors who are to
be appointed/re-appointed in the forthcoming Annual
General Meeting is given in the annexure attached.
Information supplied to the BoardThe Board has complete access to all information within
the Company including the information as per Clause 49 of
the Listing Agreement. Dates of Board Meetings are
informed well in advance and communicated to the
Directors. The agenda for the Board Meeting is circulated in
advance of each meeting.
III. Audit CommitteeAs on March 31 2011, the Audit Committee consists of three
Directors, all being non – executive and independent. All
members of the Committee are financially literate and have
expertise in accounting and financial management.
The composition of the Audit Committee and the details of
the meetings attended by the Directors are as follows:
Sl. Name of Category No. ofNo. the Members meetings
attended
1. Mr. R P Goyal Chairman 4
2. Mr. R K Bhargava Member 4
3. Mr. R R Bagri Member 4
Mr. R C Rawat, Sr. Vice President (A&T) & Company Secretary
is the Secretary of the Audit Committee. The Chairman of
the Audit Committee has attended the Annual General
Meeting of the Company held on 21st August 2010.
During the year under review, the Audit Committee met four
times i.e. 30.04.2010, 10.07.2010, 12.10.2010 and 20.01.2011.
The necessary quorum was present in all the meetings.
Role of Audit CommitteeAudit Committee of the Board is entrusted with the powers
and role that are in accordance with Clause 49 of the Listing
Agreement as well as Section 292A of the Companies Act
1956. The role of Audit Committee inter alia includes the
following:
a) Overview of the Company’s financial reporting process
and disclosure of its financial information;
b) Recommending the appointment/removal of statutory
auditors, fixation of audit fee, discussion about the
nature and scope of audit and approval of payment of
fees for any other service rendered by statutory auditors;
c) Reviewing with the management, the quarterly, half
yearly and annual financial statements before
submission to the Board;
d) Reviewing the internal audit reports and report of the
Statutory Auditors with the management.

47Annual Report 2010-11
e) Reviewing the adequacy of internal audit function, the
internal control system of the Company, compliance with
the Company’s policies and applicable laws and
regulations;
f) Reviewing the Company’s financial and risk management
policies.
g) To look into the reasons for substantial defaults, if any,
in the payment to the depositors, debenture holders,
shareholders (in case of non-payment of declared
dividend) and creditors.
The Audit Committee may also review such matters as may
be referred to it by the Board or which may be specified as
the role of the Audit Committee under amendments, if any,
from time to time, to the Listing Agreement, Companies Act
and other statutes.
IV. Remuneration CommitteeThe Company has a Remuneration Committee of Board of
Directors consisting of the following four members:
Name of Category No. of Meetings
the Director Attended
Mr. Ashok Kajaria Chairman 1
Mr. R K Bhargava Member 1
Mr. R R Bagri Member 1
Mr. D.P. Bagchi Member 1
The terms of reference to this Committee include:
Formulation of policy relating to, and fixation of,
remuneration payable, and other service terms and
conditions applicable to the Executive Directors, and
other senior executives of the Company and
Fees payable to the Non-Executive Directors for meetings
of the Board and/or various committees attended
During the year under review, the Committee met once on
30.04.2010.
The details of remuneration paid to directors during the financial year ended 31st March 2011 is as under:
` in lacs
S No. Name of Directors Salary Perquisites and other Benefits Sitting fees Total
1 Mr. Ashok Kajaria 60.00 47.00 – 107.00
2 Mr. Chetan Kajaria 48.00 37.60 – 85.60
3 Mr. Rishi Kajaria 48.00 37.60 – 85.60
4 Mr. B. K. Sinha 14.85 09.90 – 24.75
5 Mr. R P Goyal – – 1.80 1.80
6 Mr. R R Bagri – – 3.80 3.80
7 Mr. R K Bhargava – – 2.20 2.20
8 Mr. D P Bagchi – – 1.40 1.40

48 Kajaria Ceramics Limited
The Company has not issued any stock options and no
commission was paid to any Director.
The number of shares held by Non- Executive Directors as
on 31.03.11 is as follows:
S.No. Name of No. of shares
Non-Executive Director held as on 31.03.11
1 Mr. R P Goyal 2500
2 Mr. R K Bhargava 14296
3 Mr. R R Bagri 27000
4 Mr. D P Bagchi –
V. Project Management Committee The Company has a Project Management Committee of
Board of Directors to review the expansion/capital
investments. The composition of Project Management
Committee is as under: -
Name of the Director Category
Mr. Ashok Kajaria Chairman
Mr. Chetan Kajaria Member
Mr. Rishi Kajaria Member
Mr. R. R. Bagri Member
During the year under review, the Committee met four
times on 10.07.2010, 20.01.2011, 28.03.2011 and 29.03.2011
VI. Share Transfer and Investors GrievancesCommitteeThe Committee oversees redressal of shareholders and
investors grievance like transfer of shares, non receipt of
balance sheet, dividend and approval of transfer of shares,
subdivision, transmission, issue of duplicate share
certificates etc. The composition of the Committee is as
under: -
Name of the Director Category
Mr. R R Bagri Chairman
Mr. Ashok Kajaria Member
Mr. Chetan Kajaria Member
Mr. R.C.Rawat, Sr. V.P. (A&T) & Company Secretary is the
Compliance Officer of the Company.
During the year, six meeting of Share Transfer and Investors
Grievances Committee were held on 01.04.2010, 10.07.2010,
21.08.2010, 18.10.2010, 22.12.2010 and 25.02.2011.
During the year, 23 complaints were received. All the 23
complaints were disposed off and no complaints were
pending as of 31.03.2011.
VI. General Body MeetingsThe last three Annual General Meetings were held as per
details given below:
Year Date Time Venue
2008 25.09.2008 12.00 Noon A-27 & 28,
Sikandrabad Indl Area
Sikandrabad,
Distt Bulandshahr (U P)
2009 28.08.2009 12.00 Noon -do-
2010 21.08.2010 12.00 Noon -do-
There is no proposal for passing any resolution through
postal ballots in the ensuing AGM.
VII. Disclosures a) Disclosure on materially significant related party
transactions:
Details of related party transactions of the year have
been set out under Note No. 20 of Schedule No. 22 of
the Annual Accounts. During the year under review, the
Company has not entered into any transaction of a
material nature that may have any potential conflict
with the interests of the Company.
b) Details of non-compliance by the Company, penalties,
strictures imposed on the Company by the Stock
Exchanges, SEBI or any statutory authority or any
matter related to capital markets:
The Company has complied with all the requirements of
the listing agreements with the Stock Exchanges as well
as regulations and guidelines of SEBI. No penalties have
been imposed or stricture issued by SEBI, Stock
Exchanges or any statutory authority on matters

49Annual Report 2010-11
relating to capital markets during the last three years.
c) Disclosure of accounting treatment in preparation of
financial statements:
The Company has followed the guidelines of the
accounting standards laid down by the Institute of
Chartered Accountants of India in preparation of its
financial statements.
d) Whistle blower
Though the Company has already laid down a whistle
blower policy, however, the employees of the Company
are given access to the Audit Committee to report any
unethical behaviour.
e) Proceeds from public/rights/preferential issues etc.
The Company does not have any un-utilised money
raised through public/rights/preferential issues.
f) Managing Director and V.P. (Finance & Corporate
Strategy) of the Company have given the “CEO/CFO
Certification” to the Board of Directors in accordance
with Clause 49 of the Listing Agreement.
g) The Company has complied with all the mandatory
requirements. Among the non-mandatory requirements,
the Company has set up the Remuneration Committee.
The Company has also formulated the framework for
risk management and procedure for informing the
members of the Board about the risk assessment and
minimisation procedures.
VIII. Means of CommunicationQuarterly Results : Through Newspapers
Newspapers wherein : 1) Financial Express,
results normally published Economic Times
2) Jansatta (Hindi)
Any website, where : www.kajariaceramics.com
displayed
Send to Stock Exchange : Yes, within 15 minutes
of Board Meeting
Notice relating to Annual General Meeting is sent to the
members at the registered address.
IX. General Share Holders Informationi)Annual General Meeting (Financial Year 2010-11):
Date Time Venue
2nd June, 2011 12.00 Noon A-27 & 28, Sikandrabad
Indl Area Sikandrabad,
Distt Bulandshahr (U P)
ii) Next dates of 23rd May, 2011 to
book closure 2nd June, 2011
(both days inclusive)
iii)Date of Dividend, if any, will be
dividend paid within the stipulated
payment period after its declaration
by the members at the
AGM.
iv) Unpaid/unclaimed dividend :
All the unpaid/unclaimed dividend upto the financial year
2002-03 have been transferred to Investor Education and
Protection Fund. No claims will lie against the Company or
the Fund in respect of unclaimed amount so transferred.
The unclaimed dividend declared in respect of the financial
year 2003-04 is due to be transferred to Investor Education
and Protection Fund.
v) Listing on Stock Exchanges:
Bombay Stock Exchange Limited, Phiroze Jeejeebhoy
Towers, Dalal Street, Mumbai-400001.
National Stock Exchange of India Ltd,
“Exchange Plaza”, Bandra-Kurla Complex,
Bandra(E), Mumbai 400051
BSE/NSE listing fees for the financial year 2011-12 has
been paid.
vi) Stock Code
500233 (BSE) / KAJARIACER (NSE)

50 Kajaria Ceramics Limited
vii) Market Price Data : Monthly high and low quotation of shares traded on Mumbai/National Stock Exchange during the
year 2010-11: - Amount in `
B S E N S E
Months High Low High Low
April, 2010 69.20 60.00 69.20 59.80
May, 2010 69.10 58.95 69.65 60.35
June, 2010 65.80 58.25 65.50 56.50
July, 2010 72.00 60.10 71.90 57.25
August, 2010 71.75 66.30 71.90 65.00
September, 2010 79.70 67.75 79.70 67.80
October, 2010 81.95 73.60 83.60 72.00
November, 2010 80.80 69.50 80.90 69.00
December, 2010 79.35 70.00 79.40 70.10
January, 2011 77.45 66.05 76.45 66.10
February, 2011 72.50 60.80 72.00 60.30
March, 2011 78.90 65.00 78.90 66.30
x) Distribution of Shareholding as on 31st March, 2011
Category No.of Shares Held Percentage of Shareholding
1 Indian promoters 37771815 51.33
2 Mutual Funds and UTI 5142472 6.99
3 Bank, financial institutions, 35940 0.05
4 Insurance companies. 500000 0.68
5 FII's 2538365 3.45
6 Private corporate bodies 8552275 11.62
7 Indian public 18639815 25.33
8 NRI's /OCB's 400298 0.55
9 Any other (trust and foundation) 2600 0.00
GRAND TOTAL 73583580 100.00
viii) Registrar & Share Transfer Agent
MCS Ltd
F-65, 1st Floor
Okhla Industrial Area, Phase-1
New Delhi 110020
Phone: 011-41406151-52
Fax: 011-41709881
ix ) Share Transfer System
M/s MCS Ltd is the Registrar and Transfer Agents for
handling both the share registry work relating to shares
held in physical and electronic form at single point. All the
share transfers were duly registered and returned in the
normal course within stipulated period, if the documents
were clear in all respects.

51Annual Report 2010-11
xi) Dematerialisation of shares and liquidity
The Company’s equity shares are compulsorily traded in the
Stock Exchanges in the dematerialised mode and are
available for trading under both Depository Systems in India
– National Securities Depository Limited and Central
Depository Service (India) Ltd.
As on 31st March 2011, 96.95% shares of the Company have
been dematerialised.
xii) Outstanding GDRs/ADRs /warrants or other
convertible instruments
The Company has not issued any GDR/ADR/warrants or
other convertible instruments, which are pending for
conversion.
xiii) Plant Locations
The plants of the Company are located at the following
addresses:
A-27 & 28, Sikandrabad Industrial Area, Sikandrabad,
Distt Bulandshahr (U P).
19 Km Stone, Bhiwadi – Alwar Road, Village Gailpur,
Distt Alwar (Rajasthan).
xiv) Subsidiary company
There is no material non-listed subsidiary Company
requiring appointment of Independent Director of the
Company on the Board of Directors of subsidiary company.
The requirements of the Clause 49 of the Listing Agreement
with regard to the subsidiary companies have been
complied with.
However the Company has one subsidiary company which
does not fall in the category of material non-listed company:
Soriso Ceramic Private Limited
Registered Office & Factory
8-A, National Highway,
Lakhdhipur Road,
Morbi, Gujarat, 363642
xv) Address for Correspondence
Registered Office:
Kajaria Ceramics Ltd
A-27 & 28, Sikandrabad Indl Area,
Sikandrabad, Distt Bulandshahr (U P)
Corporate Office:
Kajaria Ceramics Ltd
J-1/B-1 (Extn), Mohan Co-operative Indl Estate
Mathura Road, New Delhi-110044
Phone: 26946409 Fax: 26946407, Email for Investors
The Company has designated [email protected]
as email address, especially for investors’ grievance(s).
xv) Certificate related to Code of Conduct to Directors/
Senior Management
This is to certify that as per revised Clause 49 of the Listing
Agreement, the Code of Conduct has been laid down for all
the Board Members and senior management of the
Company. The Board Members and senior management
personnel have affirmed compliance with the Code of
Conduct.
For and on behalf of the Board
Place: New Delhi Ashok Kajaria
Date: 30th April, 2011 Chairman & Managing Director
Range-wise distribution is as follows:
No. of Shareholders No. of Shares
Range Total % of shareholders Total % of share capital
1-500 7572 74.16 1244670 1.74
501-1000 1087 10.65 926335 1.30
1001-2000 657 6.44 993228 1.39
2001-3000 282 2.76 714030 1.00
3001-4000 113 1.11 404542 0.57
4001-5000 137 1.34 652190 0.91
5001-10000 141 1.38 1033878 1.45
10001 and above 221 2.16 65371131 91.64
Total: 10210 100% 73583580 100%

52 Kajaria Ceramics Limited
ANNEXURE TO THE CORPORATE GOVERNANCE
1. Mr. Ashok Kajaria
Mr. Ashok Kajaria is B.Sc., BSME from California. He is the
promoter of the Company and has more than 36 years of rich
experience in the tiles industry, global marketing and business
relating to construction industry. He is holding 28,34,500
equity shares of the Company as on 31st March 2011.
Directorships in other companies :
S.No. Name of Company Position
1 Kajaria Exports Limited Director
2. Kajaria Infrastructure Limited Director
3 Kajaria Energy Limited Director
4. Ramya Agrotech Private Limited Director
5. Indian Council of Ceramic Tile and Director
Sanitaryware
2. Mr. R.P.Goyal is M.Com, CAIIB. He served the Imperial
Bank of India (later named as State Bank of India) as
Probationary Officer and after going through various level
of promotion retired as Chairman. He was also a consultant
of the Foreign Bank from 1984 to 1999 and also an advisor
for several public sector banks. Further, he was a visiting
faculty of the Institute of Banking, Pune. He has rich
experience in the field of finance, banking and accounts. He
serves as a Director on the boards of various reputed
Companies.
Mr. R.P.Goyal joined the Board of Directors of the Company
on 24th May 1988. He is holding 2500 equity shares of the
Company as on 31st April, 2011.
Directorships in other companies:
S.No. Name of Company Position
1 Mark Exhaust Limited Director
2 Nilkamal Limited Director
Committees’ Membership in the Other Companies
S.No. Name of Company Name of the Committee Position
1 Mark Exhaust Limited Audit Committee Chairman
2 Mark Exhaust Limited Remuneration Committee Chairman
3 Nilkamal Limited Audit Committee Member

53Annual Report 2010-11
. Mr. R.R. Bagri is B.Sc. (Engg.), M.S. (Sans) and FIPHE
(New York). He has formally served M/s Geo Miller & Co. P.
Ltd. as Sr. Project Engineer from 1967 to 1972, leading
designers and contractors in the field of public health
engineering. Since June 1972, he is the Managing Director
of Clear Water Ltd., a company specialising in setting up
projects on turnkey basis in the field of public health
engineering. He joined the Board of Directors of the
Company on 21st January, 2000. He is a refined industrialist
and expert in the field of engineering and finance.
He holds 27000 equity shares of the Company as on 31st
March 2011.
Directorships in other companies:
S.No. Name of Company Position
1 Clear Water Limited Managing Director
2 Faridabad Paper Mills Limited Director
3 APM Industries Limited Director
4 Bagri Udyog (P) Limited Director
Committees’ Membership in the Other Companies
S.No. Name of Company Name of the Committee Position
1 Clear Water Limited Audit Committee Chairman
2 Clear Water Limited Remuneration Committee Chairman
3 Clear Water Limited Share Transfer Committee Chairman
4 Bagri Udyog (P) Limited Remuneration Committee Chairman
5 Bagri Udyog (P) Limited Share Transfer Committee Chairman
6 Bagri Udyog (P) Limited Audit Committee Chairman
7 APM Industries Limited Remuneration Committee Member
8 APM Industries Limited Shareholders/Investor Grievance Committee Member
9 APM Industries Limited Audit Committee Member
3

54 Kajaria Ceramics Limited
To
The Members of Kajaria Ceramics Ltd,
We have examined the compliance of conditions of Corporate Governance by Kajaria Ceramics Ltd for the year ended 31st
March 2011, as stipulated in Clause 49 of the Listing Agreement of the said with Stock Exchanges.
The compliance of conditions of Corporate Governance is the responsibility of the management.
Our examination was limited to review the procedures and implementation thereof, adopted by the Company for ensuring
the compliance of the conditions of Corporate Governance. It is neither an audit nor an expression of opinion on the
financial statements of the Company.
In our opinion and according to the explanations given to us, we certify that the Company has complied with the conditions
of Corporate Governance as stipulated in the above-mentioned Listing Agreement.
We state that no investor grievance is pending for a period exceeding one month against the Company as per the records
maintained by the Share Tranfer and Investors Grievance Committee.
We further state that such compliance is neither an assurance as to future viability of the Company nor the efficiency or
effectiveness with which the management has conducted the affairs of the Company.
For O P BAGLA & CO
Chartered Accountants
Sd/-
Place: New Delhi Mukul Bagla
Date: 30th April, 2011 PARTNER
M No. 94156
Firm Registration No. 000018N
AUDITORS’ CERTIFICATE ON COMPLIANCE WITH THECONDITIONS OF CORPORATE GOVERNANCE UNDERCLAUSE 49 OF THE LISTING AGREEMENT(S)

55Annual Report 2010-11
We have audited the attached Balance Sheet of KAJARIA
CERAMICS LIMITED as at 31st March, 2011 and also the Profit
& Loss Account and the Cash Flow Statement for the Year Ended
on that date. These financial statements are the responsibility of
the Company’s management. Our responsibility is to express an
opinion on these financial statements based on our audit.
We have conducted our audit in accordance with auditing
standards generally accepted in India. Those standards require
that we plan and perform the audit to obtain reasonable
assurance about whether the financial statements are free of
material misstatement. An audit includes examining, on a test
basis, evidence supporting the amounts and disclosures in the
financial statements. An audit also includes assessing the
accounting principles used and significant estimates made by
the management, as well as evaluating the overall financial
statement presentation. We believe that our audit provides a
reasonable basis for our opinion.
1. As required by the Companies (Auditor’s Report) order, 2003
as amended by the Companies (Auditor’s Report)
(Amendment) order 2004 issued by the Central Government
in terms of Section 227(4A) of the Companies Act, 1956,
we enclose in the annexure a statement on the matters
specified in the paragraphs 4 & 5 of the said order to the
extent applicable to the Company.
2. Further to our comments in the annexure referred to above,
we report that :-
a) We have obtained all the information and explanations
which to the best of our knowledge and belief, were
necessary for the purpose of our audit.
b) In our opinion, proper books of account as required by
law have been kept by the Company so far as appears
from our examination of such books.
c) The Balance Sheet, Profit & Loss Account and Cash Flow
Statement dealt with by this report are in agreement
with the books of account.
d) In our opinion, the Balance Sheet, Profit and Loss
Account and Cash Flow Statement dealt with by this
report comply with the applicable accounting standards
referred to in sub-section (3c) of section 211 of the
Companies Act, 1956.
e) On the basis of written representations received from the
directors as on 31st March, 2011 and taken on record by
the Board of Directors, we report that none of the
directors of the Company is disqualified from being
appointed as Director as at 31st March, 2011 in terms of
section 274(1) (g) of the Companies Act, 1956.
f) In our opinion and to the best of our information and
according to the explanations given to us, the said
accounts read together with Significant Accounting
Policies and other Notes thereon in Schedule – 22, give
the information required by the Companies Act, 1956 in
the manner so required and give true and fair view in
conformity with the accounting principles generally
accepted in India :-
i) In the case of the Balance Sheet of the state of affairs
of the Company as at 31.3.2011.
ii) In the case of the Profit & Loss Account of the PROFIT
of the Company for the year ended on that date.
iii) In case of Cash Flow Statement of the cash flow of
the Company for the year ended on that date.
For O. P. Bagla & Co.
Chartered Accountants
O. P. Bagla
Partner
Place : New Delhi Membership No. 8858
Dated : 30 April 2011 Firm Registration No. 000018N
To
The Members of
Kajaria Ceramics Limited
Auditors’ Report

56 Kajaria Ceramics Limited
Annexure to the Auditors’ Report
1. a) The Company has maintained proper records to showfull particulars including quantitative details andsituation of fixed assets.
b) As explained to us, all the fixed assets have beenphysically verified by the management in a phasedperiodical manner, which in our opinion is reasonable,having regard to the size of the Company and natureof its assets. No material discrepancies were noticed onsuch physical verification.
c) In our opinion, the Company has not disposed off asubstantial part of its fixed assets during the year andthe going concern status of the Company is notaffected.
2. a) Physical verification has been conducted by themanagement at reasonable intervals in respect offinished goods, stores, spare parts and raw materials.We were informed that physical verification of clay wasmade on the basis of volume and density which isapproximately correct.
b) In our opinion and according to the information andexplanation given to us, the procedure of physicalverification of these stocks followed by themanagement is reasonable and adequate in relation tothe size of the Company and the nature of its business.
c) In our opinion the Company is maintaining properrecords of inventories. The discrepancies noticed onsuch verification between the physical stocks and bookrecords were not significant and the same has beenproperly dealt with in the books of account.
3. The Company has not granted any loan to Companies, firmsor other parties covered in the register maintained undersection 301 of the Act, except an interest free loan of`10.54 million given to a Subsidiary Company. As per theinformation and explanations given to us, the terms andconditions of the loan are not Prima facie prejudicial to theinterest of Company. There are no overdue balancesoutstanding in relation to the loans as on 31.03.2011.
4. The Company has not taken any loan from Companies,firms or other parties covered in the register maintainedunder section 301 of the Act.
5. In our opinion and according to the information andexplanations given to us there is an adequate internalcontrol system commensurate with the size of the Companyand the nature of its business with regard to purchase ofinventories, fixed assets and with regard to the sale ofgoods and services. During the course of audit, we havenot observed any continuing failure to correct majorweaknesses in internal control system.
6. a) In our opinion and according to information andexplanations given to us the transactions that neededto be entered in the register maintained under section301 of the Act have been entered in the register.
b) In our opinion, the transactions made in pursuance ofcontracts/ arrangements entered in the registermaintained under Section 301 of the CompaniesAct,1956 and exceeding the value of `500000 inrespect of each party during the year have been madeat prices which appear reasonable as per informationavailable with the Company.
7. In our opinion and according to the information andexplanations given to us, the Company has not acceptedany deposits within the meaning of provisions of section58A, 58AA or any other relevant provisions of theCompanies Act, 1956 and the Companies (Acceptance ofDeposits) Rules, 1975.
8. In our opinion and according to the information andexplanations given to us, the Company has adequateinternal audit system commensurate with its size and natureof its business.
9. We are informed that the Central Government has notprescribed the maintenance of cost records under section209(1)(d) of the Companies Act, 1956 for the products ofthe Company.
10. a) As per information and explanations given to us theCompany has been regular in depositing theundisputed statutory dues including Provident Fund,Investor Education and Protection Fund, EmployeesState Insurance, Income Tax, Sales Tax, Wealth Tax,Service Tax, Custom Duty, Excise Duty, Cess, Octroi,Entry Tax and other statutory dues with theAppropriate Authorities. There are no undisputed
Annexure referred to in paragraph 1 of the Auditors’ Report on Accounts for the year ended 31st March 2011

57Annual Report 2010-11
statutory dues at the year end outstanding for a periodof more than six months from the date they becomepayable.
b) We have been informed that disputed demands of`60.12 million in respect of Sales Tax and Service Taxare pending in appeals with the CommissionerAppeals/High Court as per details below:
Particulars Amt Remarks
Demanded
Sales Tax Cases 1040103 Appeals pending with
Commissioner (Appeals)
Customs Duty 140165 Appeal pending with
Commissioner (Appeals)
Entry Tax 55628781 Appeal pending with
High Court, Rajasthan
Service Tax 346927 Appeal pending with
High Court, Rajasthan
Service Tax 2961472 Appeal pending with
Commissioner, Central
Excise, Jaipur
11. There are no accumulated losses of the Company as at theend of the year. The Company has not incurred cash lossesduring the financial year covered by our audit and in theimmediately preceding financial year.
12. Based on our audit procedures and on the basis ofinformation and explanations given to us by themanagement, we are of the opinion that there is no defaultin repayment of dues to the Financial Institutions, Banks ordebenture holders as at the year end.
13. The Company has not granted any loans and advances onthe basis of security by way of pledge of shares, debenturesand other securities. Hence paragraph 4 (xii) of the order isnot applicable.
14. In our opinion, the Company is not a chit fund/ nidhi/mutual benefit fund/ society. Therefore, the provisions ofclause (xiii) of paragraph 4 of the order are not applicableto the Company.
15. According to information and explanations given to us theCompany has given a guarantee for loan taken by an
associate amounting to `50 million from bank and in ouropinion, the terms and conditions of the same are notprejudicial to the interest of the Company.
16. According to the information and explanations given to usthe term loans taken by the Company have been appliedfor the purposes for which the loans were obtained.
17. According to the information and explanations given to usand on overall examination of the Balance Sheet of theCompany, we are of the opinion that the funds raised onshort term basis have not been utilized for long terminvestment.
18. During the year the Company has not made any preferentialallotment of shares to parties and Companies covered inthe Register maintained u/s 301 of the Companies Act1956. As such paragraph 4 (xviii) of the order is notapplicable.
19. Since the Company has not raised money by way of PublicIssue during the year paragraph 4 (xx) of the order is notapplicable.
20. Based upon the audit procedures performed andinformation and explanations given by the management,we report that, no fraud on or by the Company has beennoticed or reported during the course of our audit for theyear ended 31.03.2011.
21. Other clauses of the order are not applicable to theCompany for the year under report.
For O. P. Bagla & Co.Chartered Accountants
O. P. Bagla
Partner
Place : New Delhi Membership No. 8858
Dated : 30 April 2011 Firm Registration No. 000018N

58 Kajaria Ceramics Limited
Balance Sheet As at 31st March 2011
In terms of our report of even date Annexed For and on behalf of the Board
For O. P. Bagla & Co. D. P. BagchiChartered Accountants R. K. Bhargava
R. R. BagriO. P. Bagla Ashok Kajaria B. K. Sinha R. C. RawatPartner Chairman & Managing Director Directors Sr. Vice President (A & T) &Membership No.: 8858 Company Secretary
Chetan KajariaPlace: New Delhi Rishi KajariaDated: 30 April 2011 Jt. Managing Directors
(` in million)
Schedules 31.03.2011 31.3.2010
SOURCE OF FUNDS
Shareholders' Funds
Share Capital 1 147.17 147.17
Reserves and Surplus 2 2,078.46 1,746.23
2,225.63 1,893.40
Loan Funds
Secured Loans 3 2,756.79 2,588.28
Unsecured Loans 4 40.00 40.00
2,796.79 2,628.28
Deferred Tax Liabilities 5 601.91 548.52
Total 5,624.33 5,070.20
APPLICATION OF FUNDS
Fixed Assets
Gross Block 6 6,999.88 5,435.46
Less : Depreciation 2,209.49 1,987.57
Net Block 4,790.39 3,447.89
Capital Work-in-Progress 0.63 25.43
4,791.02 3,473.32
Investments 7 90.14 33.94
Current Assets, Loans & Advances
Inventories 8 1,515.11 1,402.55
Sundry Debtors 9 909.04 773.21
Cash and Bank Balances 10 29.92 44.91
Loans and Advances 11 808.43 755.76
3,262.50 2,976.43
Less : Current Liabilities & Provisions
Current Liabilities 12 2,129.89 1,197.69
Provisions 13 389.44 215.80
2,519.33 1,413.49
Net Current Assets 743.17 1,562.94
Total 5,624.33 5,070.20
Significant Accounting Policies and Notes on Accounts 22

59Annual Report 2010-11
Profit and Loss Account For the year ended 31st March 2011
In terms of our report of even date Annexed For and on behalf of the Board
For O. P. Bagla & Co. D. P. BagchiChartered Accountants R. K. Bhargava
R. R. BagriO. P. Bagla Ashok Kajaria B. K. Sinha R. C. RawatPartner Chairman & Managing Director Directors Sr. Vice President (A & T) &Membership No.: 8858 Company Secretary
Chetan KajariaPlace: New Delhi Rishi KajariaDated: 30 April 2011 Jt. Managing Directors
(` in million)
Schedules 31.03.2011 31.3.2010
INCOMESales ( Gross ) 10,045.71 7,667.54 Less: Excise Duty on Sales 522.26 312.18
9,523.45 7,355.36 Other Income 14 10.73 7.45
9,534.18 7,362.81 EXPENDITUREMaterial Manufacturing & Other Expenses 15 6,410.40 4,811.17 Increase/Decrease in Stocks 16 39.22 (2.75)Salaries, Wages and Amenities 17 758.07 612.84 Repairs and Maintenance 18 54.84 51.63 Administrative & Other Expenses 19 356.49 297.99 Selling & Distribution Expenses 20 429.83 435.21 Financial Charges 21 298.56 375.24 Depreciation 294.99 267.06 Sales Tax of earlier years 103.37 Less: Transferred from General Reserve (See Note 17 of Schedule 22) 103.37 – –
8,642.40 6,848.39 Profit Before Tax 891.78 514.42Provisions for:Income Tax 218.40 130.00Deferred Tax 53.39 13.97Income Tax / Wealth Tax Adjustment 13.35 11.93Profit After Tax 606.64 358.52Balance as per last year 994.15 819.03Profit Available For Appropriation 1,600.79 1,177.55APPROPRIATIONSProposed Dividend on Equity Shares 147.17 73.58Corporate Dividend Tax 23.87 12.22Transfer to General Reserve 200.00 100.00 Transfer from Debenture Redemption Reserve (46.04) (2.40)Surplus Carried Over 1,275.79 994.15
1,600.79 1,177.55Basic/Diluted Earnings per share (`) 8.24 4.87Significant Accounting Policies and Notes on Accounts 22

60 Kajaria Ceramics Limited
Schedules forming part of the Accounts As at 31st March 2011
(` in million)
31.03.2011 31.03.2010
Authorised125,000,000 (125,000,000) Equity Shares of `2/- each 250.00 250.00
10,00,000 (10,00,000) Preference of Shares `100/- each 100.00 100.00 350.00 350.00
Issued, Subscribed & Paid up73,583,580 (73,583,580) Equity Shares of `2/- each fully paid up in cash 147.17 147.17
147.17 147.17
A. Capital ReserveShare Premium 142.35 142.35
B. Debenture Redemption ReserveBalance B/F 46.04 48.44 Less : Written Back (46.04) (2.40)
– 46.04 C. General Reserve 513.69 413.69
Less: Transferred to Profit & Loss Account (103.37) – Add : Transferred During the Year 200.00 100.00
610.32 513.69 D. Capital Redemption Reserve 50.00 50.00 E. Profit & Loss Account 1,275.79 994.15
2,078.46 1,746.23
SCHEDULE 2 RESERVES AND SURPLUS
A. DebenturesNon Convertible Debentures – 46.04
B. Term loans- From Financial Institutions – 290.00 - From Banks 1,734.48 1,314.09 - Car loan from Others 21.93 30.81
C. Working Capital FacilitiesFrom Banks 1,000.38 907.34
2,756.79 2,588.28
Notes :1. Term loans from Financial Institutions & Banks are secured by 1st charge on immovable and movable assets (present and future)
of the Company situated at Sikandrabad Industrial Area (UP) and Village Gailpur (Rajasthan) (subject to prior charges on movablesin favour of banks) ranking pari-pasu with the charges created in favour of participating Financial Institutions and Banks andfurther guaranteed by the Managing Director of the Company.
2. Working Capital Facilities from Banks are secured by 1st charge on inventories and book debts and second charge on immovableand movable assets of the Company ranking pari passu amongst the Banks and further guaranteed by the Managing Directorof the Company.
3. Car Loan from others ` 21.93 million are secured against respective cars.
SCHEDULE 3 SECURED LOANS
SCHEDULE 1 SHARE CAPITAL

61Annual Report 2010-11
Schedules forming part of the Accounts As at 31st March 2011
(` in million)
31.03.2011 31.03.2010
Short Term Loans & Advances - From Companies 40.00 40.00
40.00 40.00
SCHEDULE 4 UNSECURED LOANS
31.03.2011 31.03.2010
Investment in Equity Shares - Long Term (At Cost)(Other than trade)Quoted3,00,000 Equity Shares of Regency Trust Ltd. of `10/- each (Note: Market Value `270.00 Lacs) 4.50 4.50 Unquoted29,39,500 Equity Shares of Kajaria Plus Pvt. Ltd. of `10/- each fully paid up 29.44 29.44 In Subsidiary Company15,30,000 Equity Shares of M/s Soriso Ceramic Pvt. Ltd. of `10/- each fully paid up 56.20 –
90.14 33.94
SCHEDULE 7 INVESTMENTS
Deferred tax Liability As at 1st April 2010 548.52 534.55 Additional adjustment for current year 53.39 13.97
601.91 548.52
SCHEDULE 5 DEFERRED TAX LIABILITIES
(As certified by the Management)Raw Materials 251.40 149.65 Stores and Spares 205.85 155.83 Finished Goods 989.98 1,036.20 Work-in-Process 67.88 60.87
1,515.11 1,402.55
SCHEDULE 8 INVENTORIES
SCHEDULE 6 FIXED ASSETS
PARTICULARS GROSS BLOCK DEPRECIATION NET BLOCK
As at Additions Sale/ As at Upto For the Sale/ Upto As at As at
1.4.2010 Transfer 31.3.2011 31.3.2010 year Transfer 31.3.2011 31.3.2011 31.3.2010
Land and Site Development 105.60 – – 105.60 – – – – 105.60 105.60
Building 947.23 438.66 – 1,385.89 270.16 31.68 – 301.84 1,084.05 677.07
Plant & Machinery 4,108.90 1,191.25 76.87 5,223.28 1,594.02 233.23 64.80 1,762.46 3,460.82 2,514.89
Furniture and Fixtures 54.01 4.60 5.68 52.94 29.38 3.27 4.23 28.42 24.51 24.63
Vehicles 92.51 19.88 6.10 106.29 18.69 9.27 2.49 25.46 80.83 73.82
Fixed Assets - Sales Outlet 127.21 1.32 2.65 125.88 75.32 17.54 1.55 91.31 34.57 51.89
Current Year 5,435.47 1,655.71 91.30 6,999.88 1,987.57 294.99 73.07 2,209.49 4,790.39 3,447.91
Previous Year 5,014.92 451.10 30.55 5,435.46 1,738.39 267.06 17.88 1,987.57 3,447.90 3,276.53

62 Kajaria Ceramics Limited
Schedules forming part of the Accounts As at 31st March 2011
(` in million)
31.03.2011 31.03.2010
a) Debts outstanding for a period exceeding six months- Considered Good 27.41 34.63 - Considered Doubtful 22.41 30.86
b) Other Debts - Considered Good 860.41 708.65 - Considered Doubtful 0.01 0.27
910.24 774.41 Less: Provision for Doubtful Debts 1.20 1.20
909.04 773.21
SCHEDULE 9 SUNDRY DEBTORS (UNSECURED)
Cash in hand and imprest 4.03 5.71 Balance with Scheduled Banks- in current account 22.31 35.62 - in Margin / FDR 3.58 3.58
29.92 44.91
SCHEDULE 10 CASH AND BANK BALANCES
Income Tax 218.40 130.00 Proposed Dividend 147.17 73.58 Corporate Dividend Tax 23.87 12.22
389.44 215.80
SCHEDULE 13 PROVISIONS
(Unsecured Considered Good)Loans- To Subsidiary 10.54 – - To Others – 6.00 Advances recoverable in cash or kind or for value to be received 310.25 378.65 Balance With Excise Authorities 86.19 32.97 Exports Benefit Accrued 4.47 6.20 Security Deposits- With Govt. Deptts. 21.53 28.92 - With Others 180.48 178.30 Prepaid Expenses 9.54 6.24 Income Tax 185.43 118.48
808.43 755.76
SCHEDULE 11 LOANS & ADVANCES
Sundry Creditors - Micro, Small & Medium Enterprises 10.30 – - Others 1,955.69 1,024.66
Investors Education & Protection Fund- Unclaimed Dividend 3.17 2.28
Other Liabilities 120.65 132.75 Interest accrued but not due 0.47 2.05 Security Deposits 39.61 35.95
2,129.89 1,197.69
SCHEDULE 12 CURRENT LIABILITIES
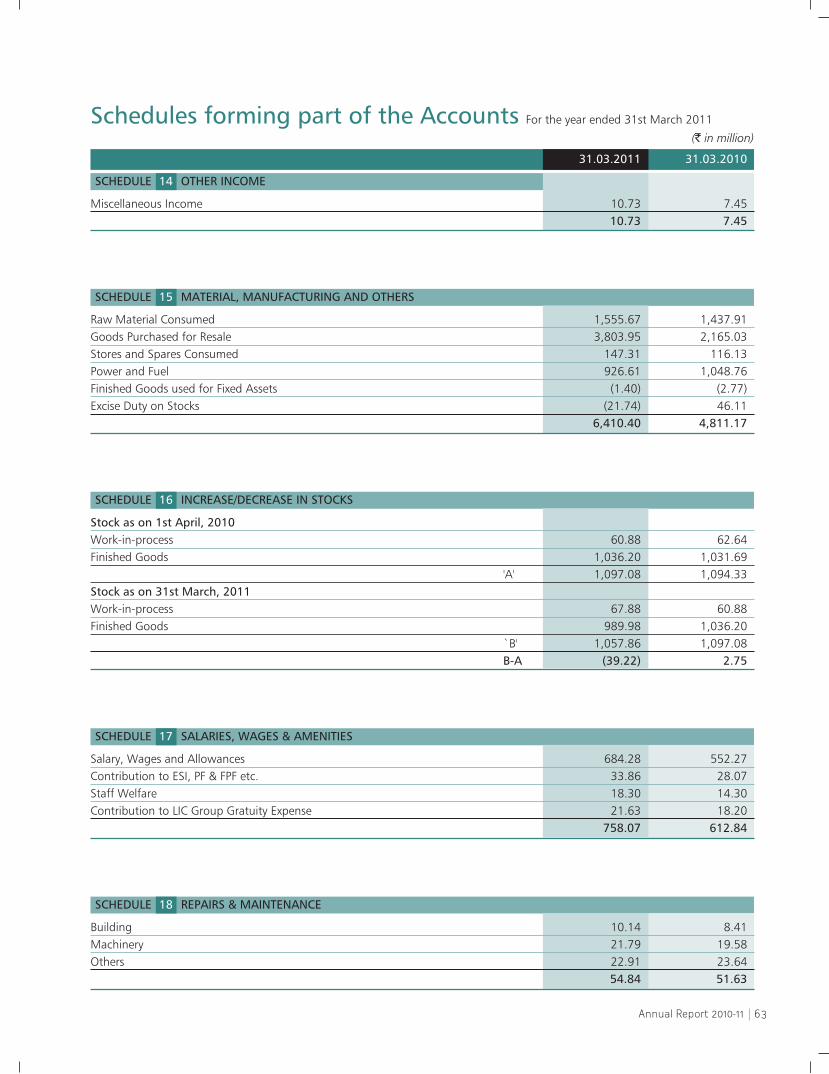
63Annual Report 2010-11
Schedules forming part of the Accounts For the year ended 31st March 2011
(` in million)
31.03.2011 31.03.2010
Miscellaneous Income 10.73 7.45 10.73 7.45
SCHEDULE 14 OTHER INCOME
Salary, Wages and Allowances 684.28 552.27 Contribution to ESI, PF & FPF etc. 33.86 28.07 Staff Welfare 18.30 14.30 Contribution to LIC Group Gratuity Expense 21.63 18.20
758.07 612.84
SCHEDULE 17 SALARIES, WAGES & AMENITIES
Stock as on 1st April, 2010Work-in-process 60.88 62.64 Finished Goods 1,036.20 1,031.69
'A' 1,097.08 1,094.33 Stock as on 31st March, 2011Work-in-process 67.88 60.88 Finished Goods 989.98 1,036.20
`B' 1,057.86 1,097.08 B-A (39.22) 2.75
SCHEDULE 16 INCREASE/DECREASE IN STOCKS
Raw Material Consumed 1,555.67 1,437.91 Goods Purchased for Resale 3,803.95 2,165.03 Stores and Spares Consumed 147.31 116.13 Power and Fuel 926.61 1,048.76 Finished Goods used for Fixed Assets (1.40) (2.77)Excise Duty on Stocks (21.74) 46.11
6,410.40 4,811.17
SCHEDULE 15 MATERIAL, MANUFACTURING AND OTHERS
Building 10.14 8.41 Machinery 21.79 19.58 Others 22.91 23.64
54.84 51.63
SCHEDULE 18 REPAIRS & MAINTENANCE

64 Kajaria Ceramics Limited
Schedules forming part of the Accounts For the year ended 31st March 2011
(` in million)
31.03.2011 31.03.2010
Printing, Stationery & EDP Expenses 7.58 6.96 Rent, Rates & Taxes 93.23 88.62 Vehicle Expenses 14.44 12.78 Communication Expenses 37.04 32.99 Traveling & Conveyance Expenses 113.78 88.24 Insurance Charges 10.80 8.75 Legal & Professional Charges 9.22 13.78 Loss on Sale / Scrapping of Fixed Assets 15.97 6.65 Directors Sitting Fees 0.92 0.40 Auditors' Remuneration :- As Audit Fees 1.00 0.75 - For Tax Audit, Certification & Tax Representations 1.14 0.62 - For Other matters 0.73 0.51 - For Reimbursement of Expenses – 0.03 Miscellaneous Expenses 32.84 23.69 Share Transfer Expenses 0.18 0.13 Electricity & Water Charges 13.46 11.94 Foreign Technician Expenses 0.15 0.05 Social Relief & Welfare Expenses 3.58 0.28 Research & Development Expenses 0.43 0.82
356.49 297.99
SCHEDULE 19 ADMINISTRATIVE & OTHER EXPENSES
Interest on Fixed Loans 162.79 241.00 Interest on others (Net) 125.66 143.84 Exchange Difference (32.45) (49.45)Bank & Other Charges 42.56 39.85
298.56 375.24
SCHEDULE 21 FINANCIAL CHARGES
Packing Freight & Forwarding Expenses 113.92 179.21 Advertisement, Publicity & Sales Promotion 163.11 128.20 Commission 152.80 127.80
429.83 435.21
SCHEDULE 20 SELLING & DISTRIBUTION EXPENSES

65Annual Report 2010-11
Schedules forming part of the Accounts
A. SIGNIFICANT ACCOUNTING POLICIES1. Basis of Accounting:
The Company prepares its financial statements in accordance with applicable accounting standards and generally acceptedaccounting principles and also in accordance with the requirements of the Companies Act, 1956.
2. Income and Expenditure:Accounting of Income & Expenditure is done on accrual basis.
3. Fixed Assets & Depreciation:a) Fixed assets are stated at their original cost of acquisition inclusive of inward freight, duties and expenditure incurred
in the acquisition, construction/installation.
b) In case of assets acquired out of foreign currency loans, the increase/decrease in liability on account of fluctuation inexchange rates has been charged to Profit & Loss Account.
c) Depreciation is charged on Straight Line Method (SLM) at the rates provided in Schedule XIV of the Companies Act,1956. Continuous process plant as defined in Schedule XIV has been considered on technical evaluation. In case ofassets of sale outlets of dealers, depreciation is charged @ 20% on SLM basis. Assets costing upto `5,000/- are fullydepreciated in the year of purchase.
d) CENVAT credit availed on capital equipment is accounted for by credit to respective fixed assets.
e) Capital Work-in-progress includes project advances pending execution.
4. Investments:Long term investments are stated at cost.
5. Inventories:Inventories are valued on the following basis:a) Stores and Spares - at moving weighted average basis.
b) Raw Materials - at moving weighted average basis.
c) Work-in-Process - at estimated cost.
d) Finished Goods - at lower of cost or estimated realisable value.
e) Material in Transit - at cost.
6. Excise & Custom Duty:a) Custom Duty is accounted for at the time receipt of goods in custom warehouse.
b) CENVAT Credit, to the extent availed, is adjusted towards cost of materials.
7. Sales:Sales are inclusive of excise duty and after deducting VAT and discounts. Discounts are recognised when substantially allconditions appurtenant thereto have been fulfilled.
8. Foreign Currency Transactions:a) Transactions denominated in foreign currencies are recorded at the exchange rates prevailing on the date of the
transaction or that approximates the actual rate at the date of the transaction.
b) Monetary items denominated in foreign currencies at the year end are restated at year end rates, except in cases coveredby forward exchange contracts.
c) Any income or expense on account of exchange difference either on settlement or on translation is recognised in theProfit and Loss Account.
9. Export Benefits:Export Benefits in respect of unutilised Advance Licences under DEPB Scheme are accounted for in the year of Export to theextent of duty leviable on imports to be made in future. The consumption of Raw Material, Stores and other inputs and thevaluation of closing stock are stated net of such export benefits.
SCHEDULE 22 ACCOUNTING POLICIES AND NOTES ON ACCOUNTS

66 Kajaria Ceramics Limited
Schedules forming part of the Accounts
10. Employee Benefits:a) Short term employee benefits are recognized as an expense at the undiscounted amount in the Profit and Loss Account
of the year in which the related service is rendered.
b) Gratuity liability has been provided on the basis of actuarial valuation.
11. Research & Development:Revenue Expenditure on research and development is charged to Profit & Loss Account in the year in which it is incurred.Capital Expenditure on research and development is treated as additions to Fixed Assets in case the same qualifies as anintangible asset as per AS – 26 issued by ICAI.
12. Provision, Contingent Liabilities and Contingent Assets:Provisions involving substantial degree of estimation in measurement are recognized when there is a present obligation asa result of past events and it is probable that there will be an outflow of resources. Contingent liabilities are not recognisedbut are disclosed in the notes. Contingent assets are neither recognised nor disclosed in the financial statements.
13. Sundry Debtors:Sundry Debtors are shown net of bills discounted.
14. Dividend received is accounted for as and when it is declared.
15. Unless specifically stated to be otherwise, these policies are consistently followed.
B. NOTES ON ACCOUNTS (` in million)
As at As at 31.03.2011 31.03.2010
1. Estimated amount of contracts remaining to be executed on Capital Account and not provided for (Net of advances) 3.96 136.41
2. Letters of Credit opened in favour of inland/overseas suppliers (Net) 1623.52 942.423. Contingent Liabilities not provided for
(excluding matters separately dealt with in the notes):a) In respect of Bills discounted With the Company’s Bankers 34.23 72.48b) Counter guarantees issued in respect of guarantees
issued by Company’s bankers 8.76 29.69c) Guarantees issued on behalf of limited Companies 50.00 50.00d) In respect of Excise Duty, Sales Tax, Service Tax, Custom Duty demands
pending before various authorities and in dispute 60.12 57.88e) Export Obligation under EPCG scheme – 2.69f) In respect of disputed Electricity demand pending with Appellate
Authorities and other consumer cases. 4.68 4.54
SCHEDULE 22 ACCOUNTING POLICIES AND NOTES ON ACCOUNTS (Contd.)
4. Details of Raw Material Consumed:
2010-11 2009-10
Unit Qty Value Qty Value(` million) (` million)
a) Body Materials MT 348115 524.29 334158 352.98b) Glaze, Frits & Chemicals MT 21516 717.03 24959 830.12c) Packing Materials NOs 19290850 314.36 21243141 254.80
1555.68 1,437.91

67Annual Report 2010-11
Schedules forming part of the Accounts
6. Salary includes following remuneration to the Managing Director, Jt. Managing Director & Whole Time Director:(` in million)
Year ended Year ended 31.03.2011 31.03.2010
- Salary 17.09 7.81- Perquisites 13.21 5.72- Contribution to Provident Fund – 0.33
5. Particulars of Sales & Stock:
2010-11 2009-10
Unit Qty Value Qty Value(million) (` million) (million) (` million)
a) Opening StockTiles Sq. Mtrs 3.90 1036.20 3.81 1031.69
b) PurchasesTiles Sq. Mtrs 9.64 3803.95 5.31 2165.03
c) SalesTiles Sq. Mtrs 29.71 10033.46 25.28 7653.55Power 12.25 13.99
d) Closing StockTiles Sq. Mtrs 3.13 989.98 3.90 1036.20
Sales Quantity includes goods used for sampling & own consumption.
SCHEDULE 22 ACCOUNTING POLICIES AND NOTES ON ACCOUNTS (Contd.)
7. Details of registered & installed capacities and production:
Unit 2010-11 2009-10 (million)
a) Registered Capacity Sq Mtrs N.A. N.A.b) Installed Capacity*
- Tiles Sq Mtrs 28.30 23.40c) Production
- Tiles Sq Mtrs 19.30 20.06
* As certified by the Management and relied on by the Auditors being a technical matter.
8. Value of Imports on CIF basis: (` in million)
2010-11 2009-10
• Capital Goods 572.83 163.02• Raw Materials 105.87 146.62• Spares and Consumables 95.20 46.72• Traded Goods 2176.18 1107.02
9. A) Expenditure in Foreign Currency (on accrual basis): (` in million)
2010-11 2009-10
a) Interest on FC Loan 17.07 13.82b) Commission of Export Sales 0.79 7.85c) Others including travel etc. 22.29 15.74
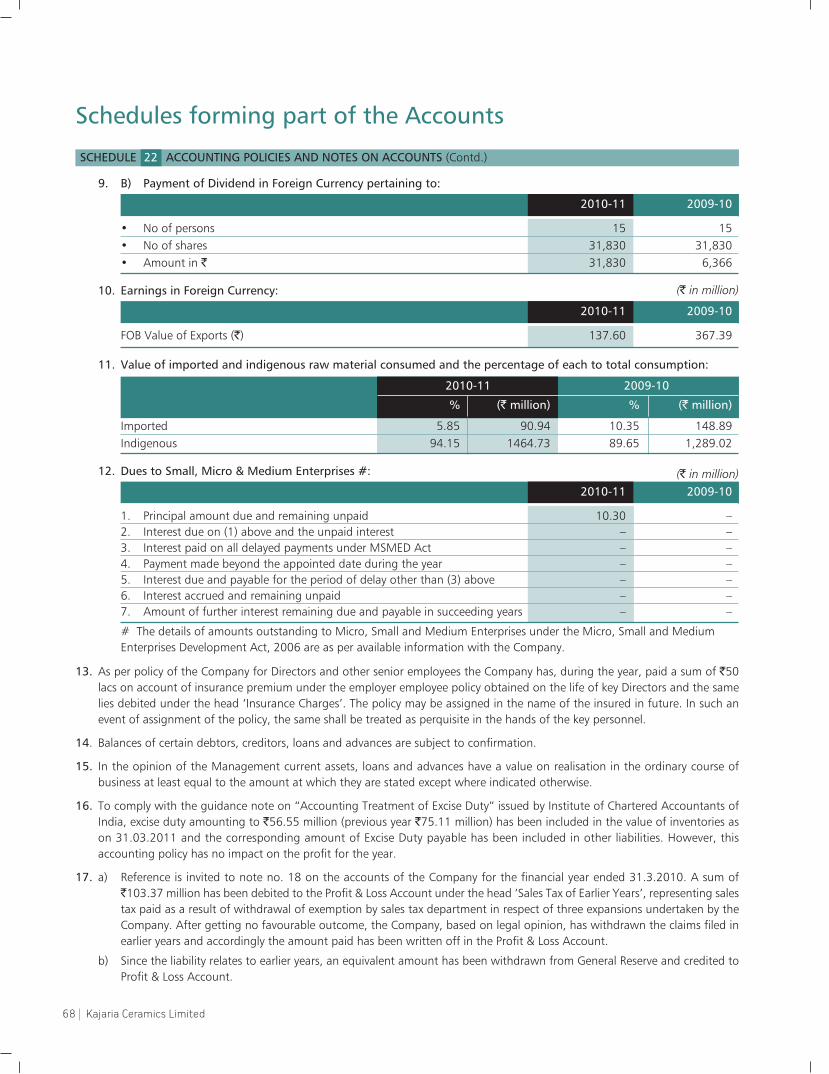
68 Kajaria Ceramics Limited
Schedules forming part of the Accounts
9. B) Payment of Dividend in Foreign Currency pertaining to:
2010-11 2009-10
• No of persons 15 15• No of shares 31,830 31,830• Amount in ` 31,830 6,366
10. Earnings in Foreign Currency: (` in million)
2010-11 2009-10
FOB Value of Exports (`) 137.60 367.39
12. Dues to Small, Micro & Medium Enterprises #: (` in million)2010-11 2009-10
1. Principal amount due and remaining unpaid 10.30 –2. Interest due on (1) above and the unpaid interest – –3. Interest paid on all delayed payments under MSMED Act – –4. Payment made beyond the appointed date during the year – –5. Interest due and payable for the period of delay other than (3) above – –6. Interest accrued and remaining unpaid – –7. Amount of further interest remaining due and payable in succeeding years – –
# The details of amounts outstanding to Micro, Small and Medium Enterprises under the Micro, Small and MediumEnterprises Development Act, 2006 are as per available information with the Company.
11. Value of imported and indigenous raw material consumed and the percentage of each to total consumption:
2010-11 2009-10
% (` million) % (` million)
Imported 5.85 90.94 10.35 148.89Indigenous 94.15 1464.73 89.65 1,289.02
13. As per policy of the Company for Directors and other senior employees the Company has, during the year, paid a sum of `50lacs on account of insurance premium under the employer employee policy obtained on the life of key Directors and the samelies debited under the head ‘Insurance Charges’. The policy may be assigned in the name of the insured in future. In such anevent of assignment of the policy, the same shall be treated as perquisite in the hands of the key personnel.
14. Balances of certain debtors, creditors, loans and advances are subject to confirmation.
15. In the opinion of the Management current assets, loans and advances have a value on realisation in the ordinary course ofbusiness at least equal to the amount at which they are stated except where indicated otherwise.
16. To comply with the guidance note on “Accounting Treatment of Excise Duty” issued by Institute of Chartered Accountants ofIndia, excise duty amounting to `56.55 million (previous year `75.11 million) has been included in the value of inventories ason 31.03.2011 and the corresponding amount of Excise Duty payable has been included in other liabilities. However, thisaccounting policy has no impact on the profit for the year.
17. a) Reference is invited to note no. 18 on the accounts of the Company for the financial year ended 31.3.2010. A sum of`103.37 million has been debited to the Profit & Loss Account under the head ‘Sales Tax of Earlier Years’, representing salestax paid as a result of withdrawal of exemption by sales tax department in respect of three expansions undertaken by theCompany. After getting no favourable outcome, the Company, based on legal opinion, has withdrawn the claims filed inearlier years and accordingly the amount paid has been written off in the Profit & Loss Account.
b) Since the liability relates to earlier years, an equivalent amount has been withdrawn from General Reserve and credited toProfit & Loss Account.
SCHEDULE 22 ACCOUNTING POLICIES AND NOTES ON ACCOUNTS (Contd.)

69Annual Report 2010-11
Schedules forming part of the Accounts
(` in million)
Particulars 31.03.2011 31.03.2010
Current Service cost 7.18 4.37Interest cost on benefit obligation 3.99 3.12Net actuarial loss recognised in the year 4.80 9.59Past service cost 6.80 –Expected Return on Plan Assets (1.15) –Net benefit expense 21.62 17.08
Balance SheetDetails of provision for Gratuity (` in million)
Particulars 30.03.2011 31.03.2010
Defined benefit obligation 42.16 35.54Less: Unrecognised past service cost – –Plan liability 42.16 35.54
18. Gratuity And Other Post-Employment Benefit Plans:The Company has a defined benefit gratuity plan. Gratuity (being administered by a Trust) is computed as 15 days salary, forevery completed year of service or part thereof in excess of 6 months and is payable on retirement / termination / resignation.The benefit vests on the employee completing 5 years of service. The Gratuity plan for the Company is a defined benefit schemewhere annual contributions are deposited to a Gratuity Trust Fund established to provide gratuity benefits. The Trust Fund hastaken a Scheme of Insurance, whereby these contributions are transferred to the insurer. The Company makes provision of suchgratuity asset/liability in the books of accounts on the basis of actuarial valuation as per the Projected unit credit method. Planassets also include investments and bank balances used to deposit premiums until due to the insurance Company.
The following tables summarize the components of net benefit expense recognised in the Profit and Loss Account and thefunded status and amounts recognised in the Balance Sheet for the plan:
Profit and Loss accountNet employee benefit expense (recognised in Employee cost)
Changes in the present value of the defined benefit obligation are as follows: (` in million)
Particulars 31.03.2011 31.03.2010
Defined benefit obligation as at 1st April 2010 49.91 34.67Interest Cost 3.99 3.12Current service cost 7.18 4.37Benefit paid (5.04) (0.03)Past Service Cost – Vested Benefit 6.80 –Actuarial losses on obligation 4.93 7.77Defined benefit obligation as at 31st March, 2011 67.77 49.91
Changes in the fair Value of plan assets are as follows: (` in million)
Particulars 31.03.2011 31.03.2010
Fair value of plan assets as at 1st April, 2010 14.37 11.00Expected return 1.15 1.30Contributions by employer 15.00 5.20Benefits paid (5.04) (0.03)Actuarial Gains / (Losses) 0.12 (3.11)Fair value of plan assets as at 31st March, 2011 25.60 14.37
SCHEDULE 22 ACCOUNTING POLICIES AND NOTES ON ACCOUNTS (Contd.)

70 Kajaria Ceramics Limited
Schedules forming part of the Accounts
The principal assumption used in determining gratuity benefit obligations for the Company’s plans are shown below:
(` in million)
Particulars 31.03.2011 31.03.2010
Discount rate 8.25% 8.00%Expected rate of return on plan assets 8.00% 6.00%Salary Escalation 7.75% 7.00%Attrition Rate 1.00% 1.00%
The estimates of future salary increases, considered in actuarial valuation, take account of inflation, seniority, promotion andother relevant factors, such as supply and demand in the employment market.
19. Tax Expense is the aggregate of current year income tax and deferred tax charged to the Profit and Loss Account for the year. a) Current Year Charge:
Income Tax provision of `218.40 million has been made on regular income.
b) Deferred Tax:The Company estimates the deferred tax charge using the applicable rate of taxation based on the impact of timingdifferences between financial statements and estimated taxable income for the current year. The movement of provisionfor deferred tax is given below:
Particulars Opening as at Charge/(credit) Closing as at1.04.2010 during the year 31.03.2011
Depreciation 548.52 53.39 601.91Net Deferred Tax Liability 548.52 53.39 601.91
20. Related Party Disclosures:In accordance with the Accounting Standards (AS-18) on Related Party Disclosures, where control exists and where keymanagement personnel are able to exercise significant influence and, where transactions have taken place during the year,alongwith description of relationship as identified, are given below:-
A. RelationshipsI. Key Management Personnel:Name Designation
Sh. Ashok Kajaria Chairman & Managing DirectorSh. Chetan Kajaria Joint Managing DirectorSh. Rishi Kajaria Joint Managing DirectorSh. B.K. Sinha Director Technical
II. Relatives of Key Management Personnel:Smt. Versha Devi KajariaSh. A.K. Kajaria (HUF)
III. Associates/Enterprises over which key management personnel are able to exercise significant influence:Kajaria Plus Pvt LtdKajaria Vision Pvt Ltd Dua Engineering Works Pvt Ltd
IV. Subsidiary CompanySoriso Ceramic Pvt Ltd
B. The following transactions were carried out with related parties in the ordinary course of business:
Related Party Transactions Key Management Subsidiary OthersPersonnel & Relatives
Purchase of Raw Material, Goods & Services – 55.14 10.15Rent Paid – – 3.71Remuneration 30.30 – –Investment in shares – 56.20 –Loan Given – 10.54 –
(` in million)
SCHEDULE 22 ACCOUNTING POLICIES AND NOTES ON ACCOUNTS (Contd.)

71Annual Report 2010-11
Schedules forming part of the Accounts
C. Outstanding balance and balance written off/written back:
As at 31.03.11 As at 31.03.10 As at 31.03.11 As at 31.03.10
Key Management Personnel & Relatives – – – – 7.89Subsidiary 10.54 – – – 10.54Others – 57.90 – – 0.40
Outstanding Balances Written off/Written back Maximum DebitBalances
(` in million)
21. Segmental Reporting:The business activity of the Company falls within one broad business segment viz “Ceramic Tiles” and substantially sale of theproduct is within the country. The Gross income and profit from the other segment is below the norms prescribed in AS-17 ofThe Institute of Chartered Accountants of India. Hence the disclosure requirement of Accounting Standard 17 of “SegmentReporting” issued by the Institute of Chartered Accountants of India is not considered applicable.
22. Pre-operative expenses capitalised to fixed assets:Pre-operative Expenses incurred & capitalized in New Projects during the year are as under:-
24. Previous year figures have been regrouped / recast wherever necessary.
(` in million)
Particulars 31.03.2011
Administrative & Other Expenses 11.94Salary & Wages 7.45Financial Charges 17.01Trial Run 14.89Total 51.29
23. Earnings per share (EPS) – The numerators and denominators used to calculate Basic and Diluted Earning per share:
Year ended Year ended 31.03.2011 31.03.2010
Profit attributable to the Equity Shareholders – (A) (` in millions) 606.64 358.52Basic /Weighted average number of Equity Shares outstanding during the year (B) 7,35,83,580 7,35,83,580Nominal value of Equity Shares (`) 2.00 2.00Basic/Diluted Earnings per share (`) – (A)/(B) 8.24 4.87
Signature to the schedule 1 to 22
In terms of our report of even date Annexed For and on behalf of the Board
For O. P. Bagla & Co. D. P. BagchiChartered Accountants R. K. Bhargava
R. R. BagriO. P. Bagla Ashok Kajaria B. K. Sinha R. C. RawatPartner Chairman & Managing Director Directors Sr. Vice President (A & T) &Membership No.: 8858 Company Secretary
Chetan KajariaPlace: New Delhi Rishi KajariaDated: 30 April 2011 Jt. Managing Directors
SCHEDULE 22 ACCOUNTING POLICIES AND NOTES ON ACCOUNTS (Contd.)

72 Kajaria Ceramics Limited
Balance Sheet Abstract and Company’s General Business Profile(As per Schedule VI, Part (IV) of the Companies Act, 1956)
In terms of our report of even date Annexed For and on behalf of the Board
For O. P. Bagla & Co. D. P. BagchiChartered Accountants R. K. Bhargava
R. R. BagriO. P. Bagla Ashok Kajaria B. K. Sinha R. C. RawatPartner Chairman & Managing Director Directors Sr. Vice President (A & T) &Membership No.: 8858 Company Secretary
Chetan KajariaPlace: New Delhi Rishi KajariaDated: 30 April 2011 Jt. Managing Directors
Public Issue
Bonus Issue
3 1 0 3
Registration No.
Balance Sheet Date
I. Registration Details
II. Capital Raised during the year (Amount in ` millions)
Total Liabilities
III. Position of Mobilisation and Deployment of Funds (Amount in ` millions)
2 0 1 1
Date Month Year
Private Placement
Paid-up Capital
Sources of Funds
Total Assets
Reserves & Surplus
IV. Performance of the Company (Amount in ` millions)
Product Description Item Code No. (ITC Code)
V. Generic Names of Principal Products / Services of Company
Net Fixed Assets Investments
Turnover (Including Other Income)
Profit Before Tax
Total Expenditure
Profit After Tax
Application of Funds
8 1 4 3 . 6 6
L26924UP1985PLC007595
1 4 7 . 1 7
9 5 3 4 . 1 8
8 9 1 . 7 8
8 6 4 2 . 4 0
6 0 6 . 6 4
Earning Per Share (in `.) Dividend Rate (%)
Ceramic Glazed Wall & Floor Tiles
8 . 2 4 1 0 0
6 9 0 8 9 0 9 0
Vetrified Tiles 6 9 0 7 1 0 1 0
4 7 9 0 . 3 9 9 0 . 1 4
Net Current Assets Misc. Expenditure7 4 3 . 1 7 N I L
Accumulated Losses N I LCapital Work in Progress 0 . 6 3
N I L
Rights Issue N I L
State Code 2 0
N I L
N I L
8 1 4 3 . 6 6
2 0 7 8 . 4 6
Secured Loans Unsecured Loans2 7 5 6 . 7 9 4 0 . 0 0
Deferred Tax Liabilities 6 0 1 . 9 1

73Annual Report 2010-11
Cash Flow Statement For the year ended 31st March 2011
In terms of our report of even date Annexed For and on behalf of the Board
For O. P. Bagla & Co. D. P. BagchiChartered Accountants R. K. Bhargava
R. R. BagriO. P. Bagla Ashok Kajaria B. K. Sinha R. C. RawatPartner Chairman & Managing Director Directors Sr. Vice President (A & T) &Membership No.: 8858 Company Secretary
Chetan KajariaPlace: New Delhi Rishi KajariaDated: 30 April 2011 Jt. Managing Directors
(` in million)
31.03.2011 31.03.2010
A. CASH FLOW FROM OPERATING ACTIVITIESNet Profit before tax and extraordinary items 891.77 514.42 Adjusted for :Depreciation 294.99 267.06 Preliminary Expenses W/off – – Investments W/off – – Interest Received – – Interest Paid 288.45 241.00 Dividend Received – – Loss on sale of Fixed Assets 15.97 599.41 6.66 514.72 Operating Profit before Working Capital Changes 1,491.18 1,029.14 Adjusted for :Trade & Other Receivables (121.52) 56.05 Inventories (112.56) (17.98)Trade Payable 932.20 698.12 367.85 405.92 Cash Generated from Operations 2,189.30 1,435.06 Interest Paid (288.45) (241.00)Direct Taxes Paid (210.30) (116.91)Cash Flow before Extraordinary Items – – Extraordinary Items (103.37) (602.12) – (357.91)Net Cash from operating activities 1,587.18 1,077.15
B. CASH FLOW FROM INVESTING ACTIVITIESPurchase of Fixed Assets (1,630.93) (476.52)Sale of Fixed Assets 2.26 6.02 Acquisitions of Companies – – Purchase of Investments (56.20) – Sale of Investments – – Interest Received – – Dividend Received – – Net Cash used in Investing Activities (1,684.87) (470.50)
C. CASH FLOW FROM FINANCING ACTIVITIESProceeds from Issue of Share Capital – – Proceeds from Long Term Borrowings 168.51 (623.38)Repayment of Borrowings – – Redemption of Preference Shares – – Dividend and Dividend Tax Paid (85.80) (17.22)Net Cash used in Financing Activities – 82.70 – (640.61)Net increase in Cash and Cash Equivalents (14.99) (33.96)Cash and Cash Equivalents as on 1st April, 2010 44.91 78.87 Cash and Cash Equivalents as on 31st March, 2011 29.92 44.91

74 Kajaria Ceramics Limited
Information on the financials of the Subsidiary Company
Statement pursuant to section 212 of the Companies Act 1956 relating to SubsidiaryCompanies
(` in million)
Name of Subsidiary Company Soriso Ceramic Pvt Ltd
Capital 30
Reserves 7.65
Total Assets 187.17
Total Liabilities 149.52
Investments made by Subsidiary –
Revenues (Turnover & other income) 44.35
Profit before Taxation 1.62
Provisions for Taxation 0.14
Profit After Tax 1.48
Proposed Dividend –
Name of the Subsidiary Company Soriso Ceramic Pvt Ltd
Financial year of the Subsidiary Company ended on 31st March 2011
Holding Company's interest
i) No. of equity share 1530000
ii) Percentage (%) of Holding. 51%
The net aggregate amount of the Subsidiary's Profit / Loss so far as it concerns the members of the Holding Company not dealt within the Holding Company's Account
i) For the Current Financial year 0.72 mn
ii) For the Previous Financial years since it became subsidiary. N A
The net aggregate amount of Profit / Loss of the Subsidiary which has been dealt within the account of the Holding Company
i) For the Current Financial year –
ii) For the Previous Financial years since it became subsidiary. –
(As per general circular no. 1/2011 dated 08 Feb 2011 issued by MCA)
`

75Annual Report 2010-11
Consolidated Auditors’ Report
We have audited the attached Consolidated Balance Sheet of
KAJARIA CERAMICS LIMITED as at 31st March, 2011 and the
Consolidated Profit & Loss Account for the Year Ended 31st
March, 2011, annexed thereto and Cash Flow Statement for the
year ended on that date. These financial statements are the
responsibility of the Company’s management. Our responsibility
is to express an opinion on these financial statements based on
our audit.
We have conducted our audit in accordance with auditing
standards generally accepted in India. Those standards require
that we plan and perform the audit to obtain reasonable
assurance about whether the financial statements are free of
material misstatement. An audit includes examining, on a test
basis, evidence supporting the amounts and disclosures in the
financial statements. An audit also includes assessing the
accounting principles used and significant estimates made by
the management, as well as evaluating the overall financial
statement presentation. We believe that our audit provides a
reasonable basis for our opinion.
1. We report that the consolidated financial statements have
been prepared by the Company’s management in
accordance with the requirements of Accounting Standard
(AS) 21, Consolidated Financial Statements, AS 23,
Accounting for Investments in Associates in Consolidated
Financial Statements and AS 27, Financial Reporting of
Interests in Joint Ventures, as notified by the Companies
(Accounting Standard) Rules, 2006.
2. We further report that on the basis of the information and
explanations given to us and on the basis of the separate
audited financial statements of the subsidiary Company, we
are of the opinion that the said consolidated financial
statements give a true and fair view in conformity with the
accounting principles generally accepted in India :-
a) In the case of the Consolidated Balance Sheet of the
consolidated state of affairs of the Group as at 31st
March 2011,
b) In the case of Consolidated Profit & Loss Account, of the
consolidated results of operations of the Group for the
year on that date and;
c) In case of Consolidated Cash Flow Statement, of the
consolidated cash flows of the Group for the year ended
on that date.
For O. P. Bagla & Co.
Chartered Accountants
O. P. Bagla
Partner
Place : New Delhi Membership No. 8858
Dated : 30 April 2011 Firm Registration No. 000018N
To
The Members of
Kajaria Ceramics Limited

76 Kajaria Ceramics Limited
Consolidated Balance Sheet As at 31st March 2011
In terms of our report of even date Annexed For and on behalf of the Board
For O. P. Bagla & Co. D. P. BagchiChartered Accountants R. K. Bhargava
R. R. BagriO. P. Bagla Ashok Kajaria B. K. Sinha R. C. RawatPartner Chairman & Managing Director Directors Sr. Vice President (A & T) &Membership No.: 8858 Company Secretary
Chetan KajariaPlace: New Delhi Rishi KajariaDated: 30 April 2011 Jt. Managing Directors
(` in million)
Schedules 31.3.2011
SOURCE OF FUNDS
Shareholders' Funds
Share Capital 1 147.17
Reserves and Surplus 2 2,078.04
2,225.21
Minority Interest 18.45
Loan Funds
Secured Loans 3 2,839.68
Unsecured Loans 4 40.00
2,879.68
Deferred Tax Liabilities 5 603.21
Total 5,726.54
APPLICATION OF FUNDS
Fixed Assets
Gross Block 6 7,178.09
Less : Depreciation 2,263.16
Net Block 4,914.93
Capital Work-in-Progress 0.63
4,915.56
Investments 7 33.94
Current Assets, Loans & Advances
Inventories 8 1,546.48
Sundry Debtors 9 942.45
Cash and Bank Balances 10 37.71
Loans and Advances 11 811.03
3,337.68
Less : Current Liabilities & Provisions
Current Liabilities 12 2,171.20
Provisions 13 389.44
2,560.64
Net Current Assets 777.04
Total 5,726.54
Significant Accounting Policies and Notes on Accounts 22

77Annual Report 2010-11
Consolidated Profit and Loss Account For the year ended 31st March 2011
In terms of our report of even date Annexed For and on behalf of the Board
For O. P. Bagla & Co. D. P. BagchiChartered Accountants R. K. Bhargava
R. R. BagriO. P. Bagla Ashok Kajaria B. K. Sinha R. C. RawatPartner Chairman & Managing Director Directors Sr. Vice President (A & T) &Membership No.: 8858 Company Secretary
Chetan KajariaPlace: New Delhi Rishi KajariaDated: 30 April 2011 Jt. Managing Directors
(` in million)
Schedules 31.03.2011
INCOMESales (Gross) 10,051.33 Less: Excise Duty on Sales 528.20
9,523.13 Other Income 14 10.80
9,533.92 EXPENDITUREMaterial Manufacturing & Other Expenses 15 6,396.71 Increase/Decrease in Stocks 16 42.60 Salaries, Wages and Amenities 17 760.83 Repairs and Maintenance 18 56.49 Administrative & Other Expenses 19 356.88 Selling & Distribution Expenses 20 430.59 Financial Charges 21 300.79 Depreciation 296.80 Sales Tax of earlier years 103.37 Less: Transferred from General Reserve (See Note 9 of Schedule 22) (103.37) –
8,641.70 Profit Before Tax 892.22Provisions for:Income Tax 218.69Deferred Tax 53.24Income Tax / Wealth Tax Adjustment 13.35Profit After Tax (Before adjustment for Minority Interest) 606.94Less : Share of profit transferred to Minority (0.72)Profit After Tax (After adjustment for Minority Interest) 606.22Balance as per last year 994.15Profit Available For Appropriation 1,600.37APPROPRIATIONSProposed Dividend on Equity Shares 147.17Corporate Dividend Tax 23.87Transfer to General Reserve 200.00Transfer from Debenture Redemption Reserve (46.04)Surplus Carried Over 1,275.37
1,600.37Basic/Diluted Earnings per share (`) 8.24Significant Accounting Policies and Notes on Accounts 22

78 Kajaria Ceramics Limited
Schedules forming part of the Consolidated Accounts As at 31st March 2011
(` in million)
31.03.2011
Authorised125,000,000 (125,000,000) Equity Shares of `2/- each 250.00
10,00,000 (10,00,000) Preference of Shares `100/- each 100.00 350.00
Issued, Subscribed & Paid up73,583,580 (73,583,580) Equity Shares of `2/- each fully paid up in cash 147.17
147.17
SCHEDULE 1 SHARE CAPITAL
A. Capital ReserveShare Premium 142.35
B. Debenture Redemption ReserveBalance B/F 46.04 Less : Written Back (46.04)
– C. General Reserve 513.69
Less: Transferred to Profit & Loss Account (103.37)Add : Transferred During the Year 200.00
610.32 D. Capital Redemption Reserve 50.00 E. Profit & Loss Account 1,275.37
2,078.04
SCHEDULE 2 RESERVES AND SURPLUS
A. Term Loans- From Banks 1,790.03 - Car loan from Others 22.82
B. Working Capital FacilitiesFrom Banks 1,026.83
2,839.68
Notes :1. Term loans from Financial Institutions & Banks are secured by 1st charge on immovable and movable assets (present and future)
of the Company (subject to prior charges on movables in favour of banks) ranking pari-pasu with the charges created in favourof participating Financial Institutions and Banks and further guaranteed by the Managing Director of the Company.
2. Working Capital Facilities from Banks are secured by 1st charge on inventories and book debts and second charge on immovableand movable assets of the Company ranking pari passu amongst the Banks and further guaranteed by the Managing Directorof the Company.
3. Car Loan from others `21.93 million are secured against respective cars.
SCHEDULE 3 SECURED LOANS

79Annual Report 2010-11
Schedules forming part of the Consolidated Accounts As at 31st March 2011
(` in million)
31.03.2011
Short Term Loans & Advances - From Companies 40.00
40.00
SCHEDULE 4 UNSECURED LOANS
Deferred tax Liability As at 1st April 2010 550.59 Additional adjustment for current year 52.62
603.21
SCHEDULE 5 DEFERRED TAX LIABILITIES
SCHEDULE 6 FIXED ASSETS
PARTICULARS GROSS BLOCK DEPRECIATION NET BLOCK
Land and Site Development 105.72 – – 105.72 – – – – 105.72
Building 969.15 438.66 – 1,407.81 277.55 31.81 – 309.36 1,098.45
Plant & Machinery 4,222.99 1,191.25 76.87 5,337.37 1,636.43 234.13 64.80 1,805.76 3,531.61
Furniture and Fixtures 56.14 4.60 5.68 55.06 30.18 3.29 4.23 29.24 25.82
Vehicles 94.72 19.88 6.10 108.50 19.96 9.30 2.49 26.77 81.73
Fixed Assets - Sales Outlet 127.21 1.32 2.65 125.88 75.32 17.54 1.55 91.31 34.57
Goodwill – 37.75 – 37.75 – 0.72 – 0.72 37.03
Current Year 5,575.93 1,693.46 91.30 7,178.09 2,039.44 296.79 73.07 2,263.16 4,914.93
31.03.2011
Investment in Equity Shares - Long Term (At Cost)(Other than trade)Quoted3,00,000 Equity Shares of Regency Trust Ltd. of `10/- each (Note: Market Value `270.00 Lacs) 4.50 Unquoted29,39,500 Equity Shares of Kajaria Plus Pvt. Ltd. of `10/- each fully paid up 29.44
33.94
SCHEDULE 7 INVESTMENTS
(As certified by the Management)Raw Materials 257.65 Stores and Spares 210.20 Finished Goods 1,007.64 Work-in-Process 70.99
1,546.48
SCHEDULE 8 INVENTORIES
As at Additions Sale/ As at Upto For the Sale/ Upto As at
1.4.2010 Transfer 31.3.2011 31.3.2010 year Transfer 31.3.2011 31.3.2011

80 Kajaria Ceramics Limited
Schedules forming part of the Consolidated Accounts As at 31st March 2011
(` in million)
31.03.2011
a) Debts outstanding for a period exceeding six months- Considered Good 40.66 - Considered Doubtful 30.20
b) Other Debts - Considered Good 872.78 - Considered Doubtful 0.01
943.65 Less: Provision for Doubtful Debts 1.20
942.45
SCHEDULE 9 SUNDRY DEBTORS (UNSECURED)
Cash in hand and imprest 4.32 Balance with Scheduled Banks- in current account 22.66 - in Margin / FDR 10.74
37.71
SCHEDULE 10 CASH AND BANK BALANCES
Income Tax 218.40 Proposed Dividend 147.17 Corporate Dividend Tax 23.87
389.44
SCHEDULE 13 PROVISIONS
(Unsecured Considered Good)Advances recoverable in cash or kind or for value to be received 311.64 Balance with Excise Authorities 92.99 Exports Benefit Accrued 4.47 Security Deposits- With Govt. Deptts. 24.57 - With Others 180.48 Prepaid Expenses 9.88 Income Tax 187.00
811.03
SCHEDULE 11 LOANS & ADVANCES
Sundry Creditors - Micro, Small & Medium Enterprises 10.30 - Others 1,989.66
Investors Education & Protection Fund- Unclaimed Dividend 3.17 Other Liabilities 127.99 Interest accrued but not due 0.47 Security Deposits 39.61
2,171.20
SCHEDULE 12 CURRENT LIABILITIES

81Annual Report 2010-11
Schedules forming part of the Consolidated Accounts For the year ended 31st March 2011
(` in million)
31.03.2011
Miscellaneous Income 10.80 10.80
SCHEDULE 14 OTHER INCOME
Salary, Wages and Allowances 686.98 Contribution to ESI, PF & FPF etc. 33.88 Staff Welfare 18.35 Contribution to LIC Group Gratuity Expense 21.63
760.83
SCHEDULE 17 SALARIES, WAGES & AMENITIES
Stock as on 1st April, 2010Work-in-process 62.70 Finished Goods 1,058.54
'A' 1,121.24 Stock as on 31st March, 2011Work-in-process 70.99 Finished Goods 1,007.64
`B' 1,078.63 B-A (42.60)
SCHEDULE 16 INCREASE/DECREASE IN STOCKS
Raw Material Consumed 1,573.83 Goods Purchased for Resale 3,759.34 Stores and Spares Consumed 149.73 Power and Fuel 936.77 Finished Goods used for Fixed Assets (1.40)Excise Duty on Stocks (21.56)
6,396.71
SCHEDULE 15 MATERIAL, MANUFACTURING AND OTHERS
Building 11.78 Machinery 21.80 Others 22.91
56.49
SCHEDULE 18 REPAIRS & MAINTENANCE

82 Kajaria Ceramics Limited
Schedules forming part of the Consolidated Accounts For the year ended 31st March 2011
(` in million)
31.03.2011
Printing, Stationery & EDP Expenses 7.66 Rent, Rates & Taxes 93.23 Vehicle Expenses 14.47 Communication Expenses 37.09 Traveling & Conveyance Expenses 113.82 Insurance Charges 10.80 Legal & Professional Charges 9.25 Loss on Sale / Scrapping of Fixed Assets 15.98 Directors Sitting Fees 0.92 Auditors' Remuneration :- As Audit Fees 1.10 - For Tax Audit, Certification & Tax Representations 1.14 - For Other matters 0.73 - For Reimbursement of Expenses – Miscellaneous Expenses 32.90 Share Transfer Expenses 0.18 Electricity & Water Charges 13.46 Foreign Technician Expenses 0.15 Social Relief & Welfare Expenses 3.58 Research & Development Expenses 0.43
356.88
SCHEDULE 19 ADMINISTRATIVE & OTHER EXPENSES
Interest on Fixed Loans 163.92 Interest on others (Net) 125.66 Exchange Difference (32.45)Bank & Other Charges 43.67
300.79
SCHEDULE 21 FINANCIAL CHARGES
Packing Freight & Forwarding Expenses 114.64 Advertisement, Publicity & Sales Promotion 163.12 Commission 152.83
430.59
SCHEDULE 20 SELLING & DISTRIBUTION EXPENSES

83Annual Report 2010-11
Schedules forming part of the Consolidated Accounts
A. SIGNIFICANT ACCOUNTING POLICIES1. Principles of Consolidation
The consolidated financial results of Kajaria Ceramics Ltd (“the Company”) and its subsidiary have been prepared on thefollowing basis:-
a) The financial statements of the Company and its Subsidiary Company have been consolidated on a line-by-line basisby adding together with the book value of like items of assets, liabilities and after eliminating the inter subsidiarybalances in accordance with Accounting Standard (AS) 21-“ Consolidated Financial Statements” issued by the Instituteof Chartered Accountants of India.
b) As far as possible the consolidated financial statement have been prepared using uniform accounting policies for liketransactions and in similar circumstances and are presented to the extent possible in the same manner as the Company’sseparate financial statements.
c) The difference between the cost of investment in the subsidiaries, over the net assets at the time of acquisition ofshares in the subsidiaries is recognised in the financial statements as Goodwill or Capital Reserve as the case may be.
d) Minority Interest’s share of net profit of Subsidiary for the year is identified and adjusted against the income of the groupin order to arrive at the net income attributable to shareholders of the Company.
e) Minority Interest’s share of net assets of the subsidiary Company is identified and presented in the Consolidated BalanceSheet separate from liabilities and the equity of the Company’s shareholders.
f) Particulars of Subsidiary Company considered in the consolidated financial statements are :
2. Basis of Accounting:The Company prepares its financial statements in accordance with applicable accounting standards and generally acceptedaccounting principles and also in accordance with the requirements of the Companies Act, 1956.
3. Income and Expenditure:Accounting of Income & Expenditure is done on accrual basis.
4. Fixed Assets & Depreciation:a) Fixed assets are stated at their original cost of acquisition inclusive of inward freight, duties and expenditure incurred
in the acquisition, construction/installation.
b) In case of assets acquired out of foreign currency loans, the increase/decrease in liability on account of fluctuation inexchange rates has been charged to Profit & Loss Account.
c) Depreciation is charged at the rates provided in Schedule XIV of the Companies Act, 1956 on Straight Line Method(SLM) on assets of Holding Compay and on Written Down Value (WDV) Method on assets of Subsidiary Company.Continuous process plant as defined in Schedule XIV has been considered on technical evaluation. In case of assets ofsale outlets of dealers, depreciation is charged @ 20% on SLM basis. Assets costing upto `5,000/- are fully depreciatedin the year of purchase. Goodwill is amortised using Straight Line Method in 5 years.
d) CENVAT credit availed on capital equipment is accounted for by credit to respective fixed assets.
e) Capital Work-in-progress includes project advances pending execution.
5. Investments:Long term investments are stated at cost.
Name of the Subsidiary Main Activities Country of Proportion ofIncorporation ownership interest
Soriso Ceramic Pvt Ltd Manufacturing of Tiles India 51%
SCHEDULE 22 ACCOUNTING POLICIES AND NOTES ON ACCOUNTS

84 Kajaria Ceramics Limited
Schedules forming part of the Consolidated Accounts
6. Inventories:Inventories are valued on the following basis:a) Stores and Spares - at moving weighted average basis.
b) Raw Materials - at moving weighted average basis.
c) Work-in-Process - at estimated cost.
d) Finished Goods - at lower of cost or estimated realisable value.
e) Material in Transit – at cost.
7. Excise & Custom Duty:a) Custom Duty is accounted for at the time receipt of goods in custom warehouse.
b) CENVAT Credit, to the extent availed, is adjusted towards cost of materials.
8. Sales:Sales are inclusive of excise duty and after deducting VAT and discounts. Discounts are recognised when substantially allconditions appurtenant thereto have been fulfilled.
9. Foreign Currency Transactions:a) Transactions denominated in foreign currencies are recorded at the exchange rates prevailing on the date of the
transaction or that approximates the actual rate at the date of the transaction.
b) Monetary items denominated in foreign currencies at the year end are restated at year end rates, except in cases coveredby forward exchange contracts.
c) Any income or expense on account of exchange difference either on settlement or on translation is recognised in theProfit and Loss Account.
10. Export Benefits:Export Benefits in respect of unutilised Advance Licences under DEPB Scheme are accounted for in the year of Export to theextent of duty leviable on imports to be made in future. The consumption of Raw Material, Stores and other inputs and thevaluation of closing stock are stated net of such export benefits.
11. Employee Benefits:a) Short term employee benefits are recognised as an expense at the undiscounted amount in the Profit and Loss Account
of the year in which the related service is rendered.
b) Gratuity liability has been provided on the basis of actuarial valuation.
12. Research & Development:Revenue Expenditure on research and development is charged to Profit & Loss Account in the year in which it is incurred.Capital Expenditure on research and development is treated as additions to Fixed Assets in case the same qualifies as anintangible asset as per AS – 26 issued by ICAI.
13. Provision, Contingent Liabilities and Contingent Assets:Provisions involving substantial degree of estimation in measurement are recognised when there is a present obligation asa result of past events and it is probable that there will be an outflow of resources. Contingent liabilities are not recognisedbut are disclosed in the notes. Contingent assets are neither recognised nor disclosed in the financial statements.
14. Sundry Debtors:Sundry Debtors are shown net of bills discounted.
15. Dividend received is accounted for as and when it is declared.
16. Unless specifically stated to be otherwise, these policies are consistently followed.
SCHEDULE 22 ACCOUNTING POLICIES AND NOTES ON ACCOUNTS (Contd.)

85Annual Report 2010-11
Schedules forming part of the Consolidated Accounts
B. NOTES ON ACCOUNTS (` in million)As at
31.03.2011
1. Estimated amount of contracts remaining to be executed on Capital Account and not provided for (Net of advances) 3.96
2. Letters of Credit opened in favour of inland/overseas suppliers (Net) 1623.523. Contingent Liabilities not provided for (excluding matters separately dealt with in the notes):
a) In respect of Bills discounted With the Company’s Bankers 34.23b) Counter guarantees issued in respect of guarantees issued by Company’s bankers 8.76c) Guarantees issued on behalf of limited Companies 50.00d) In respect of Excise Duty, Sales Tax, Service Tax, Custom Duty demands pending
before various Authorities and in dispute 66.92e) In respect of disputed Electricity demand pending with appellate authorities
and other consumer cases. 4.68
4. Salary includes following remuneration to the Managing Director, Jt. Managing Director & Director Technical
(` in million)Year ended 31.03.2011
- Salary 20.70- Perquisites 13.21- Contribution to Provident Fund –
5. As per policy of the Company for Directors and other senior employees the Company has, during the year, paid a sum of `50lacs on account of insurance premium under the employer employee policy obtained on the life of key Directors and the samelies debited under the head ‘Insurance Charges’. The policy may be assigned in the name of the insured in future. In such anevent of assignment of the policy, the same shall be treated as perquisite in the hands of the key personnel.
6. Balances of certain debtors, creditors, loans and advances are subject to confirmation.
7. In the opinion of the Management current assets, loans and advances have a value on realisation in the ordinary course ofbusiness at least equal to the amount at which they are stated except where indicated otherwise.
8. To comply with the guidance note on “Accounting Treatment of Excise Duty” issued by Institute of Chartered Accountants ofIndia, excise duty amounting to `58.29 million has been included in the value of inventories as on 31.03.2011 and thecorresponding amount of Excise Duty payable has been included in other liabilities. However, this accounting policy has noimpact on the profit for the year.
9. a) A sum of `103.37 million has been debited to the Profit & Loss Account under the head ‘Sales Tax of Earlier Years’,representing sales tax paid as a result of withdrawal of exemption by sales tax department in respect of three expansionsundertaken by the Company. After getting no favourable outcome, the Company, based on legal opinion, has withdrawnthe claims filed in earlier years and accordingly the amount paid has been written off in the Profit & Loss Account.
b) Since the liability relates to earlier years, an equivalent amount has been withdrawn from general reserve and credited toProfit & Loss Account.
10. Gratuity And Other Post-Employment Benefit Plans:The Company has a defined benefit gratuity plan. Gratuity (being administered by a Trust) is computed as 15 days salary, forevery completed year of service or part thereof in excess of 6 months and is payable on retirement / termination / resignation.The benefit vests on the employee completing 5 years of service. The Gratuity plan for the Company is a defined benefit schemewhere annual contributions are deposited to a Gratuity Trust Fund established to provide gratuity benefits. The Trust Fund hastaken a Scheme of Insurance, whereby these contributions are transferred to the insurer. The Company makes provision of such
SCHEDULE 22 ACCOUNTING POLICIES AND NOTES ON ACCOUNTS (Contd.)
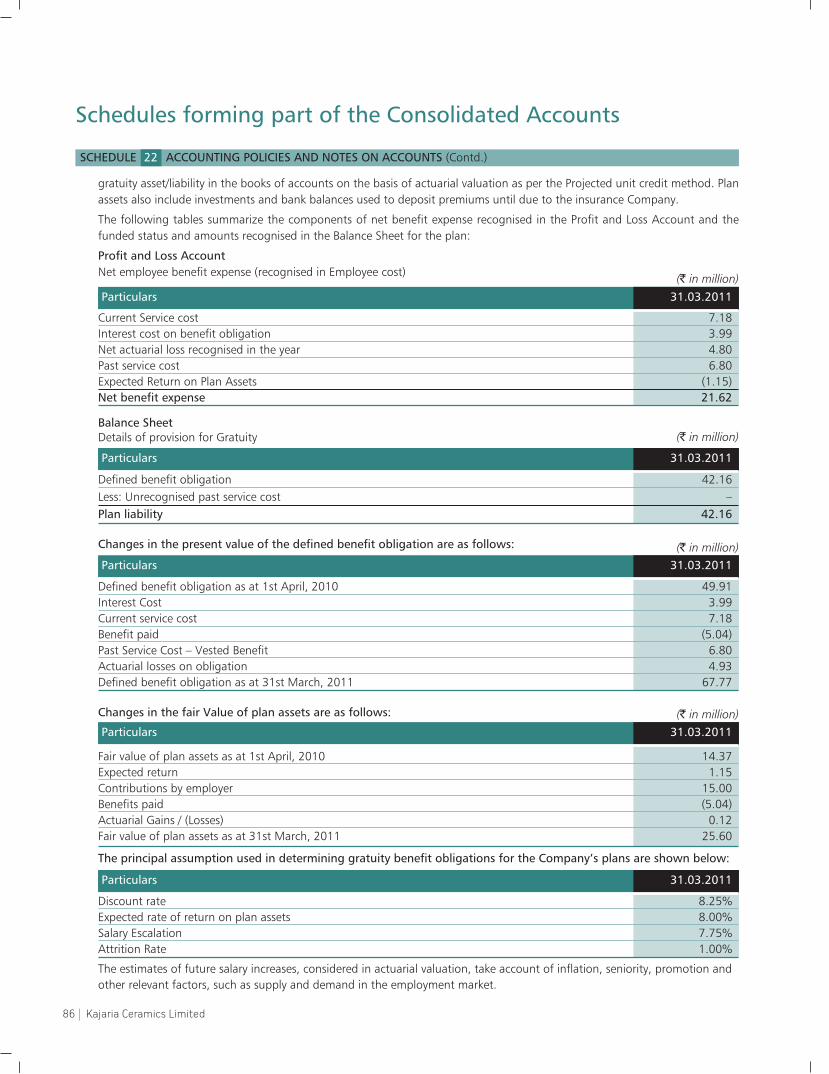
86 Kajaria Ceramics Limited
Schedules forming part of the Consolidated Accounts
(` in million)
Particulars 31.03.2011
Current Service cost 7.18Interest cost on benefit obligation 3.99Net actuarial loss recognised in the year 4.80Past service cost 6.80Expected Return on Plan Assets (1.15)Net benefit expense 21.62
Balance SheetDetails of provision for Gratuity (` in million)
Particulars 31.03.2011
Defined benefit obligation 42.16Less: Unrecognised past service cost –Plan liability 42.16
gratuity asset/liability in the books of accounts on the basis of actuarial valuation as per the Projected unit credit method. Planassets also include investments and bank balances used to deposit premiums until due to the insurance Company.
The following tables summarize the components of net benefit expense recognised in the Profit and Loss Account and thefunded status and amounts recognised in the Balance Sheet for the plan:
Profit and Loss AccountNet employee benefit expense (recognised in Employee cost)
Changes in the present value of the defined benefit obligation are as follows: (` in million)Particulars 31.03.2011
Defined benefit obligation as at 1st April, 2010 49.91Interest Cost 3.99Current service cost 7.18Benefit paid (5.04)Past Service Cost – Vested Benefit 6.80Actuarial losses on obligation 4.93Defined benefit obligation as at 31st March, 2011 67.77
Changes in the fair Value of plan assets are as follows: (` in million)Particulars 31.03.2011
Fair value of plan assets as at 1st April, 2010 14.37Expected return 1.15Contributions by employer 15.00Benefits paid (5.04)Actuarial Gains / (Losses) 0.12Fair value of plan assets as at 31st March, 2011 25.60
The principal assumption used in determining gratuity benefit obligations for the Company’s plans are shown below:
Particulars 31.03.2011
Discount rate 8.25%Expected rate of return on plan assets 8.00%Salary Escalation 7.75%Attrition Rate 1.00%
The estimates of future salary increases, considered in actuarial valuation, take account of inflation, seniority, promotion andother relevant factors, such as supply and demand in the employment market.
SCHEDULE 22 ACCOUNTING POLICIES AND NOTES ON ACCOUNTS (Contd.)

87Annual Report 2010-11
Schedules forming part of the Consolidated Accounts
11. Tax Expense is the aggregate of current year income tax and deferred tax charged to the Profit and Loss Account for the year.
a) Current Year Charge: Income Tax provision of `218.69 million has been made on regular income.
b) Deferred TaxThe Company estimates the deferred tax charge using the applicable rate of taxation based on the impact of timingdifferences between financial statements and estimated taxable income for the current year. The movement of provisionfor deferred tax is given below: (` in million)Particulars Opening as at Charge/(credit) Closing as at
1.04.2010 during the year 31.03.2011Depreciation 550.59 52.62 603.21Net Deferred Tax Liability 550.59 52.62 603.21
12. Related Party Disclosures:In accordance with the Accounting Standards (AS-18) on Related Party Disclosures, where control exists and where keymanagement personnel are able to exercise significant influence and, where transactions have taken place during the year,alongwith description of relationship as identified, are given below:-
A. RelationshipsI. Key Management Personnel:Name Designation
Sh. Ashok Kajaria Chairman & Managing DirectorSh. Chetan Kajaria Joint Managing DirectorSh. Rishi Kajaria Joint Managing DirectorSh. B.K. Sinha Director Technical
II. Relatives of Key Management Personnel:Smt. Versha Devi KajariaSh. A.K. Kajaria (HUF)
III. Associates/Enterprises over which key management personnel are able to exercise significant influence:Kajaria Plus Pvt LtdKajaria Vision Pvt Ltd Dua Engineering Works Pvt Ltd
B. The following transactions were carried out with related parties in the ordinary course of business:
Related Party Transactions Key Management OthersPersonnel & Relatives
Purchase of Raw Material, Goods & Services – 10.15Rent Paid – 3.71Remuneration 33.91 –
(` in million)
C. Outstanding balance and balance written off/written back:
As at 31.03.11 As at 31.03.11
Key Management Personnel & Relatives – – 7.89Others – – 0.40
Outstanding Written off/ Maximum DebitBalances Written back Balances
(` in million)
SCHEDULE 22 ACCOUNTING POLICIES AND NOTES ON ACCOUNTS (Contd.)

88 Kajaria Ceramics Limited
Schedules forming part of the Consolidated Accounts
SCHEDULE 22 ACCOUNTING POLICIES AND NOTES ON ACCOUNTS (Contd.)
16. Previous year figures have not been given as these are the first consolidated financial statements of the Company.
Signature to the schedule 1 to 22
In terms of our report of even date Annexed For and on behalf of the Board
For O. P. Bagla & Co. D. P. BagchiChartered Accountants R. K. Bhargava
R. R. BagriO. P. Bagla Ashok Kajaria B. K. Sinha R. C. RawatPartner Chairman & Managing Director Directors Sr. Vice President (A & T) &Membership No.: 8858 Company Secretary
Chetan KajariaPlace: New Delhi Rishi KajariaDated: 30 April 2011 Jt. Managing Directors
13. Segmental Reporting:The business activity of the Company falls within one broad business segment viz “Ceramic Tiles” and substantially sale of theproduct is within the country. The Gross income and profit from the other segment is below the norms prescribed in AS-17 ofThe Institute of Chartered Accountants of India. Hence the disclosure requirement of Accounting Standard 17 of “SegmentReporting” issued by the Institute of Chartered Accountants of India is not considered applicable.
14. Pre-operative expenses capitalised to fixed assets:Pre-operative Expenses incurred & capitalised in New Projects during the year are as under:- (` in million)
Particulars 31.03.2011
Administrative & Other Expenses 11.94Salary & Wages 7.45Financial Charges 17.01Trial Run 14.89Total 51.29
15. Earnings per share (EPS) – The numerators and denominators used to calculate Basic and Diluted Earning per share:
Year ended 31.03.2011
Profit attributable to the Equity Shareholders – (A) (` in millions) 606.94Basic /Weighted average number of Equity Shares outstanding during the year (B) 7,35,83,580Nominal value of Equity Shares (`) 2.00Basic/Diluted Earnings per share (`) – (A)/(B) 8.24
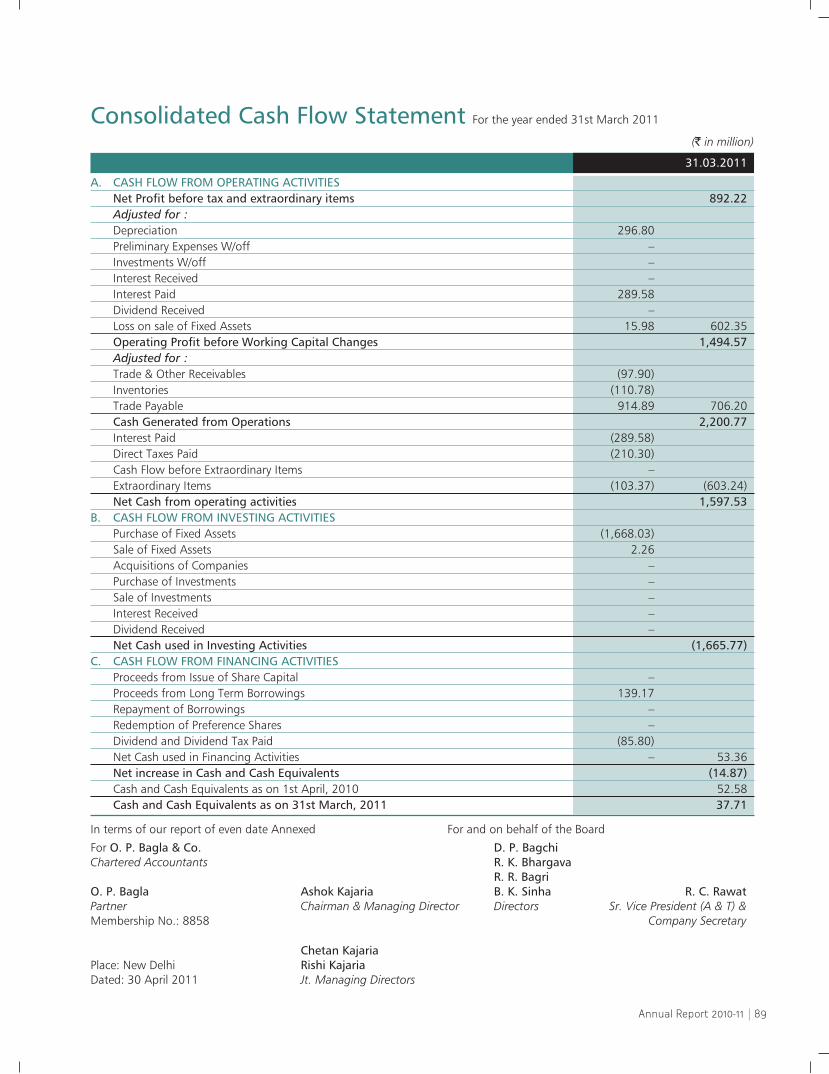
89Annual Report 2010-11
Consolidated Cash Flow Statement For the year ended 31st March 2011
In terms of our report of even date Annexed For and on behalf of the Board
For O. P. Bagla & Co. D. P. BagchiChartered Accountants R. K. Bhargava
R. R. BagriO. P. Bagla Ashok Kajaria B. K. Sinha R. C. RawatPartner Chairman & Managing Director Directors Sr. Vice President (A & T) &Membership No.: 8858 Company Secretary
Chetan KajariaPlace: New Delhi Rishi KajariaDated: 30 April 2011 Jt. Managing Directors
(` in million)
31.03.2011
A. CASH FLOW FROM OPERATING ACTIVITIESNet Profit before tax and extraordinary items 892.22 Adjusted for :Depreciation 296.80 Preliminary Expenses W/off – Investments W/off – Interest Received – Interest Paid 289.58 Dividend Received – Loss on sale of Fixed Assets 15.98 602.35 Operating Profit before Working Capital Changes 1,494.57 Adjusted for :Trade & Other Receivables (97.90)Inventories (110.78)Trade Payable 914.89 706.20 Cash Generated from Operations 2,200.77 Interest Paid (289.58)Direct Taxes Paid (210.30)Cash Flow before Extraordinary Items – Extraordinary Items (103.37) (603.24)Net Cash from operating activities 1,597.53
B. CASH FLOW FROM INVESTING ACTIVITIESPurchase of Fixed Assets (1,668.03)Sale of Fixed Assets 2.26 Acquisitions of Companies – Purchase of Investments – Sale of Investments – Interest Received – Dividend Received – Net Cash used in Investing Activities (1,665.77)
C. CASH FLOW FROM FINANCING ACTIVITIESProceeds from Issue of Share Capital – Proceeds from Long Term Borrowings 139.17Repayment of Borrowings – Redemption of Preference Shares – Dividend and Dividend Tax Paid (85.80)Net Cash used in Financing Activities – 53.36Net increase in Cash and Cash Equivalents (14.87)Cash and Cash Equivalents as on 1st April, 2010 52.58Cash and Cash Equivalents as on 31st March, 2011 37.71
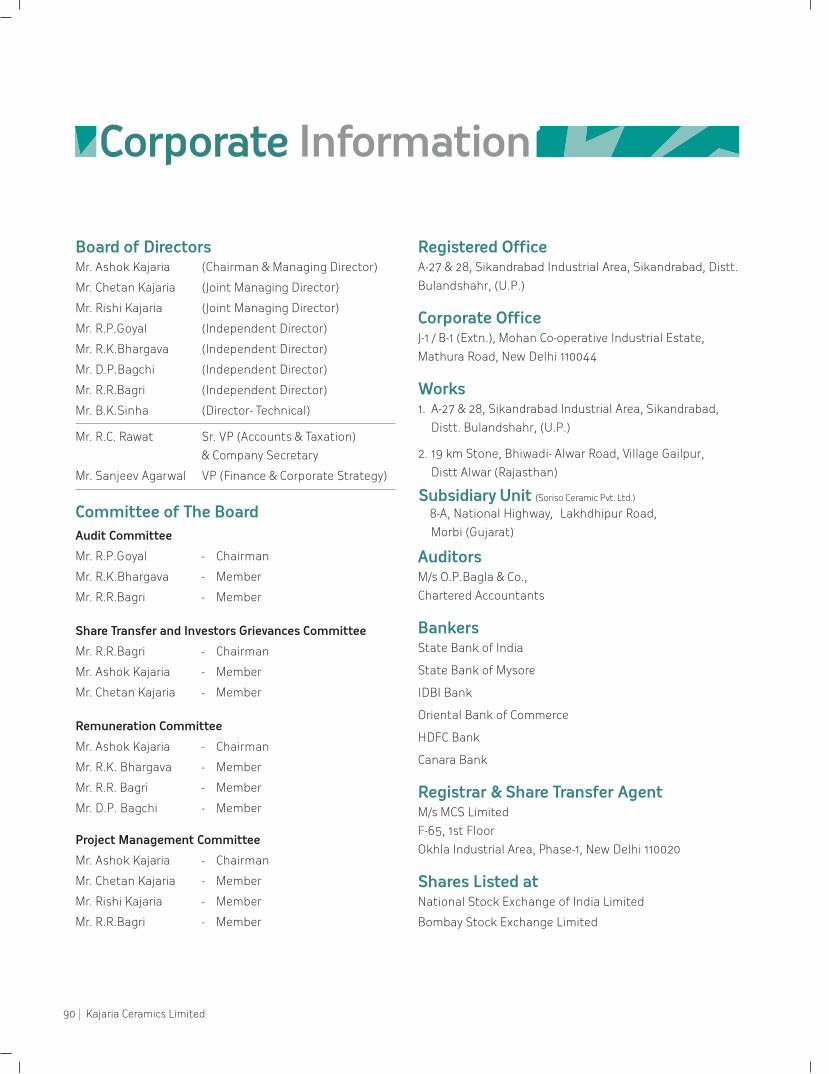
90 Kajaria Ceramics Limited
Board of DirectorsMr. Ashok Kajaria (Chairman & Managing Director)
Mr. Chetan Kajaria (Joint Managing Director)
Mr. Rishi Kajaria (Joint Managing Director)
Mr. R.P.Goyal (Independent Director)
Mr. R.K.Bhargava (Independent Director)
Mr. D.P.Bagchi (Independent Director)
Mr. R.R.Bagri (Independent Director)
Mr. B.K.Sinha (Director- Technical)
Mr. R.C. Rawat Sr. VP (Accounts & Taxation)
& Company Secretary
Mr. Sanjeev Agarwal VP (Finance & Corporate Strategy)
Committee of The BoardAudit Committee
Mr. R.P.Goyal - Chairman
Mr. R.K.Bhargava - Member
Mr. R.R.Bagri - Member
Share Transfer and Investors Grievances Committee
Mr. R.R.Bagri - Chairman
Mr. Ashok Kajaria - Member
Mr. Chetan Kajaria - Member
Remuneration Committee
Mr. Ashok Kajaria - Chairman
Mr. R.K. Bhargava - Member
Mr. R.R. Bagri - Member
Mr. D.P. Bagchi - Member
Project Management Committee
Mr. Ashok Kajaria - Chairman
Mr. Chetan Kajaria - Member
Mr. Rishi Kajaria - Member
Mr. R.R.Bagri - Member
Registered OfficeA-27 & 28, Sikandrabad Industrial Area, Sikandrabad, Distt.
Bulandshahr, (U.P.)
Corporate OfficeJ-1 / B-1 (Extn.), Mohan Co-operative Industrial Estate,
Mathura Road, New Delhi 110044
Works1. A-27 & 28, Sikandrabad Industrial Area, Sikandrabad,
Distt. Bulandshahr, (U.P.)
2. 19 km Stone, Bhiwadi- Alwar Road, Village Gailpur,
Distt Alwar (Rajasthan)
Morbi (Gujarat)
AuditorsM/s O.P.Bagla & Co.,
Chartered Accountants
BankersState Bank of India
State Bank of Mysore
IDBI Bank
Oriental Bank of Commerce
HDFC Bank
Canara Bank
Registrar & Share Transfer AgentM/s MCS Limited
F-65, 1st Floor
Okhla Industrial Area, Phase-1, New Delhi 110020
Shares Listed atNational Stock Exchange of India Limited
Bombay Stock Exchange Limited
Corporate Information
Subsidiary Unit (Soriso Ceramic Pvt. Ltd.)
8-A, National Highway, Lakhdhipur Road,

91Annual Report 2010-11
“Customers mustrecognize that you
stand for something.”– Howard Schultz, Starbucks

92 Kajaria Ceramics Limited
“The ability toperceive or think
differently is moreimportant than theknowledge gained.”
– David Bohm

Demandingcustomers buyHermes. Invest in Souza.Prefer Armani.Admire Swarovski.Swear by Apple. And trust Kajaria.
Kajaria Ceramics Limited | Annual report 2010-11
J-1/B-1 (Extn), Mohan Co-operative Industrial EstateMathura Road, New Delhi-110044
Phone: +91-11-26946409, Fax: +91-11-26946407E-mail: [email protected]
Website: www.kajariaceramics.com