demand, supply and price of copper – an …s3.amazonaws.com/zanran_storage/ supply and price of...
TRANSCRIPT

Demand, supply and price of copper – an exploration perspective
Eric Finlayson
Head of Exploration
Global Mining Investment Conference
London, September 30, 2009

Demand, supply and price of copper – an exploration perspective 2
This presentation has been prepared by Rio Tinto plc and Rio Tinto Limited (“Rio Tinto”) and consisting of the slides for a presentation concerning Rio Tinto. By reviewing/attending this presentation you agree to be bound by the following conditions.
Forward-Looking Statements
This presentation includes forward-looking statements. All statements other than statements of historical facts included in this presentation, including, without limitation, those regarding Rio Tinto’s financial position, business strategy, plans and objectives of management for future operations (including development plans and objectives relating to Rio Tinto’s products, production forecasts and reserve and resource positions), are forward-looking statements. Such forward-looking statements involve known and unknown risks, uncertainties and other factors which may cause the actual results, performance or achievements of Rio Tinto, or industry results, to be materially different from any future results, performance or achievements expressed or implied by such forward-looking statements.
Such forward-looking statements are based on numerous assumptions regarding Rio Tinto’s present and future business strategies and the environment in which Rio Tinto will operate in the future. Among the important factors that could cause Rio Tinto’s actual results, performance or achievements to differ materially from those in the forward-looking statements include, among others, levels of actual production during any period, levels of demand and market prices, the ability to produce and transport products profitably, the impact of foreign currency exchange rates on market prices and operating costs, operational problems, political uncertainty and economic conditions in relevant areas of the world, the actions of competitors, activities by governmental authorities such as changes in taxation or regulation and such other risk factors identified in Rio Tinto's most recent Annual Report on Form 20-F filed with the United States Securities and Exchange Commission (the "SEC") or Form 6-Ks furnished to the SEC. Forward-looking statements should, therefore, be construed in light of such risk factors and undue reliance should not be placed on forward-looking statements. These forward-looking statements speak only as of the date of this presentation.
Nothing in this presentation should be interpreted to mean that future earnings per share of Rio Tinto plc or Rio Tinto Limited will necessarily match or exceed its historical published earnings per share.
Cautionary Statement

Demand, supply and price of copper – an exploration perspective 3
1313141717192021222425262731
3841
7882
98160
0 50 100 150
Anglogold AshantiTeck Cominco
ImpalaENRC
ChalcoNewmont
NorilskAnglo Platinum
MosaicSouthern Copper
FreeportPotash Corp
GoldcorpBarrick Gold
XstrataAnglo American
Rio TintoShenhua
ValeBHP Billiton
Market capitalisation of major listed mining companies
(US$ billion)
At 1 September 09
Source: Thomson Datastream
Rio Tinto – Gross asset distribution (2008)
US, 11%Europe, 13%
Canada, 34%
Other, 7%
Australia, 35%

Demand, supply and price of copper – an exploration perspective 4
Rio Tinto – a world leader in mining
Aluminium Copper Iron Ore
Diamonds Energy Industrial Minerals

Demand, supply and price of copper – an exploration perspective 5
Key drivers for long term commodity demand growth remain intact
Sources: Global Insight, CIA Factbook
Urbanisation rates across Asia, the United States and European Union
United States
Japan
India
EU15
0
20
40
60
80
100
0 10,000 20,000 30,000 40,000 50,000
GDP per capita (US$ at PPP rates in 2006 terms)
Urb
anis
atio
n ra
te (p
erce
nt)
National averages
Chinese provinces
Urbanisation rates, income and population
Note: Size of bubble reflects total population
China

Demand, supply and price of copper – an exploration perspective 6
Sources: 1900-1928 McGraw Hill (1931), 1929-2008 CRU
Global copper consumption
• Compound Annual Growth Rate (CAGR) in demand over the last 108 years is ~ 3.4%
• China overtook the US in 2003 as the largest consumer of copper
• The proportion of global copper consumed in China will grow as per capita consumption increases
Consumption in millions of tonnes per annum
0
5
10
15
20
1900
1910
1920
1930
1940
1950
1960
1970
1980
1990
2000
2000
Demand, supply and price of copper – an exploration perspective 7
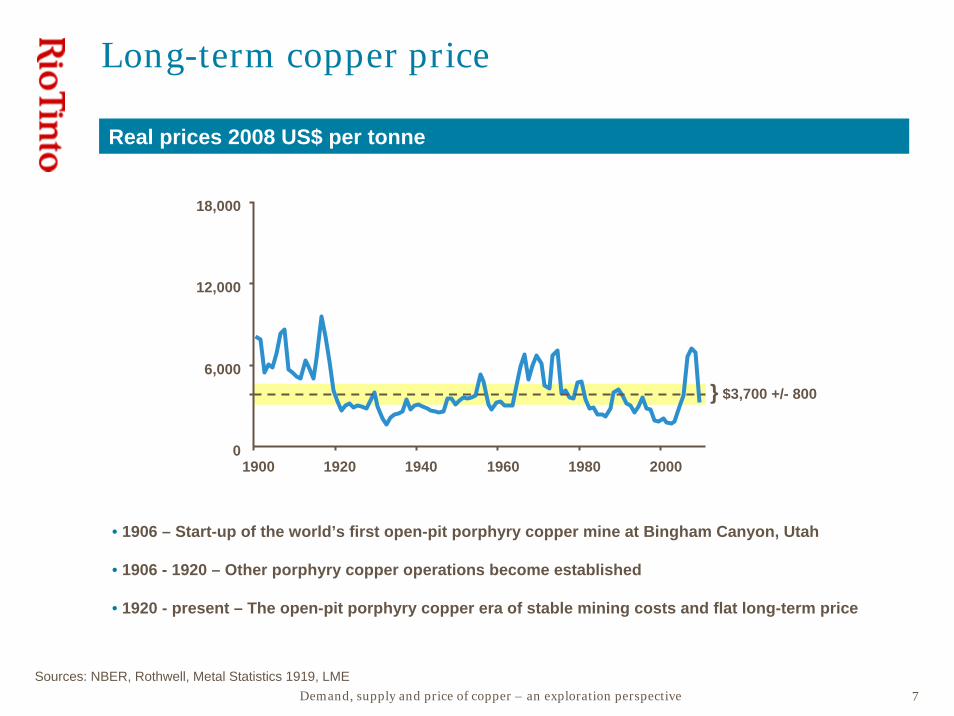
Sources: NBER, Rothwell, Metal Statistics 1919, LME
Real prices 2008 US$ per tonne
Long-term copper price
• 1906 – Start-up of the world’s first open-pit porphyry copper mine at Bingham Canyon, Utah
• 1906 - 1920 – Other porphyry copper operations become established
• 1920 - present – The open-pit porphyry copper era of stable mining costs and flat long-term price
0
6,000
12,000
18,000
1900 1920 1940 1960 1980 2000
$3,700 +/- 800}

Demand, supply and price of copper – an exploration perspective 8
Source: CRU
Production is dominated by a few operations
Grasberg/Ertsberg
Collahuasi
> 250 Other Mines
Bingham CanyonLos Bronces
AndinaBatu Hijau
MorenciCerro Verde
Antamina
Los Pelambres
Norilsk
El Teniente
Codelco Norte
Escondida
Contribution of copper mines to global copper production (2009f)

Demand, supply and price of copper – an exploration perspective 9
Source: MEG
Distribution of copper reserves and resources
•Total reserves + resources – 1.8Bt contained copper in 953 deposits•Global average grade is 0.55% copper
10%4% China
5%Australia34%
Peru
4% Mexico
3% Canada 3% Russia
3% Mongolia
3% Zambia
Others 10%3% Indonesia
2%
2%
2%
2%
2%
Philippines
KazakhstanPoland
DRC
Argentina
8%
Chile
US

Demand, supply and price of copper – an exploration perspective 10
0.770.70
0.97
0.78
1996 2000 2004 2008
24 25
45
27
1996 2000 2004 2008
Global copper reserves - years of production Average reserve grade - % copper
Source: Brook Hunt
Global copper reserves and grades are falling
• Data for 217 mines and projects
• Reserves are being mined faster than they are being replaced
• Resource conversion is falling behind production or is focusing on the high-grade parts of deposits
• Selective conversion and mining of high-grade is an unsustainable practice

Demand, supply and price of copper – an exploration perspective 11
0
10,000,000
20,000,000
30,000,000
40,000,000
50,000,000
60,000,000
70,000,000
80,000,000
90,000,000
100,000,000
Kam
oto
JVK
onko
laTe
nke
Fung
urum
eG
logo
wN
kana
Cha
mbi
shi
KG
HM
Mt I
saO
lym
pic
Dam
Ayn
akU
doka
nsko
eG
aisk
y C
ompl
exTi
ntay
aA
ntam
ina
Gra
sber
gE
l Ten
ient
eZh
ezka
zgan
Com
plex
Col
lahu
asi
And
ina
Div
isio
nE
scon
dida
Sal
obo
Lum
wan
aC
huqu
icam
ata
Sar
ches
hmeh
Sun
gun
Los
Pel
ambr
esR
adom
iro T
omic
Que
llave
coS
alva
dor D
ivis
ion
Rio
Bla
nco
Esp
eran
zaTo
rom
ocho
Cua
jone
Los
Bro
nces
Alm
alyk
Com
plex
Oyu
Tol
goi
Agu
a R
ica
Ray
Com
plex
Bin
gham
Can
yon
Dex
ing
Com
plex
San
to T
omas
Que
brad
a B
lanc
aE
l Abr
aG
aby
Bal
khas
h C
ompl
exM
onyw
aB
atu
Hija
uB
or B
asin
Saf
ford
Cer
ro V
erde
Toqu
epal
aC
anan
eaB
agda
dM
oren
ciS
ierri
taLa
Car
idad
Con
tain
ed C
u
0.00
0.50
1.00
1.50
2.00
2.50
3.00
3.50
4.00
Cu
Gra
de (%
)
Sources: MEG; FCX 2008 Form 10-K
Mined grades will continue to fall
Reserves – Deposits with >4Mt contained copper Resources – Deposits with >4Mt contained copper
0
10,000,000
20,000,000
30,000,000
40,000,000
50,000,000
60,000,000
70,000,000
80,000,000
90,000,000
100,000,000
T intaya
Konkola Nor th
Tenke Fung urumKamoto JVNkanaRe solu tionLim amayo
Lo s Su lfatos
W ind y Cra ggy
Zhezka zga n CompleKonkolaOyu To lgoi
M t Isa
Yulong
La s Bambas
Qulo ngAntam ina
O lymp ic DamCo lla huas i
K alum bilaJunin
Lo okout Hill
Sungu n
Ce rro C oloradNokom isPanan tza
A ndina D iv isio
San Manue l Div isioLumw anaTampakan
Tuw u-YandonE l Pachon
Fried a RiveEscondid a
M irad orGra sbe rg
Lo s Azules
Santa Cru z
Rio B lanco
Lo s Pe lam bres
Ak-Sug
E l A rcoE l Ten iente
La G ranjaPetaquilla
Que brad a Blan cRe ko D iq
Ch uquicam ata
Galo re Cre ekSafford
E rdm in SxewGale no
B ingham CanyoQue lla veco
Co bre de S ono r
We stern Coppe
Tok i C lu ster
Le tpa daung
B alkhash C omple
A lma lyk C omple
S ierra Go rda
Lo s Bronces
ToromochoA idarlyE l Abra
Salvador D
iv isio
V izcach itasA gua Rica
PebbleE spe ran za
Bor BasinGab y
Santo TomasMonywa
Ce rro Verd eB agda dMore nci
S ierritaBatu H ijau
Zangezu r
Cont
aine
d C
u
0.00
0.50
1.00
1.50
2.00
2.50
3.00
3.50
4.00
Cu G
rade
(%)
Weighted average grade: 0.88% copper
Total contained copper: 457Mt
Weighted average grade: 0.68% copper
Total contained copper: 909Mt

Demand, supply and price of copper – an exploration perspective 12
0
10
20
30
40
50
60
190
6
1910
1914
1918
192
2
192
6
193
0
193
4
193
8
194
2
194
6
195
0
195
4
195
8
196
2
196
6
1970
1974
1978
198
2
198
6
199
0
199
4
199
8
20
02
20
06
Mil
lio
ns
Met
ric
To
nn
es
Ore Mined
View of the open pit
• Tier 1 deposits – the largest and highest quality in the world – are geologically rare and confer sustainable competitive advantage
• They grow with exploration and commonly have other Tier 1 deposits nearby
• Their capacity to support production expansions delivers optionality and value growth
• Output from these deposits dominates global copper production
The challenge for exploration – discovery of new Tier 1 copper deposits
Production by year 1906 - 2008
Bingham Canyon, USA

Demand, supply and price of copper – an exploration perspective 13
Date Name Commodity Country Date Name Commodity Country
1947 Lac Allard Ilmenite Canada 2000 Potasio Rio Colorado Potash Argentina
1952 Weipa Bauxite Australia 2002 Resolution Copper USA
1962 Tom Price Iron Ore Australia 2004 Simandou Iron Ore Guinea
1963 Kirka Borates Turkey 2005 La Granja Copper Peru
1971 Paragominas Bauxite Brazil 2009 Jadar Borates Serbia
1965 Panguna Copper PNG 2005 Caliwingina Iron Ore Australia
1967 Ok Tedi Copper PNG 2008 Sulawesi Nickel Indonesia
1968 Rossing Uranium Namibia 2008 Mutamba Ilmenite Mozambique
1979 Argyle Diamond Australia
1982 Kaltim Prima Coal Indonesia
1983 Lihir Gold PNG
1985 QMM Ilmenite Madagascar
1990 Century Zinc Australia
1991 Corumba Iron Ore Brazil
1994 Diavik Diamond Canada
1995 Orissa Iron Ore India
In evaluation
In operation
Divested/suspended
Rio Tinto Tier 1 discoveries
• A discovery is a deposit handed over to a Product Group pre-feasibility study team
Demand, supply and price of copper – an exploration perspective 14
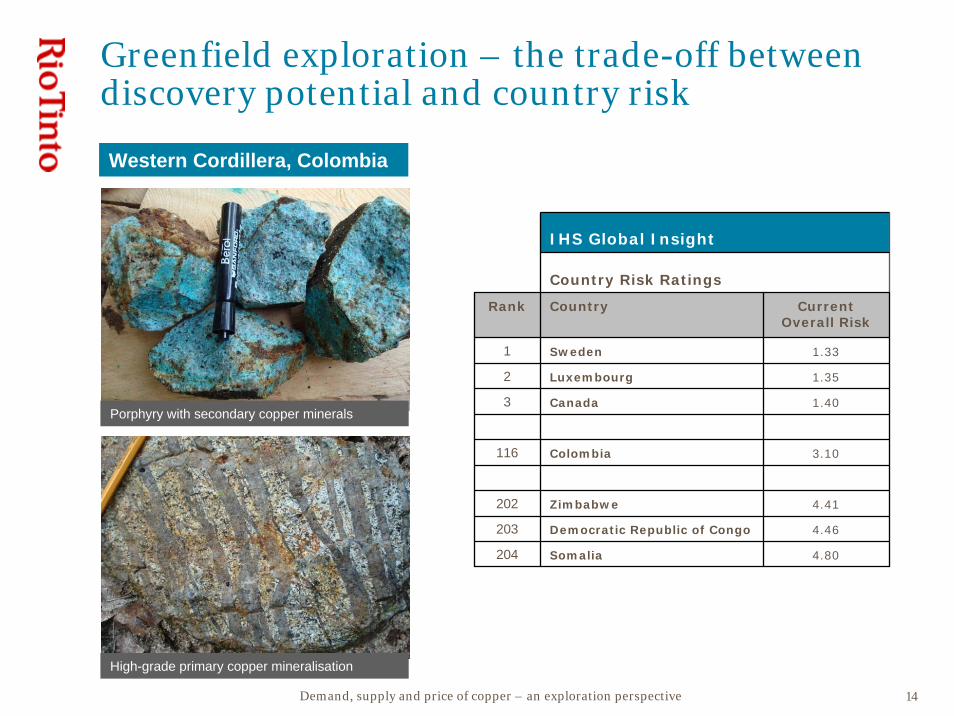
Greenfield exploration – the trade-off between discovery potential and country risk
Porphyry with secondary copper minerals
High-grade primary copper mineralisation
IHS Global Insight
Country Risk Ratings
Rank Country CurrentOverall Risk
1 Sweden 1.33
2 Luxembourg 1.35
3 Canada 1.40
116 Colombia 3.10
202 Zimbabwe 4.41
203 Democratic Republic of Congo 4.46
204 Somalia 4.80
Western Cordillera, Colombia

Demand, supply and price of copper – an exploration perspective 15
-200
0
200
400
600
800
1000
1200
14001850 1870 1890 1910 1930 1950 1970 1990 2010
Approximate year of discovery
App
roxi
mat
e de
pth
to to
p of
dep
osit
Copper discoveries showing depth of deposits with >4Mt contained copper
Deeper discoveries are starting to appear
Resolution
Hugo Dummett
Pebble East
Heruga
Kalamazoo
EscondidaGrasberg
Chuquicamata
El Teniente Andina
Olympic Dam
Los Sulfatos
Source: MEG

Demand, supply and price of copper – an exploration perspective 16
• Deep Molybdenum Zone to date only partially delineated by drilling (D664 only recently completed)
• Annular body of mineralisation extending >2,000m downwards beneath current open pit
• Current Exploration Target of 500-600Mt @ 0.1 – 0.15% Mo (pre-D664) is likely to significantly expand with further drilling
Bingham Canyon – Deep Molybdenum Zone
Brownfield exploration – high potential for discovery in an established operating environment

Demand, supply and price of copper – an exploration perspective 17
Bingham Canyon – an emerging mineral district
Bingham Canyon – tip of the iceberg
• New geophysical data have traced the Bingham Canyon ore body to depth
• Nearby unroofed intrusions identified for 2009/2010 drilling
• Potential for additional major discoveries within the Bingham Canyon mineral district

Demand, supply and price of copper – an exploration perspective 18
Notes: 1 - Existing mines and funded projects
Source: Brook Hunt
Increasing depth . . . . . . means higher mining costs?
Underground production1 - % of global production Average 2007 C1 composite costs - (c/lb)
26%
40%
2008 2025
63
102
Open Pit Underground
Copper mining methods and costs

Demand, supply and price of copper – an exploration perspective 19
Cu >0.75% drill intercepts
Technology and innovation – unlocking the value of lower-grade mineral deposits
View looking south
La Granja, Peru
• 2,770Mt @ 0.51% Cu, 0.1% Zn
• Deposit remains open
• Amenable to dump leaching of copper and zinc
• Major new mineralised porphyry found immediately to the north-west – currently under evaluation

Demand, supply and price of copper – an exploration perspective 20
Source: MEG
Global exploration expenditures
• Cyclicity of exploration spend is normal
• The current economic downturn will have no lasting impact on copper exploration & development
0
2
4
6
8
10
12
14
1989
1990
1991
1992
1993
1994
1995
1996
1997
1998
1999
2000
2001
2002
2003
2004
2005
2006
2007
2008
2009
US$
(bill
ions
)

Demand, supply and price of copper – an exploration perspective 21
• Global copper reserves and resources are sufficient for several decades. Ongoing exploration will continue to deliver new resources
• Reserve and resource grades are progressively declining due to depletion of supergene-enrichment blankets in the major producing districts
• Greenfield exploration in under-explored countries offers some potential to reverse this trend through new surface copper discoveries. However, the full potential of these countries to support major production may be undermined by sovereign risk factors
• Deeper discoveries are appearing in known districts as we explore around surface deposits. Some of these brownfield discoveries have unusually high copper and by-product grades
• Innovation in mining and processing technology may reduce the costs of production from lower-grade surface resources
• Given forecast future demand, future copper prices will depend on the relative success of greenfield discovery, brownfield discovery and innovation in mining and processing
Summary
