demand side management of an urban water supply using ... · demand side management of an urban...
TRANSCRIPT

Demand Side Management of an Urban Water Supply UsingWholesale Electricity Price
Kernan, R., Liu, X., McLoone, S., & Fox, B. (2017). Demand Side Management of an Urban Water Supply UsingWholesale Electricity Price. Applied Energy, 189, 395-402. https://doi.org/10.1016/j.apenergy.2016.12.082
Published in:Applied Energy
Document Version:Peer reviewed version
Queen's University Belfast - Research Portal:Link to publication record in Queen's University Belfast Research Portal
Publisher rights© 2016 Elsevier Ltd. This manuscript version is made available under the CC-BY-NC-ND 4.0 license http://creativecommons.org/licenses/by-nc-nd/4.0/,which permits distribution and reproduction for non-commercial purposes, provided the author and source are cited.
General rightsCopyright for the publications made accessible via the Queen's University Belfast Research Portal is retained by the author(s) and / or othercopyright owners and it is a condition of accessing these publications that users recognise and abide by the legal requirements associatedwith these rights.
Take down policyThe Research Portal is Queen's institutional repository that provides access to Queen's research output. Every effort has been made toensure that content in the Research Portal does not infringe any person's rights, or applicable UK laws. If you discover content in theResearch Portal that you believe breaches copyright or violates any law, please contact [email protected].
Download date:15. Jan. 2020

Demand Side Management of an Urban Water Supply Using WholesaleElectricity Price
R. Kernan∗, X. Liu, S. McLoone, B. Fox
School of Electronics, Electrical Engineering and Computer Science, Queen’s University Belfast
Abstract
Municipal water supply consumes large quantities of electrical energy to move water from catchment areas toservice reservoirs near centres of population. Pumping does not necessarily occur round the clock, but rather whennecessary to uphold constraints relating to reservoir levels and system pressure. There is a degree of flexibility in thetiming of pumping that makes it an excellent candidate for Demand Side Management, meaning that it can provideopportunities for improving power system operation and reducing electricity costs for the water utility. The extent ofthis flexibility depends on a number of factors. This study examines the optimisation of two water supply systems- the ‘Van Zyl’ benchmark system and a representation of the supply for the city of Belfast, Northern Ireland. Thepotential to employ intelligent operation of pumps to help bolster uptake of variable wind generation is assessed, as isquantification of the potential savings for a water utility. The results show significant potential savings for the waterutility as well as a substantial increase in the utilisation of wind power.
Keywords: Demand Side Management, Real Time Pricing, Genetic Algorithms, Wind Energy, Renewable Energy,Optimisation, Water Pumping
Nomenclature1
i Time period (i = 1,2, ... 24, 60 min/period)m Mourne supplyn Lough Neagh supplyd Inside pipe diameter (m)h f Head loss (m)C Hazen-Williams pipe roughness coefficientL Pipe length (m)Q Volumetric flow rate (m3/s)Ei Electricity cost, ith period (£)Wi Wind generation as % of total in ith periodFp,i Pump p flow rate, ith period (l/s)Mi Energy cost per unit, ith period (£/kWh)Dp,i Flow from service reservoir p, ith period (l/s)Pp,i Pump p energy consumption, ith period (kWh)Rp,i Service reservoir p water volume, ith period (l)Rp,max Maximum water volume, service reservoir p (l)Rp,min Minimum water volume, service reservoir p (l)
∗Corresponding authorEmail address: [email protected] (R. Kernan)
1. Introduction2
The drive to phase out fossil-fired generation has in-3
creased investment in renewable generation. In North-4
west Europe, wind is an abundant renewable resource5
[1], and, as such, significant efforts have been made to6
increase the penetration of wind generation in power7
systems.8
Ireland, although composed of two political jurisdic-9
tions (the Republic of Ireland and Northern Ireland), has10
one synchronised power system and Single Electricity11
Market (SEM). The Irish power system supports a rel-12
atively small population of 6.5 million people and has13
750 MW of HVDC interconnection with Britain [2]. A14
target of 40% of all electricity is to come from renew-15
able sources by 2020, predominantly from wind power16
[3]. This target causes some issues for the Irish system,17
some of which are unique due to its relative isolation18
and limited available interconnection.19
Modern wind turbines, unlike traditional syn-20
chronous generators, do not provide inertia to the power21
system as their rotating masses are connected to the grid22
through power electronics. Significant power system in-23
ertia mitigates frequency transients during system faults24
Preprint submitted to Applied Energy December 9, 2016

and large disturbances [4], and hence it is necessary to25
maintain a minimum level of system inertia. Unlike26
other countries with high penetrations of wind power27
(such as Denmark), Ireland has only limited HVDC in-28
terconnection, which provides no inertial support. Be-29
cause of this constraint, System Non-Synchronous Pen-30
etration (SNSP) is currently limited to 55% on the Irish31
power system [5], with any renewable generation above32
this level wasted. Due to its variable nature, wind power33
is non-dispatchable apart from curtailment by a system34
operator.35
In order to meet the high targets for wind power inte-36
gration, it is estimated that the SNSP limit would have37
to be raised to 70% to avoid excessive curtailment [2].38
This will be a significant challenge, especially for con-39
ventional generators [5], but presupposes that genera-40
tion must be varied to meet a varying demand beyond41
the operator’s influence. Under this regime, the system42
operator would have more problems when controlling43
a power system with high penetrations of wind power44
than one without. Dispatchable generation would see45
much greater variation in output in order to address46
wind variability, which is undesirable as it prevents gen-47
erators operating at their most efficient settings.48
Demand Side Management (DSM) provides a means49
of mitigating the regulation duty of conventional gen-50
eration. DSM has traditionally been seen as a method51
whereby a system operator or utility would exert direct52
control over load [6]. The main contribution of this53
work is in investigating whether market-driven DSM54
can provide improvements in wind power utilisation to55
the power system without explicit system operator inter-56
vention, but rather by the load responding to changes in57
system price. This is the first study to optimise a water58
network on the basis of Real-Time Pricing (RTP) and59
quantify both the energy cost savings and wind power60
utilisation.61
2. Scope for Optimising Water Supply62
2.1. Demand Side Management63
With DSM, supply of managed load is encouraged64
when net demand (consumer demand less renewable65
generation) is low. The incentive is the lower cost of66
electricity at such times. Conversely, the supply of man-67
aged load is discouraged when net demand, and elec-68
tricity price, are high. The boost to net demand when69
renewable generation is plentiful eases the SNSP con-70
straint.71
DSM is regarded as an important part of the future72
operation of power networks and as such has been the73
focus of a number of studies. Where DSM has been74
carried out based on energy cost, it has primarily been75
on the basis of Time of Use (ToU) pricing [8][9][11].76
These are multi-rate tariffs which change several times77
a day. Although promoting energy use during off-peak78
times, ToU tariffs do not track the actual market price79
of electricity and thus do not provide an incentive80
for consumers to respond to specific events, such as81
generator outages or high-wind scenarios. ToU tariffs82
reflect only the general trends of electricity cost and83
usually have no more than four changes per day.84
Increased penetrations of variable generation such as85
wind generation mean that price peaks do not always86
occur at the same time of day, as high penetrations of87
low marginal cost generation during peak times reduce88
the need for low merit generation, thus reducing market89
prices. ToU tariffs do not reflect these day-to-day90
variations. An RTP tariff, based on the wholesale cost91
of electricity, offers a realistic means of tracking the92
variation in system price.93
RTP-based DSM has been implemented in [12]-[15]94
with significant savings in energy cost. Finn et al. in95
[14] optimised residential load on the basis of RTP and96
saw increases in wind power utilisation of up to 23.3%,97
while in [15], RTP-based optimisation of industrial98
loads saw wind power utilisation increase by 5.8%99
while also reducing energy cost.100
A common theme is the aggregation of flexible101
residential loads through the use of smart meters and a102
central controller in order to minimise decision making103
and maximise savings [7]-[9]. Such schemes have the104
disadvantage of involving a large number of stake-105
holders (residential consumers) who must voluntarily106
submit to having their energy consumption controlled107
externally. However, the potential has been shown108
for significant savings in energy costs for consumers.109
Vanthournout et al. in [10] found that it was difficult110
to maintain involvement of residential consumers in111
RTP schemes due to response fatigue - automation was112
required in order to make it viable.113
DSM has also been demonstrated as being viable for114
provision of balancing reserve for wind generation [9].115
Industrial loads frequently have a higher degree of116
operational flexibility than residential loads [13],[15].117
Industrial consumers represent 42% of global electrical118
consumption. Industrial units are large compared119
to residential or commercial loads and are centrally120
controlled and owned, reducing the complexity of121
co-ordination and thus making them very attractive for122
DSM [16]. In [13], DSM of aggregated residential load123
was compared with that of representative commercial124
demand and a number of typical industrial processes. A125
2

Figure 1: Layout of a water supply network
10% saving in energy costs was seen with the industrial126
DSM, compared to 5.8% for commercial and 5% for127
residential. Similarly high savings were also seen in128
[12].129
130
2.2. Public Water Supply131
Public water supply is an excellent candidate for the132
application of DSM due its significant potential for133
a large number of operating modes. Water networks134
are centrally owned and controlled and would require135
minimal modification to allow optimised operation.136
Water pumping can be classed broadly as an inter-137
ruptible load. In [16], a steel mill was optimised on138
the basis of several smart pricing scenarios. Under139
each pricing model, optimal scheduling resulted in140
higher profit, although higher profits were seen with141
ToU pricing compared to RTP - the steel mill which142
was modelled operated on a batch cycle, meaning143
that once a batch started it could not be interrupted144
- making it less suitable for taking advantage of the145
higher level of variability of RTP compared to ToU146
pricing. Water pumping can be interrupted, provided147
reservoir level constraints are maintained and wear148
from pump switching is considered. The basic layout149
of a water supply system can be seen in Fig. 1. Large,150
centrally controlled pumps are used to move water151
from catchment areas to service reservoirs (SRs) near152
centres of population, from which water flows to153
consumers. The hydrostatic head of these SRs is used154
to maintain system pressure and, as long as SR water155
levels are maintained between minimum and maximum156
levels, there is a high degree of flexibility over the157
timing of pumping. The electricity demand of Northern158
Ireland Water (NIW) accounts for approximately 3%159
of all electrical demand in Northern Ireland, a figure160
representative of water supply systems worldwide.161
NIW oversees 26,700 km of water mains, supplying162
563 million litres of water per day to 1.8 million people.163
A total of 23 impounding reservoirs supply more than164
370 supply reservoirs [17].165
166
Figure 2: SMP and wind generation, June 2015
Many of NIW’s facilities are run on ToU tariffs. NIW167
have carried out basic optimisation at some of their168
pumping stations in the past, trying to carry out as much169
pumping as possible during low-price periods.170
In the SEM, System Marginal Price (SMP) changes171
every 30 minutes and reflects the operating cost of the172
single most expensive generator required to fulfill de-173
mand [20]. The higher the penetration of wind genera-174
tion on the power system, the lower the requirement for175
expensive generation. Since wind is considered to have176
no marginal cost, higher wind penetrations should result177
in a lower system cost. Fig. 2 shows the final SMP plot-178
ted against wind generation for one month in 2015. It is179
clear from this graph that there is some degree of cor-180
relation between wind and SMP: this can be explained181
by the current conservative operation of the power sys-182
tem. When wind penetrations are high, marginal gen-183
eration is not decommitted but rather dispatched down.184
This policy, though resulting in generators running at185
low efficiencies, gives the system operator a margin for186
3

error with regard to wind forecasting uncertainty. At187
very high wind penetrations such a policy would not be188
justifiable.189
SMP-based optimisation of load would nonetheless190
help to flatten the demand curve, as it would promote191
operation during low demand and low price scenarios192
while discouraging consumption during peak periods.193
There are several different ‘versions’ of SMP. The ac-194
tual price paid to generators (termed as Ex Post 2 or195
EP2) is not published by the SEM Operator (SEM-O)196
until four days after the day in question (D+4). A full197
day forecast (Ex-ante 1, EA1) is made available at 11:00198
one day before actual trading. This is updated at 16:00199
with the Ex-Ante 2 or EA2 forecast, and again at 9:30200
on the day itself with the Within Day 1 (WD1) forecast201
[21]. It is on the basis of these forecasts that pump-202
ing optimisation is proposed in this work. Optimising203
demand on the basis of the forecast wholesale price of204
electricity could provide a means to increase the uptake205
of wind generation by encouraging demand when wind206
generation is high as well as minimising the price paid207
by the consumer.208
In [14], Finn et al. carried out a 6-month study on209
a domestic dishwasher, optimising operation based on210
EA1 and EP2 SMP. EP2 optimisation saw energy cost211
decrease by more than 20% and wind power utilisa-212
tion increase by 23.5%, while EA1 optimisation saw213
a 17.5% reduction in cost and wind power utilisation214
increase by 16.9%. The inherent uncertainty of price215
forecasting means that it would be almost impossible to216
make the savings seen in the EP2 scenario. This study217
found that scheduling load on the basis of the EA1 fore-218
cast was a viable way to reduce energy costs and im-219
prove wind power utilisation.220
In [22], Paudyal et al. applied an industrial load man-221
agement model to a simplified representation of a water222
pumping facility, based on one day of data relating to223
an RTP tariff in Ontario, Canada. A 38.1% decrease224
in energy costs compared to non-optimised operation225
was observed. This simulation, although short in du-226
ration and disregarding hydraulic constraints, is notable227
in that it considers the impact of water pumping optimi-228
sation on the power system, citing its implementation as229
a means by which system operators could reduce peak230
demand.231
DSM of water networks is cost effective and tech-232
nically feasible, and price based optimisation of water233
networks has been carried out in the past [22]-[30].234
3. Optimisation235
Various methods have been proposed for pumping236
optimisation, including linear programming [23],237
non-linear programming [24] and dynamic program-238
ming [25]. Heuristic methods, particularly Genetic239
Algorithms (GAs), have been used successfully in a240
number of studies, as they avoid the combinatorial241
explosion inherent in other methods [27]-[30].242
GAs are meta-heuristic algorithms which simulate243
evolution and natural selection to select solutions in244
a given generation based on a measure of fitness (the245
fitness function). The algorithm initialises by randomly246
creating a population of potential solutions. The fittest247
solutions in each generation are bred with each other248
(crossover) to create the next generation. An individual249
solution’s chance of survival is proportional to its250
fitness. Random mutation is employed in order to251
diversify the population and reduce the likelihood of252
convergence to a non-global optimum [31]. Mutation253
and crossover are controlled by predefined probabili-254
ties. There are a number of different ways of defining255
how many individuals survive from one generation to256
the next - elitism was used here to ensure that the fittest257
individual in a given generation was carried forward to258
the next.259
260
4. Water Network modelling and specification261
In this work, the pumping schedules of two water supply262
systems were optimised - the ‘Van Zyl’ benchmark net-263
work, first proposed in [27], and the high-level supply of264
the city of Belfast, Northern Ireland. Optimisation was265
carried out using the ‘pyevolve’ toolkit in Python, inte-266
grated with the EPANET water network modelling soft-267
ware [26]. Potential solutions were generated by a GA,268
which were then evaluated for violation of hydraulic269
constraints in EPANET before being passed back to the270
GA to evaluate reservoir level and maximum daily flow271
constraints. Feasible solutions were scored on the basis272
of the optimisation objective (fitness function), depend-273
ing on the scenario.274
4.1. ‘Van Zyl’ benchmark system275
The ‘Van Zyl’ test system was first used by Van276
Zyl et al. in [27] and has been frequently used as a277
benchmark system for testing optimisation algorithms278
and investigating new operating procedures. It con-279
sists of a reservoir supplying two tanks (at different280
altitudes) via two primary pumps and one boost pump281
(see Fig. 3, full system specification in [27]). Demand282
4
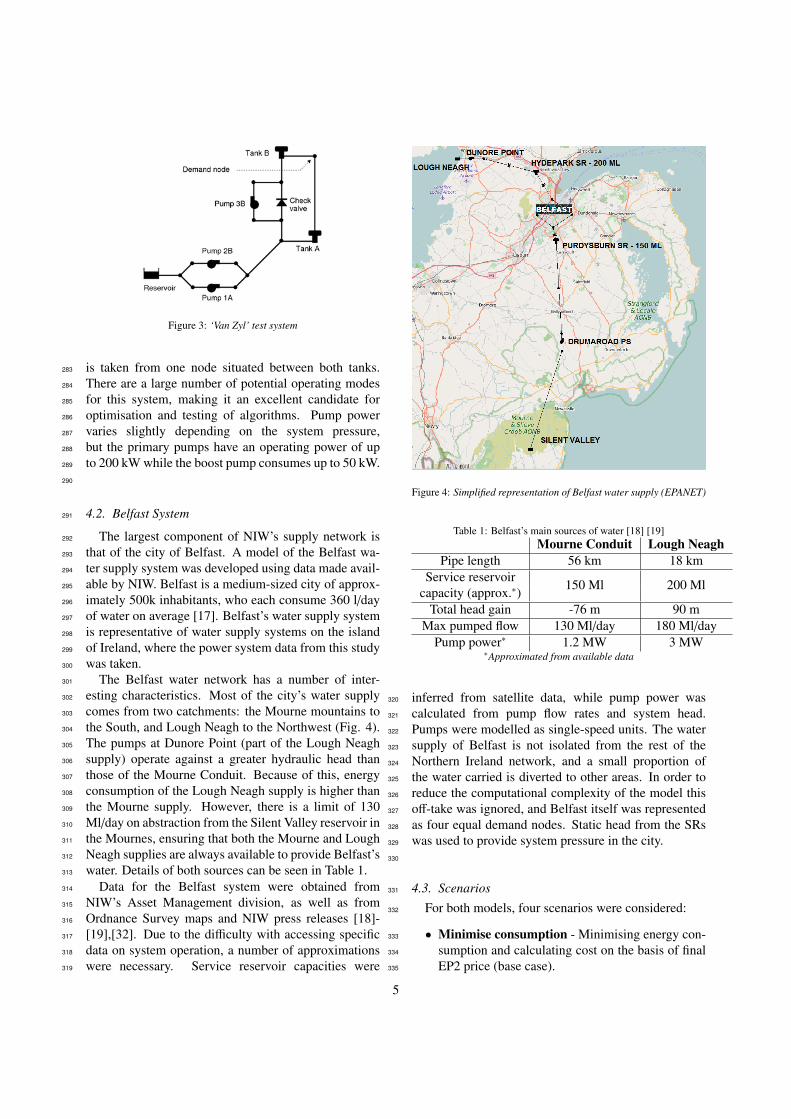
Figure 3: ‘Van Zyl’ test system
is taken from one node situated between both tanks.283
There are a large number of potential operating modes284
for this system, making it an excellent candidate for285
optimisation and testing of algorithms. Pump power286
varies slightly depending on the system pressure,287
but the primary pumps have an operating power of up288
to 200 kW while the boost pump consumes up to 50 kW.289
290
4.2. Belfast System291
The largest component of NIW’s supply network is292
that of the city of Belfast. A model of the Belfast wa-293
ter supply system was developed using data made avail-294
able by NIW. Belfast is a medium-sized city of approx-295
imately 500k inhabitants, who each consume 360 l/day296
of water on average [17]. Belfast’s water supply system297
is representative of water supply systems on the island298
of Ireland, where the power system data from this study299
was taken.300
The Belfast water network has a number of inter-301
esting characteristics. Most of the city’s water supply302
comes from two catchments: the Mourne mountains to303
the South, and Lough Neagh to the Northwest (Fig. 4).304
The pumps at Dunore Point (part of the Lough Neagh305
supply) operate against a greater hydraulic head than306
those of the Mourne Conduit. Because of this, energy307
consumption of the Lough Neagh supply is higher than308
the Mourne supply. However, there is a limit of 130309
Ml/day on abstraction from the Silent Valley reservoir in310
the Mournes, ensuring that both the Mourne and Lough311
Neagh supplies are always available to provide Belfast’s312
water. Details of both sources can be seen in Table 1.313
Data for the Belfast system were obtained from314
NIW’s Asset Management division, as well as from315
Ordnance Survey maps and NIW press releases [18]-316
[19],[32]. Due to the difficulty with accessing specific317
data on system operation, a number of approximations318
were necessary. Service reservoir capacities were319
Figure 4: Simplified representation of Belfast water supply (EPANET)
Table 1: Belfast’s main sources of water [18] [19]Mourne Conduit Lough Neagh
Pipe length 56 km 18 kmService reservoir 150 Ml 200 Mlcapacity (approx.∗)Total head gain -76 m 90 m
Max pumped flow 130 Ml/day 180 Ml/dayPump power∗ 1.2 MW 3 MW
∗Approximated from available data
inferred from satellite data, while pump power was320
calculated from pump flow rates and system head.321
Pumps were modelled as single-speed units. The water322
supply of Belfast is not isolated from the rest of the323
Northern Ireland network, and a small proportion of324
the water carried is diverted to other areas. In order to325
reduce the computational complexity of the model this326
off-take was ignored, and Belfast itself was represented327
as four equal demand nodes. Static head from the SRs328
was used to provide system pressure in the city.329
330
4.3. Scenarios331
For both models, four scenarios were considered:332
• Minimise consumption - Minimising energy con-333
sumption and calculating cost on the basis of final334
EP2 price (base case).335
5

• EP2 - Minimising cost on the basis of the final EP2336
price.337
• EA1 - Minimising cost on the basis of EA1 fore-338
cast price and calculating cost on the basis of final339
EP2 price.340
• Maximise wind - Maximise wind power utilisa-341
tion by aligning demand as much as possible with342
periods of high wind penetration.343
4.4. Optimisation Method344
Both systems were optimised on a daily basis in the345
period 1 April 2012 - 31 March 2015. Real data for346
EA1 and EP2 SMP were used as inputs, as were data for347
wind generation and penetration. Water demand pro-348
files were taken from data supplied by NIW for pre-349
vious work [33], and scaled according to the size of350
the system. A GA was used for the main optimisation,351
which integrated with the EPANET hydraulic solver to352
assess the viability of potential solutions. Candidate353
solutions were 72-bit binary strings in the case of the354
‘Van Zyl’ model and 48-bit strings in the Belfast model,355
corresponding to the operation of each pump modelled356
hourly over a 24-hour period. Hydraulically infeasible357
solutions were penalised, and feasible solutions scored358
based on the objective function of the scenario mod-359
elled. A solution was produced for each day in the mod-360
elled period, with the outputs at the end of each day used361
as the initial conditions of the following day.362
In the ‘Van Zyl’ model, 150 generations of GA were363
used, while 50 were used in the Belfast model. Both364
used a population of 200. The crossover rate was 100%,365
meaning all solutions were ‘interbred’. The mutation366
rate was 3%. These figures were arrived at through em-367
pirical evaluation. A flowchart of the methodology can368
be seen in Fig. 5.369
370
4.5. Objective Function371
For each scenario, the optimisation objective functionwas different. In the EA1 and EP2 scenarios, the objec-tive was minimisation of cost (Eq. 1).
minimise:∑24
i=1 Ei (1)
In the ‘minimise consumption’ scenario, it was to min-imise the overall quantity of energy consumed (Eq. 2).
minimise:∑24
i=1 Pp,i ∀p (2)
The objective of the ‘max wind’ scenario was to max-imise the quantity of wind energy consumed (Eq. 3).
maximise:∑24
i=1 Wi (3)
Figure 5: Genetic Algorithm and model methodology
4.6. Constraints372
For both service reservoirs, the reservoir level at timeperiod i was equal to the reservoir level at time periodi−1 minus the outflow during i−1 plus the inflow duringi − 1.
Rp,i = Rp,i−1 − Dp,i−1 + Fp,i−1 ∀p ∀i (4)
The cost of electricity consumption during time periodi was equal to the unit cost of electricity during i mul-tiplied by the power consumption of the pumps duringthe same period.
Ei = MiPp,i ∀p ∀i (5)
SR levels were allowed to vary between specified mini-mum and maximum levels (Eq. 6).
Rp,min ≤ Rp,i ≤ Rp,max ∀p ∀i (6)
4.7. Belfast Model Constraints373
There were two constraints implemented in theBelfast model that were not in the ‘Van Zyl’ model -
6

abstraction from Silent Valley Reservoir was limited to130 Ml per day, and a ‘mass balance’ constraint was en-forced, requiring SR water levels to be at least 90% ofinitial level (on 1 April 2012) at the end of each day (seeEq. 7). The ‘mass balance’ constraint was necessary toprevent reservoirs having insufficient capacity for high-demand days. ∑24
i=1 Fm ≤ 130 × 106
Rp,i=24 ≥ 0.9Rp,initial ∀p(7)
4.8. Hydraulic Modelling374
The Hazen-Williams equation (Eq. 8), [34] is an em-pirical formula which models the pressure drop of waterflowing in pipes. The EPANET solver uses this equationto calculate system pressure losses, allowing accuratecalculation of F and D at each time step. Pipes weremodelled as plastic-lined, with a roughness coefficient(C) of 130.
h f
L=
10.67Q1.85
C1.85d4.87 (8)
5. Results375
The algorithm output data for each day showing376
reservoir level variation, pump operation, flow rates, en-377
ergy consumption and final solution feasibility (a feasi-378
ble solution was found for all days with both models).379
Table 2 provides a summary of the salient data.380
5.1. ‘Van Zyl’ Model381
Despite serving the same demand, the scenarios382
modelled showed a significant variation in the total383
amount of water pumped. This is because pump 3B384
(see Fig. 3) acted as a top-up pump, transferring water385
from one SR to another. The ‘max wind’ scenario saw386
this pump used extensively, thus resulting in the higher387
energy consumption and pumped flow averages that388
can be seen in Table 2.389
390
The ‘minimise consumption’ scenario consumed391
2% less electricity then any other scenario while also392
maintaining the lowest average value of pumped flow.393
Despite this, it was the most expensive scenario, costing394
13.4% more than the EP2-based optimisation (Fig. 6).395
All scenarios showed an increase of wind power396
contribution compared to the system average (Fig. 7).397
Optimising on the basis of the wind penetration saw a398
large increase of wind contribution - 18.2% higher than399
what would be expected from the system average.400
EA1 forecast price was consistently lower than the401
final EP2 price (underestimating final cost by 13.6%402
on average) but was still cheaper than two of the three403
other scenarios. This optimisation also showed similar404
contributions from wind power to the EP2 case.405
406
5.2. Belfast Model407
All four scenarios of the Belfast model showed very408
similar values for total pumped flow, as would be ex-409
pected from the radial nature of this network. Energy410
consumption and pumped flow do not correlate directly411
due to the different energy consumptions of both sup-412
plies, and the fact that the relationship between flow rate413
and power depend on the operating head of the system,414
which vary due to the level in the SRs. The ‘max wind’415
scenario, which paid no heed to the cost or quantity of416
energy, gave the highest values for pumped flow and417
power consumption but also saw a 19.7% increase in418
wind contribution compared to the system average (Fig.419
9) while also being 10.4% cheaper than the ‘minimise420
consumption’ scenario.421
A similar pattern of operating cost was evident for422
the Belfast model as for the ‘Van Zyl’ model: EP2 op-423
timisation was the cheapest, followed by EA1. The one424
exception to this was the ‘minimise consumption’ sce-425
nario - this actually produced higher power consump-426
tion than either the EA1 or EP2 optimisations. This is427
due to a cycle observed in the output data, caused by428
the 24-hour horizon of the optimisation - initially, both429
service reservoirs would be allowed to drain as much430
as possible in order to minimise pumping. As the opti-431
misation started again for the following day, both reser-432
voirs would be depleted and significant pumping would433
be required to maintain water supply. The Lough Neagh434
supply consumed approximately 2.5 times more energy435
for each litre of water pumped compared to the Mourne436
supply. In the price- and wind-based scenarios, more437
use was made of the cheaper Mourne supply, thus re-438
ducing the need for the more expensive Lough Neagh439
water. In the Belfast model, ‘max wind’, was cheaper440
than ‘minimise consumption’ (Fig. 8). This may have441
been due to the fact that the ‘Van Zyl’ ‘max wind’ sce-442
nario consumed significantly more power than the other443
scenarios (thus increasing energy cost) while the Belfast444
‘max wind’ scenario consumed only slightly more.445
EA1 optimisation underestimated the final EP2 cost446
by 13.8% on average but saw an increase in wind power447
contribution of 7.8%.448
On average, across all scenarios, the Lough Neagh449
supply provided 51% more water than the Mourne sup-450
ply, due to the constraint on abstraction from Silent Val-451
ley and the larger volume of the Hydepark SR. 0.16452
kWh were used by the Mourne supply pumps for each453
7

Table 2: Summary of Results, April 2012 - March 2015Daily Averages Min. Cons. EA1 EP2 Max. Wind
‘VAN ZYL’ MODEL
Energy consumption (kWh) 3628 3705 3713 3885Final (EP2) cost (£) 189.6 173.8 164.2 183.1EP2 unit cost (p/kWh) 4.79 4.69 4.42 4.71Pumped flow (m3) 14885 15359 15613 16229Cost per m3 pumped (p) 1.274 1.131 1.052 1.128Expected wind contribution (kWh) 676.6 690.8 692.4 724.4(18.65% system av. penetration)Wind contribution (kWh) 689.8 (+1.95%) 732.7 (+6.06%) 745.9 (+ 7.73%) 856 (+18.17%)
BELFAST MODEL
Energy consumption (kWh) 55250 55071 55045 55874Final (EP2) cost (£) 2846 2425 2278 2550EP2 unit cost (p/kWh) 5.15 4.40 4.14 4.56Pumped flow (m3) 180449 180873 180903 185957Cost per m3 pumped (p) 1.577 1.341 1.259 1.371Expected wind contribution (kWh) 10303 10270 10265 10419(18.65% system av. penetration)Wind contribution (kWh) 10473 (+1.65%) 11066 (+7.75%) 11352 (+ 10.60%) 12467 (+19.65%)
m3 of water supplied, while the Lough Neagh pumps454
consumed 0.4 kWh for each m3 pumped. This was con-455
sistent across all scenarios and is due to the fact that the456
Lough Neagh pumps had to pump against a head of 90457
m, while the Mourne pumps were moving water against458
a negative head (-76 m).459
6. Discussion460
In this research, two water supply systems (the ‘Van461
Zyl’ test system and a model representing the supply462
for the city of Belfast) were optimised on the basis463
of minimising electricity consumption, maximising464
wind power contribution, and minimising electricity465
cost (using both forecast and actual system price).466
Pumping costs and contribution from wind power467
were quantified, with the Belfast model giving results468
consistent with the benchmark system.469
EP2 optimisation was consistently the least expen-470
sive, as might be expected as EP2 represents the final471
cost of wholesale electricity. It would not be possible to472
optimise on the basis of EP2 in reality as it is not known473
until four days after the event, but it represents the most474
cost-efficient operation possible. EA1 optimisation is475
achievable, as EA1 data are made available one day476
in advance. Despite underestimating final costs by477
approximately 14%, EA1-based optimisation nonethe-478
less represented a significant saving compared to the479
non-price-based scenarios. A water utility optimising480
pumping on the basis of the publicly available SMP481
forecast could make significant savings compared to482
normal operation.483
It should be noted that all prices discussed here are484
wholesale prices - they do not reflect the final price a485
customer would pay as SMP does not include the cost486
of distribution or transmission. It can be reasonably487
assumed that this added cost would be fairly constant488
[35] and would not affect the results seen here, other489
than to increase the cost of all scenarios by a compa-490
rable margin. A further limitation is that neither of the491
models analysed here included constraints relating to492
water treatment, which is either a continuous or batch493
process. Water is treated before being pumped to ser-494
vice reservoirs, with the treatment plant usually being495
on the same site as the pumping station (as is the case496
with both Dunore Point and Drumaroad). The Belfast497
model represents a simplification of the reality, in that498
the city itself was modelled as four demand nodes and499
offtake from both conduits for other areas were ignored;500
however, this should not have a significant effect on the501
results as the demand was scaled to compensate for the502
excess water that would have otherwise served areas503
beyond Belfast, and flow within the Belfast network504
8

Figure 6: Average SMP energy cost, ‘Van Zyl’ model
Figure 7: Average contribution of energy consumption from wind,‘Van Zyl’ model
itself would have little bearing on the demand from the505
SRs.506
For both models, the ‘max wind’ scenario showed507
a significant cost saving compared to the ‘minimise508
consumption’ scenario. Both SMP-based optimisa-509
tions also showed significant increases in wind power510
contribution compared to both the system average and511
the ‘minimise consumption’ scenario. This reinforces512
the suggestion that there is a correlation between wind513
penetration and system price. While not as conducive514
to high wind contributions as wind-based optimisation,515
SMP-based optimisation represents a viable means516
of incentivising demand to react to wind generation.517
However, the difference in wind contribution between518
the EA1 and EP2 scenarios shows that this link is519
dependent on the accuracy of wind forecasting in the520
operation of the electricity market. The very high521
increases in wind contribution seen in the ‘maximise522
wind’ scenario are also unlikely to be achievable in523
reality as they are based on perfect foresight of wind524
generation.525
In the Irish SEM, the EA1 forecast is updated later526
on D-1 with an EA2 forecast, and then again on the527
morning of the day itself with the WD1 forecast.528
In practice, an EA1-based pumping schedule could529
Figure 8: Average SMP energy cost, Belfast model
Figure 9: Average contribution of energy consumption from wind,Belfast model
be updated when these forecasts are released. The530
increased accuracy of these forecasts should correlate531
with costs and wind contributions closer to those seen532
in the EP2 scenario. High-wind events are frequently533
multi-day, and so if a period of sustained high wind was534
forecast, relaxing the mass balance constraint of the535
Belfast system could allow tanks to be filled during this536
period of low cost generation, or allow the water level537
to gradually deplete in anticipation of such an event.538
539
7. Conclusion540
The main contribution of this study is in showing that541
price-based optimisation of water supply provides an542
opportunity to benefit both the water utility (through re-543
duced cost) and the power system (through increased544
uptake of wind power). Providing that the consumer545
is paying a tariff based on the wholesale cost of en-546
ergy, optimising pump operation on the basis of an SMP547
forecast would allow the water utility to make signifi-548
cant cost savings compared to normal operation while549
increasing utilisation of wind generation. In a mar-550
ket such as the Irish SEM, where wind power is price-551
taking rather than price-making, optimising on the ba-552
sis of SMP effectively amounts to market-driven DSM553
9

(rather than that which involves explicit operator con-554
trol) which has the advantage of encouraging alignment555
of energy consumption with wind generation. Optimis-556
ing on the basis of the wind penetration itself increases557
the contribution of wind generation even further, while558
still reducing the cost of electricity. Implementing this559
in reality would be a more explicit form of DSM, either560
by direct signal from the energy utility or by design-561
ing a tariff based entirely on wind generation rather than562
SMP.563
Both approaches provide advantages for both con-564
sumer and system, but a trade-off is required between565
cost and wind power uptake. If the system operator566
wished to maximise wind generation to the fullest ex-567
tent, more explicit DSM would be desirable, thus pro-568
viding the benefit seen in the ‘max. wind’ scenario here.569
However, if flattening of the load curve was also a prior-570
ity for the system then SMP-based optimisation would571
be advantageous in that it would discourage load during572
peak times (which, due to variable generation, do not al-573
ways occur at the times reflected by standard multi-rate574
tariffs) while also, to a certain extent, promoting utilisa-575
tion of wind power.576
The methodology used here could be applied to any577
water supply system, with modifications to suit the578
needs of the particular system - for example, to take579
account of water treatment constraints, or daily or sea-580
sonal limits on water abstraction. The effectiveness of581
the method would in large part be dictated by the flow582
rate of the pumps and storage capacity of service reser-583
voirs in relation to the water demand. It should also be584
noted that the approach detailed here could be applied585
to any dispatchable load. If implemented on a sufficient586
scale, it would reduce both the need for thermal genera-587
tion and for wind power curtailment.588
Acknowledgement589
The authors would like to thank Northern Ireland Wa-590
ter for the provision of data and access to system in-591
formation, and the NI Department of Employment and592
Learning for project funding.593
References594
[1] European Environment Agency, “Europe’s onshore595
and offshore wind energy potential”, Tech. Rep. no.596
6/2009, [online]. Available: https://www.energy.597
eu/publications/a07.pdf598
[2] McGarrigle, E.V., Deane, J.P., Leahy, P.G., “How much599
wind power will be curtailed on the 2020 Irish power600
system?”, Renew. Energ., vol 55, pp. 544-553, 2013.601
[3] Sustainable Energy Authority of Ireland, “Ireland’s en-602
ergy targets: progress, ambition and impacts - summary603
for policy makers”, Tech. Rep., April 2016, [online].604
Available: https://www.seai.ie/Publications/605
Statistics_Publications/Energy_Modelling_606
Group_Publications/Ireland%E2%80%607
99s-Energy-Targets-Progress-Ambition-and-Impacts.608
pdf609
[4] Wu, D., Javadi, M., Jiang, J.N., “A preliminary study of610
impact of reduced system inertia in a low-carbon power611
system”, Jour. of Mod. Power Sys. Clean Energ., vol 3,612
no. 1, pp. 82-92, 2015.613
[5] Eirgrid Group, “DS3 Programme operational614
capability outlook 2016”, Tech. Rep., [on-615
line]. Available: http://www.eirgridgroup.616
com/site-files/library/EirGrid/617
DS3-Operational-Capability-Outlook-2016.618
pdf619
[6] Cohen, A.I., Wang, C.C., “An optimization method for620
load management scheduling,” IEEE Trans. Power Sys.,621
vol. 3, no. 2, pp. 612-618, 1988.622
[7] Qian, L.P., Zhang, Y.J., Huang, J., Wu, Y., “Demand re-623
sponse management via real-time electricity price con-624
trol in smart grids”, IEEE Jour. Sel. Areas in Comm.,625
vol. 31, no. 7, pp. 1268-1280, 2013.626
[8] Adika, C.O., Wang, L., “Autonomous appliance627
scheduling for household energy management”, IEEE628
Trans. Smart Grid, vol. 5, no. 2, pp. 673-682, 2014.629
[9] Pourmousavi, S.A., Patrick, S.N., Nehrir, M.H., “Real-630
time demand response through aggregate electric wa-631
ter heaters for load shifting and balancing wind gener-632
ation”, IEEE Trans. Smart Grid, vol. 5, no. 2, pp. 769 -633
777, 2014.634
[10] Vanthournout, K., Dupont, B., Foubert, W., Stuckens,635
C., Claessens, S., “An automated residential demand re-636
sponse pilot experiment, based on day-ahead dynamic637
pricing”, Appl. Energy, vol. 155, pp. 195-203, 2015.638
[11] van Staden, A.J., Zhang, J., Xia, X., “A model predic-639
tive control strategy for load shifting in a water pump-640
ing scheme with maximum demand charges”, Appl. En-641
ergy, vol. 88, pp. 4785-4794, 2011.642
[12] Roos, J.G., Lane, I.E., “Industrial power demand re-643
sponse analysis for one-part real-time pricing”, IEEE644
Trans. Power Sys., vol. 13, no. 1, pp. 159-164, 1998.645
[13] Logenthiran, T., Srinivasan, D., Shun, T.Z., “Demand646
side management in smart grid using heuristic opti-647
mization”, IEEE Trans. Smart Grid, vol. 3, no. 3, pp.648
1244-1252, 2012.649
[14] Finn, P., O’Connell, M., Fitzpatrick, C., “Demand side650
management of a domestic dishwasher: Wind energy651
gains, financial savings and peak-time load reduction”,652
Appl. Energy, vol. 101, pp. 678-685, 2013.653
[15] Finn, P., Fitzpatrick, C., “Demand side management of654
industrial electricity consumption: Promoting the use655
of renewable energy through real-time pricing”, Appl.656
Energy, vol. 113, pp. 11-21, 2014.657
[16] Gholian, A., Mohsenian-Rad, H., Hua, Y., “Optimal in-658
dustrial load control in smart grid”, IEEE Trans. Smart659
Grid, vol.7, no.6, pp. 2305-2316, 2016.660
[17] NI Water, “Annual Report 2014-15”, [online]. Avail-661
able: https://www.niwater.com/sitefiles/662
resources/pdf/reports/annualreport/663
niwannualreport2014-15.pdf664
[18] UK Water Projects 2009,“Project Alpha”, [online].665
Available: http://www.waterprojectsonline.666
10

com/case_studies/2009/NIW_Alpha_2009.pdf667
[19] NI Water, “Silent Valley information668
leaflet”, [online]. Available: https://www.669
niwater.com/sitefiles/resources/pdf/670
silent-valley-information-leaflet.pdf671
[20] CER, “CER factsheet on the Single Electricity Mar-672
ket”, 2011, [online]. Available: http://www.cer.673
ie/docs/000262/cer11075.pdf674
[21] SEM-O, “Pricing and scheduling frequently675
asked questions”, [online]. Available: http:676
//www.sem-o.com/Publications/General/677
Pricing%20and%20Scheduling%20FAQ.pdf678
[22] Paudyal, S., Canizares, C.A., Bhattacharya, K., “Opti-679
mal operation of industrial energy hubs in smart grids”,680
IEEE Trans. Smart Grid, vol. 6, no. 2, pp. 684-694,681
2015.682
[23] Jowitt, P.W., Germanopoulos, G. “Optimal pump683
scheduling in water-supply networks”, Jour. Water Res.684
Plan. Mgmt., vol. 118, no. 4, pp. 406-422, 1993.685
[24] Chase, D.V., Ormsbee, L.E., “Computer-generated686
pumping schedules for satisfying operating objectives”,687
Jour. Amer. Water Works Ass., vol. 85, no. 7, pp. 54-61,688
1993.689
[25] Zhuan, X., Xia, X, “Optimal operation scheduling of a690
pumping station with multiple pumps”, Appl. Energy,691
vol. 103, pp. 250-257, 2013.692
[26] US Environmental Protection Agency, “EPANET”,693
[online]. Available: https://www.epa.gov/694
water-research/epanet695
[27] Van Zyl, J.E., Savic, D.A., Walters, G.A., “Operational696
optimization of water distribution systems using a hy-697
brid genetic algorithm”, Jour. Water Res. Plan. Mgmt.,698
vol. 130, no. 2, 2004.699
[28] Lopez-Ibanez, M., Devi Prasad, T., Paechter, B., “Op-700
timal pump scheduling: representation and multiple701
objectives”, CEC, Napier University, Edinburgh, Scot-702
land, Tech. Rep., 2012.703
[29] Moreira, D.F., Ramos, H.M., “Energy cost optimization704
in a water supply system case study”, Hindawi Jour.705
Energy, vol. 2013.706
[30] Ramos, H.M., Costa, L.H.M., Goncalves, F.V., “En-707
ergy efficiency in water supply systems: GA for pump708
schedule optimization and ANN for hybrid energy pre-709
diction”, Intech Water Supply System Analysis - Se-710
lected Topics, Chapter 4, 2012.711
[31] Goldberg, D.E., Genetic Algorithms in search, op-712
timization and machine learning, Boston, USA:713
Addison-Wesley Longman, 1989.714
[32] UK Water Projects 2003, “Aquarius 3 Mourne water715
treatment works”, Tech. Rep., [online]. Available:716
http://www.waterprojectsonline.com/case_717
studies/2003/NI_Water_Mourne_2003.pdf718
[33] Kernan, R., Liu, X., McLoone, S., Fox, B., “Man-719
agement of public water supply to reduce power cost720
and improve wind power uptake”, presented at the 16th721
IEEE EEEIC, Florence, Italy, 2016722
[34] American Society of Plumbing Engineers, “Hazen723
Williams formula”,Plumbing Engineering and724
Design Handbook of Tables, [online]. Available:725
https://www.aspe.org/sites/default/files/726
webfm/pdfs/TableBookErrata.pdf727
[35] CER, “Factsheet: Electricity prices in Ireland”, Tech.728
Rep., [online]. Available: http://www.cer.ie/729
docs/000671/cer10062.pdf730
11