demand for quantity versus quality in beef, chicken and fish consumption in...
TRANSCRIPT

Kolawole Ogundari
29
ISSN 1679-1614
DEMAND FOR QUANTITY VERSUS QUALITY IN BEEF, CHICKEN AND FISH CONSUMPTION
IN NIGERIA1
Kolawole Ogundari2
Abstract: This study examines income elasticity of demand for quantity and quality beef, chicken, and fish in Nigeria. The analysis is based on randomly selected 134 households in Ondo state. The empirical results show that income elasticity of demand for beef, chicken, and fish are inelastic. This suggests that these food items are considered necessities among households in the sample. The computed income elasticity of demand for quality was found to be positive for all food items. The implication of this is that demand for quality beef, chicken, and fish increased as income of the household rises. Thus, from policy standpoint, this evidence could be explored to facilitate a better design of food policies aim at improving consumer welfare in Nigeria.
Key words: Beef, Chicken, Fish, Quantity, Quality, Elasticities, Engel curve, Nigeria
1. Introdução
It is fundamentally consistent with basic economic theory that a rational consumer tends to exhibit preferences for higher taste (presumably quality) by shifting from less expensive foods such as grains, starch etc to more expensive foods such as meat, fish, fruits etc when income level rises ceteris paribus (Deaton, 1997). Meaning that a shift from quantity to quality especially when higher quality food becomes more affordable as income rise is a reflection of change in consumer tastes and preferences.
1 Recebido em: 19/03/2012 ; Aceito em: 4/6/2012.2 Department of Food Economics and Consumption Studies, University of Kiel, Kiel, Germany. Email:
[email protected] The author gratefully acknowledges the financial support of the Alexander von Humboldt (AvH) Foundation towards his postdoctoral fellowship at the Institute of Food Economics and Consumption Studies, University of Kiel, Germany.

REVISTA DE ECONOMIA E AGRONEGÓCIO, VOL.10, Nº 1
30
Food quality encompasses both production and process attributes. With regards to the production attributes, food quality can be defined in reference to heterogeneity of food products such as colour, flavor and texture while process attributes could be linked to factors such as place of origin, method of processing and environmental impact on production. As revealed by Yu and Abler (2009), meat quality could imply considerable scope for household choice with respect to the type of meat, cut/size, appearance, texture, tenderness, flavor, nutrient content, freshness, and ease of preparation.
However, Huang and Gale (2009) argue that in modern food markets, the expenditure on food may grow faster than quantity of food purchase which not only implies higher quality food but also an indication of higher unit values. The authors stressed further that a shift toward premium food products is likely to increase the average unit value. This is because increase in unit value of food items is an indication of food quality as noted by Deaton (1988).
The analysis of food demand has received attention across the globe for the last four decades because of the following; first, food intake has been found to have a strong empirical linkage with human health and labour productivity as noted by Aromolaran, (2004) and second, because estimated income/expenditure elasticity is regarded as important tools for the nutritional policy design and planning. This observation however, explains the proliferation of food demand studies using different methodologies and focusing on different food items across the globe (Gallet, 2010). For example in Nigeria, considerable efforts has been devoted for the analysis of food demand by both academic and policy analyst in the country for more than two decades (see, Adegeye 1988; Tsegai and Kormawa, 2002; Ogunyinka and Marsh 2003; Solomon and Nazemzadeh 2004; Igwe and Onyekwere 2007; Ezedinma et al. 2006; Okoruwa. and Adebayo 2006; Olorunfemi, and Ajibefun 2007; Obayelu et al., 2009; Ojogho. O and G.O Alufohai 2010).
Therefore, given the significance of income elasticity of demand for food-items as highlighted above, we observed that many of the empirical

Kolawole Ogundari
31
studies on food demand focused on quantity elasticity of demand while very few pay attention to elasticity of demand for quality. As noted by Yu and Abler (2009) that policy recommendations based on analysis that does not take into account elasticity of demand for food quality could be subject to significant error in nutritional policy design and planning process. This is because an increase in the household demand for a commodity might not necessarily be an indication of increase demand for quality.
Thus, a review of the literature shows that only a few studies had focused on the demand for food quality (see Jan et al., 2008; Tey et al., 2009; Huang and Gale, 2009; Yu and Abler 2009). For example, the study by Jan et al., (2008) revealed that quality elasticity of demand for fruits such as apple, banana, citrus, dates, guava and mango increased as income rise in Pakistan while Tey et al., (2009) found that Malaysian consumer tend to increase their demand for quality vegetables in response to their income rise. Other studies by Huang and Gale, (2009) and Yu and Abler, (2009) both on Chinese households found that as income rises additional spending on food increase with higher unit value ( or quality).
The objective of the study is divided into two folds; first, to examine the determinants of household demand for animal protein such as beef, chicken, and fish and second, to estimate income elasticity of demand for quality beef, chicken and fish in Nigeria. Thus, contrary to early empirical studies on demand for animal protein in Nigeria that focused only on quantity elasticity of demand (see Adegeye 1988; Ogunyinka and Marsh 2003; Solomon and Nazemzadeh 2004; Igwe and Onyekwere 2007; Ezedinma et al. 2006), the present study is motivated to contribute to existing literature on the food demand analysis by estimating not only the quantity–income elasticity of demand but also quality–income elasticity of demand for beef, chicken, and fish consumption with aim of improving consumer welfare policy in the country.
The rest of the paper is organized as follows: Section 2 presents the trend analysis of animal protein and fish consumption in Nigeria. Conceptual framework is discussed in section 3. Section 4 presents methodology
REVISTA DE ECONOMIA E AGRONEGÓCIO, VOL.10, Nº 1
32
vis-à-vis, the study area, the sampling technique, the data, and empirical model. Section 5 contains results and discussion. Section 6 includes conclusions and policy implications.
2. Consumption of animal and fish protein in Nigeria: The trend
Meat consumption contributes over 70 percent of the total protein intake in many African societies which Nigeria is inclusive (Anthonio and Adeyokunnu, 1973). This observation however, underscores the significant contribution of meat in human development and body growth in the continent.
Protein consumption is important in the physical, mental, and physiological development of man. It not only supports growth, mental development, and replacement of worn out tissues, but also improves health maintenance and general well being. Unfortunately, sub-optional consumption of animal protein by a large percentage of Nigerians has become a major concern not only to livestock producers, but also to policy makers (Madubuike, 1992).
In Nigeria, existence of diverse culture characterized by regional, physical, agro-climatic, and socioeconomic differences attests to the observed changes in food habit across the country (Jabbar and di Comenico, 1993). For example, religious obligation forbids Muslim in the North and in some part of the South from eating pork meat. Thus, pork consumption is traditionally limited among non Muslims communities in the country. The demand for sheep and goat for those that cannot afford to buy sheep reach the pick during the Muslim’s Eidul-Kabeer celebration while demand for beef, turkey, and chicken reach the pick during the Christian’s Christmas celebration in Nigeria. Hence, religion

Kolawole Ogundari
33
activities, festive period and meat price be can be regarded as key determinants of the demand for animal protein in Nigeria. Nevertheless, meat from cattle, goat, sheep, pig and poultry are the main sources of animal protein in Nigeria as most of the food consumed in the country are carbohydrate which are obtained mainly in the form of starch (Oloyede, 2005).
Because of high price of animal protein most especially beef, sheep and goat, an average household in Nigeria regards fish and poultry meat as a close substitute for these food-items. This observation has led to increase in per capita consumption of poultry meat among Nigerians in recent years. Besides, surge in fish demand in the country have also been associated with increase in aquaculture production across the country with aquaculture fish contributing more than 200% to total fish supply in the country lately in Nigeria (Ogundari and Akinbogun 2010).
However, presented in Figure A of the appendix is the per capita trend analysis of the animal meat, poultry meat, and fresh fish consumption in Nigeria from 1961-2007. Also, presented in Figure B in the same appendix is the per capita beef meat, goat meat and pork meat consumption in Nigeria within the same period. Figure A revealed an increase in per capita animal meat, poultry meat and fresh fish consumption in the country. A breakdown of total animal meat consumption in Figure B shows that per capita consumption of goat meat surge while per capita beef and pork consumption is decreasing.
Thus, the summary statistics of the data from which both figures were extracted revealed that an average daily per capita total animal meat, poultry meat, and fresh fish of about 8kg, 1.2kg and 1.4kg, respectively was consumed in Nigeria between 1961 and 2007. Furthermore, the data revealed that, an average per capita

REVISTA DE ECONOMIA E AGRONEGÓCIO, VOL.10, Nº 1
34
beef meat, goat meat and pork meat of about 0.98kg, 0.97kg and 0.74kg, respectively was consumed in Nigeria from 1961-2007.
3. Conceptual framework
The paper adopted the conceptual framework developed by Paris and Houthakker (1971) to elicit the demand for quantity and quality beef, chicken and fish among households in Nigeria. Similar framework has been used by Huang and Gale (2009), Tey et al. (2009) and Yu and Abler (2009). The Paris and Houthakker’s methodology is built within the Engel’s theory and starts with identity:
( ) ( )j j je y p . q y≡ (1)
where je represents expenditure on the j-th food item; jqrepresents the physical quantity demanded of the j-th food item;
jp denotes the unit price of j-th food item. Both je and jp are assumed to be independent of y ; y is the consumption income.
According to Deaton (1988), the ratio ( ) ( )j je y /q y is not the exogenous market price; they are instead unit value which reflects household food quality choices. In view of this, the author
suggested a replacement of unit value represented by ( )jv y′ , for
jp in equation 1 as
( ) ( ) ( )j j jv y = e y /q y′ (2)
( )jv y′ measures effect of income y on the demand for food quality which is the difference between the elasticity of expenditure on

Kolawole Ogundari
35
the j-th food item je with respect to income y and the elasticity
of quantity demanded of the j-th food item jq with respect to income y . Empirically, taking the logarithm of equation 2 and differentiating it with respect to log y gives:
j j jlog v log e log q = -
log y log y log y
′∂ ∂ ∂
∂ ∂ ∂ (3)
where log v / log y′∂ ∂ represents quality elasticity and
subsequently defined as jε ; jlog e / log y∂ ∂ represents
expenditure elasticity and subsequently defined as jθ from
expenditure equation ( )je ; jlog q / log y∂ ∂ represents quantity
elasticity and subsequently define as jη from the quantity equation
( )jq .
For simplicity, equation 3 can be re-written as
j j j = - ε θ η (4)
When 0j j j ; then θ η ε> > which is an indication that households spend more on j-th food item with less quantity demanded of the same food-items as household’s income level increases.
Conversely, when 0j j j< ; then θ η ε < implied that households spend less on the j-th food item as they demanded for more quantity while households’ income level rises. The intuition behind this is
that, 0jε > signifies increase in the unit value of the j-th food

REVISTA DE ECONOMIA E AGRONEGÓCIO, VOL.10, Nº 1
36
item which is an indication of quality effect associated with rise
in income level while 0jε < signifies decrease in the unit value of the j-th food commodity as income increases.
4. Methodology
4.1. Study area, sampling technique, and the data
The study was carried out in Ondo state, Nigeria. The state is located in the Southwestern Nigeria with a total of 18 local government areas (LGAs). Agriculture is the main activities of the people of the state. It accounts for the largest revenue base of the state. The survey was carried out in two LGAs which are Akure North and Akure South. Akure North is a typical rural setting while Akure South being the capital of the state is a typical urban setting. This observation motivated the choice of these two LGAs as a perfect framework to compare how households in rural and urban community differ with regards to their consumption pattern in Nigeria. In addition, dearth of study related to the demand for food quality demand in Nigeria also motivated this article.
A multistage random sampling technique was employed in the sample selection via a well structured and pre-tested questionnaire based on 7 days recall by using trained enumerators. In the first stage, the LGAs were divided into ten wards while in the second stage seven households were randomly selected from each ward which yields seventy households per LGA. Hence, a total of 140 households were sampled across the two LGAs. Because six questionnaires could not be used due to incomplete information, a total of 134 households (i.e., 69 from Akure North and 65 from Akure South) were eventually used for the empirical analysis.
Information collected from the survey includes; quantity (kg) and correspondent value (Naira) of beef, fish, and chicken consumed by the households. Other information collected includes; household size, ages

Kolawole Ogundari
37
and gender of the household heads. The variable definition and summary statistics of the variables are presented in Table A of the appendix.
4.2. Empirical model
The expenditure and quantity equations from which jθ and jη of equation
4 are determined can be defined by ( )j e f y,z= and ( )j q f y,z=
, respectively. Here, we assumed expenditure j e and quantity j q demanded of the j-th food item not only depends on economic factor such as income y but also non-economic factors such as household’s demographic variables z . As noted by Pollak and Wales (1992), the demand for food is not only determined by economic factors such as income and price, but also by household’s demographic variables. Thus, omission of these demographic variables in a demand model may have effects on income elasticity of demand for food to be overestimated.
Previous empirical analysis of Engel’s curves using expenditure and
quantity approach such as ( )j e f y,z= and ( )j q f y,z= have always
assume a log-linear function for f in the expressions (see Deaton 1988; Deaton 1997). But recent studies have shown that a linear Engel curve does not provide an accurate picture of individual behavior (Banks et al., 1997; Tey et al, 2009; Huang and Gale 2009). For example, Banks et al., (1997) stressed the importance of nonlinearities in Engel’s curves with tendency to produce more plausible estimates of demand elasticities while permitting consistency with utility theory. Besides, non-linear Engel’s curve is advantageous in showing physical saturation of demand or non-homothetic consumer preferences.
Based on this, we define expenditure equation ( )j e f y,z= and
quantity equation ( )j q f y,z= using non-linear or quadratic Engel

REVISTA DE ECONOMIA E AGRONEGÓCIO, VOL.10, Nº 1
38
relationship as
( )3
2
1 21
ij ij i ij i ikj ik LG ik
log e = + logy + logy + z + D + α θ θ β τ υ=∑ (5)
( )3
2
1 21
ij ij i ij i ikj ik LG ik
log q = + logy + logy + z + D + α η η β τ ς=∑ (6)
where ije and ijq are respectively, expenditure on the j-th food items
( j th food = beef, chicken and fish− ) and quantity of j-th food item
purchased by the i-th household; ikz is a set of household’s demographic variables which includes household size, age and gender of the household
head, LGD is dummy variable which capture location effect on ije and
ijq ( LGD =1 denotes households in the Akure North LGA; 0 denotes
households in Akure South LGA); jθ , jβ , and τ are parameters to
be estimated; iς and iυ are white noise with mean zero and constant variance.
It is important to note that equations 5 and 6 do not satisfy the adding up criterion of a typical Almost Idea Demand System (AIDS) model such as Quadratic Almost Idea Demand System (QUAIDS) model. Nevertheless, this is not a serious concern in the present setting since we did not estimate a complete demand system which normally includes direct and cross-price effects in addition to income effects.
Because of non linear specification of equation 5, the expenditure –
income elasticity of the j-th food item for the i-th household ijθ is calculated using the relationship below:
( )1 2ij j j i = + 2 logyθ θ θ (7)

Kolawole Ogundari
39
Also, the quantity-income elasticity of the the j-th food item for the i-th
household ijη is calculated using the relationship below:
( )1 2ij j j i = + 2 logyη η η (8)
where ( )ilogy is the mean of the logarithm of income iy for the households.
After obtaining the estimates of ijθ and ijη from equation 7 and 8,
respectively, the quality elasticity jε for the j-th food item is therefore derived using equation 4.
As earlier mentioned, the Engel equations are estimated for each of the three food items considered in the present study which include beef, fish and chicken. Besides, the equations (i.e., equation 4-6) are also estimated separately for the households in the Akure North and Akure South LGAs that make up the sample. Nevertheless, this is essential to investigate whether there is evidence of quality difference in beef, chicken and fish consumption across the two LGAs.
For the empirical analysis, use employ total expenditure as a proxy for household income which was also used by Manig and Moneta (2009). Nevertheless, a search of the literature shows that a number of studies on demand analysis for meat, fish and poultry products have used total expenditure as a proxy for income (Mdarfri and Brosen 1993; Solomon and Nazemzadeh 2004; Wadud 2006; Ortega et al. 2009; Alboghdady and Khairy 2010). Therefore, one of the key arguments in support of total expenditure as a proxy for household income is the fact that it is regarded as a better measure of standard of living. Also it is widely reported that household total expenditure is traceable and more stable for empirical analysis of this nature than the reported income. Besides, quality of data on household income reported in most survey data especially in the

REVISTA DE ECONOMIA E AGRONEGÓCIO, VOL.10, Nº 1
40
developing countries like Nigeria has always been treated with caution in the demand analysis.
Also worth noting is the fact that we performed data transformation to improve the interpretation of the results by scaling all the variables by their respective sample mean.
The parameters of equation 5 and 6 were estimated following the work of Tey et al. (2009) and Huang and Gale (2009) where the authors used weighted least square regression and the corresponding number of household size as weights to obtain efficient estimates. The estimation was carried out with help of STATA 10 software.
5. Results and Discussion
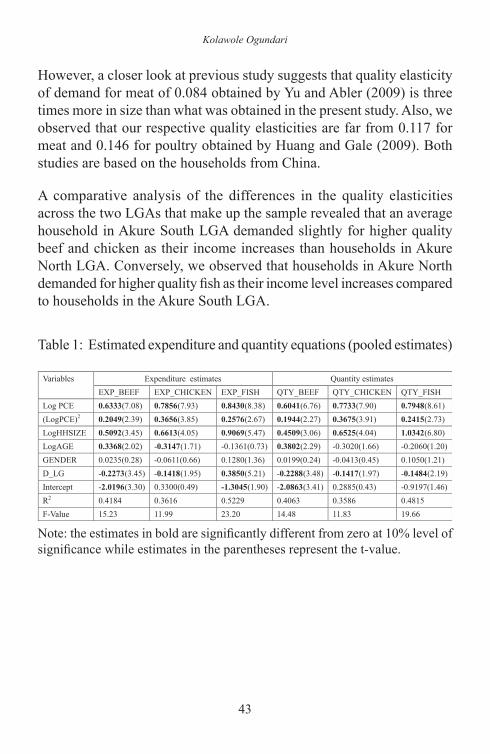
Presented in Table 1 is the result of the expenditure and quantity equations estimated based on equations 5 and 6, respectively for the pooled estimate.3 The coefficient of logPCE and (LogPCE)2 are positive and statistically significant for all the equations. As earlier mentioned, inclusion of (LogPCE)2 is a test for non-linearity between the dependent variables (EXP_BEEF, EXP_FOWL,EXP_FISH, QTY_BEEF,QTY_FOWL, QTY_FISH) and per capita total expenditure (PCE). The significant of the coefficient shows that non-linearity exist between the demand for beef, chicken and fish and PCE in the study area.
The estimated coefficients of LogHHSIZE is positive and statistically significant across all the equations. Meaning that, as household size increases, the expenditure on and quantity of beef, chicken and fish consumed increased. Also, the estimated coefficient of LogAGE is positive only for the expenditure and quantity equations for beef. The implication of this is that the older household head spend and demand more of beef in the study area. The significant negative coefficient of 3 The respective results for the Akure North and South LGA are not presented here for brevity. Nevertheless,
the LGA results could be made available by the author upon request. The pooled estimates contain samples from both LGAs.

Kolawole Ogundari
41
LogAGE for the equation representing expenditure on chicken suggests that older household head spend less on chicken. However, the coefficient of LogAGE for equation representing fish was found to insignificant in the sample.
The variable GENDER was found to have no significant impact on the expenditure and quantity equations for the demand for beef, chicken, and fish in the study area. The estimated coefficient of D_LG indicates that households in Akure North Local Government Areas spend less on beef and chicken relative to households in Akure South Local Government Areas. Households in Akure North spend more on fish relative to households in Akure South. Furthermore, households in Akure North demand less of beef, chicken, and fish relative to households in Akure South LGA. Since both Akure North and Akure South LGAs are typical example of different sectors of Nigeria economy vis-à-vis rural ( i.e., Akure North) and urban (i.e., Akure South), the coefficient of D_LG could possibly be interpreted as evident of prevailing differences in the consumption pattern across the rural and urban households in the country.
Because of the non-linear specification of the Engel functions of equations 5 and 6, the estimated expenditure and quantity elasticities computed using the relationship defined as equation 7 and 8, respectively is presented in the first two rows of Table 2. Thus, the positive sign of the estimated quantity elasticities otherwise known as income-elasticity of demand implies that the quantity (kg) of beef, chicken and fish consumed increased with rise in income level in the study. Nevertheless, the magnitude (or size) of the estimated quantity elasticities suggest that the demand for these food items is inelastic and therefore viewed as necessities among the sample households. The implication of this is that even though consumption of these food items increased with rise in income level, the proportional increase in the consumption of the items is less than the proportional increase in the income level. That is the rate of consumption of beef, fish and chicken response less to the rate of increase in household income in the study.

REVISTA DE ECONOMIA E AGRONEGÓCIO, VOL.10, Nº 1
42
Comparing the present finding with previous studies focusing on the demand for beef, fish and chicken in Nigeria, we observed that Solomon and Nazemzadeh (2004) obtained an estimated income elasticity of 1.26, 0.41 and 0.24 for the demand for beef, chicken and fresh fish, respectively based on the annual time series data covering 1980-2002. Earlier Adegeye (1988) recorded an average income elasticity of 0.47 for the demand for beef while Igwe and Onyekwere (2007) obtained income elasticity of 1.11 and 0.99, respectively for the demand for beef and chicken. Also, we noted that Ezedinma et al. (2006) recorded an estimated income elasticity of 0.69, 2.78 and 0.68, respectively for the demand for beef, chicken and fish in their study. In summary, we observed that the magnitude and sign of our estimates conform to the previous findings that the demand for beef, chicken and fish are not far from necessities in Nigeria.
The quality elasticity which is the differences between expenditure ( ijθ ) and
quantity ( ijη ) elasticities derived using equation 4 is presented in the last row of Table 2. Hence, the positive sign of estimated quality elasticities in the table is an indication that the estimated expenditure elasticities are found to be higher than the quantity elasticities across all the three food items. This, however, could possibly be a reflection of quality effect as quantity demanded for beef, chicken, and fish decrease while observed expenditure on these items increase at the same time with increase in household income. In other words, it is evident that an average household in the sample spend more on beef, chicken and fish as their income rises as they reduce the quantity of these food items purchased in the study.
Furthermore, since unit values of food-items generally reflects demand for higher quality as noted by Deaton (1988), the size of the estimated quality elasticity of demand of 0.045, 0.027 and 0.013 for fish, beef, and chicken, respectively at the point estimates in Table 2 could be taken as indicator of the unit-value of these food-items. The implication of this is that the unit value of fish is about 67% and over 100% higher than that of beef and chicken, respectively while the unit value of beef is over 100% higher than that of chicken in the study.
Kolawole Ogundari
43
However, a closer look at previous study suggests that quality elasticity of demand for meat of 0.084 obtained by Yu and Abler (2009) is three times more in size than what was obtained in the present study. Also, we observed that our respective quality elasticities are far from 0.117 for meat and 0.146 for poultry obtained by Huang and Gale (2009). Both studies are based on the households from China.
A comparative analysis of the differences in the quality elasticities across the two LGAs that make up the sample revealed that an average household in Akure South LGA demanded slightly for higher quality beef and chicken as their income increases than households in Akure North LGA. Conversely, we observed that households in Akure North demanded for higher quality fish as their income level increases compared to households in the Akure South LGA.
Table 1: Estimated expenditure and quantity equations (pooled estimates)
Note: the estimates in bold are significantly different from zero at 10% level of significance while estimates in the parentheses represent the t-value.

REVISTA DE ECONOMIA E AGRONEGÓCIO, VOL.10, Nº 1
44
Table 2: Point estimates of the expenditure, quantity and quality elasticities
Note: estimates in the parentheses represent the t-value.
6. Conclusions and policy implications
The study examines income elasticity of demand for quantity and quality beef, chicken and fish in Nigeria. The analysis is based on randomly selected 134 households from Akure North (69) and Akure South (65) Local Government Areas of Ondo state Nigeria.
The results show that an average household in the study spend more on fish, followed by chicken and lastly beef as their income rises. Also, we found evidence that households in the sample demanded for more quantity of fish, followed by chicken and beef in that order as their income increases. Across the two LGAs that make up the sample, the results revealed that households in Akure South which has a typical urban setting spend and demand for more beef and chicken than households in Akure North which is also a typical rural setting. Conversely, households in Akure North spend and demanded for more fish than households in Akure South.
The computed income elasticity of demand for quality revealed that the unit value (i.e., demand for quality) of beef, chicken and fish increased as household income increases from the study. The implication of this however, is that as income increases, an average household from the sample not only increases the quantity demand of beef, chicken, and fish but tend to demand for higher quality of these food items; reflected by the their unit values in Nigeria.

Kolawole Ogundari
45
In conclusion, since income elasticity of demand are needed for policy formulation to set priorities, understanding the relationship how households respond to change in income while taking into account quantity and quality demand could provide further insight into consumer behavior. Of course, this will allow more precise welfare calculations that are necessary for food policy analysis. Hence from the policy stand point, evidence of positive demand for quality beef, chicken and fish obtained from the empirical analysis could facilitate a better design of food policies in Nigeria. This in turns could be an important driver of food demand and future food projection, with possibility of creating different marketing opportunities and increased welfare for Nigerians.
References
ADEGEYE, A. A statistical analysis of demand for beef in the western state of Nigeria. Reading in the agricultural Marketing, University of Ibadan, Nigeria. 1988.
ADESHINWA, A. O. K.; O. FAMIMO, B. K. OGUNMODEBE and A. O. OGUNSANMI. Weaner pigs fed with graded Levels of maize offal as replacement for maize and the effects on performance. Tropical Journal of Animal Science, 1:101-105, 1999.
ALHOGHDADY, M. A and M. K. KHAIRY. The demand for meat in Egypt: An almost ideal estimation. Africa Journal of Agricultural and Resources Economics, v. 4, n.1, 70-81, 2010.
ANTHONIO, O.; ADEYOKUNNU, T. O. The challenging pattern of African diets in Rotation to income. Nigeria Journal of Agriculture, n.10, p.27-42, 1973.
AROMOLARAN, A.B. Household income, women’s income share and food calorie intake in south western Nigeria, Food Policy, v.29, p.507-530, 2004.

REVISTA DE ECONOMIA E AGRONEGÓCIO, VOL.10, Nº 1
46
BANKS, J., BLUNDELL, R.; LEWBEL, A. Quadratic Engel Curves and consumer demand. The Review of Economics Statistics, v.79, n.4, p.527-539, 1997.
DEATON, A. The analysis of Household Surveys: A micro econometric approach to development policy. Baltimore USA: John Hopkins University press, 1997.
DEATON, A. Quality, Quantity and spatial variation of price. American Economic review, v.78, n.3, p.418-430, 1988.
EZEDINMA, C., KORMAWA, P.; CHIANU, J. Urban household demand for meat and meat products in Nigeria. An almost ideal demand system analysis. Paper presented at the farm Management Association of Nigeria Conference, 18-21, September Jos, Plateau State, 2006.
FAO. Commodity balances and food supply. Available at: http://faostat.fao.org/site/614/default.aspx#ancor. Accessed on the 12 January, 2011.
GALLET, C. Meat Meets Meta: A quantitative Review of the Price Elasticity of meat. American Journal of Agricultural Economics, v.92, n.1, p. 258-272, 2010.
HUANG, K. S.; GALE, F. Food demand in China: Income, quality, and nutrient effects. China Agricultural Economic Review, v. 1, n.4, p.395-409, 2009.
JAN. A. U., CHISHTI, A. F.; KHAN, M. Estimating consumers’ response to quality: A case of pakistan fruits. The proceeding of International Conference on Applied Economics – ICOAE 2008, pp 411-414, 2008.
JABBAR, M. A.; DI COMENICO, C. M. Demand for dairy products among the indigenous population of southern Nigeria. Indian Journal of Dairy Science, v.46, n.8, p.363-370, 1993.

Kolawole Ogundari
47
IGWE, K . C.; ONYEKWERE, O. N. Meat demand analysis in Umuahia Metropolis Abia state Nigeria. Agricultural Journal, v.2, n.5, p. 550-554, 2007.
MANING, C; MONETA, A. More or better ? Measuring quality versus quantity in food consumption. Laboratory of Economics and management working paper series 2009/17, Pisa Italy: Saint’ Anna School of advanced Studies, 2009.
MDAFRI, A; BROSEN, B. W. Demand for red meat, Poultry and fish in Morocco: an almost ideal demand system. Agricultural Economics, v.9, 155-163, 1993.
MADUBUIKE, F. N. Arresting animal protein insufficiency in Nigeria: A multi- sectional approach Department of Animal Science and Fisheries Imo State University, Owerri, Nigeria, 2004.
OBAYELU, A. E.; OKORUWA, V.O; AJANI, Y. Cross-Sectional analysis of Food Demand in North Central, Nigeria: The Quadratic Almost Idea Demand System (QUAIDS) Approach. China Agricultural Economics Review, v. 1, n.2, 173-193, 2009.
OGUNDARI, K; AKINBOGUN, O. Modelling production efficiency with risk: a study of fish farms in Nigeria. Marine Resources Economics, v. 25, n3, p.295-308, 2010.
OGUNYINKA, E.O; MARSH, T. L. Testing separability in a generalized ordinary differential demand system: The case of Nigeria Demand meat. Paper presented at the Southern Agricultural Economics Association Annual Meeting, 1-5, February Mobile, Alabama, 2003.
OJOGHO. O; ALUFOHAI, G.O. Impact of price and total expenditure on food Demand in south-Western Nigeria. African Journal of Food, Agriculture, Nutrition and Development, v.10, n.1, p.4350-4363, 2010.

REVISTA DE ECONOMIA E AGRONEGÓCIO, VOL.10, Nº 1
48
OKORUWA, V.O.; ADEBAYO, E. F. Household Food Demand Analysis in Adamawa State, Nigeria. Global Journal of Agricultural Sciences, v.5, n.2, p. 109-115, 2006.
OLOYEDE, H. O. B. All for the love of nutrients, the seventy eight inaugural lecture, Library and publication Committee, University of Ilorin, 2005.
Olorunfemi, S. and I. A. Ajibefun (2007). Sample Selection Analysis of Household Food Consumption in Southwestern Nigeria. Pakistan Journal of Social Sciences 4 (1): 1-8
ORTEGA, D.L.; WANG, H.H.; EALES, J.S. Meat demand in China, China Agricultural Economics Review, v.1, n.4, p. 410-419, 2009.
PARIS, S. J.; HOUTHAKKER, H. S. The analysis of family budgets. 2ed. Cambridge: Cambridge University Press, 1971.
POLLAK, R. A; WALES, T. J. Demand system specification and estimation. Oxford: Oxford University press, 1992.
SOLOMON, O. G.; NAZEMZADEH, A. Consumerisms: statistical estimation of Nigeria meat demand. Paper presented at the allied Academics International Conference and available in the proceeding of the Academy for studies in International Business, v. 491, 47-56, 2004.
TEY, Y.S., MADNASIR, S.; ZAINALABIDIN, M.; JINAP, S.; ABDUL GARIFF, R. Demand for quality vegetables in Malaysia. International Food Research Journal, v.16, p.313-327, 2009.
TSEGAI. D.; KORMAWA, P. Determinants of Urban households’ demand for Cassava and Cassava products in Kaduna, Northern Nigeria: The Application of AIDS model paper presented at conference on International Agricultural Research for Development, Wetzenhausen, 9-11,October 2002.

Kolawole Ogundari
49
WADUD, M.A. An analysis of meat demand in Bangladesh using the almost ideal Demand system. The empirical economics letters, v.5, n.1, p.29-35, 2006.
YU, X.; ABLER, D. The demand for food quality in rural and urban china. America Journal of Agricultural Economics, v.9, n.1, p.57-69, 2009.
APPENDIX
Table A: Variable defi nition and Summary statistics of selected variable
Note: HH denotes households
Figure A: Per capita animal meat, poultry meat and fresh fish consumption in Nigeria,1961-2007, Source FAOSTAT 2011

REVISTA DE ECONOMIA E AGRONEGÓCIO, VOL.10, Nº 1
50
Figure B: Per capita beef meat, Goat meat and Pork meat consumption in Nigeria,1961-2007, Source FAOSTAT 2011