demand for public transport services: integrating ...introductionmodel frameworklatent variable...
TRANSCRIPT

Introduction Model framework Latent variable model Integrated model Estimation results Conclusions
Demand for public transport services: Integratingqualitative and quantitative methods
Bilge AtasoyAurelie Glerum
Ricardo HurtubiaMichel Bierlaire
Transport and mobility laboratoryEPFL
STRCSeptember 1, 2010
1/ 24

Introduction Model framework Latent variable model Integrated model Estimation results Conclusions
Outline
1 Introduction
2 Model framework
3 Latent variable model
4 Integrated model
5 Estimation results
6 Conclusions
2/ 24

Introduction Model framework Latent variable model Integrated model Estimation results Conclusions
Outline
1 Introduction
2 Model framework
3 Latent variable model
4 Integrated model
5 Estimation results
6 Conclusions
3/ 24

Introduction Model framework Latent variable model Integrated model Estimation results Conclusions
Introduction
The research is carried out with CarPostal: bus service in rural andlow density areas of Switzerland.
The aim of the project is to ...
Understand the travel behavior in the area of interestCome up with latent attitudes and perceptions affecting travelbehaviorIntegrate these latent attitudes into mode choice contextImprove the market share of public transport
4/ 24
Introduction Model framework Latent variable model Integrated model Estimation results Conclusions
Data collection
Data collection campaign consists of the execution of 3 surveys:
Qualitative survey
Revealed preferences (RP) survey
Stated preferences (SP) survey
5/ 24

Introduction Model framework Latent variable model Integrated model Estimation results Conclusions
Data collection
Data collection campaign consists of the execution of 3 surveys:
Qualitative survey
In-depth interviews with 20 individualsIdentification of potential latent attitudesIdeas for the design of quantitative surveys
Revealed preferences (RP) survey
Travel diary for a predefined daySocio-economic characteristicsHabitsPsychometric indicators
Stated preferences (SP) survey
5/ 24
Introduction Model framework Latent variable model Integrated model Estimation results Conclusions
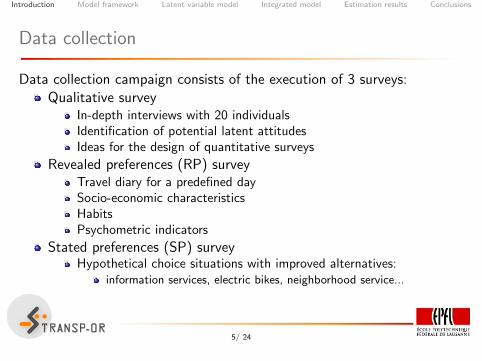
Data collection
Data collection campaign consists of the execution of 3 surveys:Qualitative survey
In-depth interviews with 20 individualsIdentification of potential latent attitudesIdeas for the design of quantitative surveys
Revealed preferences (RP) surveyTravel diary for a predefined daySocio-economic characteristicsHabitsPsychometric indicators
Stated preferences (SP) surveyHypothetical choice situations with improved alternatives:
information services, electric bikes, neighborhood service...
5/ 24

Introduction Model framework Latent variable model Integrated model Estimation results Conclusions
Outline
1 Introduction
2 Model framework
3 Latent variable model
4 Integrated model
5 Estimation results
6 Conclusions
6/ 24

Introduction Model framework Latent variable model Integrated model Estimation results Conclusions
Integrated model framework
7/ 24

Introduction Model framework Latent variable model Integrated model Estimation results Conclusions
Integrated model equations
Structural equations:
Latent var - explanatory varX ∗n = h(Xn;λ) + ωn
UtilitiesUn = V (Xn,X
∗n ;β) + εn
Measurement equations:
Latent var - indicatorsI ∗n = f (X ∗n ;α) + υ
ChoiceP(yin = 1) = P(Uin ≥ Ujn,∀j)
Likelihood:
Ln(yn, In∣Xn;α,β,θε,θυ,θω) =∫X ∗
P(yn∣Xn,Xi ,X∗;β,θε)f (In∣Xn,X
∗;α,θυ)f (X ∗∣Xn;λ,θω)dX ∗.
8/ 24

Introduction Model framework Latent variable model Integrated model Estimation results Conclusions
Outline
1 Introduction
2 Model framework
3 Latent variable model
4 Integrated model
5 Estimation results
6 Conclusions
9/ 24
Introduction Model framework Latent variable model Integrated model Estimation results Conclusions
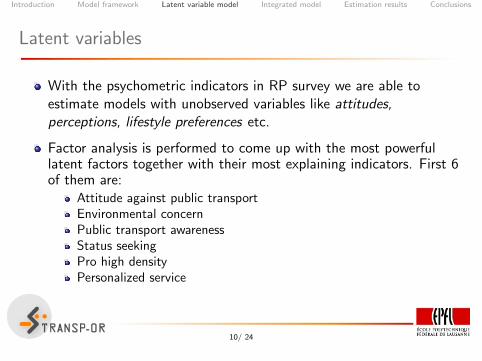
Latent variables
With the psychometric indicators in RP survey we are able toestimate models with unobserved variables like attitudes,perceptions, lifestyle preferences etc.
Factor analysis is performed to come up with the most powerfullatent factors together with their most explaining indicators. First 6of them are:
Attitude against public transportEnvironmental concernPublic transport awarenessStatus seekingPro high densityPersonalized service
10/ 24

Introduction Model framework Latent variable model Integrated model Estimation results Conclusions
Attitude against PT
Psychometric indicators (level of agreement: likert scale 1-5)
It is hard to take PT when I travel with my children.
I do not like to change means of transportation when I travel.
It is hard to take PT when I have bags or luggage.
11/ 24

Introduction Model framework Latent variable model Integrated model Estimation results Conclusions
Environmental concern
Psychometric indicators (level of agreement: likert scale 1-5)
I am concerned about global warming.
We should increase the price of gasoline to reduce congestion and air pollution.
We must act and make decisions to reduce emissions of greenhouse gases.
We need more public transport, even if it means higher taxes.
12/ 24

Introduction Model framework Latent variable model Integrated model Estimation results Conclusions
Outline
1 Introduction
2 Model framework
3 Latent variable model
4 Integrated model
5 Estimation results
6 Conclusions
13/ 24

Introduction Model framework Latent variable model Integrated model Estimation results Conclusions
Integrated latent variable and discrete choice model
Data from RP survey is used (1124 received questionnaires).
Concerned choice is the mode choice for each loop of trips in a day(1339 loops).
There are 3 alternatives for choice:
Private mode: car, taxi, car-sharing, moto etc.Public transportationSoft mode: bike and walking
14/ 24

Introduction Model framework Latent variable model Integrated model Estimation results Conclusions
Model specification
VPM = ASCPM + βcost CPM + βTTPMTTPM
+ βchildren Ichildren + βw Iw + βfrench Ifrench
VPT = ASCPT + βcost CPT + βTTPTTTPT
+ βfreq FPT + βattAPt attAPt + βattEnv attEnv
VSM = ASCSM + βdistance DSM
Pi =exp(Vi )
exp(VPM) + exp(VPT ) + exp(VSM)i = PM,PT ,SM.
Equations for latent variables
15/ 24

Introduction Model framework Latent variable model Integrated model Estimation results Conclusions
Outline
1 Introduction
2 Model framework
3 Latent variable model
4 Integrated model
5 Estimation results
6 Conclusions
16/ 24

Introduction Model framework Latent variable model Integrated model Estimation results Conclusions
Estimation results - Choice model
Integrated Model Multinomial Logit
Parameter Utility Value t-test Value t-test
ASCPM PM 0.157 0.15* 0.81 3.35ASCPT PT 0** - 0** -ASCSM SM -0.409 -0.38* 0.218 0.56*βTTPM
PM -0.0211 -4.33 -0.0215 -3.83βTTPT
PT -0.00847 -3.1 -0.00846 -2.79βcost PM & PT -0.0493 -4.63 -0.0508 -3.91βdistance SM -0.221 -4.47 -0.222 -4.44βchildren PM 0.492 3.09 0.412 2.62βw PM -0.61 -3.97 -0.622 -4.1βfrench PM 1.05 6.22 1.09 6.5βattAPt PT -0.63 -2.89 - -βattEnv PT 0.326 1.89 - -βfreq PT 0.649 3.22 0.701 3.51
(* Statistical significance < 90%, ** Fixed parameter)
17/ 24

Introduction Model framework Latent variable model Integrated model Estimation results Conclusions
Estimation results - Attitude against PT
Parameter Value t-test
βattAPt -0.63 -2.89attAPt 3.45 54.33λcars 0.129 3.52λhigh−educ -0.262 5.9λregion−BL -0.307 -3.66λregion−GR -0.234 -2.02λregion−SG -0.315 -3.01λregion−VS -0.193 -2.12λregion−BE -0.467 -3.01
Parameter Value t-test
a16 0** -a17 0.847 2.28a22 1.24 4.4α16 1** -α17 0.974 7.84α22 0.727 7.57θattAPt -0.469 -6.33θ16 -0.255 -5.03θ17 -0.126 -3.21θ22 0.0171 0.71*
18/ 24

Introduction Model framework Latent variable model Integrated model Estimation results Conclusions
Estimation results - Environmental concern
Parameter Value t-test
βattEnv 0.326 1.89attEnv 3.04 34.67λage>45 0.00609 2.59λbikes 0.0605 4.17λhigh−educ 0.262 5.9
Parameter Value t-test
a1 -1.77 -2.81a2 0.0318 0.07*a5 0** -a6 1.06 5α1 1.17 6.86α2 0.904 7.12α5 1** -α6 0.87 15.63θattEnv -0.492 -5.44θ1 0.0873 2.6θ2 -0.00741 -0.26*θ5 -0.174 -3.94θ6 -0.582 -12.87
19/ 24

Introduction Model framework Latent variable model Integrated model Estimation results Conclusions
Results
Value of timeVOTPM (CHF/h) VOTPT (CHF/h)
Integrated model 25.7 10.3Multinomial logit 25.4 10.0
Validation is done by estimating the model on 80% of the dataand predicting the remaining 20%. 66% of the estimated choiceprobabilities are above 0.5 and 19% are above 0.9.
Demand elasticitiesTime elasticity Cost elasticity
Private mode -0.20 -0.06Public transport -0.34 -0.17
20/ 24

Introduction Model framework Latent variable model Integrated model Estimation results Conclusions
Outline
1 Introduction
2 Model framework
3 Latent variable model
4 Integrated model
5 Estimation results
6 Conclusions
21/ 24

Introduction Model framework Latent variable model Integrated model Estimation results Conclusions
Conclusions
With latent variables we are able to have a better understanding oftravel behavior.
When latent attitudes are introduced effect of cost in the utilities isdecreased compared to MNL.
Utility of private mode is explained better compared to MNL sinceconstant becomes insignificant.
Existence of high education in structural equations of both latentattitudes
22/ 24

Introduction Model framework Latent variable model Integrated model Estimation results Conclusions
Future research
Inclusion of more than 2 latent variables
Discrete specification of indicators
Modeling perceptions as well as attitudes
Latent classes
Analysis of SP data
Model with SP data
Proposal of improved alternatives
23/ 24

Introduction Model framework Latent variable model Integrated model Estimation results Conclusions
Thank you for your attention !
24/ 24

Introduction Model framework Latent variable model Integrated model Estimation results Conclusions
Equations for latent variables Back
Structural equations for latent variables:
Att = Att +∑e
λeXe + ω,
Measurement equations for latent variables:
Ik = ak + αk Att + υk ∀k,
25/ 24