demand for energy and energy generation: does regional
TRANSCRIPT
Demand for Energy and Energy Generation: Does Regional
Energy Policy Play a Role?
Paul OJEAGA1*
, Odejimi DEBORAH2
1 PhD Bergamo Italy, Graduate of Industrial and Applied Economics from the Department of Mathematics,
Economics and Operations Research Bergamo Italy 2 PhD Benin Nigeria, Dean of College of Arts and Social Sciences Igbinedion University Okada
Prepared for Global Energy conference in France 2014
Abstract Does regional energy policy play a role in regional energy generation? What does the implication of the current
industrialization trend mean for the generation and the supply process across regions? And to what extent does regional
energy policy affect energy security (energy supply risks) in regions? This study investigates the effect of regional energy
policy on regional generation characteristics in seven regions of the World using regional panel data from 1980 to 2010 a
period of 31 years although some years of data are missing. It was found that regional energy policy were been shaped by
pollution concerns and that cost reduction needs had strong effects on energy security (energy generation resources supply).
The method of estimation used is the quantile regression estimation method which provides robust estimates after
controlling for heterscedastic errors and is robust in the presence of outliers in the response measurement. Energy policy
has strong implication for access to sustainable supply of energy generation resources however it had little or no effect on
energy generation itself. Industrial demand for energy particularly in the developed countries were probably also making
developed countries depend on more nuclear and hydro energy generation sources.
Keywords: Kyoto Protocol, Energy Policy, Energy Generation and Generation Sources.
1.0 Introduction
In this section we introduce the topic of discussion. World demand for energy is on the increase particularly with
the industrialization drive currently being experienced in emerging economies. For instance from 2016 the United
States will no longer be the largest importer of oil from Nigeria since their imports will be overtaken by China1.
Other issues that bother on consumption patterns such as emissions are also likely to affect regional energy policy.
It is clear that the Kyoto protocol might not be realizable in near future with major energy consuming nations
withdrawing from the Doha 2012 round of talks and other circumstance that point to the fact that emissions cut are
not likely to be met in the future. Energy generation across regions will be affected by the dwindling availability of
fossils as well as drive in improving innovative generative capabilities for cleaner and more sustainable methods of
energy production.
Lots of papers e.g. Knox-Hayes, Brown et al (2013), have also tried to address issues of energy demand and
supply risk in the generation process. However few have tried to relate specifically the effect of industrial demand
for energy on regional specific energy generation and supply. It is also noticeable that industrial energy
consumption is on the increase and noticeable industrialization trends in regions mean that this will continue to
remain so in the near future2. Regions are also highly concerned about cost of each generation source and are likely
to continue to diversify their production capabilities to mitigate supply risks Ojeaga, Azuh and Odejimi (2014). For
instance the paper Cohen et al 2011 argue for diversification away from fossils due to overdependence stating that
one way of risk reduction were probably depending on a variety of energy sources for generational purposes. Cost
of generation- can have strong implications for –energy- stakeholders and -policy makers- forcing countries across
regions to source for cheaper and sustainable ways to improve generational capabilities EU Green Paper 2001.
The role of regional policy and industrial energy consumption on energy supply and generation remains unclear.
The question if countries across regions are actually concerned about industrial demand for energy and the effects
* Email of Corresponding Author: [email protected] 1 Nigeria National Petroleum Corporation (NNPC) Oil Projection for Nigeria 2013 2 (World Bank Statistics 2010)
brought to you by COREView metadata, citation and similar papers at core.ac.uk
provided by Covenant University Repository
6 Computational Methods in Social Sciences
CMSS - VOL. II, ISSUE 1/2014
of regional energy policy on the generation and supply process could offer new insight into how energy
stakeholders view the need for providing energy that will meet the increasing demand in countries across regions.
This paper studies the effect of regional policy on energy generation and supply (energy security) across seven
regions of the World which include Africa, South East Asia Pacific, Australia, Europe, North America and Latin
America. Panel data for regions is used and data is obtained for the period of 1980 to 2010 a period of 31 years
although some years of data are missing. The method of estimation used is the quantile regression estimation
method which provides robust estimates after controlling for heterscedastic errors in the presence of outliers in the
response measurement. The rest of the paper is divided into the scope and objective of study, stylized facts on
regional energy policy and generation, literature review, theory and methodological section, sources of data,
empirical analysis and results and finally the concluding section.
2.0 Scope and Objective of The Study
In this section we state the scope and objective of the study. The study investigates the effect of regional energy
policy (since policy is shaped by energy demand across regions) on energy generation and the energy supply
process across regions using a panel of seven regions in the world. It deals extensively on how regional energy
policy will shape generation and supply patterns across region noting difference across regions and its implication
for the overall supply and generation process across regions. The objectives of the study include;
1. To determine the role of regional energy policy on the energy generation process across regions 2. To examine the extent to which regional energy policy affect energy supply (energy security) across
regions. 3. To determine the implications of industrialization trends on energy supply risk mitigation and energy
production across regions.
3.0 Stylized Facts on Regional Energy Policy and Generation
In this section stylized facts on energy policy and the generation process are presented for regions under study.
Graphs, trends and information are extracted from past studies by Ojeaga, Azuh and Odejimi (2014). The Kyoto
protocol aims to cut emissions particularly green house gases emission to the barest minimum. Energy security is
measured using score values assigned to regions, based on the level of diversification and regional specific
infrastructure in renewable energy sources in regions with North America particularly the
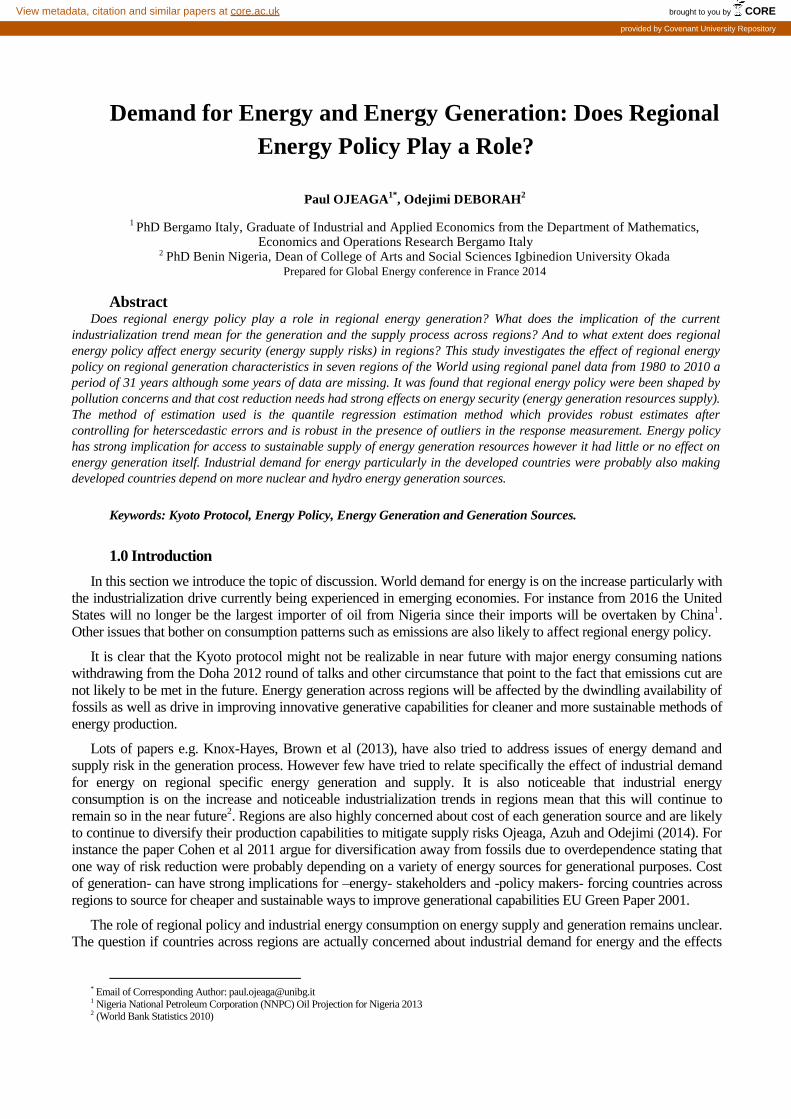
Table 1. World total installed generating capacity by region and country, 2010-2040
Projections yearly
% Δs
2010 2015 2020 2025 2030 2035 2040
OECD
OECD Americas 1,248 1,316 1,324 1,379 1,456 1,546 1,669 1.0
United Statesa 1,033 1,080 1,068 1,098 1,147 1,206 1,293 0.8
Canada 137 144 152 163 174 185 198 1.2
Mexico/Chile 78 93 104 118 135 155 177 2.8
OECD Europe 946 1,028 1,096 1,133 1,159 1,185 1,211 0.8
OECD Asia 441 444 473 489 501 516 524 0.6
Japan 287 275 293 300 304 309 306 0.2
South Korea 85 93 100 107 114 122 130 1.5
Australia/New Zealand 69 76 81 83 83 85 87 0.8
Total OECD 2,635 2,788 2,894 3,002 3,116 3,247 3,403 0.9
Non-OECD
Non-OECD Europe and Eurasia 408 421 455 480 508 538 563 1.1
Russia 229 239 264 282 299 315 325 1.2
Other 179 182 191 198 209 223 239 1.0
Paul OJEAGA, Odejimi DEBORAH 7
CMSS - VOL. II, ISSUE 1/2014
Non-OECD Asia 1,452 1,820 2,188 2,479 2,772 3,057 3,277 2.8
China 988 1,301 1,589 1,804 2,007 2,176 2,265 2.8
India 208 241 285 327 376 440 510 3.0
Other 256 278 314 347 390 441 502 2.3
Middle East 185 197 216 233 247 267 280 1.4
Africa 134 147 164 184 211 244 283 2.5
Central and South America 247 279 304 329 362 400 447 2.0
Brazil 114 137 152 169 191 221 256 2.8
Other 134 142 152 160 171 179 191 1.2
Total Non-OECD 2,426 2,864 3,327 3,705 4,099 4,505 4,850 2.3
Total World 5,061 5,652 6,221 6,707 7,214 7,752 8,254 1.6
aIncludes the 50 states and the District of Columbia.
Note: Totals may not equal sum of components due to independent rounding.
Sources: History: Derived from U.S. Energy Information Administration (EIA), International Energy Statistics database (as of November
2012), www.eia.gov/ies. Projections: EIA, Annual Energy Outlook 2013, DOE/EIA-0383(2013) (Washington, DC: April 2013); AEO2013 National
Energy Modeling System, run REF2013.D102312A, www.eia.gov/aeo ; and World Energy Projection System Plus (2013).
United States having stronger capabilities towards averting energy interruptions. Total installed world energy
capability appears to be on the increase see table 1 above. This is attributable growing domestic demand for energy
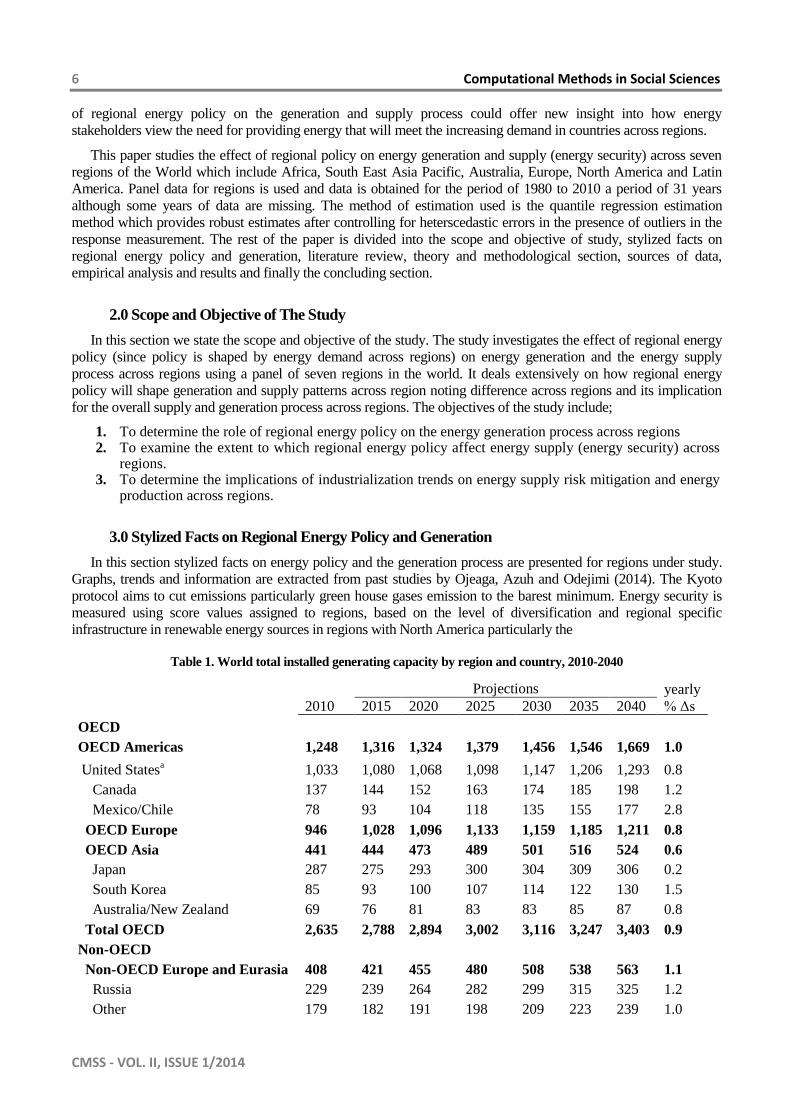
and industrialization needs particularly in emerging nations. Data from Data Market of Iceland also show that here
is also rapid industrialization in Latin America, South East Asia and other emerging African countries starting in the
early 2000s, see graphs 3, 4 and 5 respectively in Fig 3, also means that the competition for the world resources is
on the increase despite the slowdown in the industrialization development of the highly developed countries in
Europe and North America. See graphs 1 and 2 in Fig. 3. Investment in domestic technology in regions is also
ongoing with a steady rate of investment in Europe and North America and continuous improvement for Latin
America and Africa. Statistics also show that North America particularly the United States and Canada have some
of the largest number of Wind generating plants in the World after China
Fig. 1
Note: The graphs above show trends for North America, Europe, Africa, Latin America and South East Asia respectively.
(Renewable Global Status 2006 – 2012 report). Asia is presently experiencing a slowdown from the massive
investment of the 1990s in generation technology, but still maintaining steady investment in the development of
improved generation sources.
68
1012
146
810
1214
1980 1990 2000 2010
1980 1990 2000 20101980 1990 2000 2010
1 2 3
4 5
GD
P in
US
D
YearsGraphs by id
8 Computational Methods in Social Sciences
CMSS - VOL. II, ISSUE 1/2014
Fig. 2
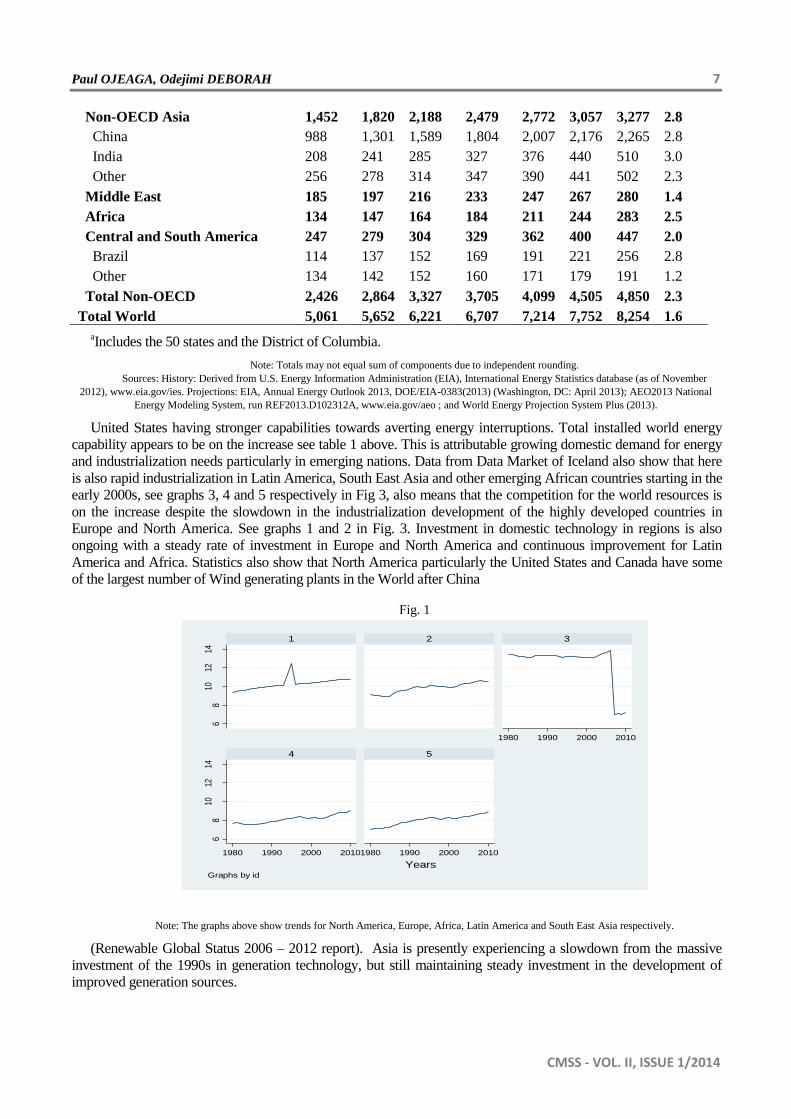
Note: The graphs above show trends for North America, Europe, Africa, Latin America and South East Asia respectively
Statistics show that North America has the most diversified energy sector with the United States having the
highest number of wind farms and hydro power stations in the world. Europe is also gradually disengaging from the
use of nuclear plants in energy generation and introducing renewable energy technology in the energy generation
process although it is still vulnerable to strong dependence on Gas production sources see IEA 2011 report. Hydro
production capabilities utilization is still reasonably high for North America, Europe, Africa and Latin America.
South East Asia is actually experiencing reduced
Fig. 3
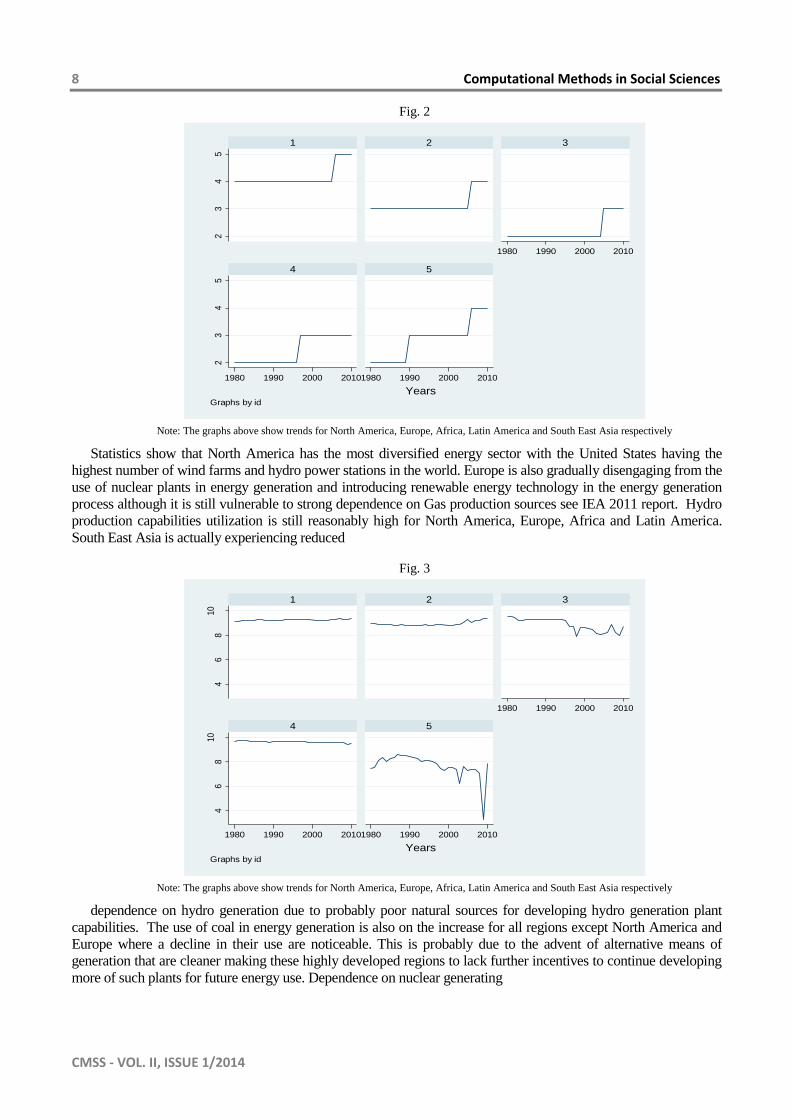
Note: The graphs above show trends for North America, Europe, Africa, Latin America and South East Asia respectively
dependence on hydro generation due to probably poor natural sources for developing hydro generation plant
capabilities. The use of coal in energy generation is also on the increase for all regions except North America and
Europe where a decline in their use are noticeable. This is probably due to the advent of alternative means of
generation that are cleaner making these highly developed regions to lack further incentives to continue developing
more of such plants for future energy use. Dependence on nuclear generating
23
45
23
45
1980 1990 2000 2010
1980 1990 2000 20101980 1990 2000 2010
1 2 3
4 5
Energ
y S
ecu
rity
YearsGraphs by id
46
810
46
810
1980 1990 2000 2010
1980 1990 2000 20101980 1990 2000 2010
1 2 3
4 5
Hyd
ro P
roduct
ion S
ourc
es
YearsGraphs by id
Paul OJEAGA, Odejimi DEBORAH 9
CMSS - VOL. II, ISSUE 1/2014
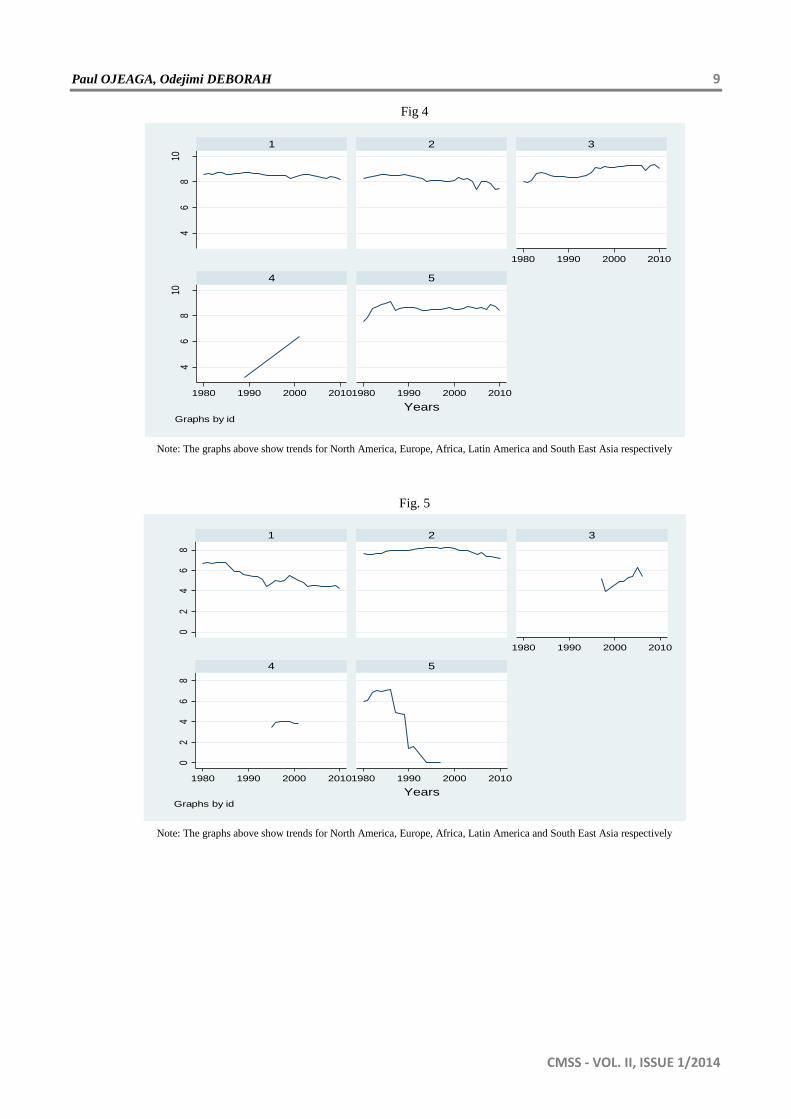
Fig 4
Note: The graphs above show trends for North America, Europe, Africa, Latin America and South East Asia respectively
Fig. 5
Note: The graphs above show trends for North America, Europe, Africa, Latin America and South East Asia respectively
46
810
46
810
1980 1990 2000 2010
1980 1990 2000 20101980 1990 2000 2010
1 2 3
4 5
Coa
l Pro
duct
ion
Sou
rces
YearsGraphs by id
02
46
80
24
68
1980 1990 2000 2010
1980 1990 2000 20101980 1990 2000 2010
1 2 3
4 5
Nuc
lear
Pro
duct
ion
Sou
rces
YearsGraphs by id
10 Computational Methods in Social Sciences
CMSS - VOL. II, ISSUE 1/2014
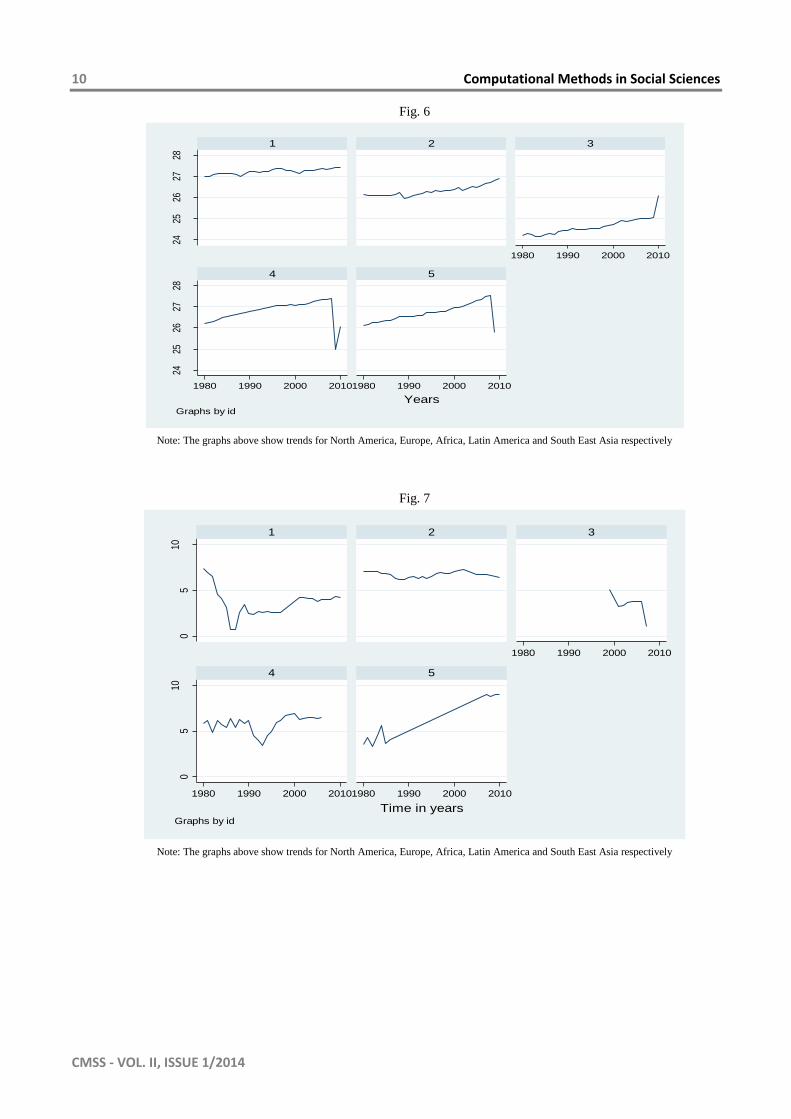
Fig. 6
Note: The graphs above show trends for North America, Europe, Africa, Latin America and South East Asia respectively
Fig. 7
Note: The graphs above show trends for North America, Europe, Africa, Latin America and South East Asia respectively
2425
2627
2824
2526
2728
1980 1990 2000 2010
1980 1990 2000 20101980 1990 2000 2010
1 2 3
4 5
Ren
ewab
le P
rodu
ctio
n S
ourc
es
YearsGraphs by id
05
100
510
1980 1990 2000 2010
1980 1990 2000 20101980 1990 2000 2010
1 2 3
4 5
Gas
Pro
duct
ion
Sou
rces
Time in yearsGraphs by id
Paul OJEAGA, Odejimi DEBORAH 11
CMSS - VOL. II, ISSUE 1/2014
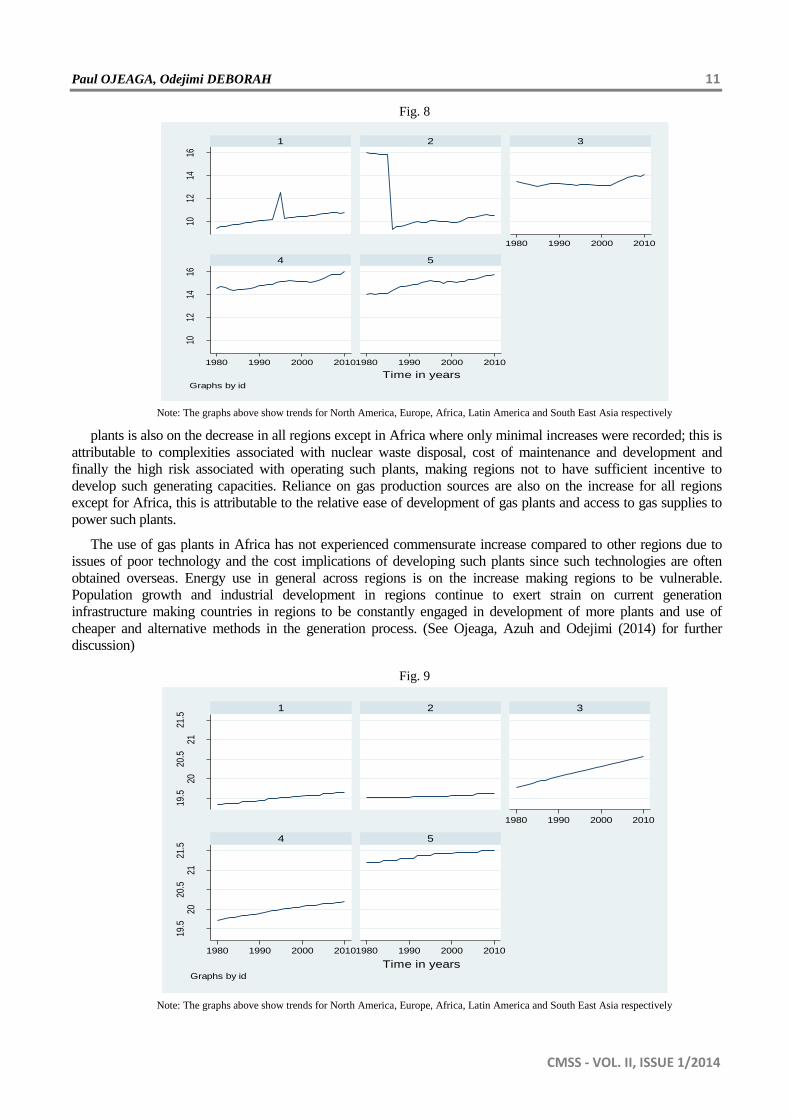
Fig. 8
Note: The graphs above show trends for North America, Europe, Africa, Latin America and South East Asia respectively
plants is also on the decrease in all regions except in Africa where only minimal increases were recorded; this is
attributable to complexities associated with nuclear waste disposal, cost of maintenance and development and
finally the high risk associated with operating such plants, making regions not to have sufficient incentive to
develop such generating capacities. Reliance on gas production sources are also on the increase for all regions
except for Africa, this is attributable to the relative ease of development of gas plants and access to gas supplies to
power such plants.
The use of gas plants in Africa has not experienced commensurate increase compared to other regions due to
issues of poor technology and the cost implications of developing such plants since such technologies are often
obtained overseas. Energy use in general across regions is on the increase making regions to be vulnerable.
Population growth and industrial development in regions continue to exert strain on current generation
infrastructure making countries in regions to be constantly engaged in development of more plants and use of
cheaper and alternative methods in the generation process. (See Ojeaga, Azuh and Odejimi (2014) for further
discussion)
Fig. 9
Note: The graphs above show trends for North America, Europe, Africa, Latin America and South East Asia respectively
1012
1416
1012
1416
1980 1990 2000 2010
1980 1990 2000 20101980 1990 2000 2010
1 2 3
4 5
Indu
stra
lizat
ion
rate
Time in yearsGraphs by id
19.5
2020
.521
21.5
19.5
2020
.521
21.5
1980 1990 2000 2010
1980 1990 2000 20101980 1990 2000 2010
1 2 3
4 5
dom
estic
con
sum
ptio
n ra
te
Time in yearsGraphs by id
12 Computational Methods in Social Sciences
CMSS - VOL. II, ISSUE 1/2014
3.1 Literature Review
In this section we review some literature related to the topic under study. Ojeaga et al (2014), state that
availability of energy resources and access to interruptible energy generation supply is likely to hit Europe most
owing to extreme cold winter temperatures and dependence on gas supply from Russia and other external sources.
They reiterate that while energy supply conditions in North America seem to be improving slightly in the 2000s
with President Obama’s recent approval in 2011/2012 of more drilling rights particularly on the US soil. Facts show
that about 19% of the world electricity production comes from renewable energy sources with hydro electricity
production alone accounting for about 16% of world electricity production (see International Energy Agency
Report 2011).
The IEA Report 2011, mentions environmental constraints, industrialization rate, domestic consumption
characteristics and regional specific investment in domestic technology as possible determinants of energy
availability across regions.
Lots of literatures also continue to argue for diversification away from fossils due to overdependence (Cohen et
al 2011), stating that diversification can lead to sustained supply and mitigate future risk of energy shortage
attributable to cost related factors that affect gas supply availability.
Awerbach and Berger (2003) state that the cost in this case determines returns, and that cost are in fact the
inverse function of returns, therefore optimizing portfolio cost is not likely to affect results making cost to have no
effect on the generating mix.
Coq and Palseva (2004) and Newman (2004, 2007). State that increase in demand are not likely to affect energy
security on the short-run since consuming countries are likely to shift to new exporters.
Jansen and Beurskens (2004) also study the impact of portfolio diversity on cost for energy importing countries
and state that consumer countries should hold portfolios free of cost risk associated with the hikes in fossil fuel
prices.
Knox-Hayes, Brown et al (2013) also attempt to study the effect of cross country energy policy effects on
energy security from country specific perspective, to energy vulnerability aversion, they find that energy security is
actually been affected by country specific domestic consumption and reliance on specific sources for energy
generation.
Investment in domestic technology in regions is also ongoing with a steady rate of investment in Europe and
North America and continuous improvement for Latin America and Africa. North America particularly the United
States and Canada have some of the largest number of Wind generating plants in the World after China (Renewable
Global Status 2006 – 2012 report).
Awerbauch, Stirling, Jansen and Beurskens (2004), define energy security in terms of portfolio diversity and
green house gases (GHG) reduction concerns. Ojeaga, Azuh, Odejimi (2014), also state that Kyoto protocol will
shape energy policy strategically but has been met with still resistances by the major fossil consumers.
Finally, they measure energy security using country specific signatory and participation in the Kyoto Accord
and meeting proceedings, starting from 1998 when the first inter government panels were set up to 2010 when
commitment towards emission reduction and implementation plans were emphasized, using score values of 1 to 3
depending on regional level of implementation and finally using consumption patterns in the pre Kyoto protocol
years.
4.0 Theory and Methodology
Past theories show that having strong energy mix could substantially reduce supply risk in the energy generation
process suggesting that cost is not likely to have any effect on the generating mix, Awerbach and Berger (2003).
Others also suggest that demand increases will not affect energy cost on the short run since consuming countries
will seek new exporters Coq and Palseva (2004) and Newman (2004, 2007). Knox-Hayes, Brown et al (2013)
explains otherwise stating specifically that energy security (risk of supply disruption) is currently be affected by
increasing consumption in countries using a panel of several countries.
Paul OJEAGA, Odejimi DEBORAH 13
CMSS - VOL. II, ISSUE 1/2014
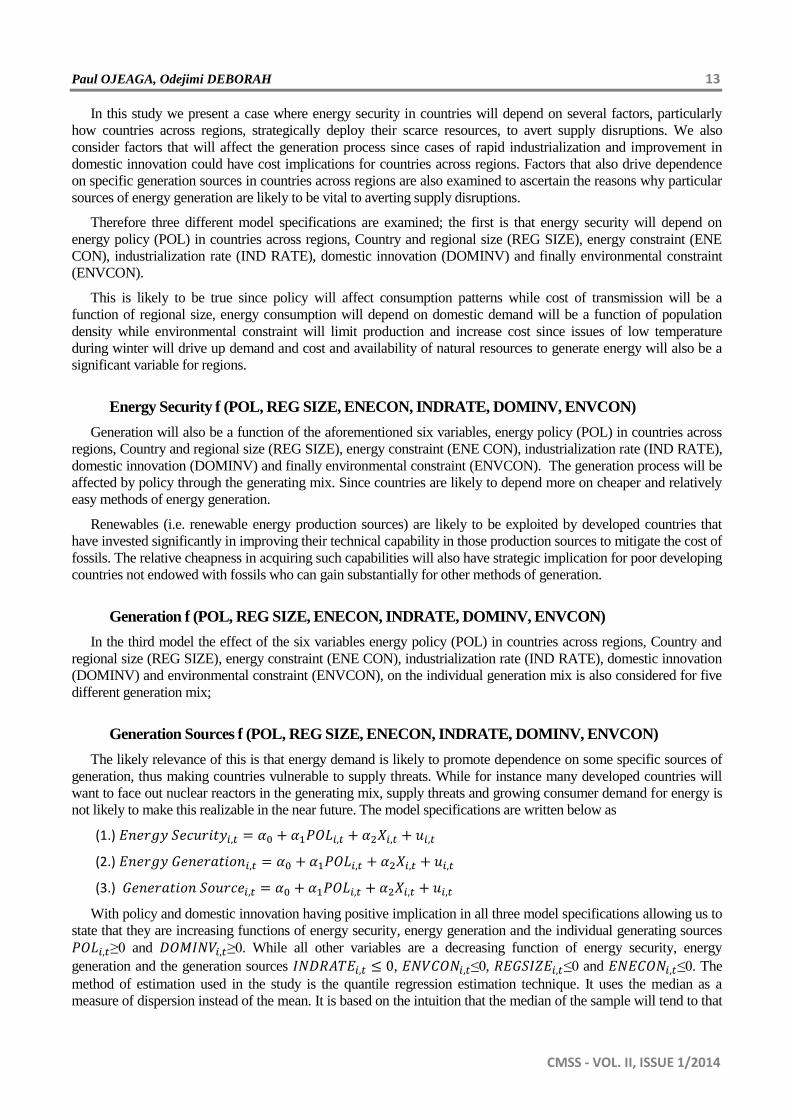
In this study we present a case where energy security in countries will depend on several factors, particularly
how countries across regions, strategically deploy their scarce resources, to avert supply disruptions. We also
consider factors that will affect the generation process since cases of rapid industrialization and improvement in
domestic innovation could have cost implications for countries across regions. Factors that also drive dependence
on specific generation sources in countries across regions are also examined to ascertain the reasons why particular
sources of energy generation are likely to be vital to averting supply disruptions.
Therefore three different model specifications are examined; the first is that energy security will depend on
energy policy (POL) in countries across regions, Country and regional size (REG SIZE), energy constraint (ENE
CON), industrialization rate (IND RATE), domestic innovation (DOMINV) and finally environmental constraint
(ENVCON).
This is likely to be true since policy will affect consumption patterns while cost of transmission will be a
function of regional size, energy consumption will depend on domestic demand will be a function of population
density while environmental constraint will limit production and increase cost since issues of low temperature
during winter will drive up demand and cost and availability of natural resources to generate energy will also be a
significant variable for regions.
Energy Security f (POL, REG SIZE, ENECON, INDRATE, DOMINV, ENVCON)
Generation will also be a function of the aforementioned six variables, energy policy (POL) in countries across
regions, Country and regional size (REG SIZE), energy constraint (ENE CON), industrialization rate (IND RATE),
domestic innovation (DOMINV) and finally environmental constraint (ENVCON). The generation process will be
affected by policy through the generating mix. Since countries are likely to depend more on cheaper and relatively
easy methods of energy generation.
Renewables (i.e. renewable energy production sources) are likely to be exploited by developed countries that
have invested significantly in improving their technical capability in those production sources to mitigate the cost of
fossils. The relative cheapness in acquiring such capabilities will also have strategic implication for poor developing
countries not endowed with fossils who can gain substantially for other methods of generation.
Generation f (POL, REG SIZE, ENECON, INDRATE, DOMINV, ENVCON)
In the third model the effect of the six variables energy policy (POL) in countries across regions, Country and
regional size (REG SIZE), energy constraint (ENE CON), industrialization rate (IND RATE), domestic innovation
(DOMINV) and environmental constraint (ENVCON), on the individual generation mix is also considered for five
different generation mix;
Generation Sources f (POL, REG SIZE, ENECON, INDRATE, DOMINV, ENVCON)
The likely relevance of this is that energy demand is likely to promote dependence on some specific sources of
generation, thus making countries vulnerable to supply threats. While for instance many developed countries will
want to face out nuclear reactors in the generating mix, supply threats and growing consumer demand for energy is
not likely to make this realizable in the near future. The model specifications are written below as
(1.)
(2.)
(3.)
With policy and domestic innovation having positive implication in all three model specifications allowing us to
state that they are increasing functions of energy security, energy generation and the individual generating sources
≥0 and ≥0. While all other variables are a decreasing function of energy security, energy
generation and the generation sources , ≤0, ≤0 and ≤0. The
method of estimation used in the study is the quantile regression estimation technique. It uses the median as a
measure of dispersion instead of the mean. It is based on the intuition that the median of the sample will tend to that
14 Computational Methods in Social Sciences
CMSS - VOL. II, ISSUE 1/2014
of the population. It provides robust estimate in the presence of outliers in the sample measure particularly the
quantile regression wrapper (qreg2) as presented by Machando and Silva (2013). The bootstrapped simultaneous
quantile regression estimation also provides the opportunity for re-sampling the dataset and testing the predictive
capability of dataset in cases of stringency in the data.
5.0 Sources of Data
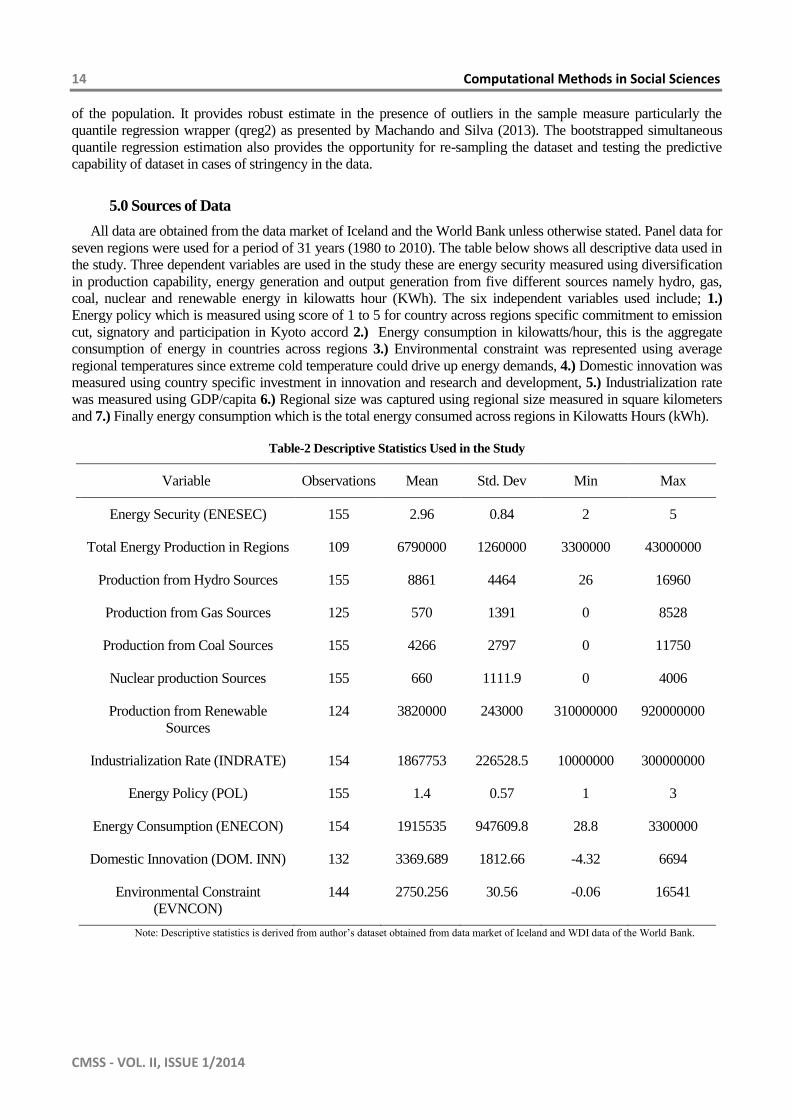
All data are obtained from the data market of Iceland and the World Bank unless otherwise stated. Panel data for
seven regions were used for a period of 31 years (1980 to 2010). The table below shows all descriptive data used in
the study. Three dependent variables are used in the study these are energy security measured using diversification
in production capability, energy generation and output generation from five different sources namely hydro, gas,
coal, nuclear and renewable energy in kilowatts hour (KWh). The six independent variables used include; 1.)
Energy policy which is measured using score of 1 to 5 for country across regions specific commitment to emission
cut, signatory and participation in Kyoto accord 2.) Energy consumption in kilowatts/hour, this is the aggregate
consumption of energy in countries across regions 3.) Environmental constraint was represented using average
regional temperatures since extreme cold temperature could drive up energy demands, 4.) Domestic innovation was
measured using country specific investment in innovation and research and development, 5.) Industrialization rate
was measured using GDP/capita 6.) Regional size was captured using regional size measured in square kilometers
and 7.) Finally energy consumption which is the total energy consumed across regions in Kilowatts Hours (kWh).
Table-2 Descriptive Statistics Used in the Study
Variable Observations Mean Std. Dev Min Max
Energy Security (ENESEC) 155 2.96 0.84 2 5
Total Energy Production in Regions 109 6790000 1260000 3300000 43000000
Production from Hydro Sources 155 8861 4464 26 16960
Production from Gas Sources 125 570 1391 0 8528
Production from Coal Sources 155 4266 2797 0 11750
Nuclear production Sources 155 660 1111.9 0 4006
Production from Renewable
Sources
124 3820000 243000 310000000 920000000
Industrialization Rate (INDRATE) 154 1867753 226528.5 10000000 300000000
Energy Policy (POL) 155 1.4 0.57 1 3
Energy Consumption (ENECON) 154 1915535 947609.8 28.8 3300000
Domestic Innovation (DOM. INN) 132 3369.689 1812.66 -4.32 6694
Environmental Constraint
(EVNCON)
144 2750.256 30.56 -0.06 16541
Note: Descriptive statistics is derived from author’s dataset obtained from data market of Iceland and WDI data of the World Bank.
Paul OJEAGA, Odejimi DEBORAH 15
CMSS - VOL. II, ISSUE 1/2014
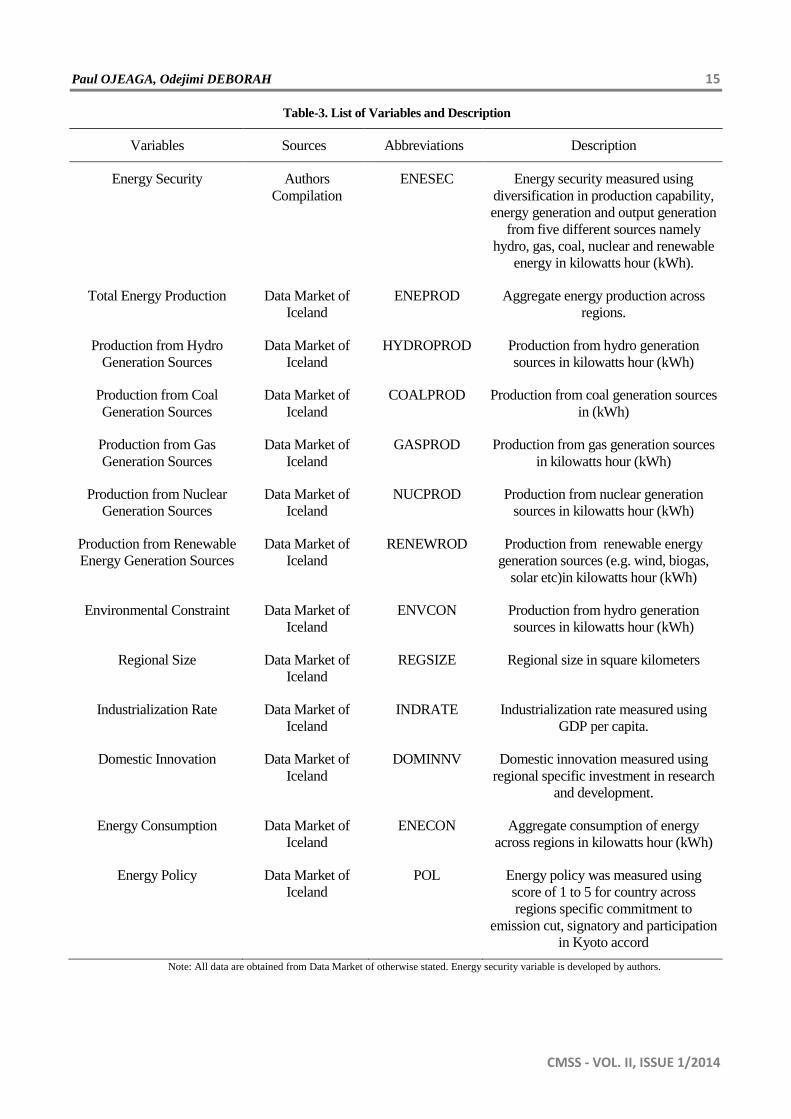
Table-3. List of Variables and Description
Variables Sources Abbreviations Description
Energy Security Authors
Compilation
ENESEC Energy security measured using
diversification in production capability,
energy generation and output generation
from five different sources namely
hydro, gas, coal, nuclear and renewable
energy in kilowatts hour (kWh).
Total Energy Production Data Market of
Iceland
ENEPROD Aggregate energy production across
regions.
Production from Hydro
Generation Sources
Data Market of
Iceland
HYDROPROD Production from hydro generation
sources in kilowatts hour (kWh)
Production from Coal
Generation Sources
Data Market of
Iceland
COALPROD Production from coal generation sources
in (kWh)
Production from Gas
Generation Sources
Data Market of
Iceland
GASPROD Production from gas generation sources
in kilowatts hour (kWh)
Production from Nuclear
Generation Sources
Data Market of
Iceland
NUCPROD Production from nuclear generation
sources in kilowatts hour (kWh)
Production from Renewable
Energy Generation Sources
Data Market of
Iceland
RENEWROD Production from renewable energy
generation sources (e.g. wind, biogas,
solar etc)in kilowatts hour (kWh)
Environmental Constraint Data Market of
Iceland
ENVCON Production from hydro generation
sources in kilowatts hour (kWh)
Regional Size Data Market of
Iceland
REGSIZE Regional size in square kilometers
Industrialization Rate Data Market of
Iceland
INDRATE Industrialization rate measured using
GDP per capita.
Domestic Innovation Data Market of
Iceland
DOMINNV Domestic innovation measured using
regional specific investment in research
and development.
Energy Consumption Data Market of
Iceland
ENECON Aggregate consumption of energy
across regions in kilowatts hour (kWh)
Energy Policy Data Market of
Iceland
POL
Energy policy was measured using
score of 1 to 5 for country across
regions specific commitment to
emission cut, signatory and participation
in Kyoto accord
Note: All data are obtained from Data Market of otherwise stated. Energy security variable is developed by authors.
16 Computational Methods in Social Sciences
CMSS - VOL. II, ISSUE 1/2014
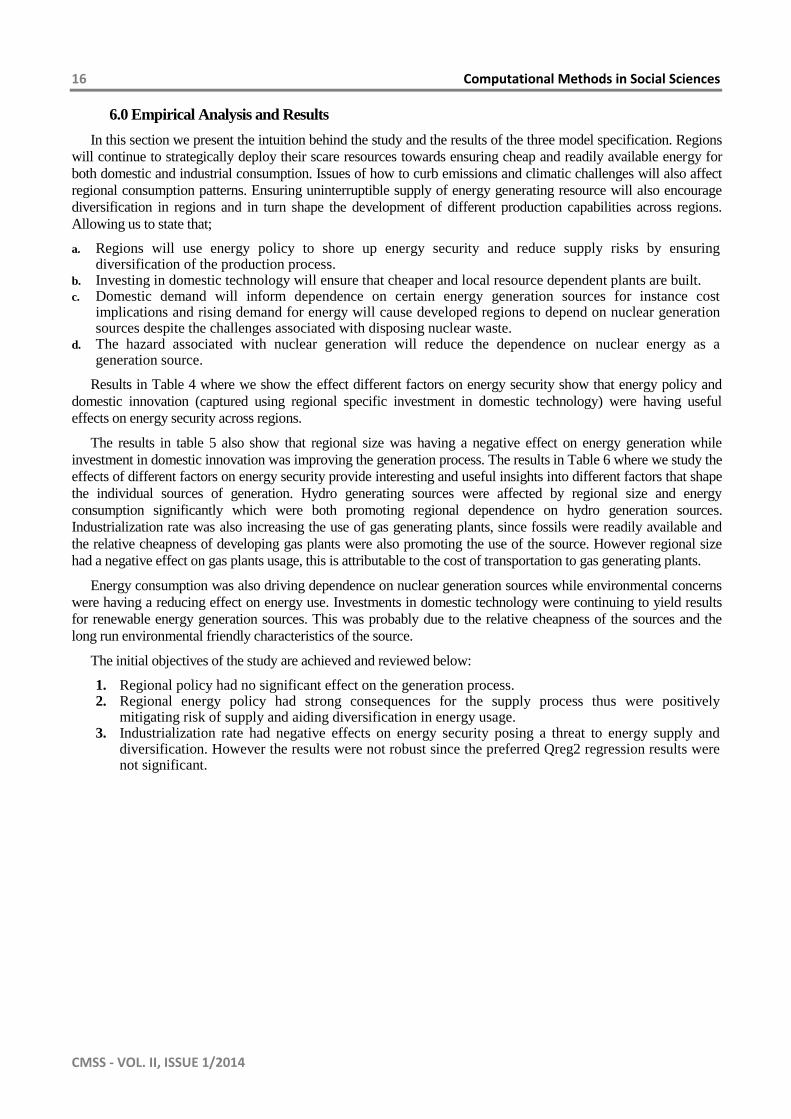
6.0 Empirical Analysis and Results
In this section we present the intuition behind the study and the results of the three model specification. Regions
will continue to strategically deploy their scare resources towards ensuring cheap and readily available energy for
both domestic and industrial consumption. Issues of how to curb emissions and climatic challenges will also affect
regional consumption patterns. Ensuring uninterruptible supply of energy generating resource will also encourage
diversification in regions and in turn shape the development of different production capabilities across regions.
Allowing us to state that;
a. Regions will use energy policy to shore up energy security and reduce supply risks by ensuring diversification of the production process.
b. Investing in domestic technology will ensure that cheaper and local resource dependent plants are built. c. Domestic demand will inform dependence on certain energy generation sources for instance cost
implications and rising demand for energy will cause developed regions to depend on nuclear generation sources despite the challenges associated with disposing nuclear waste.
d. The hazard associated with nuclear generation will reduce the dependence on nuclear energy as a generation source.
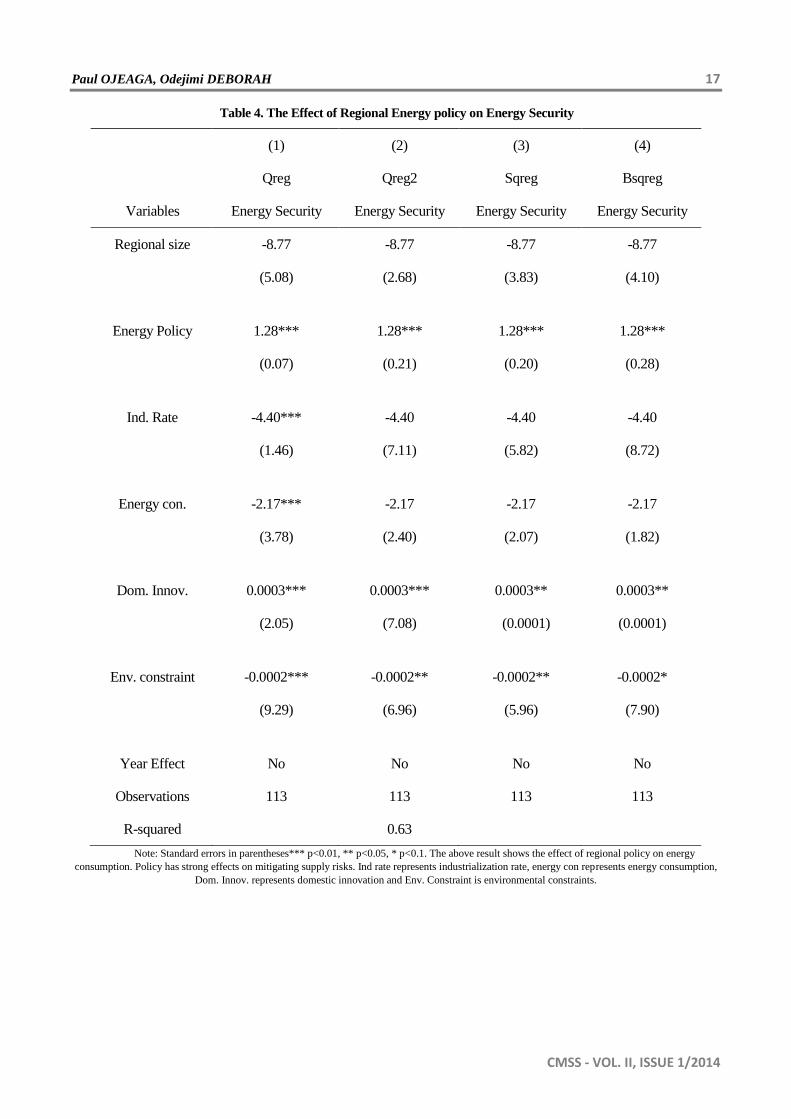
Results in Table 4 where we show the effect different factors on energy security show that energy policy and
domestic innovation (captured using regional specific investment in domestic technology) were having useful
effects on energy security across regions.
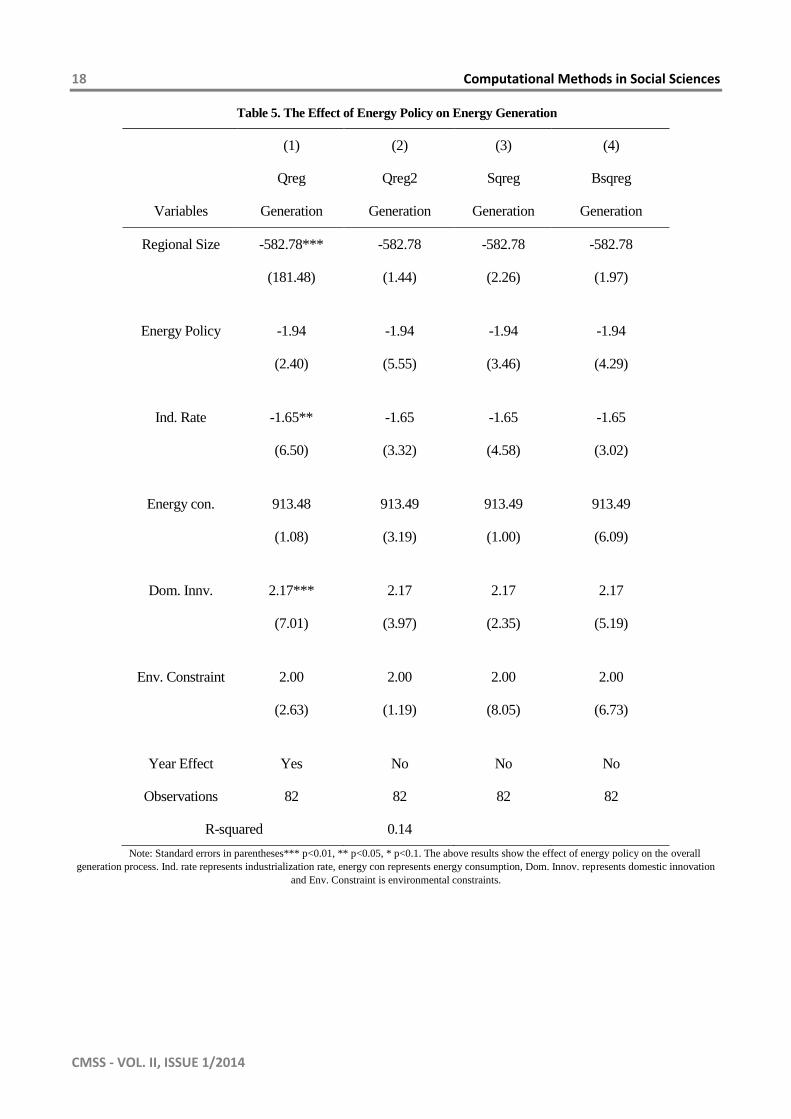
The results in table 5 also show that regional size was having a negative effect on energy generation while
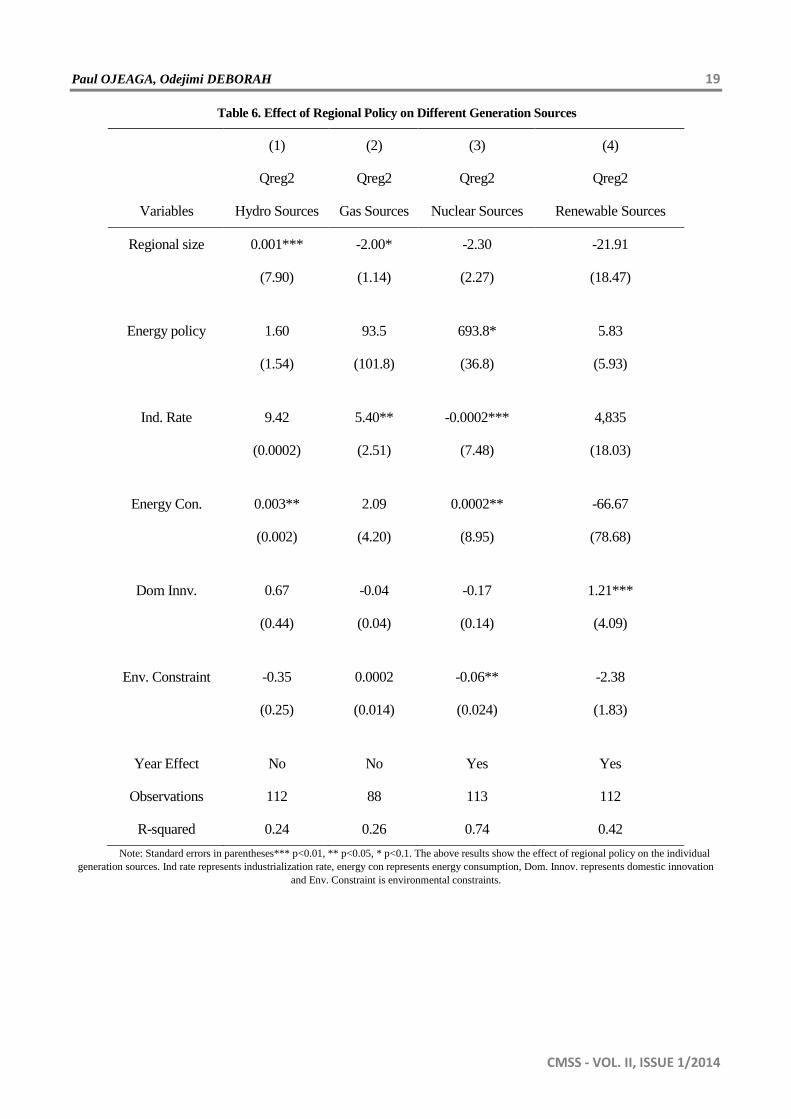
investment in domestic innovation was improving the generation process. The results in Table 6 where we study the
effects of different factors on energy security provide interesting and useful insights into different factors that shape
the individual sources of generation. Hydro generating sources were affected by regional size and energy
consumption significantly which were both promoting regional dependence on hydro generation sources.
Industrialization rate was also increasing the use of gas generating plants, since fossils were readily available and
the relative cheapness of developing gas plants were also promoting the use of the source. However regional size
had a negative effect on gas plants usage, this is attributable to the cost of transportation to gas generating plants.
Energy consumption was also driving dependence on nuclear generation sources while environmental concerns
were having a reducing effect on energy use. Investments in domestic technology were continuing to yield results
for renewable energy generation sources. This was probably due to the relative cheapness of the sources and the
long run environmental friendly characteristics of the source.
The initial objectives of the study are achieved and reviewed below:
1. Regional policy had no significant effect on the generation process. 2. Regional energy policy had strong consequences for the supply process thus were positively
mitigating risk of supply and aiding diversification in energy usage. 3. Industrialization rate had negative effects on energy security posing a threat to energy supply and
diversification. However the results were not robust since the preferred Qreg2 regression results were not significant.
Paul OJEAGA, Odejimi DEBORAH 17
CMSS - VOL. II, ISSUE 1/2014
Table 4. The Effect of Regional Energy policy on Energy Security
(1) (2) (3) (4)
Qreg Qreg2 Sqreg Bsqreg
Variables Energy Security Energy Security Energy Security Energy Security
Regional size -8.77 -8.77 -8.77 -8.77
(5.08) (2.68) (3.83) (4.10)
Energy Policy 1.28*** 1.28*** 1.28*** 1.28***
(0.07) (0.21) (0.20) (0.28)
Ind. Rate -4.40*** -4.40 -4.40 -4.40
(1.46) (7.11) (5.82) (8.72)
Energy con. -2.17*** -2.17 -2.17 -2.17
(3.78) (2.40) (2.07) (1.82)
Dom. Innov. 0.0003*** 0.0003*** 0.0003** 0.0003**
(2.05) (7.08) (0.0001) (0.0001)
Env. constraint -0.0002*** -0.0002** -0.0002** -0.0002*
(9.29) (6.96) (5.96) (7.90)
Year Effect No No No No
Observations 113 113 113 113
R-squared
0.63
Note: Standard errors in parentheses*** p<0.01, ** p<0.05, * p<0.1. The above result shows the effect of regional policy on energy
consumption. Policy has strong effects on mitigating supply risks. Ind rate represents industrialization rate, energy con represents energy consumption,
Dom. Innov. represents domestic innovation and Env. Constraint is environmental constraints.
18 Computational Methods in Social Sciences
CMSS - VOL. II, ISSUE 1/2014
Table 5. The Effect of Energy Policy on Energy Generation
(1) (2) (3) (4)
Qreg Qreg2 Sqreg Bsqreg
Variables Generation Generation Generation Generation
Regional Size -582.78*** -582.78 -582.78 -582.78
(181.48) (1.44) (2.26) (1.97)
Energy Policy -1.94 -1.94 -1.94 -1.94
(2.40) (5.55) (3.46) (4.29)
Ind. Rate -1.65** -1.65 -1.65 -1.65
(6.50) (3.32) (4.58) (3.02)
Energy con. 913.48 913.49 913.49 913.49
(1.08) (3.19) (1.00) (6.09)
Dom. Innv. 2.17*** 2.17 2.17 2.17
(7.01) (3.97) (2.35) (5.19)
Env. Constraint 2.00 2.00 2.00 2.00
(2.63) (1.19) (8.05) (6.73)
Year Effect Yes No No No
Observations 82 82 82 82
R-squared 0.14
Note: Standard errors in parentheses*** p<0.01, ** p<0.05, * p<0.1. The above results show the effect of energy policy on the overall
generation process. Ind. rate represents industrialization rate, energy con represents energy consumption, Dom. Innov. represents domestic innovation
and Env. Constraint is environmental constraints.
Paul OJEAGA, Odejimi DEBORAH 19
CMSS - VOL. II, ISSUE 1/2014
Table 6. Effect of Regional Policy on Different Generation Sources
(1) (2) (3) (4)
Qreg2 Qreg2 Qreg2 Qreg2
Variables Hydro Sources Gas Sources Nuclear Sources Renewable Sources
Regional size 0.001*** -2.00* -2.30 -21.91
(7.90) (1.14) (2.27) (18.47)
Energy policy 1.60 93.5 693.8* 5.83
(1.54) (101.8) (36.8) (5.93)
Ind. Rate 9.42 5.40** -0.0002*** 4,835
(0.0002) (2.51) (7.48) (18.03)
Energy Con. 0.003** 2.09 0.0002** -66.67
(0.002) (4.20) (8.95) (78.68)
Dom Innv. 0.67 -0.04 -0.17 1.21***
(0.44) (0.04) (0.14) (4.09)
Env. Constraint -0.35 0.0002 -0.06** -2.38
(0.25) (0.014) (0.024) (1.83)
Year Effect No No Yes Yes
Observations 112 88 113 112
R-squared 0.24 0.26 0.74 0.42
Note: Standard errors in parentheses*** p<0.01, ** p<0.05, * p<0.1. The above results show the effect of regional policy on the individual
generation sources. Ind rate represents industrialization rate, energy con represents energy consumption, Dom. Innov. represents domestic innovation
and Env. Constraint is environmental constraints.
20 Computational Methods in Social Sciences
CMSS - VOL. II, ISSUE 1/2014
7.0 Discussion and Conclusion
The study provides useful incites for policy makers who wish to understand factors that affect energy supply and
generation in countries across regions. The results of the study show that energy policies across regions were not
having useful implications for the generation process.
Furthermore energy policies were improving the supply process for generation, mitigating the risk of energy
availability disruption but were not increasing the generation capacity across regions.
Industrialization trends prove to be faster than regional improvement in production capability. The risk is that
developed countries were relying more on gas plants due to the relative cheapness in their acquisition and on
nuclear generation sources making these two capabilities to be the mainstay in the generation process in many
developed countries.
Renewable energy generation was being improved by increasing investment in domestic innovation. Developed
countries were experiencing returns on investment on renewable energy production capabilities with relative
increase in renewable energy production. The implication of this is that renewable energy sources were fast
becoming popular and could be quite useful in the future.
References
[1] Blyth, W., Lefevre, N., (2004). “Energy Security and Climate Change: An Assessment Framework”. OECD/International Energy Agency Information Paper. Paris, France.
[2] Bryce, R., (2008). “The Dangerous Delusions of ‘‘Energy Independence’’. Public Affairs. New York, NY.
[3] Cohen, G., Joutz, F., Loungani, P., (2011). “Measuring Energy Security: Trends in the Diversification of Oil and Natural Gas Supplies”. IMF Working Paper No. 11/39. Washington, DC.
[4] European Commission, (2000). “Towards a European Strategy for the Security of Energy Supply”. Green Paper, COM769. Brussels, Belgium.
[5] European Commission, (2006). “A European Strategy for Sustainable, Competitive and Secure Energy”. Green Paper, COM105. Brussels,
Belgium.
[6] Geden, Oliver. (2009). “EU Energy Policy“, in Andris Spruds, Toms Rostoks, eds., Energy. Pulling The Baltic Sea Region Together or Apart?,
pp. 12-26. Riga: Latvian Institute of International Affairs.
[7] George, Stephen. (1991). “Politics and Policy in the European Community”. Oxford: OUP
[8] Gupta, E., (2008). “Oil vulnerability index of oil-importing countries”. Energy Policy 36 (3), 1195–1211.
[9] Hakes, J., (2008). “A Declaration of Energy Independence: How Freedom from Foreign Oil Can Improve National Security, Our Economy, and
the Environment”. John Wiley & Sons, Inc., Hoboken, NJ.
[10] LaCasse, C., Plourde, A., (1995). “On the renewal of concern for the security of oil supply”. Energy Journal 16 (2), 1–23.
[11] Le Coq, C., Paltseva, E., (2008). “Common Energy Policy in the EU: The Moral Hazard of the Security of External Supply”. SIEPS Report 2008:1. Stockholm, Sweden.
[12] Le Coq, C., Paltseva, E.,(2009). “Measuring the security of external energy supply in the European Union”. Energy Policy 37 (11), 4474–4481.
[13] Lefevre, N. et al., (2009). “Analysis of Impacts of Climate Change Policies on Energy Security: Final Report”. Ecofys International BV. Utrech,
The Netherlands.
[14] Loschel, A., Moslener, U., Rubbelke, D., (2010a). “Energy security—concepts and indicators”. Energy Policy 38 (4), 1607–1608.
[15] Loschel, A., Moslener, U., Rubbelke, D., (2010b). “Indicators of energy security in industrialized Countries”. Energy Policy 38 (4), 1665–1671.
[16] Loungani, P., (2009). “The elusive quest for energy independence”. International Finance 12 (2), 291–299.
[17] Neumann, A., (2004). “Security of Supply in Liberalised European Gas Markets”. Diploma Thesis, European University Viadrina. Viadrina,
Germany.
[18] Neumann, A.,(2007). “How to measure security of supply?” Mimeo, Dresden University of Technology. Dresden, Germany.
[19] Organisation for Economic Co-operation and Development (OECD), (2004). Economic Outlook No. 76. Paris, France.
[20] Press Trust of India, (2010). “Uncertainty, Volatility Still a Threat to Oil Market”, Kuwait City. OPEC
/http://profit.ndtv.com/news/show/uncertainty-volatility-still-a-threatto- oil-market-opec-36438S. PRS (Political Risk Services) Group available at /http://www.prsgroup.com/S.
[21] Rosendahl, K.E., Sagen, E.L., (2009). “The global natural gas market: will transport cost reductions lead to lower prices?” Energy Journal 30
(2), 17–39.
[22] Sandalow, D., (2008). “Freedom from Oil: How the Next President Can End the United States’ Oil Addiction”. The McGraw-Hill Companies,
New York, NY.
[23] U.S. Energy Information Administration, (2011a). “Annual Energy Outlook 2011 with Projections to 2035”, DOE/EIA-0383(2011),
Washington, DC.
[24] U.S. Energy Information Administration, (2011b). “World Shale Gas Resources: An Initial Assessment of 14 Regions Outside the United
States”. DOE/EIA Report, Washington, DC.
[25] Van der Linde, C. et al., (2004). “Study on Energy Supply Security and Geopolitics”. CIEP Report, Clingendael International Energy
Programme. The Hague.
[26] Yergin, D., (2009). “The Long Aftershock: Oil and Energy Security after the Price Collapse”. Testimony to the Joint Economic Committee
(JEC) of the U.S. Congress on May 20, 2009. Washington, DC.