deltek mpm™ 3
TRANSCRIPT

Deltek MPM™ 3.4 Getting Started Manual
March 25, 2011

Getting Started Manual ii
While Deltek has attempted to verify that the information in this document is accurate and complete, some typographical or technical errors may exist. The recipient of this document is solely responsible for all decisions relating to or use of the information provided herein.
The information contained in this publication is effective as of the publication date below and is subject to change without notice.
This publication contains proprietary information that is protected by copyright. All rights are reserved. No part of this document may be reproduced or transmitted in any form or by any means, electronic or mechanical, or translated into another language, without the prior written consent of Deltek, Inc.
This edition published March 2011.
© 2011 Deltek, Inc.
Deltek’s software is also protected by copyright law and constitutes valuable confidential and proprietary information of Deltek, Inc. and its licensors. The Deltek software, and all related documentation, is provided for use only in accordance with the terms of the license agreement. Unauthorized reproduction or distribution of the program or any portion thereof could result in severe civil or criminal penalties.
All trademarks are the property of their respective owners.

Getting Started Manual iii
Contents Overview .......................................................................................................................................... 1
If You Need Assistance ................................................................................................................... 2
Customer Services ...................................................................................................................... 2
Customer Care Connect Site ...................................................................................................... 2
Contacting Technical Services .................................................................................................... 3
Conversion Support ..................................................................................................................... 3
Additional Documentation ........................................................................................................... 4
Introduction to MPM ........................................................................................................................ 5
Baseline Planning/Estimates to Complete .................................................................................. 5
MS Project Interface .................................................................................................................... 5
Performance Measurement ......................................................................................................... 5
C/SCSC Reporting ...................................................................................................................... 6
Subcontract Management ........................................................................................................... 6
Security Features ........................................................................................................................ 6
Backing Up MPM Files .................................................................................................................... 7
Backing Up MPM Files ................................................................................................................ 7
Using MPM ...................................................................................................................................... 9
Logging In and Logging Out of MPM ........................................................................................ 11
Running the User Logout Utility ................................................................................................ 14
Using the Menu Manager .......................................................................................................... 15
The Open Dialog Box — Access to MPM Tasks ...................................................................... 18
MPM Task Windows .................................................................................................................. 20
Changing the MPM Display ....................................................................................................... 24
Setting MPM Options ................................................................................................................ 27
Previewing Data ........................................................................................................................ 30
Printing Data .............................................................................................................................. 31
Multi-User Access & Record Locking ........................................................................................ 32
Recovering System Files .......................................................................................................... 33
Introduction to Data Warehouse .................................................................................................... 34
Workflow Overview .................................................................................................................... 35
The Data Warehouse Scheduler ............................................................................................... 37
Changing the Project Synchronization Retry Settings .............................................................. 40
Deleting Existing Project \ Global Data from within Data Warehouse ...................................... 41
Data Warehouse Troubleshooting ............................................................................................ 42
The MPM OLAP Cube ................................................................................................................... 44

Getting Started Manual iv
Connecting to an MPM OLAP Cube ......................................................................................... 44
Using the Excel PivotTable Field List ........................................................................................ 49
Scheduling OLAP Processing ................................................................................................... 53
Appendix A: Data Warehouse Tables and Views .......................................................................... 58
Synchronization Tables ............................................................................................................. 60
Appendix B: OLAP Dimensions and Measures ............................................................................. 61

Overview
Overview This Getting Started Guide describes how to begin using MPM, Data Warehouse, and OLAP. The components include:
Introduction to MPM Backing Up MPM Files
Using MPM Introduction to Data Warehouse
The MPM OLAP Cube
Deltek does not assume responsibility for providing training in the use of Microsoft Windows. We designed the MPM manuals with the assumption that you are familiar with such basic Windows functions as cut, copy, paste, undo, exit, save, and others.
Getting Started Manual 1

If You Need Assistance
If You Need Assistance If you need assistance installing, implementing, or using MPM, Deltek makes a wealth of information and expertise readily available to you.
Customer Services For over 20 years, Deltek has maintained close relationships with client firms, helping with their problems, listening to their needs, and getting to know their individual business environments. A full range of customer services has grown out of this close contact, including the following:
Extensive self-support options through the Customer Care Connect Web portal.
Phone and email support from Customer Care analysts
Technical services
Consulting services
Custom programming
Classroom, on-site, and Web-based training
Find out more about these and other services from the Customer Care Connect site.
Customer Care Connect Site The Deltek Customer Care Connect site is a support Web site for Deltek customers who purchase an Ongoing Support Plan (OSP).
The following are some of the many options that the Customer Care Connect site provides:
Download the latest versions of your Deltek products
Search Deltek’s knowledge base
Display or download product information, such as release notes, user guides, technical information, and white papers
Submit a support case and check on its progress
Transfer requested files to a Customer Care analyst
Use Quick Chat to submit a question to a Customer Care analyst online
Ask questions, exchange ideas, and share knowledge with other Deltek customers through the Deltek Connect Customer Forums
Subscribe to Deltek communications about your products and services
Receive alerts of new Deltek releases and hot fixes
For more information regarding Deltek Customer Care Connect, refer to the online help available from the Web site.
Getting Started Manual 2

If You Need Assistance
Access Customer Care Connect
To access the Customer Care Connect site, complete the following steps:
1. Go to https://deltek.custhelp.com.
2. Enter your Customer Care Connect Username and Password.
3. Click Log In.
If you forget your username or password, you can click the Account Assistance button on the login screen for help.
Contacting Technical Services While Deltek has worked hard to ensure an easy installation, in certain situations installation can be complex, and may require special consideration. In such cases, we recommend contacting Deltek Technical Services.
Deltek’s team of technical consultants can assist you with your installation in a timely manner. Deltek’s involvement ensures that all applications are installed properly, regardless of the complexity of the deployment scenario.
The Technical Services department’s assistance is billed on a time and materials basis. While installation assistance is not required, it is recommended to ensure that you optimize your investment in MPM from the time of installation. Many Deltek clients have benefited from the Deltek Technical Services department’s experience and knowledge of the MPM Installation process.
Conversion Support Regardless of the size of your deployment, Deltek consulting has the expertise and resources to help migrate your current projects, train your staff, and optimize MPM for your business without monopolizing your internal resources.
Our Basic Installation and Conversion Services package provides a path for a smooth transition with assessment and upgrade checklists, onsite deployment and data conversion, and training for your entire staff.
For detailed information and custom services and estimates, contact Deltek Consulting at 800.456.2009.
Getting Started Manual 3

If You Need Assistance
Getting Started Manual 4
Additional Documentation The following table lists the additional Deltek documentation available for this release. Except where noted, all the user guides listed in this table are available for download from the Deltek Customer Care Connect site.
Document Name Description
MPM Installation Guide This guide describes the system requirements as well as how to install MPM, Data Warehouse and OLAP.
MPM Globals Guide This guide describes how to set up and manage your Global Sets in MPM, which are used in all your MPM projects.
MPM Projects Guide
This guide describes how to set up and manage projects in MPM, define Work Breakdown Structures, establish baselines, track project milestones, replan projects, and report and analyze data.
MPM Standard Reports Guide This guide describes, and provides examples of, standard reports available in MPM.
Online Help
You can access complete online Help in any of the following ways:
Click Menu Manager Help » Deltek MPM Help Topics
Press F1 from within the MPM product Click the Help button on one of the MPM dialog boxes

Introduction to MPM
Getting Started Manual 5
Introduction to MPM Deltek's MPM is a comprehensive system for integrating proposals, cost estimating, and program management. The work breakdown structure (WBS) is central to MPM.
MPM meets all government proposal/reporting requirements and enables you to respond to the most complex Request for Proposal quickly and effectively. It is easy to use and intuitive, and provides project solutions and information in a real-time environment. The key features of MPM are described below.
You can use MPM to:
Price proposals and estimate costs
Prepare pre-RFPs
Run "what if" analysis
Run proposal and comparison reports
Prepare best and final offers
Baseline Planning/Estimates to Complete Apply indirect costs using burden templates
Define multiple rate tables
Roll over from proposal to baseline (so that negotiated estimates become baseline numbers)
Maintain integrated but separate baseline and estimate to complete
Run multiple estimate at complete (EAC) calculations
MS Project Interface The Microsoft Project Interface is a powerful interface between Microsoft Project and MPM that provides you with an easy method for linking Project data to MPM.
Performance Measurement Supports major earned value methods
Can define 99 milestones per WBS element
Integrated program log includes management reserve and undistributed budget
Enter actuals by resource and/or element of cost
Enter actuals manually or by batch import, with an option to apply indirect costs
Online control account plan for simplified reporting and status updates

Introduction to MPM
C/SCSC Reporting A complete set of standard reports
User-defined report formats with numerous sort, conditioning, summary, and time window options
Variance analysis
Required government report formats including Cost Performance Report Formats, Cost/Schedule Status Report, and Contractor Cost Data Reports
Direct report interface with Microsoft® Excel®
Batch reporting options
Subcontract Management Develop baselines across PCs at distributed sites
Automatically update performance and actuals
Track subcontractor cost variance and schedule variance
Security Features MPM has built-in security, which provides access control for project data and MPM features. If you require a top secret level or if you are in a Tempest environment (Emission or Emanations Security), you can be sure that only those individuals expressly authorized by the MPM system administrator will have access to MPM. Within MPM, there can be multiple users who are designated as system administrators or project administrators. Administrators are authorized to grant individual users permission rights to projects or to features of MPM.
See “Chapter 8: Controlling Security Access to MPM” in the MPM Globals Guide for more details.
Getting Started Manual 6

Backing Up MPM Files
Backing Up MPM Files Your company may be using MPM to track major projects costing millions of dollars. It is important that you maintain the software and consistently back up the data. MPM provides several tools to assist you including:
A data recovery tool
A report that lets you check the validity of summary data
File version number control
Backing Up MPM Files Regular backups of data files are essential. Backups are especially important when running functions such as Project Date Shift, Estimate Adjust, and Estimating. If you experience a failure part way through the Project Date Shift or Estimate Adjust process, you must go to your backup to recover data.
Even though your organization may have a system-wide backup procedure that is administered by a LAN or system administrator, individual users should always maintain a backup of their current project data.
Deltek recommends that you make a full backup at regular intervals, such as the end of each day or just before and just after a sizable amount of data is input.
Specifically, Deltek recommends:
If not on a network, daily backups using a data compression tool such as WINZIP or PKZIP
If on a network, daily incremental and weekly full backups using a tape backup on the network
Maintaining one full backup onsite and one offsite
Maintaining at least five backup tapes, revolving them as needed to have the most recent data and four prior generations backed up
All MPM users should be logged out of MPM during a backup session to ensure that all files are backed up. If a backup is undertaken while some files are open, those files can be excluded from the backup.
Daily Backups and Individual Users Deltek recommends that individual users always maintain a backup of their current project data to archive all projects and global data files on a daily basis. You can save space by using a compression program such as WINZIP or PKZIP.
To back up data using PKZIP, complete the following steps:
1. Back up the global files (see the list of global files on the next page). First, if you have done this before, delete the .ZIP file that contains the global files from yesterday. Next, using PKZIP, create a new .ZIP file that contains the files named *.LIB.
2. Back up each set of project files in a separate .ZIP file using the same technique, first deleting yesterday’s .ZIP files, then creating new .ZIP files for each project.
Getting Started Manual 7

Backing Up MPM Files
Daily and Weekly Backups using a Network Backup Tape If you are running on a network, make sure your network administrator makes daily incremental backups and weekly full backups as protection against server failures.
What to Back Up Backups should include the following files:
Project Files (for each project – substitute the name of the project for project):
projectA.MIL projectB.OBS projectC.AUD
projectD.WTD projectE.BOE projectF.WRD
projectG.ATX projectI.BWP projectN.USR
projectP.WBS projectQ.LOG projectR.CLN
projectT.HED projectU.RRH projectW.RRD
projectX.WTH projectZ.APP
Global Files:
CALENDAR.FSC CALENDAR.HOL EOCCODES.LIB
RATE.LIB RESOURCE.LIB TEMPLATE.LIB
System Files:
*.DAT
*.FMT
User Configuration Files:
WINMPM.CFG
See “Chapter 9 Maintaining the MPM Software” in the MPM Globals Guide for information on recovering data and checking file versions.
Getting Started Manual 8

Using MPM
Using MPM MPM uses the Microsoft Windows® interface to give you easy access to your data. Common windows and menus work the same way throughout MPM. This chapter describes how the standard elements of the interface work. Once you know the standards, you can use most of the MPM windows without further instruction.
To understand each window and its individual features and use, see the MPM Projects manual.
Log In to MPM Before you can use MPM, you must log in. MPM provides this security feature to prevent unauthorized access to the MPM projects and data.
See “Logging In and Logging Out of MPM” for details.
MPM Menu Manager The Menu Manager is the key to navigating within MPM. From the Menu Manager, you access all other windows inside MPM.
See “Using the Menu Manager” for more details.
Getting Started Manual 9

Using MPM
Dialog Boxes MPM displays dialog boxes when there is information needed to carry out your request. Dialog boxes contain questions that you need to answer. Many Task windows in MPM require that you supply information on an Open dialog box before you open the window.
See “The Open Dialog Box — Access to MPM Tasks” for more details.
Task Windows Use the Task windows to enter, track, update, and view the data in your projects. There are many Task windows in MPM.
See “MPM Task Windows” for more information.
For specifics about a particular Task window, see the MPM Globals and MPM Projects manuals.
Standard Messages Throughout MPM, standard messages appear on the bottom of the window in the Status Bar or in pop-up windows. These messages provide instructions, information, and warnings to assist you in moving easily and efficiently through the various functions in MPM. Deltek recommends that you read all messages carefully. If MPM has paused and does not seem to be responding, check the Status Bar to see if MPM is displaying a message that it is processing a request.
Status Bar
If the Status Bar is not showing, you can turn it on by clicking View » Status Bar. To hide the Status Bar, choose the option again.
Getting Started Manual 10

Using MPM
Logging In and Logging Out of MPM When you launch (start) MPM, you are required to log in via a User ID and Password. MPM provides this security feature to prove you are authorized to access the MPM projects and data. Each User ID can log in to the system one machine at a time.
Your User ID Your User ID must be set up by the MPM Administrator. If you are the Administrator, or if you are working alone, use the User ID SYSADMIN.
Your Password Your Password must be set up by the MPM Administrator. If you are the Administrator, or if you are working alone, use the password MPM.
See “Changing Your Password” for more details.
Launching MPM
To launch MPM, do one of the following:
Double-click the MPM icon on your desktop.
Click Start » Programs » Deltek MPM 3.4 » Deltek MPM 3.4.
Use Windows Explorer to open the DELTEKMPM folder and double-click the WINMPM.EXE file.
MPM displays the Login dialog box.
Logging In to MPM
To log in to MPM, complete the following steps:
1. Enter your User ID and Password.
2. Click OK to display the Menu Manager.
Getting Started Manual 11

Using MPM
Logging Out
To log out of MPM, complete the following steps:
1. From the Menu Manager, do one of the following:
Press CTRL + L.
Click File » Logout.
2. MPM closes the Menu Manager tabs and displays the Login dialog box.
Closing MPM
To close MPM, complete the following steps:
1. From the Menu Manager, do one of the following:
Press ALT + F4.
Click File » Exit.
Click the X box in the top right-hand corner of the window.
2. MPM closes the Menu Manager. If any MPM windows are open, they close automatically.
Changing Your Password
To change your password, complete the following steps:
1. From the Menu Manager, click Tools » Change Password. MPM displays the Change Password dialog box.
Getting Started Manual 12

Using MPM
Getting Started Manual 13
2. Enter the Old password.
3. Enter the New password twice for verification.
4. Click OK.
Data Access After you log in to MPM, you can edit only the project data to which you have been granted access. Check with your MPM Administrator for details.

Using MPM
Running the User Logout Utility The User Logout Utility is provided for use in a network environment so that a System Administrator has the capability to clear any or all user login flags when the need arises.
Only users who are assigned System Administrator authorization level have access to this utility. The Utilities tab does not display for those users who do not have System Administrator permissions.
When a user is logged out by a System Administrator, the system allows any function the user has in progress to be completed. Affected users receive a message advising that they have been logged out. Users are given the opportunity to save any modifications in the event their system is not set to save automatically.
See “MPM Installation: MPM License Types” in the MPM Installation Guide for a detailed explanation of each license type.
To run the User Logout Utility, complete the following steps: 1. From the Menu Manager, select the Utilities tab and click User Logout
Utility . The window displays a list of all users currently logged in to MPM along with the date and time they logged in. The name of the System Administrator who is logging out users does not display in the list of users.
2. Place a check mark in the Logout column for each user to be logged out.
3. Click Run to complete the logout. 4. Click the X in the top right-hand corner of the window to exit and return to
the Menu Manager window.
Getting Started Manual 14

Using MPM
Using the Menu Manager Use the Menu Manager Window to access all MPM Task windows. A toolbar gives you quick access to common tasks. Tabs allow you to access groups of the Task windows.
To access a Task window, double-click its icon or select the option on the File menu.
Title Bar
Menu BarToolbar.
Tabs.
Tabs Use the tabs on the Menu Manager to access the Task windows. MPM has eight tabs:
Globals — Enter and maintain Global File sets; control security
Projects — Enter and maintain Project data
Utilities
Distributed Project Conversion Utility — Combine and convert Element of Cost (EOC) data residing in Distributed Project transfer files (.xfr) into resource detail data.
User Logout Utility — Clear any or all user login flags as needed.
File Conversion — Convert projects and globals to a new version of the software
Reports — Select from a wide range of reports
Imports — Import data into MPM from accounting, spreadsheets, and other systems
Exports — Export data from MPM to a variety of external formats for use with other systems
Interfaces — Import data directly from MS Project using the MSP Link interface
Changing the Menu Manager View You can change the task listings view using the Menu Manager buttons. There are five buttons available on the Menu Manager Toolbar. The first four buttons change the task listing to show:
Large-sized icons
Small icons
Small icons in a list
Getting Started Manual 15

Using MPM
A detailed text listing — The text listing shows the version and modification dates of the Task windows, which can be helpful in troubleshooting.
The fifth button accesses the MPM options.
See “Setting MPM Options” for details.
Selecting Data to Download Some Open dialog boxes allow you to select the data to download. If you decide to use this feature, only the data that you select on the Open dialog box is downloaded. After the Task window is up, you can download additional data if needed. While loading data, MPM displays messages in the Status Bar. To cancel the download, press ESC.
Selecting, or filtering, the data when you open a Task window can save a considerable amount of time when you are working with a project that has a large amount of data. Unless you specify a filter choice, MPM loads all the data into the Task window, which may take several minutes (depending on the size of your project). Deltek recommends that you use the filtering options on the Open dialog box to limit the amount of information that is downloaded.
Filtering by WBS Legs Some Open dialog boxes allow you to filter by WBS Leg, expand/collapse the legs to see the available WBS legs, and select or deselect the desired leg(s).
The Expand/Collapse Box next to each WBS Leg shows whether its children are displayed.
A plus sign (+) indicates that the WBS is collapsed and there are lower level WBS children that are not currently displayed.
A minus sign (–) indicates that the WBS is expanded and all children are displayed. The lack of an Expand/ Collapse Box indicates that the WBS element has no children.
Getting Started Manual 16

Using MPM
The Expand/Collapse Box The Select/Deselect Box
Loads the element and all its sub-elements
Does not load this element or any of its sub-elements
Loads the element and selected sub-elements
To select or deselect the WBS elements to download, click the check mark box.
To download the WBS element and all of its children, collapse the WBS element and click its check mark box.
To download the element plus several of its children, expand the WBS element and click the check mark boxes of the desired children.
If a collapsed WBS element is not checked, the element and its children are not downloaded. If no WBS elements are selected, MPM loads all WBS elements.
MPM saves the WBS selections for the current project, and displays the same selections the next time you open the project.
Filtering the WBS by Manager Some Open dialog boxes offer an additional filter by Managers. For example, if you select Manager JONES, only the WBS elements assigned to Manager JONES are downloaded. MPM saves Manager selections for the current project, and displays the same selections the next time you open the project.
To select a single manager, click the manager’s name in the list.
To select multiple managers, use the SHIFT and CTRL keys as you would in any Windows application.
To deselect all Manager filters, hold down the CTRL key and click the last manager’s name. The Manager field displays <Empty>, indicating that no manager has been selected.
Filtering the WBS by Element Type Some Open dialog boxes offer an additional filter by Element Type. At least one Element Type option must be selected. To select elements that have not been assigned a type, click <Empty>. MPM downloads only the elements that match the Element Type(s) selected. For example, if you selected element type Work Package, only Work Package WBS elements are downloaded when the Task window opens.
Getting Started Manual 17

Using MPM
Getting Started Manual 18
The Open Dialog Box — Access to MPM Tasks Most Task windows in MPM have an Open dialog box. Each Open dialog box is specific to the Task window. The Open dialog box asks you for information needed before opening the Task window, such as which project to open, the data you want to edit, and the starting view for the window.
Selecting Data to Download Some Open dialog boxes allow you to select the data to download. If you decide to use this feature, only the data you select on the Open dialog box is downloaded. Once the Task window is up, you can download additional data if needed. While loading data, MPM displays messages in the Status Bar. To cancel the download, press ESC.
Selecting, or filtering, the data when you open a Task window can save a considerable amount of time when you are working with a project that has a large amount of data. Unless you specify a filter choice, MPM loads all the data into the Task window, which may take several minutes depending on the size of your project. It is recommended that you use the filtering options on the Open dialog box to limit the amount of information that is downloaded.
Filtering by WBS Legs Some Open dialog boxes allow you to filter by WBS Leg, expand/collapse the legs to see the available WBS legs, and select/deselect the desired leg(s). The Expand/Collapse Box next to each WBS Leg shows whether its children are displayed. A plus sign (+) indicates the WBS is collapsed and there are lower level WBS children that are not currently displayed. A minus sign (-) indicates the WBS is expanded and all children are displayed. The lack of an Expand/ Collapse Box indicates the WBS element has no children.
Use the following guidelines when expanding and collapsing WBS legs:
To select or deselect which WBS elements to download, click the check mark box.
To download the WBS element and all of its children, collapse the WBS element and click its check mark box.
To download the element plus several of its children, expand the WBS element and click the check mark boxes of the desired children.
If a collapsed WBS element is not checked, the element and its children will not be downloaded. If no WBS elements are selected, MPM loads all WBS elements.
MPM saves the WBS selections for the current project, and displays the same selections the next time you open the project.
Filtering the WBS by Manager Some Open dialog boxes offer an additional filter by Managers. For example, if you select Manager JONES, only the WBS elements assigned to Manager JONES are downloaded. MPM saves Manager selections for the current project, and displays the same selections the next time you open the project.
To select a single manager, click on the manager's name in the list.
To select multiple managers, use the Shift and Ctrl keys as you would in any Windows application.
To deselect all Manager filters, hold down the Ctrl key and click on the last manager's name. The Manager field displays <Empty>, indicating no manager has been selected.

Using MPM
Getting Started Manual 19
Filtering the WBS by Element Type Some Open dialog boxes offer an additional filter by Element Type. At least one Element Type option must be selected. To select elements that have not been assigned a type, click <Empty>. MPM then downloads only the elements that match the Element Type(s) selected. For example, if you selected element type Work Package, only Work Package WBS elements are downloaded when the Task window opens.
Choosing a Starting View Some Open dialog boxes allow you to choose the tab (view) selected when the Task window is displayed. This handy feature can save you a little time also.

Using MPM
MPM Task Windows Use the MPM Task windows for entering, maintaining, and analyzing the MPM data. Each serves a unique purpose, but all have some similarities.
Working with Grids MPM has a powerful, spreadsheet interface, which makes it easy to access and view all your data at a glance. To create a new record (for example, another WBS element or Contract Line Item), you insert a new row. All fields associated with that data (for example, the WBS ID, WBS Description, and Start Date of the new WBS element), display as columns in the grid. Some Task windows, like the WBS window, are split into two panes:
The left pane displays items
The right pane displays the detail information associated with the item
For example, the left pane of the WBS window displays the WBS tree. You can use the left pane to find the leg of the tree you need, and MPM displays the detail about that leg in the right pane.
Vertical Scroll Bar
Horizontal Scroll Bar
Minimize Maximize
Close Left Pane Right Pane
Toolbar Separator
Row Number
Finding a Data Item There are several methods for finding a particular data item in a Task window:
Use the Horizontal and/or Vertical Scroll Bars to scroll through your data
Some Task windows have an Edit » Find option that you can use to search for a text string. This option works exactly the same in all Task windows in which it is available.
To find a text string, enter the text and click Find Next. MPM searches for the text you entered in the current Task window.
If the text describes the contents of an entire cell, click Match Whole Cell Only. For example, if you enter the text ENGINEER and click this check box, MPM will not find DESIGN ENGINEER or TEST ENGINEER, just ENGINEER.
Getting Started Manual 20

Using MPM
If you enter ENGINEER and click Match Case, MPM will match the text’s upper and lower case, and will only find ENGINEER, not Engineer or engineer.
If MPM finds the text, MPM highlights the cell and positions the cursor there. If MPM does not find the text, MPM displays an error message.
Canceling a Process To stop processing a request or cancel changes you made to data in a grid, press the ESC key. You can also press ESC to close any dialog box. It is the equivalent to clicking Cancel.
Displaying and Hiding Fields MPM displays fields as columns in the Task window. You can display or hide any combination of columns, using Format » Column Hide. The selected fields are hidden in the Task window.
Below are guidelines for working with the Column Hide dialog box.
To: Do this:
Hide a single column Select the column and click OK.
Hide two or more contiguous columns
Select the first column, hold down the SHIFT key, select the last column, and click OK.
Hide two or more noncontiguous columns
1. Select the first column.
2. Hold down the CTRL key, then select each of the other columns you want hidden. The columns do not have to be next to each other.
3. Click OK to accept your selections.
Display all columns Select any column, hold down the CTRL key, select the same column again, and click OK.
Getting Started Manual 21
Using MPM
Editing Data in the Task Window
Data Entry Conventions Use the following conventions when entering data in MPM:
Press Tab or the arrow keys to advance the cursor to the next field (cell).
Watch the Status Bar at the bottom of the window for prompts or error messages.
To select an entire column in the window, click the column’s heading (field name).
To select an entire row, click the row number at the left edge of the window. Selecting the entire row in this way selects all data, including any fields that are currently hidden. If you subsequently copy the data, all data in that record is copied to the clipboard, not just the data in the fields currently displayed.
Required Entries Many Task windows have fields in which you must enter data. For example, if you create a new WBS element in the WBS window, you must supply an identifier for the WBS ID field. These fields show <Required> in the cell. You must make an entry in the field before you save the row.
Adding Data
To add a new row of information, complete the following steps:
1. Click the row number where you want to insert the new row.
2. Press the Insert key, or click Edit » Insert.
3. Fill in the <Required> fields, and any optional fields that suit your needs.
4. To save your changes, do one of the following:
a. Click Save.
b. Click File » Save.
c. Press CTRL+S.
d. Click another row and select Yes in response to the Save Data prompt.
Editing Data
To change existing information, complete the following steps:
1. Click the cell that you want to edit.
2. Change the data as needed.
3. To save your changes, do one of the following:
a. Click Save.
b. Click File » Save.
c. Press CTRL+S.
d. Click another row and select Yes in response to the Save Data prompt.
Deleting Data
To delete an entire row of data in a grid, complete the following steps:
Getting Started Manual 22
Using MPM
1. Highlight the entire row by clicking the row number.
2. Press the Delete key, or click Edit » Delete.
3. If the Prompt for Save option has been set, MPM prompts for confirmation.
To delete more than one row at one time, complete the following steps:
1. Click the first row number that you want to delete.
2. While holding down SHIFT, click the last row number that you want to delete.
3. Press the Delete key or click Edit » Delete.
4. If the Prompt for Save option has been set, MPM prompts for confirmation.
Saving Data To save the data you entered, do one of the following:
Click Save.
Click File » Save.
Press CTRL +S.
If the Prompt for Save option has been set, MPM prompts for verification when you click off the row.
Getting Started Manual 23

Using MPM
Changing the MPM Display You can change the display to see only the data you need, which can make your data maintenance much easier. You can:
Change the hierarchical display of the window
Select the fields (columns) being displayed
Set a filter
Select the levels of data shown
Adjust the width and format of the column data
Controlling Hierarchical Display Some Task windows, such as the WBS window, have data that is hierarchical. WBS data, for example, has a hierarchical Tree in which it is created and maintained. You can control the way the WBS Tree is displayed using and in the left pane of the WBS window. You can expand or collapse the Tree to include only the data that you currently need to see.
Displaying and Hiding Fields MPM displays the fields as columns in the Task windows. You can display or hide any or all of the columns, using Format » Column Hide.
See “Displaying and Hiding Fields” earlier in this guide for more details.
Setting a Filter Some Task windows allow you to set a filter. Setting a filter changes how much data you see in a grid.
For example, if you enter Estimates for WBS 1.X, you might only want to see the Estimates for 1.X, not all Estimates. Filtering your data makes it easy to see only the data you need, which can save you time and help prevent mistakes.
To set a filter, click Filter or click Tools » Filter. Some Task windows have many filters to choose from, including WBS identifiers, date ranges, and data elements specific to the Task window. All filters require criteria, meaning the dates in the range, the WBS ID, the element type, or whatever describes how you want to set the filter.
Getting Started Manual 24

Using MPM
To turn off the filter and show all data, choose All Data.
If you want to know if a filter is set and its current setting, look at Tools » Filter.
If it says Filter: All Data, no filter is currently set.
If it says, for example, Filter: Alias, a filter was set using the Alias field.
Expanding and Collapsing the Data Levels Some Task windows have data in a hierarchical format, such as the organizational breakdown structure (OBS). Initially, all data levels display in the Task window. To see more or less data in the hierarchy, select one of the following actions:
To see the children of a collapsed level, click the parent, and then click Show Children.
To collapse the children of a parent level, click the parent, and then click Hide Children.
To see only Level 1 (Top [applet]), click Hide All Departments.
To expand all collapsed levels, click Show All Departments.
Changing Column Width To change the size of a column, select one of the following actions:
Position the cursor at the top of the column along the right edge so that the cursor becomes. Click and drag to stretch or shrink the width.
Click Format » Column Width. The Column Width dialog box displays. You can:
Specify the desired width by entering a number.
Click Best Fit, which scales the column width to an appropriate size.
Changing the Dollar and Non-Dollar Formats
Dollar Format To change the format of dollar amounts, use Format » Dollars. This option affects display of all dollar values on the right window pane and on the total window. The default is Option 0.
Option 0 — 1,235: rounds dollar amounts to the nearest dollar. (default)
Option 1 — 1,234.6: rounds dollar amounts to the nearest 10 cents.
Option 2 — 1234.56: rounds dollar amounts to the nearest cents.
Getting Started Manual 25

Using MPM
Getting Started Manual 26
Non-Dollar Format To change the format of non-dollar amounts, use Format » Non-Dollars. This option affects display of all non-dollar values on the right window pane and on the total window. The default is Option 2.
Option 0 — 1,235: rounds non-dollar amounts to the nearest digit.
Option 1 — 1,234.6: rounds non-dollar amounts to the nearest tenth.
Option 2 — 1234.56: rounds non-dollar amounts to the nearest hundredth (the default).

Using MPM
Setting MPM Options
MPM has a set of options that you can use in all Task windows. Click Options or click Tools » Options.
This window contains General, Information, Integrated Planning, GDD, and Security options, which you access via the appropriate tab on this dialog box.
Tab Description
General MPM Options There are two General MPM options, available on all Task windows.
Save Confirmations — Choose whether you want all data changes to be saved in your project, or whether you want to be prompted before saving changes. This can be useful if you want to be reminded to check your work before saving it.
Process Confirmations — Choose whether you want to be prompted every time a process starts, or have the process start automatically. There are several Task windows that have processes that can take a long time. With the prompt on, you will know before a process starts; if it is an inconvenient time for you, you can cancel the process and run it at another time
Information Options
There are two Information fields that MPM uses to identify your company and project:
Company — Enter the name of the organization for whom you are employed.
Program — Enter the name of the program or department of which you are part.
Getting Started Manual 27

Using MPM
Tab Description
Security Options
When creating new users, you can choose whether to display the Features dialog box automatically or manually, which can be helpful when entering a lot of data.
Integrated Planning Options
There are two Integrated Planning MPM options:
Storage Options — Choose how to save estimate changes: in the Baseline only, in the Baseline and the ETC, or in the Baseline automatically, with a prompt to save in the ETC. In the initial planning stages of a project, you will likely save the Baseline and ETC together. Later you may find one of the other options helpful.
Historical Baseline Change Options — Controlling baseline changes on a program is important and also a challenge when using a live database (because of the lack of traceability). To minimize accidental changes to historical baseline estimates, MPM offers Prompt before saving modifications options.
For example, if you were changing May forward and accidentally entered data in April, this alerts you that there is an impending change to history if you elect to continue. MPM gives you the option to cancel before the historical change is made.
Automatically save modifications — This is the default and saves any changes without displaying a warning message.
Prompt before saving modifications — If this option is selected, a warning message displays if historical data is altered, giving you the option to cancel or proceed with the change:
Getting Started Manual 28

Using MPM
Historical period end month — This date is
required if Prompt before saving modifications is selected. It defaults to the current month, but you can change it to reflect another period. For example, if May is the current period, current – 1 would represent the period of April.
GDD Options There are three GDD (Graphic Drill Down) MPM options:
Legends and Labels — When generating a graph, choose whether to show WBS IDs, WBS descriptions, or both within the graph.
Graph Draw — If you have a lot of data or are requesting a complex graph, you can choose to redraw your graph manually; otherwise, GDD automatically redraws the graph.
2D Line Graph Symbols — If you are producing 2D line graphs, choose whether to display symbols for data types.
Viewing Rollup Toggle Status To view your rollup toggle status, click View » Rollup Toggle Status. MPM displays a confirmation message.
See “Chapter 2: Creating and Maintaining Project Settings” in the MPM Projects manual for instructions on using the rollup toggle.
Getting Started Manual 29

Using MPM
Previewing Data
Use Print Preview to preview your data onscreen. Click Print Preview or click File » Print Preview to access the Print Preview screen. On some Task windows, MPM displays the Print Preview dialog box, which asks additional questions.
When you preview, only the data displayed on the Task window is previewed. To change the displayed set of data, exit the Print Preview window and change the data shown in the Task window, either by downloading additional data or by changing the onscreen filter.
Preview Options The report heading contains the project name and company name that you entered on the Project Maintenance screen. You can change the Print Preview headers, footers, and other elements of the display using the Preview Option buttons. Changes made to the report’s settings only apply to the current Preview session and are not saved.
Headers and Footers
Click Header / Footer to display the Header /Footer Preview dialog box. Insert custom text, page numbers, dates, and times.
Getting Started Manual 30

Using MPM
Printing Data
Click Print or click File » Print to print your data. On some Task windows, MPM displays a Print dialog box, which asks additional questions.
If you click OK, MPM displays the Print dialog box.
This dialog box is the standard Windows Print dialog box for selecting page range, print quality, and number of copies, and changing the print setup for your printer.
When you print, only the data displayed on the Task window will print. To change the displayed set of data, exit the Print window and change the data shown on the Task window, either by downloading additional data or changing the onscreen filter.
Getting Started Manual 31

Using MPM
Getting Started Manual 32
Multi-User Access & Record Locking In any multi-user environment, it is essential that the software protect the activities of one user from adversely affecting another’s work. In MPM, every Task window employs some form of file/record locking. On a network, MPM automatically implements the file/record locking features.
File-Locking and Record-Locking File-Locking MPM will file-lock (lock an entire database so that other users cannot access it)
when a user:
Runs utilities such as the Estimating Utilities or the WBS Leg utilities, or
Performs other actions that involve the entire database, such as importing data.
Some windows file-lock while the user is saving data.
Record-Locking — MPM will record-lock (lock a record or row in a database so that other users cannot change that row) when the user chooses to save that row.
In most cases, the file or record is locked for only a moment while the update is being made. For example, when you save a WBS record, the WBS database is briefly locked during the save and then released. If locks were not applied, it would be possible for another user to save the same WBS at another machine. As a result, either a duplicate WBS would then exist or the pointers would become corrupted.
If two users attempt to update the same data simultaneously, MPM notifies the current user that another user is adding or editing the same record.
Detail and Header Files Some Task windows file-lock entire databases, even entire projects, for a longer period of time. For example, when an estimate reprice is running, the estimate detail (.RRD) and estimate header (.RRH) files are locked and the locks do not come off until the reprice has finished.
The .RRD, .RRH, and .WBS files are locked during the following processes:
Estimate Reprice
Estimate Adjust
Date Shift
Rebuild Rollup
Replanning
When MPM displays the "Database Is Busy" message, it means that a user is attempting to lock a file or record that is already locked by another user. This message will continue to display and flash until either the lock is released or the user presses ESC to abort the attempt.
If multiple users are waiting for the same locked file, the first user that attempts to access the file after it is unlocked will get access to the file. There is no first-come-first-served queue associated with a locked file.
If a network seems excessively busy, it is probably because a user is running Estimate Reprice or Estimate Adjust.

Using MPM
Recovering System Files The Recover Files command under the Tools menu can recover project and global files only. It cannot recover the following system files:
PROJ.DAT (Project List)
GLOBAL.DAT (Global List)
MPMUSERS.DAT (User List)
To recover the system files, you must use the Recover System Files utility (for example, the MPM621.EXE file). The utility is independent of MPM and you run it from the Start » Run menu.
Before you begin the recovery process, be sure to back up the system files and ensure that you have enough disk space (twice the size of the existing files) available for the recovered files.
Confirm that all users have logged out of MPM prior to starting the recover process.
To recover the system files, complete the following steps:
1. Click Start » Run.
2. In the Run dialog box, type the drive, directory, and filename of the Recover System Files utility (for example, C:\WINMPM\MPM621.EXE). MPM displays the Recover System Files dialog box.
3. Click the Option button for the file you want to recover. You can recover only one file at a time.
4. Click OK to start the recovery process.
Upon completion of the recovery process, a message is displayed indicating whether the recovery was successful or unsuccessful.
If the recovery is successful, the message indicates the location of the recovered file.
If the recovery is unsuccessful, the message indicates the reason for the failure (for example, file locked, file corrupted, lack of disk space).
Repeat this process for each system file you wish to recover.
Getting Started Manual 33

Introduction to Data Warehouse
Getting Started Manual 34
Introduction to Data Warehouse The MPM Data Warehouse is a central repository for project and global data from any and all corporate locations. The consolidated data can be used for analysis and reporting.
The Data Warehouse consists of the following components:
Microsoft SQL Server — This schema is optimized for MPM data.
MPM Data Warehouse Controller — This application resides on the database server, or optionally on a separate host machine, and is responsible for managing the importation of MPM data.
MPM Data Warehouse Controller user interface — This interface is located in the MPM Project Maintenance window and is used to select and schedule project and global data for import by the Controller into the data warehouse.

Introduction to Data Warehouse
Workflow Overview
MPM 3.4 Server
MPM 3.4 Server
MPM 3.4 Server
Controller w/Pervasive.SQL
SSIS Packages
SQL Server Database
TCP/IP
TCP/IP
TCP/IP
MPM Data Warehouse Server
The MPM Data Warehouse extract, translate, and load (ETL) process consists of two components:
A controller
A collection of SQL Server Integrated Services (SSIS) data transformation packages
The Controller The controller is a Windows Service component that polls the MPM system folders on regular intervals and initiates the ETL process. It requires the Pervasive engine to be deployed along with it, if not already installed. The Controller may be installed on the MPM Data Warehouse Server or optionally on any other machine that has full network access to all MPM Data Server locations along with the MPM Data Warehouse Server.
For each MPM system folder the Controller reads an associated Scheduler.dat file and identifies which Projects should be synched and at what interval.
The project data is then copied to a temporary repository on the MPM Data Warehouse server for processing by the SSIS packages.
The SSIS Package The SSIS Package component receives the names and locations of the projects as input for processing. It then establishes a connection to Pervasive.SQL V10 Workgroup Engine, extracts
Getting Started Manual 35

Introduction to Data Warehouse
data from the different project related files (WBS, RRH, RRD, BOE etc) and transforms the data, as defined by the SQL Server 2005 / 2008 database schema. There is one package per project file—one package for loading WBS, one package for loading BOE, one package for loading Overtime, and so on.
There is not an exact one-to-one correlation between individual MPM project files and MPM Data Warehouse project tables. The project tables are optimized for reporting and analysis.
See the MPM 3.4 Data Warehouse Data Dictionary (MPM34DW.zip) in the Docs folder under the root directory where MPM is installed for detailed Data Warehouse tables information.
Each SSIS Package deletes the existing related MPM Data Warehouse project data first, and then performs a bulk insert. There is no update operation. The delete logic uses the ProjectKey and GlobalKey to delete the project specific data.
Once the synchronization is complete, the temporary repository project data and related connections are removed from the MPM Data Warehouse server.
Getting Started Manual 36

Introduction to Data Warehouse
The Data Warehouse Scheduler Once installed, the Data Warehouse Scheduler is the primary user interface with the MPM Data Warehouse. It allows you to set up a schedule for a project’s data synchronization with the Data Warehouse Controller.
From the Project Maintenance screen, click Schedule for Synchronization or click Tools » Schedule for Synchronization to access the scheduler.
Setting the Schedule Frequency You can set the schedule frequency to:
Schedule Frequency Description
Run Immediate — The synchronization will run immediately after the controller picks up the job.
See the MPM Installation Guide appSetting section in the topic Server: Configure the Data Warehouse Controller using the Controller.exe.Config File for information on the controller’s polling frequency.
Getting Started Manual 37

Introduction to Data Warehouse
Daily — Indicate the frequency of the daily run along with the start date, end date, and time.
Weekly — Specify the days of the week when the synchronization should be run along with the start date, end date, and time.
Getting Started Manual 38
Introduction to Data Warehouse
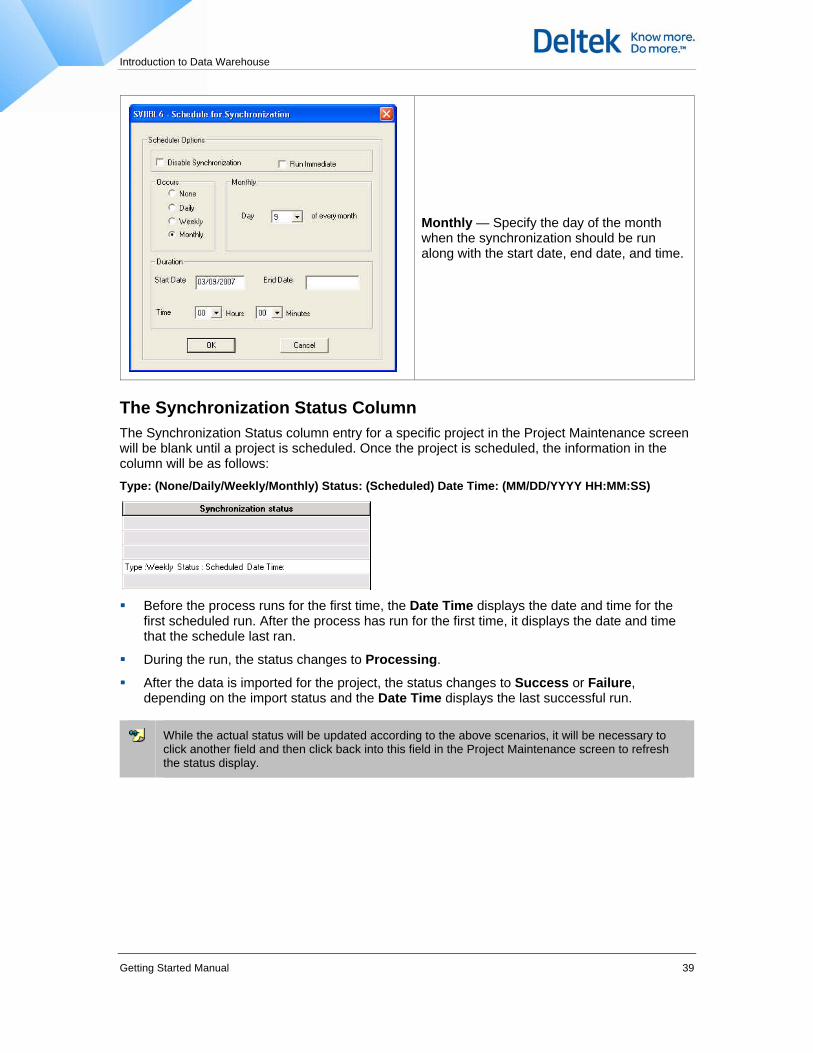
Monthly — Specify the day of the month when the synchronization should be run along with the start date, end date, and time.
The Synchronization Status Column The Synchronization Status column entry for a specific project in the Project Maintenance screen will be blank until a project is scheduled. Once the project is scheduled, the information in the column will be as follows: Type: (None/Daily/Weekly/Monthly) Status: (Scheduled) Date Time: (MM/DD/YYYY HH:MM:SS)
Before the process runs for the first time, the Date Time displays the date and time for the
first scheduled run. After the process has run for the first time, it displays the date and time that the schedule last ran.
During the run, the status changes to Processing.
After the data is imported for the project, the status changes to Success or Failure, depending on the import status and the Date Time displays the last successful run.
While the actual status will be updated according to the above scenarios, it will be necessary to click another field and then click back into this field in the Project Maintenance screen to refresh the status display.
Getting Started Manual 39

Introduction to Data Warehouse
Getting Started Manual 40
Changing the Project Synchronization Retry Settings You can control the number of times a project synchronization is attempted after a set period of inactivity. The default process attempts a project synchronization up to three times after each hour of inactivity. After the third attempt, the project status changes to Failed and the process continues with the next project.
Changing the Retry Interval The RetryInterval setting in the Controller.exe.Config file controls the amount of time the process waits between each project synchronization attempt.
To change the retry interval, complete the following steps:
1. Stop the MPM Data Warehouse Controller service.
2. Open the Controller.exe.Config file.
3. Navigate to the <appSettings> section.
4. Change the value in the RetryInterval line. If the RetryInterval line is not listed, then add the following line:
<add key=”RetryInterval” value=”#” />
where # is the number of hours or fractions of hours to wait between synchronization attempts.
For example, to wait two hours, enter the following:
<add key=”RetryInterval” value=”2” />
Fractions of hours are indicated by using a decimal point (such as .25 for 15 minutes). For example, to wait one and three quarter hours, enter the following:
<add key=”RetryInterval” value=”1.75” />
5. Restart the Data Warehouse Controller Service.
Changing the Number of Attempts The NoofRetries setting in the Controller.exe.Config file controls the number of project synchronization attempts to be made before continuing with the next project.
To change the number of retries, complete the following steps:
1. Stop the MPM Data Warehouse Controller service.
2. Open the Controller.exe.Config file.
3. Navigate to the <appSettings> section.
4. Change the value in the NoofRetries line. If the NoofRetries line is not listed, then add the following line:
<add key=”NoofRetries” value=”#” />
where # is the number of attempts to make before continuing with the next project.
For example, to make four (4) attempts, enter the following: <add key=”NoofRetries” value=”4” />
5. Restart the Data Warehouse Controller Service.

Introduction to Data Warehouse
Deleting Existing Project \ Global Data from within Data Warehouse In order to purge the data from within the ever growing Data Warehouse, a stored procedure called DeleteProject has been provided in the Data Warehouse database. This procedure is installed as part of the Data Warehouse setup.
There is no way to get the data back once deleted therefore it is recommended that you take extreme care in checking the data before deletion.
This stored procedure must be executed against the target Data Warehouse database.
To delete data from the Data Warehouse, complete the following steps:
1. Login to SQL Server Management Studio and connect to the target Data Warehouse database.
2. Create a new query and type in the following:
execute DeleteProject <ProjectName>, <SiteName>
For example, In order to delete data for a project named IT Project with site name UK-HO, type the following query:
execute DeleteProject IT Project, UK-HO
3. Execute the query.
Getting Started Manual 41

Introduction to Data Warehouse
Getting Started Manual 42
Data Warehouse Troubleshooting
Data Warehouse hangs or displays Btrieve Error 100 If the Data Warehouse hangs or displays a Btrieve Error 100 (No cache buffers are available) when synchronizing some projects, increase the Pervasive Cache Allocation Size setting on the server running the Data Warehouse Controller.
If the combined size of the .RRH and .RRD tables or .RRH and .WRD tables is greater than 72 MB, then you should increase the Cache Allocation Size parameter from the default 33554432 bytes (32 MB) to 45% or more of the combined size of the two tables.
The Cache Allocation Size of the Pervasive Engine (MicroKernel) MicroKernel uses this cache when accessing any data files
MicroKernel uses values that are multiples of 16 KB or 16,384 bytes
Overall performance is usually best when the Cache Allocation Size is a value less than 40% of the physical memory on the system, and the Configuration setting Max MicroKernel Memory Usage is set to a value greater than 40%.
Example:
RRH = 22 MB
RRD = 77 MB
Total = 99 MB
45% of 99 MB = 44.55 MB
45.55 MB * 1024 = 45619.2 KB
45619.2 KB * 1024 = 46714060.8 bytes
Round to a multiple of 16,384 bytes:
46714060.8 bytes / 16384 = 2851.2 = 2852 (rounded up)
2852 * 16384 = 4660168 bytes
In this example, 4660168 bytes is the suggested Cache Allocation Size if less than 40% of total physical memory.

Introduction to Data Warehouse
Getting Started Manual 43
Changing the Pervasive Cache Allocation Size Setting Complete the following procedure from the Data Warehouse Controller (DWC) server console. Do not use Remote Desktop (or any other remote program).
To change the Pervasive Cache Allocation Size setting, complete the following steps:
1. Open the Pervasive.SQL 10 Control Center (PCC).
2. Under Engines, right-click the server name for the server running the DWC and click Properties.
3. Select Performance tuning.
4. Change Cache Allocation Size in byte(s) to the recommended Cache Allocation Size.
5. Click Apply.
6. Close PCC.
7. Stop and restart the Pervasive engine on the DWC server (or reboot the DWC server).
8. Try to synchronize the project again.

The MPM OLAP Cube
The MPM OLAP Cube OLAP (On Line Analytical Processing) offers MPM users an additional method for extracting project related data for review and analysis.
The core MPM product provides a suite of standard reports. The Data Warehouse expands upon this with the ability to create custom cross-project reporting on virtually any project data. OLAP gives users the ability to create ad-hoc queries across a broad range of hierarchal dimensions (for example, Projects, WBS, EOC, or Resource) and measures (for example, BCWS, ACWP, or BCWP). Depending on the tool used to access OLAP, these queries can be a matter of clicking and dragging these dimensions and measures to a common cube or pivot table style report template.
A characteristic unique to OLAP is that the measures associated with the hierarchal dimensions are pre-aggregated. This means that as you build your query you see the actual data values almost instantly as the dimensions and measures are placed in your pivot table. There is no need to draft an entire report, determine how to roll up the data, and then separately execute the report before you see results.
The MPM OLAP cube’s data source is the MPM Data Warehouse. A properly installed and populated Data Warehouse is a prerequisite for using OLAP. In addition, the MPM OLAP cube is not automatically refreshed when the Data Warehouse data is re-synced. The MPM OLAP cube has its own scheduler for syncing its content with the Data Warehouse.
See “Scheduling OLAP Processing” for more information on setting up OLAP schedules.
Connecting to an MPM OLAP Cube Any reporting tool that will connect to an MS SQL Server OLAP cube, such as Crystal Reports, Cognos, or Microsoft Excel, can act as a front end to the OLAP cube. The steps below describe how to connect to an MPM OLAP cube using Microsoft Excel 2007.
Connecting to an MPM OLAP Cube using Excel 2007
To connect to an MPM OLAP cube for the first time, complete the following steps:
1. Open Microsoft Excel 2007, and click the Data tab.
If Excel is already open, start a new worksheet prior to clicking the Data tab.
2. In the Get External Data group, click From Other Sources, and then click From Analysis Services.
Getting Started Manual 44

The MPM OLAP Cube
3. On the Connect to Database Server dialog box of the Data Connection Wizard, enter
the name of the server on which your MPM OLAP database is located.
4. Enter the appropriate logon credentials and click Next.
5. On the Select Database and Table dialog box, from the Select the database that
contains the database you want drop-down list, select the MPM OLAP database.
6. Select the Connect to a specific cube or table check box.
7. Select the MPM OLAP cube and click Next.
Getting Started Manual 45

The MPM OLAP Cube
8. On the Save Data Connection File and Finish dialog box, enter a name for this
connection and click Finish.
9. On the Import Data dialog box, select the PivotTable Report option and click OK.
A blank Excel worksheet displays. The report layout area is on the left side. The PivotTable Field List that contains MPM fields to add to a report is on the right side.
The connection that you make is automatically saved, so you can easily reconnect the next time you open Excel.
Getting Started Manual 46

The MPM OLAP Cube
Reconnecting to an MPM OLAP Cube using Excel 2007
To reconnect to an MPM OLAP cube for which a connection has been previously made, complete the following steps:
1. In Microsoft Excel, click the Data tab.
2. In the Get External Data group, click Existing Connections.
3. On the Existing Connections dialog box, select the connection to the MPM OLAP cube
that you previously created and click Open.
Getting Started Manual 47

The MPM OLAP Cube
4. On the Import Data dialog box, select the PivotTable Report option and any other
appropriate options, and click OK.
A blank Excel worksheet displays. The report layout area is on the left side. The PivotTable Field List that contains MPM fields to add to a report is on the right side.
Getting Started Manual 48

The MPM OLAP Cube
Using the Excel PivotTable Field List After you connect to an MPM OLAP cube in Excel 2007, use the PivotTable Field List to choose rows and columns for your report, apply filters, and add calculated fields. The PivotTable Field List automatically displays on the right side of the Excel worksheet.
To add fields from the PivotTable Field List to your MPM custom report, complete the following steps:
1. From the PivotTable field list, click the plus sign beside a measure or dimension to expand and display MPM fields.
Measures and dimensions may also have additional folders, such as Filters and More Fields, which you can also expand to select items within them.
If you don't see the PivotTable Field List, select the Options tab and click Field List in the Show/Hide group.
2. Do any of the following in the Field list to add a measure or dimension field to the report:
Select a field's check box.
Right-click the field name in the list, and select the appropriate command from the
shortcut menu to add it to the report as a column, row, value, or filter.
From the field list, drag and drop a field into the appropriate report area (Column
Labels, Row Labels, Values, and Report Filter) at the bottom of the PivotTable Field List.
3. (Optional) Click the arrow to the right of any field to filter the values for that field.
Getting Started Manual 49

The MPM OLAP Cube
Getting Started Manual 50
4. When you select an MPM field from the list, it is automatically placed in a default location
in the report layout area on the left side of the Excel worksheet as follows:
Measures are placed as columns across the top of the report layout.
Dimensions are usually placed on the left as rows in the report layout.
The fields that you select from the PivotTable Field List are also placed in one of the default areas (Column Labels, Row Labels, Values, and Report Filter) at the bottom of the PivotTable Field List.
5. If you do not want a field located where Excel automatically places it, do either of the following to move it:
Move and re-order fields
Remove fields

The MPM OLAP Cube
PivotTable Field Descriptions Field Description
View
Click View to modify the items in the PivotTable Field List. Select from the following options:
Field Section and Areas Section Stacked — This is the default view, and it is designed for a small number of fields.
Fields Section and Areas Section Side-By-Side — This view is designed for adding and removing fields when you have more than four fields in each area.
Fields Section Only — This view is designed for adding and removing many fields.
Areas Section Only (2 by 2) — This view is designed for rearranging many fields.
Areas Section Only (1 by 4) — This view is designed for rearranging many fields.
Show fields related to
From the drop-down list, select all MPM fields available for reports or a subset of all the MPM fields to display in the PivotTable Field List.
The field list displays the measures and dimensions included in the MPM OLAP cube (external data) to which you connected after you opened Excel.
Field list
Scroll through the list to find an MPM field to add to the report.
MPM fields are divided into measures (numeric values) and dimensions (categories for sorting and grouping).
In the Field list, you can identify the measures and dimension fields as follows:
Measures have a Greek sigma symbol in front of them.
Dimensions have a Page symbol in front of them.
Report Filter
The Report Filter displays the filters that you applied to the entire report, not to specific dimensions or measures. Filters exclude data from a report.
Only dimensions can be selected as report filters.
The order of the report filters in the Report Filter area has no impact on the order of the data in the report.
To add report filters, from the list of fields in the PivotTable Field List, right-click a field name, and then on the shortcut menu, click Add to Report Filter.
Column Labels By default, some measures that you select from the PivotTable Field List display in the Column Labels area. These fields also display as columns in the report layout area.
Getting Started Manual 51

The MPM OLAP Cube
You can click and drag an item from the Column Labels area to the Row Labels area to have it placed as a row instead.
The order of the fields in the Column Labels area is the order in which the fields display in the report layout. You can click and drag fields to modify their order.
Row Labels
By default, dimensions that you select from the PivotTable Field List usually display in the Row Labels area. These fields also display as rows in the report layout area.
You can also click and drag an item from the Row Labels area to the Column Labels area to have it display as a column instead.
The order of the fields in the Row Labels area is the order in which the fields display in the report layout. You can click and drag fields to modify their order.
Values
Values displays numeric and calculated measures that you include in a report.
Dimensions cannot be values.
If more than one measure is added to a report, you see a Sum of Values label in the Column Labels area by default. This does not have to be the last row or column.
The order of the measures in the Values area determines the order of the data in the report layout. You can click and drag fields to modify their order.
Defer Layout Update
As you create a report and make modifications in the PivotTable Field List, the Excel worksheet is automatically refreshed so that you immediately see the modified data in the report layout area. You can see the modification instantly, but if you use a large amount of report data, the refresh process may take longer than an instant.
To turn off the automatic refresh so you can control when the refresh process occurs, select the Defer Layout Update check box; then when you want to refresh the data, click the Update button to the right of the Defer Layout Update check box.
See the Help topics in Microsoft Excel for more information on PivotTable reports.
Getting Started Manual 52

The MPM OLAP Cube
Scheduling OLAP Processing
To access the Schedule OLAP Processing scheduler, complete the following steps:
1. From the MPM Project Maintenance window, click Schedule OLAP Processing or click Tools » Schedule OLAP Processing to access the scheduler.
Scheduler Fields
Status Last Processed — Displays the last successful processing date and time. This field is blank
until the processor completes one successful job. See the table below for status options.
The Last Processed field continues to display the last successful OLAP process date and time, even if there are jobs that run later which fail.
Current Status — Displays the current status of the processor. See the table below for field options. While the actual status will be updated, it will be necessary to close and reopen the Project Maintenance screen to refresh the status display.
Getting Started Manual 53

The MPM OLAP Cube
The following table depicts the different status values for OLAP displayed on the scheduler dialog box:
OLAP Cube State Value in Last Processed Field
Value in Current Status Field
Cube not processed even once Blank Blank
Processing is Scheduled <Last Successful Run Date and Time> Scheduled
Processing is Pending <Last Successful Run Date and Time> Pending
Processing is in Progress <Last Successful Run Date and Time> Processing
Processing completed successfully
<Last Successful Run Date and Time> Success
Processing Failed <Last Successful Run Date and Time> Failed
Scheduler Options
Scheduler Frequency Description
Disable Synchronization – This disables any scheduled OLAP processing jobs and allows other projects to be processed.
See “Project Scheduling and OLAP Processing” later in this section for information on coordinating project and OLAP processes.
Getting Started Manual 54

The MPM OLAP Cube
Run Immediate — The OLAP processor will run immediately after the controller picks up the job.
See the MPM Installation Guide “appSetting” section in the topic “Server: Configure the Data Warehouse Controller using the Controller.exe.Config File” for information on the controller’s polling frequency.
Daily — Specify the start date, end date, and start time.
Getting Started Manual 55

The MPM OLAP Cube
Weekly — Specify the days of the week when the synchronization should be run, along with the start date, end date, and start time.
Monthly — Specify the day of the month when the synchronization should be run along with the start date, end date, and start time.
Getting Started Manual 56

The MPM OLAP Cube
Project Scheduling and OLAP Processing The OLAP processing jobs are picked up according to the scheduled time.
Example You schedule a project synchronization job for Project A at 10:00am and Project B at 10:30 am. Later, an OLAP process job is scheduled for 10:15am.
The OLAP process job will be processed before Project B unless the Controller polling has already picked up and marked the Project B synchronization job as ‘Pending.’ In that case the OLAP processing job will be processed after Project B is synchronized.
One way to ensure that OLAP processing happens only after Project synchronization is complete is by selecting Disable Synchronization. This disables the OLAP processing until a time when required Projects are not being synchronized.
Getting Started Manual 57

Appendix A: Data Warehouse Tables and Views
Appendix A: Data Warehouse Tables and Views The Data Warehouse database is a SQL Server 2005 / 2008 database, which contains tables to stage the final data. This section lists the Data Warehouse tables and views.
The Data Dictionary can be found in the <Data Warehouse Folder>\Data Dictionary folder. Open the Index.htm file using your browser to view the Data Dictionary. The Data Warehouse folder is a default installation location of the DW that can be changed during installation time.
You must not modify the tables and views listed below. Doing so will cause unpredictable results and may result in corrupt Data Warehouse data.
Tables:
dbo.DM_Audit dbo.DM_ProgramLog dbo.DM_AuditDollarType dbo.DM_Project dbo.DM_AuditEstimateType dbo.DM_ProjectHeader dbo,DM_AuditOperationType dbo.DM_Resource dbo.DM_AuditRecordType dbo.DM_ResourceDept dbo.DM_BasisofEstimate dbo.DM_Site dbo.DM_Burden dbo.DM_SpreadCurve dbo.DM_BurdenApplyToType dbo.DM_ValueType dbo.DM_BurdenTemplates dbo.DM_WBS dbo.DM_CLIN dbo.DM_WBSBCWPBase dbo.DM_COC dbo.DM_WBSElementType dbo.DM_CostElementType dbo.DM_WBSEVM dbo.DM_EOC dbo.DM_WBSTree dbo.DM_EstimateType dbo.DM_Week dbo.DM_FiscalCalendar dbo.DM_XREF_EST dbo.DM_Global dbo.DM_Year dbo.DM_HeaderThresholdReportLabels dbo.FT_ResourceRollupDetail dbo.DM_HeaderThresholdsReports dbo.FT_ResourceRollupDetailWeekly dbo.DM_LaborLookup dbo.FT_ResourceRollupEOC dbo.DM_Milestone dbo.FT_ResourceRollupSummary dbo.DM_Month dbo.FT_WBSBCWP dbo.DM_OBSPerformingDept dbo.SSISDetailLog dbo.DM_OBSResponsibleDept dbo.SSISMasterLog dbo.DM_Overtime
Views:
dbo.DM_WBS_Leaves dbo.View_HeaderThresholds dbo.View_Burden dbo.View_OBSPerformingDept dbo.View_BurdenRates dbo.View_OBSResponsibleDept dbo.View_BurdenTemplates dbo.View_SpreadCurve dbo.View_CLIN dbo.View.WBS dbo.View_ElementofCost dbo.View_Week
Getting Started Manual 58

Appendix A: Data Warehouse Tables and Views
Getting Started Manual 59
Additional Views created for OLAP when it is installed:
dbo.DM_Estimate dbo.View_DM_Resource dbo.FT_ResourceRollupDetail_By_Month dbo.View_DM_ResourceDept dbo.FT_ResourceRollupEOC_By_Month dbo.View_ FT_ACWP dbo.View_DM_COC dbo.View_DM_EOC dbo.View_DM_Global dbo.View_DM_OBSPerformingDept dbo.View_DM_OBSResponsibleDept
dbo.View_ FT_BCWP dbo.View_ FT_BCWS dbo.View_ FT_ETC dbo.View_ FT_Future_ETC

Appendix A: Data Warehouse Tables and Views
Getting Started Manual 60
Synchronization Tables The SSISMasterLog and the SSISDetailLog tables are used to store the status of synchronization where the ProjectID and SiteName are the keys for extracting project specific rows from the details table.
These tables contain the following fields:
SSISMasterLog Column Type Comment
EventKey int IDENTITY(1,1) NOT NULL
ProjectID varchar(20) NULL
LastRunDateTime datetime NULL
Status varchar(10) NULL
SiteName varchar(100) NULL
SSISDetailLog Column Type Comment
EventDetailKey int NOT NULL
EventKey int IDENTITY(1,1) NOT NULL
OperationType(Delete/Insert) varchar(10) NULL
PackageName varchar(100) NULL
EventDescription text NULL
RecordCount int NULL
LogTime Datetime NOT NULL
Along with the Controller event log, this information is useful for investigating configuration, permissions, and performance issues.

Appendix B: OLAP Dimensions and Measures
Getting Started Manual 61
Appendix B: OLAP Dimensions and Measures This section describes the dimensions and measures that are defined in the MPM 3.4 cube.
Dimension Fields
Baseline Estimate Type
These are Base Estimate Type fields, which are actually derived from the DM_EstimateType table through foreign key relationships.
Estimate Type Description — Represented by the EstimateTypeDesc field.
Estimate Type Value — Represented by the EstimateTypeValue field. This field displays the estimate type that was last used to create the resource estimate’s value. It has the following possible values:
1 – Standard Hours - Manual
A – Standard Hours - Autospread
2 – Hours - Manual
B – Hours - Autospread
3 – Prime Dollars - Manual
C – Prime Dollars - Autospread
4 – Total Burdened - Manual
D – Total Burdened - Autospread
5 – Total Cost - Manual
E – Total Cost - Autospread
6 – Total Dollars - Manual
F – Total Dollars - Autospread
7 – Total Price - Manual
G – Total Price - Autospread
8 – EQP - Manual
H – EQP - Autospread
n/a – Person Months - Manual
I – Person Months - Autospread
9 – Units - Manual
J – Units - Autospread
! – Unknown
Burden
These are fields from the DM_Burden table and DM_Global table. Burdens are also specified as Indirect Costs.
There are four type of burden costs:
Burden Code — Represented by the BurdenCode field. This is the identifier for each burden.
Burden Type — Represented by the BurdenType field. It has the following possible values:
O – Overhead

Appendix B: OLAP Dimensions and Measures
Getting Started Manual 62
Overhead (OH)
General & Administrative (G&A)
Cost of Money (COM)
Fee (profit)
G – G&A
C – Cost of Money
F – Fee
R – Resource
E – EOC
Global – Burden – Hierarchy created that combines the DM_Global and DM_Burden tables.
Calendar
These are fields from the DM_Month table.
Month — Represented by the Month field, which has a format of MMMYY.
Quarter — Represented by the Quarter field.
Year — Represented by the Year field.
Calendar — DM_Month Hierarchy.
COC
COC means Class of Cost. These are fields from the DM_COC table.
COC Code — Represented by the EOCClass field which is the Class of Cost Code.
COC Description — Represented by the EOCClassDescription field, which is the Class of Cost Description.
Global – EOC – COC — Hierarchy created that combines the DM_Global, DM_EOC and DM_COC tables.
Cost Element Type Cost Element Type Description — Represented by the CostElementTypeDesc field.
Cost Element Type Value — Represented by the CostElementTypeValue, which has the following possible values:
H - Hours/Units
P - Prime
O - OverHead
G - Gen and Admin
C - Cost of Money
F - Fee
S - Standard Hours
E - Equivalent Persons
! - Unknown
EOC
EOC means Elements of Cost and are fields from the DM_EOC table.
EOC Code — Represented by the EOCCode field which is a required field, for which actuals are being entered.
EOC Description — Represented by the EOCDescription field.

Appendix B: OLAP Dimensions and Measures
Getting Started Manual 63
ETC Estimate Type
These are fields from the DM_EstimateType table, DM_CostElementType,DM_Burden tables and FT_ResourceRollUpDetail.
Estimate Type Description — Represented by the EtcEstimateTypeDesc field.
Estimate Type Value — Represented by the EstimateTypeValue field. This field displays the estimate type that was last used to create the resource estimate’s value. It has the following possible values:
1 – Standard Hours - Manual
A – Standard Hours - Autospread
2 – Hours - Manual
B – Hours - Autospread
3 – Prime Dollars - Manual
C – Prime Dollars - Autospread
4 – Total Burdened - Manual
D – Total Burdened - Autospread
5 – Total Cost - Manual
E – Total Cost - Autospread
6 – Total Dollars - Manual
F – Total Dollars - Autospread
7 – Total Price - Manual
G – Total Price - Autospread
8 – EQP - Manual
H – EQP - Autospread
n/a – Person Months - Manual
I – Person Months - Autospread
9 – Units - Manual
J – Units - Autospread
! – Unknown
OBS Performing Dept
These are fields from the DM_OBSPerformingDept and DM_BurdenTemplates.
Burden Template Code — Represented by the BurdenTemplateCode field.
Burden Template Description — Represented by the BurdenTemplateDescription.
OBS Description — Represented by the OBSDescription field which is the Department Description.
OBS Manager — Represented by the OBSManager field, which is the Department Manager.
OBS Performing Parent — Represented by the OBSParent field, which is the Performing

Appendix B: OLAP Dimensions and Measures
Getting Started Manual 64
Department Parent ID, (This is the top level department represented by “Top Dept.”)
Burden Templates — OBS Performing Dept – Hierarchy created between DM_Burden Templates and DM_OBSPerformingDept.
OBS Performing Dept Tree — DM_OBS PerformingDept Hierarchy.
Project – OBS Performing Dept — Hierarchy created between DM_Project and DM_OBSPerformingDept.
OBS Responsible Dept
These are the fields from the DM_OBSResponsibleDept and DM_BurdenTemplates tables.
Burden Template Code — Represented by the BurdenTemplateCode field.
Burden Template Description — Represented by the BurdenTemplateDescription.
OBS Description — Represented by the OBSDescription field, which is the Department Description.
OBS Manager — Represented by the OBSManager field, which is the Department Manager.
OBS Responsible Parent — Represented by the OBSResponsibleParent, which is the Responsible Department Parent ID, (This is the top level department represented by “Top Dept.”)
Burden Templates — OBS Responsible Dept – Hierarchy created between DM_BurdenTemplates and DM_OBSResponsibleDept.
OBS Responsible Dept Tree — DM_OBSResponsibleDept Hierarchy.
Project – OBS Responsible Dept — Hierarchy created between DM_Project and DM_OBSResponsibleDept.
Overtime
These are fields from the DM_Overtime table.
Overtime Value — Represented by the OvertimeValue field, which is the actual value of the overtime.
Project – Overtime — Hierarchy created between DM_Project and DM_Overtime tables.
Project
These are fields from the DM_Project table and DM_Global tables.
Actual Rate Table – Represented by the ActualRateTable field.
Baseline Rate Table – Represented by the BaselineRateTable field.
Burden Template Override – Represented by the BurdenTemplateOverride field.
Calendar – Represented by the Calendar field.

Appendix B: OLAP Dimensions and Measures
Getting Started Manual 65
Contract End – Represented by the ContractEnd field.
Contract No – Represented by the ContractNo field.
Contract Start – Represented by the ContractStart field.
Contract Type – Represented by the ContractType field.
ETC Rate Table – Represented by the ETCRateTable field.
Fee Calculation – Represented by the FeeCalculation field.
Global Desc – Represented by the GlobalDesc field.
Global ID – Represented by the GlobalID field.
Global Path – Represented by the GlobalPath field.
Program Manager – Represented by the ProgramManager field.
Program Name – Represented by the ProjProgramName field. This will have the same value as the Program Name.
ProgramType – Represented by the ProgramType field.
Project ID – Represented by the ProjProjectID field.
Project Path – Represented by the ProjPath which is the subdirectory path to project location.
Proposal Manager – Represented by the ProposalManager field.
Proposal No – Represented by the ProposalNo field.
Rate Table Override – Represented by the RateTableOverride field.
Site Name – Represented by the SiteName field.
Resource
These are fields from the DM_Resource table, DM_EOC, DM_COC and DM_Global table.
Resource Code — Represented by the ResourceCode field.
Resource Days Per Week — Represented by the ResourceDaysPerWeek field.
Resource Description — Represented by the ResourceDescription field.
Resource Hours Per Day — Represented by the ResourceHoursPerDay field.

Appendix B: OLAP Dimensions and Measures
Getting Started Manual 66
Global – EOC – COC – Resource — Hierarchy created between DM_Global, DM_EOC, DM_COC, and DM_Resource tables.
Resource Dept
These are fields from the DM_ResourceDept and DM_Project tables.
Resource Dept Desc — Represented by the ResourceDescription field.
Resource Dept ID — Represented by the ResourceDeptID field which Resource Department ID. (This is the top level department represented by “Top Dept.”)
Resource Dept Parent — Represented by the ResourceDeptParent field which is the Resource Department Parent ID. (This is the top level department represented by “Top Dept.”)
Project – Resource Dept — Hierarchy created between DM_Project and DM_ResourceDept tables.
WBS
These are fields from the DM_WBS and DM_CLIN tables.
Alias — Represented by the WBSAlias, the Alternate WBS Alias Name.
Apportioned Base WBS — Represented by the WBSAppBaseID field, which is the Apportioned Base WBS Key.
BCWP Base — Represented by the WBSBCWPBase field. This is a WBS field that shows which unit will be used when calculating the BCWP for a WBS element. It has the following base unit values:
Hours/Units
Prime
Total Burdened
Total Cost
Total Dollars
Unknown
Charge Number — Represented by the WBSChargeNo field. This is a 20-character internal accounting system identifier used to collect costs.
CLIN Code — Represented by the ClinCode field which serves as a link to the DM_CLIN table. It is an optional 8 character field which identifies the Contract Line Item Number for a WBS.
CLIN DD1921 — Represented by the DD1921 field which means Include on DD192. Its possible values are Yes and No.
CLIN Description — Represented by the
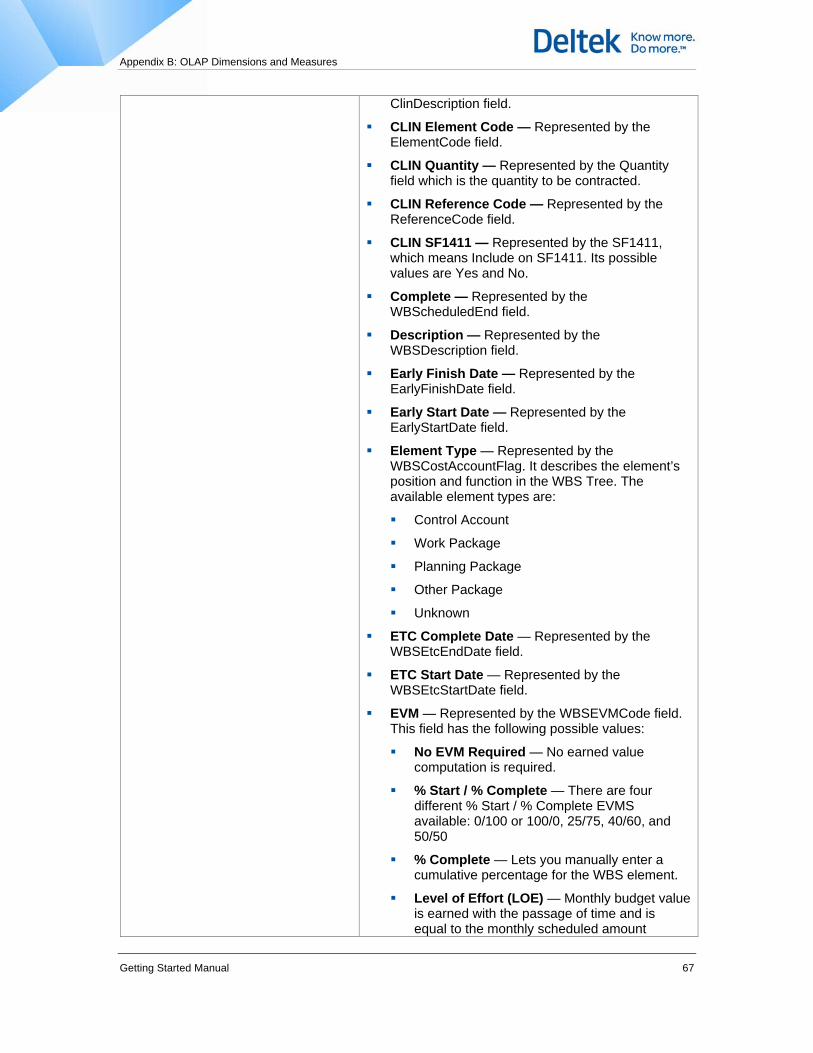
Appendix B: OLAP Dimensions and Measures
Getting Started Manual 67
ClinDescription field.
CLIN Element Code — Represented by the ElementCode field.
CLIN Quantity — Represented by the Quantity field which is the quantity to be contracted.
CLIN Reference Code — Represented by the ReferenceCode field.
CLIN SF1411 — Represented by the SF1411, which means Include on SF1411. Its possible values are Yes and No.
Complete — Represented by the WBScheduledEnd field.
Description — Represented by the WBSDescription field.
Early Finish Date — Represented by the EarlyFinishDate field.
Early Start Date — Represented by the EarlyStartDate field.
Element Type — Represented by the WBSCostAccountFlag. It describes the element’s position and function in the WBS Tree. The available element types are:
Control Account
Work Package
Planning Package
Other Package
Unknown
ETC Complete Date — Represented by the WBSEtcEndDate field.
ETC Start Date — Represented by the WBSEtcStartDate field.
EVM — Represented by the WBSEVMCode field. This field has the following possible values:
No EVM Required — No earned value computation is required.
% Start / % Complete — There are four different % Start / % Complete EVMS available: 0/100 or 100/0, 25/75, 40/60, and 50/50
% Complete — Lets you manually enter a cumulative percentage for the WBS element.
Level of Effort (LOE) — Monthly budget value is earned with the passage of time and is equal to the monthly scheduled amount

Appendix B: OLAP Dimensions and Measures
Getting Started Manual 68
(BCWP=BCWS).
Earned Standards — Earned standards is used to determine earned value for tasks whose budget value was derived using standard hours.
Milestone Weights — Budget value is earned based on the proportional weight you assign to each milestone.
BCWP Entry — Select this option when you will be entering BCWP as a cumulative lump sum.
Apportioned — The apportioned EVM is used to calculate earned value for tasks that are related in direct proportion to some other work package.
Milestone Weights with % Complete — This is the same as Milestone Weights except you can enter a percent complete for each individual milestone instead of just the WBS element.
Key Event — The Key Event is a variation on Level of Effort (LOE).
Unknown
Fee Limit — Represented by the WBSFeeLimitAmount field. This is an optional field where you can enter the fee limit (up to 16 digits) for a WBS element.
Fee Percent — Represented by the WBSFeePct field. It is an optional field where you can enter the percentage of the fee that can be allocated to each WBS element and its children.
Last Statused Date — Represented by the WBSLastAsOfDate field.
Late Finish Date — Represented by the WBSLateFinishDate field.
Late Start Date — Represented by the WBSLateStartDate field.
Level — Represented by the WBSLevel field. This field shows the hierarchical level of the WBS element and the relationship of the element to its parent. The top element in the WBS has a Level value of 1.
Manager — Represented by the WBSManager field. The Manager field is an optional 20-character field used to specify the WBS manager’s name.
Parent — Represented by the WBSParent field. The Parent field positions the WBS element

Appendix B: OLAP Dimensions and Measures
hierarchically within the WBS Tree.
Percent Complete — Represented by WBSPercentComplete field, which is the Technical Percent Complete and is used in NASA 533-P Report.
Recur — Represented by the WBSRecur field. It is an optional field that identifies a WBS element as an activity that is repeated (recurring) or an activity that is done only once (nonrecurring).
Rev Letter Date — Represented by the WBSRevLetterDate field. This field shows that date when this WBS was last revised. It can be edited only on control accounts.
Schedule Ref Date — Represented by the WBSScheduledRefDate field.
Start — Represented by the WBSScheduledStart field.
Task Description — Represented by the TaskDescription field.
WBS ID — Represented by the WBSID field.
XREF1 through XREF10 — These fields are represented by the WBSXREF1 through WBSXREF10 fields.
These are optional 20-character user-defined fields provided as additional identifiers that can be used for reporting, exporting, or onscreen filtering. You can define the field names for these fields in the Project Maintenance window. You can use these fields as wild cards, to match a specific group of data.
XREF-1 is used for identifying distributed WBS’s. If XREF-1 is changed to DISTRIBUTED then it cannot be a parent WBS.
CLIN - WBS — Hierarchy created between DM_CLIN and DM_WBS tables.
WBS Tree — WBS Hierarchy.
WBS – EOC – COC – Resource
This is a derived dimension that is constructed by combining several tables:
DM_WBS
DM_EOC
DM_COC
WBS – EOC – COC – Resource Tree - Hierarchy created between DM_WBS, DM_EOC, DM_COC, and DM_Resource tables.
Getting Started Manual 69

Appendix B: OLAP Dimensions and Measures
Getting Started Manual 70
DM_Resource
XREF-EST
These are fields from the DM_XREF_EST table.
XREF-EST Value — Represented by the XrefEstValue field.
Project – XREF-EST — Hierarchy created between DM_Project and DM_XREF_EST tables.

Appendix B: OLAP Dimensions and Measures
Getting Started Manual 71
Measures Measure Description
ACWP This represents the Actual Cost of Work Performed.
BCWP This represents Budgeted Cost of Work Performed.
BCWS This represents the Budgeted Cost of Work Scheduled.
ETC This represents the Estimate to Complete or estimate of remaining work.
LRE This stands for Last Revised Estimate, which can be calculated for any WBS element or any WBS level.
CPI This stands for Cost Performance Index and it can be calculated using the following formula: BCWP/ACWP.
CV This stands for Cost Variance and it represents the variance between the cost of work performed and actual costs (BCWP-ACWP)
SPI This stands for Schedule Performance Index and it can be calculated using the following formula: BCWP/BCWS.
SV This stands for Schedule Variance and it represents the variance between the work performed and the work schedule (BCWP-BCWS).
