dell powervault md3220i 2000 mailbox resiliency...
TRANSCRIPT

Dell PowerVault MD3220i 2000 Mailbox Resiliency Exchange 2010 Storage Solution
Tested with: ESRP – Storage Version 3.0 Tested Date: June 16, 2011

2
Copyright © 2011 Dell Inc. All Rights Reserved.
PowerVault is a registered trademark of Dell Inc. Dell is a trademark of Dell Inc. All trademarks and registered trademarks mentioned herein are the property of their respective owners. Information in this document is subject to change without notice. Reproduction in any manner is strictly forbidden without the written permission of Dell is strictly forbidden. June 2011

3
Content
Content .................................................................................................3 Overview ...............................................................................................4 Disclaimer ..............................................................................................4 PowerVault Series Storage Array Features .......................................................5 Solution Description ..................................................................................6
Exchange Storage Group Layout ..............................................................7 Targeted Customer Profile ....................................................................8 Tested Deployment .............................................................................8 Simulated Exchange Configuration ...........................................................8 Primary Storage Hardware.....................................................................9 Primary Storage Software......................................................................9 Primary Storage Disk Configuration (Mailbox Store Disks) ............................. 10
Best Practices ....................................................................................... 10 Additional Information ............................................................................. 10 Backup Strategy ..................................................................................... 10
Test Result Summary ......................................................................... 10 Reliability Results ............................................................................. 11 Storage Performance Results ............................................................... 11
Individual Server Metrics .................................................................. 11 Database Backup/Recovery Performance .............................................. 11 Database Read-only Performance ....................................................... 11 Transaction Log Recovery/Replay Performance ...................................... 12
Conclusion............................................................................................ 12 Appendix A: Stress Testing ........................................................................ 12 Appendix B: Performance Testing ............................................................... 17
Performance Test Result Report .......................................................... 17 Appendix C: Backup Testing ...................................................................... 21 Appendix D: Soft Recovery Testing .............................................................. 23
SoftRecovery Test Result Report ......................................................... 23
4
Overview This document provides information on Dell’s storage solution for Microsoft Exchange Server, based the Microsoft Exchange Solution Reviewed Program (ESRP) – Storage program*. For any questions or comments regarding the contents of this document, see http://www.dell.com/exchange *The ESRP – Storage program was developed by Microsoft Corporation to provide a common storage testing framework for vendors to provide information on its storage solutions for Microsoft Exchange Server software. For more details on the Microsoft ESRP – Storage program, please click http://www.microsoft.com/technet/prodtechnol/exchange/2007/esrp.mspx
Disclaimer
This document has been produced independently of Microsoft Corporation. Microsoft Corporation expressly disclaims responsibility for, and makes no warranty, express or implied, with respect to, the accuracy of the contents of this document. THIS WHITE PAPER IS FOR INFORMATIONAL PURPOSES ONLY, AND MAY CONTAIN TYPOGRAPHICAL ERRORS AND TECHNICAL INACCURACIES. THE CONTENT IS PROVIDED AS IS, WITHOUT EXPRESS OR IMPLIED WARRANTIES OF ANY KIND. © Dell Inc. 2011. All rights reserved. Dell, PowerEdge, PowerVault, and the Dell logo are trademarks of Dell Inc. Other trademarks and trade names are the property of their respective owners and Dell disclaims proprietary interest in the marks and names of others.

5
PowerVault Series Storage Array Features The Dell™ PowerVault™ MD3220i is a dedicated, high-availability (HA), next-generation shared-storage array designed to offer improved performance and capacity for storage consolidation and server virtualization, deployment flexibility and scalability. Following are a few advantages of using PowerVault MD3220i. MD3220i helps reduce the effort required to store and manage your data. These arrays raise the bar for performance, flexibility and scalability. Supports up to 32 physical servers when connected to one or more 1 Gb Ethernet switches
Scales up to 96 hard disk drive (HDD) storage capacity with PowerVault MD1200 and/or MD1220 enclosures
Cuts management complexity with a single management interface and a single system to back up
The MD3200i/MD3220i arrays offer several advantages over Fibre Channel systems to support your virtual server environment.
1 Gb Ethernet is a mature, well-understood technology that is less complicated than Fibre Channel technology.
Ethernet hardware is cost-effective and readily available.
Widespread familiarity with Ethernet technology can help cut training time and costs.
The MD3200i/MD3220i arrays are managed by next-generation MD Storage Manager software, an intuitive, easy-to-use client-based Java application. Two different management paths offer easy user interaction, even for those with only a basic familiarity of storage systems.
The enterprise window feature monitors multiple systems through a single interface.
Wizard-based array management helps simplify the configuration process.
Software detects and alerts you of any problems and launches an automatic Recovery Guru to help troubleshoot and resolve the issues.
MD3200i/MD3220i arrays enable you to mix and match components to create your optimal tiered-storage environment. You can deploy up to 96 HDDs by simply plugging in PowerVault MD1200 and/or PowerVault MD1220 enclosures behind MD3200i arrays. This means you can scale your system with a mix of both 3.5” and 2.5” hard drives. In dual-controller systems, you can hot plug additional storage enclosures without shutting down the system. The MD3200i/MD3220i arrays deliver an excellent performance/price ratio. Four iSCSI ports per controller enable twice the throughput compared to previous Dell 3000i iSCSI arrays. Increased cache sizes of up to 2GB per controller meet large database application needs. SSD support optimizes the system for the most demanding I/O applications. The MD3200i/MD3220i's optional data protection features include snapshots, virtual disk copy (VDC) and self-encrypting drives (SEDs) with Secure Erase. Each virtual disk supports up to eight snapshots, with a total of 128 snapshots per system. These are typically used when data needs to be

6
"frozen" in time. Virtual disk copy is full replication of an existing virtual disk at any point in time, often used for decision support and application development testing. If a drive is removed, the SED, which encrypts data written to the drive and decrypts data read from the drive, "locks" to prevent unauthorized access.
Solution Description The Dell™ PowerVault™ MD3220i is a modular disk storage expansion enclosure for PowerEdge™ servers capable of housing up to (24) 2.5-inch disk drives in a single 2U rack able chassis. The enclosure can support 1 Terabyte Near-Line SAS (7200 RPM) as well as 10K and 15K RPM SAS drives ranging in capacities up to 600GB. Dell™ PowerVault™ MD3220i Product Page
Figure 1:Dell PowerVault MD3220i enclosure with (24) 2.5-inch drives
The tested user profile was 0.20 IOPS per user with a 3GB mailbox size. This IO profile for Exchange 2010 represents about 200 messages (sent/received) per mailbox per day. Using 7.2K RPM drives, we achieved more than enough performance – Approximately 20% more than the target of 400 IOPS.
Microsoft Exchange Server System:
Server Dell™ PowerEdge™ R710
CPU 2 Intel® Xeon Processors E5620 @ 2.40Ghz
Memory 12GB memory
NIC Broadcom NeXtreme II
Internal Disk 1 Seagate 146GB 15K RPM SAS(ST9146852SS)
Storage System:
Storage System Dell™ PowerVault™ MD3220i
Disks 24 Seagate 1TB 7.2K RPM NL-SAS (ST91000640SS) Drives
Storage Configuration:
The storage configuration per enclosure was as follows:
11 RAID 10 volumes were created from 2 physical disks from 0 through 22 on the PowerVault™ MD3220i enclosure. Remaining 2 drives were used as hot spares. These volumes were used for Exchange Information stores, transaction logs and Recovery LUN.

7
The hardware environment is described in the table below.
Storage Drives Server Ethernet Connections
MD3220i storage array
Divided into 11 volumes consisting 2 drives each out of which one was recovery LUN and 2 drives were used as hot spares
24 NL-SAS 1TB drives
Dell R710 Server 1 quad-port NIC and 4 on-board ethernet ports
Exchange Storage Group Layout
To perform the tests, 22 drives in MD3220i were divided into 11 disk groups with 2 drives each leaving 2 drives as hot spares. RAID 1 volumes were created from each disk group and each contained a database and log file. One out of the eleven volumes was set as a recovery LUN. The simulated environment tested for the worst case scenario. That is to say 2,000 active mailboxes on a single PowerVault MD3220i; a total of 10 Exchange databases each hosting 200 mailboxes were attached to a single Exchange 2010 Server.

8
The proposed solution in optimal mode would use two Exchange 2010 Servers each attached to a single MD3220i configured with ten (10) RAID1 volumes. Both Exchange 2010 Servers would then host 5 active and 5 passive db and log copies as indicated in the topology figure above. In total, 10 active and 10 passive database and log copies were maintained across both storage arrays.
The ESRP-Storage program focuses on storage solution testing to address performance and reliability issues with storage design. However, storage is not the only factor to take into consideration when designing an Exchange solution. Other factors which affect the performance of the storage solution are:
Server processor utilization
Server physical and virtual memory limitations
Resource requirements for other applications
Directory and network service latencies
Network infrastructure limitations
Client usage profiles
All these factors are beyond the scope for ESRP-Storage. Therefore, the ESRP requirements of simulating number of mailboxes, size of mailbox, and mailbox I/O profile hosted per server as part of the tested configuration may not necessarily be viable for some customer deployments. For more information on identifying and addressing performance bottlenecks in an Exchange system, please read the article Microsoft Troubleshooting Microsoft Exchange Server Performance, available at:
http://technet.microsoft.com/en-us/library/dd335215.aspx
Targeted Customer Profile
The PowerVault Series storage solution is intended for small, medium, and up to large Microsoft Exchange Server 2010 organizations that want reliable, high-performance, and easy-to-manage drive storage. The tested configuration can support the following:
2 tested Exchange 2010 servers
2,000 user mailboxes
0.20 I/O per second per user 1000 MB mailbox quota per user
10 databases with 2 copies per server
1TB maximum database size tested
Mailbox Resiliency provides high availability and is the primary data protection mechanism.
Tested Deployment
The following tables summarize the testing environment.
Simulated Exchange Configuration
Number of Exchange mailboxes simulated 2000
Number of Database Availability Groups 1

9
(DAGs)
Number of servers/DAG 2
Number of active mailboxes/server 2000
Number of databases/host 10
Number of copies/database 2
Number of mailboxes/database 200
Simulated profile: I/O’s per second per mailbox (IOPS, include 30% headroom)
0.20
Database LUN size 931.01 GB
Log LUN size N/A
Total database size for performance testing 602 GB
% storage capacity used by Exchange database**
602/931.01= 64.66%
Primary Storage Hardware
Storage Connectivity (Fiber Channel, SAS, SATA, iSCSI)
iSCSI
Storage model and OS/firmware revision PowerVault MD3220i Firmware Version: 07.70.06.63
Storage cache 4 GB
Number of storage controllers 2
Number of storage ports 8
Maximum bandwidth of storage connectivity to host
1Gb Ethernet
Switch type/model/firmware revision PowerConnect 6248
HBA model and firmware Intel Quad port NIC
Number of HBA’s/host 1
Host server type Dell™ PowerEdge™ R710 2 Intel® Xeon Processors E5620 @ 2.40Ghz
Total number of disks tested in solution 24
Maximum number of spindles can be hosted in the storage
24
Primary Storage Software
HBA driver Intel Driver Version 11.7.32.0
HBA QueueTarget Setting N/A
HBA QueueDepth Setting N/A
Multi-Path I/O Microsoft iSCSI Initiator
Host OS Windows Server 2008 R2 Enterprise X64 Edition
ESE.dll file version 14.01.0225.017
Replication solution name/version N/A

10
Primary Storage Disk Configuration (Mailbox Store Disks)
Disk type, speed and firmware revision Seagate 1TB 7.2K RPM NL-SAS ST91000640SS; FW AS01
Raw capacity per disk (GB) 931.51GB
Number of physical disks in test 24
Total raw storage capacity (GB) 22356.31GB
Disk slice size (GB) N/A
Number of slices per LUN or number of disks per LUN
N/A
Raid level RAID 10
Total formatted capacity 10241.11GB
Storage capacity utilization 10241.11GB/22356.31GB = 45.80% Formatted capacity/total raw capacity
Database capacity utilization 9830.4GB/17881.39GB = 54.97% utilized Database size/total raw capacity
Best Practices Microsoft Exchange Server is a drive-intensive application. Based on the tests using the ESRP framework, Dell recommends the following best practices to improve storage performance.
Use 64K allocation size for all the volumes
Size and configure first for I/O performance, then for storage capacity.
Use Microsoft iSCSI software initiators in Exchange configurations. In these tests, the Microsoft iSCSI software initiator was used.
Place SAN infrastructure on VLANs or subnets that differ from other production network traffic.
Use non-blocking Gigabit Ethernet switches.
For additional best practices on storage design in Exchange 2010, see the URL:
http://technet.microsoft.com/en-us/library/bb124518.aspx
Additional Information For more information, see the Dell website (www.dell.com). In addition, Dell
PowerVault 3220i technical documents can be found here.
Backup Strategy
Test Result Summary
This section provides a high-level summary of the test data from ESRP and the link to the detailed html reports which are generated by the ESRP testing framework. See Appendix A for detailed information about test results.

11
Reliability Results
A number of tests in the framework check reliability. The goal is to verify the storage can handle high I/O load for a long period of time. Both log and database files are analyzed for integrity after the stress test to ensure no database or log corruption.
The following list provides an overview:
Any errors reported in the saved event log file? No errors reported on event log. No
Any errors reported in during the database and log checksum process? No
Storage Performance Results
The Primary Storage performance testing is designed to exercise the storage with maximum sustainable Exchange I/O for over two hours. The test shows how long it takes for the storage to respond to an I/O under load. The data below is the sum of all of the logical drive I/Os and the average of all the logical drives’ I/O latency during the test (which was run for six hours). Each server is listed separately and the aggregate numbers across all servers are also presented.
Individual Server Metrics
Database I/O
Database Disks Transfers/sec 481.83
Average Database Disks Reads/sec 286.20 Average Database Disks Writes/sec 195.63 Average Database Disk Read Latency (ms) 17.78 Average Database Disk Write Latency (ms) 14.23 Transaction Log I/O
Log Disks Writes/sec 17.72 Average Log Disk Write Latency (ms) 2.79
Database Backup/Recovery Performance
There are two tests reports in this section. The first one is to measure the sequential read rate of the database files, and the second is to measure the recovery/replay performance (playing transaction logs in to the database).
Database Read-only Performance The test is to measure the maximum rate at which databases could be backed
up via VSS. The following table shows the average rate for a single database file.
MB read/sec per database 36.67(Average) MB read/sec total per server 366.75

12
Transaction Log Recovery/Replay Performance The test is to measure the maximum rate at which the log files can be played
against the databases. The following table shows the average rate for 500 log files played in a single storage group. Each log file is 1 MB in size.
Average time to play one Log file (sec) 3.02 (avg. resp. to replay log/avg. # of logs replayed)
Conclusion This document was developed by Dell Inc., and reviewed by the Microsoft
Exchange Product team. The test results and data presented in this document are based on the tests introduced in the ESRP test framework. Customers should not quote the data directly for their pre-deployment verification. It is still necessary to go through the exercises to validate the storage design for a specific customer environment.
The ESRP Storage program is not designed to be a benchmarking program. Its tests are not designed for achieving the maximum throughput for a given solution. Rather, they are focused on producing recommendations from vendors for the Exchange application. Therefore, the data presented in this document should not be used for direct comparisons among the solutions.
Appendix A: Stress Testing Microsoft Exchange Jetstress 2010 Stress Test Result Report Test Summary
Overall Test Result Pass
Machine Name WIN-MDAA8648KFN
Test Description .20 profile 3gb mailbox size 2000 mailboxes
2DAGS 24 hour
Test Start Time 4/7/2011 11:17:42 AM
Test End Time 4/8/2011 11:25:46 AM
Collection Start Time
4/7/2011 11:25:31 AM
Collection End Time 4/8/2011 11:25:22 AM
Jetstress Version 14.01.0225.017
ESE Version 14.01.0218.012
Operating System Windows Server 2008 R2 Enterprise (6.1.7600.0)

13
Database Sizing and Throughput
Achieved Transactional I/O per Second 489.703
Target Transactional I/O per Second 400
Initial Database Size (bytes) 6446502248448
Final Database Size (bytes) 6465896710144
Database Files (Count) 10
Jetstress System Parameters
Thread Count 3 (per database)
Minimum Database Cache 320.0 MB
Maximum Database Cache 2560.0 MB
Insert Operations 40%
Delete Operations 20%
Replace Operations 5%
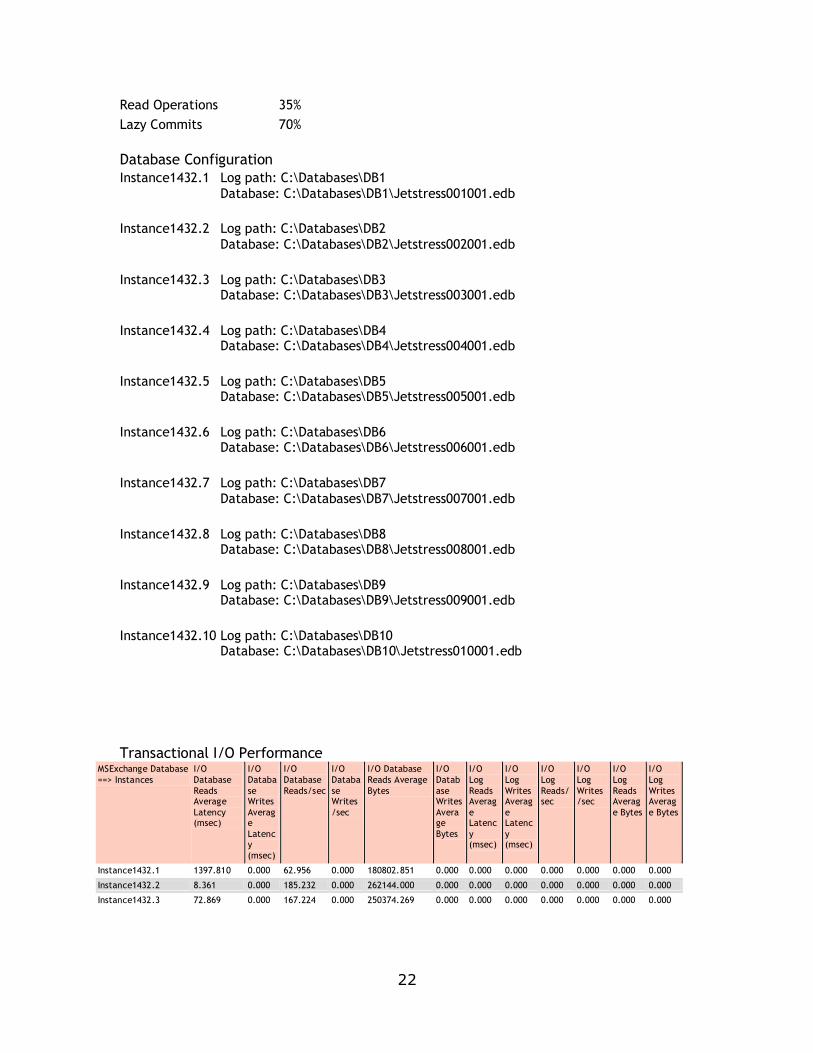
Read Operations 35%
Lazy Commits 70%
Run Background Database Maintenance True
Number of Copies per Database 2
Database Configuration
Instance1432.1 Log path: C:\Databases\DB1
Database: C:\Databases\DB1\Jetstress001001.edb
Instance1432.2 Log path: C:\Databases\DB2 Database: C:\Databases\DB2\Jetstress002001.edb
Instance1432.3 Log path: C:\Databases\DB3 Database: C:\Databases\DB3\Jetstress003001.edb
Instance1432.4 Log path: C:\Databases\DB4 Database: C:\Databases\DB4\Jetstress004001.edb
Instance1432.5 Log path: C:\Databases\DB5 Database: C:\Databases\DB5\Jetstress005001.edb
Instance1432.6 Log path: C:\Databases\DB6
Database: C:\Databases\DB6\Jetstress006001.edb
Instance1432.7 Log path: C:\Databases\DB7
Database: C:\Databases\DB7\Jetstress007001.edb
Instance1432.8 Log path: C:\Databases\DB8 Database: C:\Databases\DB8\Jetstress008001.edb

14
Instance1432.9 Log path: C:\Databases\DB9 Database: C:\Databases\DB9\Jetstress009001.edb
Instance1432.10 Log path: C:\Databases\DB10
Database: C:\Databases\DB10\Jetstress010001.edb
Transactional I/O Performance
MSExchange
Database ==>
Instances
I/O DB Reads
Avg
Latency
(msec)
I/O DB Writes
Average
Latency
(msec)
I/O DB
Reads/sec
I/O DB
Writes/sec
I/O DB Reads
Avg
Bytes
I/O DB Writes
Average
Bytes
I/O Log Reads
Avg
Latency
(msec)
I/O Log Writes
Avg
Latency
(msec)
I/O Log
Reads/sec I/O Log Writes/sec
I/O Log Reads
Avg
Bytes
I/O Log Writes
Avg
Bytes
Instance1432.1 17.9 15.1 29.1 19.9 38207.0 36483.8 0.0 2.7 0.0 17.1 0.0 4788.0
Instance1432.2 17.6 16.9 29.1 19.9 38041.3 36476.2 0.0 2.9 0.0 17.2 0.0 4798.2
Instance1432.3 17.7 16.3 29.0 19.8 38278.0 36449.5 0.0 2.9 0.0 17.1 0.0 4785.4
Instance1432.4 18.0 15.0 29.1 19.9 38010.2 36473.3 0.0 2.7 0.0 17.1 0.0 4789.0
Instance1432.5 17.5 14.3 29.0 19.8 38354.1 36467.8 0.0 2.8 0.0 17.1 0.0 4805.6
Instance1432.6 17.7 15.7 29.2 19.9 37885.6 36477.2 0.0 2.8 0.0 17.2 0.0 4778.6
Instance1432.7 17.7 14.2 29.1 19.9 38192.7 36486.7 0.0 2.8 0.0 17.1 0.0 4792.4
Instance1432.8 17.8 13.5 29.1 19.8 38338.7 36496.7 0.0 2.7 0.0 17.1 0.0 4793.6
Instance1432.9 17.6 15.6 29.1 19.8 38065.1 36479.1 0.0 2.9 0.0 17.1 0.0 4806.4
Instance1432.10 17.8 13.0 29.2 19.9 38199.0 36477.4 0.0 2.8 0.0 17.2 0.0 4807.9
Background Database Maintenance I/O Performance
MSExchange Database ==> Instances
Database Maintenance IO Reads/sec
Database Maintenance IO Reads Average Bytes
Instance1432.1 23.511 261512.851
Instance1432.2 23.561 261526.852
Instance1432.3 23.536 261487.147
Instance1432.4 23.506 261511.639
Instance1432.5 23.721 261522.249
Instance1432.6 23.501 261494.857
Instance1432.7 23.660 261512.172
Instance1432.8 23.622 261526.517
Instance1432.9 23.569 261507.031
Instance1432.10 23.585 261516.681
Log Replication I/O Performance
MSExchange Database ==> Instances I/O Log Reads/sec I/O Log Reads Average Bytes
Instance1432.1 0.331 128788.159
Instance1432.2 0.333 129462.947

15
Instance1432.3 0.332 129040.869
Instance1432.4 0.332 129327.236
Instance1432.5 0.331 128391.610
Instance1432.6 0.333 129612.695
Instance1432.7 0.331 128980.342
Instance1432.8 0.332 129015.576
Instance1432.9 0.332 129064.239
Instance1432.10 0.333 129124.058
Total I/O Performance
MSExchange Database ==> Instances
I/O Databas
e Reads
Average Latency
(msec)
I/O Databas
e Writes
Average Latency
(msec)
I/O Databas
e
Reads/sec
I/O Databas
e
Writes/sec
I/O Database Reads Average
Bytes
I/O Database Writes
Average
Bytes
I/O Log
Reads
Average
Latency
(msec)
I/O Log
Writes
Average
Latency
(msec)
I/O Log
Reads/
sec
I/O Log Writes/s
ec
I/O Log Reads Average Bytes
I/O Log Writes
Average
Bytes
Instance1432.1 17.870 15.117 52.607 19.880 138006.841 36483.837 3.427 2.707 0.331 17.103 128788.159 4787.995
Instance1432.2 17.555 16.905 52.694 19.908 137966.694 36476.183 3.272 2.902 0.333 17.173 129462.947 4798.240
Instance1432.3 17.672 16.294 52.583 19.849 138187.150 36449.515 3.474 2.850 0.332 17.149 129040.869 4785.379
Instance1432.4 17.988 14.965 52.581 19.865 137923.068 36473.346 3.545 2.739 0.332 17.128 129327.236 4789.027
Instance1432.5 17.503 14.294 52.724 19.816 138759.188 36467.774 3.284 2.757 0.331 17.054 128391.610 4805.635
Instance1432.6 17.728 15.700 52.669 19.940 137659.893 36477.242 3.147 2.845 0.333 17.241 129612.695 4778.569
Instance1432.7 17.650 14.178 52.777 19.876 138305.989 36486.679 3.132 2.774 0.331 17.091 128980.342 4792.387
Instance1432.8 17.765 13.525 52.685 19.833 138409.768 36496.734 3.318 2.714 0.332 17.115 129015.576 4793.611
Instance1432.9 17.641 15.613 52.645 19.847 138102.211 36479.080 3.292 2.906 0.332 17.079 129064.239 4806.405
Instance1432.10 17.788 13.033 52.767 19.931 138013.897 36477.404 3.306 2.780 0.333 17.150 129124.058 4807.890
Host System Performance
Counter Average Minimum Maximum
% Processor Time 2.241 0.000 8.030
Available Mbytes 8528.776 8517.000 8756.000
Free System Page Table Entries 33555614.423 33555601.000 33556122.000
Transition Pages RePurposed/sec 0.000 0.000 0.000
Pool Nonpaged Bytes 171899672.464 171466752.000 173342720.000
Pool Paged Bytes 106512337.657 106086400.000 107241472.000
Database Page Fault Stalls/sec 0.000 0.000 0.000
Test Log4/7/2011 11:17:42 AM -- Jetstress testing begins ... 4/7/2011 11:17:42 AM -- Preparing for testing ... 4/7/2011 11:18:13 AM -- Attaching databases ... 4/7/2011 11:18:13 AM -- Preparations for testing are complete. 4/7/2011 11:18:13 AM -- Starting transaction dispatch .. 4/7/2011 11:18:13 AM -- Database cache settings: (minimum: 320.0 MB, maximum: 2.5 GB) 4/7/2011 11:18:13 AM -- Database flush thresholds: (start: 25.6 MB, stop: 51.2 MB)

16
4/7/2011 11:18:25 AM -- Database read latency thresholds: (average: 20 msec/read, maximum: 100 msec/read). 4/7/2011 11:18:25 AM -- Log write latency thresholds: (average: 10 msec/write, maximum: 100 msec/write). 4/7/2011 11:18:38 AM -- Operation mix: Sessions 3, Inserts 40%, Deletes 20%, Replaces 5%, Reads 35%, Lazy Commits 70%. 4/7/2011 11:18:38 AM -- Performance logging started (interval: 15000 ms). 4/7/2011 11:18:38 AM -- Attaining prerequisites: 4/7/2011 11:25:31 AM -- \MSExchange Database(JetstressWin)\Database Cache Size, Last: 2424574000.0 (lower bound: 2415919000.0, upper bound: none) 4/8/2011 11:25:31 AM -- Performance logging has ended. 4/8/2011 11:25:31 AM -- JetInterop batch transaction stats: 138811, 139214, 138904, 138633, 138783, 139309, 138717, 138351, 138633 and 138948. 4/8/2011 11:25:33 AM -- Dispatching transactions ends. 4/8/2011 11:25:33 AM -- Shutting down databases ... 4/8/2011 11:25:46 AM -- Instance1432.1 (complete), Instance1432.2 (complete), Instance1432.3 (complete), Instance1432.4 (complete), Instance1432.5 (complete), Instance1432.6 (complete), Instance1432.7 (complete), Instance1432.8 (complete), Instance1432.9 (complete) and Instance1432.10
(complete) 4/8/2011 11:25:46 AM -- has 5772 samples. 4/8/2011 11:25:46 AM -- Creating test report ... 4/8/2011 11:26:29 AM -- Instance1432.1 has 17.9 for I/O Database Reads Average Latency. 4/8/2011 11:26:29 AM -- Instance1432.1 has 2.7 for I/O Log Writes Average Latency. 4/8/2011 11:26:29 AM -- Instance1432.1 has 2.7 for I/O Log Reads Average Latency. 4/8/2011 11:26:29 AM -- Instance1432.2 has 17.6 for I/O Database Reads Average Latency. 4/8/2011 11:26:29 AM -- Instance1432.2 has 2.9 for I/O Log Writes Average Latency. 4/8/2011 11:26:29 AM -- Instance1432.2 has 2.9 for I/O Log Reads Average Latency. 4/8/2011 11:26:29 AM -- Instance1432.3 has 17.7 for I/O Database Reads Average Latency. 4/8/2011 11:26:29 AM -- Instance1432.3 has 2.9 for I/O Log Writes Average Latency. 4/8/2011 11:26:29 AM -- Instance1432.3 has 2.9 for I/O Log Reads Average Latency. 4/8/2011 11:26:29 AM -- Instance1432.4 has 18.0 for I/O Database Reads Average Latency. 4/8/2011 11:26:29 AM -- Instance1432.4 has 2.7 for I/O Log Writes Average Latency. 4/8/2011 11:26:29 AM -- Instance1432.4 has 2.7 for I/O Log Reads Average Latency. 4/8/2011 11:26:29 AM -- Instance1432.5 has 17.5 for I/O Database Reads Average Latency. 4/8/2011 11:26:29 AM -- Instance1432.5 has 2.8 for I/O Log Writes Average Latency. 4/8/2011 11:26:29 AM -- Instance1432.5 has 2.8 for I/O Log Reads Average Latency. 4/8/2011 11:26:29 AM -- Instance1432.6 has 17.7 for I/O Database Reads Average Latency. 4/8/2011 11:26:29 AM -- Instance1432.6 has 2.8 for I/O Log Writes Average Latency. 4/8/2011 11:26:29 AM -- Instance1432.6 has 2.8 for I/O Log Reads Average Latency. 4/8/2011 11:26:29 AM -- Instance1432.7 has 17.7 for I/O Database Reads Average Latency. 4/8/2011 11:26:29 AM -- Instance1432.7 has 2.8 for I/O Log Writes Average Latency. 4/8/2011 11:26:29 AM -- Instance1432.7 has 2.8 for I/O Log Reads Average Latency. 4/8/2011 11:26:29 AM -- Instance1432.8 has 17.8 for I/O Database Reads Average Latency. 4/8/2011 11:26:29 AM -- Instance1432.8 has 2.7 for I/O Log Writes Average Latency. 4/8/2011 11:26:29 AM -- Instance1432.8 has 2.7 for I/O Log Reads Average Latency. 4/8/2011 11:26:29 AM -- Instance1432.9 has 17.6 for I/O Database Reads Average Latency. 4/8/2011 11:26:29 AM -- Instance1432.9 has 2.9 for I/O Log Writes Average Latency. 4/8/2011 11:26:29 AM -- Instance1432.9 has 2.9 for I/O Log Reads Average Latency. 4/8/2011 11:26:29 AM -- Instance1432.10 has 17.8 for I/O Database Reads Average Latency. 4/8/2011 11:26:29 AM -- Instance1432.10 has 2.8 for I/O Log Writes Average Latency. 4/8/2011 11:26:29 AM -- Instance1432.10 has 2.8 for I/O Log Reads Average Latency. 4/8/2011 11:26:29 AM -- Test has 0 Maximum Database Page Fault Stalls/sec. 4/8/2011 11:26:29 AM -- The test has 0 Database Page Fault Stalls/sec samples higher than 0. 4/8/2011 11:26:29 AM -- has 5744 samples queried.

17
Appendix B: Performance Testing Microsoft Exchange Jetstress 2010
Performance Test Result Report
Test Summary Overall Test Result Pass
Machine Name WIN-MDAA8648KFN
Test Description .20 profile 3gb mailbox size 2000 mailboxes
2DAGS
Test Start Time 4/6/2011 2:24:14 PM
Test End Time 4/6/2011 4:32:01 PM
Collection Start Time 4/6/2011 2:31:47 PM
Collection End Time 4/6/2011 4:31:33 PM
Jetstress Version 14.01.0225.017
ESE Version 14.01.0218.012
Operating System Windows Server 2008 R2 Enterprise (6.1.7600.0)
Database Sizing and Throughput Achieved Transactional I/O per Second 481.835
Target Transactional I/O per Second 400
Initial Database Size (bytes) 6444740640768
Final Database Size (bytes) 6446502248448
Database Files (Count) 10
Jetstress System Parameters
Thread Count 3 (per database)
Minimum Database Cache 320.0 MB
Maximum Database Cache 2560.0 MB
Insert Operations 40%
Delete Operations 20%
Replace Operations 5%
Read Operations 35%
Lazy Commits 70%
Run Background Database Maintenance True
Number of Copies per Database 2
Database Configuration Instance1432.1 Log path: C:\Databases\DB1

18
Database: C:\Databases\DB1\Jetstress001001.edb
Instance1432.2 Log path: C:\Databases\DB2 Database: C:\Databases\DB2\Jetstress002001.edb
Instance1432.3 Log path: C:\Databases\DB3
Database: C:\Databases\DB3\Jetstress003001.edb
Instance1432.4 Log path: C:\Databases\DB4
Database: C:\Databases\DB4\Jetstress004001.edb
Instance1432.5 Log path: C:\Databases\DB5
Database: C:\Databases\DB5\Jetstress005001.edb
Instance1432.6 Log path: C:\Databases\DB6
Database: C:\Databases\DB6\Jetstress006001.edb
Instance1432.7 Log path: C:\Databases\DB7 Database: C:\Databases\DB7\Jetstress007001.edb
Instance1432.8 Log path: C:\Databases\DB8 Database: C:\Databases\DB8\Jetstress008001.edb
Instance1432.9 Log path: C:\Databases\DB9
Database: C:\Databases\DB9\Jetstress009001.edb
Instance1432.10 Log path: C:\Databases\DB10
Database: C:\Databases\DB10\Jetstress010001.edb
Transactional I/O Performance MSExchange
Database ==>
Instances
I/O
Databa
se Reads
Averag
e Latency
(msec)
I/O
Databa
se Writes
Averag
e Latency
(msec)
I/O
Databa
se Reads/
sec
I/O
Databa
se Writes/
sec
I/O
Database
Reads Average
Bytes
I/O
Database
Writes Average
Bytes
I/O
Log
Reads Avera
ge
Latency
(msec)
I/O
Log
Writes Avera
ge
Latency
(msec)
I/O
Log
Reads/sec
I/O Log
Writes/
sec
I/O
Log
Reads Avera
ge
Bytes
I/O Log
Writes
Average Bytes
Instance1432.1 17.997 15.277 28.730 19.649 38409.338 37238.944 0.000 2.676 0.000 18.014 0.000 4852.252
Instance1432.2 17.579 14.651 28.789 19.603 38357.384 37256.537 0.000 2.710 0.000 17.672 0.000 4830.595
Instance1432.3 17.668 14.467 28.227 19.231 38747.746 37229.487 0.000 2.781 0.000 17.393 0.000 4877.456
Instance1432.4 18.005 14.466 28.399 19.388 37968.778 37317.635 0.000 2.841 0.000 17.620 0.000 4857.607
Instance1432.5 17.759 13.547 28.899 19.736 37697.942 37328.616 0.000 2.672 0.000 18.014 0.000 4784.781
Instance1432.6 17.696 14.859 28.460 19.465 37720.208 37297.740 0.000 2.973 0.000 17.657 0.000 4834.084
Instance1432.7 17.801 13.746 28.587 19.409 38509.634 37149.332 0.000 2.689 0.000 17.448 0.000 4828.638
Instance1432.8 17.931 13.440 28.982 19.857 37502.862 37131.214 0.000 2.828 0.000 17.821 0.000 4802.473
Instance1432.9 17.633 16.034 28.454 19.506 37666.240 37293.633 0.000 2.902 0.000 17.879 0.000 4849.362
Instance1432.10 17.813 11.872 28.677 19.787 37593.733 37234.970 0.000 2.853 0.000 17.766 0.000 4847.531
Background Database Maintenance I/O Performance

19
MSExchange Database ==> Instances
Database Maintenance IO Reads/sec
Database Maintenance IO Reads Average Bytes
Instance1432.1 23.572 261446.397
Instance1432.2 23.578 261555.651
Instance1432.3 23.617 261402.203
Instance1432.4 23.532 261532.435
Instance1432.5 23.714 261511.752
Instance1432.6 23.582 261512.584
Instance1432.7 23.731 261493.304
Instance1432.8 23.541 261504.014
Instance1432.9 23.646 261537.851
Instance1432.10 23.700 261456.860
Log Replication I/O Performance
MSExchange Database ==> Instances
I/O Log Reads/sec
I/O Log Reads Average Bytes
Instance1432.1 0.355 138405.300
Instance1432.2 0.344 133574.300
Instance1432.3 0.343 132613.844
Instance1432.4 0.344 131638.742
Instance1432.5 0.350 135539.149
Instance1432.6 0.345 132952.485
Instance1432.7 0.340 132554.689
Instance1432.8 0.346 135036.953
Instance1432.9 0.353 136514.251
Instance1432.10 0.349 134956.951
Total I/O Performance
MSExchange Database ==>
Instances
I/O Databa
se
Reads Averag
e Latency
(msec)
I/O Databa
se
Writes Averag
e Latency
(msec)
I/O Databa
se
Reads/sec
I/O Databa
se
Writes/sec
I/O Database
Reads
Average Bytes
I/O Database
Writes
Average Bytes
I/O Log
Reads
Average
Latency
(msec
)
I/O Log
Writes
Average
Latency
(msec
)
I/O Log
Reads
/sec
I/O Log Writes/
sec
I/O Log Reads
Average
Bytes
I/O Log Writes
Average
Bytes
Instance1432.1 17.997 15.277 52.303 19.649 138929.898 37238.944 3.854 2.676 0.355 18.014 138405.300 4852.252
Instance1432.2 17.579 14.651 52.367 19.603 138852.640 37256.537 3.783 2.710 0.344 17.672 133574.300 4830.595
Instance1432.3 17.668 14.467 51.844 19.231 140175.305 37229.487 3.188 2.781 0.343 17.393 132613.844 4877.456
Instance1432.4 18.005 14.466 51.931 19.388 139273.490 37317.635 3.828 2.841 0.344 17.620 131638.742 4857.607
Instance1432.5 17.759 13.547 52.613 19.736 138575.350 37328.616 3.519 2.672 0.350 18.014 135539.149 4784.781
Instance1432.6 17.696 14.859 52.043 19.465 139128.254 37297.740 3.087 2.973 0.345 17.657 132952.485 4834.084

20
Instance1432.7 17.801 13.746 52.318 19.409 139652.749 37149.332 3.043 2.689 0.340 17.448 132554.689 4828.638
Instance1432.8 17.931 13.440 52.524 19.857 137901.537 37131.214 3.517 2.828 0.346 17.821 135036.953 4802.473
Instance1432.9 17.633 16.034 52.100 19.506 139273.060 37293.633 3.278 2.902 0.353 17.879 136514.251 4849.362
Instance1432.10 17.813 11.872 52.377 19.787 138888.584 37234.970 3.579 2.853 0.349 17.766 134956.951 4847.531
Host System Performance Counter Average Minimum Maximum
% Processor Time 2.197 1.329 3.170
Available Mbytes 8534.343 8518.000 8717.000
Free System Page Table Entries 33555615.452 33555604.000 33556119.000
Transition Pages RePurposed/sec 0.000 0.000 0.000
Pool Nonpaged Bytes 171830404.820 171425792.000 173043712.000
Pool Paged Bytes 106007282.075 105967616.000 106078208.000
Database Page Fault Stalls/sec 0.000 0.000 0.000
Test Log4/6/2011 2:24:14 PM -- Jetstress testing begins ...
4/6/2011 2:24:14 PM -- Preparing for testing ...
4/6/2011 2:24:32 PM -- Attaching databases ... 4/6/2011 2:24:32 PM -- Preparations for testing are complete. 4/6/2011 2:24:32 PM -- Starting transaction dispatch ..
4/6/2011 2:24:32 PM -- Database cache settings: (minimum: 320.0 MB, maximum: 2.5 GB) 4/6/2011 2:24:32 PM -- Database flush thresholds: (start: 25.6 MB, stop: 51.2 MB) 4/6/2011 2:24:47 PM -- Database read latency thresholds: (average: 20 msec/read,
maximum: 100 msec/read). 4/6/2011 2:24:47 PM -- Log write latency thresholds: (average: 10 msec/write, maximum:
100 msec/write). 4/6/2011 2:24:58 PM -- Operation mix: Sessions 3, Inserts 40%, Deletes 20%, Replaces 5%, Reads 35%, Lazy Commits 70%.
4/6/2011 2:24:58 PM -- Performance logging started (interval: 15000 ms). 4/6/2011 2:24:58 PM -- Attaining prerequisites:
4/6/2011 2:31:47 PM -- \MSExchange Database(JetstressWin)\Database Cache Size, Last: 2429231000.0 (lower bound: 2415919000.0, upper bound: none) 4/6/2011 4:31:47 PM -- Performance logging has ended.
4/6/2011 4:31:47 PM -- JetInterop batch transaction stats: 12682, 12603, 12616, 12556, 12736, 12690, 12432, 12729, 12770 and 12766. 4/6/2011 4:31:49 PM -- Dispatching transactions ends.
4/6/2011 4:31:49 PM -- Shutting down databases ... 4/6/2011 4:32:01 PM -- Instance1432.1 (complete), Instance1432.2 (complete),
Instance1432.3 (complete), Instance1432.4 (complete), Instance1432.5 (complete), Instance1432.6 (complete), Instance1432.7 (complete), Instance1432.8 (complete), Instance1432.9 (complete) and Instance1432.10 (complete)
4/6/2011 4:32:01 PM -- has 505 samples. 4/6/2011 4:32:01 PM -- Creating test report ... 4/6/2011 4:32:04 PM -- Instance1432.1 has 18.0 for I/O Database Reads Average Latency.
4/6/2011 4:32:04 PM -- Instance1432.1 has 2.7 for I/O Log Writes Average Latency. 4/6/2011 4:32:04 PM -- Instance1432.1 has 2.7 for I/O Log Reads Average Latency.
4/6/2011 4:32:04 PM -- Instance1432.2 has 17.6 for I/O Database Reads Average Latency. 4/6/2011 4:32:04 PM -- Instance1432.2 has 2.7 for I/O Log Writes Average Latency. 4/6/2011 4:32:04 PM -- Instance1432.2 has 2.7 for I/O Log Reads Average Latency.
4/6/2011 4:32:04 PM -- Instance1432.3 has 17.7 for I/O Database Reads Average Latency. 4/6/2011 4:32:04 PM -- Instance1432.3 has 2.8 for I/O Log Writes Average Latency.
4/6/2011 4:32:04 PM -- Instance1432.3 has 2.8 for I/O Log Reads Average Latency.

21
4/6/2011 4:32:04 PM -- Instance1432.4 has 18.0 for I/O Database Reads Average Latency. 4/6/2011 4:32:04 PM -- Instance1432.4 has 2.8 for I/O Log Writes Average Latency.
4/6/2011 4:32:04 PM -- Instance1432.4 has 2.8 for I/O Log Reads Average Latency. 4/6/2011 4:32:04 PM -- Instance1432.5 has 17.8 for I/O Database Reads Average Latency.
4/6/2011 4:32:04 PM -- Instance1432.5 has 2.7 for I/O Log Writes Average Latency. 4/6/2011 4:32:04 PM -- Instance1432.5 has 2.7 for I/O Log Reads Average Latency. 4/6/2011 4:32:04 PM -- Instance1432.6 has 17.7 for I/O Database Reads Average Latency.
4/6/2011 4:32:04 PM -- Instance1432.6 has 3.0 for I/O Log Writes Average Latency. 4/6/2011 4:32:04 PM -- Instance1432.6 has 3.0 for I/O Log Reads Average Latency. 4/6/2011 4:32:04 PM -- Instance1432.7 has 17.8 for I/O Database Reads Average Latency.
4/6/2011 4:32:04 PM -- Instance1432.7 has 2.7 for I/O Log Writes Average Latency. 4/6/2011 4:32:04 PM -- Instance1432.7 has 2.7 for I/O Log Reads Average Latency.
4/6/2011 4:32:04 PM -- Instance1432.8 has 17.9 for I/O Database Reads Average Latency. 4/6/2011 4:32:04 PM -- Instance1432.8 has 2.8 for I/O Log Writes Average Latency. 4/6/2011 4:32:04 PM -- Instance1432.8 has 2.8 for I/O Log Reads Average Latency.
4/6/2011 4:32:04 PM -- Instance1432.9 has 17.6 for I/O Database Reads Average Latency. 4/6/2011 4:32:04 PM -- Instance1432.9 has 2.9 for I/O Log Writes Average Latency.
4/6/2011 4:32:04 PM -- Instance1432.9 has 2.9 for I/O Log Reads Average Latency. 4/6/2011 4:32:04 PM -- Instance1432.10 has 17.8 for I/O Database Reads Average Latency. 4/6/2011 4:32:04 PM -- Instance1432.10 has 2.9 for I/O Log Writes Average Latency.
4/6/2011 4:32:04 PM -- Instance1432.10 has 2.9 for I/O Log Reads Average Latency. 4/6/2011 4:32:04 PM -- Test has 0 Maximum Database Page Fault Stalls/sec. 4/6/2011 4:32:04 PM -- The test has 0 Database Page Fault Stalls/sec samples higher than 0.
4/6/2011 4:32:04 PM -- has 477 samples queried.
Appendix C: Backup Testing Microsoft Exchange Jetstress 2010 Database backup Test Result Report Database Backup Statistics - All
Database Instance Database Size (MBytes) Elapsed Backup Time MBytes Transferred/sec
Instance1432.1 616921.59 10:52:35 15.76
Instance1432.2 616929.59 03:42:02 46.31
Instance1432.3 616913.59 04:05:58 41.80
Instance1432.4 616937.59 04:13:04 40.63
Instance1432.5 616921.59 04:07:46 41.50
Instance1432.6 616921.59 14:40:51 11.67
Instance1432.7 616905.59 04:08:33 41.37
Instance1432.8 616921.59 04:10:08 41.10
Instance1432.9 616921.59 03:44:58 45.70
Instance1432.10 616913.59 04:11:21 40.91
Jetstress System Parameters
Thread Count 3 (per database)
Minimum Database Cache 320.0 MB
Maximum Database Cache 2560.0 MB
Insert Operations 40%
Delete Operations 20%
Replace Operations 5%
22
Read Operations 35%
Lazy Commits 70%
Database Configuration
Instance1432.1 Log path: C:\Databases\DB1
Database: C:\Databases\DB1\Jetstress001001.edb
Instance1432.2 Log path: C:\Databases\DB2
Database: C:\Databases\DB2\Jetstress002001.edb
Instance1432.3 Log path: C:\Databases\DB3 Database: C:\Databases\DB3\Jetstress003001.edb
Instance1432.4 Log path: C:\Databases\DB4 Database: C:\Databases\DB4\Jetstress004001.edb
Instance1432.5 Log path: C:\Databases\DB5 Database: C:\Databases\DB5\Jetstress005001.edb
Instance1432.6 Log path: C:\Databases\DB6 Database: C:\Databases\DB6\Jetstress006001.edb
Instance1432.7 Log path: C:\Databases\DB7
Database: C:\Databases\DB7\Jetstress007001.edb
Instance1432.8 Log path: C:\Databases\DB8 Database: C:\Databases\DB8\Jetstress008001.edb
Instance1432.9 Log path: C:\Databases\DB9 Database: C:\Databases\DB9\Jetstress009001.edb
Instance1432.10 Log path: C:\Databases\DB10 Database: C:\Databases\DB10\Jetstress010001.edb
Transactional I/O Performance
MSExchange Database
==> Instances
I/O
Database
Reads Average
Latency (msec)
I/O
Databa
se Writes
Average
Latency
(msec)
I/O
Database
Reads/sec
I/O
Databa
se Writes
/sec
I/O Database
Reads Average
Bytes
I/O
Datab
ase Writes
Average
Bytes
I/O
Log
Reads Averag
e Latenc
y (msec)
I/O
Log
Writes Averag
e Latenc
y (msec)
I/O
Log
Reads/sec
I/O
Log
Writes/sec
I/O
Log
Reads Averag
e Bytes
I/O
Log
Writes Averag
e Bytes
Instance1432.1 1397.810 0.000 62.956 0.000 180802.851 0.000 0.000 0.000 0.000 0.000 0.000 0.000
Instance1432.2 8.361 0.000 185.232 0.000 262144.000 0.000 0.000 0.000 0.000 0.000 0.000 0.000
Instance1432.3 72.869 0.000 167.224 0.000 250374.269 0.000 0.000 0.000 0.000 0.000 0.000 0.000

23
Instance1432.4 10.446 0.000 162.631 0.000 261103.746 0.000 0.000 0.000 0.000 0.000 0.000 0.000
Instance1432.5 9.151 0.000 165.985 0.000 262144.000 0.000 0.000 0.000 0.000 0.000 0.000 0.000
Instance1432.6 2242.854 0.000 46.611 0.000 162982.589 0.000 0.000 0.000 0.000 0.000 0.000 0.000
Instance1432.7 9.163 0.000 165.472 0.000 262144.000 0.000 0.000 0.000 0.000 0.000 0.000 0.000
Instance1432.8 9.215 0.000 164.411 0.000 262144.000 0.000 0.000 0.000 0.000 0.000 0.000 0.000
Instance1432.9 8.476 0.000 182.740 0.000 261558.857 0.000 0.000 0.000 0.000 0.000 0.000 0.000
Instance1432.10 9.289 0.000 163.542 0.000 262144.000 0.000 0.000 0.000 0.000 0.000 0.000 0.000
Host System Performance
Counter Average Minimum Maximum
% Processor Time 4.583 0.000 17.364
Available MBytes 11190.650 11178.000 11202.000
Free System Page Table Entries 33555615.658 33555601.000 33556122.000
Transition Pages RePurposed/sec 0.000 0.000 0.000
Pool Nonpaged Bytes 172355150.881 172036096.000 173465600.000
Pool Paged Bytes 112876024.141 112238592.000 113377280.000
Database Page Fault Stalls/sec 0.000 0.000 0.000
Test Log4/10/2011 3:38:35 PM -- Jetstress testing begins ... 4/10/2011 3:38:35 PM -- Preparing for testing ... 4/10/2011 3:38:46 PM -- Attaching databases ... 4/10/2011 3:38:46 PM -- Preparations for testing are complete. 4/10/2011 3:40:06 PM -- Performance logging started (interval: 30000 ms). 4/10/2011 3:40:06 PM -- Backing up databases ... 4/11/2011 6:20:58 AM -- Performance logging has ended. 4/11/2011 6:20:58 AM -- Instance1432.1 (100% processed), Instance1432.2 (100% processed), Instance1432.3 (100% processed), Instance1432.4 (100% processed), Instance1432.5 (100% processed), Instance1432.6 (100% processed), Instance1432.7 (100% processed), Instance1432.8 (100%
processed), Instance1432.9 (100% processed) and Instance1432.10 (100% processed) 4/11/2011 6:20:58 AM -- has 1759 samples. 4/11/2011 6:20:58 AM -- Creating test report ...
Appendix D: Soft Recovery Testing
Microsoft Exchange Jetstress 2010
SoftRecovery Test Result Report
Soft-Recovery Statistics - All
Database Instance Log files replayed Elapsed seconds
Instance1432.1 508 1528.8806853
Instance1432.2 502 1488.3050141
Instance1432.3 508 1507.9298485
Instance1432.4 518 1722.2118249

24
Instance1432.5 501 1482.2054033
Instance1432.6 501 1573.699564
Instance1432.7 506 1500.769436
Instance1432.8 509 1519.3334686
Instance1432.9 505 1504.7474429
Instance1432.10 505 1511.1122541
Database Configuration
Instance1432.1 Log path: C:\Databases\DB1 Database: C:\Databases\DB1\Jetstress001001.edb
Instance1432.2 Log path: C:\Databases\DB2 Database: C:\Databases\DB2\Jetstress002001.edb
Instance1432.3 Log path: C:\Databases\DB3 Database: C:\Databases\DB3\Jetstress003001.edb
Instance1432.4 Log path: C:\Databases\DB4 Database: C:\Databases\DB4\Jetstress004001.edb
Instance1432.5 Log path: C:\Databases\DB5
Database: C:\Databases\DB5\Jetstress005001.edb
Instance1432.6 Log path: C:\Databases\DB6 Database: C:\Databases\DB6\Jetstress006001.edb
Instance1432.7 Log path: C:\Databases\DB7 Database: C:\Databases\DB7\Jetstress007001.edb
Instance1432.8 Log path: C:\Databases\DB8 Database: C:\Databases\DB8\Jetstress008001.edb
Instance1432.9 Log path: C:\Databases\DB9 Database: C:\Databases\DB9\Jetstress009001.edb
Instance1432.10 Log path: C:\Databases\DB10 Database: C:\Databases\DB10\Jetstress010001.edb
Transactional I/O Performance
MSExchange Database
==> Instances
I/O
Database
Reads Average
Latency (msec)
I/O
Databa
se Writes
Average
Latency (msec)
I/O
Database
Reads/sec
I/O
Databa
se Writes/
sec
I/O Database
Reads
Average Bytes
I/O Database
Writes
Average Bytes
I/O Log
Reads
Average Latency
(msec)
I/O Log
Writes
Average
Latency (msec)
I/O Log
Reads/
sec
I/O Log
Writes/
sec
I/O Log Reads
Average Bytes
I/O Log
Writes
Average Bytes
Instance1432.1 25.536 2.049 293.001 1.990 41402.382 32681.312 11.677 0.000 2.986 0.000 231835.903 0.000
Instance1432.2 25.712 1.849 297.202 2.012 41436.650 32678.957 7.743 0.000 3.018 0.000 231855.009 0.000

25
Instance1432.3 25.281 1.803 302.236 2.017 41414.619 32768.000 7.401 0.000 3.025 0.000 232468.654 0.000
Instance1432.4 24.628 1.832 260.604 1.803 40242.754 29614.272 23.103 0.000 2.704 0.000 208999.287 0.000
Instance1432.5 25.394 1.973 298.815 2.028 41566.187 32589.428 7.736 0.002 3.045 0.008 231286.463 1.395
Instance1432.6 50.734 2.030 282.798 1.908 41213.773 32009.871 7.900 0.000 2.861 0.000 222366.078 0.000
Instance1432.7 25.662 2.005 296.689 2.020 41585.272 32591.353 7.635 0.000 3.030 0.000 231223.485 0.000
Instance1432.8 25.726 2.025 297.843 2.005 41535.917 32768.000 7.747 0.000 3.007 0.000 232481.702 0.000
Instance1432.9 25.922 1.883 293.647 2.010 41381.285 32679.914 7.698 0.000 3.016 0.000 231861.197 0.000
Instance1432.10 25.600 1.954 300.062 2.004 41365.050 32680.385 7.682 0.010 3.005 0.002 231881.170 1.369
Background Database Maintenance I/O Performance
MSExchange Database ==> Instances
Database Maintenance IO Reads/sec
Database Maintenance IO Reads Average Bytes
Instance1432.1 14.777 261732.867
Instance1432.2 14.797 261558.797
Instance1432.3 16.096 261468.591
Instance1432.4 13.487 238724.730
Instance1432.5 14.812 261362.077
Instance1432.6 14.117 252870.001
Instance1432.7 14.794 261659.311
Instance1432.8 14.774 261511.776
Instance1432.9 14.550 261717.326
Instance1432.10 14.765 261433.992
Total I/O Performance
MSExchange Database ==> Instances
I/O Databas
e Reads Average
Latency (msec)
I/O Databa
se Writes
Average
Latenc
y (msec)
I/O Database
Reads/sec
I/O Databa
se Writes
/sec
I/O Database Reads
Average Bytes
I/O Database Writes
Average Bytes
I/O Log Reads
Average Latency
(msec)
I/O Log
Writes Averag
e Latenc
y
(msec)
I/O Log
Reads/sec
I/O Log
Writes/sec
I/O Log Reads Average Bytes
I/O Log
Writes Averag
e Bytes
Instance1432.1 25.536 2.049 307.777 1.990 51980.772 32681.312 11.677 0.000 2.986 0.000 231835.903 0.000
Instance1432.2 25.712 1.849 311.999 2.012 51876.534 32678.957 7.743 0.000 3.018 0.000 231855.009 0.000
Instance1432.3 25.281 1.803 318.332 2.017 52541.160 32768.000 7.401 0.000 3.025 0.000 232468.654 0.000
Instance1432.4 24.628 1.832 274.091 1.803 50009.263 29614.272 23.103 0.000 2.704 0.000 208999.287 0.000
Instance1432.5 25.394 1.973 313.627 2.028 51946.760 32589.428 7.736 0.002 3.045 0.008 231286.463 1.395
Instance1432.6 50.734 2.030 296.914 1.908 51276.987 32009.871 7.900 0.000 2.861 0.000 222366.078 0.000
Instance1432.7 25.662 2.005 311.483 2.020 52037.956 32591.353 7.635 0.000 3.030 0.000 231223.485 0.000
Instance1432.8 25.726 2.025 312.617 2.005 51931.767 32768.000 7.747 0.000 3.007 0.000 232481.702 0.000
Instance1432.9 25.922 1.883 308.197 2.010 51783.600 32679.914 7.698 0.000 3.016 0.000 231861.197 0.000
Instance1432.10 25.600 1.954 314.827 2.004 51685.743 32680.385 7.682 0.010 3.005 0.002 231881.170 1.369
Host System Performance
Counter Average Minimum Maximum
% Processor Time 6.853 0.000 10.077
Available Mbytes 8617.511 8539.000 10903.000

26
Free System Page Table Entries 33555614.958 33555605.000 33556122.000
Transition Pages RePurposed/sec 0.000 0.000 0.000
Pool Nonpaged Bytes 173032018.735 172331008.000 173936640.000
Pool Paged Bytes 111550041.930 111513600.000 111591424.000
Database Page Fault Stalls/sec 0.000 0.000 0.000
Test Log4/9/2011 10:23:23 AM -- Jetstress testing begins ... 4/9/2011 10:23:23 AM -- Preparing for testing ... 4/9/2011 10:24:35 AM -- Attaching databases ... 4/9/2011 10:24:35 AM -- Preparations for testing are complete. 4/9/2011 10:24:35 AM -- Starting transaction dispatch .. 4/9/2011 10:24:35 AM -- Database cache settings: (minimum: 320.0 MB, maximum: 2.5 GB) 4/9/2011 10:24:35 AM -- Database flush thresholds: (start: 25.6 MB, stop: 51.2 MB) 4/9/2011 10:25:31 AM -- Database read latency thresholds: (average: 20 msec/read, maximum: 100 msec/read). 4/9/2011 10:25:31 AM -- Log write latency thresholds: (average: 10 msec/write, maximum: 100 msec/write). 4/9/2011 10:25:36 AM -- Operation mix: Sessions 3, Inserts 40%, Deletes 20%, Replaces 5%, Reads 35%, Lazy Commits 70%. 4/9/2011 10:25:36 AM -- Performance logging started (interval: 15000 ms). 4/9/2011 10:25:36 AM -- Generating log files ... 4/9/2011 2:03:46 PM -- C:\Databases\DB1 (101.6% generated), C:\Databases\DB2 (100.2% generated), C:\Databases\DB3 (101.6% generated), C:\Databases\DB4 (103.6% generated), C:\Databases\DB5 (100.2% generated), C:\Databases\DB6 (100.2% generated), C:\Databases\DB7 (101.2% generated), C:\Databases\DB8 (101.8% generated), C:\Databases\DB9 (101.0% generated) and C:\Databases\DB10 (101.0% generated) 4/9/2011 2:03:46 PM -- Performance logging has ended. 4/9/2011 2:03:46 PM -- JetInterop batch transaction stats: 21930, 21821, 22244, 22196, 21941, 21856, 21992, 22114, 21843 and 21950. 4/9/2011 2:03:46 PM -- Dispatching transactions ends. 4/9/2011 2:03:46 PM -- Shutting down databases ... 4/9/2011 2:04:00 PM -- Instance1432.1 (complete), Instance1432.2 (complete), Instance1432.3 (complete), Instance1432.4 (complete), Instance1432.5 (complete), Instance1432.6 (complete), Instance1432.7 (complete), Instance1432.8 (complete), Instance1432.9 (complete) and Instance1432.10 (complete) 4/9/2011 2:04:00 PM -- has 871 samples. 4/9/2011 2:04:00 PM -- Creating test report ... 4/9/2011 2:04:03 PM -- Instance1432.1 has 18.0 for I/O Database Reads Average Latency. 4/9/2011 2:04:03 PM -- Instance1432.1 has 2.0 for I/O Log Writes Average Latency. 4/9/2011 2:04:03 PM -- Instance1432.1 has 2.0 for I/O Log Reads Average Latency. 4/9/2011 2:04:03 PM -- Instance1432.2 has 16.9 for I/O Database Reads Average Latency. 4/9/2011 2:04:03 PM -- Instance1432.2 has 2.1 for I/O Log Writes Average Latency. 4/9/2011 2:04:03 PM -- Instance1432.2 has 2.1 for I/O Log Reads Average Latency. 4/9/2011 2:04:03 PM -- Instance1432.3 has 17.1 for I/O Database Reads Average Latency. 4/9/2011 2:04:03 PM -- Instance1432.3 has 2.3 for I/O Log Writes Average Latency. 4/9/2011 2:04:03 PM -- Instance1432.3 has 2.3 for I/O Log Reads Average Latency. 4/9/2011 2:04:03 PM -- Instance1432.4 has 18.0 for I/O Database Reads Average Latency. 4/9/2011 2:04:03 PM -- Instance1432.4 has 2.1 for I/O Log Writes Average Latency. 4/9/2011 2:04:03 PM -- Instance1432.4 has 2.1 for I/O Log Reads Average Latency. 4/9/2011 2:04:03 PM -- Instance1432.5 has 17.5 for I/O Database Reads Average Latency. 4/9/2011 2:04:03 PM -- Instance1432.5 has 2.1 for I/O Log Writes Average Latency. 4/9/2011 2:04:03 PM -- Instance1432.5 has 2.1 for I/O Log Reads Average Latency. 4/9/2011 2:04:03 PM -- Instance1432.6 has 17.1 for I/O Database Reads Average Latency. 4/9/2011 2:04:03 PM -- Instance1432.6 has 2.5 for I/O Log Writes Average Latency. 4/9/2011 2:04:03 PM -- Instance1432.6 has 2.5 for I/O Log Reads Average Latency. 4/9/2011 2:04:03 PM -- Instance1432.7 has 17.7 for I/O Database Reads Average Latency.

27
4/9/2011 2:04:03 PM -- Instance1432.7 has 2.1 for I/O Log Writes Average Latency. 4/9/2011 2:04:03 PM -- Instance1432.7 has 2.1 for I/O Log Reads Average Latency. 4/9/2011 2:04:03 PM -- Instance1432.8 has 17.7 for I/O Database Reads Average Latency. 4/9/2011 2:04:03 PM -- Instance1432.8 has 2.1 for I/O Log Writes Average Latency. 4/9/2011 2:04:03 PM -- Instance1432.8 has 2.1 for I/O Log Reads Average Latency. 4/9/2011 2:04:03 PM -- Instance1432.9 has 17.1 for I/O Database Reads Average Latency. 4/9/2011 2:04:03 PM -- Instance1432.9 has 2.3 for I/O Log Writes Average Latency. 4/9/2011 2:04:03 PM -- Instance1432.9 has 2.3 for I/O Log Reads Average Latency. 4/9/2011 2:04:03 PM -- Instance1432.10 has 17.6 for I/O Database Reads Average Latency. 4/9/2011 2:04:03 PM -- Instance1432.10 has 2.1 for I/O Log Writes Average Latency. 4/9/2011 2:04:03 PM -- Instance1432.10 has 2.1 for I/O Log Reads Average Latency. 4/9/2011 2:04:03 PM -- Test has 0 Maximum Database Page Fault Stalls/sec. 4/9/2011 2:04:03 PM -- The test has 0 Database Page Fault Stalls/sec samples higher than 0. 4/9/2011 2:04:03 PM -- has 870 samples queried. 4/9/2011 2:04:03 PM -- was saved. 4/9/2011 2:04:09 PM -- Performance logging started (interval: 4000 ms). 4/9/2011 2:04:09 PM -- Recovering databases ... 4/9/2011 2:32:51 PM -- Performance logging has ended. 4/9/2011 2:32:51 PM -- Instance1432.1 (1528.8806853), Instance1432.2 (1488.3050141), Instance1432.3 (1507.9298485), Instance1432.4 (1722.2118249), Instance1432.5 (1482.2054033), Instance1432.6 (1573.699564), Instance1432.7 (1500.769436), Instance1432.8 (1519.3334686), Instance1432.9 (1504.7474429) and Instance1432.10 (1511.1122541) 4/9/2011 2:32:51 PM -- has 427 samples. 4/9/2011 2:32:51 PM -- Creating test report ...