delivering value with€¦ · printing line § ½Ùù§úÝúú,ù¶Ä corporate overview statutory...
TRANSCRIPT


DELIVERING VALUE WITH
EXPERIENCE & GROWTH
Vardhman Textiles Ltd.
Annual Report 2017-18
AcrylicFiber
Fabrics GarmentsYarns Sewing Thread
Alloy Steel
Forward-Looking StatementsSome information in this report may contain forward-looking statements which include statements regarding Company’s expected financial position and results of operations, business plans and prospects etc. and are generally identified by forward-looking words such as “believe,” “plan,” “anticipate,” “continue,” “estimate,” “expect,” “may,” “will” or other similar words. Forward-looking statements are dependent on assumptions or basis underlying such statements. We have chosen these assumptions or basis in good faith, and we believe that they are reasonable in all material respects. However, we caution that actual results, performances or achievements could differ materially from those expressed or implied in such forward-looking statements. We undertake no obligation to update or revise any forward-looking statement, whether as a result of new information, future events, or otherwise.
Corporate Overview
Statutory Reports
Financial Statements
Notice
02 Knowing Vardhman Textiles Limited
04 Vardhman Group Milestone Journey
05 Our Collaborations06 Vardhman’s Entrenched Presence
07 Brands We Serve08 Vardhman Competitiveness10 Our Business Model
31 Management Discussion and Analysis Report
38 Business Responsibility Report49 Directors’ Report
57 Annexures to the Directors’ Report
72 Corporate Governance Report78 General Information for Shareholders
83 Standalone Financial Statements
164 Consolidated Financial Statements
256
12 Chairman’s Communique
14 Message from the Management
16 The year in Numbers18 Our Integrated Business Strategy
20 Product wise Review24 Step Towards Sustainable Manufacturing25 Corporate Social Responsibility
CONTENTS

And along the way, we saw growth being the by-
product of that excellence – because the better
we got at our work, the wider our horizons got and
the higher our achievements went. And now, as we
stride ahead with both experience and growth by
our side, we are getting closer to our aim of creating
true value – for our people, our customers, our
stakeholders and our industry.
In other words, we continue to take positive strides as a leading textile conglomerate in the country.
Creating value never really happens in a vacuum. At Vardhman, we have witnessed excellence being the by-product of our experience – the more we did our work, the better we got at it.

KNOWING VARDHMAN TEXTILES LIMITEDWith more than five decades of presence, Vardhman is today among the leading textile conglomerates in the country. Beginning humbly in the year 1965, Vardhman group has evolved over the years into a modern day textile major under the dynamic leadership of its chairman, Mr. S. P. Oswal.
Vardhman Textiles Limited today stands as an epitome of perpetual business growth and rich industry experience.
Engaged in the business of manufacturing of Yarn, Fabric, Acrylic Fibre, Garments, Sewing Threads and Alloy Steel, the Group has over the years developed as a business conglomerate with presence in India and in 75 countries across the globe.
Vardhman is one of the India’s largest textile manufacturer, with leading market share and sustainable business model.
What makes Vardhman different?Our successful business model has helped us differentiate ourselves from others. It can be
distilled into the following areas:
Highly talented team
At Vardhman, we have in place a
strong, capable and experienced
management team delivering
results that drive the company
ahead
Focused approach
Targeted and focused
diversification over the years has helped Vardhman build on its
core skills and create a pervasive
presence across the value chain
Technology focused
At Vardhman, over the years, we
have collaborated with some of
the best technology players in the
world and have developed a strong
in-house technical team which
played an instrumental role in helping
Vardhman emerge as a technology-
forward company
Customer focused
At Vardhman, we continuously
engage with our customers to
understand their requirements.
We enjoy repeat business from
existing customers on account of
enduring relationships
Vardhman Textiles Ltd. Annual Report 2017-1802

WE ARE DIVERSE BYOUR BUSINESS VERTICALS
Yarns Fabrics Sewing ThreadAcrylic Fibre Garments Alloy Steel
VARDHMAN STANDS FOR
A symbol of Trust
Experience of more than five decades in the textile industry
Leading manufacturer and exporter of cotton yarn in India.
25 state-of-the-art manufacturing facilities
Presence in more than 75 countries across the globe
Largest LargestSpindles count in the
country
2nd
Largest producer of
sewing threads in India
manufacturer of Hand
knitting yarn in India
1276Looms
140MMPA
Processing Capacity
18MMPA
Printing Line
Vardhman in numbers
Corporate Overview Statutory Reports Financial Statements Notice 03

1965 19921982 19991986 2000
2007 20152011 20162013
Vardhman
group entered
the sewing
thread market
The group entered
into garment
business with
manufacturing of
formal shirts for men
Vardhman diversified its operations by
entering into weaving
business with a plant
in Baddi, Himachal
Pradesh
Vardhman
completed 50
Golden years
Vardhman
entered into
processing of
fabrics
Vardhman started
its operations
with 6000
spindles
Vardhman
established its first composite plant in
2007 with Spinning,
Weaving and
Processing facilities
With increase in spindle
capacity to 10 lakh,
Vardhman reached the
highest spindle capacity
in the country
Printed Fabric
Unit started
in March
The group acquired
steel unit from Mohta
Industries which is now
known as Vardhman
Special Steels
A plant in Bharuch, Gujarat
was set up by the group for
production of Acrylic Fibre
VARDHMAN GROUP MILESTONE JOURNEY
Vardhman Textiles Ltd. Annual Report 2017-1804

OUR COLLABORATIONS
Nihon Sanmo
Exlan and Marubeni
Nisshinbo
Toho Rayon
American and Efird
Tokai Senko
Nisshinbo
1992
1996
2002
1995
2001
1998
2009
CompanyYear of Collaboration
Collaborated for
Fibre and Yarn Dyeing
Acrylic Fibre
Cotton Yarns
Cotton Yarns
Sewing Threads
Fabric Finishing and
Dyeing
Garment Business
Japan
Japan
Japan
Japan
Japan
Japan
USA
Corporate Overview Statutory Reports Financial Statements Notice 05

VARDHMAN’S ENTRENCHED PRESENCE
Being engaged in this competitive textile business for over five decades now, one thing we have learned is that manufacturing at competitive cost is the key to survival. The competence to manufacture at competitive cost is not as facile as it appears. At Vardhman, this has been made possible by our 25 state-of-the-art facilities located in different states of India. These facilities help Vardhman to be cost effective, enjoy economies-of-scale, effective yet maximum capacity utilisation, quick product switch and consistent product quality.
Manufacturing facilities
Ludhiana, Baddi, Hoshiarpur, Malerkotla,
Jhagadia, Budhni, Satlapur, Mandideep,
Perundurai, Vizag
Vardhman Textiles Ltd. Annual Report 2017-1806

BRANDS WE SERVE
Corporate Overview Statutory Reports Financial Statements Notice 07

VARDHMAN COMPETITIVENESS
Vardhman has been a long standing player in
the ever evolving textile industry and has a
product portfolio that enabled the Company to
have a presence across the textile value chain.
Our efficient manufacturing and high degree of focus on design and innovation have paved the
way for sales to mass-market brands.
More than 40% of our fabric is sold to domestic
and international brands such as GAP, H&M,
Peter England, Van Heusen, and Wills among
others.
Vardhman has pioneered the introduction of
100% cotton mélange into India in 1995.
It also pioneered the introduction of Core spun
yarns technology in India in 1998.
We already have a strong export presence in
more than 75 countries across the globe.
350+
Key international clients the Company is
associated with.
Pioneer in new technology adoption and
undertakes regular upgradation of machines
and systems.
H 100+ crore Average investment in new technologies and
system upgradation in the last five years.
12 locations have been approved by the
government to set up apparel parks to promote
exports.
Evolving technologies have opened up new
opportunities for companies in areas of product
development and higher operational efficiencies.
With the growing urbanisation, the demand for
branded apparels is on a rise in India.
Shifting demographics and growing urbaniza-
tion, the demand for better-quality and innova-
tive products is on the rise in India.
Market
Opportunities
Vardhman’s
Advantage
US $2.6 trillionExpected global apparel market size by 2025.
US $230 billionExpected Indian apparel market size by 2025.
Vardhman Textiles Ltd. Annual Report 2017-1808

The four pillars which have helped Vardhman maintain its competitiveness
1 2 3 4Adapting to changeTo form partnerships
and networks with
customers, consumers,
government, suppliers
and others in order to
make a sustainable
difference. Adapting
to change is about
actively engaging with
different stakeholders
to reinvent itself and
help the Company
re-establish itself in
the competitive textile
market.
Lead innovationWe inspire and excite
our customers by
delivering more significant innovation, tailored to their
changing preferences.
This accelerates the
translation of customer
needs into significant new business opportunities
that will help us be in line
with our growth strategy.
With the technology race
speeding up, our innovation
has also gone beyond
the lab, extending into
every interaction with our
customers and channel
partners.
Focus on opportunitiesWe prioritize the
customers, markets and
activities that hold the
biggest opportunities for
creating impact. Given
Vardhman’s broad portfolio
of products, it is critical
that we hone our ability to
focus on key priorities and
maximize value.
Grow our peopleWe want to enable our
employees to develop
their professional and
leadership skills. This will
include more effective
development programs,
customized to the needs
of specific parts of the organization. This helps
both our people and
organization to evolve
into better entities.
Corporate Overview Statutory Reports Financial Statements Notice 09

OUR BUSINESS MODEL
Input Business activities
Equity
Cash generated
H57.43Cr
H774Cr
Strong manufacturing capabilities
Technology investments in Raw-material and order management Inventory management Receivable and payable management
Sustainable products and solutions in the textile industry
Unique product portfolio based on expertise and application knowhow
Enhanced our portfolio with niche, value-driven products thereby accelerating cross-sale and reinforcing our volume-value positioning
Relationship management Focus on understanding the clients need
accurately and working jointly to provide the right solutions
Developed a strong support team
Maintain strong service ethics
Devise promotion programs in line with vendor and channel partner expectations
Economies-of-scale Enhanced manufacturing presence with
multiple facilities, enables the Company to achieve economies-of-scale and enhanced bargaining power
Technological enhancement Continuous and strategic investment in
technological upgradation across all the business functionalities
Group Presence in six different verticals
Yarn
Customers
Fibres
Sales agents
Threads
Channel partners
Steel
Fabrics
Distributors
Garments
Renowned global alliances
Key relationships
Vardhman Textiles Ltd. Annual Report 2017-1810

Sustainable and high applicability products and solutions, market leadership position Have been able to emerge as the leading
manufacturer and exporter of cotton yarn
in India
Enabling our customers to save time and cost
with an efficient order management system
Responsible operations Ensured wide spread product presence with a
deep rooted network
Revenue generated from the sale of products in
FY18 is H 5,851 crore
Relationship Grew its alliances and partners count
continuously since inception
Technology Sustained investment in technology, has helped
the Company to operate efficiently with greater productivity in each business function
Customers Trusted product quality, optimum customer
satisfaction, and timely product delivery
Largest manufacturer and exporter of
cotton yarn in India
Business alliances Not known just as a manufacturer of textile
products but rather as a success-driving partner
Associate with new brands to drive growth
Integrated One of the few companies in the
industry to have a presence across the
value chain
Stakeholders return H 473 crore paid in dividends in the last
five years
The Company is paying dividend continuously
since last forty years
Completed a H 720 crore buyback in
FY 2016-17
Upgrade of Credit Rating from AA to AA+ by
CRISIL
Society The Company contributes towards promoting
education, improving health care facilities,
safeguarding environment and promoting skill
development
Outputs Outcomes
Corporate Overview Statutory Reports Financial Statements Notice 11

CHAIRMAN’S COMMUNIQUE
Dear shareholders,I am pleased to present Vardhman’s FY18 performance. On the face of it, the Company’s performance was not in line with our expectations. However, looking at the bigger picture I would like to communicate that in a cyclical business like ours, our manner of sustaining such crests and responding to troughs distinguishes Vardhman. Our distinctive response to the tough industry scenario resulted into passing the tough time with minimal decline in the profits and is expected to translate into enhanced revenues, margins and surpluses across the foreseeable future.
Sectoral challenges The Central Government implemented the GST in July
2017. Even as the implementation of GST was perhaps
the most significant taxation reform in the history of independent India, the resultant teething issues impacted
the textile sector unfavourably initially.
Concurrently, appreciation of the Indian rupee through the
course of the year affected export prospects. Besides,
synthetic yarn and fabric imports were earlier subject
to a countervailing duty. With no such duty on domestic
yarn and fabrics, a large quantum of imported synthetic
yarn and garments from competing countries entered the
system, affecting the presence and competitiveness of
the domestic players.
Unexpected fluctuations in the prices of raw materials, specially cotton, owing to new arrivals of cotton at pretty
low prices, shortage of cotton stock in India and large
quantum of import of cotton at higher prices in later half
FY18 also had its share of impact. Increase in the crude
prices and rise in the prices of the yarn in the second half
also impacted the industry.
Vardhman’s responseAt Vardhman, we too bore the brunt of these adverse
macroeconomic trends but thanks to our experience we
Invested towards modernisation
of our assets and enhancement
of our capacity in FY18
Wider-width looms to be installed in
additional loom shed in Baddi
H 300Cr
224
Vardhman Textiles Ltd. Annual Report 2017-1812

exhibited a sense of determined responsiveness in the
face of these unfolding realities. In view of the continued
uncertainty, one thing that remained constant at Vardhman
was our constant focus on our future growth strategy
and investment in our niches. This I believe would help
the Company emerge a stronger player, well-placed to
capitalise with speed on a sectoral rebound. Although
challenging, FY18 also saw good progress in a lot of other
areas, which positioned Vardhman well for the future.
We focused on improving ourselves during the year in
terms of selectively investing in capex exercises, customer
centricity, enhancing quality and innovation quotient,
thereby strengthening our overall competitiveness. We
invested around H 300 crore in FY18 towards modernisation
of our assets and enhancement of our capacity. We
implemented capacity expansion in our processing unit
in Baddi with installation of additional processing unit of
30 mmpa along with capacity enhancement in the printed
fabric line. This is expected to widen the product offerings
of the Company in the yarn dyed segment and also help
service our clients better. We also initiated the setting
up of additional loom shed in Baddi for installing 224
wider-width looms. This will again help us in balancing our
additional processing fabric requirements.
We continued to modernise facilities with the objective
to enhance operating efficiencies, moderate costs and achieve qualitative consistency. With the confidence that there would be an increased need for technologies
in the days ahead, during FY18 we formulated a plan for
upgradation of the old technology wherever it is impacting
the quality of production, and based on this plan we
continue to execute our modernisation strategy.
In the present challenging environment, where a number
of challenges were beyond our control, at Vardhman
we focused on taking adequate measures over factors
that were within our reach and control. We focused on
sweating assets with the objective to cover fixed costs more efficiently. We looked into every cost incurred and practice undertaken with the objective to eliminate
wasteful expenditure. We continued to invest in research
to enhance our innovation quotient.
Road aheadYes, FY18 was a year with challenges across many of our
markets which had a negative impact on our financial performance. But here I would like to communicate that
in our existence of more than five decades, we have faced years like this before and we have come back strong
time and again. We have come this far by building on the
experiences of these difficult years and utilising these experiences we would continue to build our future. We
expect that the complement of the initiatives taken during
the year will enable the Company to enhance its revenue
momentum, margins and create attractive value in the
hands of all our stakeholders. A year like this reinforces
our belief in the strength of our proposition and enhances
our ability to adapt our business for the future. On behalf
of the Board and the entire leadership team, I thank all our
stakeholders, business partners and customers for their
continued support and guidance.
Warm Regards,
Shri Paul OswalA fellow shareholder
We continued to modernise facilities with the objective to enhance operating efficiencies, moderate costs and achieve qualitative consistency.
We have come this far by building on the experiences of these difficult years and utilising these experiences we would continue to build our future.
Corporate Overview Statutory Reports Financial Statements Notice 13

MESSAGE FROM THE MANAGEMENT
In yarn business we aim to add around 1,00,000 spindles of capacity and in fabric business we aim to increase our processing capacity from current level of 140 million meters per annum to approximately 180 million meters per annum.
At Vardhman, we led the proactive GST reform, adapting to new taxation system, ensuring minimum impact on the overall business operations.
Dear Shareholders,We are pleased to inform you that
during the year, we witnessed a
stable performance despite various
headwinds from the external
environment that were affecting
our business. During the year, the
prices of cotton remained volatile.
We entered into use of new cotton
during Q4 of FY18 which helped
us to improve our margins for the
last quarter.
The continuous evolution of GST
policies and tax rates did leave an
impact on the operations of several
industries, including the textile
industry. At Vardhman, we led the
proactive GST reform, adapting
to new taxation system, ensuring
minimum impact on the overall
business operations.
During the year, our revenues stood
at H 5,851 crore, declining marginally
against that of previous year, owing to
a drop in sales of yarn business. This
was on account of some teething
issues in GST refunds against
exports, resulting in major textile
players resorting to domestic market,
Vardhman Textiles Ltd. Annual Report 2017-1814
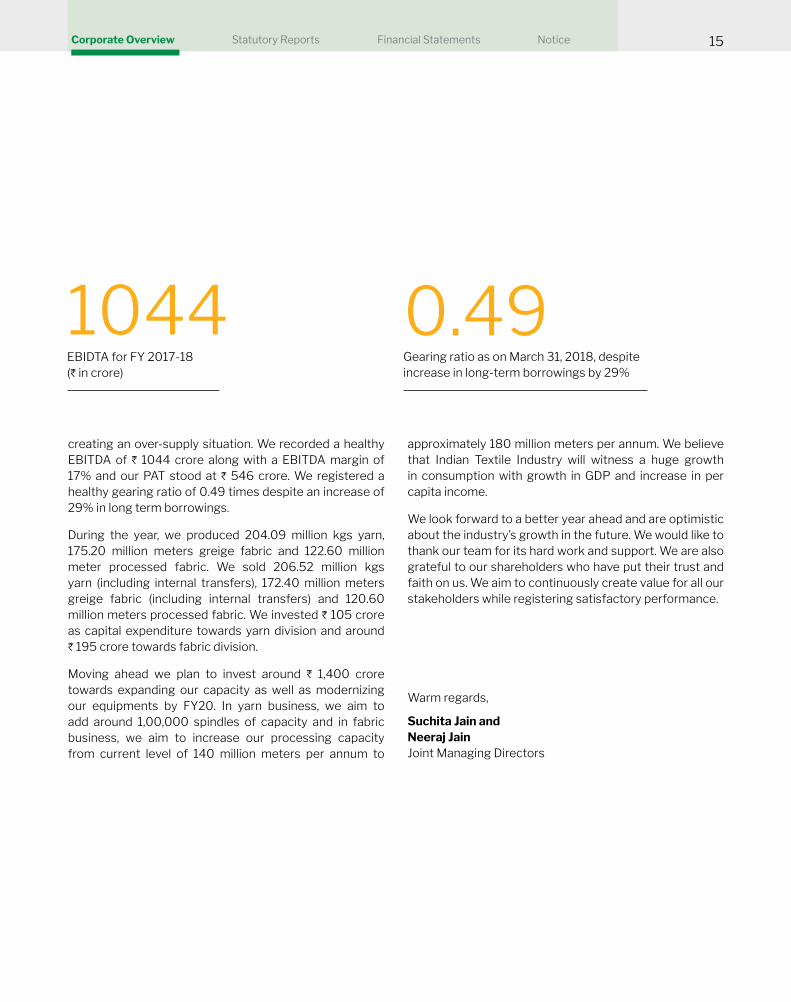
creating an over-supply situation. We recorded a healthy
EBITDA of H 1044 crore along with a EBITDA margin of
17% and our PAT stood at H 546 crore. We registered a
healthy gearing ratio of 0.49 times despite an increase of
29% in long term borrowings.
During the year, we produced 204.09 million kgs yarn,
175.20 million meters greige fabric and 122.60 million
meter processed fabric. We sold 206.52 million kgs
yarn (including internal transfers), 172.40 million meters
greige fabric (including internal transfers) and 120.60
million meters processed fabric. We invested H 105 crore
as capital expenditure towards yarn division and around
H 195 crore towards fabric division.
Moving ahead we plan to invest around H 1,400 crore
towards expanding our capacity as well as modernizing
our equipments by FY20. In yarn business, we aim to
add around 1,00,000 spindles of capacity and in fabric
business, we aim to increase our processing capacity
from current level of 140 million meters per annum to
approximately 180 million meters per annum. We believe
that Indian Textile Industry will witness a huge growth
in consumption with growth in GDP and increase in per
capita income.
We look forward to a better year ahead and are optimistic
about the industry’s growth in the future. We would like to
thank our team for its hard work and support. We are also
grateful to our shareholders who have put their trust and
faith on us. We aim to continuously create value for all our
stakeholders while registering satisfactory performance.
Warm regards,
Suchita Jain andNeeraj JainJoint Managing Directors
Gearing ratio as on March 31, 2018, despite
increase in long-term borrowings by 29%
0.49EBIDTA for FY 2017-18
(H in crore)
1044
Corporate Overview Statutory Reports Financial Statements Notice 15
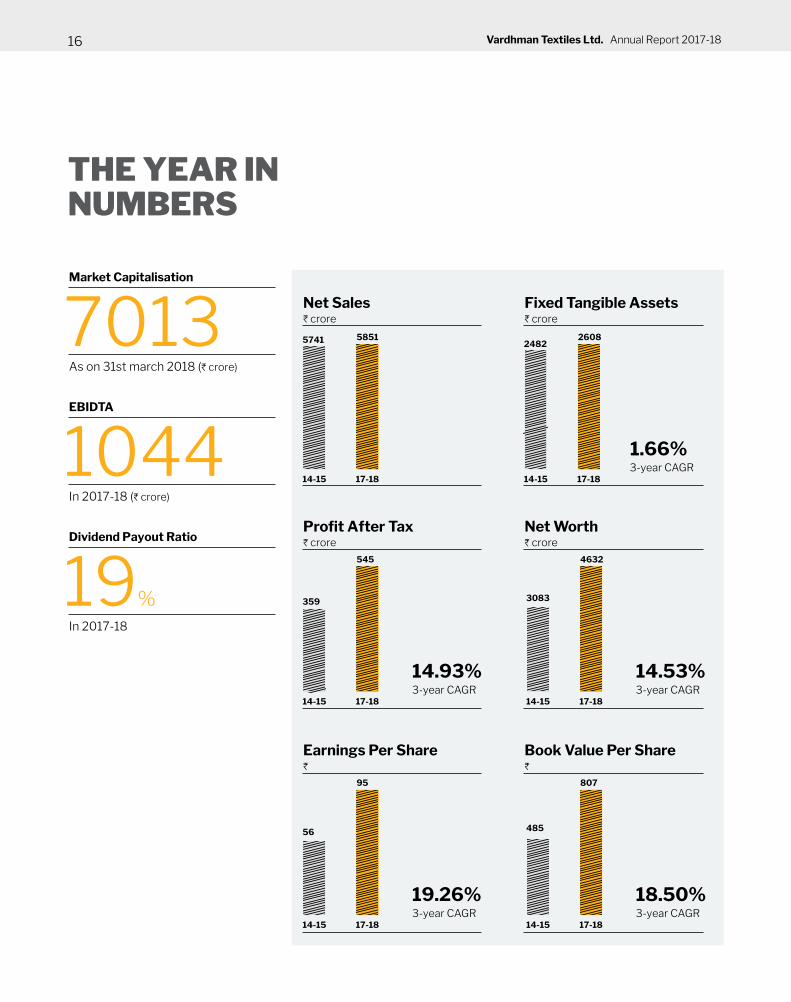
THE YEAR IN NUMBERS
Market Capitalisation
As on 31st march 2018 (H crore)
7013EBIDTA
In 2017-18 (H crore)
1044Dividend Payout Ratio
In 2017-18
19%
17-18
17-18
17-18
17-18
17-18
17-18
5851
545
95
4632
807
2608
14-15
14-15
14-15
14-15
14-15
14-15
5741
359
56
3083
485
2482
Net Sales H crore
3-year CAGR
3-year CAGR
3-year CAGR
3-year CAGR
3-year CAGR
Fixed Tangible Assets H crore
Profit After Tax H crore
Net Worth H crore
Earnings Per Share H
Book Value Per Share H
14.93%
19.26%
14.53%
18.50%
1.66%
Vardhman Textiles Ltd. Annual Report 2017-1816

THE BUSINESS
A GLOBAL PLAYER
BENEFITS OF VALUE ADDITION
Consecutive years of
profits generation
40
Proportion of the
overall revenue earned
from the domestic
market
62%
Promoters stake as on
March 31, 2018
62.15%
Increase in average realization
per Mtr for fabrics over the last
five years in the Fabric business
14.88%Increase in average
realization per Kg of yarn
over the last five years in the yarn business
3.44%
Proportion of the
overall revenue
earned from the
international market
38%Growth in domestic
revenues in the last
five years
42%Growth in
international
revenues in the last
five years
38%
How we have delivered value
Corporate Overview Statutory Reports Financial Statements Notice 17

OUR INTEGRATED BUSINESS STRATEGY
Engaging with the clientsBy partnering closely with our clients, we gain an understanding
of their needs and challenges.
Supplier supportOwing to its already established presence in the industry for
more than five decades, Vardhman has been successful in earning its suppliers’ trust. Thus, a trusted supplier support
has enabled the Company to strike the right balance between
quality and efficiency.
Innovative solutionsVardhman provides unique textile solutions to its clients by
introducing the latest processes and products across the value
chain.
Vardhman Textiles Ltd. Annual Report 2017-1818
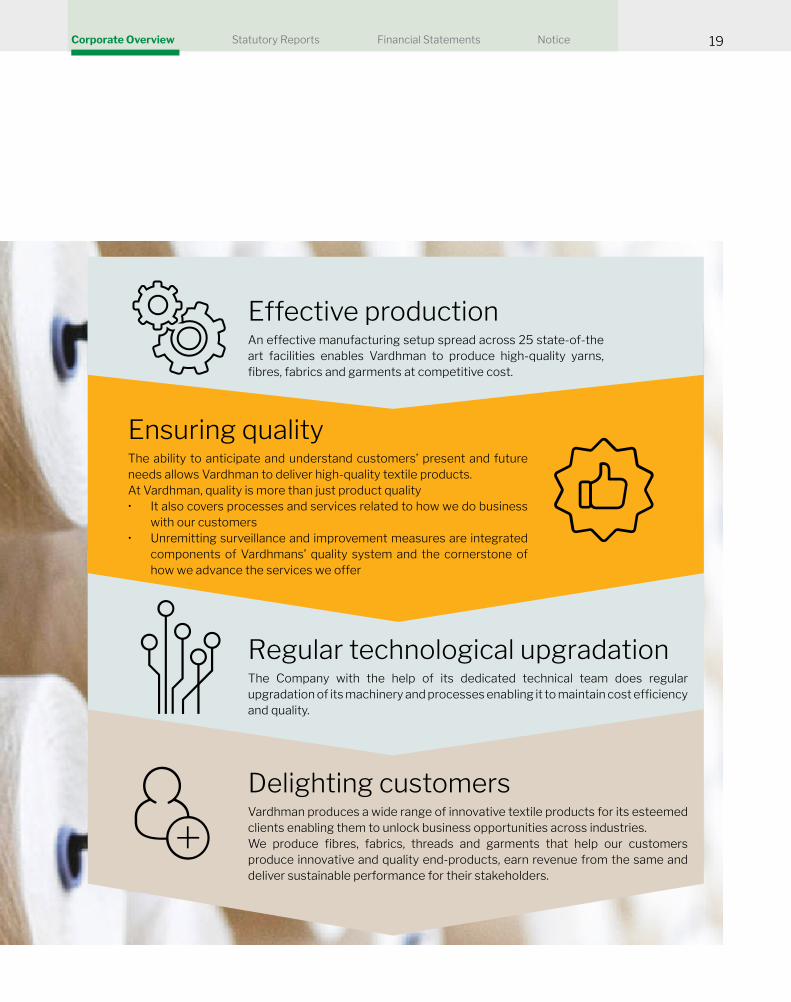
Effective productionAn effective manufacturing setup spread across 25 state-of-the
art facilities enables Vardhman to produce high-quality yarns,
fibres, fabrics and garments at competitive cost.
Regular technological upgradationThe Company with the help of its dedicated technical team does regular
upgradation of its machinery and processes enabling it to maintain cost efficiency and quality.
Delighting customersVardhman produces a wide range of innovative textile products for its esteemed
clients enabling them to unlock business opportunities across industries.
We produce fibres, fabrics, threads and garments that help our customers produce innovative and quality end-products, earn revenue from the same and
deliver sustainable performance for their stakeholders.
Ensuring qualityThe ability to anticipate and understand customers’ present and future
needs allows Vardhman to deliver high-quality textile products.
At Vardhman, quality is more than just product quality
• It also covers processes and services related to how we do business
with our customers
• Unremitting surveillance and improvement measures are integrated
components of Vardhmans’ quality system and the cornerstone of
how we advance the services we offer
Corporate Overview Statutory Reports Financial Statements Notice 19

PRODUCT WISE REVIEW
Rich product basket
Regular qualitiesCotton Yarn, Compact Yarn, Blended Yarn , Acrylic
yarn etc.
Premium qualitiesCotton Lycra, Cotton Lyocell, Cotton Viscose, Cotton
Bamboo, Cotton Tencel, Cotton Silk, Cotton Modal,
Organic Cotton, Contamination-Free Yarn, Fair Trade
Yarn, Gas Mercerised, Fancy Yarn, Slub Yarn, Hand-
Knitted Yarn, High-Twist, Low-twist, Ciro, Nylon
Cotton, Triple Blends etc.
Core competencies
Produces almost every grade across different
specialised greige and dyed yarns in cotton,
polyester, acrylic and a variety of blends along with
the value-added ones
Manufacture of organic cotton, melange, core
spun yarns, ultra yarns (contamination controlled),
gassed mercerised, super fine yarns, slub and cellulose yarns and fancy yarns for hand knitting
One of the few manufacturers of different varieties
of dyed yarns
Ability to provide virtually any shade of yarn
One of the largest exporters of cotton yarn to the
most quality conscious markets like the EU, USA
and the Far East
One of the very few players in the industry who
is known for its quality, excellence, continuous
customer-driven innovation, original strategies and
a series of technology collaborations
Vardhman manufactures quality cotton, synthetic and blended yarns marketed to prominent labels within India and abroad. The Company is a one-stop shop for all kinds of spun yarn offering variety of contemporary blends and shades.
Yarn constitutes the largest business at Vardhman Textiles Limited with over 1.1 million spindles and a capacity to
manufacture over 580 MT of yarn per day.
2016-17 2017-18
Installed capacity (spindles) (in lac) 11.01 11.02
YARN
Vardhman Textiles Ltd. Annual Report 2017-1820

Highlights 2017-18
Grew yarn sales volumes from 203.10 million kg in
2016-17 to 206.52 million kgs in 2017-18 (including
internal transfers).
Enhanced yarn exports by 1.31%. Yarns export volumes
stood at 75 million kg with a value of H 1,592.65 crore (FOB
Value).
Domestic volumes increased 3% from 73.75 million kg in
2016-17 to 75.87 million kgs in 2017-18.
Exported yarn to new markets like Fiji and Costa Rica,
among others, taking the total number of export locations
to 65.
Upgraded the blowroom lines with the latest technology
driven systems to provide contamination free yarn
Road ahead
Going ahead, the Company plans to further enhance
its international presence with a greater focus on the
emerging nations. We would continue to focus on
enhancing the quality and innovate new product lines
keeping in mind the changing taste and preferences of
the clients.
Corporate Overview Statutory Reports Financial Statements Notice 21

PRODUCT WISE REVIEW
Rich product basket
Regular qualities
Range of Products for top to bottoms for men and
women including piece dyed, yarn dyed and prints
Premium qualitiesBi-stretch, High-Stretch, Tencel and other
sustainable materials
Core competencies
One of the few players in the industry to have an
in-house design team, a development studio and
association with top Italian reputed designers,
enabling the company to offer a wide variety and
quality of products to the customers.
Have in place a dedicated fabric team looking after
the development of innovative product lines in sync
with the changing tastes and preferences of the
customers.
Have in place a very strong process control
mechanism, enabling the Company to deliver high-
quality output on a regular basis
Have in place state-of-the-art processes and
systems, sourced from one of the best technology
providers in Japan and Europe
Vardhman is one of the very few vertically integrated fabric manufacturers in India producing fabrics for both tops and bottoms in the apparel segment serving large retailers across USA, Europe, Asia and other emerging nations. The Company has pioneered the development of a wide variety of fabrics, thus emerging as preferred supplier. Fabric division has a weaving capacity above 180 million meters per annum and processing capacity of over 140 million
meters per annum across a wide specialty fabrics’ range. Vardhman, today, is one of the leading producers of fabrics
in India.
2016-17 2017-18
Processed Capacity (MMPA) 120 140
FABRICS
Vardhman Textiles Ltd. Annual Report 2017-1822

Highlights 2017-18
Grew fabric volumes marginally during the year
The printed fabric operations were established well during
the year. The company is making customised designs for
European and American customers.
Continuous upgradation of technology to enable
adaptation to new demands in line with the latest changes
in fashion.
Road ahead
Moving forward, the Company would like to further widen its
product offerings keeping in mind the changing preferences
of the end-users with the growing importance of millennials
in the decision making.
Corporate Overview Statutory Reports Financial Statements Notice 23

STEP TOWARDS SUSTAINABLE MANUFACTURING
Capacity of Biogas Plant
160 kg/day
Reduction in water consumed during the year
30 Lacs KL
Reverse Osmosis
We have implemented Reverse Osmosis at
Vardhman Fabrics, Budhni to reuse waste water
and thus reduce our water consumption.
Responsible way of Effluent Treatment
Vardhman Group has two effluent treatment plants and eight sewage treatment plants across the country.
We also have Zero Liquid Discharge (ZLD) System
Installation at our largest integrated facility at Budhni.
We have registered ourselves with Zero Discharge of
Hazardous Chemicals (ZDHC) and uploaded our reports
on its official website. We have also made Vardhman MRSL that takes into consideration the strict parameters
of all our customers and ZDHC norms.
Energy Consumption
Reduced Energy Consumption by 76.69 Lac KWH
units during the year. We have also installed two biogas
plants in Auro Textiles, Baddi and Vardhman Fabrics,
Budhni. The manure generated from Biogas is used for
horticultural purposes within the factories.
Resource Recovery
Clean water for reuse
Industrial Process
Concentration
Waste Water
Vardhman Textiles Ltd. Annual Report 2017-1824

CORPORATE SOCIAL RESPONSIBILITY
At Vardhman, we envision to be a responsible corporate entity and continue to make efforts towards quality value addition and constructive contribution in building a healthy society through our CSR initiatives. At the onset of our journey, we recognized our role as a responsible corporate entity and we have continuously aimed to have a positive impact on the society.
OUR FOCUS AREAS INCLUDE
Education Digital Literacy Program
Water, Sanitation & Hygiene: (WASH)
HealthCare Environment
Corporate Overview Statutory Reports Financial Statements Notice 25

“The Future of the world is in the Classrooms of today.” - Mr. S. P. Oswal, Chairman, Vardhman Group
Education
Education is one of the few things that can completely
rewrite the social landscape. In our rapidly developing
economy, education has emerged as a powerful tool
that can utilize the immense potential of billions to fuel
the growth of the nation. Education creates a plethora
of opportunities that provide employment, improve the
socio-economic situation and ensure a secure future. At
Vardhman, we remain steadfast on our goal of making
education accessible to the children who often do not get
that privilege.
FY 2017-18, we have constructed “Vardhman Block” of
14 Classrooms and two separate toilets at Government
Primary School Giaspura, Ludhiana by spending H 1.82
crore to substantially uplift the infrastructure which has
benefitted over 1400 students, majority of whom are children of migrant labour employed in nearby factories.
The school was inaugurated by the Hon’ble Finance
Minister, Govt. of Punjab, Shri Sardar Manpreet Singh Badal
on 29th January 2018 and he was highly appreciative of the
work done by the Vardhman Group. As per the feedback
and report received by us, the improved infrastructure has
also increased the enrollment of this school.
Apart from this, during the year, we have also constructed
School buildings, boundary walls, toilets for Girls and Boys
and drinking water points in other govt. schools of Ludhiana
& Malerkotla in Punjab, Baddi in Himachal Pradesh and
Mandideep and Budhni regions of Madhya Pradesh.
States (Punjab, MP & HP)
03
Anganwadies
41
Schools
38
Students benefited
8600More than
Vardhman Textiles Ltd. Annual Report 2017-1826

Digital Literacy Program
In India National Digital Literacy Mission (‘NDLM’) has
been initiated with the vision to empower at least one
person per household with crucial digital literacy skills by
2020. This is expected to touch the lives of more than 250
million individuals over the next few years. The National
Digital Literacy Mission is a dynamic and integrated
platform of digital literacy awareness, education and
capacity programmes that will help rural communities
fully participate in the global digital economy. Our focus is
on making technology central to enabling change.
Vardhman group actively supports the mission of digital
literacy. During the year under review, we took various
initiatives towards computer education and digital literacy.
We explored opportunities to improve digital literacy
among underprivileged children in the societies around
our factories by increasing the access to computers and
digital learning tools. Under this mission we have set up
advanced Computer Labs along with latest Personal
computers and educational software both in educational
institutions and in Govt. Schools. Under the program
we were able to set up 08 Computers labs, provided
75 Computers along other necessary accessories and
softwares.
Computer Labs
08Computer Systems
75
Corporate Overview Statutory Reports Financial Statements Notice 27

Water, Sanitation & Hygiene (WASH)
Sanitation and hygiene are critical to health, survival, and
development. Basic sanitation is described as having
access to facilities for the safe disposal of human waste,
as well as having the ability to maintain hygienic conditions
around our surroundings.
Children have a right to basic facilities such as school
toilets, safe drinking water, clean surroundings and basic
information on hygiene. Water, sanitation and hygiene in
schools creates an enabling environment which secures
children’s dignity, safety, health and attendance in classes.
Children are more receptive and quick to adopt and sustain
change. They become agents of change among their
peers, families and communities. Teachers as influential individuals, supported by the school management
committees, play an important catalytic role.
We have committed ourselves to provide safe drinking
water, clean and hygienic toilets & sanitation facilities
in schools for students and also at public places in the
vicinity of our plant area. We have constructed 17 toilets in
Govt. Schools and 03 Pubic toilets in Madhya Pradesh, HP
and Punjab. We have ensured availability of safe drinking
water in schools and villages by taking initiatives such as
installation of water filter with cooler, bore well and hand pumps in the villages.
Bore wells
03Hand Pumps
05Public Toilets for
General Public
03
Water Cooler with RO
installed in Govt. Schools
16Toilets for Girls & Boys in
Schools
17
Safe water Sanitation Hygiene
Vardhman Textiles Ltd. Annual Report 2017-1828

HealthCare
Health plays a crucial role in transforming people’s lives.
Healthy people can utilize opportunities available to
them. A well-configured and highly resourced health-care system is required to provide basic health services to the
people. Today, the foremost challenge confronting India is
improving its health indicators.
At Vardhman, we have committed ourselves to raising
the standards of and strengthening health-care systems
in the vicinity of our plants. Our need-based projects are
designed to ensure accessible, affordable and effective
health services for all needy and underprivileged sections
of the society.
In FY 2017-18, we have organized Health Checkup Camps
for people living in nearby villages of our manufacturing
units in Himachal Pradesh, Madhya Pradesh and Punjab
Regions. Total 25 medical Health Camps were organized
in 31 Villages, through which more than 4000 villagers
were examined and received necessary medications
Government Health Institutions like Primary Health
Centres, Community Health Centre and Regional hospitals
are the focal points for marginal, needy and general public
to access health services. But still in India there is a huge
gap between private and government health institutions.
Government health institutions lack due to slow system
process, services and non-availability of modern
health equipments and machineries. For strengthening
Government Health Institutions, we have provided modern
technology lifesaving medical equipments in 4 Govt.
Hospitals in MP, 02 Community Health Centres in Baddi,
HP, and 07 Hospitals in Punjab & 01 Hospital in Haryana.
Total 14 Health Institutions get impacted and Medical
equipments worth approx. H 3 crore were distributed in
these hospitals.
Health
Camps
25
States
04
Villages
Covered
31
Health
Institutions
14
Villagers Examined
4000
Worth of medical
equipments & other
facilities
~03 Cr.
Corporate Overview Statutory Reports Financial Statements Notice 29

Environment
We have always been committed towards environmental
sustainability by working in areas such as ecological
balance, protection of flora and fauna, conservation of natural resources, maintaining quality of air, water and soil.
In 2017-18, we conducted various CSR activities under this
including development of bio-diversity parks, restoration
of damaged green area, green area development,
installation of solar street lights etc. The water scarcity is
a common occurrence in MP since last many years.
We always strive to enhance green cover in and around
our factories premises as many projects are undertaken
through CSR initiatives. For example during 2018-19, we
have planted more than 50,000 saplings in MP and HP
region.
In 03 Villages 30 Solar lights installed
04 KM area Green belt developed
~50,000
saplings planted in 30 Acres of Land
Vardhman Textiles Ltd. Annual Report 2017-1830
Corporate Overview Statutory Reports Financial Statements Notice 31
MANAGEMENT DISCUSSION AND ANALYSIS
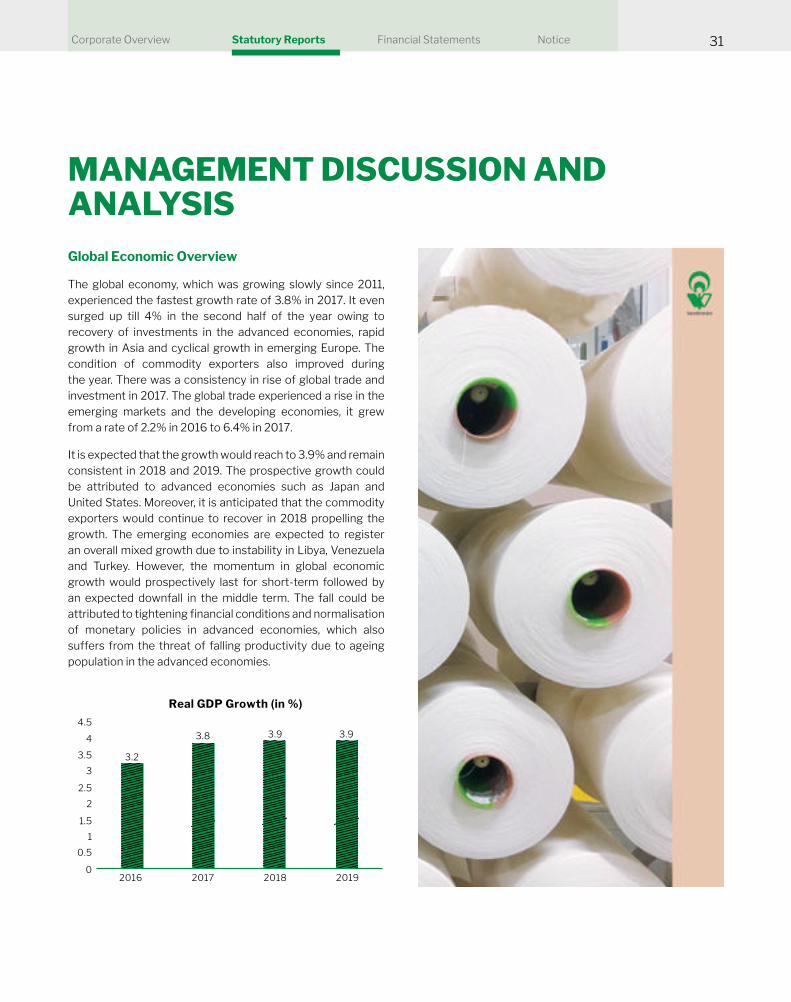
Global Economic Overview
The global economy, which was growing slowly since 2011,
experienced the fastest growth rate of 3.8% in 2017. It even
surged up till 4% in the second half of the year owing to
recovery of investments in the advanced economies, rapid
growth in Asia and cyclical growth in emerging Europe. The
condition of commodity exporters also improved during
the year. There was a consistency in rise of global trade and
investment in 2017. The global trade experienced a rise in the
emerging markets and the developing economies, it grew
from a rate of 2.2% in 2016 to 6.4% in 2017.
It is expected that the growth would reach to 3.9% and remain
consistent in 2018 and 2019. The prospective growth could
be attributed to advanced economies such as Japan and
United States. Moreover, it is anticipated that the commodity
exporters would continue to recover in 2018 propelling the
growth. The emerging economies are expected to register
an overall mixed growth due to instability in Libya, Venezuela
and Turkey. However, the momentum in global economic
growth would prospectively last for short-term followed by
an expected downfall in the middle term. The fall could be
attributed to tightening financial conditions and normalisation of monetary policies in advanced economies, which also
suffers from the threat of falling productivity due to ageing
population in the advanced economies.
Real GDP Growth (in %)
20160
0.5
1
1.5
2
2.5
3
3.5 3.2
3.8 3.9 3.94
4.5
2017 2018 2019

Vardhman Textiles Ltd. Annual Report 2017-1832
Indian Economic Overview
With the current GDP of $2.6 trillion, India is one of the fastest
growing economies of the world. The year experienced a
cyclical growth of 5.7% in the first quarter, followed by a rebound to 6.3% in the second quarter. During the third and fourth quarter, the economy grew at a rate of 7.2% and 7.7% respectively, summing up to an average growth of 6.7% for
the year. The year brought about several reforms from the
government’s end affecting both individuals in general and
industries in particular. Some of the noteworthy reforms
include ‘Goods and Service Tax’ substituting a number of
indirect tax such as Sales Tax, VAT, Excise Duty and many
more and liberalisation of FDI.
In FY19, it is expected that the economy would grow at
a robust rate of 7.4% due to expected rise in industrial
production and exports. The economy would also have to
confront new challenges, which includes managing the
inflationary pressures and increasing burden of debt coupled with high fiscal deficit. Effective implementation of policies to boost consumer demand and private investment could curb
these risks and help in maintaining the growth.
Global Textile Industry
The global textile industry is estimated to be valued at US
$800 billion and is experiencing a growth of 10% since 2012.
Out of the total industry, 40% is captured by textile segments
while the rest is captured by clothing and apparel segment.
Over the last decade, the global textile industry registered
a slow growth owing to impact of turbulence in prices of
raw material especially cotton. Dynamism in global political
environment, events like US Presidential Elections, Brexit and
delay in other government policies such as Free Trade also
played a role in growth slowdown.
CPI Inflation ( jn %)
2017-18*2016-172015-162014-15
5.9
4.94.5
3.3
(Source: Economic Survey of India)

Corporate Overview Statutory Reports Financial Statements Notice 33
Strengths
There is strong potential for growth due to
increase in demand likely to be driven by rise in
proportion of spend on clothing in EMDEs
Recuperation in global demand for luxury
goods segment.
Weakness
Shrinking fashion cycles is driving the risk of
sustainability in the industry.
Oversaturation of the retail space in the context
of digitalization.
Top 10 textile markets
(size of the bubble = textile sales)
Low risk
5-year sales CAGR
Textile spending per capita
15%
10%
5%
0%
-5%
-10%
-15%
$0 $500
India
China
Russia
Brazil
Japan
FranceUK
Germany
USA
Italy
$1,000 $1,500
Medium risk
Sensitive risk High risk
Indian Textile Industry
The domestic textile industry in India stood at US$ 150 billion
in 2017. Textile exports from India is expected to increase to
US$ 82 billion by 2021 from US$ 36.66 billion in FY17. India is
one of the key players of the global textile industry with a broad
base of raw materials and manufacturing strength across the
production chain. The uniqueness of the industry lies in its strength both in the hand-woven sector as well as the capital
intensive mill sector. The Indian mill sector is second largest
in the world with about 3400 textile mills having an installed
capacity of more than 50 million spindles and 842000
rotors. The traditional sector stands as a biggest source of
employment for millions of people across the country.
The industry aligns with the agriculture, culture and traditions
of the country providing a diversified portfolio of products suitable for the domestic and export markets. Overall, the
industry contributes about 7% of industry output in value
terms, 2% of India’s GDP. It also accounts for 15% of the
country’s export earnings and generates employment to
about 45 million people directly.
With the objective of developing in an inclusive and participative
manner, the Government has planned to boost textile
manufacturing by constructing state-of-the-art manufacturing
infrastructure and technology thriving innovation and
enhancing skills and strengthening traditional sector.
Global Textile & Apparel Trade (US$ bn)
20
00
35
0
53
0 610
60
0
710 8
00
100
0
130
0
1400
1200
1000
800
600
400
200
0
20
06
20
08
20
10
20
10
20
14
20
18(E
)
20
18(E
)

Vardhman Textiles Ltd. Annual Report 2017-1834
Textile and apparel industry in India
Government policies
Technology Upgradation Fund Scheme (TUFS): Investment
was made to promote modernisation and up-gradation of the
textile industry by providing credit at reduced rates. H 2,013
crore (US$ 312.29 million) has been allocated for the TUFS
scheme for FY 2017-18, under the Union Budget 2017-18.
A subsidy of H1,400 crore (US$ 216.25 million) was released
under this scheme in 2017.
National Textile Policy – 2000: Key areas of focus include
technological upgrades, enhancement of productivity, product
diversification and financing arrangements. New draft for this policy ensures to employ 35 million by attracting foreign
investments. It also focuses on establishing a modern apparel
garment manufacturing centre in every North Eastern state for which Government has invested an amount of US$ 3.27 million.
SAATHI Scheme: The Union Ministry of Textiles, Government
of India, along with Energy Efficiency Services Ltd (EESL), has launched a technology upgradation scheme called
SAATHI (Sustainable and Accelerated Adoption of Efficient Textile Technologies to Help Small Industries) for reviving the
powerloom sector of India.
Scheme for Capacity Building in Textiles Sector (SCBTS):
The Cabinet Committee on Economic Affairs (CCEA),
Government of India has approved a new skill development
scheme named ‘Scheme for Capacity Building in Textile
Sector (SCBTS)’ with an outlay of H1,300 crore (US$ 202.9
million) from 2017-18 to 2019-20.
The scheme is aimed at providing a demand driven and
placement oriented skilling programme to create jobs in the
organised textile sector and to promote skilling and skill up-
gradation in the traditional sectors.
Opportunities
Growth potential: The Indian textile industry is set for strong
growth, buoyed by both strong domestic consumption as well
as export demand. The sector is expected to reach US$ 226
billion by FY2023. Population is expected to reach to 1.34 billion
by FY2019. Urbanisation is expected to support higher growth
due to increase in demand for cotton and textile products.
Union Budget 2018-19
Under Union Budget 2018-19, Government of India
allocated around H 7,148 crore (US$ 1.1 billion) for the
textile Industry.
H 2,300 crore (US$ 355.27 million) have been allocated
for the Technology Up-gradation Fund Scheme (TUFS).
The government has allocated H 112.15 crore (US$ 17.32
million) towards schemes for powerloom units.
The government has allocated H 30 crore (US$ 4.63
million for the Scheme for Integrated Textile Parks, under
which there are 47 ongoing projects.
The handloom clusters under the National Handloom Development Programme will get H 396 crore (US$ 91.17
million) and the Integrated Processing Development
Scheme will get H 3.8 crore (US$ 0.59 million).
Growth drivers
Increase in disposable income: The per capita net national
income during 2017-18 is estimated to be H 1,11,782
showing a rise of 8.3 per cent as compared to H 1,03,219
during 2016-17. The increase in income would improve
the general standard of living, which in turn would further
propel demand for textile goods. (Source: ET)
Growing urban population: According to World Bank,
urban population accounts for 32.7 per cent of the total
population of India. This also works as demand driver due
to changing taste and preferences in the urban part of
India.
Expanding middle class: Domestic consumption is a
vital driver of India’s growth engine, primarily owing to
the country’s large population and an expanding middle
class—key driver of apparel demand. A rising middle class
with higher disposable incomes, aided by favourable
Size (USD Billions)
2009
70 78 89 99 109
137 150
226
2010 2011 2014 2015 2016 2017 2023*
(Source: Ministry of Textiles)
* Estimated

Corporate Overview Statutory Reports Financial Statements Notice 35
demographics, burnish the textile industry’s prospects
significantly. As per NCAER, India’s middle class will more than double from 2015-16 levels to 113.8mn households
or 547mn individuals by 2026, entailing humungous
growth opportunities for the textile sector.
Exports gaining momentum: The strong performance of
textile exports is reflected in the value of exports from the sector over the years. Textile exports witnessed a growth
(CAGR) of 6.89 per cent over the period of FY06 to FY17. In
the coming decades, Africa and Latin America could very well
turn out to be key markets for Indian textiles. This is going to
boost the production of the textile sector in the coming years.
Global Cotton Scenario
In 2017-18, the global cotton production witnessed higher
production over the cotton consumption after a gap of two
consecutive preceding years when the cotton consumption
was higher than production. During the year, the cotton
production is estimated to be about 26.63 million tons against
the 23.07 million tons, increasing by more than 15% from the
previous year, owing to higher area under cotton cultivation by
leading cotton producing countries like India, China, USA, Brazil
and Pakistan which resulted in to increased cotton production.
The area under cotton cultivation has surged by about 16%
from 29.87 million hectares to 34.64 million hectares. However,
production of Australia improved exclusively on account of
increased yield of about 31% from the last year (1600 kgs/
hectare in 2016-17 to 2088 kgs per hectare in 2017-18). Overall,
average yield of the global cotton has remained more or less
same as compared to the last year.
Country wise increase in production of leading cotton producing
countries in the year 2017-18 over the year 2016-17 is as under:
The global cotton consumption in the year 2017-18 increased by
6.7% to 26.15 million tons against the 24.52 million tons in the year
2016-17. In 2017-18, consumption surged in the leading cotton
consuming economies like China, India, Pakistan, Bangladesh
and Vietnam. The increase in the cotton consumption could be
attributed to increase in demand of cotton.
World cotton closing stocks in the year 2017-18 is estimated
to be rise by about 0.5 million. Such increase in the closing
stock is estimated to be happened in the rest of the world
except China, whose closing stocks is estimated to shrink to
9.10 million tons from 10.63 million tons.
Outlook
For the year 2018-19, Global area under cotton is likely to decline
by 2.3% to 33.85 million hectares and production is likely to
decline by 2.6% to 25.94 million tons against the 26.63 million tons
in 2017-18. Major reduction in production is projected for the USA
because of the drought like conditions prevailing in Texas which is
the largest producing region of the USA and in China because of
reduction in area under cotton cultivation by 5%.
World cotton consumption is projected to increase by about
1.3 million tons to 27.42 million tons against the 2017-18
estimates of 26.15 million tons mainly because of growing
demand across Asian and South Asian economies. This will
result in to reduction of world closing stocks by 1.5 million tons
from 19.28 million tons in 2017-18 to 17.80 million 2018-19.
Indian Cotton Industry
Cotton is one of the primary crops of the country and a major
raw material for Indian textile industry. Starting from its
cultivation to its trading, the industry provides employment
to about 35 millions of people directly and almost a similar
number in other allied agriculture industry & trade. In the
textile industry in India, the ratio of use of cotton to man-made
fibre and filament yarn is 60:40. Presently, it cultivates in three regional zones I.e. Northern Zones which consists of States of Punjab, Haryana and Rajasthan; Central Zone which consist of States of Madhya Pradesh, Gujarat, Maharashtra and Orissa;
Southern Zone comprising of States of Telangana, Andhra Pradesh, Karnataka and Tamil Nadu. Parts of Uttar Pradesh, West Bengal, and Tripura are also used for the cultivation.
Around 62% of India’s Cotton is produced on rain-fed areas
and the rest 38% on irrigated lands.
In FY 2017-18, the area under cotton cultivation has surged
by 15% at about 124.44 lakh hectares against the 108.26 lakh
hectares as compared to a year ago, owing to an increase in
1200
1000
800
600425
990
817
429
132 153
400
200
Ind
ia
Ch
ina
US
A
Bra
zil
Pa
kis
tan
Au
str
ali
a
0
Change in production of leading cotton producing countries
Inc
rea
se
d p
rod
uc
tio
n in
th
ou
sa
nd
to
ns
(Source: ICAC (International Cotton Advisory Board))

Vardhman Textiles Ltd. Annual Report 2017-1836
area under cultivation in Indian cotton producing states The
increase in area under cotton cultivation occurred due to
better profitability to the farmers in last year in the cotton crop against the alternative crop. Consequently, cotton production increased from 345 lakh bales to about 370 lakh bales in the
year 2017-18. However because of the pest attacks in certain
areas of Maharashtra, Telangana and Andhra Pradesh, all
yield of the cotton remained lower by 6.8% at about 505 kgs/
hectare against the 542 kgs/ hectares in the year 2016-17.
During FY18, Indian cotton industry had an opening stock of
around 43.8 lakh bales. With a better production of 370 lakh
bales over the last year and estimated imports of about 15 lakh
bales country will be having total supply of 428.8 lakh bales.
With an overall consumption of around 315.5 lakh bales and
an estimated exports of 70 lakh bales, the country is expected
to be left with a closing stock of about 43.3 lakh bales similar
to the previous year.
Indian cotton demand & Supply:
SUPPLY 2016-17 2017-18
Opening Stock 36.4 43.8
Crop 345.0 370.0
Import 30.9 15.0
TOTAL SUPPLY 412.4 428.8
DEMAND .
Mill Consumption 262.7 268.0
S.S.I Consumption 26.2 27.0
Non Textile Consumption 21.5 20.5
Export 58.2 70.0
TOTAL DEMAND 368.6 385.5
Closing Stock. 43.8 43.3
* - As estimated by CAB (Cotton Advisory Board) in its last meeting held on
16.06.2018

Corporate Overview Statutory Reports Financial Statements Notice 37
Outlook
In FY 2017-18, Indian farmers found cotton more profitable as compared to its alternative crops. The Indian Meteorological Department has predicted normal monsoon in the year 2018-19, an indication for the farmers to sow more cotton crop. Monsoon had already arrived in the many cotton growing regions of the country. Moreover the latest government announcement of the surging the Minimum support prices for the cotton by H 1,130 per quintal would encourage the farmers to sow more cotton crop. In FY19, the area under cotton cultivation has been forecasted to reach around 120 lakh hectares.
During the year, Indian farmers were better aware of the pest management due to past experiences. The awareness of Indian farmer against the pest attack coupled with the prediction of normal monsoon by the Indian government, the yield of Indian cotton is likely to improve resulting in increased production beyond 380 bales in FY19.
Financial Overview
Gross revenues
Gross revenues increased by 2.8% to H 5,851 crore in
2017-18, compared with H 5,690 crore reported in 2016-17.
Operatingprofit
Operating profit (EBITDA) decreased to H 1,043.62 crore during 2017-18 from H 1,759.43 crore in 2016-17, largely because of extraordinary income in 2017 on account of stake sale in VYTL (gain H 313.01 crore), gain on transfer of Hoshiarpur assets to VTYL H 52.80 crore and gain on tendering shares of VAL under the share buyback offer amounting H 36.38 crore and also due to decline in operating margins as a result of increase in cotton prices.
Netprofit
Net Profit for the year under review stood at H 545.76 crore, a 45.50% decrease from the previous financial year for the reasons explained here in before.
Net worth
The Company’s net worth stood at H 4,631.96 crore as on 31st March, 2018, increasing by 16.21%, compared with H 3,985.83 crore as on 31st March, 2017. The net worth comprised of paid-up equity share capital amounting to H 57.43 crore as on March 31, 2018 (5,74,33,460 equity shares of H 10 each fully paid up) and Company’s reserves and surplus of H 4,574.53 crore.
Total assets
The Company’s total assets increased to H 2,608.12 crore in 2017-18 from H 2,499.95 crore in 2016-17, representing an increase of 4.32%.
Outlook
The Company is planning to increase its production capacity by 2020. In FY 2017-18 it spent about H 300 crore as capex out of which H 105 crore was towards Yarn while the rest was for Fabric. The company is intending to invest about H 1,400 crore between FY2018-19 & 2019-20 as capex, to be segregated equally between Yarn and Fabric. The investment would be strategically used to add approximately 1,00,000 spindles. The company is also expanding its total fabric capacity from 140 million metres per year at present to 180 million metres by FY19-20. Although the additional production lines are estimated to be ready by February / March 2019, it would take time to utilise them optimally and the full year impact of the same would be seen only in the next financial year i.e. FY19-20.

Vardhman Textiles Ltd. Annual Report 2017-1838
BUSINESS RESPONSIBILITY REPORT
About Vardhman
Vardhman Textiles Limited (VTXL) is the flagship company of Vardhman Group with diverse operations across sectors. Vardhman‘s humble beginning dates back to 1962 when it started its manufacturing location at Ludhiana in the State of Punjab with 6000 spindles and is today one of the largest textile companies of India manufacturing Cotton Yarns & Fabrics with a capacity of over 1.10 million spindles, constituting about 2% of the country’s yarn production, 1276 looms for weaving of fabrics and 140 Million Meter per annum of fabrics processing capacity.
Through its integrated operations across textile value chain from Cotton to Fabric and to Garments, it touches lives of millions of our associates and assures quality product and services to its customers.
SECTION A: GENERAL INFORMATION ABOUT THE COMPANY
1. Corporate Identity Number (CIN) of the Company : L17111PB1973PLC0033452. Name of the Company : Vardhman Textiles Limited3. Registered address : Vardhman Premises, Chandigarh Road, Ludhiana- 141010.4. Website : www.vardhman.com5. E-mail id : [email protected]. Financial Year reported: 2017-187. Sector(s) that the Company is engaged in (industrial activity
code-wise): Textiles, NIC Code 131
8. List three key products/services that the Company manufactures/provides (as in balance sheet)
: Yarn and Fabric
9. Total number of locations where business activity is undertaken by the Company
(a) Number of International Locations (Provide details of major 5) : 0
(b) Number of National Locations : 17
10. Markets served by the Company – Local/State/National/International
: National / International
SECTION B: FINANCIAL DETAILS OF THE COMPANY
1. Paid up Capital (INR) : H57.43 crore
2. Total Turnover (INR) : H5851.37 crore
3. Total PAT (INR) : H545.76 crore
4. Total Spending on Corporate Social Responsibility (CSR) as percentage of profit after tax (%) : 2.73%
5. List of activities in which expenditure in 4 above has been incurred: Refer to Summary of CSR initiatives on page 62-64
About This Report
The Securities and Exchange Board of India (SEBI) as per its (Listing Obligations and Disclosure Requirements) Regulations, 2015 has mandated the inclusion of a “Business Responsibility Report” (BRR) as part of Company’s Annual Report for top 500 listed entities based on market capitalization at the Bombay Stock Exchange Ltd. (BSE) and the National Stock Exchange of India Ltd. (NSE). The reporting framework is based on the ‘National Voluntary Guidelines on Social, Environmental and Economic Responsibilities of Business (NVGs)’ released by the Ministry of Corporate Affairs, Government of India, in July 2011 which contains 9 Principles and Core Elements for each of the those 9 Principles. Following is the first Business Responsibility Report of our Company based on the format suggested by SEBI. Detailed Business Responsibility Report for 2017-18 (available at: www.vardhman.com/) is also based on the 9 Principles enshrined in the NVGs.

Corporate Overview Statutory Reports Financial Statements Notice 39
SECTION C: OTHER DETAILS
1. Does the Company have any Subsidiary Company/ Companies? Yes
2. Do the Subsidiary Company/Companies participate in the BR Initiatives of the parent company? If yes, then indicate the number of such subsidiary company(s) : No
3. Do any other entity/entities (e.g. suppliers, distributors etc.) that the Company does business with, participate in the BR initiatives of the Company? If yes, then indicate the percentage of such entity/entities? [Less than 30%, 30-60%, More than 60%] : No
SECTION D: BR INFORMATION
1. Details of Director/Directors responsible for BR : The Board Business Responsibility Committee is responsible for the implementation of the BR policies.
(a) Details of the Director/Director responsible for implementation of the BR policy/policies
1. DIN Number : 00340459
2. Name : Mr. Neeraj Jain
3. Designation : Jt. Managing Director
(b) Details of the BR head
S.
No.
Particulars Details
1 DIN number (if Applicable)
00340459
2 Name Neeraj Jain
3 Designation Jt. Managing Director
4 Telephone number 0161-2228943
5 Email id [email protected]
Corporate Governance for Ethics, Transparency and Accountability
PRINCIPLE 1
4PRINCIPLE
Stakeholder Engagement
7PRINCIPLE
Responsible Advocacy
2PRINCIPLE
Sustainability of Products & Services across Life-cycle
5PRINCIPLE
Human Rights
8PRINCIPLE
Supporting Inclusive Growth and Equitable Development
3PRINCIPLE
Employee Well-being
6PRINCIPLE
Protection and Restoration of the Environment
9PRINCIPLE
Providing Value to Customers and Consumers

Vardhman Textiles Ltd. Annual Report 2017-1840
Sr.
No
Questions P1
Ethics,
Transparency &
Sustainability
Accountability
P2
Sustainability
in life-cycle
of products
P3
Employee
Well Being
P4
Stakeholder
engagement
P5
Promotion
of human
rights
P6
Environment
Protection
P7
Responsible
Advocacy
P8
Inclusive
Growth
P9
Customer
Value
1. Do you have policies for: Y Y Y Y Y Y Y Y Y
2. Has the policy been formulated in consultation with the relevant stakeholders?
Y Y Y Y Y Y Y Y Y
3. Does the policy conform to any national /international standards? If yes, specify?
NA Y
ISO
14001:2015
OHSAAS 18001:2007
Y
OHSAS 18001:2007
Y
OHSAS 18001:2007
Y
OHSAS 18001:2007
Y
ISO
14001:2015
OHSAS 18001:2007
N Y N
4. Is it a board approved policy?If yes, has it been signed by MD /owner /CEO /appropriate Board Director?
Y, BOD Y, CEO Y, BOD Y, BOD N Y, CEO N Y, BOD N
5. Does the Company have a specified committee of the Board/Director/Official to oversee the implementation of the policy?
Y Y Y Y Y Y N Y N
6. Indicate the link for the policy to be viewed online
Refer below
7. Has the policy been formally communicated to all relevant internal and external stakeholders?
Y Y Y Y Y Y Y Y Y
8. Does the company have an in-house structure to implement the policy?
Y Y Y Y Y Y Y Y Y
9. Does the Company have a grievance redressal mechanism related to the policy to address stakeholders’ grievances related to the policy?
Y Y Y Y Y Y N Y Y
10. Has the company carried out independent audit /evaluation of the working of this policy by an internal or external agency?
N Y Y N Y Y N N N
2. Principle-wise (as per NVGs) BR Policy/policies (Reply in Y/N)
(b) If answer to the question at serial number 1 against any principal, is ‘No’, please explain why: (Tick up to 2 options)
3. Governance related to BR
(a) Indicate the frequency with which the Board of Directors, Committee of the Board or CEO to assess the BR performance of the Company. Within 3 months, 3-6 months, Annually, More than 1 year
Annually
(b) Does the Company publish a BR or a Sustainability
Report? What is the hyperlink for viewing this report? How frequently it is published?
Yes, the hyperlink for viewing the same is https://www.vardhman.com/user_files/investor/BRR.pdf. It is published annually in the Annual Report.
Sr.
No
Questions P1 P2 P3 P4 P5 P6 P7 P8 P9
1 The company has not understood the Principles2 The company is not at a stage where it finds itself in a position
to formulate and implement the policies on specified principles3 The company does not have financial or manpower resources
available for the task4 It is planned to be done within the next 6 months5 It is planned to be done within the next 1 year6 Any other reason (please specify)
------
------
------
NA --
------
------
----

Corporate Overview Statutory Reports Financial Statements Notice 41
We are committed to adopting the best corporate governance practices as manifested in the company’s functioning to achieve business excellence by enhancing the long term shareholder’s value. Efficient conduct of the business of the company through commitment to transparency and business ethics in discharging its corporate responsibilities are hallmarks of the best practices being followed at Vardhman.
The composition of the Board of Directors of the company is governed by the Company’s Act 2013 and SEBI Regulations 2015. As on March 31, 2018, the Company has 11 directors on its board (including the Chairman), of which 6 are independent, 3 are non-independent, and 1 is non-executive non-independent director.
To ensure accountability and monitoring, the Board has constituted various committees such as: Audit Committee, Nomination & Remuneration Committee, Corporate Social Responsibility (CSR) Committee and Stakeholders’ Relationship Committee. The committees meet periodically during the year to supervise, review performance and advice on the necessary direction to be taken.
Code of Conduct: Vardhman has its Code of Conduct which extends to all directors and senior employees of Vardhman which aims at maintaining highest standards of business conduct in line with the Ethics of the Company, provides guidance in difficult situations involving conflict of interest & moral dilemma and ensures compliance with all applicable laws. All senior employees have to read and understand this code and agree to abide by it.
The policy code of conduct is available at the company website at the link https://www.vardhman.com/investor-desk#!company_information with the name Policies- Code of Conduct.
Vigil Mechanism/ Whistle Blower Policy: The Vigil Mechanism of the Company, which also incorporates a whistle blower policy in terms of the Uniform Listing Agreement aims to provide a channel to the employees and Directors to report to the management concerns about unethical behavior, actual or suspected fraud or violation of the Codes of Conduct or policy. The mechanism provides for adequate safeguards against victimization of employees and Directors to avail of the
Sustainability
The Vardhman group’s brand and position in the society, brings with it, both responsibilities and opportunities to make the world a better place. Our global presence gives us an encumbrance to create sustainable business models that are environment friendly and in compliance with the national laws & international standards. The Group has evolved in the field of sustainability with its diversified initiatives in several directions.
Under the “Vardhman Sustainability Drive”, the Group in addition to many on-going initiatives, has substantially augmented efforts in the field of Environment, Healthcare and Safety.
Rural Development
Under the Better Cotton Initiative, Vardhman Textiles collaborated with Punjab Agricultural University to study the techniques and conditions of farming which gave birth to the Village Adoption Program that started with one village and slowly increased to 95 Villages. Under this program Farmers could achieve 60 % higher yield than national average.
Responsible sourcing of Raw Material from Villages:
Cotton being a natural fibre which needs to be produced sustainably year after year without affecting the nature and fertility of land.
There are programs like Better Cotton Initiative, Organic Cotton, Fair-trade Cotton, Cotton Made in Africa, Cotton lead (USA Cotton) Recycle Cotton which have common goals viz., improving environment, decent working conditions, sustainable prices, increased financial profitability of farmers, optimum use of water, improved soil health and biodiversity.
Vardhman is part of several sustainable cotton programs being run by the Global stakeholders. Vardhman’s share of sustainable cotton sourcing is more than 10% of overall cotton purchase.
SECTION E: PRINCIPLE-WISE PERFORMANCE
Corporate Governance for Ethics, Transparency and Accountability
PRINCIPLE 1
PRINCIPLE 2
mechanism and also provide for direct access to the Chairman/ Chairman of the Audit Committee in exceptional cases.
The vigil Mechanism/ whistle blower policy is available at the company’s website at the following link: https://www.vardhman.com/investor-desk#!company_information with the name Policies- Vigil Mechanism.
Sustainability of Products & Services across Life-cycle

Vardhman Textiles Ltd. Annual Report 2017-1842
Company is associated with Organic program in year 2004 and certified in Organic Yarn certification as GOTS (Global Organic Textile Standard), OCS (Organic content Standard), GRS (Global Recycle Standard).
Out of total buying of 42000 MT of man-made fibres and filaments 60% is covering from sustainable sources. In this either product is sustainable or the manufacturing process of suppliers is sustainable.
Almost all the cellulose fibres which are made from Wood pulp are sustainable and certified under FSC programs. Wood Cutting being done by suppliers is under sustainable processes. There are many other new products coming for developments which are sustainable in nature.
Project Pragati
We became a member of BCI in 2011 and became its implementing partner in Gujarat in 2015. At present, total project covers 10054 farmers on land of 18230 hectares in 51 villages.
In this project, company follows seven principles as per global definition of Better Cotton:
* BCI Farmers minimize the harmful impact of crop protection practices
* BCI Farmers promote water stewardship
* BCI Farmers care for the health of the soil
* BCI Farmers enhance biodiversity and use land responsibly
* BCI Farmers care for and preserve fibre quality
* BCI Farmers promote decent work
* BCI Farmers operate an effective management system
Starting with just one producer unit and 1758 farmers, we today have 3 producer units with 9456 farmers associated with us.
2015 2016 2017
1 Producer Unit 3 Producer Units 3 Producer Units9 Villages 47 Villages 48 Villages1758 Farmers 8327 Farmers 9456 Farmers
47 LGs 223 LGS 252 LGS3787 Hectares 14719 Hectares 15973 Hectares1 Year License 3 Year License UndergoingProduction of
23000 BCI BalesProduction of
60000 BCI BalesProduction of
75000-80000
BCI Bales
Under project Pragati, we train the farmers on various topics like pre-sowing, nutrient management, water management, pest & disease management, fibre quality & contamination etc., through group meetings, projectors & print material by specialists from Junagadh Agricultural University.
Such initiatives of ours have encouraged more and more farmers to get associated with us.
Water
Being on top of the essential requirements and an indispensable resource for any society, water has been our major priority in terms of sustainability measures undertaken by us.
Water Treatment
As a responsible organization, Vardhman has been always ahead in terms of technology when it comes to our Effluent treatment plants (ETPs) and Sewage treatment plants (STPs) which are 2 & 8 in numbers respectively. The effluent from four of the plants is getting treated through Common Effluent Treatment Plant (CETP).
Water Recycle and Reuse
100% recycling and zero waste: We have Zero Liquid Discharge (ZLD) System Installation at our largest integrated facility at Budhni. Due to this, annual saving of raw water is 216 Lac KL. The ETP’s and STP’s annually treat about 80 lacs KL & 6.7 lacs KL water respectively. The treated water is reused and recycled which saves 29.8 lacs KL water annually.
Our considerable achievement this year has been 100% reuse of STP treated water at all of our units. We have reached such levels of STP treatment that the treated water is being used in the process, irrigation or toilet flushing.
Water Recharge
We are focused on recharging maximum rain water in to the ground since 2005. We have set up 52 Rain Water Harvesting Systems (RWHS) within our premises. Rain water is directed from roof tops through channels and then collected in a collection pit with filter. Through this, the water is recharged into the ground through bore holes. Every year we recharge approximately 120,000 KLs of water.
Energy Conservation
Towards Conservation of energy, we have moved on to recycling and generating alternative sources of energy in 2017-2018.

Corporate Overview Statutory Reports Financial Statements Notice 43
Electricity being the major input, we implemented the approach of “Less input, more output”. This includes reforms as small as replacement of high voltage consumption lamps with LED lights extending to the usage of latest and modern machines at units for minimum energy consumption giving maximum output in a given period. This has in-turn given us a better profitability as well.
Moving ahead, we have taken the following additional steps at operational level in the year 2017-18:-
* Installation of variable Frequency Drives for Supply & Return Air Fans and water spray pumps of Humidification Plants.
* Installation of APFC Panels to improve power factor.
* Installation of AC drives on suction fan of KTTM and Auto Coner Winding Machines to maintain the required suction pressure.
* Replacement of old power in-efficient distribution transformers with energy efficient ones.
* Replacement of conventional blowers with energy efficient blowers in ETP plants.
* Optimization of compressed air consumption by controlling leakages and modification of air distribution system
* Replacement of old pumps & motors with energy efficient ones
* Laying of additional LT cables to bring down the voltage drop
Renewable Energy
We have taken two major initiatives for use of renewable energy and solid waste management:
* Biogas plants
* Composting
We have been able to reduce our food waste generation by installing Bio-gas plant at two of our locations viz; Auro Textiles, Baddi & Vardhman Fabrics, Budhni. Each installation has a capacity of 5 MT/day and produces 80 kg/day bio-gas which is utilized in canteens and mess.
Apart from the above two campuses, a composting system has been set up at Ludhiana for kitchen waste wherein the manure generated is being used for management of green areas at our premises.
Solar Power
We foresee a good scope of natural energy utilization in the area of Solar Power which we shall be further emphasizing in the coming year.
For the use of solar power as a source of energy for non-factory operations, Vardhman shall make desired investments in order to make maximum contribution to the energy conservation pledge of the Group.
An inception in this regard has already been made by us in our MP region units where Solar Kitchen Automation equipment is being used for cooking that saves approximately H 3.6 lacs worth LPG annually. Solar water heaters are being used in several hostels and residential campuses across the Group.
Air
The quality of Air that we breathe in has always received equal attention by Vardhman when we talk of sustainability. We have taken effective steps to control air emissions arising out of plant operations as well as kitchens.
* Reduction in GHGs: Practices are adopted to reduce other greenhouse gases such as methane, water vapor, nitrous oxide etc.
* Sequestration: Measures are taken to sequester carbon dioxide by promoting forestry, afforestation, tree plantation, or the planting of any kind of vegetation as trees and plants help in the sequestration of carbon dioxide.
Tree plantation has been our focus in the year gone-by wherein we have encouraged our employees to create a green environment.
Under the 6 crore sapling plantation drive of Govt. of Madhya Pradesh on 2nd July 2017- Guinness book of world record attempt, Vardhman contributed by planting 34,500 trees in Budhni.
In the past few years, Vardhman has done over 3.5 lac+ plantations.

Vardhman Textiles Ltd. Annual Report 2017-1844
In a world where everything else is equal, human effort makes all the difference. We place immense value on our workforce and consider it our biggest, most valuable asset. At Vardhman, we have a culture of empowerment that values and respects individual potential and helps each one achieve it to the fullest. Our people own their jobs and not just perform them. We continuously strive to improve quality of work-life for total job satisfaction and social harmony for the employees.
1. Please indicate the Total number of employees. 22939 (Including contractual manpower).
2. Please indicate the Total number of employees hired on temporary/contractual/casual basis. 2020
3. Please indicate the Number of permanent women employees. 4947 (does not include 466 contractor female employee)
4. Please indicate the Number of permanent employees with disabilities 57
5. Do you have an employee association that is recognized by management? No
6. What percentage of your permanent employees is members of this recognized employee association? NA
7. Please indicate the Number of complaints relating to child labour, forced labour, involuntary labour, sexual harassment in the last financial year and pending, as on the end of the financial year.
No. Category No of
complaints
filed during the financial year
No of
complaints
pending as
on end of the
financial year1 Child labour/
forced labour/involuntary labour
Nil Nil
2 Sexual harassment
Nil Nil
3 Discriminatory employment
Nil Nil
8. What percentage of your under mentioned employees were given safety & skill up-gradation training in the last year?
Vardhman recognizes employees, Local communities surrounding our operations, business associates (marginalized farmers, network of suppliers, agents and dealers), customers and shareholders/investors as our key stakeholders.
Vardhman identifies communities (with a focus on women and children from these communities) around our manufacturing facilities and small farmers in our inbound supply chain as disadvantaged, vulnerable & marginalized stakeholders.
Vardhman regularly undertakes initiatives to serve the interest of its disadvantaged, vulnerable and marginalized stakeholders. These are briefly described below:
Stakeholder
group
Initiatives
Employees Our Employee policies safeguard employees against any kind of discrimination based on caste, religion, geography, educational or social background, gender etc.
Employee Well-being
PRINCIPLE 3
Stakeholder Engagement
PRINCIPLE 4
(a) Permanent Employees 70%
(b) Permanent Women Employees 72%
(c) Casual/Temporary/Contractual Employees 66%
(d) Employees with Disabilities- 55%
The policies on the principle of Employee well-being are available on the company’s website at the following Child Labour- https://www.vardhman.com/user_files/investor/policy%20on%20Prohibition%20of%20Child%20Labour.pdf
Anti-Sexual- https://www.vardhman.com/user_files/investor/Anti%20Sexual%20Harassement%20Policy.pdf
Bonded Labour- https://www.vardhman.com/user_files/investor/Forced%20Bonded%20Labour%20Prohibition.pdf:-

Corporate Overview Statutory Reports Financial Statements Notice 45
Stakeholder
group
Initiatives
We believe in the continuous people development through investment in the training & development of our employees even in adverse business times.
Women who form 24% of our workforce are given ample opportunities to accept greater roles at work and are treated with utmost respect. Ensuring the safety of women employees is a top priority for Vardhman.
Local Communities around our
manufacturing Locations
Development and deployment of need-based community programs in the areas of health, education, skill development, sanitation, livelihood etc. as part of Corporate Social Responsibility (CSR) initiatives.
Business associates
Direct engagement with small and marginal farmers and providing free technical advice to them for improving yield of their cotton crop through deploying better farming methods. This provides an avenue for sustainable livelihood generation and capacity building for small farmers.
We educate our agents about the new products and industry scenario and engage them in both formal and informal ways as they are the extended arms of Vardhman.
Once in every two years we invite our dealers in customer meet and recognize their efforts in growing sales.
Customers We provide a dedicated sales team to ensure pre to post sale services to our customer. Post sale service ensures smooth usage of our products and problem solving through a partnership approach has helped us forge long lasting relationships with our customers
Human Rights
PRINCIPLE 5
Protection and Restoration of the Environment
PRINCIPLE 6
We subscribe fully to the basic tenets of human rights as defined in our Constitution. We adhere to the human rights principle of dignity of workforce regardless of the nation, location, language, religion, ethnic origin or any other status of any person.
We have placed grievance redressal mechanisms in every manufacturing unit and we try to ensure a harassment free work environment along with workplace health and safety. A Labour Welfare Officer is placed in every manufacturing unit who is available in the plant round the clock to take care of ensuring the basic amenities to workers. Communication meetings between workers and senior officials are regularly conducted to redress the grievance of workers and maintain harmonious relations between the management and workers.
Prime importance is given towards maintaining better working condition in the plants to take care of the health & safety of employees. We are certified under OHSAS 18001 by NSAI.
No complaint was received pertaining to human rights violation during the past financial year.
1. Vardhman’s Environment, Health and Safety policy extends to all its group companies and manufacturing units.
2. Climate change, global warming and environmental degradation pose unique challenges as well as opportunities for Vardhman. We are continually investing in new technologies, implementing process improvements and innovating. To make progressive strides and guide us in our endeavor, we have deployed a dedicated team for devising and implementing strategies for managing these risks and opportunities. Few of the steps taken in this regard, are:
a) Effluent Treatment of all our industrial effluent either through our own ETP or CETP.
b) Zero Liquid discharge (ETP, RO, MEE) system at one of our units for recycling of treated water for process usage.
c) Sewerage Treatment Plant for the treatment of domestic sewage at all the sites.
d) Utilization of treated ETP & STP water for process, gardening & flushing activities.
e) Disposal of hazardous solid waste generated at CPCB/PCB authorized disposal facility only.
f) Using the best of rainwater harvesting practices within the industry premises to ensure ground water recharge.

Vardhman Textiles Ltd. Annual Report 2017-1846
Responsible Advocacy
PRINCIPLE
7
Vardhman is a member of several industrial and trade associations. These are listed as under:
a. Confederation of Indian Industries (CII);
b. Federation of Indian Chamber of Commerce and Industries (FICCI);
c. PHD Chamber of Commerce and Industries (PHDCCI);
d. Confederation of Indian Textile Industry (CITI);
e. Texprocil; etc.
Being an industry-house, our major areas of concern are those public policies which deals with industry/business. Therefore, most of the time, our submissions are related to economic
g) All the boiler flue gases are passed through the bag filter and/ or scrubber units.
These steps lead towards reduction of raw water consumption, effluent generation, solid-waste generation, hazardous waste generation and Green House Gases emissions and help to reduce the overall impact on our natural resources and environment.
2. Vardhman identifies and assess potential environmental risks and provide training to employees.
3. We have group-wise facilities for proper management of e-waste, spent oil, and ETP sludge. All these hazardous waste are stored & maintained as per the compliance requirement and are disposed off through authorized recycler.
4. Vardhman has not registered any project related to Clean Development Mechanism project
5. Vardhman has taken various initiative e clean and sustainability initiatives such as:
* Clean Technology: We have been able to decompose food waste generated from Colony, Canteen & Hostels by installing Bio-gas plant at two of our locations (Auro Textile & VF Budhni). It produces 80 kg/day bio-gas which is utilized in canteens and mess.
In MP region, Solar Kitchen Automation equipment’s is used for cooking. Solar water heaters are being used in hostels and campus.
* Energy Conservation: Energy efficiency initiatives such as switching to more efficient HVAC, lighting, and computing systems have been adopted. Replacement of florescent T8 (36 W) tube lights with T5 (25W) tube lights; Replacement of old motors with premium efficiency IE3 motors; Replacement of HPSV lamps with energy efficient LED street lights on boundary and road lighting; Conversion of electrical heating to steam heating in machines etc.
* Reduction in water use: We have been able to reduce our water usage by regular metering, monitoring and controlling of utilities consumption at all our sites.
* Water conservation: We have 52 Rain Water Harvesting Systems by which an annual recharge of approx 1,20,000 KL of water is done to the ground.
Reduction in office waste: Initiatives include installing jet hand dryer in washroom to reduce tissue paper waste.
* Reduce food waste: We used organic composter (Aaga System) to compost food waste from canteens, hostels and mess to use it as organic manure for green belt within the premises.
* Awareness Programme: Earth Day, Environment Day Environment Week and Water Saving Week which includes various activities like; Tree Plantation, Drawing Competition, Slogan Competition, Speech Competition etc. are celebrated.
* Plantations: Every year Vardhman Group undertake plantation drives to increase green area around our factories. In Madhya Pradesh and Himachal Pradesh, we have planted more than 50,000 saplings near our facilities.
* All the group units of Vardhman is certified now certified by the revised ISO 14001: 2015 and currently planning for the certification for the ISO 45001:2018 which will replace OHSAS 18001: 2007 (Occupational Health Safety Assessment Series).
6. All the emissions are within the permissible limit of State and Central Pollution Control Board.
7. There is no show cause/legal notices received by our units. Company’s EHS policy is available on the website at the link https://www.vardhman.com/user_files/investor/EHS%20Policy.pdf.

Corporate Overview Statutory Reports Financial Statements Notice 47
policy changes and other issues, which affect the sustainability and competitiveness of the industry.
These platforms are utilized to update the industry concerns to the relevant government offices through seminars, delegations and memorandum. Through these forums, we also provide our inputs sought by the State & Central Governments from time to time related to current problems faced by the industry, future prospects and policy imperatives required to overcome bottlenecks.
These forums are used to advance the cause of the industry and are not used to take up company specific issues.
Supporting Inclusive Growth and Equitable Development
PRINCIPLE 8
1. Vardhman supports the principles of inclusive growth and equitable development through its core business as well as its corporate social responsibility initiatives.
Vardhman believes in being an equal opportunity employer. We offer equal roles and responsibility to women employees.
The company has a detailed CSR policy in place and the CSR activities are monitored by Board appointed CSR committee. The key focus areas of Vardhman’s CSR programs are promotion of education, preventive healthcare, rural development, skill enhancement, Environment protection and other areas as defined in Schedule VII of the Companies Act 2013.
2. The major CSR programs are being pursued in the areas in close proximity to our manufacturing locations so as to enable supervision and maximum developmental impact. Programs under this principal are developed and executed by:
a. In-house teams for awareness building and contract farming projects with small and marginalized farmers and local communities.
b. Trusts for community development initiatives around our manufacturing facilities in Punjab, Himachal Pradesh, Madhya Pradesh and Gujarat.
c. Other organizations- we also collaborate with other public and private organizations like hospitals etc. to provide healthcare initiatives to the underprivileged sections of the society.
3. Vardhman internally performs an impact assessment of its initiatives at the end of each year to understand the efficacy of the program in terms of delivery of desired benefits to the community and to gain insights for improving the design and delivery of future initiatives.
4. Vardhman’s contribution towards community development projects carried under its CSR policy during the reporting period (2017-18) is H14.93 crore.
Few of the CSR initiatives are given below:
Area Initiatives
Promoting Education
• ‘Vardhman Block’ constructed at Government Primary school located in Giaspura, Ludhiana has played a pivotal role in improving the educational environment of about 1400 students, majority of whom are children of the migrant labour employed in the nearby factories. The facilities provided include 14 brand new class rooms with 200 desks & benches, Safe drinking water and Clean & hygienic separate toilets for girls & boys.
• Improving School environment, infrastructure & existing facilities by constructing classrooms, toilets, kitchen shed & boundary walls in various Government schools of Punjab, Himachal Pradesh and Madhya Pradesh. We have also constructed science lab, computer Labs, and libraries and provided computers, equipments desks and books to fill the educational gaps for better education environment.
• The other initiatives undertaken by the Group include support for about 800 abandoned slum children studying at Nishkam Vidya Mandir, Ludhiana by renovating the entire school.

Vardhman Textiles Ltd. Annual Report 2017-1848
Providing Value to Customers and Consumers
PRINCIPLE 9Area Initiatives
Promoting healthcare
• Supported the Mother & Child Hospital at Ludhiana by providing an ultrasound machine, water cooler and constructing washrooms for out-patients. This hospital caters the medical needs of nearby population of the area.
• An initiative to fight with Cancer & Hepatitis B & C we have signed a MOU with CMC Hospital and DMC for the treatment of these diseases and provided financial assistance to these organisation.
Drinking water & Sanitation
Number of projects were undertaken for providing drinking water and toilet facilities in various government schools in H.P. as well as construction of public toilets in the region.
Better Cotton Initiative
As a part of plan to transform cotton production, Vardhman become implementing partner with BCI in the state of Gujarat. The plan aims at providing technical assistance to farmers toward better farming and integrated pest management techniques. The project covers around 9456 farmers as of now.
5. Note on adoption of community development work by
local communities
At Vardhman all our manufacturing units continuously engage with communities surrounding their operations through surveys and focused meetings. This is done to gauge the needs, priorities and expectations of the local community. Initiatives are thus designed and delivered in a transparent manner in line with inputs from the community itself.
The company’s CSR policy and amended CSR policy is available on its website at the following link: https://www.vardhman.com/investor-desk#!company_information with the name Policies-CSR and amended CSR policy
11.03.2016
Adding value is not always about money, or discounts. Understanding our customer is the key to add value. We try to understand what drives value for our customers and offer best quality products with a prime focus of developing memorable customer experience.
We take care of the well-being of our customers as well as the society. We take care of environment and implement practices that do not harm our society. We consistently work to improve customer satisfaction. We deliver value proactively by anticipating changes in customer’s desired needs.
1. Pending complaints at the end of the financial year were of a routine nature and constituted 5-6% of complaints pending for yarn business and 2% for fabric business.
2. We disclose all the information on our labels in compliance with the legal requirements and let customers make an informed decision.
3. There is no case pending against the company regarding unfair trade practices.
4. As part of our stakeholder engagement strategy, Vardhman engages with its customers and carries consumer surveys for different products every year to know the customer satisfaction level so that necessary steps may be taken to enhance customer satisfaction levels. There is a designated market research department which routinely carries out these surveys and gives inputs to business on taking remedial action, if required.

Corporate Overview Statutory Reports Financial Statements Notice 49
(H in crore)
Particulars STANDALONE CONSOLIDATED
2017-18 2016-17 2017-18 2016-17
Revenue from operations (Net) 5,851.37 5,690.95 6,248.27 6,029.95Other Income 185.06 628.36 197.35 553.86Profit before Depreciation, Interest & Tax (PBDIT) 1,043.62 1,759.43 1,117.82 1,790.02Interest and Financial expenses 114.32 125.13 118.19 128.68Profit before Depreciation and Tax (PBDT) 929.30 1,634.3 999.63 1,661.34Depreciation 228.55 329.49 240.00 343.40Profit before Tax (PBT) 700.75 1,304.81 759.63 1,317.94Provision for Tax - Current 147.58 281.57 165.01 302.64 - Deferred Tax (Net of Adjustment) 7.41 21.65 2.18 21.03Profit after tax (PAT) 545.76 1,001.59 592.44 994.27Other Comprehensive Income 1.70 (0.22) 1.60 (0.45)Total Comprehensive Income for the period 547.46 1,001.37 594.04 993.82
Earnings per share (H) - Basic 96.41 163.67 106.56 163.11 - Diluted 95.45 163.67 105.48 163.11
DIRECTORS’ REPORT
Dear Members,
The Directors of your Company have pleasure in presenting their 45th Annual Report of the business and operations of the Company along with the Audited Financial Statements for the year ended, 31st March, 2018.
1. Financial Results:
The financial performance of your Company for the year ended 31st March, 2018 is as under:-
2. Financial Analysis and Review of Operations:
Production & Sales Review:
During the year under review, your Company has registered Revenue from Operations of H 5,851.37 crore as compared to H 5,690.95 crore in the previous year. The export of the Company increased from H 2,206.90 crore to H 2,211.43 crore showing an increase of 0.21 % over the previous year. The product wise performance is as under:-
a) Yarn:
The production of Yarn increased marginally from 2,02,770 MT to 2,04,091 MT during the year 2017-18.
b) Fabric:
During the year, the production of grey fabric remained same as last year i.e. 175 million meter. The production of processed fabric increased from 116 million meter to 122 million meter.
STANDALONE:
Profitability:
The Company earned profit before depreciation, interest and tax of H 1,043.62 crore as against H 1,759.43 crore in the previous year. After providing for depreciation of H 228.55 crore (previous year H 329.49 crore), interest of H 114.32 crore (previous year H 125.13 crore), provision for current tax of H 147.58 crore (previous year H 281.57 crore), deferred tax (net of adjustments) of H 7.41 crore (previous year H 21.65 crore), the Net Profit after comprehensive income worked out to H 547.46 crore as compared to H 1,001.37 crore in the previous year.
The balance available for appropriation after adding balance in surplus account is H 3,095.17 crore. Out of this, a sum of H 86.09 crore and H 15.79 crore has been utilised towards dividend and corporate dividend tax thereon respectively and an amount H 17.81 crore has been transferred to Debenture Redemption Reserve. After adding a sum of
Vardhman Textiles Ltd. Annual Report 2017-1850
H 2.19 crore on account of dividend received on shares held through Trust and a sum of H 180.81 crore on account of profit on sale of shares held through Trust, a balance of H
3,158.48 crore is proposed to be carried as surplus to the balance sheet.
Resources Utilisation:
a) Fixed Assets:
The Net Block as at 31st March, 2018 was H 2,506.77 crore as compared to H 2,458.15 crore in the previous year.
b) Current Assets:
The current assets as on 31st March, 2018 were H 4,201.33 crore as against H 3,411.26 crore in the previous year. Inventory level was at H 2,116.51 crore as compared to the previous year level of H 1,589.00 crore.
CONSOLIDATED:
Profitability:
The Company earned profit before depreciation, interest and tax of H 1,117.82 crore as against H 1,790.02 crore in the previous year. After providing for depreciation of H 240.00 crore (previous year H 343.40 crore), interest of H 118.19 crore (previous year H 128.68 crore), provision for current tax of H 165.01 crore (previous year H 302.64 crore), deferred tax (net of adjustments) of H 2.18 crore (previous year H 21.03 crore), the net profit from operations after comprehensive income worked out to H 594.04 crore as compared to H 993.82 crore in the previous year.
The balance available for appropriation after adding balance in surplus account is H 3,288.39 crore. Out of this, a sum of H 84.56 crore and H 18.24 crore has been utilised towards dividend and corporate dividend tax thereon respectively, an amount H 17.81 crore and 2.05 crore has been transferred to Debenture Redemption Reserve and Statutory Reserve respectively. After adding a sum of H 2.19 crore on account of dividend received on shares held through Trust and a sum of H 180.77 crore on account of profit on sale of shares held through Trust, a balance of H 3,348.69 crore is proposed to be carried as surplus to the balance sheet.
Resources Utilisation:
a) Fixed Assets:
The Net Block as at 31st March, 2018 was H 2,618.40 crore as compared to H 2,578.05 crore in the previous year.
b) Current Assets:
The current assets as on 31st March, 2018 were H 4,545.60 crore as against H 3,838.40 crore in the previous year. Inventory level was at H 2,256.64 crore as compared to the previous year level of H 1,752.81 crore.
Financial Conditions & Liquidity:
The Company enjoys a rating of “AA+/Stable” from Credit Rating Information Services of India (CRISIL) for long term borrowings and “A1+” for short term borrowings respectively. Management believes that the Company’s liquidity and capital resources should be sufficient to meet its expected working capital needs and other anticipated cash requirements. The position of liquidity and capital resources of the Company is given below:-
(H in crore)
Particulars 2017-18 2016-17
Cash and Cash equivalents:
Beginning of the year
38.22 213.69
End of the year 65.20 38.22
Net cash provided (used) by:
Operating Activities 89.19 1288.92
Investing Activities (159.28) (251.80)
Financial Activities 97.07 (1,212.59)
3. Management Discussion and Analysis Report:
Management Discussion and Analysis Report for the year under review as stipulated under Regulation 34(2) (e) of the Securities and Exchange Board of India (Listing Obligations and Disclosure Requirements) Regulations, 2015 is presented in a separate section forming part of this Annual Report.
4. Dividend:
The Board of Directors in its meeting held on 12th May, 2018 has recommended dividend of H 15/- per share on the fully paid up Equity Shares of the Company.
5. Investor Eduction and Protection Fund (IEPF):
Pursuant to the provisions of Section 124 and 125 of the Companies Act, 2013, read with IEPF Authority

Corporate Overview Statutory Reports Financial Statements Notice 51
(Accounting, Audit, Transfer and Refund) Rules, 2016 (‘the Rules’), all unpaid or unclaimed dividends are required to be transferred by the Company to the IEPF established by the Central Government after the completion of seven years from the date of transfer to the Unpaid Dividend Account of the Company. The shareholders whose dividends have been transferred to the IEPF Authority can claim their dividend from Authority. The unclaimed or unpaid dividend relating to the financial year 2010-11 is due for remittance by the end of September, 2018 to Investor Education and Protection Fund established by Central Government.
Further, according to the Rules, the shares in respect of which dividend has not been paid or claimed by shareholders for seven consecutive years or more shall also be transferred to the IEPF Authority. The Company shall sent notice to all shareholders whose shares are due to be transferred to the IEPF Authority and publish requisite advertisement in the newspaper.
The details of these shares is also provided on the website of the Company, at www.vardhman.com.
6. Consolidated Financial Statement:
In accordance with Companies Act 2013 & Indian Accounting Standards (Ind AS) 110 on ‘Consolidated Financial Statements’ read with Ind AS 111 on ‘Joint Arrangements’ and Ind AS 112 on ‘Disclosure of Interest in other entities’, the Audited Consolidated Financial Statements are provided in the Annual Report.
7. Subsidiaries, Joint Ventures and Associate Companies:
The Company does not have any material subsidiary. The details of the financials of the subsidiary and associate companies for the year 2017-18 are as follows:-
VMT Spinning Company Limited (VMT)
This subsidiary of the Company was a Joint Venture with Marubeni Corporation (MC), Japan and Marubeni Hong Kong and South China Limited (MHSCL), Hong Kong. During the year, your Company purchased the entire stake of its Joint Venture partners i.e. 6.66% of MC and 3.88% of MHSCL in VMT. As such VMT became a 100% subsidiary of the Company w.e.f. 6th September, 2017. The Revenue from Operations of VMT has increased to H 223.74 crore from H 191.13 crore in the last year. The Net Profit of the Company after comprehensive income worked out to H 1.78 crore as against H 8.26 crore in the previous year registering a decrease of 78.45%.
VTL Investments Limited (VTL)
This 100% subsidiary of your Company is engaged in the business of investment. The earnings of the Company mainly come from the dividend /interest earned on its investments and profits made on sale of investments. During the year, the Company has earned a Net Profit of H 10.24 crore as compared to H 9.75 crore during the previous year.
Vardhman Acrylics Limited (VAL)
This subsidiary of the Company is engaged in the business of manufacturing of Acrylic Fibre. Presently, the Company holds 70.74% shares in this subsidiary. During the Financial Year 2017-18, VAL recorded Revenue from Operations of H 326.97 crore against H 368.43 crore in the previous year. The Net Profit of the Company after comprehensive income worked out to H 38.47 crore as compared to H 40.99 crore in the previous year.
Vardhman Nisshinbo Garments Company Limited (VNGL)
This subsidiary of the Company is a Joint Venture partnership of 51:49 with Nisshinbo Textiles Inc., Japan for manufacturing men’s shirts. During the year, the Revenue from Operations of the Company was H 59.81 crore as compared to H 58.18 crore in the previous year. The Company posted a Net Profit of H 0.34 crore as against a net loss of H 0.54 crore in the previous year.
Vardhman Yarns and Threads Limited (VYTL)
Vardhman Yarns and Threads Limited, a Joint Venture with American & Efird Global, LLC (A&E), is an Associate of the Company. It is engaged in the business of threads manufacturing and distribution. Presently, the Company holds 11% stake in VYTL. A&E is the second largest player in threads manufacturing and distribution across the world. During the year under review, the Revenue from Operations were H 812.84 crore as against H 778.58 crore in the previous year registering an increase of 4.40%. The Net Profit for the year after comprehensive income worked out to H 84.43 crore as compared to H 99.09 crore during last year registering a decrease of 14.7%.
Vardhman Special Steels Limited
Vardhman Special Steels Limited (VSSL) is an Associate of the Company. The Company holds 27.20% shares of VSSL. During the year, the Revenue from Operations of the Company was H 877.89 crore as compared to H 753.13 crore in the previous year. The Net Profit for the year after comprehensive income worked out to H 24.73 crore as compared to H 18.91 crore in the previous year.

Vardhman Textiles Ltd. Annual Report 2017-1852
Vardhman Spinning & General Mills Limited
Vardhman Spinning & General Mills Limited (VSGM) is an Associate of the Company. The Company holds 50% shares of VSGM. It is a trading Company dealing in the business of Cotton and Fibre. During the year, the Company has not traded any goods. So, the Revenue from Operations is NIL for the Financial Year 2017-18. The Company posted a Net Profit of H 29,404 as against a net loss of H 6,851 in the previous year.
8. Directors:
In accordance with the provisions of the Articles of Association of the Company, Mr. Sachit Jain, Director of the Company, retires by rotation at the conclusion of the forthcoming Annual General Meeting and being eligible, offers himself for re-appointment. The Board recommended his appointment for the consideration of members of the Company at ensuing Annual General Meeting.
Cessation from Directorship: During the year, Mr. Shravan Talwar ceased to be the Director of the Company as his term of appointment expired on 22nd September, 2017. Further, IDBI Bank Ltd. has withdrawn the nomination of Mr. Kumar Neel Lohit from the Board of Directors of your Company w.e.f. 11th December, 2017.
Additional Director: During the year, Dr. Parampal Singh was appointed as an Additional Director of the Company w.e.f. 27th November, 2017.
Declaration under Section 149(6):
The Independent Directors have submitted their disclosures to the Board that they fulfill all the requirements as stipulated in Section 149(6) of the Companies Act, 2013 so as to qualify themselves to be appointed as Independent Directors under the provisions of the Companies Act, 2013 and the relevant rules thereof.
Company’s Policy relating to Directors’ appointment,
payment of remuneration and discharge of their duties:
The Nomination & Remuneration Committee of the Company has formulated the Nomination & Remuneration Policy on Directors’ appointment and remuneration including the criteria for determining qualifications, positive attributes, independence of a director and other matters as provided under Section 178(3) of the Companies Act, 2013.
The Nomination & Remuneration Policy is annexed hereto and form part of this report as Annexure I.
Continuation of Non-Executive Directors:
Pursuant to the provisions of Regulation 17 of SEBI (Listing Obligation and Disclosure Requirements) Regulation, 2015, as amended vide SEBI (Listing Obligations and Disclosure Requirements) (Amendment) Regulations, 2018, Special Resolution has been proposed to be passed by the Members in the ensuing Annual General Meeting for continuation of directorships of those non-executive directors who are above the age of 75 years viz Mr. Prafull Anubhai, Mr. A.K. Kundra, Mr. D.B. Jain, Dr. S.K. Bijlani.
Familiarization programmes for Board Members:
Your Company has formulated Familiarization Programme for all the Board members in accordance with Regulation 25 of the SEBI (Listing Obligations and Disclosure Requirements) Regulations, 2015 and the Schedule IV of the Companies Act, 2013 which provides that the Company shall familiarize the Independent Directors with the Company, their roles, rights, responsibilities in the Company, nature of Industry in which the Company operates, business model of the Company, etc. through various programs.
The Familiarization Programme for Board members may be accessed on the Company’s website at the link: https://www.vardhman.com/user_files/investor/familarisation.pdf
Annual Evaluation of the Board Performance:
The meeting of Independent Directors of the Company for the calendar year 2017 was held on 8th November, 2017 to evaluate the performance of Non-Independent Directors, Chairperson of the Company and the Board as a whole.
The evaluation was done by way of discussions on the performance of the Non- Independent Directors, Chairperson and Board as a whole.
A policy on the performance evaluation of Independent Directors, Board, Committees and other individual Directors which includes criteria for performance evaluation of non-executive directors and executive directors has been formulated by the Company.
9. Key Managerial Personnel (KMP):
In compliance with provisions of Section 203 of the Companies Act, 2013, following are the KMPs of the

Corporate Overview Statutory Reports Financial Statements Notice 53
Company as on 31st March, 2018:
Sl.
No.
Name Designation
1. S.P. Oswal Chairman & Managing Director
2. Rajeev Thapar Chief Financial Officer
3. Sanjay Gupta Company Secretary
10. Number of Board Meetings:
During the year under review, the Board met Four (4) times and the intervening gap between any two meetings was within the period prescribed under Companies Act, 2013. The details of Board Meetings are set out in Corporate Governance Report which forms part of this Annual Report.
11. Auditors and Auditors’ Report:
Statutory Auditors:
At the Annual General Meeting held on 22nd September, 2017, Deloitte Haskins & Sells, LLP, Chartered Accountants (Firm registration No. 117366W/W-100018) (‘Deloitte’) were appointed as Statutory Auditors of the Company to hold office till the conclusion of 49th Annual General Meeting of the Company. Their appointment was subject to ratification by Members of the Company in every Annual General Meeting. Now, pursuant to the provisions of section 40 of the Companies (Amendment) Act, 2017, section 139 of Companies Act, 2013 has been amended whereby the requirement of annual ratification of the appointment of Statutory Auditors by the Members of the Company is no longer required. Accordingly, the resolution regarding ratification of the appointment of ‘Deloitte’ as Statutory Auditors is not being proposed in the ensuing Annual General Meeting.
Further, the Statutory Auditors of the Company have submitted Auditors’ Report on the accounts of the Company for the accounting year ended 31st March, 2018. The Auditors’ Report is self-explanatory and requires no comments.
Secretarial Auditor:
M/s. B.K. Gupta & Associates, Company Secretaries in Practice, were appointed as Secretarial Auditors of the Company by the Board of Directors of the Company in its meeting held on 10th May, 2017 for the financial year 2017-18.
The Secretarial Auditors of the Company have submitted their Report in Form MR-3 as required under Section
204, of the Companies Act, 2013 for the financial year ended 31st March, 2018. This Report is self-explanatory and requires no comments. The Report forms part of this report as Annexure II.
Cost Auditor:
The Company is maintaining the Cost Records, as specified by the Central Government under section 148(1) of Companies Act, 2013.
The Board of Directors has appointed M/s Ramanath Iyer & Company, Cost Accountants, New Delhi, as the Cost Auditors of the Company to conduct Cost Audit of the Accounts for the financial year ended 2018-19. However, as per provisions of Section 148 of the Companies Act, 2013, read with Companies (Cost Records and Audit) Rules, 2014, the remuneration to be paid to the Cost Auditors is subject to ratification by members at the Annual General Meeting. Accordingly, the remuneration to be paid to M/s Ramanath Iyer & Company, Cost Accountants, New Delhi, for financial year 2018-19 is placed for ratification by the members.
12. Audit Committee & Vigil Mechanism:
Composition of Audit Committee:
The Audit Committee consists of Mr. Prafull Anubhai, Dr. S.K. Bijlani, Mr. D.B. Jain, Mr. A.K. Kundra, Independent Directors and Mr. D.L. Sharma, Director. Mr. Prafull Anubhai is the Chairman of the Committee and Company Secretary of the Company is the Secretary of the Committee. All the recommendations made by the Audit Committee were accepted by the Board.
Vigil Mechanism:
Pursuant to provisions of Section 177(9) of the Companies Act, 2013 the Company has established a “Vigil Mechanism” incorporating whistle blower policy in terms of SEBI (Listing Obligations and Disclosure Requirements) Regulations, 2015 for employees and Directors of the Company, for expressing the genuine concerns of unethical behavior, actual or suspected fraud or violation of the code of conduct by way of direct access to the Chairman/ Chairman of the Audit Committee.
The Company has also provided adequate safeguards against victimization of employees and Directors who express their concerns.
The Policy on Vigil Mechanism and whistle blower policy as approved by the Board may be accessed on the Company’s website at the link: http://www.vardhman.com/userfiles/20b9bcdbd2cc01fde3e8e7d392d93573769 de1941436265078.pdf.

Vardhman Textiles Ltd. Annual Report 2017-1854
13. Corporate Governance:
The Company has in place a system of Corporate Governance. Corporate Governance is about maximizing shareholder value legally, ethically and sustainably. A separate report on Corporate Governance forming part of the Annual Report of the Company is annexed hereto. A certificate from the Auditors of the Company regarding compliance of conditions of Corporate Governance as stipulated under SEBI (Listing Obligations and Disclosure Requirements) Regulations, 2015 is annexed to the report on Corporate Governance.
14. Corporate Social Responsibility (CSR):
Vision & Core areas of CSR: Your Company is committed to and fully aware of its Corporate Social Responsibility (CSR), the guidelines in respect of which were more clearly laid down in the Companies Act, 2013. The Company’s vision on CSR is that the Company being a responsible Corporate Citizen would continue to make a serious endeavor for a quality value addition and constructive contribution in building a healthy and better society through its CSR related initiatives and focus on education, environment, health care and other social causes.
CSR Policy: The Corporate Social Responsibility (CSR) Policy of the Company indicating the activities to be undertaken by the Company, as approved by the Board, may be accessed on the Company’s website at the link: https://www.vardhman.com/user_files/investor/CSR%20Policy%20final.pdf
During the year, the Company has spent H14.93 crore on CSR activities.
The disclosures related to CSR activities pursuant to Section 134(3) of the Companies Act, 2013 read with Rule 9 of Companies (Accounts) Rules, 2014 and Companies (Corporate Social Responsibility) Rules, 2014 is annexed hereto and form part of this report as Annexure III.
15. Business Responsibility Report (BRR):
SEBI (Listing Obligations and Disclosure Requirements) Regulations, 2015 mandate the inclusion of the BRR as part of the Annual Report for top 500 listed entities based on market capitalization. In compliance with the Listing Regulations, we have integrated BRR disclosure into our Annual Report.
16. Dividend Distribution Policy (DDP):
As per Regulation 43A of the SEBI (Listing Obligations and Disclosure Requirements) Regulations, 2015, the top 500 listed companies are required to formulate a DDP. Accordingly, a DDP was adopted to set out the parameters and circumstances that will be taken into account by the Board in determining the distribution of dividend to its shareholders and/or retaining profits earned by the Company. The policy is enclosed as Annexure IV to the Board’s report and is also available on the Company’s website at the link: https://www.vardhman.com/user_files/investor/dividend%20policy.pdf
17. Risk Management:
The Risk Management Policy required to be formulated under the Companies Act, 2013 and SEBI (Listing Obligations and Disclosure Requirements) Regulations, 2015 has been duly formulated and approved by the Board of Directors of the Company. The aim of risk management policy is to maximize opportunities in all activities and to minimize adversity. The policy includes identifying types of risks and its assessment, risk handling, monitoring and reporting, which in the opinion of the Board may threaten the existence of the Company.
The Risk Management policy may be accessed on the Company’s website at the link: http://www.vardhman.c o m / u s e r _ f i l e s / a 4 c 0 a 8 b 0 0 e 4 0 7 c d 5 0 7 5 5 3 e a7db7f06e89de1272a1436265025.pdf.
18. Internal Financial Controls:
The Company has in place adequate internal financial controls with reference to financial statements. During the year, such controls were tested and no reportable material weakness in the design or operation was observed.
A report on the Internal Financial Controls under clause (i) of sub-section 3 of section 143 of the Companies Act, 2013 as given by the Statutory Auditors of the Company forms part of Independent Auditor’s Report on Standalone Financial Statements as Annexure B and to the Independent Auditor’s Report on Consolidated Financial Statements as Annexure A.

Corporate Overview Statutory Reports Financial Statements Notice 55
19. Particulars of Contracts or Arrangements made with Related Parties:
All contracts/arrangements/transactions entered into by the Company during the financial year with related parties were in the ordinary course of business and on an arm’s length basis. During the year, the Company had not entered into any contract/arrangement/transaction with related parties which could be considered material in accordance with the provisions of Regulation 23 of the SEBI (Listing Obligations and Disclosure Requirements) Regulations, 2015. Accordingly, the disclosure of Related Party Transactions as required under Section 134(3)(h) of the Companies Act, 2013 in Form AOC-2 is not applicable.
The Policy on dealing with related party transactions as approved by the Board may be accessed on the Company’s website at the link: http://www.vardhman.com/user_files/96c45534e3ab096d9b c682f8eebade0344f915151436264609.pdf.
Your Directors draw attention of the members to Note 46 of the standalone financial statement which sets out related party disclosures.
20. Particulars of Loans, Guarantees or Investments made under section 186 of the Companies Act, 2013:
Particulars of loans given, investments made, guarantees given and securities provided along with the purpose for which the loan or guarantee or security is proposed to be utilized by the recipient are provided in the standalone financial statement (Please refer to Note 4, 5, 9 and 12 to the standalone financial statement).
21. Conservation of Energy, Technology Absorption, Foreign Exchange Earnings and Outgo:
Energy conservation continues to be an area of major emphasis in our Company. Efforts are made to optimize the energy cost while carrying out the manufacturing operations. Particulars with respect to conservation of energy and other areas as per Section 134(3)(m) of the Companies Act, 2013 read with the Companies (Accounts) Rules, 2014, are annexed hereto and form part of this report as Annexure V.
22. Annual Return:
Pursuant to the provisions of Section 134(3)(a) of Companies Act, 2013, as substituted by Companies (Amendment) Act, 2017, w.e.f. 31st July, 2018, the web address of the extract of Annual Return of the Company is https://www.vardhman.com/user_files/investor/MGT-9.pdf.
23. Human Resources /Industrial Relations:
Human resource is considered as the most valuable of all resources available to the Company. The Company continues to lay emphasis on building and sustaining an excellent organization climate based on human performance. The Management has been continuously endeavoring to build high performance culture on one hand and amiable work environment on the other hand. As on 31st March, 2018, the Company employed around 20,919 employees on permanent rolls.
Pursuit of proactive policies for industrial relations has resulted in a peaceful and harmonious situation on the shop floors of the various plants.
24. Particulars of Employees and Related Disclosures:
The disclosures in respect of managerial remuneration as required under section 197(12) read with Rule 5(1) of the Companies (Appointment & Remuneration of Managerial Personnel) Rules, 2014 is annexed hereto and form part of this report.
A statement showing the names and other particulars of the employees drawing remuneration in excess of the limits set out in Rule 5 (2) and 5 (3) Companies (Appointment & Remuneration of Managerial Personnel) Rules, 2014 is annexed hereto and forms part of this report.
In terms of section 197(14) of the Companies Act, 2013, the Company does not have any Holding Company. However, the details regarding remuneration or commission received from any holding or subsidiary of the Company by any Managing or Whole Time Director is annexed hereto and form part of this report.
All the above details are provided in Annexure VI.
25. Material Changes and Commitments, if any, affecting the Financial Position of the Company occurred between the end of the Financial Year to which these Financial Statements relate and the date of this Report:
No material changes and commitments affecting the financial position of the Company occurred between the end of the financial year to which these financial statements relate and the date of this report.

Vardhman Textiles Ltd. Annual Report 2017-1856
26. Directors’ Responsibility Statement:
Pursuant to the provisions of Section 134 (5) of the Companies Act, 2013, the Board hereby submit its responsibility Statement:—
a. in the preparation of the annual accounts, the applicable accounting standards have been followed along with the proper explanation relating to material departures;
b. appropriate accounting policies have been selected and applied consistently, and have made judgments and estimates that are reasonable and prudent so as to give a true and fair view of the state of affairs of the Company as at 31st March, 2018 and of the profit of the Company for the year ended on 31st March, 2018;
c. proper and sufficient care has been taken for the maintenance of adequate accounting records in accordance with the provisions of the Companies Act, 2013, for safeguarding the assets of the Company and for preventing and detecting fraud and other irregularities;
d. the annual accounts have been prepared on a going concern basis;
e. the Internal financial controls have been laid down to be followed by the Company and that such internal financial controls are adequate and are operating effectively; and
f. proper systems have been devised to ensure compliance with the provisions of all applicable laws and such systems are adequate and operating effectively.
27. General Disclosures:
Your Directors state that no disclosure or reporting is required in respect of the following items as there were no transactions on these items during the year under review:
1. Details relating to deposits covered under Chapter V of the Act.
2. Issue of equity shares with differential rights as to dividend, voting or otherwise.
3. Significant or material orders passed by the Regulators or Courts or Tribunals which impact the going concern status and Company’s operations in future.
4. Change in nature of Business of Company.
Further, your Directors state that the Company has complied with the provisions relating to constitution
of Internal Complaints Committee under the Sexual Harassment of Women at Workplace (Prevention, Prohibition and Redressal) Act, 2013 and there was no case filed under the said Act.
28. Vardhman Textiles Limited Employee Stock Option Plan, 2016:
The Company has granted options to its employees under Vardhman Textiles Limited Employee Stock Options Plan, 2016 (hereinafter referred as ESOP Plan). As per the terms of the plan, the Company can grant a maximum of 6,36,518 options to eligible employees from time to time. One option entitles the holder to apply for one equity share of the Company in terms of ESOP Plan. Accordingly, during the financial year, a total of 49,250 options were exercised by the eligible employees. Out of this, 42,450 equity shares were allotted during the year ended 31st March, 2018 and 6800 equity shares were allotted on 9th April, 2018. So, the paid up equity share capital of the Company stood increased to H 57,43,34,600 as on 31st March, 2018.
The ESOP Plan of the Company is being implemented
in accordance with SEBI (Share Based Employee Benefits) Regulations, 2014 and the resolution passed by the shareholders approving the said plan. A certificate received from the Auditors of the Company in this regard would be available at the Annual General Meeting for the inspection by the Members.
The details as required to be disclosed are put on the Company’s website and may be accessed at https://www.vardhman.com/user_files/investor/ESOP%20Disclosure.pdf
29. Acknowledgement:
Your Directors are pleased to place on record their sincere gratitude to the Government, Financial Institutions, Bankers, Business Constituents and Shareholders for their continued and valuable co-operation and support to the Company and look forward to their continued support and co-operation in future too.
They also take this opportunity to express their deep appreciation for the devoted and sincere services rendered by the employees at all levels of the operations of the Company during the year.
For and on behalf of The Board
Place : Ludhiana (S.P. Oswal)
Dated : 13th August, 2018 Chairman & Managing Director

Corporate Overview Statutory Reports Financial Statements Notice 57
INDEX OF ANNEXURES(Forming Part of Board Report)
Annexure No. Particulars
I Nomination & Remuneration Policy approved by the Board.
II Secretarial Audit Report in form no. MR-3 for FY 2017-18.
III CSR Activities – Annual Report FY 2017-18.
IV Dividend Distribution Policy
V Conservation of energy, technology absorption, foreign exchange earnings and outgo.
VI Particulars of employees and related disclosures.
ANNEXURES TO THE DIRECTORS’ REPORT
ANNEXURE- I
Nomination & Remuneration Policy of the Company:
1. Preface:
In terms of the provisions of Section 178 of the Companies Act, 2013 and Clause 49 of the Listing Agreement, this policy on Nomination and Remuneration of Directors and Senior Management has been formulated by the Committee and approved by the Board of Directors in their meeting held on 7th August, 2014.
Upon the recommendations of Nomination and Remuneration Committee, the Board of Directors of VTXL in its meeting held on 8th May, 2015 made certain amendments in the existing policy and thereafter replaced the existing policy with the amended policy.
The amended policy is as under:-
2. Role of the Committee:
a) To identify persons who are qualified to become Directors and who may be appointed in Senior Management in accordance with the criteria laid down and recommend to Board their appointment and removal.
b) To formulate criteria for determining qualifications, positive attributes and independence of a Director.
c) To recommend to the Board remuneration policy related to remuneration of Directors (whole time Directors, Executive Directors etc), Key Managerial Personnel and other employees while ensuring the following:-
a That the level and composition of remuneration is reasonable and sufficient to attract, retain and motivate directors of the quality required to run the company successfully.
b That relationship of remuneration to performance is clear and meets appropriate performance benchmarks.
c That remuneration to directors, key managerial personnel and senior management involves a balance between fixed and incentive pay reflecting short and long term performance objectives appropriate of the working of the company and its goals.
d) To formulate criteria for evaluation of Directors and the Board.
e) To devise a policy on Board diversity.

Vardhman Textiles Ltd. Annual Report 2017-1858
3. Membership:
a) The Committee shall consist of a minimum 3 non-executive directors, majority of them being independent.
b) Minimum two (2) members shall constitute a quorum for the Committee meeting.
c) Membership of the Committee shall be disclosed in the Annual Report.
d) Term of the Committee shall be continued unless terminated by the Board of Directors.
4. Chairman:
a) Chairman of the Committee shall be an Independent Director.
b) Chairman of the Company may be appointed as a member of the Committee but shall not be a Chairman of the Committee.
c) In the absence of the Chairman, the members of the Committee present at the meeting shall choose one amongst them to act as Chairman.
d) Chairman of the Nomination and Remuneration Committee meeting could be present at the Annual General Meeting or may nominate some other member to answer the shareholders’ queries.
5. Frequency of Meetings:
The meeting of the Committee shall be held at such regular intervals as may be required.
6. Committee Members’ Interests:
a) A member of the Committee is not entitled to be present when his or her own remuneration is discussed at a meeting or when his or her performance is being evaluated.
b) The Committee may invite such executives, as it considers appropriate, to be present at the meetings of the Committee.
7. Secretary:
The Company Secretary of the Company shall act as Secretary of the Committee.
8. Voting:
a) Decisions of the Committee shall be decided by a majority of votes of Members present and voting and any such decision shall for all purposes be deemed a decision of the Committee.
b) In the case of equality of votes, the Chairman of the meeting will have a casting vote.
9. Minutes of Committee Meeting:
The minutes of all the proceedings of all meetings must be signed by the Chairman of the Committee at the subsequent meeting. Minutes of the Committee meetings will be tabled at the subsequent Board meetings.
10. Effective Date & Amendments:
This policy will be effective from 8th May, 2015 and may be amended subject to the approval of Board of Directors

Corporate Overview Statutory Reports Financial Statements Notice 59
ANNEXURE- II
Form MR-3
Secretarial Audit Report
for the financial year ended 31st March, 2018
[Pursuant to section 204(1) of the Companies Act, 2013 and rule No.9 of the Companies (Appointment and Remuneration of Managerial Personnel) Rules, 2014]
ToThe Members,Vardhman Textiles Limited
Chandigarh Road,Ludhiana- 141010
We have conducted the Secretarial Audit of the compliance of applicable statutory provisions and the adherence to good corporate practices by Vardhman Textiles Limited (hereinafter called the company). Secretarial Audit was conducted in a manner that provided us a reasonable basis for evaluating the corporate conducts/statutory compliances and expressing my opinion thereon.
Based on our verification of the Company’s books, papers, minutes books, forms and returns filed and other records maintained by the company and also the information provided by the Company, its officers, agents and authorized representatives during the conduct of Secretarial Audit, We hereby report that in our opinion, the company has, during the audit period covering the financial year ended on March 31, 2018 complied with the statutory provisions listed hereunder and also that the Company has proper Board-processes and compliance-mechanism in place to the extent, in the manner and subject to the reporting made hereinafter.
We have examined the books, papers, minute books, forms and returns filed and other records maintained by Vardhman Textiles Limited (“the Company”) for the financial year ended on 31st March, 2018 according to the provisions of:
(i) The Companies Act, 2013 (the Act) and the rules made there under;
(ii) The Securities Contracts (Regulation) Act, 1956 (‘SCRA’) and the rules made there under;
(iii) The Depositories Act, 1996 and the Regulations and Bye-laws framed there under;
(iv) Foreign Exchange Management Act, 1999 and the rules and regulations made there under to the extent of Foreign Direct Investment, Overseas Direct Investment and External Commercial Borrowings
(v) The following Regulations and Guidelines prescribed under the Securities and Exchange Board of India Act, 1992 (‘SEBI Act’):-
(a) The Securities and Exchange Board of India (Listing Obligations and Disclosure Requirements) Regulations, 2015;
(b) The Securities and Exchange Board of India (Substantial Acquisition of Shares and Takeovers) Regulations, 2011;
(c) The Securities and Exchange Board of India (Prohibition of Insider Trading) Regulations, 2015;
(d) The Securities and Exchange Board of India (Issue of Capital and Disclosure Requirements) Regulations, 2009- Not Applicable during the Audit period;
(e) The Securities and Exchange Board of India (Employee Stock Option Scheme and Employee Stock Purchase Scheme) Guidelines, 1999;
(f) The Securities and Exchange Board of India (Issue and Listing of Debt Securities) Regulations, 2008-Not Applicable during the Audit period;
(g) The Securities and Exchange Board of India (Registrars to an Issue and Share Transfer Agents)

Vardhman Textiles Ltd. Annual Report 2017-1860
Regulations, 1993 regarding the Companies Act and dealing with client;
(h) The Securities and Exchange Board of India (Delisting of Equity Shares) Regulations, 2009-Not Applicable during the Audit period; and
(i) The Securities and Exchange Board of India (Buyback of Securities) Regulations, 1998-Not Applicable during the Audit period.
We have also examined compliance with the applicable clauses of the following:
(i) Secretarial Standards (SS-1 and SS-2) issued by The Institute of Company Secretaries of India.
(ii) The Listing Agreements entered into by the Company with Bombay Stock Exchange and National Stock Exchange
During the period under review the Company has generally complied with the provisions of the Act, Rules, Regulations, Guidelines, Standards, etc. mentioned above.
We further report that
The Board of Directors of the Company is duly constituted with proper balance of Executive Directors, Non-Executive Directors and Independent Directors. The changes in the composition of the Board of Directors that took place during the period under review were carried out in compliance with the provisions of the Act.
Adequate notice is given to all directors to schedule the Board Meetings, agenda and detailed notes on agenda were sent at least seven days in advance, and a system exists for seeking and obtaining further information and clarifications on the agenda items before the meeting and for meaningful participation at the meeting.
Majority decision is carried through while the dissenting members views are captured and recorded as part of the minutes, if any.
We further report that there are adequate systems and processes in the company commensurate with the size and operations of the company to monitor and ensure compliance with applicable laws, rules, regulations and guidelines.
For B.K. Gupta & Associates
Company Secretaries
(Bhupesh Gupta)
Place: Ludhiana FCS No.:4590 Date: 18th July, 2018 C P No.:5708
List of Labour Laws and Environmental Laws which have been verified during Audit Period
List of Labour Laws
Factories Act, 1948Industrial Disputes Act, 1947The Payment of Wages Act, 1936The Minimum Wages Act, 1948Employee’s State Insurance Act, 1948The Payment of Bonus Act, 1972The Contract Labour (Regulation and Abolition) Act, 1970The Apprentices Act, 1961
List of Environmental Laws
Environment (Protection) Act, 1986The Public Liability Insurance Act, 1991Water (Prevention and Control of Pollution) Act, 1974Air (Prevention and Control of Pollution) Act, 1981Hazardous Waste (Management, Handling and Trans boundary Movements) Rules, 2008

Corporate Overview Statutory Reports Financial Statements Notice 61
ANNEXURE:-A
ToThe Members,Vardhman Textiles Limited
Chandigarh Road,Ludhiana- 141010
1. Maintenance of secretarial record is the responsibility of the management of the Company. Our responsibility is to express an opinion on these secretarial records based on our audit.
2. We have followed the audit practices and processes as were appropriate to obtain reasonable assurance about the correctness of the contents of the secretarial records. The verification was done on the random test basis to ensure that correct facts are reflected in secretarial records. We believe that the processes and practices, we followed provide a reasonable basis for our opinion.
3. We have not verified the correctness and appropriateness of financial records and Books of Accounts of the Company.
4. Where ever required, we have obtained the Management representation about the compliance of laws, rules and regulations and happening of events etc.
5. The compliance of the provisions of Corporate and other applicable laws, rules, regulations, standards is the responsibility of management. Our examination was limited to the verification of procedures on random test basis.
6. The Secretarial Audit report is neither an assurance as to the future viability of the company nor of the efficacy or effectiveness with which the management has conducted the affairs of the Company.
For B.K. Gupta & Associates
Company Secretaries
(Bhupesh Gupta)
Place: Ludhiana FCS No.:4590Date: 18th July, 2018 C P No.:5708

Vardhman Textiles Ltd. Annual Report 2017-1862
ANNEXURE:-A
ANNEXURE- III
Annual Report on Corporate Social Responsibility (CSR) activities for the financial year 2017-18:
Sr.
No.
Particulars
1. Brief outline of CSR Policy The focus areas of the Company under its CSR programme are promotion of education, health care, rural development, skill enhancement, environment protection and any other project as defined in Schedule VII of the Companies Act, 2013.
2. Composition of CSR Committee The CSR Committee of the Company consists of:i) Mr. A.K. Kundra- Chairmanii) Mr. Sachit Jain- Memberiii) Mr. Neeraj Jain- Memberiv) Mr. D.L. Sharma- Member
3. Average net profit of the Company for last three financial years
H 850.85 crore
4. Prescribed CSR Expenditure H 17.02 crore5. Details of CSR spent during the year:
Total amount spent for the financial year H 14.93 croreAmount unspent, if any H 2.09 croreManner in which the amount spent during the financial year
ANNEXURE – A
6. In case the Company has failed to spend two percent, reason thereof.
The Company has spent H 14.93 crore in the Financial year 2017-18 on activities as provided in Annexure A. The prescribed unspent amount will be spent on CSR projects in the coming financial year.
7. A responsibility statement of the CSR Committee that the implementation and monitoring of CSR policy, is in compliance with CSR objectives and policy of the Company
ANNEXURE- B
CSR Project or activity identified Projects or
programs
1. Local area or other
2. Specify the state
and district where
project or program
was undertaken
Amount outlay
(Budget) project
or program
wise - Direct
Expenditure
on Projects/
Programs
(including
overheads)
Amount spent
on the projects
or programs
subheads
- Direct
Expenditure
on Projects/
Programs
(including
overheads)
Cumulative
Expenditure
upto the
reporting
period
Amount spent:
Direct or
through
implementing
agency
A) Promoting Education
Re Construction / construction of Schools - classrooms, toilets, and providing basic amenities for government schools
Himachal Pradesh 168.62 139.34 139.73 through implementing agency
Improvement of hygiene / sanitation facility inside the school
Himachal Pradesh 42.09 42.09 42.09 Direct
Re Construction / construction of Schools - classrooms, toilets, and providing basic amenities for government schools
Madhya Pradesh 318.13 224.25 250.47 through implementing agency

Corporate Overview Statutory Reports Financial Statements Notice 63
CSR Project or activity identified Projects or
programs
1. Local area or other
2. Specify the state
and district where
project or program
was undertaken
Amount outlay
(Budget) project
or program
wise - Direct
Expenditure
on Projects/
Programs
(including
overheads)
Amount spent
on the projects
or programs
subheads
- Direct
Expenditure
on Projects/
Programs
(including
overheads)
Cumulative
Expenditure
upto the
reporting
period
Amount spent:
Direct or
through
implementing
agency
Re Construction / construction of Schools - classrooms, toilets, and providing basic amenities for government schools
Punjab 764.28 605.40 732.08 through implementing agency
B) Promoting Health Care
Providing Medical Equipment for Optical imaging at a Charitable hospital
Haryana 26.00 23.50 23.50 through implementing agency
Providing various medical equipment and construction of Maternity Child Health Centre
Himachal Pradesh 63.96 56.14 59.00 through implementing agency
Providing various medical equipment and construction of shed
Madhya Pradesh 105.11 64.56 90.91 through implementing agency
Providing various medical equipment and Organizing Health Check-up Camp
Punjab 131.63 107.42 107.42 through implementing agency
Donation to Digestive Disease Care Foundation, Cankids, CMC Hospital
Punjab 31.50 31.50 31.50 Direct
C) Rural Development Projects
Village Adoptions Program under BCI Cotton Gujarat 135.77 80.63 113.72 through implementing agency
Construction of Public toilets, drainage system, Public library cum community hall
Himachal Pradesh 39.75 32.12 35.97 through implementing agency
Providing solar lights, Development of Nurseries, Providing Drinking water supply
Madhya Pradesh 22.85 13.66 17.54 through implementing agency
Construction of Bus shelters at bus stops, Setting up of open gym by providing Exercising Equipment.
Punjab 31.65 31.50 31.50 through implementing agency
D) Measures for the benefit of armed forces veterans, war widows and their dependents
Punjab 1.00 0.68 0.68 through implementing agency

Vardhman Textiles Ltd. Annual Report 2017-1864
CSR Project or activity identified Projects or
programs
1. Local area or other
2. Specify the state
and district where
project or program
was undertaken
Amount outlay
(Budget) project
or program
wise - Direct
Expenditure
on Projects/
Programs
(including
overheads)
Amount spent
on the projects
or programs
subheads
- Direct
Expenditure
on Projects/
Programs
(including
overheads)
Cumulative
Expenditure
upto the
reporting
period
Amount spent:
Direct or
through
implementing
agency
E) Promoting Art and Culture Haryana 3.00 3.00 3.00 through implementing agency
F) Environmental Sustainability
Developing Green Belt area and plantation activities to increase green area
Himachal Pradesh 0.54 0.48 0.48 through implementing agency
Developing Green Belt area and plantation activities to increase green area
Madhya Pradesh 45.16 36.73 38.74 through implementing agency
Total Amount 1931.04 1493.00 1718.33
ANNEXURE- B
Responsibility Statement
It is hereby affirmed that the implementation and monitoring of CSR policy is in compliance with CSR objectives of the Company.
Date: 12th May, 2018 S.P. Oswal A.K. Kundra
Place: Ludhiana Chairman & Managing Director Chairman of CSR Committee

Corporate Overview Statutory Reports Financial Statements Notice 65
ANNEXURE- IV
Dividend Distribution Policy
The equity shares of Vardhman Textiles Limited (“VTXL” or “the Company”) are listed on BSE Ltd. and NSE Ltd, Mumbai. As per the SEBI (Listing Obligations and Disclosure Requirements) Regulations, 2015, as amended, the Company is required to formulate a Dividend Distribution Policy which shall be disclosed in its Annual Report and on its website.
The dividend distribution shall be in accordance with the applicable provisions of the Companies Act, 2013, Rules framed thereunder, SEBI (Listing Obligations and Disclosure Requirements) Regulations, 2015 and other legislations governing dividends and the Articles of Association of the Company, as in force and as amended from time to time.
The Board of Directors of the Company (“the Board”) has approved the Dividend Distribution Policy of the Company (‘the Policy”) which endeavours to enhance stakeholder value for its investors and at the same time tries to ensure the right balance between the quantum of dividend paid and the amount retained for various business purposes.
The Board will recommend dividend distribution based on various internal and external factors, while striving for fairness, consistency and sustainability.
A. Parameters for Declaration of Dividend
1. Internal / Financial Factors:
1.1. Expansion plans
The Company’s growth oriented decision to conserve cash in the Company for future expansion plan impacts shareholders expectation for the long run which shall have to be considered by the Board before taking a dividend decision and to decide on the quantum of dividend.
1.2 Cost of borrowings
The Board will analyze the requirement of necessary funds considering the long term or short term projects proposed to be undertaken by the Company. The viability of the options in terms of cost of raising necessary funds from outsiders such as bankers, lending institutions or by issuance of debt securities or by ploughing back its own funds, will impact the dividend decision.
1.3OperatingcashflowoftheCompany
In case of inadequate operating cash flow, the Company may need to rely on outside funding to meet its financial obligations. Thus, the Board will consider the operating cash flows before its decision whether to declare dividend or retain its profits.
1.4 Return on invested capital
The efficiency with which the Company uses its capital will impact the decision of dividend declaration.
1.5 Corporate Actions
Any Corporate Actions resulting in a significant allocation of capital for the Company may also impact the dividend decision and quantum of dividend.
2. External Factors:
2.1 Macroeconomic conditions
Considering the state of economy in the country, the policy decisions that may be formulated by the Government and other conditions prevailing in the international market which may have a bearing on or affect the business of the Company, the management may consider retaining an appropriate amount of profits to meet unforeseen circumstances. The first & foremost consideration of the business will be to maintain solvency even in times of adversity and to protect the Company from all threats that emanate from changes in the social and political order.
2.2 Statutory Compulsions
Prevailing legal requirements, regulatory conditions or restrictions laid down under the Applicable Laws including tax laws.
B. Utilisation of Retained Earnings
The Company aims in ensuring sustainable wealth creation for its shareholders and with this objective, would utilise the retained earnings of the Company in a manner in which it is beneficial to Company as well as its stakeholders. The Company would aim at achieving the right balance between

Vardhman Textiles Ltd. Annual Report 2017-1866
the distribution of retained earnings among the shareholders and utilisation of the same for meeting other requirements, including expansions. The Board will endeavour to maintain a reasonable dividend pay-out of the Company’s profit after tax on standalone financials (other than extraordinary income).
C. Parameters for various classes of shares
Currently, the Company does not have any other class of shares (including shares with differential voting rights) other than equity shares. In the absence of any other class of shares and/or shares with differential voting rights, the entire distributable profit for the purpose of declaration of dividend is considered for the equity shareholders.
D. Periodic Review
• This Policy would be subject to revision/amendment in accordance with the guidelines as may be issued by Ministry of Corporate Affairs, Securities Exchange Board of India or such other regulatory authority, from time to time, on the subject matter. The Board reserves the right to review this policy on periodical basis, considering various external and internal factors.
E. Disclosure of Policy
The policy will be available on the Company’s website and will also be disclosed in the Company’s Annual Report.

Corporate Overview Statutory Reports Financial Statements Notice 67
ANNEXURE- V
Particulars of Energy Conservation, Technology Absorption and Foreign Exchange Earnings and Outgo required under the Companies (Accounts) Rules, 2014.
Steps taken for Conservation of Energy:
All the units have taken various measures in conservation of energy. The thrust is to measure the existing system parameters and then implement improvements. Emphasis is also given to optimise the operation of various equipments which also lead to energy conservation.
Consequent to the Energy Conservation measures taken, the Company was able to save 76.69 Lac KWH units of electricity thereby making a saving of H 4.67 crore during the financial year 2017-18.
Technology Absorption:
Efforts made in Technology Absorption are furnished as under:
A) Research and Development (R&D):
1. SpecificareasinwhichResearch&DevelopmentiscarriedoutbytheCompany:
Research & Development is carried out for improvement in the production process and quality of products. The Company has been able to pioneer the launch of new products that have been successful in the market due to its R&D efforts.
2. BenefitsderivedasaresultofR&D:
The Company has been continuously improving the quality of its existing products and entered into new products and also been able to reduce the cost of production.
3. Future Course of action:
Management is committed to strengthen R & D activities further to improve its competitiveness in times to come.
4. ExpenditureonR&D:
(H In crore)
2017-18 2016-17
Capital 6.29 6.36
Recurring 0.85 0.94
Total 7.14 7.30
Total R & D expenditure as a Percentage of Turnover 0.12% 0.13%
B) Technology Absorption, Adaptation and Innovation:
1. Efforts made:
The Company is continuously making efforts for adaptation of latest technology in all its units. The Company has also created specific cells for studying and analyzing the existing processes for further improvement.
2. Particularsoftechnologyimportedinlastfiveyears.
a) Technology imported NIL
b) Year of import N.A.
c) Has technology been fully absorbed N.A.
Vardhman Textiles Ltd. Annual Report 2017-1868
Foreign Exchange Earnings and Outgo:
Activities relating to exports, initiatives taken to increase exports, development of new export market for products and services and export plans are given hereunder:
• Exports of Yarns Diversified into new Products & Markets with continuous growth.
• Continuously enhanced the sale of more environment friendly yarns.
Total Foreign Exchange earned and used:
(H In crore)
2017-18 2016-17
a). Earnings (FOB value of Exports, commission earned) 2,211.43 2,206.90
b). Outgo (CIF value of Imports and expenditure in foreign currency) 811.71 439.33

Corporate Overview Statutory Reports Financial Statements Notice 69
ANNEXURE- VI
Particulars of employees and related disclosures:
Details pertaining to remuneration as required under section 197(12) of the Companies Act, 2013 read with Rule 5 (1) of the
Companies (Appointment and Remuneration of Managerial Personnel) Rules, 2014
1. The percentage increase in remuneration of each Director, Chief Financial Officer and Company Secretary during the financial year 2017-18 and ratio of the remuneration of each Director to the median remuneration of the employees of the Company for the financial year 2017-18 are as under:
Note:
* Remuneration of Mrs. Suchita Jain for the financial year 2017-18 cannot be compared with her remuneration in the financial year 2016-17 as she received remuneration for only a part of the financial year 2016-17 (i.e. w.e.f. 24th August, 2016).
** Dr. Parampal Singh was appointed as an Additional Director of Company w.e.f. 27th November, 2017;*** During the year, Mr. Shravan Talwar ceased to be Director of the Company w.e.f. 22nd September, 2017;**** IDBI Bank Limited has withdrawn the nomination of Mr. Kumar Neel Lohit from the Board of the Company w.e.f. 11th December, 2017.# Mr. Sanjay Gupta has been appointed as a Company Secretary (KMP) w.e.f. 1st June, 2017.
2. The median remuneration of employees of the Company during the financial year was H 3.25 Lacs.
3. In the financial year, there was an increase of 2.60% in the median remuneration of employees.
4. There were 20,919 permanent employees on the rolls of the Company as on March 31, 2018.
5. Average percentage increase made in the salaries of employees other than the managerial personnel in the last financial year 2017-18 was 8.66% whereas the increase in the managerial remuneration for the same financial year was -31.93%.
6. It is hereby affirmed that the remuneration paid is as per the Remuneration Policy for Directors, Key Managerial Personnel and other Employees.
Sr.
No.
Name of Director/ KMP and Designation Remuneration
for Directors/
KMP for financial year 2017-18
(Amount In H)
% Increase in
Remuneration
in the financial year 2017-18
Ratio of
Remuneration of Each
Director/ KMP to
Median Remuneration
of Employees
1. S.P. Oswal Chairman & Managing Director 15,18,64,445 -43.03 466.61
2. Sachit Jain Joint Managing Director 1,39,98,116 18.70 43.01
3. Neeraj Jain Joint Managing Director 1,66,09,080 50.34 51.03
4. Suchita Jain Joint Managing Director 1,67,79,295 N.A.* 51.55
5. D.L. Sharma Non- Executive Non- Independent Director - - -
6. Prafull Anubhai Non- Executive Independent Director 3,80,000 -14.61 1.17
7. A.K. Kundra Non- Executive Independent Director 5,00,000 -15.97 1.54
8. D.B. Jain Non- Executive Independent Director 2,60,000 13.04 0.80
9. R.M. Malla Non- Executive Independent Director 1,70,000 -17.07 0.52
10. S.K. Bijlani Non- Executive Independent Director 2,55,000 -1.92 0.78
11. Parampal Singh Additional Director** 35,000 N.A. 0.11
12. Shravan Talwar Non-Executive Independent Director*** 65,000 -31.58 0.20
13. Kumar Neel Lohit Nominee Director of IDBI Bank Ltd.**** 70,000 100 0.22
14. Rajeev Thapar Chief Financial Officer 56,43,508 15.57 17.34
15. Sanjay Gupta Company Secretary# 14,84,844 N.A. 4.56

Vardhman Textiles Ltd. Annual Report 2017-1870
Details pertaining to remuneration as required under section 197(12) of Companies Act, 2013 read with Rule 5 (2) of the
Companies (Appointment and Remuneration of Managerial Personnel) Rules, 2014
A. Persons employed throughout the financial year, who were in receipt of remuneration which, in the aggregate, was not less than H 1,02,00,000/- per annum
B. Persons employed for a part of financial year, who were in receipt of remuneration for any part of that year, at a rate which in aggregate, was not less than J 8,50,000/- per month – NIL
Sr.
No.
Name of
employee
Designation/
Nature of
duties
Remuneration
(in H lac)
Qualification Age
(Years)
Experience
(Years)
Date of
Employment
Particulars
of last
employment
1. Mr. S.P. Oswal
Chairman & Managing Director
1,518.64 M.Com 75 51 08.10.1973 Chairman and Managing Director
(Vardhman Spinning and General Mills Limited)
2. Mr. Sachit Jain
Joint
Managing Director
139.98 B. Tech, MBA 52 28 13.06.1994 Executive Director, VMT Spinning Company Limited
3. Mr. Neeraj Jain
Joint
Managing Director
166.09 B.Com, CA 51 26 31.03.2010 N.A.
4. Mrs. Suchita Jain
Joint
Managing Director
167.79 M.Com 50 25 30.03.2005 N.A.

Corporate Overview Statutory Reports Financial Statements Notice 71
Sr.
No.
Name Age Designation Gross
Remuneration
( J in lakhs per
annum)
Nature of
Employment
Qualification Experience Date of joining Previous
Employment
(Company
Name)
No. of Equity
Shares held on
31.03.2018
1. I.J. Dhuria 64 Director
(Materials)
68.01 Regular B.Sc. (Hons.),
MBA
39.06 05/10/1989 Modi Spinning
& Weaving
Mills Ltd.
950
2. I.M.J.S
Sidhu
70 President &
Director
In-charge
64.64 Regular B.Text. 47.00 03/03/1981 Shree
Bhawani
Cotton Mills
Ltd.
1500
3. D.K.
Sindwani
57 Director
(Corporate
Services)
63.50 Regular B.Com , CA 33.00 01/04/2015 Hero Steels
Ltd.
500
4. Rajeev
Thapar
50 CFO 56.43 Regular B.Com (Hons.),
CA
28.08 01/06/1990 S C Vasudeva
& Co.
610
5. Rakesh
Mishra
56 Vice-President 52.15 Regular B.Sc, M.Sc,
MCA, MBA
31.04 28/01/2016 Jindal Steel
Ltd.
500
6. S. Pal 74 Director (MP
Location)
51.47 Regular MA (Pol.Sc.),
MA (History),
Dip.PM/IR
54.00 15/05/1985 Punjab
Alkalies &
Chemicals
Ltd.
1500
7. T.C.
Gupta
58 Chief General
Manager
(Operations)
47.01 Regular B.Tech.
(Textiles)
35.11 24/05/1993 Modern
Syntex Ltd.
100
8. K.K.
Lahiri
60 Chief General
Manager
(Operations)
46.16 Regular B.Text., M.Text.
(IIT), Dip.in
Mgmt.
35.00 11/04/1986 Rama Fabrics 0
9. S.K. Rai 41 Vice-President 46.00 Regular BCA, MIT, MBA 15.06 22/08/2017 International
Tractors Ltd.
0
10. Parveen
Dhingra
53 General
Manager
(Operations)
45.15 Regular B.Text. 29.05 27/09/1993 Deepak
Spinners Ltd.
400
C. A statement showing details of Top Ten Employees in terms of remuneration drawn:
Sr.
No.
Name of Director Name of Subsidiary Company Amount (In H lacs)
1. Mr. Neeraj Jain VMT Spinning Co. Ltd. 25.36
Note: None of the above employees is related to any Director of the Company.
Details pertaining to Remuneration or Commission received from Holding or Subsidiary of the Company as required under
Section 197(14) of the Companies Act, 2013
Vardhman Textiles Ltd. Annual Report 2017-1872
CORPORATE GOVERNANCE REPORT
This report on corporate governance forms part of the Annual Report. Corporate governance refers to a combination of laws, regulations, procedures, implicit rules and good corporate practices that ensure that a Company meets its obligations to optimize shareholders’ value and fulfill its responsibilities to the community, customers, employees, Government and other segments of society. Your Company is committed on adopting the best practices of Corporate Governance as manifested in the Company’s functioning to achieve the business excellence by enhancing long-term shareholders’ value. Efficient conduct of the business of the Company through commitment to transparency and business ethics in discharging its corporate responsibilities is hallmarks of the best practices followed by the Company. This report on Corporate Governance, besides being in compliance of the mandatory SEBI (Listing Obligations & Disclosures Requirements) Regulations, 2015, gives an insight into the functioning of the Company.
1. Company’s Philosophy:
• Faith in bright future of Indian textiles and hence continued expansion in areas “which we know best”.
• Total customer focus in all operational areas.
• Products to be of best available quality for premium market segments through TQM.
• Zero defect implementation.
• Global orientation targeting – at least 20% production for exports.
• Integrated diversification/ product range expansion.
• World class manufacturing facilities with most modern R & D and process technology.
• Faith in individual potential and respect for human values.
• Encouraging innovation for constant improvements to achieve excellence in all functional areas.
• Accepting change as a way of life.
• Appreciating our role as a responsible corporate citizen.
2. Board of Directors/ Board Meetings:
i. Composition as on March 31st, 2018
The Composition of Board and category of Directors are as follows:-
Category Name of Directors
Promoter
Directors
# S.P. Oswal- Chairman & Managing Director
# Sachit Jain- Joint Managing Director
# Suchita Jain- Joint Managing Director
Executive Non- Independent
Director
Neeraj Jain- Joint Managing Director
Independent
Directors
Prafull Anubhai
A.K. Kundra
D.B. Jain
R.M. Malla
S.K. Bijlani
Parampal Singh (Additional Director)
Non- Executive Non- Independent
Director
D.L. Sharma
Relationship Inter-se:
# Except Mr. S.P. Oswal, Mr. Sachit Jain and Mrs. Suchita Jain, none of the Director of the Company is related to any other Director of the
Company.
ii. Board Meetings:
During the financial year 2017-2018, the Board met 4 (Four) times on the following dates:
• 10th May, 2017
• 11th August, 2017
• 08th November, 2017
• 6th February, 2018

Corporate Overview Statutory Reports Financial Statements Notice 73
Name of Director No. of
Board
meetings
attended
Attendance
at last AGM
Total No. of
Director-
ships in other
Companies
No. of
Committee
memberships in
other Companies
Total No.
of Board
Chairmanship in
other Companies
Total No. of
Committee
Chairmanship in
other companies
S.P. Oswal 4 Yes 7 - 3 -
Sachit Jain 3 No 5 2 - 1
Suchita Jain 3 Yes 7 1 - -
Neeraj Jain 4 Yes 4 - - -
D.L. Sharma 2 Yes 10 2 1 -
Prafull Anubhai 4 Yes 3 3 - 1
A. K Kundra 4 No 2 - - -
D.B. Jain 4 No - - - -
R.M. Malla 4 No 6 2 - 1
S.K. Bijlani 3 No 1 1 - -
Parampal Singh* 1 No - - - -
Shravan Talwar** 2 No - - - -
Kumar Neel Lohit***
2 No - - - -
Name of
Committee
Composition Terms of Reference
Audit Committee Prafull Anubhai (Chairman)
• The role of the Audit Committee is as per Section 177 of the Companies Act, 2013 read with Regulation 18 of the SEBI (Listing Obligations and Disclosure Requirements) Regulation, 2015.A.K. Kundra
D.B. Jain
D.L. Sharma
S.K. Bijlani
Nomination and
Remuneration Committee
Prafull Anubhai (Chairman)
• The role of the Nomination and Remuneration Committee is as per Section 178 of the Companies Act, 2013 read with Regulation 19 of SEBI (Listing Obligations and Disclosure Requirements) Regulations, 2015.
• Formulated and recommended Nomination and Remuneration Policy.
• The Nomination & Remuneration Policy includes policy on Director’s appointment and remuneration including the criteria for determining qualifications, positive attributes, independence of a Director and other matters as provided under Section 178(3) of the Companies Act, 2013.
• Nomination and Remuneration Policy of the Company forms part of the Board Report as Annexure I.
S.P. Oswal
A.K. Kundra
iii. Attendance of the Directors at the Board Meetings during the year and at last Annual General Meeting of the
Company as also the number of other Directorship/Chairmanship in Indian Public Limited Companies are as follows:-
* Dr. Parampal Singh was appointed as an Additional Director of Company w.e.f. 27th November, 2017;
** During the year, Mr. Shravan Talwar ceased to be a Director of the Company w.e.f. 22nd September, 2017;
*** IDBI Bank Limited has withdrawn the nomination of Mr. Kumar Neel Lohit from the Board of the Company w.e.f. 11th December, 2017.
Video conferencing facility was provided to facilitate Directors travelling abroad or present at other locations to participate in the Board meetings.
3. Board Committees:
i. Board Committees, their composition and terms of reference are provided as under:

Vardhman Textiles Ltd. Annual Report 2017-1874
Board Committees Audit CSR Nomination &
Remuneration
Stakeholders
Relationship
Meetings held 5 3 2 1
S.P. Oswal N.A. N.A. 2 N.A.
Sachit Jain N.A. 0 N.A. 0
Suchita Jain N.A. N.A. N.A. N.A.
Neeraj Jain N.A. 3 N.A. N.A.
D.L. Sharma 3 2 N.A. 1
Prafull Anubhai 5 N.A. 2 N.A.
A. K Kundra 5 3 2 1
D.B. Jain 4 N.A. N.A. N.A.
R.M. Malla N.A. N.A. N.A. N.A.
S.K. Bijlani 4 N.A. N.A. N.A.
Parampal Singh* N.A. N.A. N.A. N.A.
Shravan Talwar** 2 N.A. N.A. N.A.
Kumar Neel Lohit*** N.A. N.A. N.A. N.A.
N.A.- Not a member of the Committee.
* Dr. Parampal Singh was appointed as an Additional Director of Company w.e.f. 27th November, 2017;
** During the year, Mr. Shravan Talwar ceased to be a Director of the Company w.e.f. 22nd September, 2017;
*** IDBI Bank Limited has withdrawn the nomination of Mr. Kumar Neel Lohit from the Board of the Company w.e.f. 11th December, 2017.
Mr. Sanjay Gupta, Company Secretary and Compliance Officer of the Company is the Secretary of all Board Committees constituted under the Companies Act, 2013 and SEBI (Listing Obligations and Disclosure Requirements) Regulations, 2015.
ii. Meetings of Board Committees held during the year and Director’s attendance:
Name of
Committee
Composition Terms of Reference
Corporate Social Responsibility Committee
A.K. Kundra (Chairman)
• Formulated and recommended CSR Policy of the Company indicating CSR activities proposed to be undertaken by the Company pursuant to provisions of Schedule VII of the Companies Act, 2013 read with CSR Rules, 2014. The CSR policy may be accessed on the Company’s website at the link: http://www.vardhman.com/user_files/d622b1c8d626fabfcecf09e145cb1b4e9f4884761436264563.pdf.
• Recommends expenditure to be incurred for CSR activities/project and ensures effective monitoring of CSR policy of the Company from time to time.
• The Annual Report on CSR activities undertaken by the Company forms part of the Board Report as Annexure III.
D.L. Sharma
Neeraj Jain
Sachit Jain
Stakeholder’s Relationship Committee
A.K. Kundra (Chairman)
• The Committee reviews and ensures redressal of investor grievances.
• The Committee noted that during the year the Company received 11 complaints related to non-receipt of dividend, bonus shares and annual report, etc. All the complaints have been duly resolved by the Company and there is no pendency in respect of shares received for transfer during 2017-2018 except those that are disputed/ sub-judice.
D.L. Sharma
Sachit Jain

Corporate Overview Statutory Reports Financial Statements Notice 75
iii. Meeting of Independent Directors:
A meeting of Independent Directors of the Company for the calendar year 2017 was held on 8th November, 2017 to evaluate the performance of Non-Independent Directors of the Company, Chairman of the Company and the Board as a whole.
Performance Evaluation
The performance evaluation of Non-Independent Directors of the Company, Chairman of the Company and the Board as a whole, was done by Independent Directors by way of discussions on their performance.
A policy on the performance evaluation of Independent Directors, Board, Committees and other individual Directors which includes criteria for performance evaluation of non-executive directors and executive directors has been formulated by the Company.
Pursuant to the provisions of the Companies Act, 2013, Listing Regulations and as per the Nomination, Appointment and Remuneration Policy, the Board of Directors/ Independent Directors/Nomination & Remuneration Committee (“NRC”) (as applicable) had undertaken an evaluation of the Board’s own performance, the performance of its Committees and of all the individual Directors including the Chairman of the Board of Directors based on various parameters relating to roles, responsibilities and obligations of the Board, effectiveness of its functioning, contribution of Directors at meetings and the functioning of its Committees.
Familiarisation programme for Independent Directors
The details of the Familiarisation Programme conducted for the Independent Directors of the Company are available on the Company’s website at the link: https://www.vardhman.com/user_files/investor/familarisation.pdf
4. Directors’ Remuneration:
i) Chairman and Managing Director / Executive Directors:
The Company pays remuneration to Chairman and Managing Director and Joint Managing Directors as approved by the Board of Directors and the Members of the Company in the General Meeting.
A detail of remuneration paid to the Directors during the year 2017-18 is as given below:
ii) Non-Executive Directors:
Non-Executive Directors have not been paid any remuneration except sitting fees for attending Board & Committee Meetings.
The Non-Executive Directors are paid sitting fees @ H 35,000/- per Board Meeting and @ H 30,000/- per Committee Meeting. The detail of sitting fees paid to the Directors during the Financial Year 2017-18 is given hereunder: -
Name Designation Salary Perquisites &
Allowances
Retirement
BenefitCommission Gross
remuneration
S.P. Oswal Chairman & Managing Director 65.31 7.22 5.60 1,440.51 1,518.64Sachit Jain Joint Managing Director 85.56 0.43 6.05 47.94 139.98Neeraj Jain Joint Managing Director 86.71 12.82 6.06 60.50 166.09Suchita Jain Joint Managing Director 94.08 0.43 6.78 66.50 167.79
Name of Director Sitting Fee (H)
1. Prafull Anubhai 3,80,000
2. A.K. Kundra 5,00,000
3. D.B. Jain 2,60,000
4. R.M. Malla 1,70,000
5. S.K. Bijlani 2,55,000
6. Parampal Singh* 35,000
7. Shravan Talwar** 65,000
8. Kumar Neel Lohit (IDBI Nominee)*** 70,000 * Dr. Parampal Singh was appointed as an Additional Director of Company w.e.f. 27th November, 2017; ** During the year, Mr. Shravan Talwar ceased to be a Director of the Company w.e.f. 22nd September, 2017; *** IDBI Bank Limited has withdrawn the nomination of Mr. Kumar Neel Lohit from the Board of the Company w.e.f. 11th December, 2017.
(H in Lakhs)

Vardhman Textiles Ltd. Annual Report 2017-1876
5. Shareholding details of Directors as on 31st March, 2018:
The shareholding of the Directors in the Equity Share Capital of the Company is given as follows: -
No other director holds any share in the Equity Share Capital of the Company.
6. General Body Meetings:
i. The details of Annual General Meeting & no. of Special Resolutions passed during last three financial years are as follows:
ii. Postal Ballot
During the year, no resolution was passed through postal ballot. There is no immediate proposal for passing any resolution through postal ballot in financial year 2018-19.
7. Disclosures:
i. There was no materially significant related party transaction that may have any potential conflict with interest of the Company at large. Transactions with related parties are disclosed in Note No. 33 to the Financial Statements. The Policy on dealing with related party transactions as approved by the Board may be accessed on the Company’s website at the link: http://www.vardhman.com/user files/96c45534e3ab096d9bc682f8eebade0344f915151436264609.pdf.
ii. There has not been any non-compliance by the Company in respect of which penalties or strictures were imposed by the Stock Exchanges or the Securities Exchange Board of India (SEBI) or any other Statutory Authority during the last three years.
iii. The Company promotes ethical behaviour in all its business activities and has put in place a mechanism for reporting illegal or unethical behaviour. The Company has a Vigil mechanism and Whistle Blower Policy under which the
S.
No.
Name of Director Number of Shares Held
1. S.P. Oswal 5,97,591
2. Suchita Jain 2,44,424
3. Neeraj Jain 1,515
4. D.L. Sharma 5,003
Meeting Day, Date and Time of the
Meeting
Venue No. of Special Resolutions
44th Annual General Meeting for the Financial year ended 31st March, 2017.
Friday, 22nd September, 2017 at 09.00 A.M.
Regd. Office, Chandigarh Road, Ludhiana- 141010.
1
43rd Annual General Meeting for the year ended 31st March, 2016.
Monday, 5th September, 2016 at 09:00 A.M.
Regd. Office, Chandigarh Road, Ludhiana- 141010.
1
42nd Annual General Meeting for the year ended 31st March, 2015.
Friday, 4th September, 2015 at 10.00 A.M.
Regd. Office, Chandigarh Road, Ludhiana- 141010.
1

Corporate Overview Statutory Reports Financial Statements Notice 77
employees are free to report violations of applicable laws and regulations and the Code of Conduct. The policy on “Vigil Mechanism and Whistle Blower” may be accessed on the Company’s website at the link: http://www.vardhman.com/user_files/20b9bcdbd2cc01fde3e8e7d392d93573769de1941436265078.pdf
iv. The Company has complied with all the applicable requirements specified in Regulation 17 to 27 and 46 of SEBI (Listing Obligations and Disclosure Requirements) Regulations, 2015.
v. The Board of Directors of the Company has adopted (i) the Code of Practices and Procedures for Fair Disclosure of Unpublished Price Sensitive Information and (ii) the Code of Conduct, as required under SEBI (Prohibition of Insider Trading) Regulations, 2015.
vi. During the year no case was filed pursuant to the Sexual Harassment of Women at Workplace (Prevention, Prohibition and Redressal) Act, 2013.
vii. Risk Management Policy as required under SEBI (Listing Obligations and Disclosure Requirements) Regulations, 2015 has been duly formulated and approved by Board of Directors of the Company. The aim of Risk Management Policy is to maximize the opportunities in all activities and to minimize adversity.
viii. Further, the Company has complied with all mandatory requirements of SEBI (Listing Obligations and Disclosure Requirements) Regulations, 2015. The Company may also take up the non-mandatory requirements of the Regulations in due course of time.
ix. As on March 31, 2018, there were no outstanding GDRs/ ADRs/ Warrants or any convertible instruments.
x. During the year 2017-18, the Company had managed the foreign exchange risk and commodity price risk and hedged to the extent considered necessary. The Company enters into forward contracts and options contracts for hedging foreign exchange exposures against exports and imports. Further, Company also enters in commodity forward contracts for hedging commodity price risk exposures on cotton purchase. The details of foreign currency exposure are disclosed in the Note No. 37 to the Financial Statements.
xi. The Company has no material subsidiary.
8. Means of Communication:
The Company communicates with the shareholders at large through its Annual Reports, publication of financial results, press releases in leading newspapers, conducting analyst meets and by filing of various reports and returns with the Statutory Bodies like Stock Exchanges and the Registrar of Companies. The Quarterly Financial Results are published in prominent daily newspapers viz., “Business Standard” and “Desh Sewak”. The Financial Results of the Company are also made available at the Company’s web-site www.vardhman.com.

Vardhman Textiles Ltd. Annual Report 2017-1878
i) 45th Annual General Meeting:
Date : 27th September, 2018 Time : 11:00 a.m. Venue : Regd. Office, Vardhman Premises, Chandigarh Road, Ludhiana-141 010ii) Financial Calendar 2018-19 (Tentative)
First Quarter Results : August, 2018 Second Quarter Results : November, 2018 Third Quarter Results : February, 2019 Annual Results : May, 2019iii) Dates of Book Closure : 17th September, 2018 to 27th September, 2018 (both days inclusive)iv) Dividend payment date : Within 30 days after declaration.v) Listing : The securities of the Company are listed on the following Stock Exchanges: -
1. The BSE Limited, Mumbai (BSE), 1st Floor, New Trading Ring, Rotunda Building, P.J. Towers, Dalal Street, Fort, Mumbai-400 001.
2. The National Stock Exchange of India Limited (NSE), Exchange Plaza, Bandra-Kurla Complex, Bandra (East), Mumbai.
Listing fee, as applicable, has been duly paid to both the aforesaid Stock Exchanges.
vi) Stock Code:
• The Bombay Stock Exchange Limited, Mumbai : 502986
• The National Stock Exchange of India Limited : VTL
vii) Stock Market Data:
The month-wise highest and lowest and closing stock prices of NSE vis-a-vis BSE during the financial year 2017-18 is given below: -
GENERAL INFORMATION FOR SHAREHOLDERS
Financial Year
2017-18
Share Prices of Vardhman Textiles Limited on NSE Share Prices of Vardhman Textiles Limited on BSE
Highest (H) Lowest (H) Closing (H) %age
change over
last month’s
closing
Highest (H) Lowest (H) Closing (H) %age
change over
last month’s
closing
April 1391.20 1280.05 1298.45 -1.08 1430.00 1280.00 1294.9 -1.76May 1349.85 1251.00 1297.00 -0.11 1400.00 1252.00 1299.15 0.33June 1315.00 1128.30 1139.80 -12.12 1325.00 1130.00 1138.8 -12.34July 1243.10 1128.35 1218.65 6.92 1249.70 1128.95 1222.6 7.36August 1248.00 1138.00 1223.60 0.41 1234.55 1138.50 1222.5 -0.01September 1349.00 1164.00 1337.10 9.28 1345.00 1161.70 1330.05 8.80October 1354.95 1225.00 1289.70 -3.54 1366.00 1220.35 1291.8 -2.88November 1334.40 1215.05 1308.85 1.48 1331.00 1218.95 1304.95 1.02December 1398.90 1277.05 1378.85 5.35 1399.00 1275.50 1367.55 4.80January 1559.95 1293.00 1297.40 -5.91 1565.10 1290.00 1295.7 -5.25February 1415.00 1266.55 1347.95 3.90 1407.35 1266.00 1351.15 4.28March 1384.75 1188.00 1222.20 -0.09 1378.45 1194.05 1220.75 -9.65
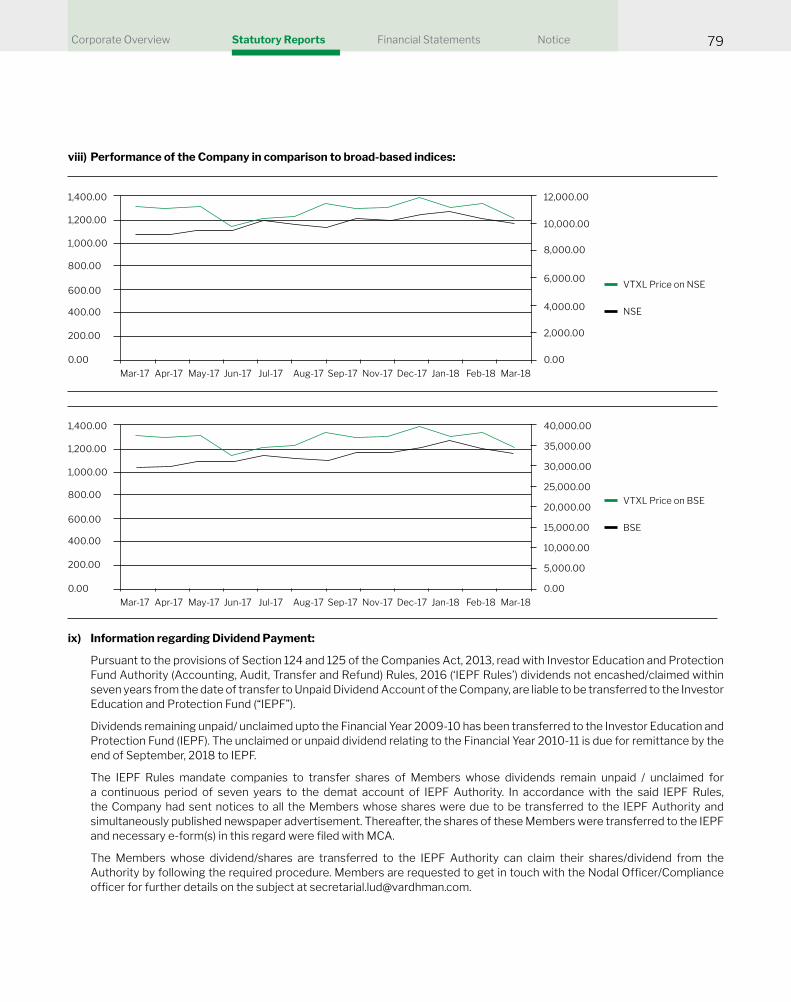
Corporate Overview Statutory Reports Financial Statements Notice 79
viii) Performance of the Company in comparison to broad-based indices:
ix) Information regarding Dividend Payment:
Pursuant to the provisions of Section 124 and 125 of the Companies Act, 2013, read with Investor Education and Protection Fund Authority (Accounting, Audit, Transfer and Refund) Rules, 2016 (‘IEPF Rules’) dividends not encashed/claimed within seven years from the date of transfer to Unpaid Dividend Account of the Company, are liable to be transferred to the Investor Education and Protection Fund (“IEPF”).
Dividends remaining unpaid/ unclaimed upto the Financial Year 2009-10 has been transferred to the Investor Education and Protection Fund (IEPF). The unclaimed or unpaid dividend relating to the Financial Year 2010-11 is due for remittance by the end of September, 2018 to IEPF.
The IEPF Rules mandate companies to transfer shares of Members whose dividends remain unpaid / unclaimed for a continuous period of seven years to the demat account of IEPF Authority. In accordance with the said IEPF Rules, the Company had sent notices to all the Members whose shares were due to be transferred to the IEPF Authority and simultaneously published newspaper advertisement. Thereafter, the shares of these Members were transferred to the IEPF and necessary e-form(s) in this regard were filed with MCA.
The Members whose dividend/shares are transferred to the IEPF Authority can claim their shares/dividend from the Authority by following the required procedure. Members are requested to get in touch with the Nodal Officer/Compliance officer for further details on the subject at [email protected].
VTXL Price on NSE
NSE
1,400.00 12,000.00
1,200.00 10,000.00
1,000.008,000.00
800.00
600.006,000.00
400.00 4,000.00
200.00 2,000.00
0.00Mar-17 Apr-17 May-17 Jun-17 Jul-17 Aug-17 Sep-17 Nov-17 Dec-17 Jan-18 Feb-18 Mar-18
0.00
VTXL Price on BSE
BSE
1,400.00 40,000.00
1,200.00 35,000.00
1,000.00 30,000.00
800.00
600.00
25,000.00
400.00
20,000.00
10,000.00
200.00
15,000.00
5,000.00
0.00Mar-17 Apr-17 May-17 Jun-17 Jul-17 Aug-17 Sep-17 Nov-17 Dec-17 Jan-18 Feb-18 Mar-18
0.00

Vardhman Textiles Ltd. Annual Report 2017-1880
x) Registrar & Transfer Agent:
The work related to Share Transfer Registry in terms of both physical and electronic mode is being dealt with by M/s. Alankit Assignments Limited at the address given below: -
M/s. Alankit Assignments Limited,
(Unit: Vardhman Textiles Limited)
1E/13, Alankit Heights, Jhandewalan Extension, New Delhi - 110 055.
Phone: (011) 41540060-63, Fax: (011) 41540064, E-mail: [email protected]
xi) Share Transfer System:
The Company has constituted a Share Transfer Committee of its Directors. The Committee meets on an average once in 10 days. The list of valid transfers prepared by the Transfer Agent in respect of transfer cases received by them and objections, if any, are placed before the Committee for its approval/confirmation. The Share Certificates are returned back to the shareholders by Transfer Agent within 15 days from the date of receipt by them.
The shares of the Company are traded on the Stock Exchanges compulsorily in demat form. The Company has participated as an issuer both with National Securities Depository Limited (NSDL) and Central Depository Services (India) Limited (CDSL). The shareholders may operate through any of the depositories, based on tariffs, quality and range of services being offered by them. The International Securities Identification Number (ISIN) of the Company is INE 825 A01012.
xii) Distribution of Shareholding as on 31st March, 2018:
xiii) Dematerialisation of shares:
As on 31st March, 2018, 98.40% of the capital comprising 5,65,17,362 shares, out of total of 5,74,33,460 shares, were dematerialized.
xiv) Stock Options:
The Company has granted options to its employees under Vardhman Textiles Limited Employee Stock Options Plan, 2016 (hereinafter referred as ESOP Plan). As per the terms of the plan, the Company can grant a maximum of 6,36,518 options to eligible employees from time to time. One option entitles the holder to apply for one equity share of the Company in terms of ESOP Plan. Accordingly, during the financial year, a total of 49,250 options were exercised by the eligible employees. Out of this, 42,450 equity shares were allotted during the year ended 31st March, 2018 and 6800 equity shares were allotted on 9th April, 2018. So, the paid up equity share capital of the Company stood increased to H 57,43,34,600 as on 31st March, 2018.
Range No. of Shares Shareholders Shares
Numbers of total
Holders
% to Total Holders Numbers of shares
Held
% to Total Shares
Upto-500 21727 91.42 1925381 3.35
501-1000 999 4.20 709240 1.24
1001-2000 478 2.01 682363 1.19
2001-3000 150 0.63 380457 0.66
3001-4000 67 0.28 235695 0.41
4001-5000 42 0.18 195206 0.34
5001-10000 99 0.42 715621 1.25
10001- above 203 0.86 52589497 91.56
Total 23765 100 57433460 100

Corporate Overview Statutory Reports Financial Statements Notice 81
xv) Plant Location:
• Arihant Spinning Mill Industrial Area, Malerkotla-148 023
• Anant Spinning Mills, New Industrial Area, Mandideep-462 046
• Arisht Spinning Mills, Sai Road, Baddi, Distt. Solan (H.P.)- 173 205.
• Auro Spinning Mills, Sai Road, Baddi, Distt. Solan (H.P.)- 173 205.
• Auro Dyeing,(Unit –I & II) Sai Road, Baddi, Distt. Solan (H.P.)- 173 205.
• Auro Weaving Mills, Sai Road Baddi, Distt. Solan (H.P.) - 173 205.
• Auro Textiles (Unit-I & II) Sai Road, Baddi, Distt. Solan (H.P.)- 173 205
• Mahavir Spinning Mills (Textile Division) Sai Road, Baddi, Distt. Solan (H.P.)- 173 205
• Mahavir Spinning Mills (Textile Division) (Unit II), Sai Road, Baddi, Distt, Solan (H.P.) - 173205
I, S.P. Oswal, Chairman & Managing Director of Vardhman Textiles Limited declare that all Board Members and Senior Management Personnel have affirmed compliance with ‘Code of Conduct for Board & Senior Management Personnel’ for the year ended 31st March, 2018.
Place: Ludhiana S.P. Oswal
Dated: 12th May, 2018 Chairman & Managing Director
• Vardhman Spinning Mills, Sai Road, Baddi, Distt. Solan (H.P.)- 173 205
• Vardhman Spinning and General Mills, Chandigarh Road, Ludhiana-141 010.
• Vardhman Fabrics Budhni, Distt. Sehore (M.P.)
• Vardhman Yarns Satlapur, Distt. Raisen (M.P.)
• Vardhman Fabrics (Power Division) Budhni, Distt. Sehore (M.P.)
• Vardhman Yarns (Power Division) Satlapur, Distt. Raisen (M.P.)
xvi) Address for correspondence:
Registered office : Chandigarh Road, Ludhiana-141010 Tel : 0161-2228943-48 Fax : 0161-2601048, 2602710, 2222616 E-mail : [email protected] (Exclusively for redressal of investors’ grievances)
CHAIRMAN & MANAGING DIRECTOR’S DECLARATION

Vardhman Textiles Ltd. Annual Report 2017-1882
To the Members of Vardhman Textiles Limited
Independent Auditor’s Certificate on Corporate Governance
1. This certificate is issued in accordance with the terms of our engagement letter dated November 6, 2017.
2. We, Deloitte Haskins & Sells LLP, Chartered Accountants, the Statutory Auditors of Vardhman Textiles Limited (“the Company”), have examined the compliance of conditions of Corporate Governance by the Company, for the year ended on March 31, 2018, as stipulated in regulations 17 to 27 and clauses (b) to (i) of regulation 46(2) and para C and D of Schedule V of the SEBI (Listing Obligations and Disclosure Requirements) Regulations, 2015 (the Listing Regulations).
Managements’ Responsibility
3. The compliance of conditions of Corporate Governance is the responsibility of the Management. This responsibility includes the design, implementation and maintenance of internal control and procedures to ensure the compliance with the conditions of the Corporate Governance stipulated in Listing Regulations.
Auditor’s Responsibility
4. Our responsibility is limited to examining the procedures and implementation thereof, adopted by the Company for ensuring compliance with the conditions of the Corporate Governance. It is neither an audit nor an expression of opinion on the financial statements of the Company.
5. We have examined the books of account and other relevant records and documents maintained by the Company for the purposes of providing reasonable assurance on the compliance with Corporate Governance requirements by the Company.
6. We have carried out an examination of the relevant records of the Company in accordance with the Guidance Note on Certification of Corporate Governance issued by the
Institute of the Chartered Accountants of India (the ICAI), the Standards on Auditing specified under Section 143(10) of the Companies Act 2013, in so far as applicable for the purpose of this certificate and as per the Guidance Note on Reports or Certificates for Special Purposes issued by the ICAI which requires that we comply with the ethical requirements of the Code of Ethics issued by the ICAI.
7. We have complied with the relevant applicable requirements of the Standard on Quality Control (SQC) 1, Quality Control for Firms that Perform Audits and Reviews of Historical Financial Information, and Other Assurance and Related Services Engagements.
Opinion
8. Based on our examination of the relevant records and according to the information and explanations provided to us and the representations provided by the Management, we certify that the Company has complied with the conditions of Corporate Governance as stipulated in regulations 17 to 27 and clauses (b) to (i) of regulation 46(2) and para C and D of Schedule V of the Listing Regulations during the year ended March 31, 2018.
9. We state that such compliance is neither an assurance as to the future viability of the Company nor the efficiency or effectiveness with which the Management has conducted the affairs of the Company.
For Deloitte Haskins & Sells LLP
Chartered Accountants (Firm‘s Registration No. 117366W / W-100018)
Rajesh Kumar Agarwal
Place: Ludhiana Partner Date: May 12, 2018 (Membership No. 105546)
CORPORATE GOVERNANCE CERTIFICATE
Corporate Overview Statutory Reports Financial Statements Notice 83
Independent Auditor’s Report
To the Members of Vardhman Textiles Limited
Report on the Standalone Ind AS Financial Statements
We have audited the accompanying standalone Ind AS
financial statements of Vardhman Textiles Limited (“the Company”), which comprise the Balance Sheet as at March 31,
2018, and the Statement of Profit and Loss (including Other Comprehensive Income), the Cash Flow Statement and the
Statement of Changes in Equity for the year then ended, and
a summary of the significant accounting policies and other explanatory information.
Management’s Responsibility for the Standalone Ind AS Financial Statements
The Company’s Board of Directors is responsible for the matters
stated in Section 134(5) of the Companies Act, 2013 (“the Act”) with respect to the preparation of these standalone Ind AS
financial statements that give a true and fair view of the financial position, financial performance including other comprehensive income, cash flows and changes in equity of the Company in accordance with the Indian Accounting Standards (Ind AS) prescribed under section 133 of the Act read with the Companies
(Indian Accounting Standards) Rules, 2015, as amended, and other accounting principles generally accepted in India.
This responsibility also includes maintenance of adequate
accounting records in accordance with the provisions of
the Act for safeguarding the assets of the Company and
for preventing and detecting frauds and other irregularities;
selection and application of appropriate accounting policies;
making judgments and estimates that are reasonable and
prudent; and design, implementation and maintenance of
adequate internal financial controls, that were operating effectively for ensuring the accuracy and completeness
of the accounting records, relevant to the preparation and
presentation of the standalone Ind AS financial statements that give a true and fair view and are free from material
misstatement, whether due to fraud or error.
Auditor’s Responsibility
Our responsibility is to express an opinion on these standalone Ind AS financial statements based on our audit.
In conducting our audit, we have taken into account the
provisions of the Act, the accounting and auditing standards
and matters which are required to be included in the audit report
under the provisions of the Act and the Rules made thereunder and the Order issued under section 143(11) of the Act.
We conducted our audit of the standalone Ind AS financial statements in accordance with the Standards on Auditing
specified under Section 143(10) of the Act. Those Standards require that we comply with ethical requirements and plan
and perform the audit to obtain reasonable assurance about
whether the standalone Ind AS financial statements are free from material misstatement.
An audit involves performing procedures to obtain audit
evidence about the amounts and the disclosures in the
standalone Ind AS financial statements. The procedures selected depend on the auditor’s judgment, including the
assessment of the risks of material misstatement of the
standalone Ind AS financial statements, whether due to fraud or error. In making those risk assessments, the auditor considers internal financial control relevant to the Company’s preparation of the standalone Ind AS financial statements that give a true and fair view in order to design audit procedures that
are appropriate in the circumstances. An audit also includes evaluating the appropriateness of the accounting policies used
and the reasonableness of the accounting estimates made
by the Company’s Directors, as well as evaluating the overall
presentation of the standalone Ind AS financial statements.
We believe that the audit evidence obtained by us is sufficient and appropriate to provide a basis for our audit opinion on the
standalone Ind AS financial statements.
Opinion
In our opinion and to the best of our information and according
to the explanations given to us, the aforesaid standalone Ind AS financial statements give the information required by the Act in the manner so required and give a true and fair
view in conformity with the Ind AS and other accounting
principles generally accepted in India, of the state of affairs

Vardhman Textiles Ltd. Annual Report 2017-1884
of the Company as at March 31, 2018, and its profit, total comprehensive income, its cash flows and the changes in equity for the year ended on that date.
Report on Other Legal and Regulatory Requirements
1. As required by Section 143(3) of the Act, based on our audit we report that:
a) We have sought and obtained all the information and
explanations which to the best of our knowledge and belief were necessary for the purposes of our audit.
b) In our opinion, proper books of account as required
by law have been kept by the Company so far as it
appears from our examination of those books.
c) The Balance Sheet, the Statement of Profit and Loss including Other Comprehensive Income, the Cash Flow Statement and Statement of Changes in Equity
dealt with by this Report are in agreement with the relevant books of account.
d) In our opinion, the aforesaid standalone Ind AS
financial statements comply with the Indian Accounting Standards prescribed under Section 133
of the Act.
e) On the basis of the written representations received from the directors of the Company as on March 31,
2018 taken on record by the Board of Directors,
none of the directors is disqualified as on March 31, 2018 from being appointed as a director in terms of
Section 164(2) of the Act.
f) With respect to the adequacy of the internal financial controls over financial reporting of the Company and the operating effectiveness of such controls, refer
to our separate Report in “Annexure A”. Our report expresses an unmodified opinion on the adequacy
and operating effectiveness of the Company’s
internal financial controls over financial reporting for the reasons stated therein.
g) With respect to the other matters to be included in
the Auditor’s Report in accordance with Rule 11 of the Companies (Audit and Auditors) Rules, 2014, as amended, in our opinion and to the best of our
information and according to the explanations given to us:
i. The Company has disclosed the impact of pending litigations on its financial position in its standalone Ind AS financial statements – Refer to Note 38(a) to the standalone Ind AS financial statements;
ii. The Company did not have any long-term contracts including derivative contracts for
which there were any material foreseeable
losses – Refer to Note 38(e) to the standalone Ind AS financial statements;
iii. There has been no delay in transferring amounts, required to be transferred, to the Investor
Education and Protection Fund by the Company
2. As required by the Companies (Auditor’s Report) Order, 2016 (“the Order”) issued by the Central Government in terms of Section 143(11) of the Act, we give in “Annexure B” a statement on the matters specified in paragraphs 3 and 4 of the Order.
For Deloitte Haskins & Sells Llp
Chartered Accountants
(Firm‘s Registration No. 117366W / W-100018)
Vijay Agarwal
Place: Ludhiana (Partner) Date: May 12, 2018 (Membership No. 094468)

Corporate Overview Statutory Reports Financial Statements Notice 85
Annexure “A” to the Independent Auditor’s Report
Report on the Internal Financial Controls Over Financial Reporting under Clause (i) of Sub-section 3 of Section 143 of the Companies Act, 2013 (“the Act”)
We have audited the internal financial controls over financial reporting of Vardhman Textiles Limited (“the Company”) as of March 31, 2018 in conjunction with our audit of the standalone
Ind AS financial statements of the Company for the year ended on that date.
Management’s Responsibility for Internal Financial Controls
The Company’s management is responsible for establishing
and maintaining internal financial controls based on the internal control over financial reporting criteria established by the Company considering the essential components
of internal control stated in the Guidance Note on Audit of Internal Financial Controls over Financial Reporting issued by the Institute of Chartered Accountants of India. These responsibilities include the design, implementation
and maintenance of adequate internal financial controls that were operating effectively for ensuring the orderly
and efficient conduct of its business, including adherence to company’s policies, the safeguarding of its assets, the
prevention and detection of frauds and errors, the accuracy
and completeness of the accounting records, and the timely
preparation of reliable financial information, as required under the Companies Act, 2013.
Auditor’s Responsibility
Our responsibility is to express an opinion on the Company's internal financial controls over financial reporting of the Company based on our audit. We conducted our audit in accordance with the Guidance Note on Audit of Internal Financial Controls Over Financial Reporting (the “Guidance Note”) issued by the Institute of Chartered Accountants of
India and the Standards on Auditing prescribed under Section
143(10) of the Companies Act, 2013, to the extent applicable to an audit of internal financial controls. Those Standards
and the Guidance Note require that we comply with ethical requirements and plan and perform the audit to obtain
reasonable assurance about whether adequate internal
financial controls over financial reporting was established and maintained and if such controls operated effectively in all
material respects.
Our audit involves performing procedures to obtain audit evidence about the adequacy of the internal financial controls system over financial reporting and their operating effectiveness. Our audit of internal financial controls over financial reporting included obtaining an understanding of internal financial controls over financial reporting, assessing the risk that a material weakness exists, and testing and evaluating the design and operating effectiveness of internal
control based on the assessed risk. The procedures selected depend on the auditor’s judgement, including the assessment
of the risks of material misstatement of the financial statements, whether due to fraud or error.
We believe that the audit evidence we have obtained is
sufficient and appropriate to provide a basis for our audit opinion on the Company’s internal financial controls system over financial reporting.
Meaning of Internal Financial Controls over Financial Reporting
A company's internal financial control over financial reporting is a process designed to provide reasonable assurance
regarding the reliability of financial reporting and the preparation of financial statements for external purposes in accordance with generally accepted accounting principles. A company's internal financial control over financial reporting includes those policies and procedures that (1) pertain to the maintenance of records that, in reasonable detail, accurately
and fairly reflect the transactions and dispositions of the assets of the company; (2) provide reasonable assurance that transactions are recorded as necessary to permit preparation
of financial statements in accordance with generally accepted accounting principles, and that receipts and expenditures of the company are being made only in accordance with
(Referred to in paragraph 1(f) under ‘Report on Other Legal and Regulatory Requirements’ section of our report of even date)
Vardhman Textiles Ltd. Annual Report 2017-1886
authorisations of management and directors of the company;
and (3) provide reasonable assurance regarding prevention or timely detection of unauthorised acquisition, use, or
disposition of the company's assets that could have a material effect on the financial statements.
Inherent Limitations of Internal Financial Controls over Financial Reporting
Because of the inherent limitations of internal financial controls over financial reporting, including the possibility of collusion or improper management override of controls,
material misstatements due to error or fraud may occur and
not be detected. Also, projections of any evaluation of the internal financial controls over financial reporting to future periods are subject to the risk that the internal financial control over financial reporting may become inadequate because of changes in conditions, or that the degree of compliance with
the policies or procedures may deteriorate.
Opinion
In our opinion, to the best of our information and according to
the explanations given to us, the Company has, in all material
respects, an adequate internal financial controls system over financial reporting and such internal financial controls over financial reporting were operating effectively as at March 31, 2018, based on the criteria for internal financial control over financial reporting established by the Company considering the essential components of internal control stated in the
Guidance Note on Audit of Internal Financial Controls Over Financial Reporting issued by the Institute of Chartered Accountants of India.
For Deloitte Haskins & Sells Llp
Chartered Accountants
(Firm‘s Registration No. 117366W / W-100018)
Vijay Agarwal
Place: Ludhiana (Partner) Date: May 12, 2018 (Membership No. 094468)

Corporate Overview Statutory Reports Financial Statements Notice 87
Annexure “B” to the Independent Auditor’s Report(Referred to in paragraph 2 under ‘Report on Other Legal and Regulatory Requirements’ Section of our report of even date)
(i) (a) The Company has maintained proper records showing full particulars, including quantitative details
and situation of fixed assets.
(b) The Company has a program of verification to cover all the items of fixed assets in a phased manner which, in our opinion, is reasonable having regard to the size of the
Company and the nature of its assets. Pursuant to the program, certain fixed assets were physically verified by the management during the year. According to the information and explanations given to us, no material discrepancies were noticed on such verification.
(c) According to the information and explanations given to us, the records examined by us and based on the examination of the registered sale deeds and transfer deeds / conveyance deeds and the confirmations received by us from “ICICI Bank Limited and IDBI Bank Limited” (custodians) on behalf of term and consortium lenders for the credit facility extended to the Company against immovable properties
whose title deeds have been pledged as security for
obtaining credit facility and the same are held in the
name of Company.
We report that, the title deeds, comprising all the
immovable properties of land and buildings which
are freehold, are held in the name of the Company as
at the balance sheet date, except the following:
Particulars
of Land and
building
Carrying value
as at March
31, 2018
(J In crore)
Remarks
Freehold land
located at
Chandigarh
admeasuring
1170.56 square meters.
4.38 Pending
registration in
the name of
Company
(ii) As explained to us, the inventories were physically verified during the year by the Management at reasonable intervals other than for stock lying with third parties and/
or goods in transit for which confirmation have been obtained/subsequent receipts have been verified in most of the cases. The discrepancies noticed on physical verification of inventories as compared to book records were not material and have been properly dealt with in
the books of account.
(iii) According to the information and explanations given to us, the Company has granted unsecured loans to three
bodies corporate, covered in the register maintained
under Section 189 of the Companies Act, 2013, in respect of which:
a. The terms and conditions of the grant of such loans are, in our opinion, prima facie, not prejudicial to the
Company’s interest.
b. The schedule of repayment of principal and payment of interest has been stipulated and repayments or
receipts of principal amounts and interest have been
regular as per stipulations.
c. There is no overdue amount remaining outstanding as at the year-end.
(iv) In our opinion and according to the information and explanations given to us, the Company has complied with the provisions of Sections 185 and 186 of the Act in respect of grant of loans, making investments and
providing guarantees and securities, as applicable.
(v) The Company has not accepted deposits during the year and does not have any unclaimed deposits as at March
31, 2018 and therefore, the provisions of the clause 3 (v) of the Order are not applicable to the Company.
(vi) The maintenance of cost records has been specified by the Central Government under Section 148(1) of the Companies Act, 2013. We have broadly reviewed the cost records maintained by the Company pursuant to
the Companies (Cost Records and Audit) Rules, 2014, as amended prescribed by the Central Government under sub-section (1) of Section 148 of the Companies Act, 2013, and are of the opinion that, prima facie, the
prescribed cost records have been made and maintained.

Vardhman Textiles Ltd. Annual Report 2017-1888
We have, however, not made a detailed examination of the cost records with a view to determine whether they
are accurate or complete.
(vii) According to the information and explanations given to us, in respect of statutory dues:
(a) The Company has generally been regular in depositing undisputed statutory dues, including provident fund,
employees’ state insurance, income-tax, sales tax, service tax, customs duty, excise duty, value added tax,
goods and services tax, cess and other material statutory dues applicable to it with the appropriate authorities.
(b) There were no undisputed amounts payable in respect of provident fund, employees’ state insurance,
income-tax, sales tax, service tax, customs duty, excise duty, value added tax, goods and services tax, cess and other material statutory dues applicable in
arrears as at March 31, 2018 for a period of more than
six months from the date they became payable.
(c) Details of dues of excise duty, sales tax, value added tax, service tax and income-tax which have not been deposited as on March 31, 2018 on account of disputes are given below and there are no dues of customs duty as on March 31, 2018 on
account of disputes
Nature of
Statute
Nature of Dues Forum where
dispute is
pending
Period Amount* Amount paid
under protest
Amount unpaid
(J In crore)
Central Excise Laws
Excise Duty Supreme Court 2005 0.04 - 0.04
CESTAT 2009-2013 2.17 - 2.17
Upto
Commissioner
(Appeals)
2001 - 2015 2.73 0.08 2.65
Service Tax Laws Service Tax CESTAT 2010 - 2011 0.02 - 0.02
Upto
Commissioner
(Appeals)
2008-2011 0.07 - 0.07
Sales Tax Laws Central Sales Tax Upto
Commissioner
(Appeals)
2009-2010 0.06 - 0.06
State Sales Tax Appellate Board 2006-2007 0.51 0.20 0.31
Upto
Commissioner
(Appeals)
2005 - 2006 0.02 - 0.02
Income-tax Laws Income-tax ITAT 2001-2012 141.42 115.21 26.21
Upto
Commissioner
(Appeals)
2012-2014 87.65 18.80 68.85
*Amount as per demand orders including interest and penalty wherever quantified in the Order.

Corporate Overview Statutory Reports Financial Statements Notice 89
(viii) In our opinion and according to the information and explanations given to us, the Company has not defaulted in the repayment of loans or borrowings to financial institutions, banks, government and dues to debenture holders.
(ix) In our opinion and according to the information and explanations given to us, the term loans have been applied by the Company during the year for the purposes
for which they were raised. During the year, the Company has raised H499.80 crore through private placement of non-convertible debentures, however it has not raised any money by way of initial public offer/further public offer (including debt instruments) during the year.
(x) To the best of our knowledge and according to the information and explanations given to us, no fraud by the Company and no material fraud on the Company by
its officers or employees has been noticed or reported during the year.
(xi) In our opinion and according to the information and explanations given to us, the Company has paid/provided managerial remuneration in accordance with the requisite
approvals mandated by the provisions of section 197 read with Schedule V to the Companies Act, 2013.
(xii) The Company is not a Nidhi Company and hence reporting under clause 3 (xii) of the CARO 2016 is not applicable.
(xiii) In our opinion and according to the information and explanations given to us, the Company is in compliance with Section 177 and 188 of the Companies Act, 2013
where applicable, for all transactions with the related
parties and the details of related party transactions have
been disclosed in the standalone financial statements as required by the applicable accounting standards.
(xiv) During the year the Company has not made any preferential allotment or private placement of shares or
fully or partly convertible debentures and hence reporting
under clause (xiv) of CARO 2016 is not applicable to the Company.
(xv) In our opinion and according to the information and explanations given to us, during the year the Company has not entered into any non-cash transactions with its directors or persons connected with him and hence
provisions of Section 192 of the Companies Act, 2013 are not applicable.
(xvi) The Company is not required to be registered under Section 45-IA of the Reserve Bank of India Act, 1934 and hence reporting under clause 3 (xvi) of CARO 2016 is not applicable to the Company.
For Deloitte Haskins & Sells Llp
Chartered Accountants
(Firm‘s Registration No. 117366W / W-100018)
Vijay Agarwal
Place: Ludhiana (Partner) Date: May 12, 2018 (Membership No. 094468)

Vardhman Textiles Ltd. Annual Report 2017-1890
Balance Sheet as at March 31, 2018
(All amounts in H crore, unless otherwise stated)
ParticularsNote
No.
As at
March 31, 2018
As at
March 31, 2017
ASSETS
Non-current assets
(a) Property, plant and equipment 3A 2,503.04 2,451.41 (b) Capital work-in-progress 3A 105.08 48.54 (c) Intangible assets 3B 3.73 6.74 (d) Financial assets (i) Investments 4 787.96 972.19 (ii) Loans 5 0.59 0.61 (iii) Others financial assets 6 8.97 1.74 (e) Other non-current assets 7 85.26 66.04 Total Non-current assets 3,494.63 3,547.27
Current assets
(a) Inventories 8 2,116.51 1,589.00 (b) Financial assets (i) Investments 9 804.04 670.60 (ii) Trade receivables 10 727.32 717.91 (iii) Cash and cash equivalents 11 65.20 38.22 (iv) Bank balances other than above 11A 3.11 2.25 (v) Loans 12 45.21 36.56 (vi) Other financial assets 13 23.99 40.47 (c) Current tax assets(net) 14 99.07 45.14 (d) Other current assets 15 316.88 271.11 Total Current assets 4,201.33 3,411.26
TOTAL ASSETS 7,695.96 6,958.53
EQUITY AND LIABILITIES
Equity
(a) Equity share capital 16 57.43 55.93 (b) Other equity 17 4,574.53 3,929.92 Equity attributable to the owners of the Company 4,631.96 3,985.85
Liabilities
Non-current liabilities
(a) Financial liabilities (i) Borrowings 18 1,195.55 719.35 (ii) Other financial liabilities 19 0.65 0.49 (b) Provisions 20 7.04 8.90 (c) Deferred tax liabilities (Net) 21 235.60 238.41 (d) Other non-current liabilities 22 22.18 21.01 Total Non-current liabilities 1,461.02 988.16
Current liabilities
(a) Financial liabilities (i) Borrowings 23 805.51 1,055.06 (ii) Trade payables 24 196.19 177.41 (iii) Other financial liabilities 25 471.94 600.76 (b) Provisions 26 4.82 4.28 (c) Current tax liabilities (net) 14 9.45 - (d) Other current liabilities 27 115.07 147.01 Total Current liabilities 1,602.98 1,984.52
TOTAL EQUITY AND LIABILITIES 7,695.96 6,958.53
See accompanying notes to the standalone financial statements 1 - 48
In terms of our report attached
For Deloitte Haskins & Sells LLP
Chartered Accountants For and on behalf of the Board of Directors
Vijay Agarwal Sanjay Gupta Rajeev Thapar Suchita Jain S.P. Oswal
Partner Company Secretary Chief Financial Joint Managing Director Chairman and Managing
Membership No:-4935 Officer DIN:00746471 Director DIN: 00121737
Place : Ludhiana Place : LudhianaDate: May 12, 2018 Date: May 12, 2018

Corporate Overview Statutory Reports Financial Statements Notice 91
Statement of Profit and Loss for the year ended March 31, 2018
(All amounts in H crore, unless otherwise stated)
In terms of our report attached
For Deloitte Haskins & Sells LLP
Chartered Accountants For and on behalf of the Board of Directors
Vijay Agarwal Sanjay Gupta Rajeev Thapar Suchita Jain S.P. Oswal
Partner Company Secretary Chief Financial Joint Managing Director Chairman and Managing
Membership No:-4935 Officer DIN:00746471 Director DIN: 00121737
Place : Ludhiana Place : LudhianaDate: May 12, 2018 Date: May 12, 2018
ParticularsNote
No.
For the year ended
March 31, 2018
For the year ended
March 31, 2017
I Revenue from operations 28 5,851.37 5,690.95
II Other income 29 185.06 628.36
III Total Income (I+II) 6,036.43 6,319.31
IV Expenses :
Cost of materials consumed 30 3,180.52 2,836.69
Purchases of stock-in-trade 31 33.63 29.20
Changes in inventories of finished goods,work-in-progress and stock-in-trade 32 (48.01) (74.18)
Employee benefits expense 33 479.63 453.61
Finance costs 34 114.32 125.13
Depreciation and amortization 3A &
3B
228.55 329.49
Other expenses 35 1,347.04 1,314.56
Total Expenses 5,335.68 5,014.50
V Profit before tax (III-IV) 700.75 1,304.81
VI Tax expense: 36
Current tax 147.58 281.57
Deferred tax 7.41 21.65
VII Profit for the year (V-VI) 545.76 1,001.59
VIII Other Comprehensive Income 17
A Items that will not be reclassified to profit or loss
(a) (i) Remeasurements of the defined benefits plans 2.51 (0.51)
(ii) Income tax relating to items that will not be reclassified to profit or loss
(0.87) 0.17
(b) (i) Equity instruments through other comrehensive income 0.09 0.18
(ii) Income tax relating to items that will not be reclassified to profit or loss
(0.03) (0.06)
IX Total other comprehensive income 1.70 (0.22)
X Total comprehensive income for the year (VII+IX) 547.46 1,001.37
Earnings per equity share (amount in J) 42
(1) Basic 96.41 163.67
(2) Diluted 95.45 163.67
See accompanying notes to the standalone financial statements 1 - 48

Vardhman Textiles Ltd. Annual Report 2017-1892
Cash Flow Statement for the year ended March 31, 2018
(All amounts in H crore, unless otherwise stated)
ParticularsYear ended
March 31, 2018
Year ended
March 31, 2017
A CASH FLOW FROM OPERATING ACTIVITIES
Profit before tax 700.75 1,304.81
Adjustments for:
Finance costs 103.81 112.52
Fair valuation gain on investment (78.08) (95.30)
Subsidy income (1.79) (1.81)
Prepayments of leasehold land 0.08 0.08
Interest income (17.76) (33.30)
Dividend on current investments (19.98) (15.41)
Net gain on sale / discarding of property, plant and equipment (4.69) (61.58)
(Profit)/Loss on sale of Investments (Net) (20.26) (365.61)
Provision no longer required written back (net) (8.02) (3.50)
Amortization of processing charges 0.64 0.87
Assets written off 3.32 4.34
Bad debt written off 0.45 3.52
Allowances for doubtful trade receivables and advances - 2.74
Depreciation and amortization 228.55 329.49
Share options outstanding account 10.57 -
Changes in working capital:
Adjustments for (increase) / decrease in operating assets :-
Trade receivables and other assets (9.88) 45.80
Inventories (527.50) 220.11
Loans (Current) (8.65) (6.41)
Loans (Non-current) 0.02 0.15
Other assets (Current) (56.07) 26.26
Other assets (Non-current) (5.56) 10.90
Other financial assets (Current) 8.24 47.04
Other financial assets (Non-current) (7.11) 10.19
Adjustments for increase / (decrease) in operating liabilities :-
Trade payables and other liabilities 26.80 35.00
Provisions (Non-Current) (1.86) 2.97
Provisions (Current) 0.54 (0.92)
Others financial liabilities (Current) (2.40) 7.71
Others financial liabilities (Non-Current) 0.16 0.30
Other liabilities (Non-current) (1.13) (0.54)
Other liabilities (Current) (31.07) 13.12
Cash generated from operations 282.12 1,593.54
Income taxes paid (192.93) (304.62)
Net cash generated by operating activities 89.19 1,288.92

Corporate Overview Statutory Reports Financial Statements Notice 93
Cash Flow Statement for the year ended March 31, 2018
(All amounts in H crore, unless otherwise stated)
ParticularsYear ended
March 31, 2018
Year ended
March 31, 2017
B CASH FLOW FROM INVESTING ACTIVITIES
Purchase of investments (879.24) (918.42)
Proceeds from sale of Investments 1,028.38 807.16
Interest received 25.02 51.89
Payment for purchase of property, plant and equipment, capital work in
progress and other intangible assets
(363.10) (291.03)
Proceeds from disposal of property, plant and equipment 9.68 83.19
Dividend on subsidaries, associates and other investments 19.98 15.41
Net cash used in investing activities (159.28) (251.80)
C CASH FLOW FROM FINANCING ACTIVITIES*
Proceeds/ (Repayment) from equity share capital 5.55 (705.45)
Proceeds from sale of treasury shares 182.23 -
Proceeds from borrowings (non-current) 333.80 -
Repayment of borrowings (non-current) - (436.44)
Repayment of borrowings (current) (net) (249.55) -
Proceeds from borrowings (current) (net) - 38.24
Corporate dividend tax paid (15.79) -
Dividends on equity share capital paid (83.03) (1.05)
Capital Subsidy received 4.45 3.35
Finance costs paid (80.59) (111.24)
Net cash (used)/generated in financing activities 97.07 (1,212.59)
Net increase / (decrease) in cash and cash equivalents 26.98 (175.47)
Cash and cash equivalents at the beginning of the year 38.22 213.69
Cash and cash equivalents at the end of the year 65.20 38.22
* There are no non cash changes arising from financing activities
In terms of our report attached
For Deloitte Haskins & Sells LLP
Chartered Accountants For and on behalf of the Board of Directors
Vijay Agarwal Sanjay Gupta Rajeev Thapar Suchita Jain S.P. Oswal
Partner Company Secretary Chief Financial Joint Managing Director Chairman and Managing
Membership No:-4935 Officer DIN:00746471 Director DIN: 00121737
Place : Ludhiana Place : LudhianaDate: May 12, 2018 Date: May 12, 2018
See accompanying notes to the standalone financial statements 1 - 48

Vardhman Textiles Ltd. Annual Report 2017-1894
Sta
tem
en
t o
f C
ha
ng
es
in E
qu
ity
for
the
ye
ar
en
de
d M
arc
h 3
1, 2
018
(All
amou
nts
in H
cro
re, u
nle
ss o
the
rwis
e s
tate
d)
a. E
qu
ity
sh
are
ca
pit
al
b. O
the
r e
qu
ity
Am
ou
nt
Ba
lan
ce
as
at
1st
Ap
ril,
20
16 6
2.0
5
Buy
back
of s
hare
s (in
clud
ing
of 1
,36
,53
9 n
os. o
f sha
res
held
thro
ugh
trus
t. A
lso
refe
r not
e 16
) (6
.12)
Ba
lan
ce
as
at
31s
t M
arc
h, 2
017
55
.93
Sal
e of
ow
n sh
ares
hel
d th
roug
h tr
ust (
Ref
er n
ote
40
) 1
.46
Issu
e of
equ
ity
shar
es u
nder
em
ploy
ee s
tock
opt
ion
plan
(Ref
er n
ote
45
) 0
.04
Ba
lan
ce
as
at
31s
t M
arc
h, 2
018
57
.43
Sh
are
ap
pli
ca
tio
n
mo
ne
y
pe
nd
ing
all
otm
en
t
Re
se
rve
s a
nd
Su
rplu
sIt
em
of
oth
er
co
mp
reh
en
siv
e in
co
me
To
tal
Ca
pit
al
res
erv
e
Ca
pit
al
red
em
pti
on
res
erv
e
Se
cu
rity
pre
miu
m
De
be
ntu
re
red
em
pti
on
res
erv
e
Sh
are
op
tio
ns
ou
tsta
nd
ing
ac
co
un
t
Ge
ne
ral
res
erv
e
Re
tain
ed
ea
rnin
gs
Eq
uit
y in
str
um
en
t
thro
ug
h o
the
r
co
mp
reh
en
siv
e in
co
me
Ba
lan
ce
at
Ap
ril 1
, 20
16 -
1
.24
-
2
09
.91
-
-
1,8
63
.02
1
,55
2.7
8
0.9
3
3,6
27
.88
Pro
fit f
or th
e ye
ar -
- -
- -
- -
1,0
01.
59
1
,00
1.5
9
Oth
er c
ompr
ehen
sive
inco
me
for t
he
year
(net
of i
ncom
e ta
x) -
- -
- -
- -
(0.3
4)
0.1
2 (0
.22)
To
tal c
om
pre
he
ns
ive
inc
om
e f
or
the
ye
ar
-
-
-
-
-
-
-
1,0
01.
25
0
.12
1
,00
1.3
7
Tra
nfe
r to
ca
pit
al r
ed
em
pti
on
re
serv
e o
n
ac
co
un
t o
f b
uy
ba
ck
of
eq
uit
y s
ha
res
- -
6.2
6
- -
- -
(6.2
6)
- -
Pre
miu
m o
n bu
ybac
k of
sha
res
(net
of
H14
.48
cro
re o
f pre
miu
m re
lati
ng to
ow
n sh
are
s h
eld
th
rou
gh
tru
st)
- -
- (2
09
.91)
- -
(48
9.4
2) -
- (6
99
.33
)B
ala
nc
e a
s a
t M
arc
h 3
1, 2
017
1.2
4
6.2
6
-
-
-
1,3
73
.60
2
,54
7.7
7
1.0
5
3,9
29
.92
Pro
fit f
or th
e ye
ar -
- -
- -
- -
54
5.7
6
- 5
45
.76
O
ther
com
preh
ensi
ve in
com
e fo
r the
yea
r, (n
et o
f inc
ome
tax)
-
- -
- -
- -
1.6
4
0.0
6
1.7
0
To
tal c
om
pre
he
ns
ive
inc
om
e f
or
the
ye
ar
-
-
-
-
-
-
-
54
7.4
0
0.0
6
54
7.4
6
Fina
l Equ
ity
Div
iden
d fo
r the
fina
ncia
l yea
r 20
16-1
7 (A
mou
nt H
15 p
er s
hare
) -
- -
- -
- -
(86
.09
) -
(86
.09
)Ta
x on
Div
iden
d -
- -
- -
- -
(15
.79
) -
(15
.79
)

Corporate Overview Statutory Reports Financial Statements Notice 95
Sta
tem
en
t o
f C
ha
ng
es
in E
qu
ity
for
the
ye
ar
en
de
d M
arc
h 3
1, 2
018
(All
amou
nts
in H
cro
re, u
nle
ss o
the
rwis
e s
tate
d)
Sh
are
ap
pli
ca
tio
n
mo
ne
y
pe
nd
ing
all
otm
en
t
Re
se
rve
s a
nd
Su
rplu
sIt
em
of
oth
er
co
mp
reh
en
siv
e in
co
me
To
tal
Ca
pit
al
res
erv
e
Ca
pit
al
red
em
pti
on
res
erv
e
Se
cu
rity
pre
miu
m
De
be
ntu
re
red
em
pti
on
res
erv
e
Sh
are
op
tio
ns
ou
tsta
nd
ing
ac
co
un
t
Ge
ne
ral
res
erv
e
Re
tain
ed
ea
rnin
gs
Eq
uit
y in
str
um
en
t
thro
ug
h o
the
r
co
mp
reh
en
siv
e in
co
me
Div
ide
nd
on
sh
are
s h
eld
th
rou
gh
tru
st -
- -
- -
- -
2.1
9
- 2
.19
P
rofi
t on
sale
s of
sha
res
held
thro
ugh
trus
t (R
efer
not
e 4
0)
- -
- -
- -
- 1
80
.81
- 1
80
.81
Em
plo
ye
e s
toc
k o
pti
on
s a
cc
ure
d u
pto
Mar
ch 2
018
(Ref
er n
ote
45
) -
- -
- -
12.
07
- -
- 1
2.0
7 T
ran
sfe
r to
eq
uit
y s
ha
res
du
e t
o is
sue
of
empl
oyee
sto
ck o
ptio
ns (R
efer
not
e 4
5)
(1.5
0)
(1.5
0)
Se
cu
riti
es
pre
miu
m o
n s
ha
res
un
de
r
Em
plo
ye
e s
toc
k o
pti
on
s -
- -
4.9
1 -
- -
- -
4.9
1 T
ran
sfe
r to
de
be
ntu
re r
ed
em
pti
on
re
serv
e
on
ac
co
un
t o
f is
sue
of
de
be
ntu
res
- -
- -
17.
81
- -
(17.
81)
- -
Sh
are
Ap
plic
ati
on
Mo
ne
y r
ec
eiv
ed
pe
nd
ing
allo
tmen
t und
er e
mpl
oyee
sto
ck o
ptio
ns.
0.5
5 -
- -
- -
- -
- 0
.55
B
ala
nc
e a
s a
t M
arc
h 3
1, 2
018
0.5
5
1.2
4
6.2
6
4.9
1 1
7.8
1 1
0.5
7
1,3
73
.60
3,1
58
.48
1
.11
4,5
74
.53
a. O
the
r E
qu
ity
See
acc
ompa
nyin
g no
tes
to th
e st
anda
lone
fina
ncia
l sta
tem
ents
1
- 48
In t
erm
s o
f o
ur
rep
ort
att
ac
he
d
Fo
r D
elo
itte
Ha
sk
ins
& S
ell
s L
LP
Ch
art
ere
d A
cc
ou
nta
nts
Fo
r a
nd
on
be
ha
lf o
f th
e B
oa
rd o
f D
ire
cto
rs
Vij
ay
Ag
arw
al
Sa
nja
y G
up
ta
Ra
jee
v T
ha
pa
r S
uc
hit
a J
ain
S
.P. O
sw
al
Pa
rtn
er
Co
mp
an
y S
ec
reta
ry
Ch
ief
Fin
an
cia
l Jo
int
Ma
na
gin
g D
ire
cto
r C
ha
irm
an
an
d M
an
ag
ing
M
embe
rshi
p N
o:-4
93
5
Offi
cer
DIN
:00
746
471
D
irect
or
D
IN: 0
012
173
7
Pla
ce :
Ludh
iana
P
lace
: Lu
dhia
naD
ate
: Ma
y 1
2, 2
018
D
ate
: Ma
y 1
2, 2
018

Vardhman Textiles Ltd. Annual Report 2017-1896
Notes to Standalone Financial Statementsfor the year ended March 31, 2018
(All amounts in H crore, unless otherwise stated)
1 General Information
Vardhman Textiles Limited (the Company) is a public Company, which was incorporated under the provisions
of the Companies Act, 1956 on October 8, 1973 and has its registered office at Chandigarh Road, Ludhiana. The name of the Company at its incorporation was Mahavir
Spinning Mills Limited and subsequently changed to Vardhman Textiles Limited on September 5, 2006. The Company is engaged in manufacturing of cotton yarn,
synthetic yarn and woven fabric. The Company is listed on two stock exchanges i.e. at National Stock Exchange and at Bombay Stock Exchange.
The financial statements were approved for issue in accordance with a resolution of the directors on May 12,
2018
2 Significant accounting policies, significant accounting judgements, estimates and assumptions and applicablity of new and revsied Ind AS
2.1 Statement of compliance
These financial statements are prepared in accordance with Indian Accounting Standard (Ind AS), and the provisions of the Companies Act ,2013 (‘the Act’) (to the extent notified). The Ind AS are prescribed under Section 133 of the Act read with Rule 3 of the Companies (Indian Accounting Standards) Rules, 2015 and relevant amendment rules issued thereafter.
Effective April 1, 2016, the Company has adopted all the
Ind AS standards and the adoption was carried out in
accordance with Ind AS 101 First time adoption of Indian
Accounting Standards, with effect from April 1, 2015 as the transition date. The transition was carried out from Indian Accounting Principles generally accepted in India
as prescribed under Section 133 of the Act, read with
Rule 7 of the Companies (Accounts) Rules, 2014 (IGAAP), which was the previous GAAP.
Amounts for year ended March 31, 2017 and amounts as at March 31, 2017 were audited by previous auditors – S.C. Vasudeva & Co.
2.2 Basis of preparation and presentation
The financial statements have been prepared on the historical cost basis except for certain financial instruments that are measured at fair values at the end
of each reporting period, as explained in the accounting policies below.
Historical cost is generally based on the fair value of the
consideration given in exchange for goods and services.
Fair value is the price that would be received to sell an
asset or paid to transfer a liability in an orderly transaction
between market participants at the measurement date,
regardless of whether that price is directly observable or
estimated using another valuation technique. In estimating the fair value of an asset or a liability, the Company takes into
account the characteristics of the asset or liability if market
participants would take those characteristics into account
when pricing the asset or liability at the measurement date. Fair value for measurement and/or disclosure purposes in these financial statements is determined on such a basis, except for share-based payment transactions that are within the scope of Ind AS 102, leasing transactions that
are within the scope of Ind AS 17, and measurements that have some similarities to fair value but are not fair value,
such as net realisable value in Ind AS 2 or value in use
in Ind AS 36.
In addition, for financial reporting purposes, fair value measurements are categorised into Level 1, 2, or 3 based on the degree to which the inputs to the fair value
measurements are observable and the significance of the inputs to the fair value measurement in its entirety,
which are described as follows:
• Level 1 inputs are quoted prices (unadjusted) in active markets for identical assets or liabilities that
the entity can access at the measurement date;
• Level 2 inputs are inputs, other than quoted prices included within Level 1, that are observable for the asset or liability, either directly or
indirectly; and
• Level 3 inputs are unobservable inputs for the asset or liability.

Corporate Overview Statutory Reports Financial Statements Notice 97
Notes to Standalone Financial Statementsfor the year ended March 31, 2018
(All amounts in H crore, unless otherwise stated)
2.3 Revenue recognition
Revenue is measured at the fair value of the consideration received or receivable. Revenue is reduced for customer returns, rebates and other similar allowances.
2.3.1 Sale of goods
Revenue from the sale of goods is recognised when all the following conditions are satisfied:
a. The Company has transferred to the buyer the significant risks and rewards of ownership of the goods.
b. The Company retains neither continuing managerial involvement to the degree usually
associated with ownership nor effective control
over the goods sold;
c. The amount of revenue can be measured reliably;
d. It is probable that the economic benefits associated with the transaction will flow to the Company; and
e. The costs incurred or to be incurred in respect of the transaction can be measured reliably.
2.3.2 Rendering of services
Revenue from a contract to provide services is recognised by reference to the stage of completion
of the contract.
2.3.3 Dividend and interest income
Dividend income from investments is recognised
when the shareholder’s right to receive payment has
been established (provided that it is probable that the economic benefits will flow to the Company and the amount of income can be measured reliably).
Interest income from a financial asset is recognised when it is probable that the economic benefits will flow to the Company and the amount of income can be measured reliably. Interest income is accrued on a time proportion basis, by reference to the
principal outstanding and at the effective interest
rate applicable, which is the rate that exactly discounts estimated future cash receipts through
the expected life of the financial asset to that asset’s net carrying amount on initial recognition.
2.3.4 Rental income
The Company’s policy for recognition of revenue
from operating leases is described below:-
2.3.4.1 Leasing
Leases are classified as finance leases whenever the terms of the lease transfer
substantially all the risks and rewards of
ownership to the lessee. All other leases are classified as operating leases.
2.3.4.2 The Company as lessor
Rental income from operating leases is generally recognised on a straight-line basis over the term of the relevant lease. Where the rentals are structured solely
to increase in line with expected general inflation to compensate for the Company’s expected inflationary cost increases, such increases are recognised in the
year in which such benefits accrue. Initial direct costs incurred in negotiating and
arranging an operating lease are added to
the carrying amount of the leased asset
and recognised on a straight-line basis over the lease term.
2.3.4.3 The Company as lessee
Rental expense from operating leases is generally recognised on a straight-line basis over the term of the relevant lease. Where the rentals are structured solely
to increase in line with expected general inflation to compensate for the lessor’s expected inflationary cost increases, such increases are recognised in the year in
which such benefits accrue. Contingent

Vardhman Textiles Ltd. Annual Report 2017-1898
Notes to Standalone Financial Statementsfor the year ended March 31, 2018
(All amounts in H crore, unless otherwise stated)
rentals arising under operating leases are
recognised as an expense in the period in which they are incurred.
In the event that lease incentives
are received to enter into operating
leases, such incentives are recognised
as a liability. The aggregate benefit of incentives is recognised as a reduction
of rental expense on a straight-line basis, except where another systematic basis is more representative of the time pattern in
which economic benefits from the leased asset are consumed.
2.4 Government grants
Government grants are not recognised until there is reasonable assurance that the Company will comply with
the conditions attaching to them and that the grants will
be received.
Government grants are recognised in profit or loss on a systematic basis over the periods in which the Company
recognises as expenses the related costs for which the grants are intended to compensate.
Specifically, government grants whose primary condition is that the Company should purchase, construct or
otherwise acquire non-current assets are recognised as deferred revenue in the balance sheet and transferred to
profit or loss on a systematic and rational basis over the useful lives of the related assets.
Government grants that are receivable as compensation for expenses or losses already incurred or for the purpose of giving immediate financial support to the Company with no future related costs are recognised in profit or loss in the period in which they become receivable.
2.5 Borrowing costs
Borrowing costs directly attributable to the acquisition,
construction or production of qualifying assets, which are
assets that necessarily take a substantial period of time
to get ready for their intended use or sale, are added to
the cost of those assets, until such time as the assets are
substantially ready for their intended use or sale.
Interest income earned on the temporary investment
of specific borrowings pending their expenditure on qualifying assets is deducted from the borrowing costs
eligible for capitalisation.
2.6 Foreign currencies
In preparing the financial statements of the Company, transactions in currencies other than the entity’s functional
currency (foreign currencies) are recognised at the rates of exchange prevailing at the dates of the transactions. At the end of each reporting period, monetary items
denominated in foreign currencies are retranslated at the
rates prevailing at that date. Non-monetary items carried at fair value that are denominated in foreign currencies
are retranslated at the rates prevailing at the date when
the fair value was determined. Non-monetary items that are measured in terms of historical cost in a foreign
currency are not retranslated.
2.7 Employee benefits
2.7.1 Retirement benefit costs and terminationbenefits
Payments to defined contribution retirement benefit plans are recognised as an expense when employees have rendered service entitling them to
the contributions.
For defined benefit retirement benefit plans, the cost of providing benefits is determined using the projected unit credit method, with actuarial
valuations being carried out at the end of each annual
reporting period. Re-measurement, comprising actuarial gains and losses, the effect of the changes
to the asset ceiling (if applicable) and the return on plan assets (excluding net interest), is reflected immediately in the balance sheet with a charge or
credit recognised in other comprehensive income
in the period in which they occur. Re-measurement recognised in other comprehensive income is
reflected immediately in retained earnings and is not reclassified to profit or loss. Past service cost is recognised in profit or loss in the period of a plan amendment. Net interest is calculated by applying the discount rate at the beginning of the period to
Corporate Overview Statutory Reports Financial Statements Notice 99
Notes to Standalone Financial Statementsfor the year ended March 31, 2018
(All amounts in H crore, unless otherwise stated)
the net defined benefit liability or asset. Defined benefit costs are categorised as follows:
a. service cost (including current service cost, past service cost, as well as gains and losses on
curtailments and settlements);
b. net interest expense or income; and
c. re-measurement
The Company presents the first two components of defined benefit costs in profit or loss in the line item ‘Employee benefits expense’. Curtailment gains and losses are accounted for as past service
costs.
The retirement benefit obligation recognised in the balance sheet represents the actual deficit or surplus in the Company’s defined benefit plans. Any surplus resulting from this calculation is limited
to the present value of any economic benefits available in the form of refunds from the plans or
reductions in future contributions to the plans.
A liability for a termination benefit is recognised at the earlier of when the entity can no longer withdraw
the offer of the termination benefit and when the entity recognises any related restructuring costs.
2.7.2 Short-term and other long-term employee
benefits
A liability is recognised for benefits accruing to employees in respect of wages and salaries,
and annual leave in the period the related service
is rendered at the undiscounted amount of
the benefits expected to be paid in exchange for that service.
Liabilities recognised in respect of short-term employee benefits are measured at the undiscounted amount of the benefits expected to be paid in exchange for the related service.
Liabilities recognised in respect of other long-term employee benefits are measured at the present value of the estimated future cash outflows expected to be
made by the Company in respect of services provided
by employees up to the reporting date.
2.8 Share-based payment arrangements
Share-based payment transactions of the Company
Equity-settled share-based payments to employees and others providing similar services are measured at the fair
value of the equity instruments at the grant date. Details regarding the determination of the fair value of equity-settled share-based transactions are set out in note no. 45.
The fair value determined at the grant date of the
equity-settled share-based payments is expensed on a straight-line basis over the vesting period, based on the Company’s estimate of equity instruments that will
eventually vest, with a corresponding increase in equity. At the end of each reporting period, the Company
revises its estimate of the number of equity instruments
expected to vest. The impact of the revision of the original estimates, if any, is recognised in profit or loss such that the cumulative expense reflects the revised estimate, with a corresponding adjustment to the equity-settled employee option outstanding account.
2.9 Taxation
Income tax expense represents the sum of the tax currently payable and deferred tax.
2.9.1 Current tax
The tax currently payable is based on taxable profit for the year. Taxable profit differs from ‘profit before tax’ as reported in the statement of profit and loss because of items of income or expense that are taxable or deductible in other years and items that are never taxable or deductible. The Company’s current tax is calculated using tax rates that have been enacted or substantively enacted by the end
of the reporting period.
Current income tax assets/liabilities for current year is recognized at the amount expected to be paid to and/or recoverable from the tax authorities, using the tax rates that have been enacted or substantively enacted by the Balance Sheet March 31, 2018.

Vardhman Textiles Ltd. Annual Report 2017-18100
2.9.2 Deferred tax
Deferred tax is recognised on temporary differences between the carrying amounts of
assets and liabilities in the financial statements and the corresponding tax bases used in the computation of taxable profit. Deferred tax liabilities are generally recognised for all taxable temporary differences. Deferred tax assets are generally recognised for all deductible temporary
differences to the extent that it is probable that taxable profits will be available against which those deductible temporary differences can be
utilised. Such deferred tax assets and liabilities are not recognised if the temporary difference
arises from the initial recognition (other than in a business combination) of assets and liabilities in a
transaction that affects neither the taxable profit nor the accounting profit.
The carrying amount of deferred tax assets is reviewed at the end of each reporting period and
reduced to the extent that it is no longer probable that sufficient taxable profits will be available to allow all or part of the asset to be recovered.
Deferred tax liabilities and assets are measured at the tax rates that are expected to apply in the period in which the liability is settled or the asset
realised, based on tax rates (and tax laws) that have been enacted or substantively enacted by the end
of the reporting period.
The measurement of deferred tax liabilities and assets reflects the tax consequences that would follow from the manner in which the Company
expects, at the end of the reporting period, to recover or settle the carrying amount of its assets
and liabilities.
Minimum Alternate Tax (MAT) paid in accordance with the tax laws, which gives future economic benefits in the form of adjustment to future income-tax liablity, is considered as an asset if there is convincing evidence that the Company will
pay normal income-tax. Accordingly, MAT Credit is recognised as asset in the Balance Sheet when it is
probable that future economic benefit associated with it will flow to the Company.
2.9.3 Current and deferred tax for the year
Current and deferred tax are recognised in profit or loss, except when they relate to items that are recognised in other comprehensive income
or directly in equity, in which case, the current
and deferred tax are also recognised in other comprehensive income or directly in equity
respectively.
2.10 Property, plant and equipment
Land and buildings held for use in the production or supply of goods or services, or for administrative
purposes, are stated in the balance sheet at cost less
accumulated depreciation and accumulated impairment
losses. Freehold land is not depreciated.
The Cost of an item of Property, plant and equipment
comprises:
a. its purchase price including import duties and non-refundable purchase taxes after deducting trade discounts and rebates
b. any attributable expenditure directly attributable for bringing an asset to the location and the working
condition for its intended use and
c. the initial estimate of the costs of dismantling and removing the item and restoring the site on which
it is located, the obligation for which an entity incurs
either when the item is acquired or as a consequence
of having used the item during a particular period for
purposes other than to produce inventories during
that period.
Depreciation is provided on Straight Line Method on the basis of useful lives of such assets specified in Schedule II to the Companies Act, 2013 except the assets costing H5000/- or below on which depreciation is charged @ 100%. Depreciation is calculated on pro-rata basis.
The estimated useful life of the assets have been
assessed based on technical advice, taking into account
Notes to Standalone Financial Statementsfor the year ended March 31, 2018
(All amounts in H crore, unless otherwise stated)

Corporate Overview Statutory Reports Financial Statements Notice 101
the nature of the asset, the estimated usage of the
asset, the operating conditions of the asset, past history
of replacement, anticipated technological changes,
manufacturers warranties and maintenance support etc
and are as under:
Buildings 3 - 60 years
Plant and Equipment 1 - 40 years
Furniture and Fixtures & Office Equipment
1- 10 years
Vehicles 1 - 10 years
Advances paid towards the acquisition of property, plant
and equipment outstanding at each balance sheet date
is classified as capital advances under other non-current assets and the cost of assets not put to use before such
date are disclosed under ‘Capital work-in-progress’. Subsequent expenditures relating to property, plant and equipment is capitalized only when it is probable that
future economic benefits associated with these will flow to the Company and the cost of the item can be measured
reliably. Repairs and maintenance costs are recognized in net profit in the statement of profit and loss when incurred. The cost and related accumulated depreciation are eliminated from the financial statements upon sale or retirement of the asset and the resultant gains or
losses are recognized in the statement of profit and loss. Assets to be disposed off are reported at the lower of the
carrying value or the fair value less cost to sell.
Depreciation is recognised so as to write off the cost of
assets (other than freehold land and properties under construction) less their residual values over their useful
lives, using the straight-line method. The estimated useful lives, residual values and depreciation method
are reviewed at the end of each reporting period, with
the effect of any changes in estimate accounted for on a
prospective basis.
2.11 Intangible assets
2.11.1 Intangible assets acquired separately
Intangible assets with finite useful lives that are acquired separately are carried at cost less
accumulated amortisation and accumulated
impairment losses. Amortisation is recognised on a
straight-line basis over their estimated useful lives. The estimated useful life and amortisation method
are reviewed at the end of each reporting period, with
the effect of any changes in estimate being accounted
for on a prospective basis. Intangible assets with indefinite useful lives that are acquired separately are carried at cost less accumulated impairment losses.
2.11.2 De-recognition of intangible assets
An intangible asset is derecognised on disposal, or
when no future economic benefits are expected from use or disposal. Gains or losses arising from derecognition of an intangible asset, measured as
the difference between the net disposal proceeds
and the carrying amount of the asset, are recognised
in profit or loss when the asset is derecognised.
2.11.3 Useful lives of intangible assets
Estimated useful lives of the intangible assets are
as follows:
Computer softwares 6 years
Contribution to Common
Effluent Treatment Plant (CETP)5 years
Right to use power lines 5 Years
2.12 Impairment of tangible and intangible assets other
than goodwill
At the end of each reporting period, the Company reviews
the carrying amounts of its tangible and intangible
assets to determine whether there is any indication
that those assets have suffered an impairment loss. If any such indication exists, the recoverable amount of the asset is estimated in order to determine the extent of the impairment loss (if any). When it is not possible to estimate the recoverable amount of an individual
asset, the Company estimates the recoverable amount
of the cash-generating unit to which the asset belongs. When a reasonable and consistent basis of allocation
can be identified, corporate assets are also allocated to individual cash-generating units, or otherwise they are allocated to the smallest Company of cash-generating units for which a reasonable and consistent allocation
basis can be identified.
Notes to Standalone Financial Statementsfor the year ended March 31, 2018
(All amounts in H crore, unless otherwise stated)

Vardhman Textiles Ltd. Annual Report 2017-18102
Intangible assets with indefinite useful lives and intangible assets not yet available for use are tested for
impairment at least annually, and whenever there is an
indication that the asset may be impaired.
Recoverable amount is the higher of fair value less costs of disposal and value in use. In assessing value in use, the estimated future cash flows are discounted to their present value using a pre-tax discount rate that reflects current market assessments of the time value of money
and the risks specific to the asset for which the estimates of future cash flows have not been adjusted.
If the recoverable amount of an asset (or cash-generating unit) is estimated to be less than its carrying amount, the
carrying amount of the asset (or cash-generating unit) is reduced to its recoverable amount. An impairment loss is recognised immediately in profit or loss.
When an impairment loss subsequently reverses, the
carrying amount of the asset (or a cash-generating unit) is increased to the revised estimate of its recoverable
amount, but so that the increased carrying amount does
not exceed the carrying amount that would have been determined had no impairment loss been recognised
for the asset (or cash-generating unit) in prior years. A reversal of an impairment loss is recognised immediately
in profit or loss.
2.13 Inventories
Inventories are valued at cost or net realizable value,
whichever is lower. The cost in respect of the various items of inventory is computed as under:
In case of raw materials at weighted average cost plus
direct expenses. The cost includes cost of purchase and other costs incurred in bringing the inventories to their
present location and condition.
In case of stores and spares at weighted average cost
plus direct expenses. The cost includes cost of purchase and other costs incurred in bringing the inventories to
their present location and condition.
In case of work in progress at raw material cost
plus conversion costs depending upon the stage of
completion.
In case of finished goods at raw material cost plus conversion costs, packing cost, non recoverable indirect
taxes (if applicable) and other overheads incurred to bring the goods to their present location and condition.
In case of by-products at estimated realizable value
Net realizable value is the estimated selling price in
ordinary course of business, less estimated costs of
completion and the estimated costs necessary to make
the sale.
2.14 Provisions and contingent liablities
Provisions are recognised when the Company has a
present obligation (legal or constructive) as a result of a past event, it is probable that the Company will be
required to settle the obligation, and a reliable estimate
can be made of the amount of the obligation.
The amount recognised as a provision is the best estimate
of the consideration required to settle the present
obligation at the end of the reporting period, taking
into account the risks and uncertainties surrounding
the obligation. When a provision is measured using the cash flows estimated to settle the present obligation, its carrying amount is the present value of those cash flows (when the effect of the time value of money is material).
When some or all of economic benefits required to settle a provision are expected to be recovered from a third party, a receivable is recognised as on asset if it is
virtually certain that reimbursements will be received
and amount of the receivable can be measured reliably.
A disclosure for a contingent liablity is made when there
is a possible obligation or a present obligation thay may,
but probably will not, require an outflow of resources. When there is a possible obligation or a present
obligation that the likelihood of outflow of resources is remote, no provision or disclosure is made.
2.15 Financial instruments
Financial assets and financial liabilities are recognised when a Company entity becomes a party to the
contractual provisions of the instruments.
Notes to Standalone Financial Statementsfor the year ended March 31, 2018
(All amounts in H crore, unless otherwise stated)

Corporate Overview Statutory Reports Financial Statements Notice 103
Financial assets and financial liabilities are initially measured at fair value. Transaction costs that are directly attributable to the acquisition or issue of financial assets and financial liabilities (other than financial assets and financial liabilities at fair value through profit or loss) are added to or deducted from the fair value of the financial assets or financial liabilities, as appropriate, on initial recognition. Transaction costs directly attributable to the acquisition of financial assets or financial liabilities at fair value through profit or loss are recognised immediately in profit or loss.
2.15.1 Financial assets
All regular way purchases or sales of financial assets are recognised and derecognised on a trade
date basis. Regular way purchases or sales are purchases or sales of financial assets that require delivery of assets within the time frame established
by regulation or convention in the marketplace.
All recognised financial assets are subsequently measured in their entirety at either amortised cost
or fair value, depending on the classification of the financial assets
2.15.1.1 Classificationoffinancialassets
Financial instruments that meet the
following conditions are subsequently
measured at amortised cost (except for debt instruments that are designated as
at fair value through profit or loss on initial recognition):
a. the asset is held within a business model whose objective is to hold assets in
order to collect contractual cash flows; and
b. the contractual terms of the instrument give rise on specified dates to cash flows that are solely payments of principal and interest on the principal
amount outstanding
Financial instruments that meet the
following conditions are subsequently
measured at fair value through other
comprehensive income (except for debt instruments that are designated as at
fair value through profit or loss on initial recognition):
a. the asset is held within a business model whose objective is achieved
both by collecting contractual cash
flows and selling financial assets; and
b. the contractual terms of the instrument give rise on specified dates to cash flows that are solely payments of principal and interest on the principal
amount outstanding.
Interest income is recognised in profit or loss for instruments measured at Fair
value through other comprehensive
income (FVTOCI). All other financial assets are subsequently measured at fair value.
2.15.1.2 Effective interest method
The effective interest method is a
method of calculating the amortised cost
of a debt instrument and of allocating
interest income over the relevant period. The effective interest rate is the rate that
exactly discounts estimated future cash receipts (including all fees and points paid or received that form an integral part of
the effective interest rate, transaction
costs and other premiums or discounts)
through the expected life of the debt instrument, or, where appropriate, a
shorter period, to the net carrying amount
on initial recognition.
Income is recognised on an effective
interest basis for debt instruments other
than those financial assets classified as at FVTPL. Interest income is recognised in profit or loss and is included in the “Other income” line item.
Notes to Standalone Financial Statementsfor the year ended March 31, 2018
(All amounts in H crore, unless otherwise stated)

Vardhman Textiles Ltd. Annual Report 2017-18104
2.15.1.3 Investments in equity instruments
measured at fair value through other
comprehensive income (FVTOCI)
On initial recognition, the Company can make an irrevocable election (on an instrument-by-instrument basis) to present the subsequent changes
in fair value in other comprehensive
income pertaining to investments in
equity instruments. This election is not permitted if the equity investment is held
for trading. These elected investments are initially measured at fair value plus
transaction costs. Subsequently, they are measured at fair value with gains
and losses arising from changes in fair
value recognised in other comprehensive
income and accumulated in the ‘Reserve for equity instruments through other
comprehensive income’. The cumulative gain or loss is not reclassified to profit or loss on disposal of the investments.
A financial asset is held for trading if:
a. it has been acquired principally for the purpose of selling it in the near term; or
b. on initial recognition it is part of a portfolio of identified financial instruments that the Company
manages together and has a recent
actual pattern of short-term profit-taking; or
c. it is a derivative that is not designated and effective as a hedging instrument
or a financial guarantee.
Dividends on these investments in equity
instruments are recognised in profit or loss when the Company’s right to receive
the dividends is established, it is probable
that the economic benefits associated with the dividend will flow to the entity, the dividend does not represent a recovery
of part of cost of the investment and the
amount of dividend can be measured
reliably. Dividends recognised in profit or loss are included in the ‘Other income’ line item.
2.15.1.4 Financial assets at fair value through
profitorloss(FVTPL)
Investments in equity instruments are
classified as at FVTPL, unless the Company irrevocably elects on initial recognition
to present subsequent changes in fair
value in other comprehensive income for
investments in equity instruments which
are not held for trading.
Debt instruments that meet the amortised
cost criteria or the FVTOCI criteria but are designated as at FVTPL are measured at FVTPL.
A financial asset that meets the amortised cost criteria or debt instruments that meet
the FVTOCI criteria may be designated as at FVTPL upon initial recognition if such designation eliminates or significantly reduces a measurement or recognition
inconsistency that would arise from
measuring assets or liabilities or
recognising the gains and losses on them
on different bases. The Company has designated debt instrument as at FVTPL.
Financial assets at FVTPL are measured at fair value at the end of each reporting
period, with any gains or losses arising
on remeasurement recognised in profit or loss. The net gain or loss recognised in profit or loss incorporates any dividend or interest earned on the financial asset and is included in the ‘Other income’ line item. Dividend on financial assets at FVTPL is recognised when the Company’s right
to receive the dividends is established, it
is probable that the economic benefits associated with the dividend will flow
Notes to Standalone Financial Statementsfor the year ended March 31, 2018
(All amounts in H crore, unless otherwise stated)

Corporate Overview Statutory Reports Financial Statements Notice 105
to the entity, the dividend does not
represent a recovery of part of cost of the
investment and the amount of dividend
can be measured reliably.
2.15.1.5 Impairmentoffinancialassets
The Company applies the expected credit loss model for recognising impairment loss
on financial assets measured at amortised cost, debt instruments at FVTOCI, lease receivables, trade receivables, other
contractual rights to receive cash or
other financial asset not designated as at FVTPL.
Expected credit losses are the weighted average of credit losses with the
respective risks of default occurring as
the weights. Credit loss is the difference between all contractual cash flows that are due to the Company in accordance
with the contract and all the cash flows that the Company expects to receive (i.e. all cash shortfalls), discounted at the original effective interest rate (or credit-adjusted effective interest rate for purchased or originated credit-impaired financial assets). The Company estimates cash flows by considering all contractual terms of the financial instrument (for example, prepayment, extension, call and similar options) through the expected life of that financial instrument.
When making the assessment of whether
there has been a significant increase in credit risk since initial recognition, the
Company uses the change in the risk of
a default occurring over the expected life of the financial instrument instead of the change in the amount of expected credit losses. To make that assessment, the Company compares the risk of a default
occurring on the financial instrument as at the reporting date with the risk of a default
occurring on the financial instrument as at the date of initial recognition and
considers reasonable and supportable
information, that is available without
undue cost or effort, that is indicative of
significant increases in credit risk since initial recognition.
For trade receivables or any contractual
right to receive cash or another financial asset that result from transactions that
are within the scope of Ind AS 11 and Ind
AS 18, the Company always measures
the loss allowance at an amount equal to
lifetime expected credit losses.
Further, for the purpose of measuring
lifetime expected credit loss allowance for trade receivables, the Company has
used a practical expedient as permitted under Ind AS 109. The Company follows simplified approach for recognition of impairment loss allowance on trade
recievables. The application of simplified approach does not require the Company
to track changes in credit risk. Rather, it recognises impairment loss allowance
based on lifetime ECL’s at each reporting date, right from its initial recognition.
The impairment requirements for the
recognition and measurement of a loss
allowance are equally applied to debt
instruments at FVTOCI except that the loss allowance is recognised in other
comprehensive income and is not reduced
from the carrying amount in the balance
sheet.
2.15.1.6Derecognitionoffinancialassets
The Company derecognises a financial asset when the contractual rights to
the cash flows from the asset expire, or when it transfers the financial asset and substantially all the risks and rewards of
ownership of the asset to another party. If
Notes to Standalone Financial Statementsfor the year ended March 31, 2018
(All amounts in H crore, unless otherwise stated)

Vardhman Textiles Ltd. Annual Report 2017-18106
the Company neither transfers nor retains
substantially all the risks and rewards
of ownership and continues to control
the transferred asset, the Company
recognises its retained interest in the asset
and an associated liability for amounts it
may have to pay. If the Company retains substantially all the risks and rewards of
ownership of a transferred financial asset, the Company continues to recognise
the financial asset and also recognises a collateralised borrowing for the proceeds
received.
On derecognition of a financial asset in its entirety, the difference between the
asset’s carrying amount and the sum of
the consideration received and receivable
and the cumulative gain or loss that had
been recognised in other comprehensive
income and accumulated in equity is
recognised in profit or loss if such gain or loss would have otherwise been
recognised in profit or loss on disposal of that financial asset.
On derecognition of a financial asset other than in its entirety (e.g. when the Company retains an option to repurchase
part of a transferred asset), the Company
allocates the previous carrying amount
of the financial asset between the part it continues to recognise under continuing
involvement, and the part it no longer
recognises on the basis of the relative
fair values of those parts on the date of
the transfer. The difference between the carrying amount allocated to the part
that is no longer recognised and the sum
of the consideration received for the part
no longer recognised and any cumulative
gain or loss allocated to it that had been
recognised in other comprehensive
income is recognised in profit or loss if such gain or loss would have otherwise been
recognised in profit or loss on disposal
of that financial asset. A cumulative gain or loss that had been recognised in
other comprehensive income is allocated
between the part that continues to be
recognised and the part that is no longer
recognised on the basis of the relative fair
values of those parts.
2.15.1.7 Foreign exchange gains and losses
The fair value of financial assets denominated in a foreign currency is
determined in that foreign currency and
translated at the spot rate at the end of
each reporting period.
For foreign currency denominated
financial assets measured at amortised cost and FVTPL, the exchange differences are recognised in profit or loss.
2.15.2 Financial liabilities
All financial liabilities are subsequently measured at amortised cost using the effective interest method
or at FVTPL.
2.15.2.1 Financial liabilities at fair value through
profitandloss(FVTPL)
Financial liabilities are classified as at FVTPL when the financial liability is either contingent consideration recognised by
the Company as an acquirer in a business
combination to which Ind AS 103 applies
or is held for trading or it is designated as at
FVTPL.
A financial liability is classified as held for trading if:
a. it has been incurred principally for the purpose of repurchasing it in the near
term; or
b. on initial recognition it is part of a portfolio of identified financial instruments that the Company
Notes to Standalone Financial Statementsfor the year ended March 31, 2018
(All amounts in H crore, unless otherwise stated)

Corporate Overview Statutory Reports Financial Statements Notice 107
manages together and has a recent
actual pattern of short-term profit-taking; or
c. it is a derivative that is not designated and effective as a hedging instrument.
A financial liability other than a financial liability held for trading or contingent
consideration recognised by the Company
as an acquirer in a business combination
to which Ind AS 103 applies, may be
designated as at FVTPL upon initial recognition if:
a. such designation eliminates or significantly reduces a measurement or recognition inconsistency that would
otherwise arise;
b. the financial liability forms part of group of financial assets or financial liabilities or both, which is managed
and its performance is evaluated on
a fair value basis, in accordance with
the Company’s documented risk
management or investment strategy,
and information about the grouping is
provided internally on that basis; or
c. it forms part of a contract containing one or more embedded derivatives, and
Ind AS 109 permits the entire combined contract to be designated as at FVTPL in accordance with Ind AS 109.
Financial liabilities at FVTPL are stated at fair value, with any gains or losses arising
on remeasurement recognised in profit or loss. The net gain or loss recognised in profit or loss incorporates any interest paid on the financial liability and is included in the ‘Other income’ line item.
Gains or losses on financial guarantee contracts and loan commitments issued
by the Company that are designated by
the Company as at fair value through profit or loss are recognised in profit or loss.
2.15.2.2 Financial liabilities subsequently measured
at amortised cost
Financial liabilities that are not held-for-trading and are not designated as at
FVTPL are measured at amortised cost at the end of subsequent accounting
periods. The carrying amounts of financial liabilities that are subsequently measured
at amortised cost are determined based
on the effective interest method. Interest expense that is not capitalised as part of costs of an asset is included in the ‘Finance costs’ line item.
The effective interest method is a method
of calculating the amortised cost of a
financial liability and of allocating interest expense over the relevant period. The effective interest rate is the rate that
exactly discounts estimated future cash payments (including all fees and points paid or received that form an integral part
of the effective interest rate, transaction
costs and other premiums or discounts)
through the expected life of the financial liability, or (where appropriate) a shorter period, to the net carrying amount on initial
recognition.
2.15.2.3Derecognitionoffinancialliabilities
The Company derecognises financial liabilities when, and only when, the
Company’s obligations are discharged,
cancelled or have expired. An exchange between with a lender of debt instruments
with substantially different terms is
accounted for as an extinguishment of the original financial liability and the recognition of a new financial liability. Similarly, a substantial modification of the terms of an existing financial liability (whether or not attributable to the financial
Notes to Standalone Financial Statementsfor the year ended March 31, 2018
(All amounts in H crore, unless otherwise stated)

Vardhman Textiles Ltd. Annual Report 2017-18108
difficulty of the debtor) is accounted for as an extinguishment of the original financial liability and the recognition of a new
financial liability. The difference between the carrying amount of the financial liability derecognised and the consideration paid
and payable is recognised in profit or loss.
2.15.3Derivativefinancialinstruments
The Company enters into a variety of derivative
financial instruments to manage its exposure to foreign exchange rate risks and to manage its exposure to imported raw material price risk including foreign exchange forward contracts and commodities future contracts. Further details of derivative financial instruments are disclosed in note 37.
Derivatives are initially recognised at fair value
at the date the derivative contracts are entered
into and are subsequently remeasured to their
fair value at the end of each reporting period. The resulting gain or loss is recognised in profit or loss immediately unless the derivative is designated
and effective as a hedging instrument, in which
event the timing of the recognition in profit or loss depends on the nature of the hedging relationship
and the nature of the hedged item.
2.15.4 Equity instrument
Equity instrument are any contract that
evidences a residual interest in the assets of
an equity after deducting all of its liablities.
Debt or equity instruments issued by the Company
are classifed as either financial liablities or as equity in accordance with the substance of the
contractual arrangements and the definitions of a financial liablity and an equity instrument
Ordinary shares are classified as equity. Incremental costs directly attributable to the issuance of new
ordinary shares and share options are recognised
as a deduction from equity, net of any tax effects.
The equity shares of the Company held by it
through a trust are presented as deduction from
total equity, until they are cancelled or sold.
2.16 Earnings per share
Basic earnings per equity share are computed by
dividing the net profit attributable to the equity holders
of the Company by the weighted average number of
equity shares outstanding during the period. Diluted earnings per equity share is computed by dividing
the net profit attributable to the equity holders of the
Company by the weighted average number of equity
shares considered for deriving basic earnings per
equity share and also the weighted average number
of equity shares that could have been issued upon
conversion of all dilutive potential equity shares. The dilutive potential equity shares are adjusted for
the proceeds receivable had the equity shares been
actually issued at fair value (i.e. the average market value of the outstanding equity shares). Dilutive potential equity shares are deemed converted as of
the beginning of the period, unless issued at a later
date. Dilutive potential equity shares are determined independently for each period presented.
2.17 Significant accounting judgements, estimates and assumptions
In the application of the Company’s accounting policies,
which are described as stated above, the directors of the
Company are required to make judgements, estimates
and assumptions about the carrying amounts of assets
and liabilities that are not readily apparent from other
sources. The estimates and associated assumptions are based on historical experience and other factors that are considered to be relevant. Actual results may differ from these estimates.
The estimates and underlying assumptions are reviewed
on an ongoing basis. Revisions to accounting estimates are recognized in the period in which the estimate is
revised if the revision affects only the period of the
revision and future periods if the revision affects both
current and future periods.
Notes to Standalone Financial Statementsfor the year ended March 31, 2018
(All amounts in H crore, unless otherwise stated)

Corporate Overview Statutory Reports Financial Statements Notice 109
2.17.1 Key sources of uncertainty
In the application of the Company accounting
policies, the management of the Company is
required to make judgements, estimates and
assumptions about the carrying amounts of assets
and liabilities that are not readily apparent from
other sources. The estimates and associated assumptions are based on historical experience and other factors that are considered to be relevant. Actual results may differ from these estimates.
The estimates and underlying assumptions
are reviewed on an ongoing basis. Revisions to accounting estimates are recognised in the period
in which the estimate is revised if the revision
affects only that period or in the period of the
revision and future periods if the revision affects
both current and future periods.
The following are the areas of estimation
uncertainty and critical judgements that the
management has made in the process of applying
the Company’s accounting policies and that
have the most significant effect on the amounts recognised in the financial statements:
2.17.1.1 Definedbenefitplans
The cost of the defined benefit plan and
other post-employment benefits and the present value of such obligation are
determined using actuarial valuations. An actuarial valuation involves making
various assumptions that may differ
from actual developments in the future. These include the determination of the
discount rate, future, salary increases,
mortality rates and future pension
increases. Due to the complexities involved in the valuation and its long-term nature, a defined benefit obligation
is highly sensitive to changes in these
assumptions. All assumptions are reviewed at each reporting date.
2.17.1.2 Useful lives of depreciable tangible
assets and intangible assets
Management reviews the useful lives of
depreciable/amortisable assets at each reporting date.
As at March 31, 2018 management assessed
that the useful lives represent the expected utility of the assets to the Company.
During the financial year, the directors determined that the useful lives of certain
items of plant and equipment should be
different. Based on technical evaluation and market consideration, the Company
has, with effect from April 1, 2017, revised the estimated useful of life of general plant
and machinery from 7.5 years to 10 years.
The financial effect of this reassessment, assuming the assets are held until the end
of their estimated useful lives, is decrease
in the depreciation expense in the current financial year by H101.28 crore.
2.17.1.3 Fair Value measurements and valuation
processes
Some of the Company’s assets and
liabilities are measured at fair value for
financial reporting purposes. The board of directors of the Company approves
the fair values determined by the Chief
Financial Officer of the Company including determining the appropriate valuation
techniques and inputs for fair value
measurements.
In estimating the fair value of an asset
or liability, the Company uses market-observable data to the extent is available. Where Level 1 inputs are not available, the Company engages third party qualified valuers to perform the valuation. The Chief Financial Officer works closely with
Notes to Standalone Financial Statementsfor the year ended March 31, 2018
(All amounts in H crore, unless otherwise stated)

Vardhman Textiles Ltd. Annual Report 2017-18110
the qualified external valuers to establish appropriate valuation techniques and
inputs to the model.
Information about the valuation techniques
and inputs used in determining the fair
value of various assets and liabilities are
disclosed in notes 37.
2.17.1.4 Contingent Liability
In ordinary course of business, the
Company faces claims by various parties. The Company annually assesses such
claims and monitors the legal environment
on an ongoing basis, with the assistance of
external legal counsel, wherever necessary. The Company records a liability for any
claims where a potential loss probable and
capable of being estimated and discloses
such matters in its financial statements, if material. For potential losses that are considered possible, but not probable,
the Company provides disclosures in the
financial statements but does not record
a liability in its financial statements unless the loss becomes probable.
2.18 Applicablity of new and revised IND AS
Ministry of Corporate affairs has notified Ind AS 115 ‘Revenue from Contracts with customers’, which is effective from April 1, 2018. The new standard outlines a single comprehensive control-based model for revenue recognition and supersedes current revenue recognition
guidance based on risks or rewards. The Company is evaluating the requirements of Ind AS 115 and its effect of the financial statements.
Appendix B to Ind AS 21, Foreign currency transactions and advance consideration: On March 28, 2018, Ministry of Corporate Affairs (“MCA”) has notified the Companies (Indian Accounting Standards) Amendment Rules, 2018 containing Appendix B to Ind AS 21, Foreign currency transactions and advance consideration which clarifies the date of the transaction for the purpose of determining the
exchange rate to use on initial recognition of the related asset, expense or income, when an entity has received or paid advance consideration in a foreign currency. The amendment will come into force from April 1, 2018.
Notes to Standalone Financial Statementsfor the year ended March 31, 2018
(All amounts in H crore, unless otherwise stated)

Corporate Overview Statutory Reports Financial Statements Notice 111
3A Property, plant and equipment and capital work-in-progress
As at
March 31, 2018
As at
March 31, 2017
Carrying amount of
Freehold land 91.55 86.39 Buildings 709.10 732.57 Plant and equipment 1,667.97 1,594.74 Furniture and fixtures 7.50 8.32 Vehicles 7.46 9.88 Office equipment 19.46 19.51 Total Property, plant and equipment 2,503.04 2,451.41
Capital work-in-progress 105.08 48.54 2,608.12 2,499.95
Freehold
land
Buildings Plant and
equipment
Furniture
and fixturesVehicles Office
equipment
Total
Gross carrying value
Balance as at April 1, 2016 65.59 729.49 2,014.13 9.34 10.77 17.56 2,846.88
Addition 21.69 64.18 202.44 0.48 2.83 18.12 309.74
Disposal (0.89) (6.64) (11.86) (0.05) (0.68) (0.12) (20.24)
Balance at March 31, 2017 86.39 787.03 2,204.71 9.77 12.92 35.56 3,136.38
Addition 5.16 8.85 262.01 0.67 1.62 5.92 284.23
Disposal - (4.03) (54.59) (0.04) (3.45) (0.93) (63.04)
Balance at March 31, 2018 91.55 791.85 2,412.13 10.40 11.09 40.55 3,357.57
Accumulated depreciation
Balance as at April 1, 2016 - 26.22 323.83 1.71 1.55 4.53 357.84
Depreciation - 28.82 287.70 1.43 1.76 5.15 324.86
Disposal/Adjustment - (0.58) (1.56) (1.69) (0.27) 6.37 2.27
Balance at March 31, 2017 - 54.46 609.97 1.45 3.04 16.05 684.97
Depreciation - 29.49 185.81 1.49 1.57 5.91 224.27
Disposal - (1.20) (51.62) (0.04) (0.98) (0.88) (54.73)
Balance at March 31, 2018 - 82.75 744.16 2.90 3.63 21.09 854.63
Carrying amount
Balance as at April 1, 2016 65.59 703.27 1,690.30 7.63 9.22 13.03 2,489.04
Addition 21.69 64.18 202.44 0.48 2.83 18.12 309.74
Disposal/ Adjustment (0.89) (6.06) (10.30) 1.64 (0.41) (6.49) (22.51)
Depreciation - (28.82) (287.70) (1.43) (1.76) (5.15) (324.86)
Balance at March 31, 2017 86.39 732.57 1,594.74 8.32 9.88 19.51 2,451.41
Addition 5.16 8.85 262.01 0.67 1.62 5.92 284.23
Disposal - (2.83) (2.97) - (2.47) (0.06) (8.33)
Depreciation - (29.49) (185.81) (1.49) (1.57) (5.91) (224.27)
Balance at March 31, 2018 91.55 709.10 1,667.97 7.50 7.46 19.46 2,503.04
Notes to Standalone Financial Statementsfor the year ended March 31, 2018
(All amounts in H crore, unless otherwise stated)

Vardhman Textiles Ltd. Annual Report 2017-18112
Notes on property, plant and equipment
1. Freehold land includes H4.38 crore (March 31, 2017 Nil) for the cost of land for which title deeds are yet to be executed in favor of the Company, though the possession thereof has been taken by the Company.
2. Refer to note 18 (a) for information on property, plant and equipment pledged as security by the Company.
3. During the financial year 2017-18, the management had reviewed the useful life of general plant and machinery and had re-estimated that useful life of such plant and machinery should be 10 years instead of 7.5 years. Accordingly,the necessary accounting changes have been done prospectively w.e.f April 1, 2017 as per Ind AS 8 and Ind AS 16.The depreciation expense charged for the year ended March 31, 2018 would have been higher by H101.28 crore had the Company continued with previously estimated useful life for general plant and machinery.
4. Buildings includes H2.48 crore (March 31, 2017: H2.48 crore) cost of residential flats at Mandideep, the land cost of which has not been excluded from this cost. The depreciation for the year has been taken on the entire cost.
3A Property, plant and equipment and capital work-in-progress (contd..)
3B Intangible assets
As at
March 31, 2018
As at
March 31, 2017
Carrying amount of
Computer softwares 3.73 5.17
Contribution to CETP - 0.14
Right to use power lines - 1.43
3.73 6.74
Computer
softwares
Contribution
to CETP
Right to use
power lines
Total
Gross carrying value
Balance as at April 1, 2016 18.32 0.64 18.13 37.09
Addition 0.65 - - 0.65
Disposal (1.04) - - (1.04)
Balance as at March 31, 2017 17.93 0.64 18.13 36.70
Addition 1.27 - - 1.27
Balance as at March 31, 2018 19.20 0.64 18.13 37.97
Accumulated amortisation
Balance as at April 1, 2016 10.42 0.46 15.13 26.01
Amortisation expenses 3.02 0.04 1.57 4.63
Disposal (0.68) - - (0.68)
Balance as at March 31, 2017 12.76 0.50 16.70 29.96
Amortisation expenses 2.71 0.14 1.43 4.28
Balance as at March 31, 2018 15.47 0.64 18.13 34.24
Notes to Standalone Financial Statementsfor the year ended March 31, 2018
(All amounts in H crore, unless otherwise stated)

Corporate Overview Statutory Reports Financial Statements Notice 113
Note: These intangible assets are not internally generated
Computer
softwares
Contribution
to CETP
Right to use
power lines
Total
Carrying amount
Balance as at April 1, 2016 7.90 0.18 3.00 11.08
Addition 0.65 - - 0.65
Disposal (0.36) - - (0.36)
Amortisation expenses (3.02) (0.04) (1.57) (4.63)
Balance as at March 31, 2017 5.17 0.14 1.43 6.74
Addition 1.27 - - 1.27
Amortisation expenses (2.71) (0.14) (1.43) (4.28)
Balance as at March 31, 2018 3.73 - - 3.73
3B Intangible assets (contd..)
4 **Investments (Non Current)
Particulars As at
March 31, 2018
As at
March 31, 2017
Break up of investments in subsidiaries, associates and joint venture
I TRADE INVESTMENTS (at cost/carrying value)
Financial assets carried at cost
a. Investment in equity instruments
(i) Investment in subsidiaries (quoted)
5,68,51,144 (March 31, 2017: 5,68,51,144 ) Equity shares of H10/- 53.15 53.15 each fully paid up of Vardhman Acrylics Limited (ii) Investment in subsidiaries (unquoted)
$$ 2,07,00,060 (March 31, 2017: 1,85,15,060 ) Equity shares of H10/- 39.62 28.56 each fully paid up of VMT Spinning Company Limited 40,00,000 (March 31, 2017: 40,00,000) Equity shares of H10/- 4.04 4.04 each fully paid up of VTL Investments Limited (iii) Investment in Joint Ventures/ associates
Quoted
^ 97,08,333 (March 31, 2017: 58,25,000) Equity shares of H10/- 25.24 5.83 each fully paid up of Vardhman Special Steels Limited Unquoted
$ 62,69,699 (March 31, 2017: 62,69,699) Equity shares of H10/- 27.50 27.50 each fully paid up of Vardhman Yarns & Threads Limited (Refer Note 48.5) 71,40,000 (March 31, 2017: 71,40,000 ) Equity shares of H10/- each 7.14 7.14 fully paid up of Vardhman Nisshinbo Garments Company Limited 25,000 (March 31, 2017 : 25,000) Equity shares of H10/- each 0.03 0.03 fully paid-up of Vardhman Spinning and General Mills Limited
Notes to Standalone Financial Statementsfor the year ended March 31, 2018
(All amounts in H crore, unless otherwise stated)

Vardhman Textiles Ltd. Annual Report 2017-18114
Particulars As at
March 31, 2018
As at
March 31, 2017
b. Investment in preference instruments (unquoted)
(i) Investment in joint ventures
1,00,00,000 (March 31, 2017: 1,00,00,000) 10% non-cumulative convertible preference shares of H10/- each fully paid up of Vardhman Nisshinbo Garments Company Limited 10.00 10.00
Financial assets measured at fair value through other comprehensive
income
(i) Investment in equity instruments (unquoted)
41,000 (March 31, 2017: 41,000) Equity-Shares of H10/- each 0.07 0.06 fully paid-up of Shivalik Solid Waste Management Limited (Section 25 Company) 1,40,625 (March 31, 2017: 1,40,625 ) Equity shares of H10/- each 1.65 1.61 fully paid-up of Nimbua Greenfield (Punjab) Limited 2,225 (March 31, 2017: 2,225) Equity shares of H10/- each fully paid-
up of Devakar Investment & Trading Company Private Limited 0.16 0.12 II Other Investments:-
Financial assets measured at fair value through Profit and loss (i) Investment in Bonds/ Preference shares/ Debentures (quoted)
6660 (March 2017 31, :6,660) 17.38% Non-convertible redeemable cumulative preference shares of H7500/- each fully paid of IL&FS Financial Services Limited 11.19 11.24
10,000 (March 31, 2017:10,000) 16.46% Non-convertible redeemable cumulative preference shares of H7500/- each fully paid of IL&FS Financial Services Limited 16.60 15.66
*NIL (March 31, 2017: 2,500) Principal protected market linked redeemable non-convertible debentures of H1,00,000/- each of ECL Finance Limited - 25.00
*NIL (March 31, 2017:1,500) Principal protected market linked redeemable non-convertible debentures of H1,00,000/- each of IIFL Wealth Finance Limited - 16.06
*NIL (March 31, 2017: 2,000) Principal protected market linked redeemable non-convertible debentures of H1,00,000/- each of IIFL Wealth Finance Limited - 21.34
100 (March 31, 2017: 100 )Principal protected market linked redeemable non convertible debentures of H1,000,000/- each of Aspire home Finance ltd 11.68 10.63
Unquoted
12,50,000 (31st March 2017: Nil ) 8.2% cumulative compulsarily convertible preference shares of H100 each Tata motor Finance Limited 26.99 -
4 **Investments (Non Current) (contd..)
Notes to Standalone Financial Statementsfor the year ended March 31, 2018
(All amounts in H crore, unless otherwise stated)
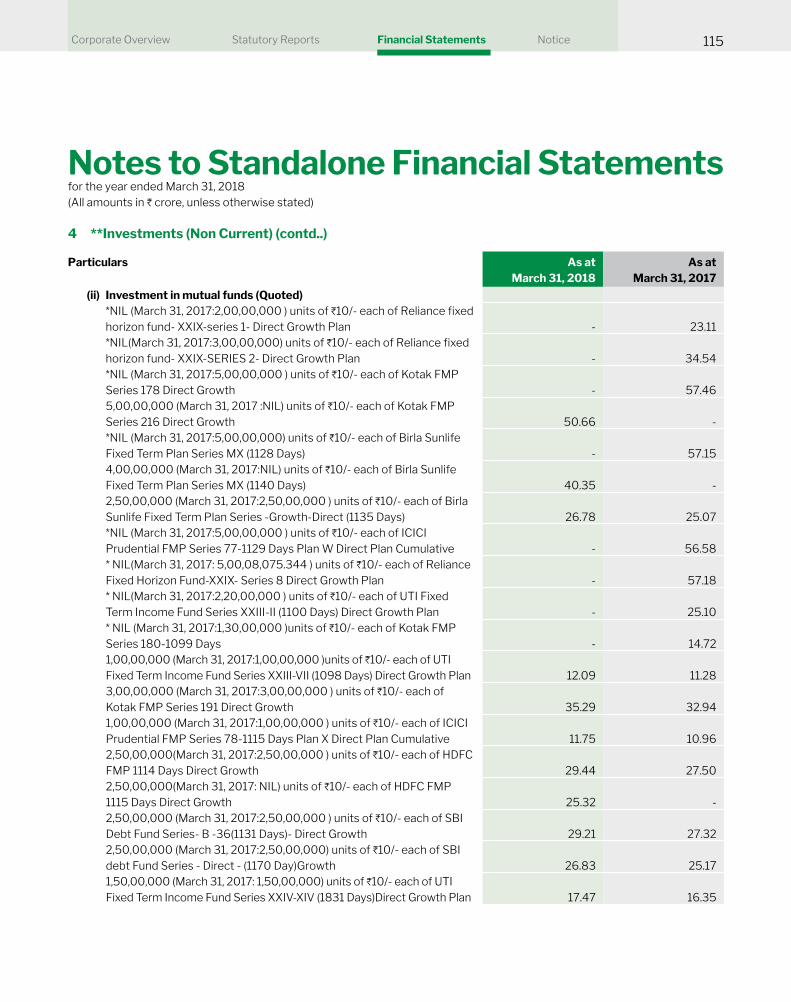
Corporate Overview Statutory Reports Financial Statements Notice 115
4 **Investments (Non Current) (contd..)
Particulars As at
March 31, 2018
As at
March 31, 2017
(ii) Investment in mutual funds (Quoted)
*NIL (March 31, 2017:2,00,00,000 ) units of H10/- each of Reliance fixed horizon fund- XXIX-series 1- Direct Growth Plan - 23.11
*NIL(March 31, 2017:3,00,00,000) units of H10/- each of Reliance fixed horizon fund- XXIX-SERIES 2- Direct Growth Plan - 34.54
*NIL (March 31, 2017:5,00,00,000 ) units of H10/- each of Kotak FMP Series 178 Direct Growth - 57.46
5,00,00,000 (March 31, 2017 :NIL) units of H10/- each of Kotak FMP Series 216 Direct Growth 50.66 -
*NIL (March 31, 2017:5,00,00,000) units of H10/- each of Birla Sunlife Fixed Term Plan Series MX (1128 Days) - 57.15
4,00,00,000 (March 31, 2017:NIL) units of H10/- each of Birla Sunlife Fixed Term Plan Series MX (1140 Days) 40.35 -
2,50,00,000 (March 31, 2017:2,50,00,000 ) units of H10/- each of Birla Sunlife Fixed Term Plan Series -Growth-Direct (1135 Days) 26.78 25.07
*NIL (March 31, 2017:5,00,00,000 ) units of H10/- each of ICICI Prudential FMP Series 77-1129 Days Plan W Direct Plan Cumulative - 56.58
* NIL(March 31, 2017: 5,00,08,075.344 ) units of H10/- each of Reliance Fixed Horizon Fund-XXIX- Series 8 Direct Growth Plan - 57.18
* NIL(March 31, 2017:2,20,00,000 ) units of H10/- each of UTI Fixed Term Income Fund Series XXIII-II (1100 Days) Direct Growth Plan - 25.10
* NIL (March 31, 2017:1,30,00,000 )units of H10/- each of Kotak FMP Series 180-1099 Days - 14.72
1,00,00,000 (March 31, 2017:1,00,00,000 )units of H10/- each of UTI Fixed Term Income Fund Series XXIII-VII (1098 Days) Direct Growth Plan 12.09 11.28
3,00,00,000 (March 31, 2017:3,00,00,000 ) units of H10/- each of Kotak FMP Series 191 Direct Growth 35.29 32.94
1,00,00,000 (March 31, 2017:1,00,00,000 ) units of H10/- each of ICICI Prudential FMP Series 78-1115 Days Plan X Direct Plan Cumulative 11.75 10.96
2,50,00,000(March 31, 2017:2,50,00,000 ) units of H10/- each of HDFC FMP 1114 Days Direct Growth 29.44 27.50
2,50,00,000(March 31, 2017: NIL) units of H10/- each of HDFC FMP 1115 Days Direct Growth 25.32 -
2,50,00,000 (March 31, 2017:2,50,00,000 ) units of H10/- each of SBI Debt Fund Series- B -36(1131 Days)- Direct Growth 29.21 27.32
2,50,00,000 (March 31, 2017:2,50,00,000) units of H10/- each of SBI debt Fund Series - Direct - (1170 Day)Growth 26.83 25.17
1,50,00,000 (March 31, 2017: 1,50,00,000) units of H10/- each of UTI Fixed Term Income Fund Series XXIV-XIV (1831 Days)Direct Growth Plan 17.47 16.35
Notes to Standalone Financial Statementsfor the year ended March 31, 2018
(All amounts in H crore, unless otherwise stated)

Vardhman Textiles Ltd. Annual Report 2017-18116
* Investments having maturity period of less than 12 months from March 31, 2018 i.e. the balance sheet date have been reclassified as ' Current Investment' during the year.$ For change in the Company’s ownership interest in Vardhman Yarns and Threads Limited refer note no.48.5$$ For change in Company’s ownership interest in VMT Spinning Company Limited
During the financial year 2017-2018, the Company has acquired remaining 10.56 % equity shares of VMT Spinning Company Limited (VMT) from Marubeni Corporation, Japan (13,80,000 shares consisting of 6.67% share) & Marubeni Hong Kong and south china limited (8,05,000 shares consisting of 3.89% share) for H11.05 crore. Accordingly VMT, has become a wholly owned subsidiary of the Company.
^ For change in Company's ownership interest in Vardhman Special Steels Limited
During the financial year 2017-18 the Company has subscribed to 38,83,333 equity shares of Vardhman Special Steels Limited offered through Right Issue at a price of H50 per share amounting to H19.41 crore.
**Refer Note 37
Particulars As at
March 31, 2018
As at
March 31, 2017
2,50,00,000 (March 31, 2017: 2,50,00,000) units of H10/- each of UTI Fixed Term Income Fund Series XXV-11 (1097 Days)Direct Growth Plan 28.40 26.44
3,50,00,000 (March 31, 2017: 3,50,00,000 ) units of H10/- each of Kotak FMP Series 202 Direct - Growth 37.43 35.07
*NIL(March 31, 2017: 5,00,00,000) units of H10/- each of SBI Debt Fund Series-B (1105 DAYS) Direct Plan Growth FMP - 59.16
* NIL(March 31, 2017: 3,00,00,000) units of H10/- each of ICICI Prudential FMP Series 76-1108 Days Plan V Direct Plan Cumulative - 35.61
5,00,00,000 (March 31, 2017: NIL )units of H10/- each of SBI Debt Fund Series C10 (1150 DAYS) Direct Plan Growth FMP 50.59 -
25,000,000 (March 31, 2017: 25,000,000 ) units of H10/- each of ICICI Prudential FMP Series 80-1233 Days Plan O Direct Plan Cumulative 26.87 25.17
25,000,000 (March 31, 2017: 2,50,00,000 ) units of H10/- each of Reliance Fixed Horizon Fund- XXXIII- Series 3- Direct Plan Growth Plan 26.90 25.19
2,50,00,000 (March 31, 2017: 2,50,00,000 0) units of H10/- each of Reliance Fixed Horizon Fund- XXXIIV- Series 4- Direct Plan Growth Plan 26.87 25.15
50,000,000 (March 31, 2017 : NIL) units of H10/- each of ICICI Fixed Maturity Plan Series 82-1203 50.65 -
787.96 972.19
1. Aggregate book value of quoted investments 670.76 893.14 2. Aggregate Market Value of quoted investments 1,001.97 1,202.81 3. Aggregate carrying value of unquoted investments 117.20 79.05
4 **Investments (Non Current) (contd..)
Notes to Standalone Financial Statementsfor the year ended March 31, 2018
(All amounts in H crore, unless otherwise stated)

Corporate Overview Statutory Reports Financial Statements Notice 117
5 Loans (Non Current)
6 *Other financial assets (Non Current)
Particulars As at
March 31, 2018
As at
March 31, 2017
Financial assets at amortized cost
Loan to employees 0.59 0.61 0.59 0.61
Particulars As at
March 31, 2018
As at
March 31, 2017
Financial assets at amortized cost
Fixed Deposits with banks more than twelve months maturity 1.53 1.63 Interest Receivable 0.23 0.11 Other Recoverable 7.21 -
8.97 1.74
Particulars As at
March 31, 2018
As at
March 31, 2017
Non Financial Assets at amortized cost
(unsecured considered good) Capital advances 37.07 23.33 Balance with government authorities 12.82 13.98 Security deposits 27.47 20.94 Unamortised Lease hold land prepayment 7.22 7.31 Prepaid (Deferred) Expense for employee benefit 0.08 0.05 Prepaid expenses-others 0.60 0.43
85.26 66.04
Particulars As at
March 31, 2018
As at
March 31, 2017
(at cost or net realisable value, whichever is lower) Raw materials* 1,340.40 875.56 Work-in-progress 142.43 137.69 Finished Goods 489.98 446.71 Stores and Spares* 143.70 129.04
2,116.51 1,589.00
*Refer Note 37
7 Other non current assets
8 Inventories
*above items include goods in transit as per below
Notes to Standalone Financial Statementsfor the year ended March 31, 2018
(All amounts in H crore, unless otherwise stated)

Vardhman Textiles Ltd. Annual Report 2017-18118
Particulars As at
March 31, 2018
As at
March 31, 2017
Raw materials 7.13 55.28 Stores and Spares 10.95 14.69
18.08 69.97
8 Inventories (contd..)
9 **Other investments (Current)
(i) The cost of inventories recognised as an expense during the year in respect of continuing operations was H3,180.52 crore (March 31, 2017: H2,836.69 crore)
(ii) The cost of inventory recognised as an expenses includes H NIL crore (March 31, 2017 H NIL crore) in respect of write down of inventory to net realisable value.
(iii) Refer to Note 18(a) and 23 for information on inventories pledged as security by the Company.
(iv) The method of valuation of inventories has been stated in note 2.13.
Particulars As at
March 31, 2018
As at
March 31, 2017
Financial assets measured at fair value through Profit and loss
(i) Investment in Liquid Funds (Quoted)
*NIL (March 31, 2017: 6492.73 ) units of 1,000/- each of - 0.65
Baroda pioneer liquid fund plan a ddr
NIL (March 31, 2017:26,700.657 ) units of H1,000/- each of Boi Axa Liquid Fund -Direct Plan-Growth ( scheme code Lfdgg) - 5.00
NIL (March 31, 2017: 5,17,523.56 ) units of H100/- each of Birla sun life cash plus-direct-growth - 13.52
*NIL (March 31, 2017: 0.18) units of H1,000/- each of Hdfc cash management funds-savings plan direct-growth - -
(ii) Investment in Debt Funds/ Monthly Income Plans/Debentures/Bonds
(Quoted)
1,27,19,456 (March 31, 2017 : NIL) units of H10/- each of ICICI corporate Bond Direct Growth 35.98 -
4,00,00,000 (March 31, 2017: 4,00,00,000 ) units of H10/- each of Kotak FMP Series 200 Direct - Growth 42.97 40.25
2,48,58,660.76(March 31, 2017:Nil) units of H10/- each of Reliance Corporate Bond fund Direct Plan Growth 35.99 -
2,17,37,240 (March 31, 2017 : NIL ) units of H10/- each of L&T Short Term Income Fund 41.24 -
NIL (March 31, 2017:1,00,00,000 ) units of H10/- each of SBI debt Fund Series - (400 Day )Regular -Growth - 12.70
Notes to Standalone Financial Statementsfor the year ended March 31, 2018
(All amounts in H crore, unless otherwise stated)

Corporate Overview Statutory Reports Financial Statements Notice 119
Particulars As at
March 31, 2018
As at
March 31, 2017
NIL (March 31, 2017:1,50,00,000) units of H10/- each of SBI debt Fund Series - Direct - (400 Day)Growth - 19.31
NIL (March 31, 2017: 2,50,00,000 )units of H10/- each of SBI debt Fund Series -Direct -(380 Day)Growth - 32.04
NIL (March 31, 2017: 2,54,82,906 ) units of H10/- each of ICICI Prudential FMP Series 73-390 D Plan I Direct Plan Cumulative - 32.82
NIL (March 31, 2017:2,50,00,000 ) units of H10/- each of Dsp Blackrock FMP-12.5M - 32.18
NIL (March 31, 2017: 2,50,00,000) units of H10/- each of Kotak FMP Series 149 Direct - Growth - 31.99
83,58,827.758 (March 31, 2017: 83,58,827.758 ) units of H10/- each of Kotak Bond (short Term) -Direct Plan Growth 28.14 26.45
NIL (March 31, 2017:2,50,00,000) units of H10/- each of Reliance Fixed Horizon Fund XXVI Series 2 Direct Growth Plan - 32.21
NIL (March 31, 2017: 2,00,00,000 ) units of H10/- each of Reliance Fixed Horizon Fund- XXV- Series 33- Direct Plan Growth Plan - 25.71
NIL (March 31, 2017: 83,48,611.292) units of H10/- each of Reliance short Term Fund - Direct Growth Plan Growth Option - 26.38
NIL (March 31, 2017: 2,50,00,000 ) units of H10/- each of BSL Fixed Term Plan -Series KR - Growth Direct - 32.21
12,49,786.287 (March 31, 2017:12,49,786.287 ) units of H10/- each of Birla Sun life Treasury Optimizer Plan-Growth-Direct Plan 28.05 26.29
NIL (March 31, 2017:95,359.82 ) units of H10/- each of Birla Sun life Floating Rate- Short Term -Growth-Direct Plan - 2.07
2,43,36,821.61 (March 31, 2017: 2,43,36,821.61 ) units of H10/- each of Idfc Corporate Bond Fund -Direct Plan -Growth Option 29.11 27.30
NIL (March 31, 2017: 3,00,00,000 ) units of H10/- each of UTI Fixed Term Income Fund Series XVIII-I Direct Growth Plan - 38.54
NIL (March 31, 2017:1,500)Principal protected Market Linked redeemable Non Convertible Debentures of H1,00,000/- each of ECL Finance limited - 15.00
NIL (March 31, 2017:1,000) Principal protected Market Linked redeemable Non Convertible Debentures of H1,00,000/- each of ECL Finance limited - 11.11
NIL (March 31, 2017:996 )Secured redeemable Non convertible Principal protected market linked debentures of H1,00,000/- each of Reliance Capital Ltd - 9.89
NIL (March 31, 2017:1,500 )Principal protected Market Linked redeemable Non Convertible Debentures of H1,00,000/- each of IIFL wealth Finance limited - 15.90
*NIL (March 31, 2017:100 )Bonds of H1,000,000/- each of 7.17% NHAI - 10.14
9 **Other investments (Current) (contd..)
Notes to Standalone Financial Statementsfor the year ended March 31, 2018
(All amounts in H crore, unless otherwise stated)

Vardhman Textiles Ltd. Annual Report 2017-18120
9 **Other investments (Current) (contd..)
Particulars As at
March 31, 2018
As at
March 31, 2017
*NIL (March 31, 2017:81 )Bonds of H1,000,000/- each of 7.18% NABARD - 8.13 *NIL (March 31, 2017:5 )Bonds of H1,000,000/- each of 7.47% PFC - 0.52 *NIL (March 31, 2017:7 )Bonds of H1,000,000/- each of 7.50% PFC - 0.73 *NIL (March 31, 2017:43 )Bonds of H1,000,000/- each of 7.60% Axis Bank - 4.40 *NIL (March 31, 2017:50 )Bonds of H1,000,000/- each of 7.60% ICICI - 5.15 *NIL (March 31, 2017: 71)Bonds of H1,000,000/- each of 7.63% PFC - 7.44 *NIL (March 31, 2017:50 )Bonds of H1,000,000/- each of 7.95% HDFC Bank - 5.26 *NIL (March 31, 2017:66)Bonds of H1,000,000/- each of 8.22% Daimler
financial SR-4 - 6.67 *NIL (March 31, 2017:5)Bonds of H1,000,000/- each of 8.38% LIC Housing
finance - 0.52 *NIL (March 31, 2017:100)Bonds of H1,000,000/- each of 8.48% LIC
Housing finance - 10.99 NIL (March 31, 2017:60) Principal protected Market Linked redeemable
Non Convertible Debentures of H1,000,000/- each of Indiabulls housing finance - 6.04
NIL (March 31, 2017: 45,840.730) units of H1,000/- each of Reliance Money Manager Fund - Growth - 10.28
*NIL (March 31, 2017:1,000,000 )Bonds of H100/- each of Karnataka State development loan - 10.25
*NIL (March 31, 2017:1,000,000 )Bonds of H100/- each of Maharashtra State development loan - 10.18
*500,000 (March 31, 2017: 1,000,000 )Bonds of H100/- each of 7.77 Kerala State development loan 4.96 10.10
*NIL (March 31, 2017: 5,00,000 )Bonds of H100/- each of State development loan - 5.11
*7837.31 (March 31, 2017: NIL) Aditya Birla sun life floating rate fund of H100 each 0.18 -
*NIL (March 31, 2017:5,00,000 )Bonds of H100/- each of 7.64 Haryana State development loan - 5.02
#2,500 (March 31, 2017:NIL )Principal protected Market Linked redeemable Non Convertible Debentures of H1,00,000/- each of ECL Finance limited 30.25 -
#1,500 (March 31, 2017:NIL )Principal protected Market Linked redeemable Non Convertible Debentures of H1,00,000/- each of IIFL wealth Finance limited 17.36 -
#2,000 (March 31, 2017:Nil )Principal protected Market Linked redeemable Non Convertible Debentures of H1,00,000/- each of IIFL wealth Finance limited 23.38 -
#2,00,00,000 (March 31, 2017:Nil ) units of H10/- each of Reliance fixed horizon fund- XXIX-SERIES 1- Direct growth plan 24.81 -
Notes to Standalone Financial Statementsfor the year ended March 31, 2018
(All amounts in H crore, unless otherwise stated)

Corporate Overview Statutory Reports Financial Statements Notice 121
Particulars As at
March 31, 2018
As at
March 31, 2017
#3,00,00,000 (March 31, 2017:Nil) units of H10/- each of Reliance fixed horizon fund- XXIX-SERIES 2- Direct growth plan 37.07 -
#5,00,00,000 (March 31, 2017:Nil ) units of H10/- each of Kotak FMP Series 178 Direct Growth 61.86 -
#5,00,00,000 (March 31, 2017:Nil) units of H10/- each of Birla Sunlife Fixed Term Plan Series MX (1128 Days) 61.19 -
#5,00,00,000 (March 31, 2017:Nil ) units of H10/- each of ICICI Prudential FMP Series 77-1129 Days Plan W Direct Plan Cumulative 61.03 -
#5,00,08,075.344 (March 31, 2017: Nil ) units of H10/- each of Reliance Fixed Horizon Fund-XXIX- Series 8 Direct Growth Plan 61.34 -
#2,20,00,000 (March 31, 2017:Nil ) units of H10/- each of UTI Fixed Term Income Fund Series XXIII-II (1100 Days) Direct Growth Plan 27.01 -
#1,30,00,000 (March 31, 2017:Nil )units of H10/- each of Kotak FMP Series 180-1099 Days 15.81 -
#5,00,00,000 (March 31, 2017: Nil) units of H10/- each of SBI Debt Fund Series-B (1105 DAYS) Direct Plan Growth FMP* 63.42 -
#3,00,00,000 (March 31, 2017: Nil) units of H10/- each of ICICI Prudential FMP Series 76-1108 Days Plan V Direct Plan Cumulative 38.08 -
(iii) Investment in preference shares (unquoted)
10,00,000 (March 31, 2017: 10,00,000 ) 3% cumulative compulsorily convertible Preference Shares of H100/- each of TATA Motors Finance Ltd. 11.60 10.00
(iv) Investment in equity share (quoted)
75,400 ( March 31, 2017 :1,50,800 ) Equity Shares of H10 /-each fully paid up of Hindustan Petroleum Corporation Ltd. 2.60 7.93
NIL ( March 31, 2017 :8,06,000 ) Equity shares of H10 /- each fully paid up of Rural Electrification Corporation Limited - 14.59
13,04,645 ( March 31, 2017 :13,04,645 ) Equity shares of H1 /- each fully paid up of Welspun India Limited 7.57 11.42
26,000 ( March 31, 2017 :26,000 ) Equity shares of H10 /-each fully paid up of Trident Limited 0.15 0.21
1,46,000 (31st March 2017: NIL) equity shares of H10 each fully paid of
Reliance Industries Limited 12.89 - 804.04 670.60
1. Aggregate amount of quoted investments 792.44 660.60 2. Aggregate market value of quoted investments 792.44 660.60 3. Aggregate amount of uquoted investment 11.60 10.00
9 **Other investments (Current) (contd..)
* These Investments are made through portfolio management services
# Investments having maturity period of less than 12 months from 31st March 2018 i.e. the balance sheet date have been reclassified as ' Current investment' during the year.** Refer note 37
Notes to Standalone Financial Statementsfor the year ended March 31, 2018
(All amounts in H crore, unless otherwise stated)

Vardhman Textiles Ltd. Annual Report 2017-18122
10 *Trade receivables
Particulars As at
March 31, 2018
As at
March 31, 2017
Receivable from related parties (Refer Note 46)
- Unsecured, considered good 6.68 2.13
Receivable from others
- Unsecured, considered good 720.64 715.78
- Doubtful 4.97 4.97
Less: Allowances for doubtful trade receivables (4.97) (4.97)
727.32 717.91
Expected Credit Loss
Particulars As at
March 31, 2018
As at
March 31, 2017
(i) Ageing
Less than 180 days - - More than 180 days 4.97 4.97
4.97 4.97
(ii) Age of Receivables:
Less than 180 days 718.98 709.10 More than 180 days 8.34 8.81
727.32 717.91
(i) The credit period allowed on sales generally vary, on case to case basis, business to business, based on market conditions, maximum credit period allowed is 45 days in case of domestic yarn and 90 days in case of domestic fabric. In case of exports, maximum credit period of 120 days against letter of credit is provided.
There are no major customers that represent more than 10% of total balances of trade receivables.
The Group follows simplified approach for recognition of impairment loss allowance on trade recievables. The application of simplified approach does not require the Group to track changes in credit risk. Rather, it recognises impairment loss allowance based on lifetime ECL's at each reporting date, right from its initial recognition. The expected credit loss allowance is based on the ageing of the days the receivable are dues and rates as given in the provision matrix. The provision matrix at the end of reporting period is as follows:-
Notes to Standalone Financial Statementsfor the year ended March 31, 2018
(All amounts in H crore, unless otherwise stated)

Corporate Overview Statutory Reports Financial Statements Notice 123
10 *Trade receivables (contd..)
11 Cash and cash equivalents#
Particulars As at
March 31, 2018
As at
March 31, 2017
Movement in expected credit loss allowance
Balance at the beginning of the year 4.97 2.03
Movement in expected credit loss allowance - 2.94
Balance at the end of the year 4.97 4.97
Particulars As at
March 31, 2018
As at
March 31, 2017
a) Balances with banks
- In current accounts 62.86 27.96
- In deposit accounts with maturity upto three months 0.01 9.80
b) Cheques on hand 2.20 0.19
c) Cash on hand 0.13 0.27
65.20 38.22
The concentration of credit risk is limited due to the fact that customer base is large and unrelated.* Refer note 37
For the purpose of financial statements cash and cash equivalents include cash on hand and bank balances. Cash and cash equivalent at the end of reporting period can be reconciled to the related items in balance sheet as follows:
#Refer note 37
11A Bank balances other than cash and cash equivalents#
Particulars As at
March 31, 2018
As at
March 31, 2017
a) Other bank balances
- Earmarked balances with banks* 2.78 1.91
- Deposits with more than twelve months maturity 1.53 1.63
- Deposits with more than three months but less than twelve months maturity 0.33 0.34
4.64 3.88
Less: Amounts disclosed as other financial non current assets (Refer note 6) 1.53 1.63
3.11 2.25
* Earmarked balances with banks includes H2.76 crore (March 31, 2017: H1.90 crore ) pertaining to dividend accounts with banks and H0.02 crore (March 31, 2017:H0.01 crore) pledged with government authorities and others.
# Refer note 37
Notes to Standalone Financial Statementsfor the year ended March 31, 2018
(All amounts in H crore, unless otherwise stated)

Vardhman Textiles Ltd. Annual Report 2017-18124
12 Loans (Current)#
13 Other financial assets (Current)**
Particulars As at
March 31, 2018
As at
March 31, 2017
Financial assets at amortized cost
Loans to related parties (Refer note 46)
(Unsecured and considered good)
- Subsidiary companies 15.50 7.00
- Others 26.99 26.99
Loan to employees 2.72 2.57
45.21 36.56
# Refer note 37
Particulars As at
March 31, 2018
As at
March 31, 2017
Financial assets at amortized cost
Recoverable from related parties (Refer Note 46) 0.03 0.03
Interest receivable 1.03 8.41
Claims receivable 0.19 0.69
Other Recoverable 20.77 13.28
Financial assets at Fair value through Profit and loss
Derivative Financial Instruments* 1.97 18.06
23.99 40.47
* The Company enters into derivative financial instruments to manage its exposure to foreign exchange rate risk including foreign exchange forward contracts. For further details of derivative financial instruments refer note 37.
** Refer note 37
These derivative financial instruments are not designated as FVTOCI hedging instruments as they do not meet the required criteria.
14 Current tax
Particulars As at
March 31, 2018
As at
March 31, 2017
Current tax assets (net)
Taxes paid (net) 99.07 45.14
Current tax liabilities (net)
Income-tax payable (net) 9.45 -
Notes to Standalone Financial Statementsfor the year ended March 31, 2018
(All amounts in H crore, unless otherwise stated)

Corporate Overview Statutory Reports Financial Statements Notice 125
15 Other current assets
16 Equity share capital
Particulars As at
March 31, 2018
As at
March 31, 2017
Amount recoverable from Mahavir Share Trust in respect of shares
held in Trust (Refer note 40) 4.65 3.60
Advances to suppliers 77.86 96.85
Unamortised Lease hold land prepayments 0.08 0.08
Balance with government authorities 194.55 62.75
Prepaid (Deferred) Expense for employee benefit 0.10 0.11
Prepaid expenses others 4.67 4.69
MAT Credit Recoverable - 10.30
Other recoverables :
- Considered good 34.97 92.73
- doubtful 0.03 0.03
Less: Allowances for doubtful other recoverables (0.03) (0.03)
34.97 92.73
316.88 271.11
As at
March 31, 2018
As at
March 31, 2017
Authorised share capital:
9,00,00,000 equity shares of H10 each
(March 31, 2017: 9,00,00,000 equity shares of H10 each) 90.00 90.00
1,00,00,000 redeemable cumulative preference shares of H10 each (March 31, 2017: 1,00,00,000 redeemable cumulative preference shares of H10 each) 10.00 10.00
100.00 100.00
Issued, subscribed and fully paid up share capital comprises:
5,74,33,460 equity shares of H10 each
(March 31, 2017: 5,59,28,808 equity shares of H10 each) 57.43 55.93
57.43 55.93
16.1 Rights, preference and restriction attached to equity shares
The Company has one class of equity shares having a par value of H10/- each. Each holder of equity shares is entitled to one vote per share. The dividend proposed by the Board of Directors is subject to the approval of the shareholders in the ensuing annual general meeting. In the event of liquidation of the Company, the holders of equity shares will be entitled to receive any of the remaining assets of the Company, after distribution of all preferential amounts. The distribution will be in proportion to the number of equity shares held by the shareholders
Notes to Standalone Financial Statementsfor the year ended March 31, 2018
(All amounts in H crore, unless otherwise stated)

Vardhman Textiles Ltd. Annual Report 2017-18126
As at March 31, 2018 As at March 31, 2017
Number of
shares
Amount Number of
shares
Amount
Balance as at the beginning of the year 57,391,010 57.39 63,651,879 63.65
Less:- Buyback of shares (including of 1,36,539 nos. of shares held through trust. Also refer note 16.7)
- - (6,260,869) (6.26)
57,391,010 57.39 57,391,010 57.39
Less:- Own shares held through trust - - (1,462,202) (1.46)
Add:- Issue of equity shares under employee stock option plan (Refer note 45)
42,450 0.04 - -
Balance as at the end of the year 57,433,460 57.43 55,928,808 55.93
As at March 31, 2018 As at March 31, 2017
Number of
shares
%
holding
Number of
shares
%
holding
Devakar Investment and Trading Company
Private Limited 6,192,786 10.78% 6,192,786 10.79%
Adishwar Enterprises LLP 10,318,863 17.97% 11,413,130 19.89%
Vardhman Holdings Limited 15,314,517 26.66% 14,067,671 24.51%
16.5 Details of shares held by the holding Company
There is no holding / ultimate Company of the Company
16.6 Details of shares held by each shareholder holding more than 5% shares
16.4 Reconciliation of number of shares
16.2 Rights, preference and restriction attached to preference shares
The rate of dividend on preference shares will be decided by the Board of Directors as and when issued. Preferential shares as and when issued shall have the cumulative right to receive dividend as and when declared and shall have preferential right of
repayment on amount of capital.
16.3 As at March 31, 2018, senior employees of the Company were offerred 6,14,000 options (option to vest equity shares as per employee stock options scheme 2016, for details refer note 45). The vesting for due options began from current financial year and 61,400 options/shares during the year. Out of these, 42,450 shares/options have been excercised. Share options granted under Company's employee share option plan carry right to dividend and voting rights at par with other equity holders.
16 Equity share capital (contd..)
Notes to Standalone Financial Statementsfor the year ended March 31, 2018
(All amounts in H crore, unless otherwise stated)

Corporate Overview Statutory Reports Financial Statements Notice 127
16.7 The Board of Directors of the Company at its meeting held on September 24, 2016 approved the buyback of upto 62,60,869 fully paid up equity shares of H10 each, at a price not exceeding H1175/- payable in cash through the Tender Offer route, upto an aggregate amount not exceeding H720 crore from the open market through Stock Exchange(s). During the previous year, the Company had bought back and extinguished 62,60,869 equity shares of H10 each at price of H1150/-. Consequently, H6.26 crore were transferred to capital redemption reserve as per the requirements of Section 69 of the Companies Act, 2013.
17 Other equity
Particulars As at
March 31, 2018
As at
March 31, 2017
Share application money pending allotment 0.55 -
Capital reserve 1.24 1.24
Capital redemption reserve 6.26 6.26
Security premium 4.91 -
Debenture redemption reserve 17.81 -
Share options outstanding account 10.57 -
General reserve 1,373.60 1,373.60
Retained earnings 3,158.48 2,547.77
Equity instrument through other comprehensive income 1.11 1.05
4,574.53 3,929.92
16 Equity share capital (contd..)
Notes to Standalone Financial Statementsfor the year ended March 31, 2018
(All amounts in H crore, unless otherwise stated)

Vardhman Textiles Ltd. Annual Report 2017-18128
No
tes
to
Sta
nd
alo
ne
Fin
an
cia
l Sta
tem
en
tsfo
r th
e y
ea
r e
nd
ed
Ma
rch
31,
20
18
(All
amou
nts
in H
cro
re, u
nle
ss o
the
rwis
e s
tate
d)
17
Oth
er
eq
uit
y (
co
ntd
..)
Sh
are
ap
pli
ca
tio
n
mo
ne
y
pe
nd
ing
all
otm
en
t
Re
se
rve
s a
nd
Su
rplu
sIt
em
of
oth
er
co
mp
reh
en
siv
e in
co
me
To
tal
Ca
pit
al
res
erv
e
Ca
pit
al
red
em
pti
on
res
erv
e
Se
cu
rity
pre
miu
m
De
be
ntu
re
red
em
pti
on
res
erv
e
Sh
are
op
tio
ns
ou
tsta
nd
ing
ac
co
un
t
Ge
ne
ral
res
erv
e
Re
tain
ed
ea
rnin
gs
Eq
uit
y in
str
um
en
t
thro
ug
h o
the
r
co
mp
reh
en
siv
e in
co
me
Ba
lan
ce
at
Ap
ril 1
, 20
16 -
1
.24
-
2
09
.91
-
-
1,8
63
.02
1
,55
2.7
8
0.9
3
3,6
27
.88
Pro
fit f
or th
e ye
ar -
- -
- -
- -
1,0
01.
59
1
,00
1.5
9
Oth
er c
ompr
ehen
sive
inco
me
for t
he y
ear,
net o
f inc
ome
tax
- -
- -
- -
- (0
.34
) 0
.12
(0.2
2)
To
tal c
om
pre
he
ns
ive
inc
om
e f
or
the
ye
ar
-
-
-
-
-
-
-
1,0
01.
25
0
.12
1
,00
1.3
7
Tra
nsf
er
to c
ap
ita
l re
de
mp
tio
n r
ese
rve
on
ac
co
un
t o
f b
uy
ba
ck
of
eq
uit
y s
ha
res
- -
6.2
6
- -
- -
(6.2
6)
- -
Pre
miu
m o
n bu
ybac
k of
sha
res
(net
of
H14
.48
cro
re o
f pre
miu
m re
lati
ng to
ow
n sh
are
s h
eld
th
rou
gh
tru
st)
- -
- (2
09
.91)
- -
(48
9.4
2) -
- (6
99
.33
)
Ba
lan
ce
at
Ma
rch
31,
20
17 -
1
.24
6
.26
-
-
-
1,
37
3.6
0
2,5
47
.77
1
.05
3
,92
9.9
2
Pro
fit f
or th
e ye
ar -
- -
- -
- -
54
5.7
6
- 5
45
.76
Oth
er c
ompr
ehen
sive
inco
me
for t
he y
ear,
net o
f inc
ome
tax
- -
- -
- -
- 1
.64
0
.06
1
.70
To
tal c
om
pre
he
ns
ive
inc
om
e f
or
the
ye
ar
-
-
-
-
-
-
-
54
7.4
0
0.0
6
54
7.4
6
Fina
l Equ
ity
Div
iden
d fo
r the
fina
ncia
l yea
r 20
16-1
7 (A
mou
nt H
15 p
er s
hare
) -
- -
- -
- -
(86
.09
) -
(86
.09
)
Tax
on D
ivid
end
- -
- -
- -
- (1
5.7
9)
- (1
5.7
9)
Div
ide
nd
on
sh
are
s h
eld
th
rou
gh
tru
st -
- -
- -
- -
2.1
9
- 2
.19
Pro
fit o
n sa
les
of s
hare
s he
ld th
roug
h tr
ust
(Ref
er n
ote
40
) -
- -
- -
- -
18
0.8
1 -
18
0.8
1
Em
plo
ye
e s
toc
k o
pti
on
s a
cc
ure
d u
pto
Mar
ch 2
018
(Ref
er n
ote
45
) -
- -
- -
12.
07
- -
- 1
2.0
7
Tra
nsf
er
to e
qu
ity
sh
are
s d
ue
to
issu
e o
f
empl
oyee
sto
ck o
ptio
ns (R
efer
not
e 4
5)
(1.5
0)
(1.5
0)

Corporate Overview Statutory Reports Financial Statements Notice 129
No
tes
to
Sta
nd
alo
ne
Fin
an
cia
l Sta
tem
en
tsfo
r th
e y
ea
r e
nd
ed
Ma
rch
31,
20
18
(All
amou
nts
in H
cro
re, u
nle
ss o
the
rwis
e s
tate
d)
17
Oth
er
eq
uit
y (
co
ntd
..)
Sh
are
ap
pli
ca
tio
n
mo
ne
y
pe
nd
ing
all
otm
en
t
Re
se
rve
s a
nd
Su
rplu
sIt
em
of
oth
er
co
mp
reh
en
siv
e in
co
me
To
tal
Ca
pit
al
res
erv
e
Ca
pit
al
red
em
pti
on
res
erv
e
Se
cu
rity
pre
miu
m
De
be
ntu
re
red
em
pti
on
res
erv
e
Sh
are
op
tio
ns
ou
tsta
nd
ing
ac
co
un
t
Ge
ne
ral
res
erv
e
Re
tain
ed
ea
rnin
gs
Eq
uit
y in
str
um
en
t
thro
ug
h o
the
r
co
mp
reh
en
siv
e in
co
me
Se
cu
riti
es
pre
miu
m o
n s
ha
res
un
de
r
Em
plo
ye
e s
toc
k o
pti
on
s -
- -
4.9
1 -
- -
- -
4.9
1
Tra
nsf
er
to d
eb
en
ture
re
de
mp
tio
n r
ese
rve
on
ac
co
un
t o
f is
sue
of
de
be
ntu
res
- -
- -
17.
81
- -
(17.
81)
- -
Sh
are
Ap
plic
ati
on
Mo
ne
y re
ce
ive
d p
en
din
g
allo
tmen
t und
er e
mpl
oyee
sto
ck o
ptio
ns.
0.5
5 -
- -
- -
- -
- 0
.55
Ba
lan
ce
at
Ma
rch
31,
20
18
0.5
5
1.2
4
6.2
6
4.9
1 1
7.8
1 1
0.5
7
1,3
73
.60
3,1
58
.48
1
.11
4,5
74
.53
a. S
ha
re a
pp
lic
ati
on
mo
ne
y p
en
din
g a
llo
tme
nt
an
d s
ha
re o
pti
on
ou
tsta
nd
ing
ac
co
un
t
It re
pres
ents
mon
ey re
ceiv
ed fr
om s
enio
r em
ploy
ees
unde
r the
Com
pany
’s e
mpl
oyee
sha
re o
ptio
n sc
hem
e.
b. C
ap
ita
l re
se
rve
Ca
pit
al
rese
rve
re
pre
sen
ts r
ese
rve
re
co
gn
ise
d o
n a
ma
lga
ma
tio
n b
ein
g t
he
dif
fere
nc
e b
etw
ee
n c
on
sid
era
tio
n a
mo
un
t a
nd
ne
t a
sse
ts o
f th
e t
ran
sfe
ror
Com
pany
.
c. C
ap
ita
l re
de
mp
tio
n r
es
erv
e
Cap
ital
Red
empt
ion
rese
rve
is a
sta
tuto
ry,
non-
dist
ribu
tabl
e re
serv
e in
to w
hich
am
ount
s ar
e tr
ansf
erre
d fo
llow
ing
the
rede
mpt
ion
or p
urch
ase
of a
C
ompa
ny’s
ow
n sh
ares
.
d. S
ec
uri
tie
s p
rem
ium
Sec
urit
ies
prem
ium
repr
esen
ts a
mou
nt o
f pre
miu
m re
cogn
ised
on
issu
e of
sha
res
to s
hare
hold
ers
at a
pri
ce m
ore
than
its
face
val
ue.
e. D
eb
en
ture
re
de
mp
tio
n r
es
erv
e
The
Com
pany
has
issu
ed n
on c
onve
rtib
le d
eben
ture
s in
Fin
anci
al Y
ear 2
017
-18
and
as
per t
he p
rovi
sion
s of
the
Com
pani
es A
ct, 2
013
, it i
s re
quire
d to
cre
ate
debe
ntur
e re
dem
ptio
n re
serv
e ou
t of t
he p
rofi
ts a
vaila
ble
for p
aym
ent o
f div
iden
d.

Vardhman Textiles Ltd. Annual Report 2017-18130
f. General reserve
General reserve is used from time to time to transfer profits from retained earnings for appropriation purposes. As the general reserve is created by a transfer from one component of equity to another and is not an item of other comprehensive income,
items included in the general reserve will not be reclassified subsequently to profit or loss.
g. Retained earnings
Retained earnings represents amount that can be distributed by the Company to its equity shareholders is determined based on the financial statements of the Company and also considering the requirements of the Companies Act 2013.
h. Equity instrument through other comprehensive income
Reserve for equity instruments through other comprehensive income represents the cumulative gains and losses arising on the revaluation of equity instruments measured at fair value through other comprehensive income, net of amount reclassified to retained earnings when those assets have been disposed off.
17 Other equity (contd..)
18 Borrowings (Non Current)
Particulars As at
March 31, 2018
As at
March 31, 2017
Secured - at amortised cost
Term loans
From banks* 977.13 1,143.11 Less: Current maturities (refer note-25) 281.38 423.76
695.75 719.35
Debentures
Series A 7.59% 1500 Debentures of H10,00,000/-each 150.00 - Series B 7.69% 1500 Debentures of H10,00,000/-each 150.00 - Series C 7.75% 1998 Debentures of H10,00,000/-each 199.80 - Total 1,195.55 719.35
* Net of unamortized processing charges: March 31, 2018: H1.84 crore (March 31, 2017 1.85 crore)
(a) Term loans from banks are secured by mortgage created or to be created on all the immovable assets of the Company,
both present and future and hypothecation of all movable assets including inventories, trade receivables, movable machinery,
machinery parts, tools and accessories and other movable both present and future, subject to charges created or to be created
in favour of the bankers for securing the working capital limits. Refer Note 48.2.
(b) The Company has issued secured, rated listed Redeemable Non-convertible Debentures (NCDs) aggregating to H499.80 crore for cash at par on private placement basis on September 8, 2017. The NCDs are listed at the Bombay Stock Exchange of India (BSE) and comprise of three series repayable in third, fourth and fifth years and have an overall yield of 7.69% per annum. CRISIL has assigned a rating of AA+ with Stable outlook to the said NCDs of the Company on August 18, 2017. The NCDs shall be secured by way of a first pari passu charge over the immovable and movable fixed assets of the Company and it should have fixed asset cover of more than 105% of outstanding amount of NCDs.
( c ) There have been no breach of covenants mentioned in the loan agreements during the reporting years.
Notes to Standalone Financial Statementsfor the year ended March 31, 2018
(All amounts in H crore, unless otherwise stated)

Corporate Overview Statutory Reports Financial Statements Notice 131
18 (d) Terms of repayment of loan/debentures
Loan Category Frequency
of principal
repayments
Interest rate Repayments during
FY 2018-19 FY 2019-20 FY 2020-21 FY 2021-24**
Term loans Quarterly
Payments
*8.45% to 9.98% 281.38 298.45 57.43 339.87
7.59% Series A Non-convertible debentures Yearly 7.59% - - 150.00 - 7.69% Series A Non-convertible debentures Yearly 7.69% - - - 150.00 7.75% Series A Non-convertible debentures Yearly 7.75% - - - 199.80
281.38 298.45 207.43 689.67
* Also refer note 34
** From Financial year 2021 to financial year 2024.
18 (e) Also refer note 37 for fair value disclosures.
19 Other financial liabilities (Non Current)*
20 Provisions (Non Current)
Particulars As at
March 31, 2018
As at
March 31, 2017
Financial liabilities at amortized cost
Retention money 0.65 0.49
0.65 0.49
Particulars As at
March 31, 2018
As at
March 31, 2017
Provision for employee benefits :
- Leave encashment (Refer note 47) 7.04 8.90
7.04 8.90
* Refer note 37
The provision for employee benefit include annual leave and vested long service leave entitlement accrued of employees.
18 Borrowings (Non Current) (contd..)
Notes to Standalone Financial Statementsfor the year ended March 31, 2018
(All amounts in H crore, unless otherwise stated)

Vardhman Textiles Ltd. Annual Report 2017-18132
22 Other non-current liabilities
23 Borrowings (Current)*
Particulars As at
March 31, 2018
As at
March 31, 2017
Deferred Income for Capital subsidy 22.14 19.84
Due to employees 0.04 0.05
Other - 1.12
Total 22.18 21.01
Particulars As at
March 31, 2018
As at
March 31, 2017
Loans repayment on demand
- From banks (secured at amortised cost) 743.12 1,016.34
- From banks (unsecured at amortised cost) 62.39 38.72
Total 805.51 1,055.06
The deferred revenue arises as a result of the benefits received from state government on account of installation of specified project assets whereby such grant is treated as deferred income and is recognized as income over the useful life of the assets
for which such grant is received.
21 Deferred tax liabilities (net)*
Particulars As at
March 31, 2018
As at
March 31, 2017
Deferred tax liabilities Fixed assets: Impact of difference between tax depreciation and 270.12 259.00 depreciation charged for the financial reporting year
270.12 259.00
Deferred tax assets Impact of expenditure charged to the statement of profit and loss in the current year but allowable for tax purposes on payment basis 24.31 20.59 MAT Credit Recoverable 10.21 -
34.52 20.59
235.60 238.41
Notes to Standalone Financial Statementsfor the year ended March 31, 2018
(All amounts in H crore, unless otherwise stated)

Corporate Overview Statutory Reports Financial Statements Notice 133
23 Borrowings (Current)* (contd..)
a. Details of security for working capital borrowings
Working capital borrowings from banks are secured by way of hypothecation of entire present and future tangible current assets
of the Company as well as a second charge on the entire present and future fixed assets of the Company.
b. Includes Nil (March 31, 2017: Nil) for commercial paper issued by the Company. The maximum amount outstanding during the year is H1,385.64 crore (FY 2016-17: H1,136.24 crore)
* Refer note 37
24 Trade payables*
25 Other financial liabilities (Current)**
Particulars As at
March 31, 2018
As at
March 31, 2017
Trade payables ( refer note 43)
Due to micro and small enterprises - -
Due to other than micro and small enterprises 191.71 172.61
Due to related parties (Refer Note 46) 4.48 4.80
Total 196.19 177.41
As at
March 31, 2018
As at
March 31, 2017
Financial liabilities at amortized cost
Current maturities of non current debt 281.38 423.76
Interest accrued but not due on borrowings 24.87 1.64
Other payables
- Retention money 6.27 8.25
- Security deposits 2.15 1.68
- Expense payable 83.84 90.13
- Payables for purchase of fixed assets 0.21 7.49
- Due to employees 65.84 67.81
Financial liabilities at Fair value through Profit and loss
Derivative Financial Instruments* 7.38 -
Total 471.94 600.76
* Refer note 37
* This includes net mark to market loss of H1.92 crore (March 31,2017 : Nil) on commodities traded through commodities exchange. The Company has taken future contracts to hedge against fluctuation of cotton prices during the year and has booked mark to market loss on these contracts in head Other expenses (Refer note 35)
** Refer note 37
Notes to Standalone Financial Statementsfor the year ended March 31, 2018
(All amounts in H crore, unless otherwise stated)

Vardhman Textiles Ltd. Annual Report 2017-18134
26 Provisions (Current)
Particulars As at
March 31, 2018
As at
March 31, 2017
Provision for employee benefits : (Refer note 47)
Leave encashment 2.95 1.81
Gratuity 1.87 2.47
4.82 4.28
27 Other current liabilities
Particulars As at
March 31, 2018
As at
March 31, 2017
Statutory remittances* 40.99 47.85
Deferred Income for Capital subsidy 2.00 1.81
Unpaid dividends ** 2.76 1.90
Advances from customers 47.92 75.85
Other Liabilities 21.40 19.60
Total 115.07 147.01
* Statutory remittances includes contribution to provident fund and Employee state insurance corporation, tax deducted at source,excise duty,VAT/sales tax,service tax, goods and service tax etc.
** Unpaid dividends do not include any amount due and outstanding required to be credited to the Investors' Education and Protection Fund.
28 Revenue from operations #
Particulars For the year ended
March 31, 2018
For the year ended
March 31, 2017
Sale of products (Net of Rebate & Discount and including excise duty) 5,762.50 5,561.73
Sale of services 2.20 6.70
Other operating revenues :
- Export benefits* 75.31 111.75
- Others 11.36 10.77
5,851.37 5,690.95
# The following is an analysis of the company’s revenue from its products and
services
Sale of Yarn 3,649.41 3,489.73
Sale of Fabric 2,109.96 2,068.59
Service income 2.20 6.70
Others (Sale of scrap, waste etc) 14.49 14.18
5,776.06 5,579.20
Notes to Standalone Financial Statementsfor the year ended March 31, 2018
(All amounts in H crore, unless otherwise stated)
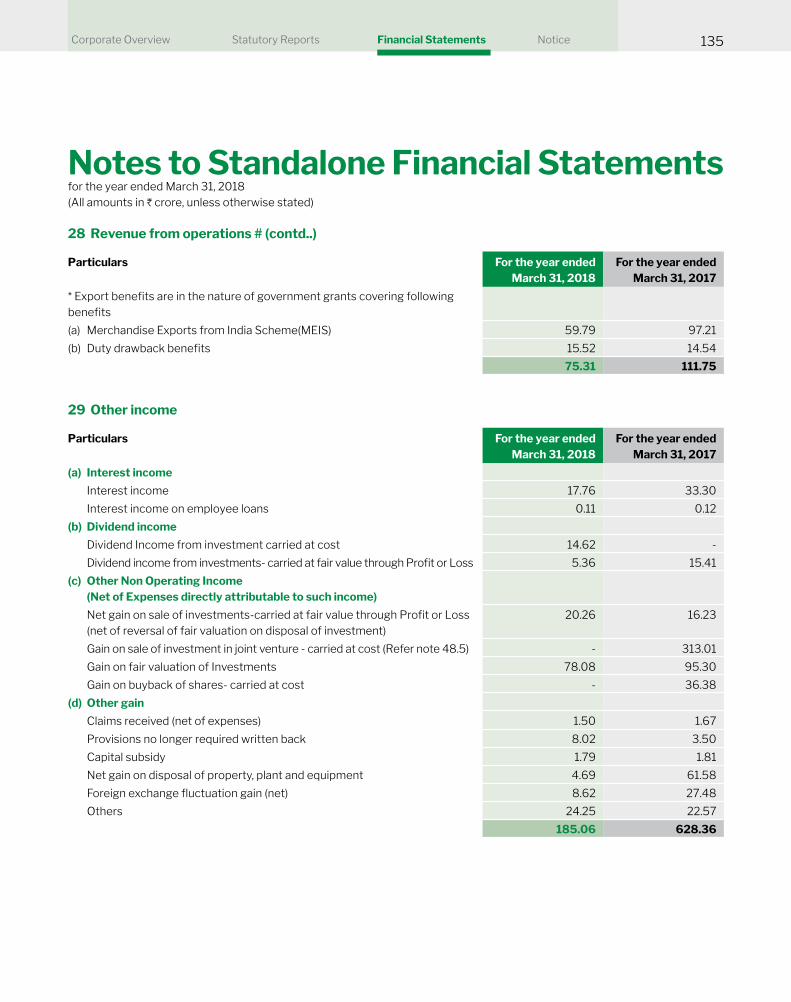
Corporate Overview Statutory Reports Financial Statements Notice 135
29 Other income
Particulars For the year ended
March 31, 2018
For the year ended
March 31, 2017
(a) Interest income
Interest income 17.76 33.30
Interest income on employee loans 0.11 0.12
(b) Dividend income
Dividend Income from investment carried at cost 14.62 -
Dividend income from investments- carried at fair value through Profit or Loss 5.36 15.41
(c) Other Non Operating Income
(Net of Expenses directly attributable to such income)
Net gain on sale of investments-carried at fair value through Profit or Loss (net of reversal of fair valuation on disposal of investment)
20.26 16.23
Gain on sale of investment in joint venture - carried at cost (Refer note 48.5) - 313.01
Gain on fair valuation of Investments 78.08 95.30
Gain on buyback of shares- carried at cost - 36.38
(d) Other gain
Claims received (net of expenses) 1.50 1.67
Provisions no longer required written back 8.02 3.50
Capital subsidy 1.79 1.81
Net gain on disposal of property, plant and equipment 4.69 61.58
Foreign exchange fluctuation gain (net) 8.62 27.48
Others 24.25 22.57
185.06 628.36
Particulars For the year ended
March 31, 2018
For the year ended
March 31, 2017
* Export benefits are in the nature of government grants covering following benefits
(a) Merchandise Exports from India Scheme(MEIS) 59.79 97.21
(b) Duty drawback benefits 15.52 14.54
75.31 111.75
28 Revenue from operations # (contd..)
Notes to Standalone Financial Statementsfor the year ended March 31, 2018
(All amounts in H crore, unless otherwise stated)

Vardhman Textiles Ltd. Annual Report 2017-18136
30 Cost of materials consumed
31 Purchases of Stock-in-trade:
Particulars For the year ended
March 31, 2018
For the year ended
March 31, 2017
Cotton 2,542.72 2,221.14 Manmade fibre 576.29 573.96 Yarn 24.40 24.05 Fabric 34.80 13.56 Others 2.31 3.98
3,180.52 2,836.69
Particulars For the year ended
March 31, 2018
For the year ended
March 31, 2017
Yarn 33.47 29.17 Fabric - 0.03 Others 0.16 -
33.63 29.20
32 Changes in inventories of finished goods, work-in-progress and stock-in-trade
Particulars For the year ended
March 31, 2018
For the year ended
March 31, 2017
Inventories at the beginning of the year
Work-in-progress 137.69 109.55 Finished goods 446.71 400.67
584.40 510.22
Inventories at the end of the year
Work-in-progress 142.43 137.69 Finished goods 489.98 446.71
632.41 584.40
(48.01) (74.18)
33 Employee benefits expense *
Particulars For the year ended
March 31, 2018
For the year ended
March 31, 2017
Salaries and wages 429.93 406.83 Contribution to provident and other funds 44.21 40.61 Staff welfare expenses 5.49 6.17
479.63 453.61
* Also refer note 47
Notes to Standalone Financial Statementsfor the year ended March 31, 2018
(All amounts in H crore, unless otherwise stated)

Corporate Overview Statutory Reports Financial Statements Notice 137
34 Finance costs
Particulars For the year ended
March 31, 2018
For the year ended
March 31, 2017
Interest expense* 103.81 112.52
Other borrowing costs 10.51 12.61
114.32 125.13
*Interest expense is net of interest reimbursement of H43.82 crore (March 31, 2017 H59.32 crore) under Technology upgradation fund scheme and H12.59 crore (March 31, 2017 H28.04 crore) under Madhya Pradesh state interest reimbursement on term loan.
35 Other expenses
Particulars For the year ended
March 31, 2018
For the year ended
March 31, 2017
Power and fuel 586.47 553.99
Consumption of stores and spare parts 37.12 37.56
Packing materials and charges 74.78 78.11
Dyes and Chemical consumed 184.13 185.86
Rent 2.12 2.29
Repairs and maintenance to buildings 19.48 33.63
Repairs and maintenance to machinery 167.37 159.00
Insurance 5.21 6.52
Rates and taxes 2.44 1.31
Auditors remuneration:
- Audit fee 0.50 0.37
- Tax audit fee 0.08 0.09
- Reimbursement of expenses 0.16 0.13
- In other capacity 0.06 0.05
Bad debts written off 0.45 3.52
Excise duty consumed on sale of goods 0.10 0.52
Allowances for doubtful trade receivables and advances - 2.74
Forwarding charges and octroi 102.30 84.89
Commission to selling agents 43.71 49.02
Assets written off 3.32 4.34
Other miscellaneous expenses (Refer note 48.3) 117.24 110.62
1,347.04 1,314.56
Notes to Standalone Financial Statementsfor the year ended March 31, 2018
(All amounts in H crore, unless otherwise stated)

Vardhman Textiles Ltd. Annual Report 2017-18138
36 Tax balances
The following is the analysis of deferred tax assets / (liabilities) presented in the standalone balance sheet
36.1 Deferred tax liabilities (Net) Opening
Balance
Mat Credit
Adjustment
Recognised in
profit or lossRecognised
in OCI
Closing
Balance
2017-18
Deferred tax assets
Expenses deductible in future years 18.86 3.69 - 22.55
Provision for doubtful debts / advances 1.72 0.03 - 1.75
MAT credit recoverable - 10.21 - - 10.21
Others 0.01 - 0.01
20.59 10.21 3.72 - 34.52
Deferred tax liabilities
Property, plant and equipment and Intangible
assets (203.28) (40.90) - (244.18)
Investment in bonds, mutual funds and
equity instruments (55.44) 29.33 - (26.11)
Others (0.28) 0.44 - 0.17
(259.00) - (11.13) - (270.12)
Net deferred tax liabilities (238.41) 10.21 (7.41) - (235.60)
36.1 Deferred tax liabilities (Net) Opening
Balance
Mat Credit
Adjustment
Recognised in
profit or lossRecognised
in OCI
Closing
Balance
2016-17
Deferred tax assets
Expenses deductible in future years 15.90 2.96 - 18.86
Provision for doubtful debts / advances 0.78 0.94 - 1.72
Others 0.01 - - 0.01
16.69 - 3.90 - 20.59
Deferred tax liabilities
Property, plant and equipment and Intangible
assets (200.48) (2.80) - (203.28)
Investment in bonds, mutual funds and equity
instruments (22.37) (33.01) (0.06) (55.44)
Others (0.23) (0.05) - (0.28)
(223.08) - (35.86) (0.06) (259.00)
Net deferred tax liabilities (206.39) - (31.96) (0.06) (238.41)
Note: Deferred tax assets and deferred tax liabilities have been offset as they are governed by the same taxation laws.
Notes to Standalone Financial Statementsfor the year ended March 31, 2018
(All amounts in H crore, unless otherwise stated)

Corporate Overview Statutory Reports Financial Statements Notice 139
36 Tax balances (contd..)
36.2 Income tax recognised in profit or loss
Particulars For the year ended
March 31, 2018
For the year ended
March 31, 2017
Current tax
In respect of the current year 147.58 281.57
Deferred tax
In respect of the current year 7.41 21.65
Total income tax expense recognised 154.99 303.22
Particulars For the year ended
March 31, 2018
For the year ended
March 31, 2017
Profit before tax 700.75 1,304.81
Tax at the Indian Tax Rate of 34.608 % 242.51 451.57
Differential tax rate on capital gain on sale of investments/fair valuation on investment (34.30) (48.01)
Effect of exempted dividend income (6.88) (5.30)
Effect of indexation benefit on value of investment (18.81) (39.89)
Effect of deduction under section 80-IA and 80-IC of the Income-tax Act, 1961 (35.88) (34.56)
Effect of deduction under section 32-AC of the Income-tax Act, 1961 - (10.25)
Effect of brought forward long term capital losses - (10.78)
Effect of expenses that are not deductible in determining taxable profit 2.61 0.94
Effect of change in tax rate 2.62 -
Others 3.12 (0.50)
154.99 303.22
The income tax expense for the year can be reconciled to the accounting profit as follows
36.3 Income tax recognised in other comprehensive income
Particulars For the year ended
March 31, 2018
For the year ended
March 31, 2017
Arising on income and expenses recognised in other comprehensive income
Net fair value gain on investment in equity shares at FVTOCI 0.03 0.06
Remeasurement of defined benefit obligation 0.87 (0.17)
Total income tax recognised in other comprehensive income 0.90 (0.11)
Notes to Standalone Financial Statementsfor the year ended March 31, 2018
(All amounts in H crore, unless otherwise stated)
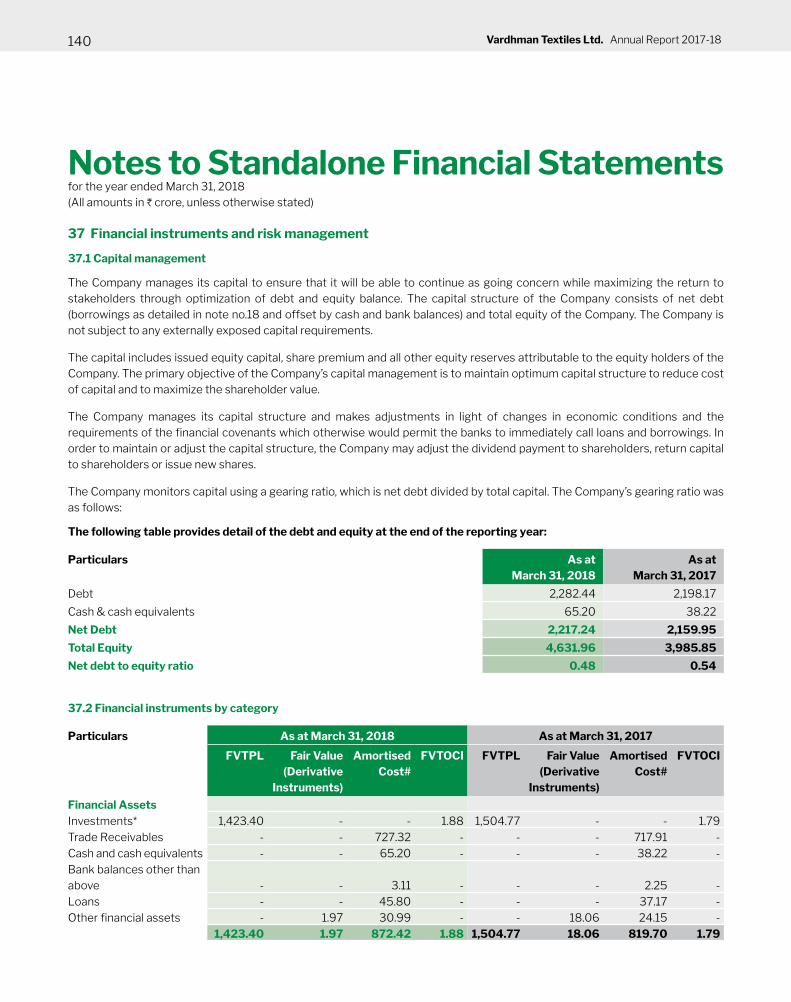
Vardhman Textiles Ltd. Annual Report 2017-18140
Particulars As at
March 31, 2018
As at
March 31, 2017
Debt 2,282.44 2,198.17
Cash & cash equivalents 65.20 38.22
Net Debt 2,217.24 2,159.95
Total Equity 4,631.96 3,985.85
Net debt to equity ratio 0.48 0.54
The following table provides detail of the debt and equity at the end of the reporting year:
37.2 Financial instruments by category
Particulars As at March 31, 2018 As at March 31, 2017
FVTPL Fair Value
(Derivative
Instruments)
Amortised
Cost#
FVTOCI FVTPL Fair Value
(Derivative
Instruments)
Amortised
Cost#
FVTOCI
Financial Assets
Investments* 1,423.40 - - 1.88 1,504.77 - - 1.79 Trade Receivables - - 727.32 - - - 717.91 - Cash and cash equivalents - - 65.20 - - - 38.22 - Bank balances other than
above - - 3.11 - - - 2.25 - Loans - - 45.80 - - - 37.17 - Other financial assets - 1.97 30.99 - - 18.06 24.15 -
1,423.40 1.97 872.42 1.88 1,504.77 18.06 819.70 1.79
37.1 Capital management
37 Financial instruments and risk management
The Company manages its capital to ensure that it will be able to continue as going concern while maximizing the return to stakeholders through optimization of debt and equity balance. The capital structure of the Company consists of net debt (borrowings as detailed in note no.18 and offset by cash and bank balances) and total equity of the Company. The Company is not subject to any externally exposed capital requirements.
The capital includes issued equity capital, share premium and all other equity reserves attributable to the equity holders of the
Company. The primary objective of the Company’s capital management is to maintain optimum capital structure to reduce cost of capital and to maximize the shareholder value.
The Company manages its capital structure and makes adjustments in light of changes in economic conditions and the
requirements of the financial covenants which otherwise would permit the banks to immediately call loans and borrowings. In order to maintain or adjust the capital structure, the Company may adjust the dividend payment to shareholders, return capital
to shareholders or issue new shares.
The Company monitors capital using a gearing ratio, which is net debt divided by total capital. The Company’s gearing ratio was as follows:
Notes to Standalone Financial Statementsfor the year ended March 31, 2018
(All amounts in H crore, unless otherwise stated)

Corporate Overview Statutory Reports Financial Statements Notice 141
37.2 Financial instruments by category (contd..)
Particulars As at March 31, 2018 As at March 31, 2017
FVTPL Fair Value
(Derivative
Instruments)
Amortised
Cost#
FVTPL Fair Value
(Derivative
Instruments)
Amortised
Cost#
Financial Liabilities
Borrowings (including current maturity of term loan) - - 2,282.44 - - 2,198.17 Trade Payables - - 196.19 - - 177.41 Other financial liabilities - 7.38 183.82 - - 177.49
- 7.38 2,662.45 - - 2,553.07
# Carrying value of the financial assets and financial liabilities designated at amortised cost approximates its fair value.* Investment value excludes investment in subsidiaries/Associates/Joint ventures of H166.72 crore (March 31, 2017: H136.24 crore) which are shown at cost in balance sheet as per Ind AS 27 "Separate Financial Statements".
Fair value hierarchy
The following table provides an analysis of financial instruments that are measured at fair value and have been grouped into Level 1, Level 2 and Level 3 below:
Level 1 Level 2 Level 3 Total
Financial Assets
Investments in mutual funds/bonds/preference shares 246.63 1,153.55 - 1,400.18
Investments in quoted equity instruments 23.22 - - 23.22
Investments in unquoted equity instruments - - 1.88 1.88
Foreign currency / commodity forward contracts - 1.97 - 1.97
269.85 1,155.52 1.88 1,427.25
Financial Liabilities
Foreign currency / commodity forward contracts - 7.38 - 7.38 - 7.38 - 7.38
As at March 31, 2018
Level 1 Level 2 Level 3 Total
Financial Assets
Investments in mutual funds/bonds/preference shares 284.83 1,185.79 - 1,470.62 Investments in quoted equity instruments 34.15 - - 34.15 Investments in unquoted equity instruments - - 1.79 1.79 Foreign currency / commodity forward contracts - 18.06 - 18.06
318.98 1,203.85 1.79 1,524.62
As at March 31, 2017
Notes to Standalone Financial Statementsfor the year ended March 31, 2018
(All amounts in H crore, unless otherwise stated)

Vardhman Textiles Ltd. Annual Report 2017-18142
Level 1:
Quoted prices in the active market. This level of hierarchy includes financial assets that are measured by reference to quoted prices in the active market.
Level 2:
Valuation techniques with observable inputs. This level of hierarchy includes items measured using inputs other than quoted prices included within Level 1 that are observable for such items, either directly or indirectly.
Level 3:
Valuation techniques with unobservable inputs. This level of hierarchy includes items measured using inputs that are not based on observable market data (unobservable inputs). Fair value determined in whole or in part, using a valuation model based on assumptions that are neither supported by prices from observable current market transactions in the same instruments nor
based on available market data.
Sensitivity of Level 3 financial instruments are insignificant
The fair value of the financial instruments are determined at the amount that would be received to sell an asset in an orderly transaction between market participants. The following methods and assumptions were used to estimate the fair values:
Investments in mutual funds: Fair value is determined by reference to quotes from the financial institutions, i.e. net asset value (NAV) for investments in mutual funds declared by mutual fund house.
Investment in preference shares/debentures: Fair value is determined by reference to quotes from fund houses/portfolio management services companies/respective issuer of preference shares,debentures i.e value of investments.
Derivative contracts: The Company has entered into various foreign currency contracts to manage its exposure to fluctuations in foreign exchange rates . These financial exposures are managed in accordance with the Company’s risk management policies and procedures. Fair value of derivative financial instruments are determined using valuation techniques based on information derived from observable market data, i.e., mark to market values determined by the Authorised Dealers Banks.
Quoted equity investments: Fair value is derived from quoted market prices in active markets.
Unquoted equity investments: Fair value is derived on the basis of net asset value approach, in this approach the net asset value
is used to capture the fair value of these investments.
37.2 Financial instruments by category (contd..)
Notes to Standalone Financial Statementsfor the year ended March 31, 2018
(All amounts in H crore, unless otherwise stated)

Corporate Overview Statutory Reports Financial Statements Notice 143
37.2 Financial instruments by category (contd..)
Reconciliation of Level 3 fair value measurements
Unlisted equity
instruments
As at April 1, 2016 1.61
Purchases -
Gain / (loss) recognised in OCI/Profit/Loss 0.18
As at March 31, 2017 1.79
Purchases -
Gain / (loss) recognised in OCI/Profit/Loss 0.09
As at March 31, 2018 1.88
37.3 Financial risk management
The Company’s corporate treasury functions provides services to the business, coordinates access to the financial markets, monitors and manages the financial risks relating to operations of the Company through internal risk reports which analyse exposure by degree and magnitude of risk. These risks include market risk (including currency risk, interest rate risk and other price risks, credit risk and liquity risk).
The Company seeks to minimize the effects of these risk by using derivate financial instruments to hedge risk exposure. The issue of financial derivatives is governed by the Company’s policy approved by the board of directors.
The principal financial assets of the Company include loans, trade and other receivables, and cash and bank balances that derive directly from its operations. The principal financial liabilities of the Company, include loans and borrowings, trade and other payables and the main purpose of these financial liabilities is to finance the day to day operations of the Company.
This note explains the risks which the Company is exposed to and policies and framework adopted by the Company to manage these risks.
37.3.1 Market risk
Market risk is the risk that the fair value of future cash flows of a financial instrument will fluctuate because of changes in market prices. Market prices comprise three types of risk: foreign currency risk, interest rate risk, investment risk.
A. Foreign Currency Risk Management
The Company operates internationally and business is transacted in several currencies. The export sales of Company comprise around 38% of the total sales of the Company, Further the Company also imports certain assets and material from outside India. The exchange rate between the Indian rupee and foreign currencies has changed substantially in recent years and may fluctuate substantially in the future. Consequently, the Company is exposed to foreign currency risk and the results of the Company may be affected as the rupee appreciates/ depreciates against foreign currencies. Foreign exchange risk arises from the future probable transactions and recognized assets and liabilities denominated in a currency other than Company’s functional currency.
The Company measures the risk through a forecast of highly probable foreign currency cash flows and manages its foreign currency risk by appropriately hedging the transactions. The Company uses a combination of derivative financial instruments such as foreign exchange forward and option contracts to mitigate the risk of changes in exchange rates on foreign currency exposures.
Notes to Standalone Financial Statementsfor the year ended March 31, 2018
(All amounts in H crore, unless otherwise stated)

Vardhman Textiles Ltd. Annual Report 2017-18144
The carrying amounts of the Company's foreign currency denominated monetary assets and monetary liabilities at the end of the reporting periods expressed are as follows:
As at March 31, 2018 USD EUR CHF JPY
Financial assets
Trade receivables 5.19 0.36 - -
Foreign exchange derivative contracts* (7.33) (0.68) - -
Net exposure to foreign currency risk (assets) - - - -
Financial liablities
Trade payables - 0.18 0.05 13.77 Borrowings - - - Foreign exchange derivative contracts* (2.78) (0.54) (0.22) (54.10)Net exposure to foreign currency risk (assets) - - - -
Net exposure to foreign currency risk (net) - - - -
As at March 31, 2017 USD EUR CHF JPY
Financial assets
Trade receivables 5.29 0.42 - -
Foreign exchange derivative contracts* (5.29) (0.42) - -
Net exposure to foreign currency risk (assets) - - - -
Financial liablities
Trade payables and other financial liablities 0.36 0.08 0.08 6.15 Borrowings
Foreign exchange derivative contracts* (0.36) (0.08) - (4.52)Net exposure to foreign currency risk (assets) - - 0.08 1.63
Net exposure to foreign currency risk (net) - - 0.08 1.63
*Excess forwards sold against pending purchase order/sales order shipment
37.3.1 Market risk (contd..)
Foreign currency sensitivity analysis
The following table details the Company's sensitivity to a 10 % increase and decrease in the Hagainst the relevant foreign
currency. The sensitivity analysis includes only outstanding foreign currency denominated monetary items as tabulated above and adjusts their translation at the period end for 10% change in foreign currency rates. A positive number below indicates an increase in profit before tax or vice-versa.
Particulars Year ended March 31, 2018 Year ended March 31, 2017
J strengthens
by 10%
J weakens
by 10%
J strengthens
by 10%
J weakens
by 10%
Impact on profit /(loss) for the yearUSD - - - - EUR - - - - CHF - - 0.50 (0.50)JPY - - 0.09 (0.09)
Notes to Standalone Financial Statementsfor the year ended March 31, 2018
(All amounts in H crore, unless otherwise stated)

Corporate Overview Statutory Reports Financial Statements Notice 145
37.3.1 Market risk (contd..)
Foreign exchange derivative contracts
The Company uses derivative financial instruments exclusively for hedging financial risks that arise from its commercial business or financing activities. The Company’s Corporate Treasury team measures the risk through a forecast of highly probable foreign currency cash flows and manages its foreign currency cash flows by appropriately hedging the transactions. When a derivative is entered into for the purpose of being a hedge, the Company negotiates the terms of those derivatives to match the terms of
the hedged exposure. For hedges of forecast transactions the derivatives cover the period of exposure from the point the cash flows of the transactions are forecasted up to the point of settlement of the resulting receivable or payable that is denominated in the foreign currency. All identified exposures are managed as per the policy duly approved by the Board of Directors.
The following table details the foreign currency derivative contracts outstanding at the end of the reporting period:
No of Deals Foreign Currency
(FCY CRORE)
Nominal Amount (J crore)
Outstanding Contracts* As at
March 31, 2018
As at
March 31, 2017
As at
March 31, 2018
As at
March 31, 2017
As at
March 31, 2018
As at
March 31, 2017
USD / INR Buy forward 25 28 2.62 2.15 174.44 142.18
USD / INR Buy option 1 7 0.16 1.51 10.40 100.41
USD / INR Sell forward 114 105 6.72 5.22 442.29 363.74
EUR / USD Sell forward - 6 - 0.36 - 25.37
USD / INR Sell option 2 3 0.60 0.30 38.24 20.50
EUR / USD Buy forward 1 2 0.19 0.06 15.51 4.30
EUR / INR Buy forward 5 4 0.35 0.05 27.89 3.67
EUR / INR Sell forward 27 14 0.68 0.41 54.60 30.04
GBP / USD Buy forward - - - - - -
EUR / INR Sell forward - - - - - -
JPY/INR Buy forward 1 2 54.10 4.52 31.90 2.65
USD/JPY buy forward - 1 - 5.08 - 3.02
USD/CHF Buy forward 1 2 0.22 0.05 15.36 3.55
CHF/INR Buy Forward 1 - 0.02 - 1.42 -
Fair value assets /(liabilities) (3.49) 18.06
* Sensitivity on the above derivative contracts in respect of foreign currency exposure is insignificant
B. Interest rate risk management
Interest rate risk is the risk that the fair value or future cash flows of a financial instrument will fluctuate because of changes in market interest rates. The Company’s exposure to the risk of changes in market interest rates relates primarily to the Company’s debt obligations with floating interest rates.
As the Company has no significant interest-bearing assets, the income and operating cash flows are substantially independent of changes in market interest rates. The Company’s exposure to the risk of changes in market interest rates relates primarily to the Company’s debt obligations with floating interest rates, which are included in interest bearing loans and borrowings in these financial statements. The Company’s fixed rate borrowings are carried at amortised cost. They are therefore not subject to interest rate risk, since neither the carrying amount nor the future cash flows will fluctuate because of a change in market interest rates.
Notes to Standalone Financial Statementsfor the year ended March 31, 2018
(All amounts in H crore, unless otherwise stated)
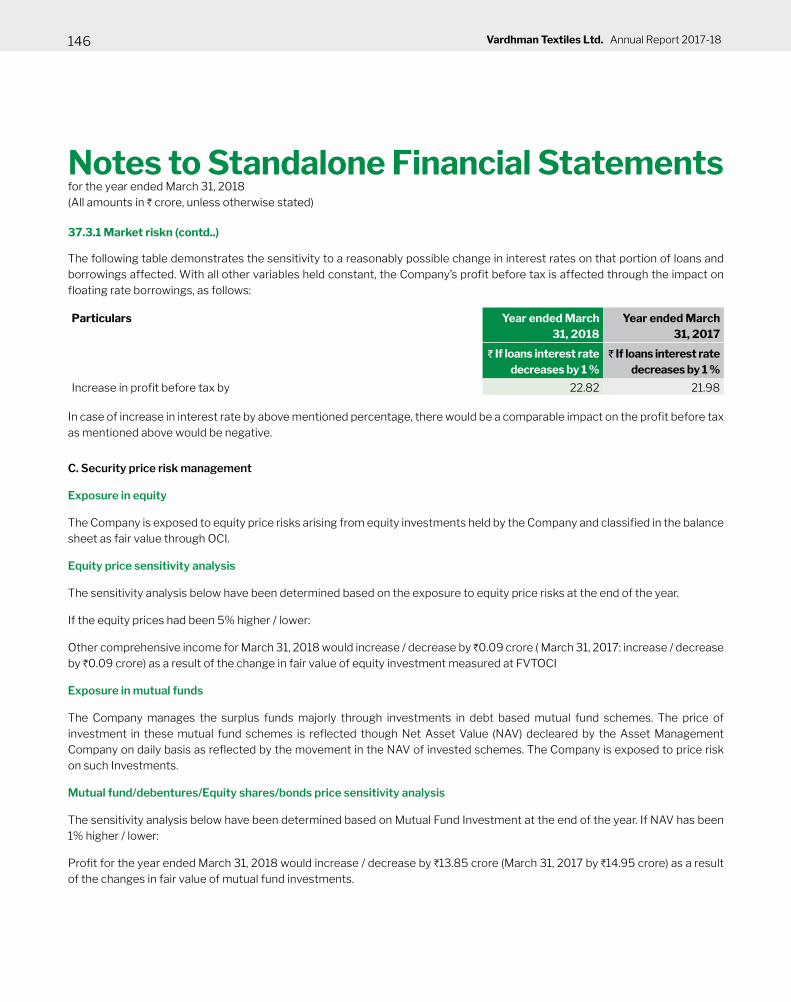
Vardhman Textiles Ltd. Annual Report 2017-18146
37.3.1 Market riskn (contd..)
The following table demonstrates the sensitivity to a reasonably possible change in interest rates on that portion of loans and
borrowings affected. With all other variables held constant, the Company’s profit before tax is affected through the impact on floating rate borrowings, as follows:
Particulars Year ended March
31, 2018
Year ended March
31, 2017
J If loans interest rate
decreases by 1 %
J If loans interest rate
decreases by 1 %
Increase in profit before tax by 22.82 21.98
In case of increase in interest rate by above mentioned percentage, there would be a comparable impact on the profit before tax as mentioned above would be negative.
C. Security price risk management
Exposure in equity
The Company is exposed to equity price risks arising from equity investments held by the Company and classified in the balance sheet as fair value through OCI.
Equity price sensitivity analysis
The sensitivity analysis below have been determined based on the exposure to equity price risks at the end of the year.
If the equity prices had been 5% higher / lower:
Other comprehensive income for March 31, 2018 would increase / decrease by H0.09 crore ( March 31, 2017: increase / decrease by H0.09 crore) as a result of the change in fair value of equity investment measured at FVTOCI
Exposure in mutual funds
The Company manages the surplus funds majorly through investments in debt based mutual fund schemes. The price of investment in these mutual fund schemes is reflected though Net Asset Value (NAV) decleared by the Asset Management Company on daily basis as reflected by the movement in the NAV of invested schemes. The Company is exposed to price risk on such Investments.
Mutual fund/debentures/Equity shares/bonds price sensitivity analysis
The sensitivity analysis below have been determined based on Mutual Fund Investment at the end of the year. If NAV has been 1% higher / lower:
Profit for the year ended March 31, 2018 would increase / decrease by H13.85 crore (March 31, 2017 by H14.95 crore) as a result of the changes in fair value of mutual fund investments.
Notes to Standalone Financial Statementsfor the year ended March 31, 2018
(All amounts in H crore, unless otherwise stated)

Corporate Overview Statutory Reports Financial Statements Notice 147
The following is the detail of revenues generated from top five customers of the Company:
Particulars As at
March 31, 2018
As at
March 31, 2017
Revenue from top five customers 528.42 539.88 % of total sales of products 9.03% 9.71%
37.3.2 Credit risk management
Credit risk refers to the risk of default on its obligation by the counterparty resulting in a financial loss. The maximum exposure to the credit risk at the reporting date is primarily from trade receivables which are typically unsecured. Credit risk on cash and bank balances is limited as the Company generally invests in deposits with banks and financial institutions with high credit ratings assigned by credit rating agencies. Investments primarily include investment in liquid mutual fund units, bonds, fixed maturity plan etc. issued by institutions having proven track record. The Company’s credit risk in case of all other financial instruments is negligible.
The Company assesses the credit risk based on external credit ratings assigned by credit rating agencies. The Company also assesses the creditworthiness of the customers internally to whom goods are sold on credit terms in the normal course of
business. The credit limit of each customer is defined in accordance with this assessment. Outstanding customer receivables are regularly monitored and any shipments to overseas customers are generally covered by letters of credit.
The impairment analysis is performed on client to client basis for the debtors that are past due at the end of each reporting date. The Company has not considered an allowance for doubtful debts in case of trade receivables that are past due but there has
not been a significant change in the credit quality and the amounts are still considered recoverable.
Financial assets for which loss allowance is measured:
As at
March 31, 2018
As at
March 31, 2017
Loans - Non-current 0.59 0.61 Loans - Current 45.21 36.56 Other financial assets - Non-current 8.97 1.74 Other financial assets - Current 23.99 40.47 Trade receivables 727.32 717.91
806.08 797.29
Loss allowance is as follows:
As at April 1, 2016 2.03
Provided during the year 2.94Reversed during the year - As at March 31, 2017 4.97
Provided during the year - Reversed during the year - As at March 31, 2018 4.97
Other than financial assets mentioned above, none of the Company's financial assets are either impaired, and there were no indications that defaults in payment obligations would occur.
Notes to Standalone Financial Statementsfor the year ended March 31, 2018
(All amounts in H crore, unless otherwise stated)

Vardhman Textiles Ltd. Annual Report 2017-18148
37.3.3 Liquidity Risk Management
The financial liabilities of the Company, other than derivatives, include loans and borrowings, trade and other payables. The Company's principal sources of liquidity are cash and cash equivalents and the cash flow that is generated from operations. The Company monitors its risk of shortage of funds to meet the financial liabilities using a liquidity planning tool. The Company plans to maintain sufficient cash and marketable securities to meet the obligations as and when fall due. The below is the detail of contractual maturities of the financial liabilities of the Company at the end of each reporting period:
The table below analyses the Company's financial liabilities and financial assets into relevant maturity groupings based on their contractual maturities:
Financial Assets Less than
1 year
More than 1 year
and upto 3 years
More than 3 year
and upto 5 years
More than
5 years
Total
As at March 31, 2018
Investments* 804.04 384.32 235.04 168.60 1,592.00
Trade Receivables 727.32 - - - 727.32
Cash and cash equivalents 65.20 - - - 65.20
Bank balances other than above 3.11 - - - 3.11
Loans 45.21 0.59 - - 45.80
Other financial assets 23.99 8.97 - - 32.96
1,668.87 393.88 235.04 168.60 2,466.39
Financial Assets Less than
1 year
More than 1 year
and upto 3 years
More than 3 year
and upto 5 years
More than
5 years
Total
As at March 31, 2017
Investments* 670.60 641.90 192.26 138.03 1,642.79
Trade Receivables 717.91 - - - 717.91
Cash and cash equivalents 38.22 - - - 38.22
Bank balances other than above 2.25 - - - 2.25
Loans 36.56 0.61 - - 37.17
Other financial assets 40.47 1.74 - - 42.21
1,506.01 644.25 192.26 138.03 2,480.55
Less than
1 year
More than 1 year
and upto 3 years
More than 3 year
and upto 5 years
More than
5 years
Total
As at March 31, 2018
Borrowings* 1,086.89 505.88 689.67 - 2,282.44
Trade payables 196.19 - - - 196.19
Other financial liabilities** 183.17 0.65 - - 183.82
1,466.25 506.53 689.67 - 2,662.45
Notes to Standalone Financial Statementsfor the year ended March 31, 2018
(All amounts in H crore, unless otherwise stated)

Corporate Overview Statutory Reports Financial Statements Notice 149
Less than
1 year
More than 1 year
and upto 3 years
More than 3 year
and upto 5 years
More than
5 years
Total
As at March 31, 2017
Borrowings* 1,478.81 564.37 154.99 - 2,198.17
Trade payables 177.41 - - - 177.41
Other financial liabilities 177.00 0.49 - - 177.49
1,833.22 564.86 154.99 - 2,553.07
* including Current Maturity of non-current borrowings
38 Contingent liabilities and commitments
As at
March 31, 2018
As at
March 31, 2017
a. Claims against the Company not acknowledged as debts:
Sales tax, excise duty, etc* 6.90 6.66
Income-tax** 214.90 182.50
Others 5.62 4.36
* Amount deposited H0.85 crore (March 31, 2017 : H0.67 crore)** Amount deposited H134.01 crore (March 31, 2017 : H100.68 crore)
b. Liability on account of bank guarantees and letter of credit of H272.65 crore (March 31, 2017: H112.55 crore)
c. The amounts shown above represents the best possible estimates arrived at on the basis of available information. The uncertainties and possible reimbursements are dependent on the outcome of the different legal processes which have been
invoked by the Company or the claimants as the case may be and therefore cannot be predicted accurately or relate to a present
obligations that arise from past events where it is either not probable that an outflow of resources will be required to settle or a reliable estimate cannot be made. The Company has been advised that it has strong legal positions against such disputes.
d. The Payment of Bonus (Amendment) Act 2015, notified on 31st December 2015, had revised the thresholds for coverage of employee eligible for Bonus and also enhanced the ceiling limits for computation of bonus retrospectively from 1st April
2014. Based on legal opinion, the Company has filed a writ petition in Hon’ble High Court of Punjab & Haryana contesting its retrospective applicability and the said jurisdictional High Court has granted stay on its retrospective operation. In view thereof, the company has not provided differential bonus pertaining to the period from 1st April 2014 to 31st March 2015 amounting to H8.21 crore. However, the company has provided/paid bonus w.e.f. 1st April 2015 according to the amended provisions of the Payment of Bonus (Amendment) Act 2015.
37.3.3 Liquidity Risk Management (contd..)
Notes to Standalone Financial Statementsfor the year ended March 31, 2018
(All amounts in H crore, unless otherwise stated)

Vardhman Textiles Ltd. Annual Report 2017-18150
(ii) The Company has other commitments, for purchases / sales orders which are issued after considering requirements per operating cycle for purchase / sale of goods and services, employee benefits in normal course of business. The Company does not have any long term contracts including derivative contracts for which there will be any material foreseeable losses.
* amount as per demand orders including interest and penalty wherever quantified in the Order.
Name of the Statute Nature of the
Dues
Forum where Dispute is pending Period to which
the amount relates
(various years
covering the period)
Amount* Amount
unpaid
Central Excise Laws Excise Duty Supreme Court 2005 0.04 0.04
Customs, Excise & Service Tax Appellate Tribunal (CESTAT)
2009-13 2.17 2.17
Upto Commissioner (Appeals) 2001-2013 2.73 2.65
Service Tax Laws Service Tax CESTAT 2010-2011 0.02 0.02
Upto Commissioner (Appeals) 2008-2011 0.07 0.07
Sales Tax LawsCentral Sales Tax Upto Commissioner (Appeals) 2009-2010 0.06 0.06
State Sales TaxesUpto Commissioner (Appeals) 2005-06 0.02 0.02
Appelate Board 2006-07 0.51 0.31
Income-tax Laws Income-tax Income-tax Appellate Tribunal (ITAT) 2001-2012 141.42 26.21
Upto Commissioner (Appeals) 2012-2014 87.65 68.85
39 The details of dues of excise duty, entry tax, value added tax, service tax and income-tax which have not been deposited as on March 31, 2018 on account of disputes are given below:
e. Capital and other commitments
As at
March 31, 2018
As at
March 31, 2017
(i) Estimated Amount of contracts remaining to be executed on capital account & not provided for (net of advance)
385.37 80.71
38 Contingent liabilities and commitments (contd..)
40(a) The Company was holding its own Nil (March 31, 2017: 14,62.202 nos.) equity shares of H10 each through a Trust, which were
received by it in its capacity as a shareholder of Vardhman Holdings Limited, in accordance with the 'Scheme of Arrangement and Demerger'. 1,36,539 shares were tendered during the year ended March 31, 2017 in terms of buy back announced by the Company. The value of shares held at the end of each reporting period has been adjusted in the equity in accordance with Ind AS 32. During the current year, the Company has sold remaining 14,62,202 shares in market for sales consideration of H182.23 crore.
Notes to Standalone Financial Statementsfor the year ended March 31, 2018
(All amounts in H crore, unless otherwise stated)

Corporate Overview Statutory Reports Financial Statements Notice 151
40(b) The aforesaid Trust is also holding 5,32,911 equity shares (March 31, 2017: 3,19,748 nos.) of H10 each of Vardhman Special Steels Limited. Out of above 3,19,748 no of shares were allotted to it in the capacity of a shareholder of the Company by virtue of ‘Scheme of Arrangement & Demerger’ entered into by the Company, Vardhman Special Steels Limited and their respective shareholders and creditors.The aforesaid trust also purchased 2,13,163 equity shares in scheme of Right issue announced by Vardhman Special Steels Limited during the year.
As the aforesaid shares are held by a Trust on behalf of the Company and Company not being registered owner of shares, the
cost of these shares is not reflected in investments but same has been valued at cost as reflected in other current asset.
40(c) The detail of the amount recoverable from Mahavir Share Trust as at the close of the year is as under:
Particulars As at
March 31, 2018
As at
March 31, 2017
Cost of shares of the Company* - 13.05
Cost of shares of Vardhman Special Steels Limited 4.64 3.57
Other recoverable 0.01 0.03
4.65 16.65
* The amount recoverable on account of equity shares of the Company held by the trust has been reduced from equity share capital & retained earnings.
41 Segment information
The Company is primarily in the business of manufacturing, purchase and sale of textiles. The Chairman and Managing Director of the Company, which has been identified as being the Chief Operating Decision Maker (CODM), evaluates the Company’s performance, allocate resources based on the analysis of the various performance indicator of the Company as a single unit. Therefore,there is only one reportable segment for the Company.
Year ended
March 31, 2018
Year ended
March 31, 2017
Basic earnings per share (INR) 96.41 163.67
Diluted earnings per share (INR) 95.45 163.67
Profit attributable to the equity holders of the Company used in calculating basic earning per share 545.76 1,001.59
Weighted average number of equity shares for the purpose of basic earning
per share (numbers) 56,608,628 61,194,799
Profit attributable to the equity holders of the Company used in calculating dilutive earning per share 545.76 1,001.59
Weighted average number of equity shares for the purpose of dilutive earning
per share (numbers) 57,180,178 61,194,799
42 Earnings per share
Notes to Standalone Financial Statementsfor the year ended March 31, 2018
(All amounts in H crore, unless otherwise stated)

Vardhman Textiles Ltd. Annual Report 2017-18152
43 The Company owes dues of Nil (March 31, 2017: Nil) towards Micro and Small Enterprises, which are outstanding for more than 45 days as at March 31, 2018. This information as required to be disclosed under the Micro, Small and Medium Enterprises Development Act, 2006 has been determined to the extent such parties have been identified on the basis of information available with the Company.
44 Leases
The Company has leased facilities under cancellable and non-cancellable operating leases arrangements with a lease term ranging from one to ninety nine years, which are subject to renewal at mutual consent thereafter. The cancellable arrangements can be terminated by either party after giving due notice. The lease rent expenses recognised during the year amounts to H2.12 crore (March 31, 2017: H2.29 crore). The future minimum lease payments in respect of the non-cancellable operating leases are:
As at
March 31, 2018
As at
March 31, 2017
Within one year 1.21 1.28 After one year but not more than five years 2.71 2.71 More than five years 26.26 33.50
30.18 37.49
45 Share based payments - Employee Share option plan of the Company
(i) Detail of employee share option of the Company: The Company has a share option scheme for senior employees of the Company. In accordance with the terms of the plan as approved by shareholders, eligible employees may be granted options to purchase equity shares. Each employee share option convert into one equity share of the Company on exercise. Exercise price payable by the recipient is determined as per scheme. The options when allotted carry rights to dividend and voting power at par with other equity shares. Options may be exercised at the time of vesting to the date of their expiry.
(ii) The number of options granted is in accordance with employee stock option scheme approved by the shareholders and is subject to approval by the remuneration committee. The scheme rewards senior employees to the extent of Company’s and the individual’s achievement judged against both qualitative and quantitative criteria.
(iii) The following share payments arrangement is in existence during the current year (none in previous year).
Option Detail Number Grate Date Exercise
Period
Exercise Price
(H)
Fair value of option at
grant date
(H)
Vardhman Employee Stock Option 2016 6,04,500 15th Nov-16 2 years
from the
date of
vesting
815/- 352
3,000 9th Feb-17 815/- 352
6,500 10th May-17 815/- 352
6,14,000
Notes to Standalone Financial Statementsfor the year ended March 31, 2018
(All amounts in H crore, unless otherwise stated)

Corporate Overview Statutory Reports Financial Statements Notice 153
Details of vesting
Vesting period from grant date Vesting schedule
On completion of 12 months 10%
On completion of 24 months 20%
On completion of 36 months 20%
On completion of 48 months 20%
On completion of 60 months 30%
Inputs into the model Particulars
Grant date share price (H) 1,056.60
Exercise price (H) 815
Expected volatility 33.78%
Option life 2 years
Dividend yield 1.92%
Risk free Interest Rate 6.31%
(iv) During the current year, the grant of 60,750 equity shares was due but only 49,250 shares have been exercised during the year.
(v) Fair value of options/shares granted in the year
Call option value per option unit using black scholes method is H427.63. The following inputs have been used for computing the fair value:
(vi) Moment of share options
45 Share based payments - Employee Share option plan of the Company (contd..)
Particulars 2017-18 2016-17
Number of
options
Weighted
Average
Exercise price
(H)
Number of
options
Weighted
Average
Exercise price
(H)
Balance at beginning of year 6,07,500 - -
Granted during the year 6,500 815 6,07,500 815
Forfeited during the year - - -
Exercised during the year 49,250 815 - -
Expired during the year - - -
Balance at end of year 5,64,750 - 6,07,500 -
Notes to Standalone Financial Statementsfor the year ended March 31, 2018
(All amounts in H crore, unless otherwise stated)

Vardhman Textiles Ltd. Annual Report 2017-18154
46 Related party transactions
46.1 Description of related parties
Subsidiaries Key management personnel (KMP)
VMT Spinning Company Limited Mr. S.P. Oswal, Chairman and Managing DirectorVardhman Acrylics Limited Mr. Sachit Jain, Joint Managing DirectorVTL Investments Limited Mrs. Suchita Jain, Joint Managing Director (w.e.f. August 24, 2016)Joint ventures Mr. Neeraj Jain, Joint Managing DirectorVardhman Nisshinbo Garments Company Limited Mr. Rajeev Thapar, Chief Financial Officer Ms. Karan Kamal Walia, Company Secretary upto (1-05-2017) Mr. Sanjay Gupta, Company Secretary w.e.f. (01-06-2017) Associates Enterprises over which KMP have significant influenceVardhman Yarns and Threads Limited Vardhman Holdings LimitedVardhman Spinning and General Mills Limited Vardhman Apparels LimitedVardhman Special Steels Limited Smt. Banarso Devi Oswal Public Charitable Trust Sri Aurobindo Socio Economic and Management Research InstituteRelative of KMP Adhishwar Enterprises LLP Ms. Soumya Jain Devakar Investment and Trading Company Private LimitedMs.Sagrika Jain Santon Finance and Investment Company Limited Post Employment Benefit Plans Trust Flamingo Finance and Investment Company LimitedMahavir Employee Gratuity Fund Trust Ramaniya Finance and Investment Company LimitedMahavir Superannuation scheme Mahavir Spinning Mills Private Limited Northern Trading Company
Amber Syndicate
Paras Syndicate
Eastern Trading Company
Mahavir Traders
(vii) Share options exercised during the year*
Exercised Exercise date Share price at
exercise date
Granted on 15th November,2016 42,450 08-01-2018 1,405.75
(viii) Amount accounted for in profit and loss for Employee stock options is H12.07 crore.
* For 6,800 shares application money has been received upto 31-03-2018 but allotment was made on 09-04-2018.
45 Share based payments - Employee Share option plan of the Company (contd..)
Notes to Standalone Financial Statementsfor the year ended March 31, 2018
(All amounts in H crore, unless otherwise stated)

Corporate Overview Statutory Reports Financial Statements Notice 155
46.2 Transactions with related parties
For the year ended
March 31, 2018
For the year ended
March 31, 2017
Sale /processing of goods to:
Subsidiaries 10.14 12.96
Associates 5.29 6.42
Joint ventures 15.97 13.98
Enterprises over which KMP have significant influence 31.55 18.29
62.95 51.65
Purchase/processing of goods from:
Subsidiaries 157.99 217.55
Associates 17.65 10.82
Joint ventures 0.31 0.06
175.95 228.43
Purchase of property, plant & equipment from:
Subsidiaries 0.60 0.21
Associates 0.31 28.22
0.91 28.43
Sales of property, plant & equipment to:
Subsidiaries 0.61 1.14
Associates 0.81 62.98
Joint Venture - 0.02
1.42 64.14
Rent paid
Associates - -
Enterprises over which KMP have significant influence 0.12 0.10
0.12 0.10
Rent received
Subsidiaries 0.03 0.11
Associates 0.23 0.30
0.26 0.41
Dividend received
Subsidiaries 8.53 -
Associates 6.09 -
14.62 -
Interest paid
Subsidiaries 0.08 0.05
0.08 0.05
Notes to Standalone Financial Statementsfor the year ended March 31, 2018
(All amounts in H crore, unless otherwise stated)

Vardhman Textiles Ltd. Annual Report 2017-18156
For the year ended
March 31, 2018
For the year ended
March 31, 2017
Interest received
Subsidiaries 0.84 0.36
Associates 1.10 1.17
Joint Venture 0.90 0.92
2.84 2.45
Reimbursement of expenses received from
Subsidiaries 0.27 0.62
Associates 0.12 5.91
Joint Venture 0.16 0.03
0.55 6.56
Reimbursement of expenses paid
Subsidiaries 0.27 2.20
Associates 0.32 4.85
Joint Venture 0.06 0.16
0.65 7.21
Recepit against corporate service tax agreement
Subsidiaries 1.50 1.50
Associates 4.16 4.20
Joint Venture 0.03 0.03
5.69 5.73
Payment against licence agreement
Enterprises over which KMP have significant influence 0.99 0.98
0.99 0.98
Donations to
Enterprises over which KMP have significant influence 14.82 4.19
14.82 4.19
Salary paid to
Relatives of KMP 0.10 0.07
0.10 0.07
Loan given to (including opening balance)
Subsidiaries 33.00 22.25
Associates 15.00 15.00
Joint Venture 14.49 13.99
62.49 51.24
46.2 Transactions with related parties (contd..)
Notes to Standalone Financial Statementsfor the year ended March 31, 2018
(All amounts in H crore, unless otherwise stated)

Corporate Overview Statutory Reports Financial Statements Notice 157
46.2 Transactions with related parties (contd..)
For the year ended
March 31, 2018
For the year ended
March 31, 2017
Loan received back from
Subsidiaries 17.50 15.25
Associates - -
Joint Venture 2.50 2.00
20.00 17.25
Contribution to post employment benefit plans
Post Employment Benefit Plans Trust 3.35 4.60
3.35 4.60
46.3 Outstanding Balances:
As at
March 31, 2018
As at
March 31, 2017
Receivables
Joint Venture 7.49 2.96
7.49 2.96
Payables
Associates 4.48 4.80
4.48 4.80
Loan given outstanding
Subsidiaries 15.50 7.00
Associates 15.00 15.00
Joint Venture 11.99 11.99
42.49 33.99
Equity Investment outstanding
Subsidiaries 96.81 85.75
Associates 52.77 33.35
Joint Venture 7.14 7.14
156.72 126.24
Preference Investment outstanding
Joint Venture 10.00 10.00
10.00 10.00
Notes to Standalone Financial Statementsfor the year ended March 31, 2018
(All amounts in H crore, unless otherwise stated)

Vardhman Textiles Ltd. Annual Report 2017-18158
47 Employee benefits
47.1 Defined contribution plans:
46.4 Key management personnel compensation
For the year ended
March 31, 2018
For the year ended
March 31, 2017
Short-term benefits* 20.60 30.39
20.60 30.39
For the year ended
March 31, 2018
For the year ended
March 31, 2017
Superannuation fund 0.87 0.86
Provident fund administered through Regional Provident Fund Commissioner 25.93 25.29
Employees’ State Insurance Corporation 7.99 6.91
Other funds 0.16 0.35
34.95 33.41
* excluding provision for employee benefits,employee stock options but includes sitting fees and commission paid / payable to non executive directors
Amounts recognized in the statement of profit and loss are as under:
The expenses incurred on account of the above defined contribution plans have been included in Note 33 “Employee Benefits Expenses” under the head “Contribution to provident and other funds”
47.2 Defined benefit plans
The Company sponsors funded defined benefit plan for qualifying employees. This defined benefit plan of gratuity is administered by a separate trust that is legally separate from the entity. The trustees are required by the law to act in the interest of the trust and all the relevant stakeholders i.e. active employees, inactive employees, retired employees and employers, etc. The trust is responsible for investment policy with regard to the assets of the trust. The Company has a gratuity plan wherein every employee is entitled to the benefit equivalent to 15 days salary last drawn for each completed year of service. Gratuity is payable to all eligible employees of the Company on retirement, separation, death or permanent disablement, in terms of the provisions
of the Payment of Gratuity Act, 1972 or as per the Company’s plan, whichever is more beneficial.
(i) These plans typically expose the Company to actuarial risks such as investment risk, interest rate risk, longevity risk and
salary risk.
Investment Risk
The probability or likelihood of occurrence of losses relative to the expected return on any particular investment.
Salary Risk
The present value of defined benefit plan is calculated with the assumption of salary increase, rate of plan, participants in future. Deviation in rate of increase in salary in future for plan participants from the rate of increase in salary used to determine the
present value of obligation will have a bearing on the plan’s liability.
Notes to Standalone Financial Statementsfor the year ended March 31, 2018
(All amounts in H crore, unless otherwise stated)
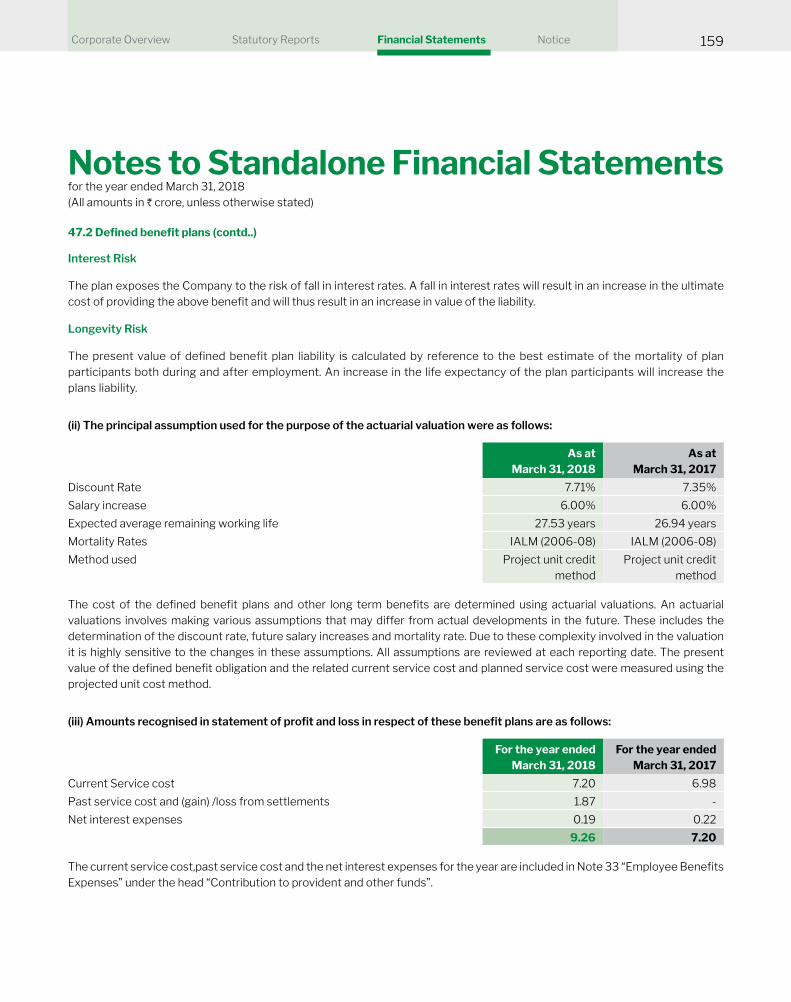
Corporate Overview Statutory Reports Financial Statements Notice 159
(ii) The principal assumption used for the purpose of the actuarial valuation were as follows:
As at
March 31, 2018
As at
March 31, 2017
Discount Rate 7.71% 7.35%
Salary increase 6.00% 6.00%
Expected average remaining working life 27.53 years 26.94 years
Mortality Rates IALM (2006-08) IALM (2006-08)
Method used Project unit credit
method
Project unit credit
method
The cost of the defined benefit plans and other long term benefits are determined using actuarial valuations. An actuarial valuations involves making various assumptions that may differ from actual developments in the future. These includes the determination of the discount rate, future salary increases and mortality rate. Due to these complexity involved in the valuation it is highly sensitive to the changes in these assumptions. All assumptions are reviewed at each reporting date. The present value of the defined benefit obligation and the related current service cost and planned service cost were measured using the projected unit cost method.
Interest Risk
The plan exposes the Company to the risk of fall in interest rates. A fall in interest rates will result in an increase in the ultimate cost of providing the above benefit and will thus result in an increase in value of the liability.
Longevity Risk
The present value of defined benefit plan liability is calculated by reference to the best estimate of the mortality of plan participants both during and after employment. An increase in the life expectancy of the plan participants will increase the plans liability.
(iii)Amountsrecognisedinstatementofprofitandlossinrespectofthesebenefitplansareasfollows:
For the year ended
March 31, 2018
For the year ended
March 31, 2017
Current Service cost 7.20 6.98
Past service cost and (gain) /loss from settlements 1.87 -
Net interest expenses 0.19 0.22
9.26 7.20
The current service cost,past service cost and the net interest expenses for the year are included in Note 33 “Employee Benefits Expenses” under the head “Contribution to provident and other funds”.
47.2 Defined benefit plans (contd..)
Notes to Standalone Financial Statementsfor the year ended March 31, 2018
(All amounts in H crore, unless otherwise stated)

Vardhman Textiles Ltd. Annual Report 2017-18160
47.2 Defined benefit plans (contd..)
(iv) Amounts recognised in Other Comprehensive Income:
(v)Theamountincludedinbalancesheetarisingfromtheentity’sobligationinrespectofitsdefinedbenefitplansisasfollows:
(vi)Movementsinthepresentvalueofdefinedbenefitobligationareasfollows:
For the year ended
March 31, 2018
For the year ended
March 31, 2017
Return on plan assets (excluding amounts included in net interest expenses) 0.44 0.77
Actuarial gain/(losses) arising from changes in financial assumptions - -
Actuarial gain/(losses) arising from changes in experience adjustments 2.07 (1.27)
2.51 (0.50)
As at
March 31, 2018
As at
March 31, 2017
Present value of funded defined benefit obligation 54.61 48.69
Fair Value of Plan Assets 52.74 46.22
Surplus / (Deficit) (1.87) (2.47)
Effect of asset ceiling, if any - -
Net assets / (liability) (1.87) (2.47)
For the year ended
March 31, 2018
For the year ended
March 31, 2017
Opening defined benefit obligation 48.69 42.35
Transferred during the year 0.15
Current Service Cost 7.20 6.97
Interest Cost 3.76 3.32
Actuarial (gain)/losses arising from changes in financial assumptions - -
Past service cost including curtailment gains/losses 1.87 -
Actuarial (gain)/losses arising from changes in experience adjustments (2.07) 1.27
Benefits paid (4.84) (5.37)
Closing defined benefit obligation 54.61 48.69
Notes to Standalone Financial Statementsfor the year ended March 31, 2018
(All amounts in H crore, unless otherwise stated)
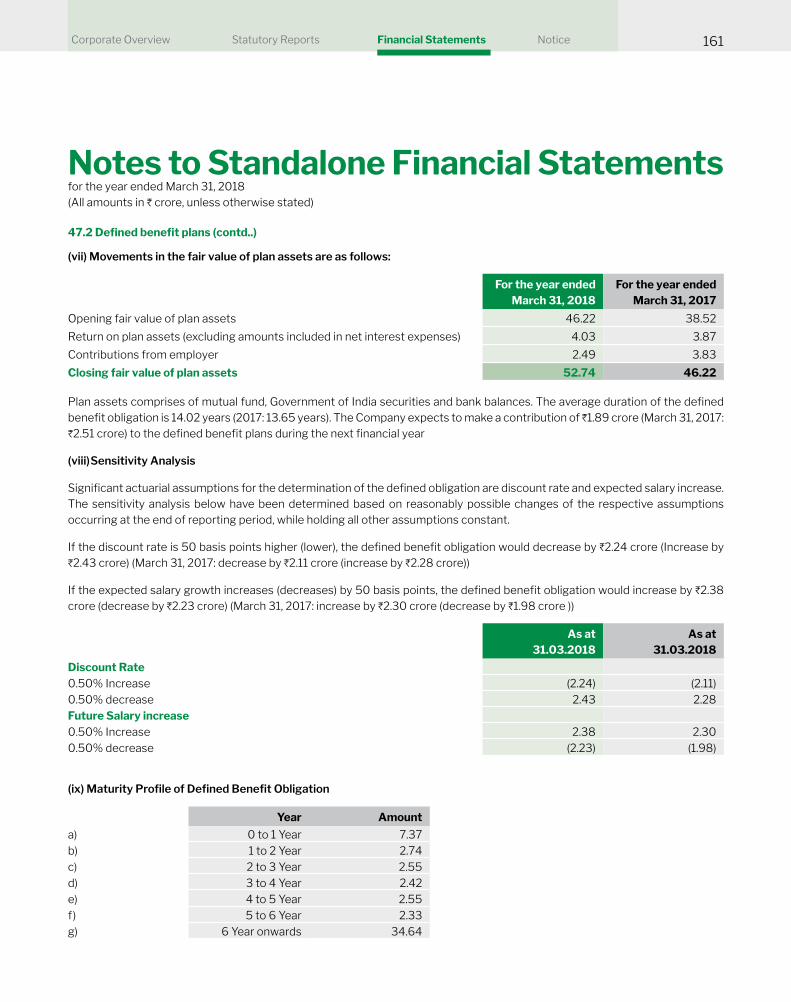
Corporate Overview Statutory Reports Financial Statements Notice 161
47.2 Defined benefit plans (contd..)
(vii) Movements in the fair value of plan assets are as follows:
(ix)MaturityProfileofDefinedBenefitObligation
For the year ended
March 31, 2018
For the year ended
March 31, 2017
Opening fair value of plan assets 46.22 38.52
Return on plan assets (excluding amounts included in net interest expenses) 4.03 3.87
Contributions from employer 2.49 3.83
Closing fair value of plan assets 52.74 46.22
Plan assets comprises of mutual fund, Government of India securities and bank balances. The average duration of the defined benefit obligation is 14.02 years (2017: 13.65 years). The Company expects to make a contribution of H1.89 crore (March 31, 2017: H2.51 crore) to the defined benefit plans during the next financial year
(viii) Sensitivity Analysis
Significant actuarial assumptions for the determination of the defined obligation are discount rate and expected salary increase. The sensitivity analysis below have been determined based on reasonably possible changes of the respective assumptions
occurring at the end of reporting period, while holding all other assumptions constant.
If the discount rate is 50 basis points higher (lower), the defined benefit obligation would decrease by H2.24 crore (Increase by H2.43 crore) (March 31, 2017: decrease by H2.11 crore (increase by H2.28 crore))
If the expected salary growth increases (decreases) by 50 basis points, the defined benefit obligation would increase by H2.38 crore (decrease by H2.23 crore) (March 31, 2017: increase by H2.30 crore (decrease by H1.98 crore ))
As at
31.03.2018
As at
31.03.2018
Discount Rate
0.50% Increase (2.24) (2.11)0.50% decrease 2.43 2.28 Future Salary increase
0.50% Increase 2.38 2.30 0.50% decrease (2.23) (1.98)
Year Amount
a) 0 to 1 Year 7.37 b) 1 to 2 Year 2.74 c) 2 to 3 Year 2.55 d) 3 to 4 Year 2.42 e) 4 to 5 Year 2.55 f) 5 to 6 Year 2.33 g) 6 Year onwards 34.64
Notes to Standalone Financial Statementsfor the year ended March 31, 2018
(All amounts in H crore, unless otherwise stated)

Vardhman Textiles Ltd. Annual Report 2017-18162
48 Additional disclosures
47.3 Other long term employee benefit
48.2 Assets pledged as security:
(i) Amount recognised in profit and loss in note no.33 "Employee benefit expense" under the head "Salaries and Wages" towards leave encashment is H2.89 crore (March 31, 2018 H5.31 core)
(ii) Amount taken to balance sheet
2017-18 2016-17
Current 2.95 1.81
Non Current 7.04 8.90
48.1 Disclosure required by Regulation 34 read with Schedule V of SEBI (Listing obligations and Disclosure Requirements) Regulations,2015:-
(i) The Company has given inter corporate deposits aggregating to H26.00 crore (March 31, 2017: H22.25 crore) to VMT Spinning Company Limited during the year. The maximum amount outstanding during the year was H20.00 crore (March 31, 2017: H13.75 crore). The Balance outstanding as on March 31, 2018 is H15.50 crore (March 31, 2017: H7.00 crore).
(ii) The Company has given inter corporate deposits aggregating to H Nil (March 31, 2017: H Nil) to Vardhman Special Steels Limited. The maximum amount outstanding during the year was H15.00 crore (March 31, 2017: H15.00 crore). The balance outstanding as on March 31, 2018 is H15.00 crore (March 31, 2017: H15.00 crore).
(iii) The Company has given inter corporate deposits aggregating to H2.50 crore (March 31, 2017: H2.00 crore) to Vardhman Nisshinbo Garments Company Limited during the year. The maximum amount outstanding during the year was H14.49 crore (March 31, 2017: H11.99 crore). The balance outstanding as on March 31, 2018 is H11.99 crore (March 31, 2017: H11.99 crore).
Particulars As at
March 31, 2018
As at
March 31, 2017
Current assets
Financial assets
Trade receviables 727.32 717.91
Non-financial assets
Inventory 2,116.51 1,589.00
Total current assets pledged as security 2,843.83 2,306.91
Non-current assets
Property, plant & equipment 2,503.04 2,451.41
Total non-current assets pledged as security 2,503.04 2,451.41
Total assets pledged as security 5,346.87 4,758.32
Notes to Standalone Financial Statementsfor the year ended March 31, 2018
(All amounts in H crore, unless otherwise stated)

Corporate Overview Statutory Reports Financial Statements Notice 163
48.3 Amount required to be spent as per section 135 of the Companies Act 2013.
Details of expenditure towards Corporate Social Responsibility (CSR) activities:
a) Gross amount required to be spent by the Company during the year was H17.02 crore (March 31, 2017 H14.46 crore).
b) Amount spent during the year : H14.93 crore (March 31, 2017 H5.41 crore)
Amount unspent during the year was H2.09 crore (March 31, 2017 H9.05 crore).
(c) Activity Amount
Promoting Education 10.11
Promoting Healthcare 2.83
Rural Development Projects 1.58
Measures for the benefit of armed forces veterans, war widows and their dependents 0.01
Promoting Art and Culture 0.03
Environmental Sustainability 0.37
Total 14.93
48.4 There has been no delay in transferring amount, required to be transferred, to the investor education and investor fund
(IEPF) by the Company during the year.
48.5 During the previous year, the Company has sold its 40% equity stake in Vardhman Yarns & Threads Limited (VYTL), equivalent to 22,802,541 equity shares, to its Joint Venture partner namely American & Efird Global (A&E) for a consideration of H413.01 crore. Gain on sale of such investment amounting to H313.00 crore has been shown under the head ‘Other Income’. Accordingly, the Company now holds 11% equity stake in VYTL equivalent to 62,69,699 equity shares at a cost of H27.50 crore. In view of changed situation, the investment is also re-classified as ‘Investment in Associates’.
48.6 Previous year figures in the financial statements, including the notes thereto, have been reclassified wherever required to confirm to the current year presentation/classification. These are not material and do not affect the previously reported net profit or equity.
For and on behalf of the Board of Directors
Sanjay Gupta Rajeev Thapar Suchita Jain S.P. Oswal
Company Secretary Chief Financial Joint Managing Director Chairman and Managing
Membership No:-4935 Officer DIN:00746471 Director DIN: 00121737
Place : LudhianaDate: May 12, 2018
Notes to Standalone Financial Statementsfor the year ended March 31, 2018
(All amounts in H crore, unless otherwise stated)

Vardhman Textiles Ltd. Annual Report 2017-18164
Consolidated Financial Statements

Corporate Overview Statutory Reports Financial Statements Notice 165
Independent Auditor’s Report
To the Members of Vardhman Textiles Limited
Report on the Consolidated Ind AS Financial Statements
We have audited the accompanying consolidated Ind
AS financial statements of Vardhman Textiles Limited (hereinafter referred to as "the Parent") and its subsidiaries
(the Parent and its subsidiaries together referred to as "the
Group"), which includes Group’s share of profit in its associates and its joint venture, comprising the Consolidated Balance
Sheet as at March 31, 2018, the Consolidated Statement of
Profit and Loss (including other comprehensive income), the Consolidated Cash Flow Statement, the Consolidated
Statement of Changes in Equity, for the year then ended,
and a summary of the significant accounting policies and other explanatory information (hereinafter referred to as "the consolidated Ind AS financial statements").
Management's Responsibility for the Consolidated Ind AS Financial Statements
The Parent's Board of Directors is responsible for the
preparation of these consolidated Ind AS financial statements in terms of the requirements of the Companies Act, 2013
(hereinafter referred to as "the Act") that give a true and
fair view of the consolidated financial position, consolidated financial performance including other comprehensive income, consolidated cash flows and consolidated statement of changes in equity of the Group including its Associates
and Joint venture in accordance with the Indian Accounting
Standards (Ind AS) prescribed under Section 133 of the Act
read with the Companies (Indian Accounting Standards)
Rules, 2015, as amended, and other accounting principles
generally accepted in India. The respective Board of Directors of the companies included in the Group and of its
associates and joint venture are responsible for maintenance
of adequate accounting records in accordance with the
provisions of the Act for safeguarding the assets of the
Group, its associates and its joint venture and for preventing
and detecting frauds and other irregularities; the selection
and application of appropriate accounting policies; making
judgments and estimates that are reasonable and prudent;
and the design, implementation and maintenance of adequate
internal financial controls, that were operating effectively for ensuring the accuracy and completeness of the accounting
records, relevant to the preparation and presentation of the
consolidated Ind AS financial statements that give a true and fair view and are free from material misstatement, whether
due to fraud or error, which have been used for the purpose of
preparation of the consolidated Ind AS financial statements by the Directors of the Parent, as aforesaid.
Auditor's Responsibility
Our responsibility is to express an opinion on these consolidated Ind AS financial statements based on our audit. In conducting our audit, we have taken into account the
provisions of the Act, the accounting and auditing standards
and matters which are required to be included in the audit
report under the provisions of the Act and the Rules made
thereunder.
We conducted our audit in accordance with the Standards on
Auditing specified under Section 143(10) of the Act. Those Standards require that we comply with ethical requirements
and plan and perform the audit to obtain reasonable assurance
about whether the consolidated Ind AS financial statements are free from material misstatement.
An audit involves performing procedures to obtain audit
evidence about the amounts and the disclosures in the
consolidated Ind AS financial statements. The procedures selected depend on the auditor's judgment, including the
assessment of the risks of material misstatement of the
consolidated Ind AS financial statements, whether due to fraud or error. In making those risk assessments, the auditor considers internal financial control relevant to the Parent's preparation of the consolidated Ind AS financial statements that give a true and fair view in order to design
audit procedures that are appropriate in the circumstances. An audit also includes evaluating the appropriateness of
the accounting policies used and the reasonableness of
the accounting estimates made by the Parent's Board of
Directors, as well as evaluating the overall presentation of the
consolidated Ind AS financial statements.

Vardhman Textiles Ltd. Annual Report 2017-18166
We believe that the audit evidence obtained by us and other
auditors in terms of their reports referred to Other Matters
paragraph below, is sufficient and appropriate to provide a basis for our audit opinion on the consolidated Ind AS financial statements.
Opinion
In our opinion and to the best of our information and
according to the explanations given to us and based on the consideration of reports of the other auditors on separate
financial statements of the subsidiaries, associates and joint venture referred to below in the Other Matters paragraph,
the aforesaid consolidated Ind AS financial statements give the information required by the Act in the manner so required
and give a true and fair view in conformity with the Ind AS
and other accounting principles generally accepted in India,
of the consolidated state of affairs of the Group as at March
31, 2018, and their consolidated profit, consolidated total comprehensive income, their consolidated cash flows and consolidated statement of changes in equity for the year
ended on that date.
Other Matters
We did not audit the financial statements of three subsidiaries viz., VMT Spinning Company Limited, VTL Investments Limited and Vardhman Acrylics Limited, whose financial statements/ financial information reflect total assets of H645.69 crore as at March 31, 2018, total revenues of H583.28 crore and net cash outflows amounting to H20.98 crore for the year ended on that date, as considered in the consolidated
Ind AS financial statements. The consolidated Ind AS financial statements also include the Group's share of net profit of H17.51 crore for the year ended March 31, 2018, as considered in the consolidated Ind AS financial statements, in respect of three associates viz., Vardhman Yarns and Threads Limited, Vardhman Special Steels Limited and Vardhman Spinning and General Mills Limited and one joint venture viz., Vardhman Nisshinbo Garments Company Limited, whose financial statements have not been audited by us. These financial
statements have been audited by other auditors whose
reports have been furnished to us by the Management and
our opinion on the consolidated Ind AS financial statements, in so far as it relates to the amounts and disclosures included
in respect of these subsidiaries, joint venture and associates,
and our report in terms of sub-section (3) of Section 143 of
the Act, in so far as it relates to the aforesaid subsidiaries, joint
ventures and associate is based solely on the reports of the
other auditors.
Our opinion on the consolidated Ind AS financial statements above and our report on Other Legal and Regulatory Requirements below, is not modified in respect of the above matter with respect to our reliance on the work done and the
reports of other auditors.
Report on Other Legal and Regulatory Requirements
As required by Section 143(3) of the Act, based on our audit
and on the consideration of the report of the other auditors
on separate financial statements and the other financial information of subsidiaries, associates and joint venture
companies incorporated in India, referred in the Other Matters
paragraph above we report, to the extent applicable, that:
(a) We have sought and obtained all the information and
explanations which to the best of our knowledge and belief were necessary for the purposes of our audit of the
aforesaid consolidated Ind AS financial statements.
(b) In our opinion, proper books of account as required by
law relating to preparation of the aforesaid consolidated
Ind AS financial statements have been kept so far as it appears from our examination of those books and the reports of the other auditors.
(c) The Consolidated Balance Sheet, the Consolidated
Statement of Profit and Loss (including Other Comprehensive Income), the Consolidated Cash Flow
Statement and Consolidated Statement of Changes
in Equity dealt with by this Report are in agreement

Corporate Overview Statutory Reports Financial Statements Notice 167
with the relevant books of account maintained for
the purpose of preparation of the consolidated Ind AS
financial statements.
(d) In our opinion, the aforesaid consolidated Ind AS financial statements comply with the Indian Accounting Standards
prescribed under Section 133 of the Act.
(e) On the basis of the written representations received
from the directors of the Parent as on March 31, 2018
taken on record by the Board of Directors of the Parent
and the reports of the statutory auditors of its subsidiary
Companies, associate Companies and joint venture
Company incorporated in India, none of the directors
of the Group, its associate Companies and joint venture
Company incorporated in India is disqualified as on March 31, 2018 from being appointed as a director in terms of
Section 164 (2) of the Act.
(f) With respect to the adequacy of the internal financial controls over financial reporting and the operating effectiveness of such controls, refer to our separate
Report in “Annexure A”, which is based on the auditors’ reports of the Parent, subsidiary Companies, associate
Companies and joint venture Company incorporated in
India to whom internal financial control over financial reporting is applicable. Our report expresses an unmodified opinion on the adequacy and operating effectiveness of
internal financial controls over financial reporting of those Companies, for the reasons stated therein.
(g) With respect to the other matters to be included in
the Auditor's Report in accordance with Rule 11 of
the Companies (Audit and Auditor's) Rules, 2014, as
amended, in our opinion and to the best of our information
and according to the explanations given to us:
i. The consolidated Ind AS financial statements disclose the impact of pending litigations on the
consolidated financial position of the Group, its associates and joint venture – Refer to Note 38(a) to
the consolidated Ind AS financial statements.
ii. The Group, its associates and joint venture did not have any material foreseeable losses on long-term contracts
including derivative contracts – Refer to Note 38(e) to
the consolidated Ind AS financial statements.
iii. There has been no delay in transferring amounts required to be transferred, to the Investor Education
and Protection Fund by the Parent and its subsidiary
Companies, associate Companies and joint venture
Company incorporated in India.
For Deloitte Haskins & Sells Llp
Chartered Accountants
(Firm‘s Registration No. 117366W / W-100018)
Vijay Agarwal
Place: Ludhiana (Partner) Date: May 12, 2018 (Membership No. 094468)

Vardhman Textiles Ltd. Annual Report 2017-18168
Annexure “A” to the Independent Auditor’s Report(Referred to in paragraph (f) under ‘Report on Other Legal and Regulatory Requirements’ section of our report of even date)
Report on the Internal Financial Controls Over Financial Reporting under Clause (i) of Sub-section 3 of Section 143 of the Companies Act, 2013 (“the Act”)
In conjunction with our audit of the consolidated Ind AS
financial statements of the Company as of and for the year ended March 31, 2018, we have audited the internal financial controls over financial reporting of Vardhman Textiles Limited (hereinafter referred to as “Parent”) and its subsidiary companies, its associates companies and joint venture
company, which are companies incorporated in India, as of
that date.
Management’s Responsibility for Internal Financial Controls
The respective Board of Directors of the Parent, its subsidiary
companies, its associate companies and joint venture, which
are companies incorporated in India, are responsible for
establishing and maintaining internal financial controls based on the internal control over financial reporting criteria established by the respective companies considering the essential
components of internal control stated in the Guidance Note on
Audit of Internal Financial Controls Over Financial Reporting
issued by the Institute of Chartered Accountants of India (ICAI). These responsibilities include the design, implementation and
maintenance of adequate internal financial controls that were operating effectively for ensuring the orderly and efficient conduct of its business, including adherence to the respective
company’s policies, the safeguarding of its assets, the
prevention and detection of frauds and errors, the accuracy
and completeness of the accounting records, and the timely
preparation of reliable financial information, as required under the Companies Act, 2013.
Auditor’s Responsibility
Our responsibility is to express an opinion on the internal financial controls over financial reporting of the Parent, its subsidiary companies, its associate companies and its joint
venture, which are companies incorporated in India, based
on our audit. We conducted our audit in accordance with the Guidance Note on Audit of Internal Financial Controls
Over Financial Reporting (the “Guidance Note”) issued by the Institute of Chartered Accountants of India and the Standards
on Auditing, prescribed under Section 143(10) of the
Companies Act, 2013, to the extent applicable to an audit of internal financial controls. Those Standards and the Guidance Note require that we comply with ethical requirements and
plan and perform the audit to obtain reasonable assurance
about whether adequate internal financial controls over financial reporting was established and maintained and if such controls operated effectively in all material respects.
Our audit involves performing procedures to obtain audit
evidence about the adequacy of the internal financial controls system over financial reporting and their operating effectiveness. Our audit of internal financial controls over financial reporting included obtaining an understanding of internal financial controls over financial reporting, assessing the risk that a material weakness exists, and testing and evaluating the design and operating effectiveness of internal
control based on the assessed risk. The procedures selected depend on the auditor’s judgement, including the assessment
of the risks of material misstatement of the financial statements, whether due to fraud or error.
We believe that the audit evidence we have obtained and
the audit evidence obtained by the other auditors of the
subsidiary companies, associate companies and joint venture
company, which are companies incorporated in India, in terms
of their reports referred to in the Other Matters paragraph
below, is sufficient and appropriate to provide a basis for our audit opinion on the internal financial controls system over financial reporting of the Parent, its subsidiary companies, its associate companies and its joint venture, which are
companies incorporated in India.
Meaning of Internal Financial Controls over Financial Reporting
A company's internal financial control over financial reporting is a process designed to provide reasonable assurance

Corporate Overview Statutory Reports Financial Statements Notice 169
regarding the reliability of financial reporting and the preparation of financial statements for external purposes in accordance with generally accepted accounting principles. A company's internal financial control over financial reporting includes those policies and procedures that (1) pertain to the
maintenance of records that, in reasonable detail, accurately
and fairly reflect the transactions and dispositions of the assets of the company; (2) provide reasonable assurance that
transactions are recorded as necessary to permit preparation
of financial statements in accordance with generally accepted accounting principles, and that receipts and expenditures of the company are being made only in accordance with
authorisations of management and directors of the company;
and (3) provide reasonable assurance regarding prevention
or timely detection of unauthorised acquisition, use, or
disposition of the company's assets that could have a material
effect on the financial statements.
Inherent Limitations of Internal Financial Controls over Financial Reporting
Because of the inherent limitations of internal financial controls over financial reporting, including the possibility of collusion or improper management override of controls,
material misstatements due to error or fraud may occur and
not be detected. Also, projections of any evaluation of the internal financial controls over financial reporting to future periods are subject to the risk that the internal financial control over financial reporting may become inadequate because of changes in conditions, or that the degree of compliance with
the policies or procedures may deteriorate.
Opinion
In our opinion to the best of our information and according to
the explanations given to us and based on the consideration
of the reports of the other auditors referred to in the Other
Matters paragraph below, the Parent, its subsidiary companies,
its associate companies and joint venture company, which
are companies incorporated in India, have, in all material
respects, an adequate internal financial controls system over financial reporting and such internal financial controls over financial reporting were operating effectively as at March 31, 2018, based on the criteria for internal financial control over financial reporting established by the respective companies considering the essential components of internal control
stated in the Guidance Note on Audit of Internal Financial
Controls Over Financial Reporting issued by the Institute of
Chartered Accountants of India.
Other Matters
Our aforesaid report under Section 143(3) (i) of the Act on the
adequacy and operating effectiveness of the internal financial controls over financial reporting insofar as it relates to three subsidiary companies, three associate companies and one
joint venture, which are companies incorporated in India, is
based solely on the corresponding reports of the auditors of
such companies incorporated in India.
Our opinion is not modified in respect of the above matter.
For Deloitte Haskins & Sells Llp
Chartered Accountants
(Firm‘s Registration No. 117366W / W-100018)
Vijay Agarwal
Place: Ludhiana (Partner) Date: May 12, 2018 (Membership No. 094468)

Vardhman Textiles Ltd. Annual Report 2017-18170
Consolidated Balance Sheet as at March 31, 2018
(All amount in H crore, unless otherwise stated)
ParticularsNote
No.
As at
March 31, 2018
As at
March 31, 2017
ASSETS
Non-current assets
(a) Property, plant and equipment 3A 2,614.59 2,571.31 (b) Capital work-in-progress 3A 105.71 49.03 (c) Other intangible assets 3B 3.81 6.74 (d) Goodwill 4 12.50 12.54 (e) Financial assets
(i) Investment in associates and joint ventures 5A 106.00 75.17 (ii) Investments 5B 748.58 858.75 (iii) Loans 6A 0.59 0.61 (iv) Others financial assets 6B 9.40 10.09 (f) Other non-current assets 7 97.31 78.41 Total Non-current assets 3,698.49 3,662.65
Current assets
(a) Inventories 8 2,256.64 1,752.81 (b) Financial assets
(i) Investments 9 979.09 934.40 (ii) Trade receivables 10 757.53 733.50 (iii) Cash and cash equivalents 11 70.38 42.29 (iv) Bank balances other than above 11A 3.38 2.36 (v) Loans 12 29.80 29.71 (vi) Other financial assets 13 18.35 26.40 (c) Current tax assets(net) 14 78.41 21.26 (d) Other current assets 15 352.02 295.67 Total Current assets 4,545.60 3,838.40
TOTAL ASSETS 8,244.09 7,501.05
EQUITY AND LIABILITIES
Equity
(a) Equity share capital 16 56.43 54.91 (b) Other equity 17 4,897.27 4,218.32 Equity attributable to the owners of the Company 4,953.70 4,273.23
(c) Non-controlling interests 108.78 112.19 Total Equity 5,062.48 4,385.42
Liabilities
Non-current liabilities
(a) Financial liabilities
(i) Borrowings 18 1,209.77 742.70 (ii) Other financial liabilities 19 0.65 0.49 (b) Provisions 20 7.69 9.69 (c) Deferred tax liabilities (Net) 21 255.62 255.69 (d) Other non-current liabilities 22 22.18 21.03 Total Non-current liabilities 1,495.91 1,029.60
Current liabilities
(a) Financial liabilities
(i) Borrowings 23 821.19 1,066.32 (ii) Trade payables 24 239.86 245.15 (iii) Other financial liabilities 25 489.26 617.87 (b) Provisions 26 5.47 4.65 (c) Current tax liabilities (net) 14 10.93 -
(d) Other current liabilities 27 118.99 152.04 Total Current liabilities 1,685.70 2,086.03
TOTAL EQUITY AND LIABILITIES 8,244.09 7,501.05
See accompanying notes to the consolidated financial statements 1 - 49
In terms of our report attached
For Deloitte Haskins & Sells LLP
Chartered Accountants For and on behalf of the Board of Directors
Vijay Agarwal Sanjay Gupta Rajeev Thapar Suchita Jain S.P. Oswal
Partner Company Secretary Chief Financial Joint Managing Director Chairman and Managing
Membership No:-4935 Officer DIN:00746471 Director DIN: 00121737
Place : Ludhiana Place : LudhianaDate: May 12, 2018 Date: May 12, 2018

Corporate Overview Statutory Reports Financial Statements Notice 171
Consolidated Statement of Profit and Lossfor the year ended March 31, 2018
(All amount in H crore, unless otherwise stated)
In terms of our report attached
For Deloitte Haskins & Sells LLP
Chartered Accountants For and on behalf of the Board of Directors
Vijay Agarwal Sanjay Gupta Rajeev Thapar Suchita Jain S.P. Oswal
Partner Company Secretary Chief Financial Joint Managing Director Chairman and Managing
Membership No:-4935 Officer DIN:00746471 Director DIN: 00121737
Place : Ludhiana Place : LudhianaDate: May 12, 2018 Date: May 12, 2018
ParticularsNote
No.
For the year ended
March 31, 2018
For the year ended
March 31, 2017
I Revenue from operations 28 6,248.27 6,029.95 II Other income 29 197.35 553.86 III Total Income (I+II) 6,445.62 6,583.81
IV Expenses :
Cost of materials consumed 30 3,438.28 3,015.80 Purchases of stock-in-trade 31 4.15 5.39 Changes in inventories of finished goods, work-in-progress and stock-in-trade 32 (37.87) (90.82)Employee benefits expense 33 506.26 478.85 Finance costs 34 118.19 128.68 Depreciation and amortization 3A & 3B 240.00 343.40 Other expenses 35 1,434.49 1,421.43 Total Expenses 5,703.50 5,302.73
V Profit before tax (III-IV) 742.12 1,281.08
VI Share of profit of associates/ joint ventures 17.51 36.86 VII Profit before tax (V+VI) 759.63 1,317.94
VIII Tax expense: 36
Current tax 165.01 302.64 Deferred tax 2.18 21.03
IX Profit for the year (VII-VIII) 592.44 994.27
X Other Comprehensive Income 17
A Items that will not be reclassified to profit or loss(a) (i) Remeasurements of the defined benefits plans 2.47 (0.61) (ii) Income tax relating to items that will not be reclassified to profit or loss (0.86) 0.21 (b) (i) Equity instruments through other comrehensive income (0.01) 0.06 (ii) Income tax relating to items that will not be reclassified to profit or loss - (0.02)(c) Share of other comprehensive income from associates/joint venture - (0.09)
XI Total other comprehensive income 1.60 (0.45)
XII Total comprehensive income for the year (IX+XI) 594.04 993.82
Profit attributable to: - Owners of the Company 581.19 981.41 - Non-controlling interests 11.25 12.86
592.44 994.27
Other Comprehensive Income attributable to: - Owners of the Company 1.57 (0.42) - Non-controlling interests 0.03 (0.03)
1.60 (0.45)
Total Comprehensive Income attributable to: - Owners of the Company 582.76 980.99 - Non-controlling interests 11.28 12.83
594.04 993.82
Earnings per equity share (amount in J) 41
(1) Basic 106.56 163.11 (2) Diluted 105.48 163.11 See accompanying notes to the consolidated financial statements 1 - 49

Vardhman Textiles Ltd. Annual Report 2017-18172
Consolidated Cash Flow Statementfor the year ended March 31, 2018
(All amount in H crore, unless otherwise stated)
ParticularsYear ended
March 31, 2018
Year ended
March 31, 2017
A CASH FLOW FROM OPERATING ACTIVITIES
Profit before tax 759.63 1,317.94
Adjustments for:
Share of profit of associates (17.51) (36.86)
Finance costs 106.86 116.22
Fair valuation gain on investment (86.84) (99.68)
Subsidy income (1.83) (1.89)
Prepayments of Leasehold land 0.24 0.08
Interest income (19.01) (31.22)
Dividend on current investments (7.29) (14.62)
Net gain on sale / discarding of property, plant and equipment (4.81) (64.15)
(Profit)/Loss on sale of Investments (Net) (34.96) (281.10)
Provision no longer required written back(Net) (8.38) (3.61)
Amortisation of processing charges 0.64 0.93
Asset written off 3.39 4.38
Bad debt written off 0.46 3.59
Allowances for doubtful trade receivables and advances - 2.74
Depreciation and amortization expense 240.00 343.40
Share options outstanding account 10.57 -
Changes in working capital:
Adjustments for (increase) / decrease in operating assets :-
Trade receivables (24.49) 37.86
Inventories (503.84) 183.74
Loans (Current) (0.09) (6.39)
Loans (Non-current) 0.02 0.17
Other assets (Current) (56.37) 20.00
Other assets (Non-current) (5.38) 9.77
Other financial assets (Current) (0.44) 47.49
Other financial assets (Non-current) 0.81 10.71
Adjustments for increase / (decrease) in operating liabilities :-
Trade payables and other liabilities 3.08 72.31
Provisions (Non-current) (2.00) 3.33
Provisions (Current) 0.82 (0.80)
Others financial liabilities (Current) (5.74) 7.13
Others financial liabilities (Non-Current) 0.16 0.30
Other liabilities (Non-current) (1.13) (0.53)
Other liabilities (Current) (32.18) 17.70
Cash generated from operations 314.39 1,658.94
Income taxes paid (212.09) (308.66)
Net cash generated by operating activities 102.30 1,350.28

Corporate Overview Statutory Reports Financial Statements Notice 173
Consolidated Cash Flow Statementfor the year ended March 31, 2018
(All amount in H crore, unless otherwise stated)
ParticularsYear ended
March 31, 2018
Year ended
March 31, 2017
B CASH FLOW FROM INVESTING ACTIVITIES
Purchase of investments (1,068.01) (1,087.48)
Proceeds from sale of investments 1,224.47 903.34
Interest received 26.39 49.72
Payment for purchase of property, plant and equipment, capital work in
progress and other intangible assets (366.73) (309.94)
Proceeds from sale of property, plant and equipment 10.31 86.55
Dividend on associates, other investments 7.29 14.62
Net cash used in investing activities (166.28) (343.19)
C CASH FLOW FROM FINANCING ACTIVITIES
Proceeds/ (Repayment) from Equity Share capital 5.54 (688.39)
Proceeds from sale of treasury shares 182.23
Proceeds from borrowings (non-current) 328.24 -
Repayment of borrowings (non-current) - (418.13)
Repayment of borrowings (current) (245.13) -
Proceeds from borrowings (current) (net) - 38.85
Corporate dividend tax paid (18.24) -
Dividends on equity share capital paid (81.35) (0.93)
Capital Subsidy received 4.45 3.35
Finance costs paid (83.67) (114.91)
Net cash generated / (used) in financing activities 92.07 (1,180.16)
Net increase / (decrease) in cash and cash equivalents 28.09 (173.07)
Cash and cash equivalents at the beginning of the year 42.29 215.36
Cash and cash equivalents at the end of the year 70.38 42.29
* There are no non cash changes arising from financing activities
In terms of our report attached
For Deloitte Haskins & Sells LLP
Chartered Accountants For and on behalf of the Board of Directors
Vijay Agarwal Sanjay Gupta Rajeev Thapar Suchita Jain S.P. Oswal
Partner Company Secretary Chief Financial Joint Managing Director Chairman and Managing
Membership No:-4935 Officer DIN:00746471 Director DIN: 00121737
Place : Ludhiana Place : LudhianaDate: May 12, 2018 Date: May 12, 2018
See accompanying notes to the consolidated financial statements 1 - 49
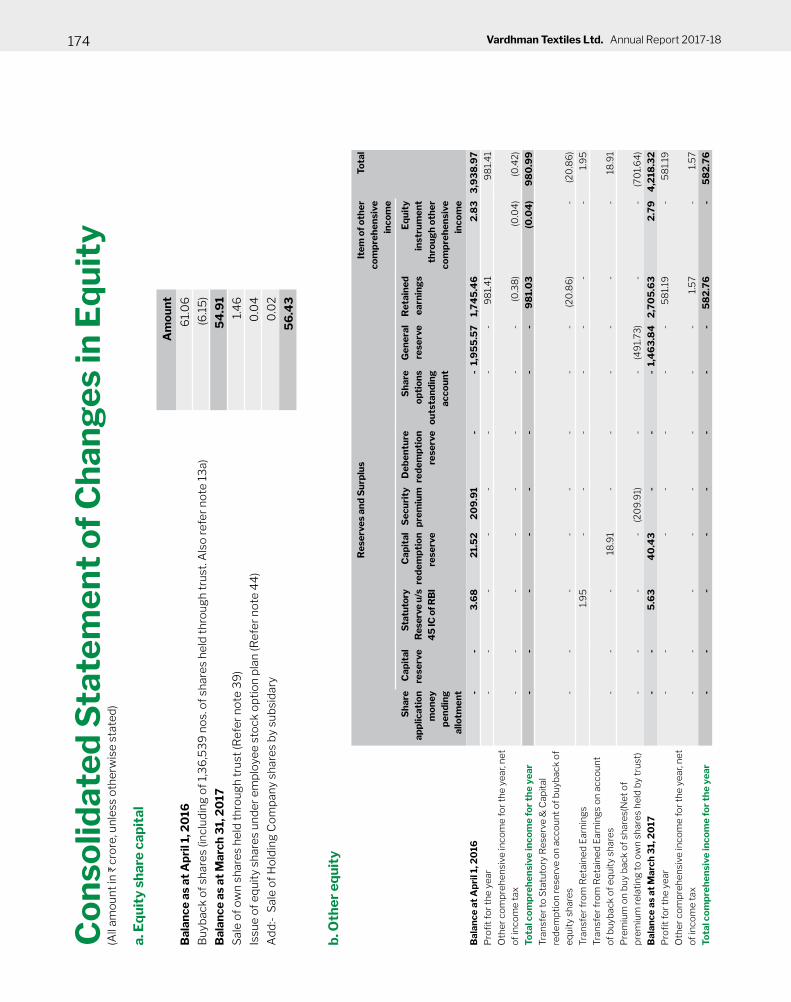
Vardhman Textiles Ltd. Annual Report 2017-18174
Co
ns
oli
da
ted
Sta
tem
en
t o
f C
ha
ng
es
in E
qu
ity
(All
am
ou
nt
in H
cro
re, u
nle
ss o
the
rwis
e s
tate
d)
a. E
qu
ity
sh
are
ca
pit
al
b. O
the
r e
qu
ity
Am
ou
nt
Ba
lan
ce
as
at
Ap
ril 1
, 20
16 6
1.0
6
Buy
back
of s
hare
s (in
clud
ing
of 1
,36
,53
9 n
os. o
f sha
res
held
thro
ugh
trus
t. A
lso
refe
r not
e 13
a) (6
.15
)
Ba
lan
ce
as
at
Ma
rch
31,
20
17 5
4.9
1
Sal
e of
ow
n sh
ares
hel
d th
roug
h tr
ust (
Ref
er n
ote
39
) 1
.46
Issu
e o
f e
qu
ity
sh
are
s u
nd
er
em
plo
ye
e s
toc
k o
pti
on
pla
n (R
efe
r n
ote
44
) 0
.04
Add
:- S
ale
of H
oldi
ng C
ompa
ny s
hare
s by
sub
sida
ry 0
.02
56
.43
Re
se
rve
s a
nd
Su
rplu
sIt
em
of
oth
er
co
mp
reh
en
siv
e
inc
om
e
To
tal
Sh
are
ap
pli
ca
tio
n
mo
ne
y
pe
nd
ing
all
otm
en
t
Ca
pit
al
res
erv
e
Sta
tuto
ry
Re
serv
e u
/s
45
IC o
f R
BI
Ca
pit
al
red
em
pti
on
res
erv
e
Se
cu
rity
pre
miu
m
De
be
ntu
re
red
em
pti
on
res
erv
e
Sh
are
op
tio
ns
ou
tsta
nd
ing
ac
co
un
t
Ge
ne
ral
res
erv
e
Re
tain
ed
ea
rnin
gs
Eq
uit
y
ins
tru
me
nt
thro
ug
h o
the
r
co
mp
reh
en
siv
e
inc
om
e
Ba
lan
ce
at
Ap
ril 1
, 20
16 -
-
3.6
8
21.
52
2
09
.91
-
-
1,9
55
.57
1
,74
5.4
6
2.8
3
3,9
38
.97
Pro
fit f
or th
e ye
ar -
-
-
-
-
-
-
-
9
81.
41
98
1.4
1 O
the
r c
om
pre
he
nsi
ve in
co
me
fo
r th
e y
ea
r, n
et
of in
com
e ta
x -
-
-
-
-
-
-
-
(0
.38
) (0
.04
) (0
.42)
To
tal c
om
pre
he
ns
ive
inc
om
e f
or
the
ye
ar
-
-
-
-
-
-
-
-
98
1.0
3
(0.0
4)
98
0.9
9
Tra
nsf
er
to S
tatu
tory
Re
serv
e &
Ca
pit
al
red
em
pti
on
re
serv
e o
n a
cc
ou
nt
of
bu
yb
ac
k o
f
eq
uit
y s
ha
res
-
-
-
-
-
-
-
-
(20
.86
) -
(2
0.8
6)
Tra
nsf
er
fro
m R
eta
ine
d E
arn
ing
s 1
.95
-
-
-
-
-
-
-
1
.95
T
ran
sfe
r fr
om
Re
tain
ed
Ea
rnin
gs
on
ac
co
un
t
of
bu
yb
ac
k o
f e
qu
ity
sh
are
s -
-
-
18
.91
--
--
--
18
.91
Pre
miu
m o
n b
uy
ba
ck
of
sha
res(
Ne
t o
f
pre
miu
m r
ela
tin
g t
o o
wn
sh
are
s h
eld
by
tru
st)
-
-
-
-
(20
9.9
1) -
-
(4
91.
73)
-
-
(70
1.6
4)
Ba
lan
ce
as
at
Ma
rch
31,
20
17 -
-
5.6
3
40
.43
-
-
-
1,4
63
.84
2
,70
5.6
3
2.7
9
4,2
18.3
2
Pro
fit f
or th
e ye
ar -
-
-
-
-
-
-
5
81.
19
-
58
1.19
O
the
r c
om
pre
he
nsi
ve in
co
me
fo
r th
e y
ea
r, n
et
of in
com
e ta
x -
-
-
-
-
-
-
-
1.5
7-
1.5
7 T
ota
l co
mp
reh
en
siv
e in
co
me
fo
r th
e y
ea
r -
-
-
-
-
-
-
-
58
2.7
6
- 5
82
.76

Corporate Overview Statutory Reports Financial Statements Notice 175
Co
ns
oli
da
ted
Sta
tem
en
t o
f C
ha
ng
es
in E
qu
ity
(All
am
ou
nt
in H
cro
re, u
nle
ss o
the
rwis
e s
tate
d)
a. E
qu
ity
Sh
are
Ca
pit
al
See
acc
ompa
nyin
g no
tes
to th
e co
nsol
idat
ed fi
nanc
ial s
tate
men
ts
1 - 4
9
In t
erm
s o
f o
ur
rep
ort
att
ac
he
d
Fo
r D
elo
itte
Ha
sk
ins
& S
ell
s L
LP
Ch
art
ere
d A
cc
ou
nta
nts
Fo
r a
nd
on
be
ha
lf o
f th
e B
oa
rd o
f D
ire
cto
rs
Vij
ay
Ag
arw
al
Sa
nja
y G
up
ta
Ra
jee
v T
ha
pa
r S
uc
hit
a J
ain
S
.P. O
sw
al
Pa
rtn
er
Co
mp
an
y S
ec
reta
ry
Ch
ief
Fin
an
cia
l Jo
int
Ma
na
gin
g D
ire
cto
r C
ha
irm
an
an
d M
an
ag
ing
M
embe
rshi
p N
o:-4
93
5
Offi
cer
DIN
:00
746
471
D
irect
or
D
IN: 0
012
173
7
Pla
ce :
Ludh
iana
P
lace
: Lu
dhia
naD
ate:
May
12,
20
18
Dat
e: M
ay 1
2, 2
018
Re
se
rve
s a
nd
Su
rplu
sIt
em
of
oth
er
co
mp
reh
en
siv
e
inc
om
e
To
tal
Sh
are
ap
pli
ca
tio
n
mo
ne
y
pe
nd
ing
all
otm
en
t
Ca
pit
al
res
erv
e
Sta
tuto
ry
Re
serv
e u
/s
45
IC o
f R
BI
Ca
pit
al
red
em
pti
on
res
erv
e
Se
cu
rity
pre
miu
m
De
be
ntu
re
red
em
pti
on
res
erv
e
Sh
are
op
tio
ns
ou
tsta
nd
ing
ac
co
un
t
Ge
ne
ral
res
erv
e
Re
tain
ed
ea
rnin
gs
Eq
uit
y
ins
tru
me
nt
thro
ug
h o
the
r
co
mp
reh
en
siv
e
inc
om
e
Fina
l Equ
ity
Div
iden
d fo
r the
fina
ncia
l yea
r 2
016
-17
(Am
ou
nt
H15
pe
r sh
are
) -
-
-
-
-
-
-
(8
4.5
6)
-
(84
.56
)Ta
x on
Div
iden
d -
-
-
-
-
-
-
(1
8.2
4)
-
(18
.24
)D
ivid
en
d o
n s
ha
res
he
ld t
hro
ug
h t
rust
-
-
-
-
-
-
-
2.1
9
-
2.1
9
Pro
fit o
n sa
les
of s
hare
s he
ld th
roug
h tr
ust
(Ref
er n
ote
39
) -
-
-
-
-
-
-
1
80
.77
-
18
0.7
7 E
mp
loy
ee
sto
ck
op
tio
ns
ac
cu
red
up
to M
arc
h
20
18 (R
efe
r n
ote
44
) -
-
-
-
-
1
2.0
7 -
-
-
1
2.0
7 T
ran
sfe
r to
eq
uit
y s
ha
res
du
e t
o is
sue
of
em
plo
ye
e s
toc
k o
pti
on
s (R
efe
r n
ote
44
) (1
.50
) (1
.50
)S
ec
uri
tie
s p
rem
ium
on
sh
are
s u
nd
er
Em
plo
ye
e s
toc
k o
pti
on
s -
-
-
4
.91
-
-
-
-
-
4.9
1 T
ran
sfe
r to
de
be
ntu
re r
ed
em
pti
on
re
serv
e o
n
ac
co
un
t o
f is
sue
of
de
be
ntu
res
-
-
-
-
17.
81
-
-
(17.
81)
-
-
Tra
nsf
er
to S
tatu
tory
Re
serv
e u
nd
er
45
-IC
of
RB
I Ac
t (2
.05
) (2
.05
)T
ran
sfe
r fr
om
Re
tain
ed
Ea
rnin
gs
2.0
5
2.0
5
Sh
are
Ap
plic
ati
on
Mo
ne
y r
ec
eiv
ed
pe
nd
ing
allo
tmen
t und
er e
mpl
oyee
sto
ck o
ptio
ns.
0.5
5
-
-
-
-
-
-
-
-
0.5
5
0.5
5
7
.68
4
0.4
3
4.9
1 1
7.8
1 1
0.5
7 1
,46
3.8
4
3,3
48
.69
2
.79
4,8
97
.27

Vardhman Textiles Ltd. Annual Report 2017-18176
Notes to Consolidated Financial Statementsfor the year ended March 31, 2018
(All amount in H crore, unless otherwise stated)
1 General Information
Vardhman Textiles Limited (the Company) is a public Company, which was incorporated under the provisions
of the Companies Act, 1956 on October 8, 1973 and has its registered office at Chandigarh Road, Ludhiana. The name of the Company at its incorporation was Mahavir
Spinning Mills Limited and subsequently changed to Vardhman Textiles Limited on September 5, 2006. The Company is engaged in manufacturing of cotton yarn,
synthetic yarn and woven fabric. The Company is listed on two stock exchanges i.e. at National Stock Exchange and at Bombay Stock Exchange.
The financial statements were approved for issue in accordance with a resolution of the directors on
May 12, 2018
2 Significant accounting policies, significant accounting judgements, estimates and assumptions and applicablity of new and revsied IND AS
2.1 Statement of compliance
These financial statements are prepared in accordance with Indian Accounting Standard (Ind
AS), and the provisions of the Companies Act,
2013 (‘the Act’) (to the extent notified) The Ind AS are prescribed under Section 133 of the Act read
with Rule 3 of the Companies (Indian Accounting
Standards) Rules, 2015 and relevant amendment
rules issued thereafter.
Effective April 1, 2016, the Company has adopted
all the Ind AS standards and the adoption was
carried out in accordance with Ind AS 101 First
time adoption of Indian Accounting Standards, with
effect from April 1, 2015 as the transition date. The transition was carried out from Indian Accounting
Principles generally accepted in India as prescribed
under Section 133 of the Act, read with Rule 7 of the
Companies (Accounts) Rules, 2014 (IGAAP), which
was the previous GAAP.
Amounts for year ended March 31, 2017 and amounts
as at March 31, 2017 were audited by previous
auditors – S.C. Vasudeva & Co.
2.2 Basis of preparation and presentation
The financial statements have been prepared on the historical cost basis except for certain financial instruments that are measured at fair values at the
end of each reporting period, as explained in the accounting policies below.
Historical cost is generally based on the fair value of the consideration given in exchange for goods and services.
Fair value is the price that would be received to sell
an asset or paid to transfer a liability in an orderly
transaction between market participants at the
measurement date, regardless of whether that price
is directly observable or estimated using another
valuation technique. In estimating the fair value of an asset or a liability, the Company takes into account
the characteristics of the asset or liability if market
participants would take those characteristics into
account when pricing the asset or liability at the
measurement date. Fair value for measurement and/or disclosure purposes in these financial statements is determined on such a basis, except for share-based payment transactions that are within the
scope of Ind AS 102, leasing transactions that are
within the scope of Ind AS 17, and measurements
that have some similarities to fair value but are not
fair value, such as net realisable value in Ind AS 2 or
value in use in Ind AS 36.
In addition, for financial reporting purposes, fair value measurements are categorised into Level 1, 2, or 3 based on the degree to which the inputs to the fair value
measurements are observable and the significance of the inputs to the fair value measurement in its entirety,
which are described as follows:
• Level 1 inputs are quoted prices (unadjusted) in active markets for identical assets or liabilities that
the entity can access at the measurement date;

Corporate Overview Statutory Reports Financial Statements Notice 177
Notes to Consolidated Financial Statementsfor the year ended March 31, 2018
(All amount in H crore, unless otherwise stated)
• Level 2 inputs are inputs, other than quoted prices included within Level 1, that are observable for the asset or liability, either directly or indirectly; and
• Level 3 inputs are unobservable inputs for the asset or liability.
2.3 Basis of consolidation
The consolidated financial statements incorporate the financial statements of the Company and entities (including structured entities) controlled by the
Company and its subsidiaries. Control is achieved when the Company:
• has power over the investee;
• is exposed, or has rights, to variable returns from its involvement with the investee; and
• has the ability to use its power to affect its returns.
The Company reassesses whether or not it controls
an investee if facts and circumstances indicate
that there are changes to one or more of the three
elements of control listed above.
When the Company has less than a majority of the
voting rights of an investee, it has power over the
investee when the voting rights are sufficient to give it the practical ability to direct the relevant activities
of the investee unilaterally. The Company considers all relevant facts and circumstances in assessing
whether or not the Company’s voting rights in an
investee are sufficient to give it power, including:
• the size of the Company’s holding of voting rights
relative to the size and dispersion of holdings of
the other vote holders;
• potential voting rights held by the Company,
other vote holders or other parties;
• rights arising from other contractual
arrangements; and
• any additional facts and circumstances that
indicate that the Company has, or does not
have, the current ability to direct the relevant
activities at the time that decisions need to be
made, including voting patterns at previous
shareholders’ meetings.
Consolidation of a subsidiary begins when the
Company obtains control over the subsidiary and
ceases when the Company loses control of the
subsidiary. Specifically, income and expenses of a subsidiary acquired or disposed of during the year
are included in the consolidated statement of profit and loss from the date the Company gains control
until the date when the Company ceases to control
the subsidiary.
Profit or loss and each component of other comprehensive income are attributed to the owners
of the Company and to the non-controlling interests. Total comprehensive income of subsidiaries is
attributed to the owners of the Company and to the
non-controlling interests even if this results in the
non-controlling interests having a deficit balance.
When necessary, adjustments are made to the
financial statements of subsidiaries to bring their accounting policies into line with the Company’s
accounting policies.
All intraCompany assets and liabilities, equity, income,
expenses, and cash flows relating to transactions between members of the Company are eliminated in
full on consolidation.
2.4 Changes in the Company’s ownership interests in
existing subsidiaries
Changes in the Group’s ownership interests in
subsidiaries that do not result in the Group losing
control over the subsidiaries are accounted for as
equity transactions. The carrying amounts of the Group’s interests and the non-controlling interests
are adjusted to reflect the changes in their relative interests in the subsidiaries. Any difference between the amount by which the non-controlling interests
are adjusted and the fair value of the consideration
paid or received is recognised directly in equity and
attributed to owners of the Company.

Vardhman Textiles Ltd. Annual Report 2017-18178
2.5 Goodwill
Goodwill arising on an acquisition of a business is
carried at cost as established at the date of acquisition
of the business less accumulated impairment
losses, if any.
For the purposes of impairment testing, goodwill is
allocated to each of the Group’s cash-generating
units (or groups of cash-generating units) that
is expected to benefit from the synergies of the combination.
A cash-generating unit to which goodwill has been
allocated is tested for impairment annually, or more
frequently when there is an indication that the unit
may be impaired. If the recoverable amount of the cash-generating unit is less than its carrying amount,
the impairment loss is allocated first to reduce the carrying amount of any goodwill allocated to the unit
and then to the other assets of the unit pro rata based
on the carrying amount of each asset in the unit. Any impairment loss for goodwill is recognised directly
in profit or loss. An impairment loss recognised for goodwill is not reversed in subsequent periods.
In case any goodwill impairment is identified the same is approved by the board of directors and
recorded in the books of accounts and disclosed
appropriately.
2.6 Investment in associates and joint ventures
An associate is an entity over which the Company
has significant influence. Significant influence is the power to participate in the financial and operating policy decisions of the investee but is not control or
joint control over those policies.
A joint venture is a joint arrangement whereby the
parties that have joint control of the arrangement
have rights to the net assets of the joint arrangement. Joint control is the contractually agreed sharing of
control of an arrangement, which exists only when decisions about the relevant activities require
unanimous consent of the parties sharing control.
The results and assets and liabilities of associates or
joint ventures are incorporated in these consolidated
financial statements using the equity method of accounting, except when the investment, or a portion thereof, is classified as held for sale, in which case it is accounted for in accordance with Ind AS
105. Under the equity method, an investment in an associate or a joint venture is initially recognised in
the consolidated balance sheet at cost and adjusted
thereafter to recognise the Company’s share of
the profit or loss and other comprehensive income of the associate or joint venture. Distributions received from an associate or a joint venture reduce
the carrying amount of the investment. When the Company’s share of losses of an associate or a joint
venture exceeds the Company’s interest in that associate or joint venture (which includes any long-
term interests that, in substance, form part of the
Company’s net investment in the associate or joint
venture), the Company discontinues recognising
its share of further losses. Additional losses are recognised only to the extent that the Company has incurred legal or constructive obligations or made
payments on behalf of the associate or joint venture.
An investment in an associate or a joint venture is
accounted for using the equity method from the
date on which the investee becomes an associate or
a joint venture. On acquisition of the investment in an associate or a joint venture, any excess of the cost of the investment over the Company’s share of the net
fair value of the identifiable assets and liabilities of the investee is recognised as goodwill, which is included
within the carrying amount of the investment. Any excess of the Company’s share of the net fair value of the identifiable assets and liabilities over the cost of the investment, after reassessment, is recognised
directly in equity as capital reserve in the period in
which the investment is acquired.
After application of the equity method of accounting,
the Company determines whether there is any
objective evidence of impairment as a result of
one or more events that occurred after the initial
recognition of the net investment in an associate or a
joint venture and that event (or events) has an impact
on the estimated future cash flows from the net investment that can be reliably estimated. If there
Notes to Consolidated Financial Statementsfor the year ended March 31, 2018
(All amount in H crore, unless otherwise stated)

Corporate Overview Statutory Reports Financial Statements Notice 179
exists such an objective evidence of impairment, then it is necessary to recognise impairment loss
with respect to the Company’s investment in an
associate or a joint venture.
When necessary, the entire carrying amount
of the investment (including goodwill) is tested
for impairment in accordance with Ind AS 36
Impairment of Assets as a single asset by comparing
its recoverable amount (higher of value in use and fair
value less costs of disposal) with its carrying amount,
Any impairment loss recognised forms part of the
carrying amount of the investment. Any reversal of that impairment loss is recognised in accordance
with Ind AS 36 to the extent that the recoverable amount of the investment subsequently increases.
The Company discontinues the use of the equity
method from the date when the investment ceases
to be an associate or a joint venture, or when the
investment is classified as held for sale. When the Company retains an interest in the former associate
or joint venture and the retained interest is a financial asset, the Company measures the retained interest
at fair value at that date and the fair value is regarded
as its fair value on initial recognition in accordance
with Ind AS 109. The difference between the carrying amount of the associate or joint venture at the date
the equity method was discontinued, and the fair
value of any retained interest and any proceeds from
disposing of a part interest in the associate or joint
venture is included in the determination of the gain
or loss on disposal of the associate or joint venture. In addition, the Company accounts for all amounts
previously recognised in other comprehensive
income in relation to that associate or joint venture
on the same basis as would be required if that
associate or joint venture had directly disposed of
the related assets or liabilities. Therefore, if a gain or loss previously recognised in other comprehensive
income by that associate or joint venture would be
reclassified to profit or loss on the disposal of the related assets or liabilities, the Company reclassifies the gain or loss from equity to profit or loss (as a reclassification adjustment) when the equity method is discontinued.
When a group entity transacts with an associate or
a joint venture of the Company, profits and losses resulting from the transactions with the associate
or joint venture are recognised in the Company’s
consolidated financial statements only to the extent of interests in the associate or joint venture that are
not related to the Company.
2.7 Revenue recognition
Revenue is measured at the fair value of the
consideration received or receivable. Revenue is reduced for customer returns, rebates and other
similar allowances.
2.7.1 Sale of goods
Revenue from the sale of goods is recognised
when all the following conditions are satisfied:
a. The Company has transferred to the buyer the significant risks and rewards of ownership of the goods.
b. The Company retains neither continuing managerial involvement to the degree
usually associated with ownership nor
effective control over the goods sold;
c. The amount of revenue can be measured reliably;
d. It is probable that the economic benefits associated with the transaction will flow to the Company; and
e. The costs incurred or to be incurred in respect of the transaction can be measured reliably.
2.7.2 Rendering of services
Revenue from a contract to provide services
is recognised by reference to the stage of
completion of the contract.
2.7.3 Dividend and interest income
Dividend income from investments is
recognised when the shareholder’s right
Notes to Consolidated Financial Statementsfor the year ended March 31, 2018
(All amount in H crore, unless otherwise stated)

Vardhman Textiles Ltd. Annual Report 2017-18180
to receive payment has been established
(provided that it is probable that the economic
benefits will flow to the Company and the amount of income can be measured reliably).
Interest income from a financial asset is recognised when it is probable that the
economic benefits will flow to the Company and the amount of income can be measured
reliably. Interest income is accrued on a time proportion basis, by reference to the principal
outstanding and at the effective interest
rate applicable, which is the rate that exactly discounts estimated future cash receipts
through the expected life of the financial asset to that asset’s net carrying amount on initial
recognition.
2.7.4 Rental income
The Company’s policy for recognition of
revenue from operating leases is described
below:-
2.7.4.1 Leasing
Leases are classified as finance leases whenever the terms of the lease
transfer substantially all the risks and
rewards of ownership to the lessee. All other leases are classified as operating leases.
2.7.4.2 The Group as lessor
Rental income from operating leases
is generally recognised on a straight-
line basis over the term of the relevant
lease. Where the rentals are structured solely to increase in line with expected general inflation to compensate for the Company’s expected inflationary cost increases, such increases are
recognised in the year in which such
benefits accrue. Initial direct costs incurred in negotiating and arranging
an operating lease are added to the
carrying amount of the leased asset
and recognised on a straight-line basis
over the lease term.
2.7.4.3 The Group as lessee
Rental expense from operating leases is generally recognised on a straight-
line basis over the term of the relevant
lease. Where the rentals are structured solely to increase in line with expected general inflation to compensate for the lessor’s expected inflationary cost increases, such increases are
recognised in the year in which such
benefits accrue. Contingent rentals arising under operating leases are
recognised as an expense in the period in which they are incurred.
In the event that lease incentives
are received to enter into operating
leases, such incentives are recognised
as a liability. The aggregate benefit of incentives is recognised as a reduction
of rental expense on a straight-line basis, except where another systematic basis is more representative of the time
pattern in which economic benefits from the leased asset are consumed.
2.8 Government grants
Government grants are not recognised until there is
reasonable assurance that the Company will comply
with the conditions attaching to them and that the
grants will be received.
Government grants are recognised in profit or loss on a systematic basis over the periods in which the
Company recognises as expenses the related costs for which the grants are intended to compensate.
Specifically, government grants whose primary condition is that the Company should purchase,
construct or otherwise acquire non-current assets are
recognised as deferred revenue in the balance sheet
Notes to Consolidated Financial Statementsfor the year ended March 31, 2018
(All amount in H crore, unless otherwise stated)

Corporate Overview Statutory Reports Financial Statements Notice 181
and transferred to profit or loss on a systematic and rational basis over the useful lives of the related assets.
Government grants that are receivable as
compensation for expenses or losses already incurred or for the purpose of giving immediate
financial support to the Company with no future related costs are recognised in profit or loss in the period in which they become receivable.
2.9 Borrowing costs
Borrowing costs directly attributable to the
acquisition, construction or production of qualifying
assets, which are assets that necessarily take a
substantial period of time to get ready for their
intended use or sale, are added to the cost of those
assets, until such time as the assets are substantially
ready for their intended use or sale.
Interest income earned on the temporary investment
of specific borrowings pending their expenditure on qualifying assets is deducted from the borrowing
costs eligible for capitalisation.
2.10 Foreign currencies
In preparing the financial statements of the Group, transactions in currencies other than the entity’s
functional currency (foreign currencies) are
recognised at the rates of exchange prevailing at the dates of the transactions. At the end of each reporting period, monetary items denominated
in foreign currencies are retranslated at the rates
prevailing at that date. Non-monetary items carried at fair value that are denominated in foreign currencies
are retranslated at the rates prevailing at the date
when the fair value was determined. Non-monetary items that are measured in terms of historical cost in
a foreign currency are not retranslated.
2.11 Employee benefits
2.11.1Retirement benefit costs and terminationbenefits
Payments to defined contribution retirement benefit plans are recognised as an expense
when employees have rendered service
entitling them to the contributions.
For defined benefit retirement benefit plans, the cost of providing benefits is determined using the projected unit credit method, with actuarial
valuations being carried out at the end of each
annual reporting period. Re-measurement, comprising actuarial gains and losses, the effect
of the changes to the asset ceiling (if applicable)
and the return on plan assets (excluding net interest), is reflected immediately in the balance sheet with a charge or credit recognised in
other comprehensive income in the period in
which they occur. Re-measurement recognised in other comprehensive income is reflected immediately in retained earnings and is not
reclassified to profit or loss. Past service cost is recognised in profit or loss in the period of a plan amendment. Net interest is calculated by applying the discount rate at the beginning of
the period to the net defined benefit liability or asset. Defined benefit costs are categorised as follows:
a. service cost (including current service cost, past service cost, as well as gains and losses
on curtailments and settlements);
b. net interest expense or income; and
c. re-measurement
The Company presents the first two components of defined benefit costs in profit or loss in the line item ‘Employee benefits expense’. Curtailment gains and losses are accounted for as past service costs.
The retirement benefit obligation recognised in the balance sheet represents the actual
deficit or surplus in the Company’s defined benefit plans. Any surplus resulting from this calculation is limited to the present value of
any economic benefits available in the form of refunds from the plans or reductions in future
contributions to the plans.
Notes to Consolidated Financial Statementsfor the year ended March 31, 2018
(All amount in H crore, unless otherwise stated)

Vardhman Textiles Ltd. Annual Report 2017-18182
A liability for a termination benefit is recognised at the earlier of when the entity can no longer
withdraw the offer of the termination benefit and when the entity recognises any related
restructuring costs.
2.11.2 Short-term and other long-term employee
benefits
A liability is recognised for benefits accruing to employees in respect of wages and salaries, and
annual leave in the period the related service is
rendered at the undiscounted amount of the
benefits expected to be paid in exchange for that service.
Liabilities recognised in respect of short-term employee benefits are measured at the undiscounted amount of the benefits expected to be paid in exchange for the related service.
Liabilities recognised in respect of other long-term employee benefits are measured at the present value of the estimated future cash
outflows expected to be made by the Company in respect of services provided by employees
up to the reporting date.
2.12 Share-based payment arrangements
Share-based payment transactions of the Company
Equity-settled share-based payments to employees
and others providing similar services are measured
at the fair value of the equity instruments at the grant
date. Details regarding the determination of the fair value of equity-settled share-based transactions are
set out in note no. 44.
The fair value determined at the grant date of the
equity-settled share-based payments is expensed on a straight-line basis over the vesting period, based on
the Company’s estimate of equity instruments that
will eventually vest, with a corresponding increase
in equity. At the end of each reporting period, the Company revises its estimate of the number of equity
instruments expected to vest. The impact of the revision of the original estimates, if any, is recognised
in profit or loss such that the cumulative expense reflects the revised estimate, with a corresponding adjustment to the equity-settled share options
outstanding account.
2.13 Taxation
Income tax expense represents the sum of the tax currently payable and deferred tax.
2.13.1 Current tax
The tax currently payable is based on taxable profit for the year. Taxable profit differs from ‘profit before tax’ as reported in the statement of profit and loss because of items of income or expense that are taxable or deductible in other years and items that are never taxable or deductible. The Company’s current tax is calculated using tax rates that have been enacted or substantively enacted by the end of
the reporting period.
Current income tax assets/liabilities for current year is recognized at the amount expected to be paid to and/or recoverable from the
tax authorities, using the tax rates that have been enacted or substantively enacted by the
Balance Sheet.
2.13.2 Deferred tax
Deferred tax is recognised on temporary differences between the carrying amounts
of assets and liabilities in the financial statements and the corresponding tax bases used in the computation of taxable profit. Deferred tax liabilities are generally recognised for all taxable temporary differences. Deferred tax assets are generally recognised for all deductible temporary differences to the
extent that it is probable that taxable profits will be available against which those deductible
temporary differences can be utilised. Such deferred tax assets and liabilities are not recognised if the temporary difference arises
from the initial recognition (other than in a
Notes to Consolidated Financial Statementsfor the year ended March 31, 2018
(All amount in H crore, unless otherwise stated)
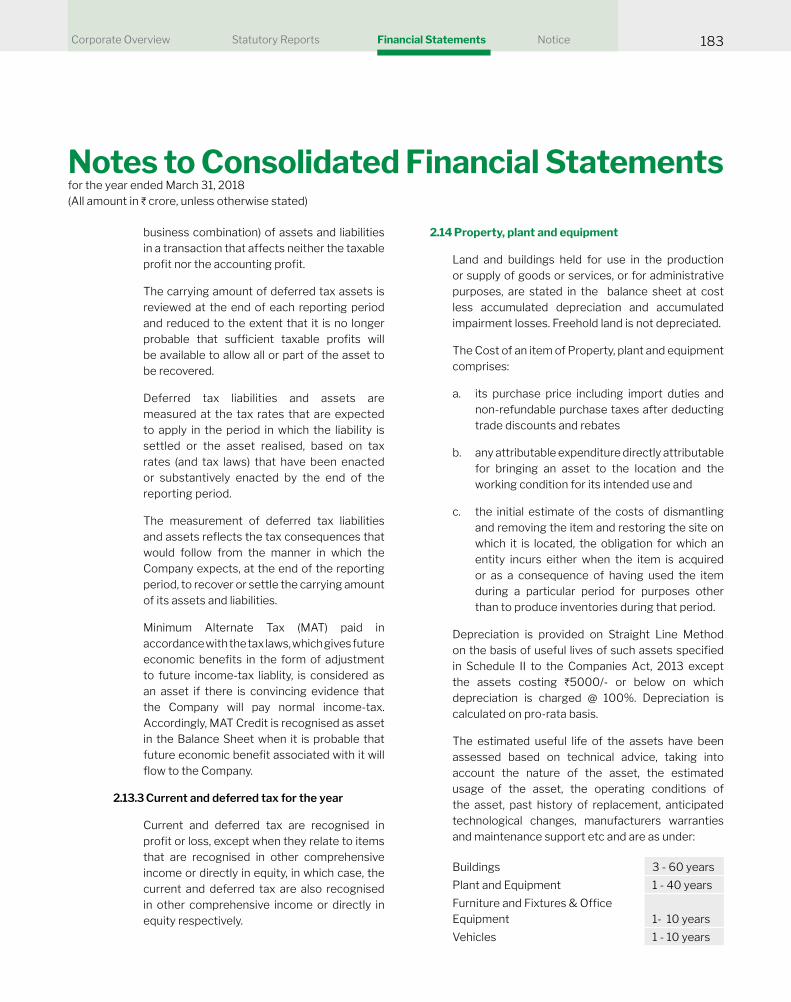
Corporate Overview Statutory Reports Financial Statements Notice 183
business combination) of assets and liabilities
in a transaction that affects neither the taxable profit nor the accounting profit.
The carrying amount of deferred tax assets is reviewed at the end of each reporting period
and reduced to the extent that it is no longer probable that sufficient taxable profits will be available to allow all or part of the asset to
be recovered.
Deferred tax liabilities and assets are measured at the tax rates that are expected to apply in the period in which the liability is
settled or the asset realised, based on tax rates (and tax laws) that have been enacted or substantively enacted by the end of the
reporting period.
The measurement of deferred tax liabilities and assets reflects the tax consequences that would follow from the manner in which the
Company expects, at the end of the reporting period, to recover or settle the carrying amount
of its assets and liabilities.
Minimum Alternate Tax (MAT) paid in accordance with the tax laws, which gives future economic benefits in the form of adjustment to future income-tax liablity, is considered as an asset if there is convincing evidence that
the Company will pay normal income-tax. Accordingly, MAT Credit is recognised as asset
in the Balance Sheet when it is probable that
future economic benefit associated with it will flow to the Company.
2.13.3 Current and deferred tax for the year
Current and deferred tax are recognised in profit or loss, except when they relate to items that are recognised in other comprehensive
income or directly in equity, in which case, the
current and deferred tax are also recognised in other comprehensive income or directly in
equity respectively.
2.14 Property, plant and equipment
Land and buildings held for use in the production or supply of goods or services, or for administrative
purposes, are stated in the balance sheet at cost
less accumulated depreciation and accumulated
impairment losses. Freehold land is not depreciated.
The Cost of an item of Property, plant and equipment
comprises:
a. its purchase price including import duties and non-refundable purchase taxes after deducting trade discounts and rebates
b. any attributable expenditure directly attributable for bringing an asset to the location and the
working condition for its intended use and
c. the initial estimate of the costs of dismantling and removing the item and restoring the site on
which it is located, the obligation for which an
entity incurs either when the item is acquired
or as a consequence of having used the item
during a particular period for purposes other
than to produce inventories during that period.
Depreciation is provided on Straight Line Method on the basis of useful lives of such assets specified in Schedule II to the Companies Act, 2013 except the assets costing H5000/- or below on which
depreciation is charged @ 100%. Depreciation is calculated on pro-rata basis.
The estimated useful life of the assets have been
assessed based on technical advice, taking into
account the nature of the asset, the estimated
usage of the asset, the operating conditions of
the asset, past history of replacement, anticipated
technological changes, manufacturers warranties
and maintenance support etc and are as under:
Buildings 3 - 60 years
Plant and Equipment 1 - 40 years
Furniture and Fixtures & Office Equipment 1- 10 years
Vehicles 1 - 10 years
Notes to Consolidated Financial Statementsfor the year ended March 31, 2018
(All amount in H crore, unless otherwise stated)

Vardhman Textiles Ltd. Annual Report 2017-18184
Advances paid towards the acquisition of property,
plant and equipment outstanding at each balance
sheet date is classified as capital advances under other non-current assets and the cost of assets
not put to use before such date are disclosed under
‘Capital work-in-progress’. Subsequent expenditures relating to property, plant and equipment is capitalized
only when it is probable that future economic benefits associated with these will flow to the Company and the cost of the item can be measured reliably. Repairs and maintenance costs are recognized in net profit in the statement of profit and loss when incurred. The cost and related accumulated depreciation are
eliminated from the financial statements upon sale or retirement of the asset and the resultant gains or
losses are recognized in the statement of profit and loss. Assets to be disposed off are reported at the lower of the carrying value or the fair value less cost
to sell.
Depreciation is recognised so as to write off the cost
of assets (other than freehold land and properties
under construction) less their residual values over
their useful lives, using the straight-line method. The estimated useful lives, residual values and
depreciation method are reviewed at the end of each
reporting period, with the effect of any changes in
estimate accounted for on a prospective basis.
2.15 Intangible assets
2.15.1 Intangible assets acquired separately
Intangible assets with finite useful lives that are acquired separately are carried at cost less
accumulated amortisation and accumulated
impairment losses. Amortisation is recognised on a straight-line basis over their estimated
useful lives. The estimated useful life and amortisation method are reviewed at the
end of each reporting period, with the effect
of any changes in estimate being accounted
for on a prospective basis. Intangible assets with indefinite useful lives that are acquired separately are carried at cost less accumulated
impairment losses.
2.15.2 De-recognition of intangible assets
An intangible asset is derecognised on
disposal, or when no future economic benefits are expected from use or disposal. Gains or losses arising from derecognition of an
intangible asset, measured as the difference
between the net disposal proceeds and the
carrying amount of the asset, are recognised in
profit or loss when the asset is derecognised.
2.15.3 Useful lives of intangible assets
Estimated useful lives of the intangible assets
are as follows:
Computer softwares 6 years
Contribution to Common Effluent Treatment Plant (CETP)
5 years
Right to use power lines 5 Years
2.16 Impairment of tangible and intangible assets other
than goodwill
At the end of each reporting period, the Company
reviews the carrying amounts of its tangible and
intangible assets to determine whether there is
any indication that those assets have suffered an
impairment loss. If any such indication exists, the recoverable amount of the asset is estimated in
order to determine the extent of the impairment loss (if any). When it is not possible to estimate the recoverable amount of an individual asset, the
Company estimates the recoverable amount of the
cash-generating unit to which the asset belongs. When a reasonable and consistent basis of allocation
can be identified, corporate assets are also allocated to individual cash-generating units, or otherwise
they are allocated to the smallest Company of
cash-generating units for which a reasonable and
consistent allocation basis can be identified.
Intangible assets with indefinite useful lives and intangible assets not yet available for use are tested
for impairment at least annually, and whenever there
is an indication that the asset may be impaired.
Notes to Consolidated Financial Statementsfor the year ended March 31, 2018
(All amount in H crore, unless otherwise stated)

Corporate Overview Statutory Reports Financial Statements Notice 185
Recoverable amount is the higher of fair value less
costs of disposal and value in use. In assessing value in use, the estimated future cash flows are discounted to their present value using a pre-tax discount rate that reflects current market assessments of the time value of money and the risks specific to the asset for which the estimates of future cash flows have not been adjusted.
If the recoverable amount of an asset (or cash-
generating unit) is estimated to be less than its
carrying amount, the carrying amount of the asset (or
cash-generating unit) is reduced to its recoverable
amount. An impairment loss is recognised immediately in profit or loss.
When an impairment loss subsequently reverses, the
carrying amount of the asset (or a cash-generating
unit) is increased to the revised estimate of its
recoverable amount, but so that the increased carrying
amount does not exceed the carrying amount that would have been determined had no impairment loss
been recognised for the asset (or cash-generating
unit) in prior years. A reversal of an impairment loss is recognised immediately in profit or loss.
2.17 Inventories
Inventories are valued at cost or net realizable value,
whichever is lower. The cost in respect of the various items of inventory is computed as under:
In case of raw materials at weighted average cost
plus direct expenses. The cost includes cost of purchase and other costs incurred in bringing the
inventories to their present location and condition.
In case of stores and spares at weighted average
cost plus direct expenses. The cost includes cost of purchase and other costs incurred in bringing the
inventories to their present location and condition.
In case of work in progress at raw material cost
plus conversion costs depending upon the stage of
completion.
In case of finished goods at raw material cost plus conversion costs, packing cost, non recoverable
indirect taxes (if applicable) and other overheads incurred to bring the goods to their present location
and condition.
In case of by-products at estimated realizable value
Net realizable value is the estimated selling price in
ordinary course of business, less estimated costs of
completion and the estimated costs necessary to
make the sale.
2.18 Provisions and contingent liablities
Provisions are recognised when the Company has a
present obligation (legal or constructive) as a result
of a past event, it is probable that the Company will
be required to settle the obligation, and a reliable
estimate can be made of the amount of the obligation.
The amount recognised as a provision is the best
estimate of the consideration required to settle the
present obligation at the end of the reporting period,
taking into account the risks and uncertainties
surrounding the obligation. When a provision is measured using the cash flows estimated to settle the present obligation, its carrying amount is the
present value of those cash flows (when the effect of the time value of money is material).
When some or all of economic benefits required to settle a provision are expected to be recovered from a third party, a receivable is recognised as on
asset if it is virtually certain that reimbursements
will be received and amount of the receivable can be
measured reliably.
A disclosure for a contingent liablity is made when
there is a possible obligation or a present obligation
thay may, but probably will not, require an outflow of resources. When there is a possible obligation or a present obligation that the likelihood of outflow of resources is remote, no provision or disclosure is made.
2.19 Financial instruments
Financial assets and financial liabilities are recognised when a Company entity becomes a party
to the contractual provisions of the instruments.
Notes to Consolidated Financial Statementsfor the year ended March 31, 2018
(All amount in H crore, unless otherwise stated)

Vardhman Textiles Ltd. Annual Report 2017-18186
Financial assets and financial liabilities are initially measured at fair value. Transaction costs that are directly attributable to the acquisition or issue of
financial assets and financial liabilities (other than financial assets and financial liabilities at fair value through profit or loss) are added to or deducted from the fair value of the financial assets or financial liabilities, as appropriate, on initial recognition. Transaction costs directly attributable to the
acquisition of financial assets or financial liabilities at fair value through profit or loss are recognised immediately in profit or loss.
2.19.1 Financial assets
All regular way purchases or sales of financial assets are recognised and derecognised on
a trade date basis. Regular way purchases or sales are purchases or sales of financial assets that require delivery of assets within the time
frame established by regulation or convention
in the marketplace.
All recognised financial assets are subsequently measured in their entirety at
either amortised cost or fair value, depending
on the classification of the financial assets
2.19.1.1Classificationoffinancialassets
Financial instruments that meet the
following conditions are subsequently
measured at amortised cost (except for debt instruments that are designated
as at fair value through profit or loss on initial recognition):
a. the asset is held within a business model whose objective is to
hold assets in order to collect
contractual cash flows; and
b. the contractual terms of the instrument give rise on specified dates to cash flows that are solely payments of principal and interest
on the principal amount outstanding
Financial instruments that meet the
following conditions are subsequently
measured at fair value through other
comprehensive income (except for debt instruments that are designated
as at fair value through profit or loss on initial recognition):
a. the asset is held within a business model whose objective is achieved
both by collecting contractual cash
flows and selling financial assets; and
b. the contractual terms of the instrument give rise on specified dates to cash flows that are solely payments of principal and
interest on the principal amount
outstanding.
Interest income is recognised in profit or loss for instruments measured at Fair
value through other comprehensive
income (FVTOCI). All other financial assets are subsequently measured at
fair value.
2.19.1.2 Effective interest method
The effective interest method is a
method of calculating the amortised
cost of a debt instrument and of
allocating interest income over the
relevant period. The effective interest rate is the rate that exactly discounts estimated future cash receipts (including
all fees and points paid or received that
form an integral part of the effective
interest rate, transaction costs and
other premiums or discounts) through
the expected life of the debt instrument, or, where appropriate, a shorter period,
to the net carrying amount on initial
recognition.
Income is recognised on an effective
interest basis for debt instruments
Notes to Consolidated Financial Statementsfor the year ended March 31, 2018
(All amount in H crore, unless otherwise stated)

Corporate Overview Statutory Reports Financial Statements Notice 187
other than those financial assets classified as at FVTPL. Interest income is recognised in profit or loss and is included in the “Other income” line item.
2.19.1.3 Investments in equity instruments
measured at fair value through other
comprehensive income (FVTOCI)
On initial recognition, the Company
can make an irrevocable election (on
an instrument-by-instrument basis)
to present the subsequent changes
in fair value in other comprehensive
income pertaining to investments in
equity instruments. This election is not permitted if the equity investment is held
for trading. These elected investments are initially measured at fair value plus
transaction costs. Subsequently, they are measured at fair value with gains and
losses arising from changes in fair value
recognised in other comprehensive
income and accumulated in the ‘Reserve
for equity instruments through other
comprehensive income’. The cumulative gain or loss is not reclassified to profit or loss on disposal of the investments.
A financial asset is held for trading if:
a. it has been acquired principally for the purpose of selling it in the near
term; or
b. on initial recognition it is part of a portfolio of identified financial instruments that the Company
manages together and has a recent
actual pattern of short-term profit-taking; or
c. it is a derivative that is not designated and effective as a
hedging instrument or a financial guarantee.
Dividends on these investments in
equity instruments are recognised in
profit or loss when the Company’s right to receive the dividends is established,
it is probable that the economic
benefits associated with the dividend will flow to the entity, the dividend does not represent a recovery of part of cost
of the investment and the amount of
dividend can be measured reliably. Dividends recognised in profit or loss are included in the ‘Other income’
line item.
2.19.1.4 Financial assets at fair value through
profitorloss(FVTPL)
Investments in equity instruments
are classified as at FVTPL, unless the Company irrevocably elects on initial
recognition to present subsequent
changes in fair value in other
comprehensive income for investments
in equity instruments which are not held
for trading.
Debt instruments that meet the
amortised cost criteria or the FVTOCI criteria but are designated as at FVTPL are measured at FVTPL.
A financial asset that meets the amortised cost criteria or debt
instruments that meet the FVTOCI criteria may be designated as at
FVTPL upon initial recognition if such designation eliminates or significantly reduces a measurement or recognition
inconsistency that would arise from
measuring assets or liabilities or
recognising the gains and losses on
them on different bases. The Company has designated debt instrument
as at FVTPL.
Notes to Consolidated Financial Statementsfor the year ended March 31, 2018
(All amount in H crore, unless otherwise stated)

Vardhman Textiles Ltd. Annual Report 2017-18188
Financial assets at FVTPL are measured at fair value at the end of
each reporting period, with any gains
or losses arising on remeasurement
recognised in profit or loss. The net gain or loss recognised in profit or loss incorporates any dividend or interest
earned on the financial asset and is included in the ‘Other income’ line item. Dividend on financial assets at FVTPL is recognised when the Company’s right
to receive the dividends is established,
it is probable that the economic
benefits associated with the dividend will flow to the entity, the dividend does not represent a recovery of part of cost
of the investment and the amount of
dividend can be measured reliably.
2.19.1.5 Impairmentoffinancialassets
The Company applies the expected credit loss model for recognising impairment
loss on financial assets measured at amortised cost, debt instruments
at FVTOCI, lease receivables, trade receivables, other contractual rights to
receive cash or other financial asset not designated as at FVTPL.
Expected credit losses are the weighted average of credit losses with the
respective risks of default occurring as
the weights. Credit loss is the difference between all contractual cash flows that are due to the Company in accordance
with the contract and all the cash flows that the Company expects to receive (i.e. all cash shortfalls), discounted at the original effective interest rate
(or credit-adjusted effective interest
rate for purchased or originated
credit-impaired financial assets). The Company estimates cash flows by considering all contractual terms of
the financial instrument (for example,
prepayment, extension, call and similar options) through the expected life of that financial instrument.
When making the assessment of
whether there has been a significant increase in credit risk since initial
recognition, the Company uses the
change in the risk of a default occurring
over the expected life of the financial instrument instead of the change in the
amount of expected credit losses. To make that assessment, the Company
compares the risk of a default occurring
on the financial instrument as at the reporting date with the risk of a default
occurring on the financial instrument as at the date of initial recognition and
considers reasonable and supportable
information, that is available without
undue cost or effort, that is indicative of
significant increases in credit risk since initial recognition.
For trade receivables or any contractual
right to receive cash or another financial asset that result from transactions that
are within the scope of Ind AS 11 and Ind
AS 18, the Company always measures
the loss allowance at an amount equal
to lifetime expected credit losses.
Further, for the purpose of measuring
lifetime expected credit loss allowance for trade receivables, the Group has
used a practical expedient as permitted under Ind AS 109. The Group follows simplified approach for recognition of impairment loss allowance on
trade recievables. The application of simplified approach does not require the Group to track changes in credit
risk. Rather, it recognises impairment loss allowance based on lifetime ECL’s at each reporting date, right from its
initial recognition.
Notes to Consolidated Financial Statementsfor the year ended March 31, 2018
(All amount in H crore, unless otherwise stated)

Corporate Overview Statutory Reports Financial Statements Notice 189
The impairment requirements for the
recognition and measurement of a
loss allowance are equally applied to
debt instruments at FVTOCI except that the loss allowance is recognised
in other comprehensive income and is
not reduced from the carrying amount
in the balance sheet.
2.19.1.6Derecognitionoffinancialassets
The Company derecognises a financial asset when the contractual rights to
the cash flows from the asset expire, or when it transfers the financial asset and substantially all the risks and rewards
of ownership of the asset to another
party. If the Company neither transfers nor retains substantially all the risks and
rewards of ownership and continues
to control the transferred asset, the
Company recognises its retained
interest in the asset and an associated
liability for amounts it may have to pay. If the Company retains substantially
all the risks and rewards of ownership
of a transferred financial asset, the Company continues to recognise the
financial asset and also recognises a collateralised borrowing for the
proceeds received.
On derecognition of a financial asset in its entirety, the difference between
the asset’s carrying amount and the
sum of the consideration received and
receivable and the cumulative gain or
loss that had been recognised in other
comprehensive income and accumulated
in equity is recognised in profit or loss if such gain or loss would have otherwise
been recognised in profit or loss on disposal of that financial asset.
On derecognition of a financial asset other than in its entirety (e.g. when
the Company retains an option to
repurchase part of a transferred asset),
the Company allocates the previous
carrying amount of the financial asset between the part it continues
to recognise under continuing
involvement, and the part it no longer
recognises on the basis of the relative
fair values of those parts on the date of
the transfer. The difference between the carrying amount allocated to the
part that is no longer recognised and
the sum of the consideration received
for the part no longer recognised and
any cumulative gain or loss allocated
to it that had been recognised in other
comprehensive income is recognised
in profit or loss if such gain or loss would have otherwise been recognised
in profit or loss on disposal of that financial asset. A cumulative gain or loss that had been recognised in other
comprehensive income is allocated
between the part that continues to
be recognised and the part that is no
longer recognised on the basis of the
relative fair values of those parts.
2.19.1.7 Foreign exchange gains and losses
The fair value of financial assets denominated in a foreign currency is
determined in that foreign currency and
translated at the spot rate at the end of
each reporting period.
For foreign currency denominated
financial assets measured at amortised cost and FVTPL, the exchange differences are recognised in profit or loss.
2.19.2 Financial liabilities
All financial liabilities are subsequently measured at amortised cost using the effective
interest method or at FVTPL.
Notes to Consolidated Financial Statementsfor the year ended March 31, 2018
(All amount in H crore, unless otherwise stated)

Vardhman Textiles Ltd. Annual Report 2017-18190
2.19.2.1 Financial liabilities at fair value through
profitandloss(FVTPL)
Financial liabilities are classified as at FVTPL when the financial liability is either contingent consideration
recognised by the Company as an
acquirer in a business combination to
which Ind AS 103 applies or is held for
trading or it is designated as at FVTPL.
A financial liability is classified as held for trading if:
a. it has been incurred principally for the purpose of repurchasing it in
the near term; or
b. on initial recognition it is part of a portfolio of identified financial instruments that the Company
manages together and has a recent
actual pattern of short-term profit-taking; or
c. it is a derivative that is not designated and effective as a
hedging instrument.
2.19.2.2 Financial liabilities subsequently
measured at amortised cost
Financial liabilities that are not held-for-
trading and are not designated as at
FVTPL are measured at amortised cost at the end of subsequent accounting
periods. The carrying amounts of financial liabilities that are subsequently measured at amortised cost are
determined based on the effective
interest method. Interest expense that is not capitalised as part of costs of an
asset is included in the ‘Finance costs’
line item.
The effective interest method is a
method of calculating the amortised
cost of a financial liability and of
allocating interest expense over the relevant period. The effective interest rate is the rate that exactly discounts estimated future cash payments
(including all fees and points paid or
received that form an integral part of
the effective interest rate, transaction
costs and other premiums or discounts)
through the expected life of the financial liability, or (where appropriate) a shorter period, to the net carrying
amount on initial recognition.
2.19.2.3Derecognitionoffinancialliabilities
The Company derecognises financial liabilities when, and only when, the
Company’s obligations are discharged,
cancelled or have expired. An exchange between with a lender of debt instruments
with substantially different terms is
accounted for as an extinguishment of the original financial liability and the recognition of a new financial liability. Similarly, a substantial modification of the terms of an existing financial liability (whether or not attributable to
the financial difficulty of the debtor) is accounted for as an extinguishment of the original financial liability and the recognition of a new financial liability. The difference between the carrying amount
of the financial liability derecognised and the consideration paid and payable is
recognised in profit or loss.
2.19.3Derivativefinancialinstruments
The Company enters into a variety of derivative
financial instruments to manage its exposure to foreign exchange rate risks and to manage its exposure to imported raw material price risk including foreign exchange forward contracts and commodities future contracts. Further details of derivative financial instruments are disclosed in note 37.
Notes to Consolidated Financial Statementsfor the year ended March 31, 2018
(All amount in H crore, unless otherwise stated)

Corporate Overview Statutory Reports Financial Statements Notice 191
Derivatives are initially recognised at fair value
at the date the derivative contracts are entered
into and are subsequently remeasured to their
fair value at the end of each reporting period. The resulting gain or loss is recognised in
profit or loss immediately unless the derivative is designated and effective as a hedging
instrument, in which event the timing of the
recognition in profit or loss depends on the nature of the hedging relationship and the
nature of the hedged item.
2.19.4 Equity instrument
Equity instrument are any contract that
evidences a residual interest in the assets of an
equity after deducting all of its liablities.
Debt or equity instruments issued by the
Company are classifed as either financial liablities or as equity in accordance with the substance of
the contractual arrangements and the definitions of a financial liablity and an equity instrument
Ordinary shares are classified as equity. Incremental costs directly attributable to the
issuance of new ordinary shares and share
options are recognised as a deduction from
equity, net of any tax effects.
The equity shares of the Company held by it
through a trust are presented as deduction from
total equity, until they are cancelled or sold.
2.20 Earnings per share
Basic earnings per equity share are computed by
dividing the net profit attributable to the equity holders of the Company by the weighted average
number of equity shares outstanding during the
period. Diluted earnings per equity share is computed by dividing the net profit attributable to the equity holders of the Company by the weighted average
number of equity shares considered for deriving
basic earnings per equity share and also the weighted
average number of equity shares that could have
been issued upon conversion of all dilutive potential
equity shares. The dilutive potential equity shares are adjusted for the proceeds receivable had the
equity shares been actually issued at fair value (i.e. the average market value of the outstanding equity
shares). Dilutive potential equity shares are deemed converted as of the beginning of the period, unless
issued at a later date. Dilutive potential equity shares are determined independently for each period
presented.
2.21 Significant accounting judgements, estimates and assumptions
In the application of the Company’s accounting
policies, which are described as stated above, the
directors of the Company are required to make
judgements, estimates and assumptions about the
carrying amounts of assets and liabilities that are not
readily apparent from other sources. The estimates and associated assumptions are based on historical
experience and other factors that are considered to be relevant. Actual results may differ from these estimates.
The estimates and underlying assumptions
are reviewed on an ongoing basis. Revisions to accounting estimates are recognized in the period
in which the estimate is revised if the revision
affects only the period of the revision and future
periods if the revision affects both current and
future periods.
2.21.1Significantinfluenceoverassociates
Note 45 describe the entities as associates of
the Group as the Group owns:-
a. in Vardhman Special Steels Limited (VSSL):-
27.20 percent ownership interest
b. in Vardhman Spinning and General Mills
Limited(VSGM):-
50.00 percent ownership interest
c. in Vardhman Yarns and Threads Limited(VYTL):-
11.00 percent ownership interest
The group has significant influence in over VSSL and VSGM associates above by the
Notes to Consolidated Financial Statementsfor the year ended March 31, 2018
(All amount in H crore, unless otherwise stated)

Vardhman Textiles Ltd. Annual Report 2017-18192
virtue of ownership interest. However in case of VYTL significant influence is not only by the virtue of ownership interest but also due
to contractual right to appoint managing
director and no significant business decisions relating to debts restructuring and business
restructuring in the above said associate can
be implemented without prior approval of the
Company.
2.21.2 Control over Joint Venture:-
Vardhman Nisshimboo Garments Limited (VNGL) is a company with a seperate legal entity. There is no contractual arrangement or any other facts and circumstances that indicate
that the parties to the joint arrangement have
rights/control on the assets and obligations
for the liabilities of the joint arrangement. Accordingly (VNGL) is classified as a joint venture of the Group. See note 45.
2.21.3 Key sources of uncertainty
In the application of the Company accounting
policies, the management of the Company
is required to make judgements, estimates
and assumptions about the carrying amounts
of assets and liabilities that are not readily
apparent from other sources. The estimates and associated assumptions are based on
historical experience and other factors that are considered to be relevant. Actual results may differ from these estimates.
The estimates and underlying assumptions
are reviewed on an ongoing basis. Revisions to accounting estimates are recognised in the
period in which the estimate is revised if the
revision affects only that period or in the period
of the revision and future periods if the revision
affects both current and future periods.
The following are the areas of estimation
uncertainty and critical judgements that the
management has made in the process of
applying the Company’s accounting policies
and that have the most significant effect on the amounts recognised in the financial statements:
2.21.4Definedbenefitplans
The cost of the defined benefit plan and other post-employment benefits and the present value of such obligation are determined using
actuarial valuations. An actuarial valuation involves making various assumptions that
may differ from actual developments in the
future. These include the determination of the discount rate, future, salary increases, mortality
rates and future pension increases. Due to the complexities involved in the valuation and its long-term nature, a defined benefit obligation is highly sensitive to changes in these
assumptions. All assumptions are reviewed at each reporting date.
2.21.5 Useful lives of depreciable tangible assets
and intangible assets
Management reviews the useful lives of
depreciable/amortisable assets at each
reporting date.
As at March 31, 2018 management assessed
that the useful lives represent the expected utility of the assets to the Company.
During the financial year, the directors determined that the useful lives of certain
items of plant and equipment should be
different. Based on technical evaluation and market consideration, the Company has, with
effect from April 1, 2017, revised the estimated
useful of life of general plant and machinery
from 7.5 years to 10 years.
The financial effect of this reassessment, assuming the assets are held until the end of
their estimated useful lives, is decrease in the
depreciation expense in the current financial year by H104.20 crore.
Notes to Consolidated Financial Statementsfor the year ended March 31, 2018
(All amount in H crore, unless otherwise stated)

Corporate Overview Statutory Reports Financial Statements Notice 193
2.21.6 Fair Value measurements and valuation
processes
Some of the Company’s assets and liabilities
are measured at fair value for financial reporting purposes. The board of directors of the Company approves the fair values
determined by the Chief Financial Officer of the Company including determining the
appropriate valuation techniques and inputs
for fair value measurements.
In estimating the fair value of an asset or liability,
the Company uses market-observable data to
the extent is available. Where Level 1 inputs are not available, the Company engages third party
qualified valuers to perform the valuation. The Chief financial officer works closely with the qualified external valuers to establish appropriate valuation techniques and inputs to the model.
Information about the valuation techniques
and inputs used in determining the fair value
of various assets and liabilities are disclosed in
notes 37.
2.21.7 Contingent Liability
In ordinary course of business, the Group
faces claims by various parties. The Company annually assesses such claims and monitors the
legal environment on an ongoing basis, with the
assistance of external legal counsel, wherever necessary. The Company records a liability for
any claims where a potential loss probable and
capable of being estimated and discloses such
matters in its financial statements, if material. For potential losses that are considered
possible, but not probable, the Company
provides disclosures in the financial statements but does not record a liability in its financial statements unless the loss becomes probable.
2.22 Applicablity of new and revised IND AS
Ministry of Corporate affairs has notified Ind AS 115 ‘Revenue from Contracts with customers’, which
is effective from April 1, 2018. The new standard outlines a single comprehensive control-based
model for revenue recognition and supersedes
current revenue recognition guidance based on
risks or rewards. The Company is evaluating the requirements of Ind AS 115 and its effect of the
financial statements.
Appendix B to Ind AS 21, Foreign currency transactions and advance consideration: On March 28, 2018, Ministry of Corporate Affairs (“MCA”) has notified the Companies (Indian Accounting Standards)
Amendment Rules, 2018 containing Appendix B to Ind AS 21, Foreign currency transactions and advance
consideration which clarifies the date of the transaction for the purpose of determining the exchange rate to use on initial recognition of the related asset, expense or income, when an entity has received or paid advance
consideration in a foreign currency. The amendment will come into force from April 1, 2018.
Notes to Consolidated Financial Statementsfor the year ended March 31, 2018
(All amount in H crore, unless otherwise stated)

Vardhman Textiles Ltd. Annual Report 2017-18194
3A Property, plant and equipment and capital work-in-progress
As at
March 31, 2018
As at
March 31, 2017
Carrying amount of
Freehold land 92.16 87.02 Buildings 735.15 759.22 Plant and equipment 1,750.29 1,685.29 Furniture and fixtures 7.64 8.49 Vehicles 8.39 10.54 Office equipment 20.96 20.75 Total Property, plant and equipment 2,614.59 2,571.31
Capital work-in-progress 105.71 49.03 2,720.30 2,620.34
Freehold
land
Buildings Plant and
equipment
Furniture
and fixturesVehicles Office
equipment
Total
Gross carrying value
Balance as at April 1, 2016 66.24 757.71 2,108.48 9.54 11.61 18.71 2,972.30
Addition 21.70 65.02 221.53 0.53 2.89 18.45 330.12
Disposal / Adjustment (0.92) (6.66) (12.92) (0.05) (0.69) 0.06 (21.17)
Balance at March 31, 2017 87.02 816.07 2,317.09 10.02 13.81 37.22 3,281.24
Addition 5.14 9.55 263.98 0.68 2.10 6.45 287.90
Disposal - (4.08) (56.70) (0.04) (3.63) (1.02) (65.46)
Balance at March 31, 2018 92.16 821.54 2,524.37 10.66 12.28 42.65 3,503.68
Accumulated depreciation
Balance as at April 1, 2016 - 27.28 333.55 1.75 1.67 4.72 368.97
Depreciation - 30.16 299.89 1.46 1.87 5.38 338.76
Disposal/Adjustment - (0.59) (1.64) (1.68) (0.27) 6.37 2.19
Balance at March 31, 2017 - 56.85 631.80 1.53 3.27 16.47 709.92
Depreciation - 30.75 195.56 1.53 1.70 6.19 235.73
Disposal - (1.21) (53.28) (0.04) (1.08) (0.97) (56.57)
Balance at March 31, 2018 - 86.39 774.08 3.02 3.84 21.69 889.08
Carrying amount
Balance as at April 1, 2016 66.24 730.43 1,774.93 7.79 9.94 13.98 2,603.32
Addition 21.70 65.02 221.53 0.53 2.89 18.45 330.12
Disposal/Adjustment (0.92) (6.07) (11.28) 1.63 (0.41) (6.32) (23.37)
Depreciation - (30.16) (299.89) (1.46) (1.87) (5.38) (338.76)
Balance at March 31, 2017 87.02 759.22 1,685.29 8.49 10.54 20.75 2,571.31
Addition 5.14 9.55 263.98 0.68 2.10 6.45 287.90
Disposal - (2.87) (3.42) 0.00 (2.55) (0.05) (8.89)
Depreciation - (30.75) (195.56) (1.53) (1.70) (6.19) (235.73)
Balance at March 31, 2018 92.16 735.15 1,750.29 7.64 8.39 20.96 2,614.59
Notes to Consolidated Financial Statementsfor the year ended March 31, 2018
(All amount in H crore, unless otherwise stated)

Corporate Overview Statutory Reports Financial Statements Notice 195
Notes on property, plant and equipment
1 Freehold land includes H4.38 crore (March 31, 2017 Nil) for the cost of land for which title deeds are yet to be executed in favor of the Company, though the possession thereof has been taken by the Company.
2 Refer to note 18 for information on property, plant and equipment pledged as security by the Company.
3 During the financial year 2017-18, the management had reviewed the useful life of general plant and machinery of textile segment of the Holding Company along with VMT Spinning and Company Limited and had re-estimated that useful life of such plant and machinery should be 10 years instead of 7.5 years. Accordingly,the necessary accounting changes have been done prospectively w.e.f April 1, 2017 as per Ind AS 8 and Ind AS 16.The depreciation expense charged for the year ended March 31, 2018 would have been higher by H104.20 crore had the Company continued with previously estimated useful life for general plant and machinery.
4 Buildings includes H2.48 crore (march 31, 2017: H2.48 crore) cost of residential flats at Mandideep, the land cost of which has not been excluded from this cost. The depreciation for the year has been taken on the entire cost.
3A Property, plant and equipment and capital work-in-progress (contd..)
3B Other intangible assets
As at
March 31, 2018
As at
March 31, 2017
Carrying amount of
Computer softwares 3.75 5.18
Contribution to CETP - 0.13
Right to use power lines 0.06 1.43
3.81 6.74
Computer
softwares
Contribution
to CETP
Right to use
power lines
Total
Gross carrying value
Balance as at April 1, 2016 10.18 0.63 4.50 15.31
Addition 0.65 - - 0.65
Disposal (0.36) - - (0.36)
Balance as at March 31, 2017 10.47 0.63 4.50 15.60
Addition 1.28 - 0.06 1.34
Balance as at March 31, 2018 11.75 0.63 4.56 16.94
Accumulated amortisation
Balance as at April 1, 2016 2.27 0.46 1.50 4.23
Amortisation expenses 3.02 0.04 1.57 4.63
Balance as at March 31, 2017 5.29 0.50 3.07 8.86
Amortisation expenses 2.71 0.13 1.43 4.27
Balance as at March 31, 2018 8.00 0.63 4.50 13.13
Notes to Consolidated Financial Statementsfor the year ended March 31, 2018
(All amount in H crore, unless otherwise stated)

Vardhman Textiles Ltd. Annual Report 2017-18196
ParticularsAs at
March 31, 2018
As at
March 31, 2017
Deemed Cost 12.54 12.59Disposal (0.04) (0.05)Carrying Value at the end 12.50 12.54
4 Goodwill*
* Refer note 2.5
5 Investments in Joint Ventures and Associates
Particulars As at
March 31, 2018
As at
March 31, 2017
5A TRADE INVESTMENTS (at cost/carrying value)
Financial assets carried at cost
a. Break up of investments in associates
(carrying amount determined using equity method of accounting)
(i) Investment in Joint Ventures/ associates
Quoted
99,35,133 (31 March 2017: 60,51,800) Equity shares of H10/- each fully paid
up of Vardhman Special Steels Limited 44.51 17.04
Unquoted
$ 62,69,699 (March 31, 2017: 62,69,699) Equity shares of H10/- each fully
paid up of Vardhman Yarns & Threads Limited (Refer Note 47.5) 53.62 50.44
71,40,000 (March 31, 2017: 71,40,000 ) Equity shares of H10/- each (2.20) (2.38)
3B Other intangible assets (contd..)
Computer
softwares
Contribution
to CETP
Right to use
power lines
Total
Carrying amount
Balance as at April 1, 2016 7.91 0.17 3.00 11.08
Addition 0.65 - - 0.65
Disposal (0.36) - - (0.36)
Amortisation expenses (3.02) (0.04) (1.57) (4.63)
Balance as at March 31, 2017 5.18 0.13 1.43 6.74
Addition 1.28 - 0.06 1.34
Amortisation expenses (2.71) (0.13) (1.43) (4.27)
Balance as at March 31, 2018 3.75 - 0.06 3.81
Note: These intangible assets are not internally generated
Notes to Consolidated Financial Statementsfor the year ended March 31, 2018
(All amount in H crore, unless otherwise stated)

Corporate Overview Statutory Reports Financial Statements Notice 197
5 Investments in Joint Ventures and Associates (contd..)
Particulars As at
March 31, 2018
As at
March 31, 2017
fully paid up of Vardhman Nisshinbo Garments Company Limited
25,000 (March 31, 2017 : 25,000) Equity shares of H10/- each 0.07 0.07
fully paid-up of Vardhman Spinning and General Mills Limited
b. Investment in preference instruments (unquoted)
(i) Investment in joint ventures
1,00,00,000 (March 31, 2017: 1,00,00,000) 10% non-cumulative convertible preference shares of H10/- each fully paid up of Vardhman Nisshinbo Garments Company Limited 10.00 10.00
Total 5(A) 106.00 75.17
5B Other Investment
Financial assets measured at fair value through other comprehensive
income
(i) Investment in equity instruments (unquoted)
41,000 (March 31, 2017: 41,000) Equity-Shares of H10/- each 0.07 0.06
fully paid-up of Shivalik Solid Waste Management Limited
(Section 25 Company)
1,40,625 (March 31, 2017: 1,40,625 ) Equity shares of H10/- each 1.65 1.61
fully paid-up of Nimbua Greenfield (Punjab) Limited
2,225 (March 31, 2017: 2,225) Equity shares of H10/- each fully paid-up
of Devakar Investment & Trading Company Private Limited 0.16 0.12
1,647,525 (March 31, 2017: 1,647,525, 1st April 2015: 16,47,525) Equity Shares of Narmada Clean Tech Limited of H10/- each fully paid up. 4.33 4.43
Other Investments:-
III Financial assets measured at fair value through Profit and loss
(i) Investment in Bonds/ Preference shares/ Debentures/Fixed
Maturity Plans (quoted)
6,660 (March 2017 31, :6,660) 17.38% Non-convertible redeemable cumulative preference shares of H7,500/- each fully paid of IL&FS Financial Services Limited 11.19 11.24
820 (March 31, 2017 820) 16.46% Non Convertible Redeemable cumulative Preference Shares of H7,500/- each fully paid of IL & FS Financial Services Ltd. 1.36 1.27
10,000 (March 31, 2017:10,000) 16.46% Non-convertible redeemable cumulative preference shares of H7,500/- each fully paid of IL&FS Financial Services Limited 16.60 15.66
*NIL (March 31, 2017: 2,500) Principal protected market linked redeemable non-convertible debentures of H1,00,000/- each of ECL Finance Limited - 25.00
Notes to Consolidated Financial Statementsfor the year ended March 31, 2018
(All amount in H crore, unless otherwise stated)

Vardhman Textiles Ltd. Annual Report 2017-18198
5 Investments (Non Current) (contd..)
Particulars As at
March 31, 2018
As at
March 31, 2017
*NIL (March 31, 2017:1,500) Principal protected market linked redeemable non-convertible debentures of H1,00,000/- each of IIFL Wealth Finance Limited - 16.06
*NIL (March 31, 2017: 2,000) Principal protected market linked redeemable non-convertible debentures of H1,00,000/- each of IIFL Wealth Finance Limited - 21.34
100 (March 31, 2017: 100 )Principal protected market linked redeemable non convertible debentures of H1,000,000/- each of
Aspire home Finance ltd 11.68 10.63
100 (March 31, 2017 : Nil) Non-Convertible Debentures of H1,000,000 /
each of JM Financial Products Limited TR-BE-XX Opt IA &IB BR 10.15 -
150 (March 31, 2017 : Nil) Non-Convertible Debentures of H1,000,000 /
each of JM Financial Products Limited TR-BL-IV OPT III BR 15.23 -
6,000 (March 31, 2017 : Nil) Non-Convertible Debentures of H100,000 /
each of ECAP Equities Limited SR-J9J701A 62.19 -
Unquoted
12,50,000 (31st March 2017: Nil ) 8.2% cumulative compulsarily convertible preference shares of Tata motor Finance Limited of H200 each 26.99 -
(ii) Investment in mutual funds (Quoted)
*NIL (March 31, 2017:2,00,00,000 ) units of H10/- each of Reliance fixed horizon fund- XXIX-Series-1 Direct growth plan. - 23.11
*NIL(March 31, 2017:3,00,00,000) units of H10/- each of Reliance fixed horizon fund- XXIX-Series 2- Direct growth plan. - 34.54
*NIL (March 31, 2017:5,00,00,000 ) units of H10/- each of Kotak Fixed Maturity Plans Series 178 Direct Growth - 57.46
5,00,00,000 (March 31, 2017 :NIL) units of H10/- each of Kotak Fixed Maturity Plans Series 216 Direct Growth 50.66 -
*NIL (March 31, 2017:5,00,00,000) units of H10/- each of Birla Sunlife
Fixed Term Plan Series MX (1128 Days) - 57.15
4,00,00,000 (March 31, 2017:NIL) units of H10/- each of Birla Sunlife
Fixed Term Plan Series MX (1140 Days) 40.35 -
2,50,00,000 (March 31, 2017:2,50,00,000 ) units of H10/- each of Birla
Sunlife Fixed Term Plan Series -Growth-Direct (1135 Days) 26.78 25.07
*NIL (March 31, 2017:5,00,00,000 ) units of H10/- each of ICICI Prudential
Fixed Maturity Plans Series 77-1129 Days Plan W Direct Plan Cumulative - 56.58
* NIL(March 31, 2017: 5,00,08,075.344 ) units of H10/- each of Reliance
Fixed Horizon Fund-XXIX- Series 8 Direct Growth Plan - 57.18
* NIL(March 31, 2017:2,20,00,000 ) units of H10/- each of UTI Fixed Term Income Fund Series XXIII-II (1100 Days) Direct Growth Plan - 25.10
Notes to Consolidated Financial Statementsfor the year ended March 31, 2018
(All amount in H crore, unless otherwise stated)

Corporate Overview Statutory Reports Financial Statements Notice 199
5 Investments (Non Current) (contd..)
Particulars As at
March 31, 2018
As at
March 31, 2017
* NIL (March 31, 2017:1,30,00,000 )units of H10/- each of Kotak Fixed Maturity Plans Series 180-1099 Days - 14.72
1,00,00,000 (March 31, 2017:1,00,00,000 )units of H10/- each of UTI Fixed Term Income Fund Series XXIII-VII (1098 Days) Direct Growth Plan 12.09 11.28
3,00,00,000 (March 31, 2017:3,00,00,000 ) units of H10/- each of
Kotak Fixed Maturity Plans Series 191 Direct Growth 35.29 32.94
1,00,00,000 (March 31, 2017:1,00,00,000 ) units of H10/- each of ICICI
Prudential Fixed Maturity Plans Series 78-1115 Days Plan X Direct Plan Cumulative 11.75 10.96
2,50,00,000(March 31, 2017:2,50,00,000 ) units of H10/- each of HDFC Fixed Maturity Plans 1114 Days Direct Growth 29.44 27.50
2,50,00,000(March 31, 2017: NIL) units of H10/- each of HDFC Fixed Maturity Plans 1115 Days Direct Growth 25.32 -
2,50,00,000 (March 31, 2017:2,50,00,000 ) units of H10/- each of SBI
Debt Fund Series- B -36(1131 Days)- Direct Growth 29.21 27.32
2,50,00,000 (March 31, 2017:2,50,00,000) units of H10/- each of SBI
debt Fund Series - Direct - (1170 Day)Growth 26.83 25.17
1,50,00,000 (March 31, 2017: 1,50,00,000) units of H10/- each of UTI Fixed Term Income Fund Series XXIV-XIV (1831 Days)Direct Growth Plan 17.47 16.35
2,50,00,000 (March 31, 2017: 2,50,00,000) units of H10/- each of UTI Fixed Term Income Fund Series XXV-11 (1097 Days)Direct Growth Plan 28.40 26.44
3,50,00,000 (March 31, 2017: 3,50,00,000 ) units of H10/- each of
Kotak Fixed Maturity Plans Series 202 Direct - Growth 37.43 35.07
*NIL(March 31, 2017: 5,00,00,000) units of H10/- each of SBI Debt
Fund Series-B (1105 DAYS) Direct Plan Growth Fixed Maturity Plans - 59.16
* NIL(March 31, 2017: 3,00,00,000) units of H10/- each of ICICI Prudential
Fixed Maturity Plans Series 76-1108 Days Plan V Direct Plan Cumulative - 35.61
5,00,00,000 (March 31, 2017: NIL )units of H10/- each of SBI Debt Fund
Series C10 (1150 DAYS) Direct Plan Growth Fixed Maturity Plans 50.59 -
25,000,000 (March 31, 2017: 25,000,000 ) units of H10/- each of ICICI
Prudential Fixed Maturity Plans Series 80-1233 Days Plan O Direct Plan Cumulative 26.87 25.17
25,000,000 (March 31, 2017: 2,50,00,000 ) units of H10/- each of
Reliance Fixed Horizon Fund- XXXIII- Series 3- Direct Plan Growth Plan 26.90 25.19
2,50,00,000 (March 31, 2017: 2,50,00,000 0) units of H10/- each of
Reliance Fixed Horizon Fund- XXXIIV- Series 4- Direct Plan Growth Plan 26.87 25.16
50,000,000 (March 31, 2017 : NIL) units of H10/- each of ICICI Fixed Maturity Plan Series 82-1203 50.64 -
Notes to Consolidated Financial Statementsfor the year ended March 31, 2018
(All amount in H crore, unless otherwise stated)

Vardhman Textiles Ltd. Annual Report 2017-18200
5 Investments (Non Current) (contd..)
* Investments having maturity period of less than 12 months from March 31, 2018 i.e. the balance sheet date have been reclassified as ‘ Current Investment’ during the year.$ For change in the Company’s ownership interest in Vardhman Yarns and Threads Limited refer note no.47.5^ For change in Company’s ownership interest in Vardhman Special Steels Limited
During the financial year 2017-18 the Group has subscribed to 38,83,333 equity shares of Vardhman Special Steels Limited offered through Right Issue at a price of H50 per share amounting to H19.42 crore.
**Refer Note 37
6A Loans (Non Current)
6B Other financial assets (Non Current)
Particulars As at
March 31, 2018
As at
March 31, 2017
Financial assets at amortized cost
Loan to employees 0.59 0.61 0.59 0.61
Particulars As at
March 31, 2018
As at
March 31, 2017
Financial assets at amortized cost
Fixed Deposits with banks more than twelve months maturity 1.86 1.94 Interest Receivable 0.23 0.11 Other Recoverable 7.31 8.04
9.40 10.09
Particulars As at
March 31, 2018
As at
March 31, 2017
NIL (March 31, 2017: 50,00,000) units of H10/- each of UTI Fixed Term Income Fund Series XXII-VI Growth Plan - 5.98
26,000,000 (March 31, 2017: Nil) units of H10/- each of HDFC Fixed Maturity Plans 1150 Days March 2018 (1) Direct Growth Series -39 26.27
Nil (March 31, 2017 80,00,000) units of H10/- each of DSP Blackrock 3
Years close ended equity fund 11.12
12298.07 (March 31, 2017 Nil) units of H1000/- each of DSP Money
Manager Fund 2.95 -
50,00,000 (March 31, 2017 Nil) units of H10- each of DSP Blackrock
Ace direct growth 4.87 -
Total 5(B) 748.58 858.75
1. Aggregate book value of quoted investments 759.89 869.67
2. Aggregate Market Value of quoted investments 902.41 933.33
3. Aggregate carrying value of unquoted investments 94.69 64.35
Notes to Consolidated Financial Statementsfor the year ended March 31, 2018
(All amount in H crore, unless otherwise stated)

Corporate Overview Statutory Reports Financial Statements Notice 201
Particulars As at
March 31, 2018
As at
March 31, 2017
Non Financial Assets at amortized cost
(unsecured considered good)
Capital advances 37.22 23.47 Balance with government authorities 12.82 13.98 Security deposits 27.71 21.18 Unamortised Lease hold land prepayment 18.85 19.09 Prepaid (Deferred) Expense for employee benefit 0.08 0.06 Prepaid expenses-others 0.63 0.63
97.31 78.41
Particulars As at
March 31, 2018
As at
March 31, 2017
(at cost or net realisable value, whichever is lower)
Raw materials* 1,444.71 991.77 Work-in-progress 150.57 143.22 Finished Goods 509.37 478.85 Stores and Spares* 153.77 139.92 Less: Unrealised profit on consolidation (1.78) (0.95)
2,256.64 1,752.81
*above items include goods in transit as per below
Raw materials 9.38 99.24 Stores and Spares 11.05 14.89
20.43 114.13
7 Other non current assets
8 Inventories
(i) The cost of inventories recognised as an expense during the year in respect of continuing operations was H3,438.28 crore (March 31, 2017: H3,015.80 crore)
(ii) The cost of inventory recognised as an expenses includes H NIL crore (March 31, 2017 H NIL crore) in respect of write down of inventory to net realisable value.
(iii) Refer to Note 18( a) and 23 for information on inventories pledged as security by the Company.
(iv) The method of valuation of inventories has been stated in note 2.17.
Notes to Consolidated Financial Statementsfor the year ended March 31, 2018
(All amount in H crore, unless otherwise stated)

Vardhman Textiles Ltd. Annual Report 2017-18202
9 Other investments (Current)**
Particulars As at
March 31, 2018
As at
March 31, 2017
Financial assets measured at fair value through Profit and loss
(i) Investment in Liquid Funds (Quoted)
*NIL (March 31, 2017: 6492.73 ) units of 1,000/- each of - 0.65
Baroda Pioneer Liquid fund Plan A DDR
NIL (March 31, 2017:26,700.657 ) units of H1,000/- each of Bank of India
Axa Liquid Fund -Direct Plan-Growth - 5.00
NIL (March 31, 2017: 5,17,523.56 ) units of H100/- each of Birla sun life
cash plus-Direct Growth - 13.52
*NIL (March 31, 2017: 0.18) units of H1,000/- each of HDFC Cash management funds-Savings plan-Direct Growth - 0.00
(ii) Investment in Debt Funds/ Monthly Income Plans/Debentures/Bonds/
Preference Shares/Mutual Funds/Fixed Maturity Plans (Quoted)
5,00,000 (31 March 2017: 5,00,000) Preference Shares of H100/- each of
L& T Redemable Preference Shares 5.08 5.00
1,27,19,456 (March 31, 2017 : NIL) units of H10/- each of ICICI corporate
Bond Direct Growth 35.98 -
4,00,00,000 (March 31, 2017: 4,00,00,000 ) units of H10/- each of Kotak
Fixed Maturity Plans Series 200 Direct - Growth 42.97 40.25
2,48,58,660.76(March 31, 2017:Nil) units of H10/- each of Reliance
Corporate Bond fund Direct Plan Growth 35.99 -
2,17,37,240 (March 31, 2017 : NIL ) units of H10/- each of L&T Short Term Income Fund 41.24 -
NIL (March 31, 2017:1,00,00,000 ) units of H10/- each of SBI debt Fund
Series - (400 Day )Regular -Growth - 12.70
NIL (March 31, 2017:1,50,00,000) units of H10/- each of SBI debt Fund
Series - Direct - (400 Day)Growth - 19.31
NIL (March 31, 2017: 2,50,00,000 )units of H10/- each of SBI debt Fund Series
-Direct -(380 Day)Growth - 32.04
NIL (March 31, 2017: 2,54,82,906 ) units of H10/- each of ICICI Prudential
Fixed Maturity Plans Series 73-390 Days Plan I Direct Plan Cumulative - 32.82
NIL (March 31, 2017:2,50,00,000 ) units of H10/- each of Dsp Blackrock
Fixed Maturity Plans-12.5M - 32.18
NIL (March 31, 2017: 2,50,00,000) units of H10/- each of Kotak Fixed Maturity Plans Series 149 Direct - Growth - 31.99
83,58,827.758 (March 31, 2017: 83,58,827.758 ) units of H10/- each of
Kotak Bond (short Term) -Direct Plan Growth 28.14 26.45
NIL (March 31, 2017:2,50,00,000) units of H10/- each of Reliance Fixed Horizon Fund XXVI Series 2 Direct Growth Plan - 32.21
Notes to Consolidated Financial Statementsfor the year ended March 31, 2018
(All amount in H crore, unless otherwise stated)

Corporate Overview Statutory Reports Financial Statements Notice 203
Particulars As at
March 31, 2018
As at
March 31, 2017
NIL (March 31, 2017: 2,00,00,000 ) units of H10/- each of Reliance Fixed Horizon Fund- XXV- Series 33- Direct Plan Growth Plan - 25.71
NIL (March 31, 2017: 83,48,611.292) units of H10/- each of Reliance short
Term Fund - Direct Growth Plan Growth Option - 26.38
NIL (March 31, 2017: 2,50,00,000 ) units of H10/- each of BSL Fixed Term Plan -Series KR - Growth Direct - 32.21
12,49,786.287 (March 31, 2017:12,49,786.287 ) units of H10/- each of Birla
Sun life Treasury Optimizer Plan-Growth-Direct Plan 28.05 26.29
NIL (March 31, 2017:95,359.82 ) units of H10/- each of Birla Sun life Floating
Rate- Short Term -Growth-Direct Plan - 2.07
2,43,36,821.61 (March 31, 2017: 2,43,36,821.61 ) units of H10/- each of Idfc
Corporate Bond Fund -Direct Plan -Growth Option 29.11 27.30
NIL (March 31, 2017: 3,00,00,000 ) units of H10/- each of UTI Fixed Term Income Fund Series XVIII-I Direct Growth Plan - 38.54
NIL (March 31, 2017:1,500)Principal protected Market Linked redeemable Non Convertible Debentures of H1,00,000/- each of ECL Finance limited - 15.00
NIL (March 31, 2017:1,000) Principal protected Market Linked redeemable Non Convertible Debentures of H1,00,000/- each of ECL Finance limited - 11.11
NIL (March 31, 2017:996 )Secured redeemable Non convertible Principal protected market linked debentures of H1,00,000/- each of Reliance Capital Ltd - 9.89
NIL (March 31, 2017:1,500 )Principal protected Market Linked redeemable Non Convertible Debentures of H1,00,000/- each of IIFL wealth Finance limited - 15.90
*NIL (March 31, 2017:100 )Bonds of H1,000,000/- each of 7.17% NHAI - 10.14
*NIL (March 31, 2017:81 )Bonds of H1,000,000/- each of 7.18% NABARD - 8.13
*NIL (March 31, 2017:5 )Bonds of H1,000,000/- each of 7.47% PFC - 0.52
*NIL (March 31, 2017:7 )Bonds of H1,000,000/- each of 7.50% PFC - 0.73
*NIL (March 31, 2017:43 )Bonds of H1,000,000/- each of 7.60% Axis Bank - 4.40
*NIL (March 31, 2017:50 )Bonds of H1,000,000/- each of 7.60% ICICI - 5.15
*NIL (March 31, 2017:71 )Bonds of H1,000,000/- each of 7.63% PFC - 7.44
*NIL (March 31, 2017:50 )Bonds of H1,000,000/- each of 7.95% HDFC Bank - 5.26
*NIL (March 31, 2017:66)Bonds of H1,000,000/- each of 8.22% Daimler financial SR-4 - 6.67
*NIL (March 31, 2017:5 )Bonds of H1,000,000/- each of 8.38% LIC Housing finance - 0.52
*NIL (March 31, 2017:100 )Bonds of H1,000,000/- each of 8.48% LIC Housing finance - 10.99
NIL (March 31, 2017:60) Principal protected Market Linked redeemable Non Convertible Debentures of H1,000,000/- each of Indiabulls housing finance - 6.04
9 Other investments (Current)** (contd..)
Notes to Consolidated Financial Statementsfor the year ended March 31, 2018
(All amount in H crore, unless otherwise stated)

Vardhman Textiles Ltd. Annual Report 2017-18204
9 Other investments (Current)** (contd..)
Particulars As at
March 31, 2018
As at
March 31, 2017
NIL (March 31, 2017: 45840.73 0) units of H1,000/- each of Reliance
Money Manager Fund - Growth - 10.28
*NIL (March 31, 2017:1,000,000 )Bonds of H100/- each of Karnataka State
development loan - 10.25
*NIL (March 31, 2017:1,000,000 )Bonds of H100/- each of Maharashtra
State development loan - 10.18
*500,000 (March 31, 2017: 1,000,000 )Bonds of H100/- each of 7.77 Kerala State development loan 4.96 10.10
*NIL (March 31, 2017: 5,00,000 )Bonds of H100/- each of State
development loan - 5.11
*7837.31 (March 31, 2017: NIL) Units of H100/- each of Aditya Birla sun life
floating rate fund 0.18 -
#2,500 (March 31, 2017:NIL )Principal protected Market Linked redeemable Non Convertible Debentures of H1,00,000/- each of ECL Finance limited 30.25 -
#1,500 (March 31, 2017:NIL )Principal protected Market Linked redeemable Non Convertible Debentures of H1,00,000/- each of IIFL wealth Finance limited 17.36 -
#2,000 (March 31, 2017:Nil )Principal protected Market Linked redeemable Non Convertible Debentures of H1,00,000/- each of IIFL wealth Finance limited 23.38 -
#2,00,00,000 (March 31, 2017:Nil ) units of H10/- each of Reliance fixed horizon fund- XXIX-SERIES 1- DIRECT GROWTH PLAN 24.81 -
#3,00,00,000 (March 31, 2017:Nil) units of H10/- each of Reliance fixed horizon fund- XXIX-SERIES 2- Direct growth plan 37.07 -
#5,00,00,000 (March 31, 2017:Nil ) units of H10/- each of Kotak Fixed Maturity Plans Series 178 Direct Growth 61.86 -
#5,00,00,000 (March 31, 2017:Nil) units of H10/- each of Birla Sunlife Fixed Term Plan Series MX (1128 Days) 61.19 -
#5,00,00,000 (March 31, 2017:Nil ) units of H10/- each of ICICI Prudential
Fixed Maturity Plans Series 77-1129 Days Plan W Direct Plan Cumulative 61.03 -
#5,00,08,075.344 (March 31, 2017: Nil ) units of H10/- each of Reliance
Fixed Horizon Fund-XXIX- Series 8 Direct Growth Plan 61.34 -
#2,20,00,000 (31 March 2016:Nil ) units of H10/- each of UTI Fixed Term Income Fund Series XXIII-II (1100 Days) Direct Growth Plan 27.01 -
#1,30,00,000 (March 31, 2017:Nil )units of H10/- each of Kotak Fixed Maturity Plans Series 180-1099 Days 15.81 -
#5,00,00,000 (March 31, 2017: Nil) units of H10/- each of SBI Debt Fund
Series-B (1105 DAYS) Direct Plan Growth Fixed Maturity Plans 63.42 -
#3,00,00,000 (March 31, 2017: Nil) units of H10/- each of ICICI Prudential
Fixed Maturity Plans Series 76-1108 Days Plan V Direct Plan Cumulative 38.08 -
Notes to Consolidated Financial Statementsfor the year ended March 31, 2018
(All amount in H crore, unless otherwise stated)

Corporate Overview Statutory Reports Financial Statements Notice 205
9 Other investments (Current)** (contd..)
Particulars As at
March 31, 2018
As at
March 31, 2017
*NIL (March 31, 2017:5,00,000 )Bonds of H100/- each of 7.64 Haryana State development loan - 5.02
NIL (March 31, 2017 : 1,000 ) units of H100,000 / each of IIFL Wealth Finance Ltd - 10.49
NIL (March 31, 2017 :250) units of H1,000,000 / each of JM Financial
products ltd - 25.00
NIL (March 31, 2017: 10,000,000) units of H10/- each of Reliance Fixed Horizon Fund -XXV-Series 16-Growth Plan - 12.96
NIL (March 31, 2017 : 25,000,000) units of H10/- each of Kotak Fixed Maturity Plans Series 150 Growth - 32.76
Nil (March 31, 2017: 15,000,000 ) units of H10/- each of UTI Fixed Term Income Fund Series XVIII-I (400 Days) Direct Growth Plan - 19.27
NIL (31 March 2017: 10,000,000 units of H10/- each of DSP Blackrock FTP
- Series 44 -36 Month Direct Growth - 12.64
NIL (31 March 2017: 60,779 ) units of H1,000 /- each of Principal Bank CD
Fund-Direct Plan Growth. - 12.84
21,320,689 (March 31, 2017: 21,320.689) units of H10/- each of edelweiss
banking (earlier known as JP Morgan Indian banking) and PSU debt fund -Direct plan-Growth option 31.07 29.13
9,690,611 (March 31, 2017: 9,690,611 ) units of H10/ each of Edelweiss
Bond (earlier knows as JP Morgan Indian active bond fund -Direct plan)
Growth option 18.19 17.54
NIL(31 March 2017: 22,430,779 ) units of H10/ each of Edelweiss
Banking(earlier known as JP Morgan Indian banking) and PSU debt fund -Regular plan-Growth option - 30.33
3,335,393 (March 31, 2017 :3,335,393) units of H10/ each of IDFC Dynamic
bond fund - Growth -Direct plan 7.21 6.99
NIL(31 March 2017 :781) units of H1,000 /- each of Principal Low Duration Fund - Direct Plan Growth - 0.21
11,831 (March 31, 2017: Nil) units of H1000/- each of Principal Cash
Management Fund - Direct Plan Growth 2.00 -
16,592 (March 31, 2017: Nil) units of H1000/- each of Kotak Floater Short
Term - Direct Plan - Growth 4.73 -
13,854,704 (March 31, 2017: Nil) units of H10/- each of Axis Enhanced Arbitrage Fund Direct Dividend 15.14 -
5,000,000 (March 31, 2017: Nil) units of H10/- each of UTI Fixed Term Income Fund Series XXII-VI Growth Plan 6.50 -
11,350,000 (31 March 2017: 11,350,000) Preference Shares of H8/- (31
March 2017: H10/-) each of 6% Zee Entertainment Enterprises Limited 8.63 10.73
Notes to Consolidated Financial Statementsfor the year ended March 31, 2018
(All amount in H crore, unless otherwise stated)

Vardhman Textiles Ltd. Annual Report 2017-18206
9 Other investments (Current)** (contd..)
Particulars As at
March 31, 2018
As at
March 31, 2017
22,443 (March 31, 2017 :45510) units of H1,000 /- each of SBI Premier
Liquid Fund- Dir Plan Growth 6.11 11.62
94 (March 31, 2017 : Nil) Non-Convertible Debentures of H1,000,000/ each
of JM Financial Products Limited Tranche-AU BR 10.03 -
19,974,912 (March 31, 2017 : Nil) units of H10 / each of L & T Resurgent India Corporate Bond Fund Direct Growth 26.69 -
NIL (March 31, 2017 13,07,121.76) units of H10/- each of Birla Active Debt
MM FoF- Growth - 2.94
Nil (Previous Year 394.109) Units of H1000/- each of SBI PLF Direct Plan Growth - 0.10
13617.48 (March 31, 2017 Nil) units of H10/- each of Birla Advantage fund 0.60 -
22,219.45 (Previous Year Nil) Units of H10/- each of Kotak Select Focus
Fund Direct Plan Growth 0.08 -
11,70,199.41 (Previous Year Nil) Units of H10/- each of Kotak Equity Arbitage
Fund Direct Plan Fortnight dividend 2.76 -
1,50,658.98 (Previous Year Nil) Units of H10/- each of L&T India Value Fund 0.56 -
27,80,412 (Previous Year Nil) Units of H10/- each of L&T Arbitage Opp Fund-Direct Growth 2.85 -
1,000 (Previous Year 1,000) Units of H1000/- each of ECL Finance Limited 10.00 10.00
23,55,396 (March 31, 2017 Nil) Units of H10 each of Birla Enchanced
Arbitrage Fund Direct Dividend Reinvestment 2.63 -
4853 (March 31, 2017 Nil) Units of H 1000 each of HDFC Liquid Fund Direct Plan Growth 1.68 -
19,22,324 (March 31, 2017 18,27,539.60) units of H10/- each of HDFC Arbitrage fund 2.06 1.96
Nil (Previous Year 25392.91) Units of H1000/- each of Kotak Floater Short
term fund direct plan growth - 6.78
42,00,000 (March 31, 2017 42,00,000) units of H10/- each of UTI Fixed term income fund direct plan growth 4.86 4.52
12400.65 (March 31, 2017 Nil) units of H10/- each of Mirae Asset
Managment Fund 2.27 -
15,71,36.91 (March 31, 2017 Nil) units of H10/- each of Mirae Asset India
Equity Fund 0.74 -
6146 (March 31, 2017 Nil) units of H1000/- each of HDFC Cash Management Savings-Dividend Distribution 0.65 -
(iii) Investment in preference shares (unquoted)
10,00,000 (March 31, 2017: 10,00,000 ) 3% cumulative compulsorily convertible Preference Shares of H100/- each of TATA Motors Finance Ltd. 11.60 10.00
Notes to Consolidated Financial Statementsfor the year ended March 31, 2018
(All amount in H crore, unless otherwise stated)

Corporate Overview Statutory Reports Financial Statements Notice 207
9 Other investments (Current)** (contd..)
Particulars As at
March 31, 2018
As at
March 31, 2017
(iv) Investment in equity share (quoted)
4400 (March 31, 2017 Nil) shares of H5 each of Axiscades Engineering Technologies Ltd 0.07 -
7182 (March 31, 2017 Nil) shares of H1 each of Balrampur Chini Mills Ltd 0.11 -
751(March 31, 2017 Nil) shares of H10 each of Bharat Bijlee Ltd 0.11 -
5700(March 31, 2017 Nil) shares of H10 each of Central Depository
Services (India) Limited 0.20 -
2556(March 31, 2017 Nil) shares of H10 each of Deepak Fertilisers &
Petrochemicals Corporation Ltd 0.10 -
3210(March 31, 2017 Nil) shares of H2 each of Gujarat Ambuja Exports Ltd 0.06 -
5689(March 31, 2017 Nil) shares of H10 each of Heidelberg Cement India Ltd 0.09 -
8700(March 31, 2017 Nil) shares of H2 each of Jindal Saw Ltd 0.10 -
2087(Previous Year Nil) Units of H1 each of K R B L Ltd 0.12 -
2900(Previous Year Nil) Units of H2 each of KEC International Ltd 0.10 -
1450(Previous Year Nil) Units of H10 each of Lumax Auto Technologies Ltd 0.11 -
2500(Previous Year Nil) Units of H10 each of Narayana Hrudayalaya Ltd 0.07 -
900(Previous Year Nil) Units of H2 each of Ratnamani Metals & Tubes Ltd 0.09 -
1754(Previous Year Nil) Units of H1 each of Shilpa Medicare Ltd 0.11 -
440(Previous Year Nil) Units of H10 each of SRF LTD 0.09 -
2625(Previous Year Nil) Units of H10 each of Surya Roshni Ltd 0.10 -
1650(Previous Year Nil) Units of H10 each of Tata Elxsi Ltd 0.18 -
7044(Previous Year Nil) Units of H2 each of Titagarh Wagons Ltd 0.12 -
75,400 ( March 31, 2017 :1,50,800 ) Equity Shares of H10 /-each fully paid
up of Hindustan Petroleum Corporation Ltd. 2.60 7.93 NIL ( March 31, 2017 :8,06,000 ) Equity shares of H10 /- each fully paid up
of Rural Electrification Corporation Limited - 14.58 13,04,645 ( March 31, 2017 :13,04,645 ) Equity shares of H1 /- each fully
paid up of Welspun India Limited 7.57 11.41 26,000 ( March 31, 2017 :26,000 ) Equity shares of H10 /-each fully paid up
of Trident Limited 0.15 0.22 1,46,000 (31st March 2017: NIL) equity shares of H10 each fully paid of
Reliance Industries Limited of H10 each 12.89 -
979.09 934.40
1. Aggregate amount of quoted investments 967.49 924.40 2. Aggregate market value of quoted investments 967.49 924.40 3. Aggregate amount of unquoted investment 11.60 10.00
* These Investments are made through portfolio management services
# Investments having maturity period of less than 12 months from 31st March 2018 i.e. the balance sheet date have been reclassified as ‘ Current Investment’ during the year.** Refer note 37
Notes to Consolidated Financial Statementsfor the year ended March 31, 2018
(All amount in H crore, unless otherwise stated)

Vardhman Textiles Ltd. Annual Report 2017-18208
10 Trade receivables*
Particulars As at
March 31, 2018
\As at
March 31, 2017
Receivable from related parties (Refer Note 45)
- Unsecured, considered good 6.68 2.13 Receivable from others
- Unsecured, considered good 750.85 731.37 - Doubtful 5.02 5.02 Less: Allowances for doubtful trade receivables (5.02) (5.02)
757.53 733.50
Expected Credit Loss
Particulars As at
March 31, 2018
As at
March 31, 2017
(i) Ageing
Less than 180 days - -
More than 180 days 5.02 5.02 5.02 5.02
(ii) Age of Receivables:
Less than 180 days 749.19 724.70 More than 180 days 8.34 8.80
757.53 733.50
(i) The credit period allowed on sales generally vary, on case to case basis, business to business, based on market conditions,
maximum credit period allowed is 45 days in case of domestic yarn and 90 days in case of domestic fabric. In case of exports maximum credit period of 120 days against letter of credit is provided.
There are no major customers that represent more than 10% of total balances of trade receivables.
The Group follows simplified approach for recognition of impairment loss allowance on trade recievables. The application of simplified approach does not require the Group to track changes in credit risk. Rather, it recognises impairment loss allowance based on lifetime ECL’s at each reporting date, right from its initial recognition.. The expected credit loss allowance is based on the ageing of the days the receivable are dues and rates as given in the provision matrix. The provision matrix at the end of reporting period is as follows:-
Particulars As at
March 31, 2018
As at
March 31, 2017
Movement in expected credit loss allowance
Balance at the beginning of the year 5.02 2.08
Movement in expected credit loss allowance - 2.94
Balance at the end of the year. 5.02 5.02
The concentration of credit risk is limited due to the fact that customer base is large and unrelated.
* Refer note 37
Notes to Consolidated Financial Statementsfor the year ended March 31, 2018
(All amount in H crore, unless otherwise stated)

Corporate Overview Statutory Reports Financial Statements Notice 209
11 Cash and cash equivalents#
Particulars As at
March 31, 2018
As at
March 31, 2017
a) Balances with banks
- In current accounts 68.03 32.01
- In deposit accounts with maturity upto three months 0.01 9.80
b) Cheques on hand 2.20 0.19
c) Cash on hand 0.14 0.29
70.38 42.29
For the purpose of financial statements cash and cash equivalents include cash on hand and bank balances. Cash and cash equivalent at the end of reporting period can be reconciled to the related items in balance sheet as follows:
#Refer note 37
11A Bank balances other than cash and cash equivalents#
Particulars As at
March 31, 2018
As at
March 31, 2017
a) Other bank balances
- Earmarked balances with banks* 3.05 2.03
- Deposits with more than twelve months maturity 1.86 1.94
- Deposits with more than three months but less than twelve months maturity 0.33 0.33
5.24 4.30
Less: Amounts disclosed as other financial non current assets (Refer note 6) 1.86 1.94
3.38 2.36
* Earmarked balances with banks includes H3.03 crore (March 31, 2017: H2.02 crore ) pertaining to dividend accounts with banks and H0.02 crore (March 31, 2017:H0.01 crore) pledged with government authorities and others.
# Refer note 37
12 Loans (Current)#
Particulars As at
March 31, 2018
As at
March 31, 2017
Financial assets at amortized cost
Loans to related parties (Refer note 45)
(Unsecured and considered good)
- Others 26.99 26.99
Loan to employees 2.81 2.72
29.80 29.71
# Refer note 37
Notes to Consolidated Financial Statementsfor the year ended March 31, 2018
(All amount in H crore, unless otherwise stated)

Vardhman Textiles Ltd. Annual Report 2017-18210
13 Other financial assets (Current)
Particulars As at
March 31, 2018
As at
March 31, 2017
Financial assets at amortized cost
Recoverable from related parties (Refer Note 45) 0.03 0.03 Interest receivables 1.03 8.50 Claims receivable 0.23 0.74 Other Recoverable 14.97 8.47 Margin money - 8.66 Financial assets at Fair value through Profit and lossDerivative Financial Instruments* 2.09 -
18.35 26.40
* The Company enters into derivative financial instruments to manage its exposure to foreign exchange rate risk including foreign exchange forward contracts. For further details of derivative financial instruments refer note 37.
These derivative financial instruments are not designated as FVTOCI hedging instruments as they do not meet the required criteria.
14 Current tax
Particulars As at
March 31, 2018
As at
March 31, 2017
Current tax assets (net)
Taxes paid (net) 78.41 21.26 Current tax liabilities (net)
Income-tax payable (net) 10.93 -
15 Other current assets
Particulars As at
March 31, 2018
As at
March 31, 2017
Amount recoverable from Mahavir Share Trust in respect of shares
held in Trust (Refer note 39) 4.65 3.60 Advances to suppliers 86.72 106.05 Unamortised Lease hold land prepayments 0.08 0.08 Balance with government authorities 203.99 67.41 Prepaid (Deferred) Expense for employee benefit 0.11 0.12 Prepaid expenses others 5.26 4.97 Other recoverables : - Considered good 51.21 113.44 - doubtful 0.03 0.03 Less: Allowances for doubtful other recoverables (0.03) (0.03)
51.21 113.44
352.02 295.67
Notes to Consolidated Financial Statementsfor the year ended March 31, 2018
(All amount in H crore, unless otherwise stated)

Corporate Overview Statutory Reports Financial Statements Notice 211
16 Equity share capital
As at
March 31, 2018
As at
March 31, 2017
Authorised share capital:
9,00,00,000 equity shares of H10 each
(March 31, 2017: 9,00,00,000 equity shares of H10 each) 90.00 90.00 1,00,00,000 redeemable cumulative preference shares of H10 each (March 31,
2017: 1,00,00,000 redeemable cumulative preference shares of H10 each) 10.00 10.00 100.00 100.00
Issued, subscribed and fully paid up share capital comprises:
5,64,29,987 equity shares of H10 each
(March 31, 2017: 5,49,05,335 equity shares of H10 each) 56.43 54.91 56.43 54.91
16.1 Rights, preference and restriction attached to equity shares
The Company has one class of equity shares having a par value of `10/- each. Each holder of equity shares is entitled to one vote per share. The dividend proposed by the Board of Directors is subject to the approval of the shareholders in the ensuing annual general meeting. In the event of liquidation of the Company, the holders of equity shares will be entitled to receive any of the remaining assets of the Company, after distribution of all preferential amounts. The distribution will be in proportion to the number of equity shares held by the shareholders
16.2 Rights, preference and restriction attached to preference shares
The rate of dividend on preference shares will be decided by the Board of Directors as and when issued. Preferential shares as and when issued shall have the cumulative right to receive dividend as and when declared and shall have preferential right of
repayment on amount of capital.
16.3 As at March 31, 2018, senior employees of the Company were offerred 6,14,000 options (option to vest equity shares as per
employee stock options scheme 2016, for details refer note 44). The vesting for due options began from current financial year and 61,400 options/shares during the year. Out of these, 42,450 shares/options have been excercised. Share options granted under Company’s employee share option plan carry right to dividend and voting rights at par with other equity holders.
As at March 31, 2018 As at March 31, 2017
Number of
shares
Amount Number of
shares
Amount
Balance as at the beginning of the year 5,63,67,537 56.37 6,25,17,879 62.52 Less: Buyback of shares (including of 1,36,539 nos. of shares held through trust. Also refer note 16) - - (6,150,342) (6.15)
5,63,67,537 56.37 56,367,537 56.37
Less:- Own shares held through trust - - (1,462,202) (1.46)Add:- Sale of Holding Company shares by subsidary 20,000 0.02 Add:- Issue of equity shares under employee stock option plan (Refer note 44) 42,450 0.04 - -
Balance as at the end of the year 56,429,987 56.43 54,905,335 54.91
16.4 Reconciliation of number of shares
Notes to Consolidated Financial Statementsfor the year ended March 31, 2018
(All amount in H crore, unless otherwise stated)

Vardhman Textiles Ltd. Annual Report 2017-18212
As at March 31, 2018 As at March 31, 2017
Number of
shares
%
holding
Number of
shares
%
holding
Devakar Investment and Trading Company
Private Limited 6,192,786 10.78% 6,192,786 10.79%
Adishwar Enterprises LLP 10,318,863 17.97% 11,413,130 19.89%
Vardhman Holdings Limited 15,314,517 26.66% 14,067,671 24.51%
16.5 Details of shares held by the holding Company
There is no holding / ultimate Company of the Company
16.6 Details of shares held by each shareholder holding more than 5% shares
16.7 The Board of Directors of the Company at its meeting held on September 24, 2016 approved the buyback of upto 62,60,869 fully paid up equity shares of H10 each, at a price not exceeding H1175/- payable in cash through the Tender Offer route, upto an
aggregate amount not exceeding H720 crore from the open market through Stock Exchange(s). During the previous year, the Company had bought back and extinguished 62,60,869 equity shares of H10 each at price of H1150/-. Consequently, H6.26 crore were transferred to capital redemption reserve as per the requirements of Section 69 of the Companies Act, 2013.
17 Other equity
Particulars As at
March 31, 2018
As at
March 31, 2017
Share application money pending allotment 0.55 -
Capital reserve - -
Statutory Reserve 7.68 5.63
Capital redemption reserve 40.43 40.43
Security premium 4.91 -
Debenture redemption reserve 17.81 -
Share options outstanding account 10.57 -
General reserve 1,463.84 1,463.84
Retained earnings 3,348.69 2,705.63
Equity instrument through other comprehensive income 2.79 2.79
4,897.27 4,218.32
Notes to Consolidated Financial Statementsfor the year ended March 31, 2018
(All amount in H crore, unless otherwise stated)
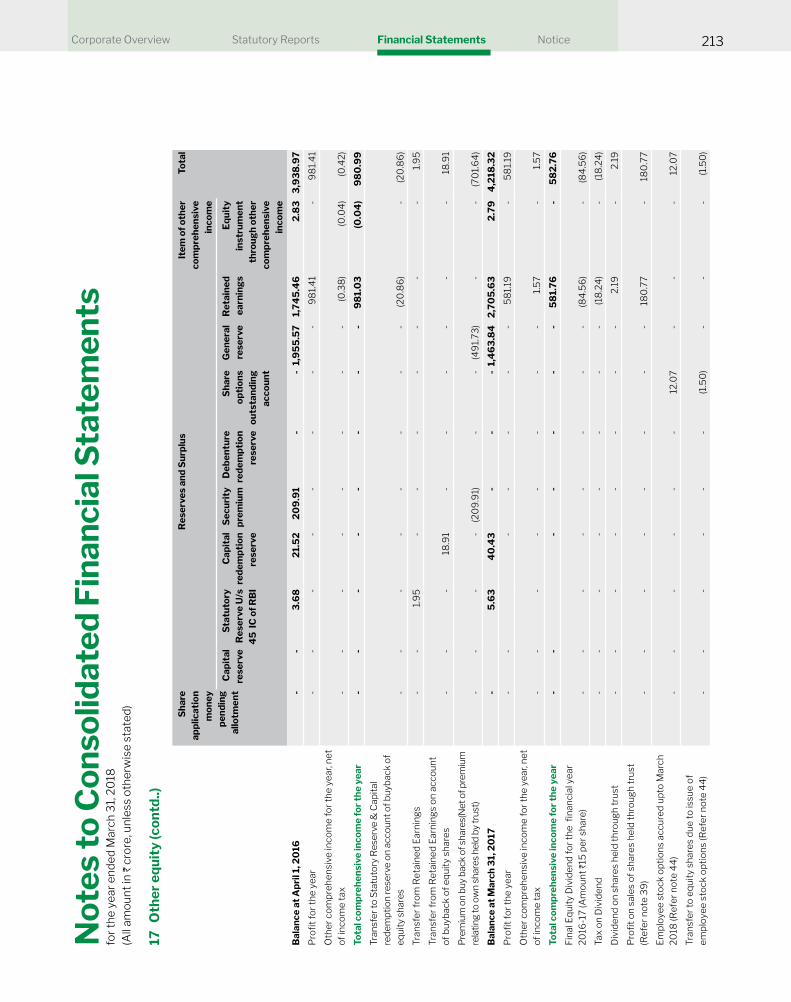
Corporate Overview Statutory Reports Financial Statements Notice 213
17
Oth
er
eq
uit
y (
co
ntd
..)
Sh
are
ap
pli
ca
tio
n
mo
ne
y
pe
nd
ing
all
otm
en
t
Re
se
rve
s a
nd
Su
rplu
sIt
em
of
oth
er
co
mp
reh
en
siv
e
inc
om
e
To
tal
Ca
pit
al
res
erv
e
Sta
tuto
ry
Re
se
rve
U/s
45
IC
of
RB
I
Ca
pit
al
red
em
pti
on
res
erv
e
Se
cu
rity
pre
miu
m
De
be
ntu
re
red
em
pti
on
res
erv
e
Sh
are
op
tio
ns
ou
tsta
nd
ing
ac
co
un
t
Ge
ne
ral
res
erv
e
Re
tain
ed
ea
rnin
gs
Eq
uit
y
ins
tru
me
nt
thro
ug
h o
the
r
co
mp
reh
en
siv
e
inc
om
e
Ba
lan
ce
at
Ap
ril 1
, 20
16 -
-
3.6
8
21.
52
2
09
.91
-
-
1,9
55
.57
1
,74
5.4
6
2.8
3
3,9
38
.97
Pro
fit f
or th
e ye
ar -
-
-
-
-
-
-
-
98
1.4
1 -
98
1.4
1
Oth
er
co
mp
reh
en
sive
inc
om
e f
or
the
ye
ar,
ne
t
of in
com
e ta
x -
-
-
-
-
-
-
-
(0.3
8)
(0.0
4)
(0.4
2)
To
tal c
om
pre
he
ns
ive
inc
om
e f
or
the
ye
ar
-
-
- -
-
-
-
-
9
81.
03
(
0.0
4)
98
0.9
9
Tra
nsf
er
to S
tatu
tory
Re
serv
e &
Ca
pit
al
red
em
pti
on
re
serv
e o
n a
cc
ou
nt
of
bu
yba
ck
of
eq
uit
y sh
are
s -
-
-
-
-
-
-
-
(20
.86
) -
(2
0.8
6)
Tra
nsf
er
fro
m R
eta
ine
d E
arn
ing
s -
- 1
.95
-
--
--
--
1.9
5
Tra
nsf
er
fro
m R
eta
ine
d E
arn
ing
s o
n a
cc
ou
nt
of
bu
yb
ac
k o
f e
qu
ity
sh
are
s-
- -
18
.91
--
--
--
18
.91
Pre
miu
m o
n b
uy
ba
ck
of
sha
res(
Ne
t o
f p
rem
ium
rela
tin
g t
o o
wn
sh
are
s h
eld
by
tru
st)
-
-
- -
(2
09
.91)
-
-
(49
1.73
) -
-
(7
01.
64
)
Ba
lan
ce
at
Ma
rch
31,
20
17 -
5.6
3
40
.43
-
-
-
1,4
63
.84
2
,70
5.6
3
2.7
9
4,2
18.3
2
Pro
fit f
or th
e ye
ar -
-
-
-
-
-
-
5
81.
19
-
58
1.19
Oth
er
co
mp
reh
en
sive
inc
om
e f
or
the
ye
ar,
ne
t
of in
com
e ta
x -
-
-
-
-
-
-
-
1.5
7-
1.5
7
To
tal c
om
pre
he
ns
ive
inc
om
e f
or
the
ye
ar
-
-
-
-
-
-
-
58
1.7
6
- 5
82
.76
Fina
l Equ
ity
Div
iden
d fo
r the
fina
ncia
l yea
r 2
016
-17
(Am
ou
nt
H15
pe
r sh
are
) -
-
-
-
-
-
-
-
(84
.56
) -
(8
4.5
6)
Tax
on D
ivid
end
-
-
- -
-
-
-
-
(1
8.2
4)
-
(18
.24
)
Div
ide
nd
on
sh
are
s h
eld
th
rou
gh
tru
st -
-
-
-
-
-
-
-
2.1
9
-
2.1
9
Pro
fit o
n sa
les
of s
hare
s he
ld th
roug
h tr
ust
(Ref
er n
ote
39
) -
-
-
-
-
-
-
-
18
0.7
7 -
1
80
.77
Em
plo
ye
e s
toc
k o
pti
on
s a
cc
ure
d u
pto
Ma
rch
20
18 (R
efe
r n
ote
44
) -
-
-
-
-
-
12.
07
-
-
-
12.
07
Tra
nsf
er
to e
qu
ity
sh
are
s d
ue
to
issu
e o
f
em
plo
ye
e s
toc
k o
pti
on
s (R
efe
r n
ote
44
)-
--
--
- (1
.50
)-
--
(1.5
0)
No
tes
to
Co
ns
olid
ate
d F
ina
nc
ial S
tate
me
nts
for
the
ye
ar
en
de
d M
arc
h 3
1, 2
018
(All
am
ou
nt
in H
cro
re, u
nle
ss o
the
rwis
e s
tate
d)

Vardhman Textiles Ltd. Annual Report 2017-18214
17
Oth
er
eq
uit
y (
co
ntd
..)
Sh
are
ap
pli
ca
tio
n
mo
ne
y
pe
nd
ing
all
otm
en
t
Re
se
rve
s a
nd
Su
rplu
sIt
em
of
oth
er
co
mp
reh
en
siv
e
inc
om
e
To
tal
Ca
pit
al
res
erv
e
Sta
tuto
ry
Re
se
rve
U/s
45
IC
of
RB
I
Ca
pit
al
red
em
pti
on
res
erv
e
Se
cu
rity
pre
miu
m
De
be
ntu
re
red
em
pti
on
res
erv
e
Sh
are
op
tio
ns
ou
tsta
nd
ing
ac
co
un
t
Ge
ne
ral
res
erv
e
Re
tain
ed
ea
rnin
gs
Eq
uit
y
ins
tru
me
nt
thro
ug
h o
the
r
co
mp
reh
en
siv
e
inc
om
e
Se
cu
riti
es
pre
miu
m o
n s
ha
res
un
de
r
Em
plo
ye
e s
toc
k o
pti
on
s -
-
-
-
4.9
1 -
-
-
-
-
4
.91
Tra
nsf
er
to d
eb
en
ture
re
de
mp
tio
n r
ese
rve
on
ac
co
un
t o
f is
sue
of
de
be
ntu
res
-
-
- -
-
1
7.8
1 -
-
(1
7.8
1) -
-
Tra
nsf
er
to S
tatu
tory
Re
serv
e u
nd
er
45
-IC
of
RB
I Ac
t-
--
--
--
- (2
.05
)-
(2.0
5)
Tra
nsf
er
fro
m R
eta
ine
d E
arn
ing
s-
- 2
.05
-
--
--
--
2.0
5
Sh
are
Ap
plic
ati
on
Mo
ne
y r
ec
eiv
ed
pe
nd
ing
allo
tmen
t und
er e
mpl
oyee
sto
ck o
ptio
ns.
0.5
5 -
-
-
-
-
-
-
-
-
0.5
5
Ba
lan
ce
at
Ma
rch
31,
20
18 0
.55
7.6
8
40
.43
4
.91
17
.81
10
.57
1,4
63
.84
3
,34
8.6
9
2.7
94
,89
7.2
7
a. S
ha
re a
pp
lic
ati
on
mo
ne
y p
en
din
g a
llo
tme
nt
an
d s
ha
re o
pti
on
ou
tsta
nd
ing
ac
co
un
t
It re
pres
ents
mon
ey re
ceiv
ed fr
om s
enio
r em
ploy
ees
unde
r the
Com
pany
’s e
mpl
oyee
sha
re o
ptio
n sc
hem
e.
b. C
ap
ita
l re
se
rve
Ca
pit
al
rese
rve
re
pre
sen
ts r
ese
rve
re
co
gn
ise
d o
n a
ma
lga
ma
tio
n b
ein
g t
he
dif
fere
nc
e b
etw
ee
n c
on
sid
era
tio
n a
mo
un
t a
nd
ne
t a
sse
ts o
f th
e t
ran
sfe
ror
Com
pany
.
c. C
ap
ita
l re
de
mp
tio
n r
es
erv
e
Ca
pit
al
Re
de
mp
tio
n r
ese
rve
is
a s
tatu
tory
, n
on
-dis
trib
uta
ble
re
serv
e i
nto
wh
ich
am
ou
nts
are
tra
nsf
err
ed
fo
llow
ing
th
e r
ed
em
pti
on
or
pu
rch
ase
of
a
Com
pany
’s o
wn
shar
es.
d. S
ec
uri
tie
s p
rem
ium
Sec
urit
ies
prem
ium
repr
esen
ts a
mou
nt o
f pre
miu
m re
cogn
ised
on
issu
e of
sha
res
to s
hare
hold
ers
at a
pri
ce m
ore
than
its
face
val
ue.
No
tes
to
Co
ns
olid
ate
d F
ina
nc
ial S
tate
me
nts
for
the
ye
ar
en
de
d M
arc
h 3
1, 2
018
(All
am
ou
nt
in H
cro
re, u
nle
ss o
the
rwis
e s
tate
d)
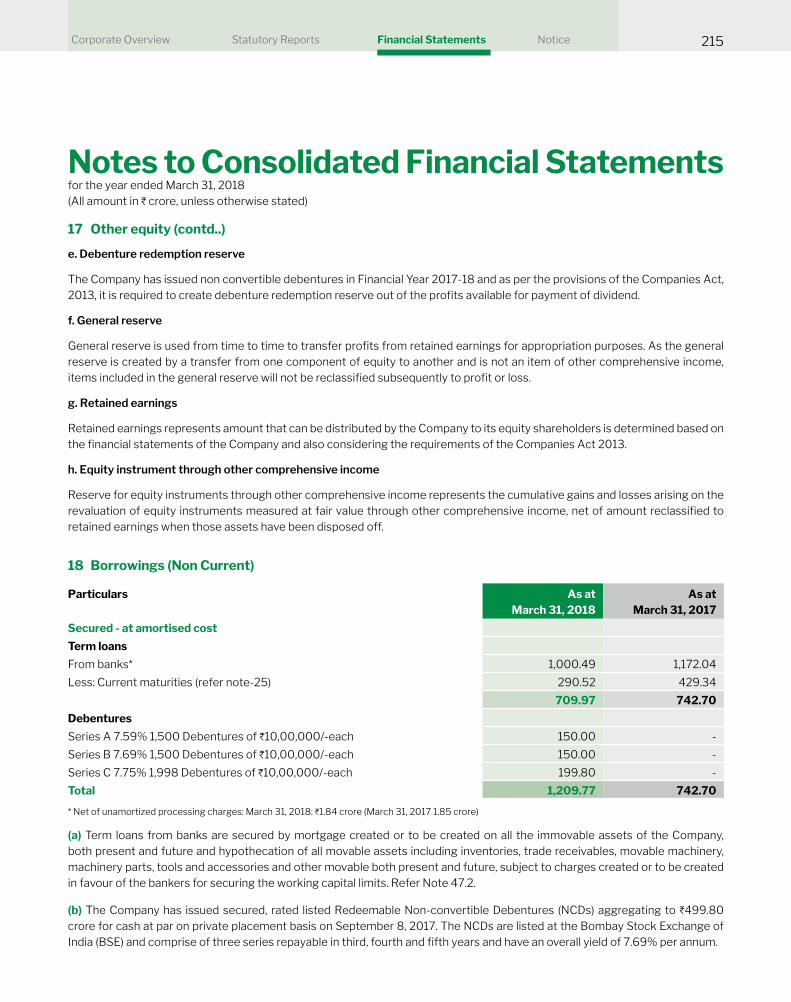
Corporate Overview Statutory Reports Financial Statements Notice 215
e. Debenture redemption reserve
The Company has issued non convertible debentures in Financial Year 2017-18 and as per the provisions of the Companies Act, 2013, it is required to create debenture redemption reserve out of the profits available for payment of dividend.
f. General reserve
General reserve is used from time to time to transfer profits from retained earnings for appropriation purposes. As the general reserve is created by a transfer from one component of equity to another and is not an item of other comprehensive income,
items included in the general reserve will not be reclassified subsequently to profit or loss.
g. Retained earnings
Retained earnings represents amount that can be distributed by the Company to its equity shareholders is determined based on
the financial statements of the Company and also considering the requirements of the Companies Act 2013.
h. Equity instrument through other comprehensive income
Reserve for equity instruments through other comprehensive income represents the cumulative gains and losses arising on the
revaluation of equity instruments measured at fair value through other comprehensive income, net of amount reclassified to retained earnings when those assets have been disposed off.
17 Other equity (contd..)
18 Borrowings (Non Current)
Particulars As at
March 31, 2018
As at
March 31, 2017
Secured - at amortised cost
Term loans
From banks* 1,000.49 1,172.04
Less: Current maturities (refer note-25) 290.52 429.34
709.97 742.70
Debentures
Series A 7.59% 1,500 Debentures of H10,00,000/-each 150.00 -
Series B 7.69% 1,500 Debentures of H10,00,000/-each 150.00 -
Series C 7.75% 1,998 Debentures of H10,00,000/-each 199.80 -
Total 1,209.77 742.70
* Net of unamortized processing charges: March 31, 2018: H1.84 crore (March 31, 2017 1.85 crore)
(a) Term loans from banks are secured by mortgage created or to be created on all the immovable assets of the Company,
both present and future and hypothecation of all movable assets including inventories, trade receivables, movable machinery,
machinery parts, tools and accessories and other movable both present and future, subject to charges created or to be created
in favour of the bankers for securing the working capital limits. Refer Note 47.2.
(b) The Company has issued secured, rated listed Redeemable Non-convertible Debentures (NCDs) aggregating to H499.80 crore for cash at par on private placement basis on September 8, 2017. The NCDs are listed at the Bombay Stock Exchange of India (BSE) and comprise of three series repayable in third, fourth and fifth years and have an overall yield of 7.69% per annum.
Notes to Consolidated Financial Statementsfor the year ended March 31, 2018
(All amount in H crore, unless otherwise stated)

Vardhman Textiles Ltd. Annual Report 2017-18216
18 (d) Terms of repayment of loan/debentures
Loan Category Frequency
of principal
repayments
Interest rate Repayments during
FY 2018-19 FY 2019-20 FY 2020-21 FY 2021-24**
Term loans Quarterly
Payments
*8.45% to 9.98% 290.52 312.70 57.40 339.87
7.59% Series A Non-convertible debentures Yearly 7.59% - - 150.00 -
7.69% Series A Non-convertible debentures Yearly 7.69% - - - 150.00 7.75% Series A Non-convertible debentures Yearly 7.75% - - - 199.80
290.52 312.70 207.40 689.67
* Also refer note 34
** From Financial year 2020-21 to financial year 2023-24.
18 (e) Also refer note 37 for fair value disclosures.
19 Other financial liabilities (Non Current)
20 Provisions (Non Current)
Particulars As at
March 31, 2018
As at
March 31, 2017
Financial liabilities at amortized cost
Retention money 0.65 0.49 0.65 0.49
Particulars As at
March 31, 2018
As at
March 31, 2017
Provision for employee benefits : - Leave encashment (Refer note 46) 7.69 9.56 - Gratuity 0.13
7.69 9.69
The provision for employee benefit include annual leave and vested long service leave entitlement accrued of employees.
CRISIL has assigned a rating of AA+ with Stable outlook to the said NCDs of the Company on August 18, 2017. The NCDs shall be secured by way of a first pari passu charge over the immovable and movable fixed assets of the Company and it should have fixed asset cover of more than 105% of outstanding amount of NCDs.
( c ) There have been no breach of covenants mentioned in the loan agreements during the reporting years.
18 Borrowings (Non Current) (contd..)
Notes to Consolidated Financial Statementsfor the year ended March 31, 2018
(All amount in H crore, unless otherwise stated)

Corporate Overview Statutory Reports Financial Statements Notice 217
21 Deferred tax liabilities (net)*
Particulars As at
March 31, 2018
As at
March 31, 2017
Deferred tax liabilities Fixed assets: Impact of difference between tax depreciation and 298.31 293.80 depreciation charged for the financial reporting year
298.31 293.80
Deferred tax assets Impact of expenditure charged to the statement of profit and loss in the current year but allowable for tax purposes on payment basis 26.04 22.61 MAT Credit Recoverable 16.65 15.50
42.69 38.11
255.62 255.69
* Refer note 36
22 Other non-current liabilities
Particulars As at
March 31, 2018
As at
March 31, 2017
Deferred Income for Capital subsidy 22.14 19.86
Due to employees 0.04 0.05
Other - 1.12
Total 22.18 21.03
The deferred revenue arises as a result of the benefits received from state government on account of installation of specified project assets whereby such grant is treated as deferred income and is recognized as income over the useful life of the assets
for which such grant is received.
Notes to Consolidated Financial Statementsfor the year ended March 31, 2018
(All amount in H crore, unless otherwise stated)

Vardhman Textiles Ltd. Annual Report 2017-18218
23 Borrowings (Current)
Particulars As at
March 31, 2018
As at
March 31, 2017
Loans repayment on demand
- From banks (secured at amortised cost) 758.80 1,027.60
- From banks (unsecured at amortised cost) 62.39 38.72
Total 821.19 1,066.32
a. Details of security for working capital borrowings
Working capital borrowings from banks are secured by way of hypothecation of entire present and future tangible current assets
of the Company as well as a second charge on the entire present and future fixed assets of the Company.
b. Includes Nil (March 31, 2017: Nil) for commercial paper issued by the Company. The maximum amount outstanding during the year is H1385.64 crore (FY 2016-17: H1136.24 crore)
24 Trade payables*
Particulars As at
March 31, 2018
As at
March 31, 2017
Trade payables ( refer note 42)
Due to micro and small enterprises - 0.50
Due to other than micro and small enterprises 235.39 239.89
Due to related parties (Refer Note 45) 4.47 4.76
Total 239.86 245.15
* Refer Note 37
25 Other financial liabilities (Current)**
Particulars As at
March 31, 2018
As at
March 31, 2017
Financial liabilities at amortized cost
Current maturities of non current debt 290.52 429.34
Interest accrued but not due on borrowings 24.87 1.64
Other payables
- Retention money 7.00 9.22
- Security deposits 2.18 1.74
- Expense payable 87.68 97.36
- Payables for purchase of fixed assets 0.21 7.49
- Due to employees 69.40 71.08
Notes to Consolidated Financial Statementsfor the year ended March 31, 2018
(All amount in H crore, unless otherwise stated)

Corporate Overview Statutory Reports Financial Statements Notice 219
26 Provisions (Current)
* This includes net mark to market loss of H1.92 crore (March 31, 2017 : Nil) on commodities traded through stock exchange. The Company has taken future contracts to hedge against fluctuation of cotton prices during the year and has booked mark to market loss on these contracts in head other expenses (Refer note no 35)
** Refer note 37
Particulars As at
March 31, 2018
As at
March 31, 2017
Provision for employee benefits : (Refer note 46)
Leave encashment 3.19 1.99
Gratuity 2.28 2.66
5.47 4.65
27 Other current liabilities
Particulars As at
March 31, 2018
As at
March 31, 2017
Statutory remittances* 42.14 50.41
Deferred Income for Capital subsidy 2.02 1.85
Unpaid dividends ** 3.03 2.02
Advances from customers 50.07 77.58
Other Liabilities 21.73 20.18
Total 118.99 152.04
* Statutory remittances includes contribution to provident fund and Employee state insurance corporation, tax deducted at source,excise duty,VAT/sales tax,service tax, goods and service tax etc.
** Unpaid dividends do not include any amount due and outstanding required to be credited to the Investors’ Education and Protection Fund.
Particulars As at
March 31, 2018
As at
March 31, 2017
Financial liabilities at Fair value through Profit and loss
Derivative Financial Instruments* 7.40 -
Total 489.26 617.87
25 Other financial liabilities (Current)** (contd..)
Notes to Consolidated Financial Statementsfor the year ended March 31, 2018
(All amount in H crore, unless otherwise stated)

Vardhman Textiles Ltd. Annual Report 2017-18220
28 Revenue from operations #
Particulars For the year ended
March 31, 2018
For the year ended
March 31, 2017
Sale of products (Net of Rebate & Discount and including excise duty) 6,157.55 5,893.11
Sale of services 0.87 3.59
Other operating revenues :
- Export benefits* 78.05 115.36
- Others 11.80 17.89
6,248.27 6,029.95
# The following is an analysis of the companies revenue from its products and
services
Sale of Yarn 3,405.21 3,489.73
Sale of Fabric 2,119.42 2,068.59
Arcylic Fibre 251.76 192.84
Service income 0.87 3.59
Others (Sale of scrap, waste etc) 392.96 159.84
6,170.22 5,914.59
* Export benefits are in the nature of government grants covering following benefits
(a) Merchandise Exports from India Scheme(MEIS) 62.53 100.50
(b) Duty drawback benefits 15.52 14.86
78.05 115.36
29 Other income
Particulars For the year ended
March 31, 2018
For the year ended
March 31, 2017
(a) Interest income
Interest income 19.01 35.73
Interest income on employee loans 0.11 0.12
(b) Dividend income
Dividend Income from investment carried at cost - -
Dividend income from investments- carried at fair value through Profit or Loss 7.29 16.36
(c) Other Non Operating Income (Net of Expenses directly attributable to
such income)
Net gain on sale of investments-carried at fair value through Profit or Loss (net of reversal of fair valuation on disposal of investment)
34.96 28.86
Gain on sale of investment in joint venture - carried at cost (Refer note 47.5) - 252.24
Gain on fair valuation of Investments 86.84 99.68
Notes to Consolidated Financial Statementsfor the year ended March 31, 2018
(All amount in H crore, unless otherwise stated)

Corporate Overview Statutory Reports Financial Statements Notice 221
Particulars For the year ended
March 31, 2018
For the year ended
March 31, 2017
(d) Other gain
Claims received (net of expenses) 1.52 1.69
Provisions no longer required written back 8.38 3.61
Capital subsidy 1.83 1.89
Net gain on disposal of property, plant and equipment 4.81 64.15
Foreign exchange fluctuation gain (net) 9.12 26.61
Others 23.48 22.92
197.35 553.86
29 Other income (contd..)
30 Cost of materials consumed
Particulars For the year ended
March 31, 2018
For the year ended
March 31, 2017
Cotton 2,669.03 2,324.16
Manmade fibre 501.97 495.01
Acrylonitrile - Consumption 206.97 142.71
Yarn 7.35 23.36
Fabric 34.80 13.56
Others 18.16 17.00
3,438.28 3,015.80
31 Purchases of Stock-in-trade:
Particulars For the year ended
March 31, 2018
For the year ended
March 31, 2017
Yarn 2.64 0.03
Fabric - 0.29
Others 1.51 5.07
4.15 5.39
Notes to Consolidated Financial Statementsfor the year ended March 31, 2018
(All amount in H crore, unless otherwise stated)

Vardhman Textiles Ltd. Annual Report 2017-18222
32 Changes in inventories of finished goods, work-in-progress and stock-in-trade
Particulars For the year ended
March 31, 2018
For the year ended
March 31, 2017
Inventories at the beginning of the year
Work-in-progress 143.22 114.04
Finished goods 478.85 417.21
622.07 531.25
Inventories at the end of the year
Work-in-progress 150.57 143.22
Finished goods 509.37 478.85
659.94 622.07
(37.87) (90.82)
33 Employee benefits expense *
Particulars For the year ended
March 31, 2018
For the year ended
March 31, 2017
Salaries and wages 453.90 429.68
Contribution to provident and other funds 46.50 42.63
Staff welfare expenses 5.86 6.54
506.26 478.85
* Also refer note 46
34 Finance costs
Particulars For the year ended
March 31, 2018
For the year ended
March 31, 2017
Interest expense* 106.86 115.33
Other borrowing costs 11.33 13.35
118.19 128.68
*Interest expense is net of interest reimbursement of H43.56 crore (March 31, 2017 H60.33 crore ) under Technology upgradation fund scheme and H12.59 crore (March 31, 2017 H28.04 crore) under Madhya Pradesh state interest reimbursement on term loan.
Notes to Consolidated Financial Statementsfor the year ended March 31, 2018
(All amount in H crore, unless otherwise stated)

Corporate Overview Statutory Reports Financial Statements Notice 223
35 Other expenses
36 Tax balances
Particulars For the year ended
March 31, 2018
For the year ended
March 31, 2017
Power and fuel 627.09 596.13
Consumption of stores and spare parts 39.04 39.25
Packing materials and charges 78.58 81.87
Dyes and Chemical consumed 186.43 187.83
Rent 2.12 2.29
Repairs and maintenance to buildings 20.67 36.39
Repairs and maintenance to machinery 175.63 167.89
Insurance 5.61 6.92
Rates and taxes 6.51 4.77
Auditors remuneration:
- Audit fee 0.53 0.41
- Tax audit fee 0.09 0.10
- Reimbursement of expenses 0.17 0.13
- In other capacity 0.06 0.05
Bad debts written off 0.46 3.59
Excise duty consumed on sale of goods 5.85 32.50
Allowances for doubtful trade receivables and advances - 2.74
Forwarding charges and octroi 113.45 94.63
Commission to selling agents 45.17 50.51
Assets written off 3.39 4.38
Other miscellaneous expenses (Refer note 47.3) 123.64 109.05
1,434.49 1,421.43
The following is the analysis of deferred tax assets / (liabilities) presented in the standalone balance sheet
Notes to Consolidated Financial Statementsfor the year ended March 31, 2018
(All amount in H crore, unless otherwise stated)

Vardhman Textiles Ltd. Annual Report 2017-18224
36 Tax balances (contd..)
36.1 Deferred tax liabilities (Net)
Opening
Balance
Recognised in
profit or lossClosing
Balance
2017-18
Deferred tax assets
Expenses deductible in future years 20.87 3.41 24.28
Provision for doubtful debts / advances 1.74 0.02 1.76
MAT credit recoverable 15.50 1.15 16.65
Others -
38.11 4.58 42.69
Deferred tax liabilities
"Property, plant and equipment and
Intangible assets" 223.31 39.83 263.14
Investment in bonds, mutual funds and equity instruments 70.03 (35.31) 34.72
Others 0.46 (0.01) 0.45
293.80 4.51 298.31
Net deferred tax liabilities 255.69 (0.07) 255.62
(H in crore)
Opening
Balance
Recognised in
profit or lossClosing
Balance
2016-17
Deferred tax assets
Expenses deductible in future years 16.60 4.27 20.87
Provision for doubtful debts / advances 0.79 0.95 1.74
MAT credit recoverable 3.10 12.40 15.50
Others
20.49 17.62 38.11
Deferred tax liabilities
Property, plant and equipment and Intangible assets 219.13 4.18 223.31
Investment in bonds, mutual funds and equity instruments 34.53 35.50 70.03
Others 1.48 (1.02) 0.46
Defined benefit obligation
255.14 38.66 293.80
Net deferred tax liabilities 234.65 21.04 255.69
Note: Deferred tax assets and deferred tax liabilities have been offset as they are governed by the same taxation laws.
Notes to Consolidated Financial Statementsfor the year ended March 31, 2018
(All amount in H crore, unless otherwise stated)

Corporate Overview Statutory Reports Financial Statements Notice 225
36.2 Income tax recognised in profit or loss
(H in crore)
Particulars For the year ended
March 31, 2018
For the year ended
March 31, 2017
Current tax
In respect of the current year 165.01 302.64
Deferred tax
In respect of the current year 2.18 21.03
Total income tax expense recognised 167.19 323.67
(H in crore)
Particulars For the year ended
March 31, 2018
For the year ended
March 31, 2017
Profit before tax 759.63 1,317.94
Tax at the Indian Tax Rate of 34.608 % 262.33 448.36
Differential tax rate on capital gain on sale of investments (24.25) (48.01)
Effect of exempted dividend income (6.88) (5.30)
Effect of indexation benefit on value of investment (18.81) (39.89)
Effect of deduction under section 80-IA and 80-IC of the Income-tax Act, 1961 (35.88) (34.56)
Effect of deduction under section 32-AC of the Income-tax Act, 1961 - (10.25)
Effect of brought forward long term capital losses - (10.78)
Effect of expenses that are not deductible in determining taxable profit 2.61 0.94
Effect of change in tax rate 2.11 -
Others (14.04) 23.16
167.19 323.67
The income tax expense for the year can be reconciled to the accounting profit as follows
36.3 Income tax recognised in other comprehensive income
(H in crore)
Particulars For the year ended
March 31, 2018
For the year ended
March 31, 2017
Arising on income and expenses recognised in other comprehensive income 0.86 (0.19)
Total income tax recognised in other comprehensive income 0.86 (0.19)
36 Tax balances (contd..)
Notes to Consolidated Financial Statementsfor the year ended March 31, 2018
(All amount in H crore, unless otherwise stated)

Vardhman Textiles Ltd. Annual Report 2017-18226
37.1 Capital management
37 Financial instruments and risk management
(H in crore)
Particulars As at
March 31, 2018
As at
March 31, 2017
Debt 2,321.48 2,238.36
Cash & cash equivalents 70.38 42.29
Net Debt 2,251.10 2,196.07
Total Equity 4,953.70 4,273.23
Net debt to equity ratio 0.45 0.51
The Company manages its capital to ensure that it will be able to continue as going concern while maximizing the return to stakeholders through optimization of debt and equity balance. The capital structure of the Company consists of net debt (borrowings as detailed in note no.18 and offset by cash and bank balances) and total equity of the Company. The Company is not subject to any externally exposed capital requirements.
The capital includes issued equity capital, share premium and all other equity reserves attributable to the equity holders of the
Company. The primary objective of the Company’s capital management is to maintain optimum capital structure to reduce cost of capital and to maximize the shareholder value.
The Company manages its capital structure and makes adjustments in light of changes in economic conditions and the
requirements of the financial covenants which otherwise would permit the banks to immediately call loans and borrowings. In order to maintain or adjust the capital structure, the Company may adjust the dividend payment to shareholders, return capital
to shareholders or issue new shares.
The Company monitors capital using a gearing ratio, which is net debt divided by total capital . The Company’s gearing ratio was as follows:
The following table provides detail of the debt and equity at the end of the reporting year:
37.2 Financial instruments by category
Particulars As at March 31, 2018 As at March 31, 2017
FVTPL Fair Value
(Derivative
Instruments)
Amortised
Cost#
FVTOCI FVTPL Fair Value
(Derivative
Instruments)
Amortised
Cost#
FVTOCI
Financial Assets
Investments* 1,721.45 - - 6.21 1,786.93 - - 6.22 Trade Receivables - - 757.53 - - - 733.50 -
Cash and cash equivalents - - 70.38 - - - 42.29 -
Bank balances other
than above - - 3.38 - - - 2.36 -
Loans - - 30.39 - - - 30.32 -
Other financial assets - 2.09 25.66 - - - 36.49 -
1,721.45 2.09 887.34 6.21 1,786.93 - 844.96 6.22
Notes to Consolidated Financial Statementsfor the year ended March 31, 2018
(All amount in H crore, unless otherwise stated)

Corporate Overview Statutory Reports Financial Statements Notice 227
Particulars As at March 31, 2018 As at March 31, 2017
FVTPL Fair Value
(Derivative
Instruments)
Amortised
Cost#
FVTPL Fair Value
(Derivative
Instruments)
Amortised
Cost#
Financial Liabilities
Borrowings
(including current maturity of term loan) - - 2,321.48 - - 2,238.36 Trade Payables - - 239.86 - - 245.15 Other financial liabilities - 7.40 191.99 - - 189.02
- 7.40 2,753.33 - - 2,672.53
# Carrying value of the financial assets and financial liabilities designated at amortised cost approximates its fair value.* Investment value excludes investment in Associates/Joint ventures of H106.00 crore (March 31, 2017: H75.17 crore) which are shown at cost in balance sheet as per Ind AS 27 “Separate Financial Statements”.
Fair value hierarchy
The following table provides an analysis of financial instruments that are measured at fair value and have been grouped into Level 1, Level 2 and Level 3 below:
Level 1 Level 2 Level 3 Total
Financial Assets
Investments in mutual funds/bonds/
preference shares 341.64 1,356.60 - 1,698.24 Foreign currency / commodity forward contracts - 2.09 - 2.09 Quoted equity instruments 23.22 - - 23.22 Unquoted equity instruments - - 6.21 6.21
364.86 1,358.69 6.21 1,729.76
Financial Liabilities
Foreign currency / commodity forward
contracts - 7.40 - 7.40 - 7.40 - 7.40
As at March 31, 2018
As at March 31, 2017
Level 1 Level 2 Level 3 Total
Financial Assets
Investments in mutual funds/bonds/
preference shares 370.04 1,382.75 - 1,752.79 Quoted equity instruments 34.14 - - 34.14 Unquoted equity instruments 6.22 6.22
404.18 1,382.75 6.22 1,793.15 Financial Liabilities
- - - -
37 Financial instruments and risk management (contd..)
Notes to Consolidated Financial Statementsfor the year ended March 31, 2018
(All amount in H crore, unless otherwise stated)

Vardhman Textiles Ltd. Annual Report 2017-18228
Level 1:
Quoted prices in the active market. This level of hierarchy includes financial assets that are measured by reference to quoted prices in the active market. This category consists of open ended mutual funds.
Level 2:
Valuation techniques with observable inputs. This level of hierarchy includes items measured using inputs other than quoted prices included within Level 1 that are observable for such items, either directly or indirectly. This level of hierarchy consists of over the counter (OTC) derivative contracts.
Level 3:
Valuation techniques with unobservable inputs. This level of hierarchy includes items measured using inputs that are not based on observable market data (unobservable inputs). Fair value determined in whole or in part, using a valuation model based on assumptions that are neither supported by prices from observable current market transactions in the same instruments nor
based on available market data.
Sensitivity of Level 3 financial instruments are insignificant
The fair value of the financial instruments are determined at the amount that would be received to sell an asset in an orderly transaction between market participants. The following methods and assumptions were used to estimate the fair values:
Investments in mutual funds: Fair value is determined by reference to quotes from the financial institutions, i.e. net asset value (NAV) for investments in mutual funds declared by mutual fund house.
Derivative contracts: The Company has entered into various foreign currency contracts to manage its exposure to fluctuations in foreign exchange rates . These financial exposures are managed in accordance with the Company’s risk management policies and procedures. Fair value of derivative financial instruments are determined using valuation techniques based on information derived from observable market data, i.e., mark to market values determined by the Authorised Dealer Banks.
Quoted equity investments: Fair value is derived from quoted market prices in active markets.
Unquoted equity investments: Fair value is derived on the basis of net asset value approach, in this approach the net asset value is used to capture the fair value of these investments.
37 Financial instruments and risk management (contd..)
Reconciliation of Level 3 fair value measurements
Unlisted equity
instruments
As at April 1, 2016 6.16
Purchases -
Gain / (loss) recognised in OCI 0.06
As at March 31, 2017 6.22
Purchases -
Gain / (loss) recognised in OCI (0.01)
As at March 31, 2018 6.21
Notes to Consolidated Financial Statementsfor the year ended March 31, 2018
(All amount in H crore, unless otherwise stated)

Corporate Overview Statutory Reports Financial Statements Notice 229
37.3 Financial risk management
The Company’s corporate treasury function provides services to the business, coordinates access to the financial markets, monitors and manages the financial risks relating to operations of the Company through internal risk reports which analyse exposure by degree and magnitude of risk. These risks include market risk including currency risk, interest rate risk and other price risks, credit risk and liquity risk.
The Company seeks to minimize the effects of these risk by using derivate financial instruments to hedge risk exposure. The issue of financial derivatives is governed by the Company’s policy approved by the board of directors.
The principal financial assets of the Company include loans, trade and other receivables, and cash and bank balances that derive directly from its operations. The principal financial liabilities of the Company, include loans and borrowings, trade and other payables and the main purpose of these financial liabilities is to finance the day to day operations of the Company.
This note explains the risks which the Company is exposed to and policies and framework adopted by the Company to manage these risks.
37.3.1 Market risk
Market risk is the risk that the fair value of future cash flows of a financial instrument will fluctuate because of changes in market prices. Market prices comprise three types of risk: foreign currency risk, interest rate risk, investment risk.
A. Foreign currency risk management
The Company operates internationally and business is transacted in several currencies. The export sales of Company comprise around 38% of the total sales of the Company, Further the Company also imports certain assets and material from outside India. The exchange rate between the Indian rupee and foreign currencies has changed substantially in recent years and may fluctuate substantially in the future. Consequently, the Company is exposed to foreign currency risk and the results of the Company may be affected as the rupee appreciates/ depreciates against foreign currencies. Foreign exchange risk arises from the future probable transactions and recognized assets and liabilities denominated in a currency other than Company’s functional currency.
The Company measures the risk through a forecast of highly probable foreign currency cash flows and manages its foreign currency risk by appropriately hedging the transactions. The Company uses a combination of derivative financial instruments such as foreign exchange forward and option contracts to mitigate the risk of changes in exchange rates on foreign currency exposures.
The carrying amounts of the Company’s foreign currency denominated monetary assets and monetary liabilities at the end of
the reporting periods expressed in H, are as follows:
USD EUR CHF GBP JPY
Financial assets
Trade receivables 5.33 0.36 - - -
Foreign exchange derivative contracts* (7.55) (0.68) - - -
Net exposure to foreign currency risk (assets) - - - - -
Financial liablities
Trade payables 0.60 0.18 0.05 - 13.77 Borrowings - - - - -
Foreign exchange derivative contracts* (3.84) (0.54) (0.22) - (54.10)Net exposure to foreign currency risk (assets) - - - - -
Net exposure to foreign currency risk (net) - - - - -
As at March 31, 2018
37 Financial instruments and risk management (contd..)
Notes to Consolidated Financial Statementsfor the year ended March 31, 2018
(All amount in H crore, unless otherwise stated)

Vardhman Textiles Ltd. Annual Report 2017-18230
USD EUR CHF GBP JPY
Financial assets
Trade receivables 5.38 0.42 - - -
Foreign exchange derivative contracts* (5.29) (0.42) - - -
Net exposure to foreign currency risk (assets) 0.09 - - - -
Financial liablities
Trade payables and other financial liablities 0.43 0.08 0.08 - 6.15 Borrowings
Foreign exchange derivative contracts* (0.43) (0.08) - - (4.52)Net exposure to foreign currency risk (assets) - - 0.08 - 1.63
Net exposure to foreign currency risk (net) 0.09 - (0.08) - (1.63)
As at March 31, 2017
*Excess forwards sold against pending purchase order/sales order shipment
Foreign currency sensitivity analysis
The following table details the Company’s sensitivity to a 10 % increase and decrease in the H against the relevant foreign
currency. The sensitivity analysis includes only outstanding foreign currency denominated monetary items as tabulated above and adjusts their translation at the period end for 10% change in foreign currency rates. A positive number below indicates an increase in profit before tax or vice-versa.
Particulars Year ended March 31, 2018* Year ended March 31, 2017
J strengthens
by 10%
J weakens
by 10%
J strengthens
by 10%
J weakens
by 10%
Impact on profit /(loss) for the yearUSD - - 0.60 (0.60)EUR - - - (-)
CHF - - 0.51 (0.51)GBP - - - -
JPY - - 0.09 (0.09)
*Forex exposure is fully hedged at March 31, 2018
37 Financial instruments and risk management (contd..)
Foreign exchange derivative contracts
The Company uses derivative financial instruments exclusively for hedging financial risks that arise from its commercial business or financing activities. The Company’s Corporate Treasury team measures the risk through a forecast of highly probable foreign currency cash flows and manages its foreign currency cash flows by appropriately hedging the transactions. When a derivative is entered into for the purpose of being a hedge, the Company negotiates the terms of those derivatives to match the terms of
the hedged exposure. For hedges of forecast transactions the derivatives cover the period of exposure from the point the cash flows of the transactions are forecasted up to the point of settlement of the resulting receivable or payable that is denominated in the foreign currency. All identified exposures are managed as per the policy duly approved by the Board of Directors.
Notes to Consolidated Financial Statementsfor the year ended March 31, 2018
(All amount in H crore, unless otherwise stated)

Corporate Overview Statutory Reports Financial Statements Notice 231
The following table details the foreign currency derivative contracts outstanding at the end of the reporting period:
Outstanding Contracts* No of Deals Foreign Currency
(FCY Crore)
Nominal Amount (J Crore)
As at
March 31, 2018
As at
March 31, 2017
As at
March 31, 2018
As at
March 31, 2017
As at
March 31, 2018
As at
March 31, 2017
USD / INR Buy forward 37 43 3.68 3.07 243.81 205.22 USD / INR Sell Option 2 3 0.60 0.30 38.24 20.50USD / INR Buy Option 1 7 0.16 1.51 10.40 100.41USD / INR Sell forward 124 105 6.95 5.22 456.94 363.74 EUR / USD Sell forward - 6 - 0.36 - 25.37 EUR / USD Buy forward 1 2 0.19 0.06 15.51 4.30 EUR / INR Buy forward 5 4 0.35 0.05 27.89 3.67 EUR / INR Sell forward 27 14 0.68 0.41 54.60 30.04 JPY/INR Buy forward 1 2 54.10 4.52 31.90 2.65 USD/JPY buy forward - 1 - 5.08 - 3.02 USD/CHF Buy forward 1 2 0.22 0.05 15.36 3.55 CHF/INR Buy Forward 1 - 0.02 - 1.42 -
Fair value assets /(liabilities) (3.39) -
* Sensitivity on the above derivative contracts in respect of foreign currency exposure is insignificant
B. Interest rate risk management
Interest rate risk is the risk that the fair value or future cash flows of a financial instrument will fluctuate because of changes in market interest rates. The Company’s exposure to the risk of changes in market interest rates relates primarily to the Company’s debt obligations with floating interest rates.
As the Company has no significant interest-bearing assets, the income and operating cash flows are substantially independent of changes in market interest rates. The Company’s exposure to the risk of changes in market interest rates relates primarily to the Company’s debt obligations with floating interest rates, which are included in interest bearing loans and borrowings in these financial statements. The Company’s fixed rate borrowings are carried at amortised cost. They are therefore not subject to interest rate risk, since neither the carrying amount nor the future cash flows will fluctuate because of a change in market interest rates.
The following table demonstrates the sensitivity to a reasonably possible change in interest rates on that portion of loans and
borrowings affected. With all other variables held constant, the Company’s profit before tax is affected through the impact on floating rate borrowings, as follows:
Year ended
March 31, 2018
Year ended
March 31, 2017
H loans interest rate
decreases by 1 %
H loans interest rate
decreases by 1 %
Increase in profit before tax by 23.21 22.38
In case of increase in interest rate by above mentioned percentage, there would be a comparable impact on the profit before tax as mentioned above would be negative.
37 Financial instruments and risk management (contd..)
Notes to Consolidated Financial Statementsfor the year ended March 31, 2018
(All amount in H crore, unless otherwise stated)
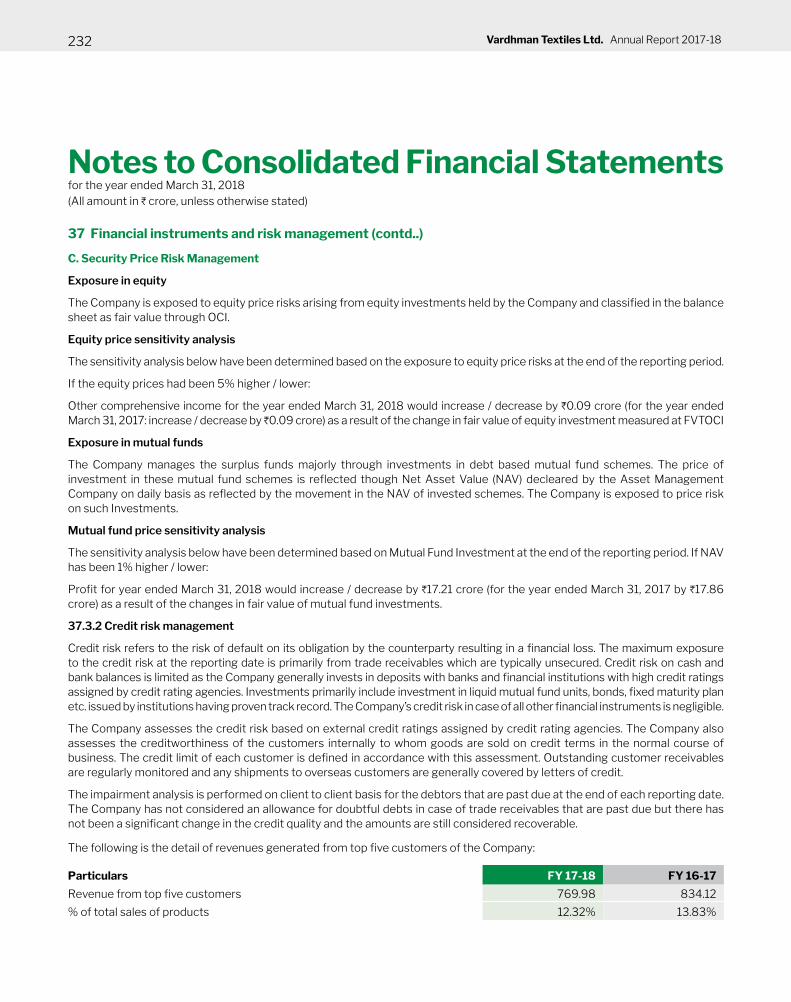
Vardhman Textiles Ltd. Annual Report 2017-18232
C. Security Price Risk Management
Exposure in equity
The Company is exposed to equity price risks arising from equity investments held by the Company and classified in the balance sheet as fair value through OCI.
Equity price sensitivity analysis
The sensitivity analysis below have been determined based on the exposure to equity price risks at the end of the reporting period.
If the equity prices had been 5% higher / lower:
Other comprehensive income for the year ended March 31, 2018 would increase / decrease by H0.09 crore (for the year ended March 31, 2017: increase / decrease by H0.09 crore) as a result of the change in fair value of equity investment measured at FVTOCI
Exposure in mutual funds
The Company manages the surplus funds majorly through investments in debt based mutual fund schemes. The price of investment in these mutual fund schemes is reflected though Net Asset Value (NAV) decleared by the Asset Management Company on daily basis as reflected by the movement in the NAV of invested schemes. The Company is exposed to price risk on such Investments.
Mutual fund price sensitivity analysis
The sensitivity analysis below have been determined based on Mutual Fund Investment at the end of the reporting period. If NAV has been 1% higher / lower:
Profit for year ended March 31, 2018 would increase / decrease by H17.21 crore (for the year ended March 31, 2017 by H17.86 crore) as a result of the changes in fair value of mutual fund investments.
37.3.2 Credit risk management
Credit risk refers to the risk of default on its obligation by the counterparty resulting in a financial loss. The maximum exposure to the credit risk at the reporting date is primarily from trade receivables which are typically unsecured. Credit risk on cash and bank balances is limited as the Company generally invests in deposits with banks and financial institutions with high credit ratings assigned by credit rating agencies. Investments primarily include investment in liquid mutual fund units, bonds, fixed maturity plan etc. issued by institutions having proven track record. The Company’s credit risk in case of all other financial instruments is negligible.
The Company assesses the credit risk based on external credit ratings assigned by credit rating agencies. The Company also assesses the creditworthiness of the customers internally to whom goods are sold on credit terms in the normal course of
business. The credit limit of each customer is defined in accordance with this assessment. Outstanding customer receivables are regularly monitored and any shipments to overseas customers are generally covered by letters of credit.
The impairment analysis is performed on client to client basis for the debtors that are past due at the end of each reporting date. The Company has not considered an allowance for doubtful debts in case of trade receivables that are past due but there has
not been a significant change in the credit quality and the amounts are still considered recoverable.
The following is the detail of revenues generated from top five customers of the Company:
Particulars FY 17-18 FY 16-17
Revenue from top five customers 769.98 834.12
% of total sales of products 12.32% 13.83%
37 Financial instruments and risk management (contd..)
Notes to Consolidated Financial Statementsfor the year ended March 31, 2018
(All amount in H crore, unless otherwise stated)

Corporate Overview Statutory Reports Financial Statements Notice 233
Financial assets for which loss allowance is measured:
Particulars As at
March 31, 2018
As at
March 31, 2017
Loans - Non-current 0.59 0.61 Loans - Current 29.80 29.71 Other financial assets - Non-current 9.40 10.09 Other financial assets - Current 18.35 26.40 Trade receivables 757.53 733.50 Loss Allowance is as follows:- 815.67 800.31
Loss allowance is as follows:
As at April 1, 2016 2.08
Provided during the year 2.94 Reversed during the year -
As at March 31, 2017 5.02
Provided during the year -
Reversed during the year -
As at March 31, 2018 5.02
Other than financial assets mentioned above, none of the Company’s financial assets are either impaired, and there were no indications that defaults in payment obligations would occur.
37.3.3 Liquidity Risk Management
The financial liabilities of the Company, other than derivatives, include loans and borrowings, trade and other payables. The Company’s principal sources of liquidity are cash and cash equivalents and the cash flow that is generated from operations. The Company monitors its risk of shortage of funds to meet the financial liabilities using a liquidity planning tool. The Company plans to maintain sufficient cash and marketable securities to meet the obligations as and when fall due. The below is the detail of contractual maturities of the financial liabilities of the Company at the end of each reporting period:
The table below analyses the Company’s financial liabilities into relevant maturity groupings based on their contractual maturities:
(H in crore)
Financial Assets Less than
1 year
More than 1 year
and upto 3 years
More than 3 year
and upto 5 years
More than
5 years
Total
As at March 31, 2018
Investments* 979.09 505.98 236.39 112.21 1,833.67 Trade Receivables 757.53 - - - 757.53 Cash and cash equivalents 70.38 - - - 70.38 Bank balances other than above 3.38 - - - 3.38 Loans 29.78 0.61 - - 30.39 Other financial assets 17.67 10.09 - - 27.76
1,857.83 516.68 236.39 112.21 2,723.11
37 Financial instruments and risk management (contd..)
Notes to Consolidated Financial Statementsfor the year ended March 31, 2018
(All amount in H crore, unless otherwise stated)

Vardhman Textiles Ltd. Annual Report 2017-18234
Financial Assets Less than
1 year
More than 1 year
and upto 3 years
More than 3 year
and upto 5 years
More than
5 years
Total
As at March 31, 2017
Investments 934.40 643.36 207.91 82.65 1,868.32
Trade Receivables 733.50 - - - 733.50
Cash and cash equivalents 42.29 - - - 42.29
Bank balances other than above 2.36 - - - 2.36
Loans 29.71 0.61 - - 30.32
Other financial assets 26.40 10.09 - - 36.49
1,768.66 654.06 207.91 82.65 2,713.28
Less than
1 year
More than 1 year
and upto 3 years
More than 3 year
and upto 5 years
More than
5 years
Total
As at March 31, 2018
Borrowings* 1,111.71 520.10 689.67 - 2,321.48
Trade payables 239.86 - - - 239.86
Other financial liabilities 199.39 0.65 - - 200.04
1,550.96 520.75 689.67 - 2,761.38
Less than
1 year
More than 1 year
and upto 3 years
More than 3 year
and upto 5 years
More than
5 years
Total
As at March 31, 2017
Borrowings* 1,495.66 581.83 150.62 10.25 2,238.36
Trade payables 245.15 - - - 245.15
Other financial liabilities 188.54 0.49 - - 189.02
1,929.35 582.32 150.62 10.25 2,672.53
* including Current Maturity of non-current borrowings
37 Financial instruments and risk management (contd..)
Notes to Consolidated Financial Statementsfor the year ended March 31, 2018
(All amount in H crore, unless otherwise stated)

Corporate Overview Statutory Reports Financial Statements Notice 235
38 Contingent liabilities and commitments
As at
March 31, 2018
As at
March 31, 2017
Sales tax, excise duty, etc* 11.17 11.33
Income-tax** 215.28 182.96
Others 5.62 4.36
a. Claims against the Company not acknowledged as debts:
* Amount deposited H1.30 crore (2017 : H1.35 crore)** Amount deposited H134.01 crore (2017 : H102.07 crore)
b. Liability on account of bank guarantees and letter of credit of H301.80 crore (2017: H117.58 crore)
c. The amounts shown above represents the best possible estimates arrived at on the basis of available information. The uncertainties and possible reimbursements are dependent on the outcome of the different legal processes which have been
invoked by the Company or the claimants as the case may be and therefore cannot be predicted accurately or relate to a present
obligations that arise from past events where it is either not probable that an outflow of resources will be required to settle or a reliable estimate cannot be made. The Company has been advised that it has strong legal positions against such disputes.
d. The Payment of Bonus (Amendment) Act 2015, notified on 31st December 2015, had revised the thresholds for coverage of employee eligible for Bonus and also enhanced the ceiling limits for computation of bonus retrospectively from 1st April
2014. Based on legal opinion, the Company has filed a writ petition in Hon’ble High Court of Punjab & Haryana contesting its retrospective applicability and the said jurisdictional High Court has granted stay on its retrospective operation. In view thereof, the company has not provided differential bonus pertaining to the period from 1st April 2014 to 31st March 2015 amounting to
H8.21 crore. However, the company has provided/paid bonus w.e.f. 1st April 2015 according to the amended provisions of the Payment of Bonus (Amendment) Act 2015.
38 Contingent liabilities and commitments
e. Capital and other commitments
As at
March 31, 2018
As at
March 31, 2017
(i) Estimated Amount of contracts remaining to be executed on capital account & not provided for (net of advance) 386.08 81.87
(ii) The Company has other commitments, for purchases / sales orders which are issued after considering requirements per
operating cycle for purchase / sale of goods and services, employee benefits including union agreements in normal course of business. The Company does not have any long term contracts including derivative contracts for which there will be any material foreseeable losses.
Notes to Consolidated Financial Statementsfor the year ended March 31, 2018
(All amount in H crore, unless otherwise stated)

Vardhman Textiles Ltd. Annual Report 2017-18236
Particulars As at
March 31, 2018
As at
March 31, 2017
Cost of shares of the Company* - 13.05Cost of shares of Vardhman Special Steels Limited 4.64 3.57Other recoverable 0.01 0.03
4.65 16.65
* The amount recoverable on account of equity shares of the Company held by the trust has been reduced from equity share capital & retained earnings.
39 (c) The detail of the amount recoverable from Mahavir Share Trust as at the close of the year is as under:
39 (a) The Company was holding its own Nil (March 31, 2017: 14,62,202 nos.) equity shares of H10 each through a Trust, which were
received by it in its capacity as a shareholder of Vardhman Holdings Limited, in accordance with the ‘Scheme of Arrangement and Demerger’. Out of above 1,36,539 shares were tendered during the year ended March 31, 2017 in terms of buy back announced by the Company. The value of shares held at the end of each reporting period has been adjusted in the equity in accordance with Ind AS 32. During the current year, the Company has sold remaining 14,62,202 shares in market for sales consideration of H182.23 crore
39 (b) The aforesaid Trust is also holding 5,32,911 equity shares (March 31, 2017: 3,19,748 nos.) of H10 each of Vardhman Special Steels Limited. Out of above 3,19,748 no of shares were allotted to it in the capacity of a shareholder of the Company by virtue of ‘Scheme of Arrangement & Demerger’ entered into by the Company, Vardhman Special Steels Limited and their respective shareholders and creditors.The aforesaid trust also purchased 2,13,163 equity shares in scheme of Right issue announced by Vardhman Special Steels Limited during the year.
As the aforesaid shares are held by a Trust on behalf of the Company and Company not being registered owner of shares, the
cost of these shares is not reflected in investments but same has been valued at cost as reflected in other current asset.
Notes to Consolidated Financial Statementsfor the year ended March 31, 2018
(All amount in H crore, unless otherwise stated)

Corporate Overview Statutory Reports Financial Statements Notice 237
41
Se
gm
en
t in
form
ati
on
(a) T
he g
roup
is p
rim
arily
in t
he b
usin
ess
of m
anuf
actu
ring
, pur
chas
e an
d sa
le o
f te
xtile
s &
fibr
e. T
he M
anag
ing
Dire
ctor
of
the
Com
pany
, whi
ch h
as b
een
iden
tifi
ed a
s be
ing
the
Chi
ef O
pera
ting
Dec
isio
n M
aker
(CO
DM
), ev
alua
tes
the
Com
pany
’s p
erfo
rman
ce,
allo
cate
reso
urce
s ba
sed
on th
e an
alys
is o
f the
var
ious
per
form
ance
indi
cato
r of t
he g
roup
as
text
iles
and
fibr
e. T
here
fore
, the
re
are
two
repo
rtab
le s
egm
ents
viz
text
iles
and
fibr
e.
Te
xil
es
Fib
reT
ota
l
Cu
rre
nt
Ye
ar
Pre
vio
us
ye
ar
Cu
rre
nt
Ye
ar
Pre
vio
us
ye
ar
Cu
rre
nt
Ye
ar
Pre
vio
us
ye
ar
Re
ve
nu
e
To
tal S
ale
s 5
,99
6.3
7 5
,828
.47
326
.93
3
67.
84
6
,323
.30
6
,19
6.3
1
Less
/- In
ter S
egm
ent S
ales
-
-
(75
.03
) (1
66
.36
) (7
5.0
3)
(16
6.3
6)
Ex
tern
al S
ale
s 5
,99
6.3
7
5,8
28
.47
2
51.
90
20
1.4
86
24
8.2
76
02
9.9
5
Oth
er
Inc
om
e4
8.3
7 1
42.
93
2
0.8
0
23
.93
6
9.1
7 1
66
.86
Una
lloca
ted
Oth
er In
com
e 1
28.1
8
38
7.0
0
To
tal R
ev
en
ue
6,0
44
.74
5
,97
1.4
0
27
2.7
02
25
.41
6,4
45
.62
6
,58
3.8
1
Re
su
lt
Se
gm
en
t re
sult
s 7
60
.91
1,0
70.4
0
47.
15
57.
50
8
08
.06
1
,127
.90
Una
lloct
aed
Cor
pora
te e
xpen
ses/
(Inco
me)
(Net
) (5
2.25
) (2
81.
86
)
Op
erat
ing
pro
fit
86
0.3
1 1
,40
9.7
6
Fin
an
ce
co
st 1
18.1
9
128
.68
Inc
om
e f
rom
Ass
oc
iate
s/jo
int
ven
ture
s 1
7.5
1 3
6.8
6
Pro
fit
bef
ore
tax
75
9.6
3
1,3
17.9
4
Pro
vis
ion
fo
r ta
xa
tio
n
Cur
rent
tax
and
defe
rred
tax
16
7.19
3
23.6
7
Pro
fit
afte
r ta
x 5
92
.44
9
94
.27
Oth
er
info
rma
tio
n
Se
gm
en
t a
sse
ts5
86
3.0
15
144
.53
89
.43
39
1.8
6 6
,25
2.4
4
5,5
36
.36
Una
lloca
ted
corp
orat
e as
sets
199
1.6
5 1
,96
4.6
9
To
tal a
ss
ets
8,2
44
.09
7
,50
1.0
5
No
tes
to
Co
ns
olid
ate
d F
ina
nc
ial S
tate
me
nts
for
the
ye
ar
en
de
d M
arc
h 3
1, 2
018
(All
am
ou
nt
in H
cro
re, u
nle
ss o
the
rwis
e s
tate
d)

Vardhman Textiles Ltd. Annual Report 2017-18238
Te
xil
es
Fib
reT
ota
l
Cu
rre
nt
Ye
ar
Pre
vio
us
ye
ar
Cu
rre
nt
Ye
ar
Pre
vio
us
ye
ar
Cu
rre
nt
Ye
ar
Pre
vio
us
ye
ar
To
tal e
qu
ity
an
d li
ab
ilit
ies
Eq
uit
y (S
ha
re c
ap
ita
l an
d o
the
r e
qu
ity
) 4
,95
3.7
0
4,2
73.2
3
No
n c
on
tro
llin
g in
tere
st 1
08
.78
1
12.1
9
Seg
men
t Lia
bilit
ies
477
.12
45
9.1
84
8.5
874
.98
525
.70
5
34
.16
Se
cu
red
an
d u
nse
cu
red
loa
ns
2,3
21.4
8
2,2
38
.38
Una
lloct
aed
Cor
pora
te L
iabi
litie
s78
.81
87.
40
Def
erre
d Ta
x Li
abili
ties
25
5.6
2 2
55
.69
To
tal e
qu
ity
an
d li
ab
ilit
ies
8,2
44
.09
7
,50
1.0
5
Cap
ital
exp
endi
ture
28
7.3
4
329
.67
1.9
1 1
.09
2
89
.25
3
30
.76
De
pre
cia
tio
n &
Am
ort
isa
tio
n22
8.9
8 3
33
.59
4
.73
4
.61
23
3.7
1 3
38
.20
Una
lloca
ted
Cor
pora
te D
epre
ciat
ion
&
Am
ort
isa
tio
n
6.2
9
5.2
0
To
tal D
ep
rec
iati
on
24
0.0
0
34
3.4
0
41
Se
gm
en
t in
form
ati
on
(c
on
td..)
No
tes
to
Co
ns
olid
ate
d F
ina
nc
ial S
tate
me
nts
for
the
ye
ar
en
de
d M
arc
h 3
1, 2
018
(All
am
ou
nt
in H
cro
re, u
nle
ss o
the
rwis
e s
tate
d)
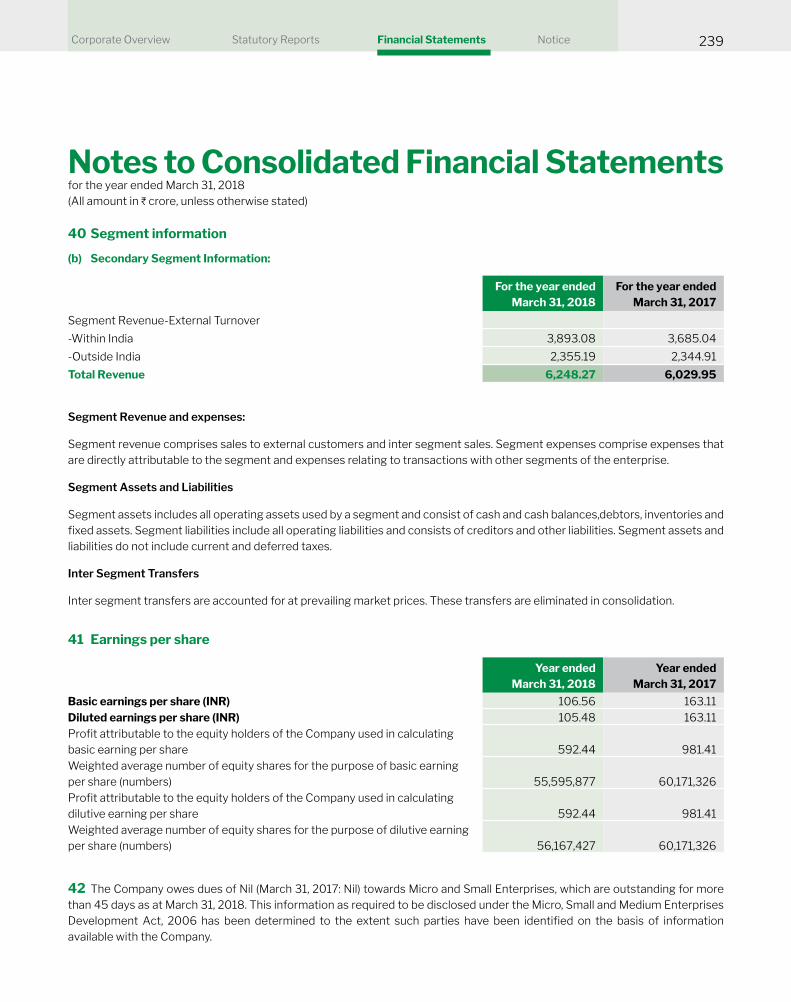
Corporate Overview Statutory Reports Financial Statements Notice 239
Year ended
March 31, 2018
Year ended
March 31, 2017
Basic earnings per share (INR) 106.56 163.11 Diluted earnings per share (INR) 105.48 163.11 Profit attributable to the equity holders of the Company used in calculating basic earning per share 592.44 981.41 Weighted average number of equity shares for the purpose of basic earning
per share (numbers) 55,595,877 60,171,326
Profit attributable to the equity holders of the Company used in calculating dilutive earning per share 592.44 981.41 Weighted average number of equity shares for the purpose of dilutive earning
per share (numbers) 56,167,427 60,171,326
41 Earnings per share
40 Segment information
(b) Secondary Segment Information:
For the year ended
March 31, 2018
For the year ended
March 31, 2017
Segment Revenue-External Turnover
-Within India 3,893.08 3,685.04
-Outside India 2,355.19 2,344.91
Total Revenue 6,248.27 6,029.95
Segment Revenue and expenses:
Segment revenue comprises sales to external customers and inter segment sales. Segment expenses comprise expenses that are directly attributable to the segment and expenses relating to transactions with other segments of the enterprise.
Segment Assets and Liabilities
Segment assets includes all operating assets used by a segment and consist of cash and cash balances,debtors, inventories and
fixed assets. Segment liabilities include all operating liabilities and consists of creditors and other liabilities. Segment assets and liabilities do not include current and deferred taxes.
Inter Segment Transfers
Inter segment transfers are accounted for at prevailing market prices. These transfers are eliminated in consolidation.
42 The Company owes dues of Nil (March 31, 2017: Nil) towards Micro and Small Enterprises, which are outstanding for more than 45 days as at March 31, 2018. This information as required to be disclosed under the Micro, Small and Medium Enterprises Development Act, 2006 has been determined to the extent such parties have been identified on the basis of information available with the Company.
Notes to Consolidated Financial Statementsfor the year ended March 31, 2018
(All amount in H crore, unless otherwise stated)

Vardhman Textiles Ltd. Annual Report 2017-18240
43 Leases
The Company has leased facilities under cancellable and non-cancellable operating leases arrangements with a lease term
ranging from one to ninety nine years, which are subject to renewal at mutual consent thereafter. The cancellable arrangements can be terminated by either party after giving due notice. The lease rent expenses recognised during the year amounts to H2.12 crore (March 31, 2017: H2.29 crore). The future minimum lease payments in respect of the non-cancellable operating leases are:
As at
March 31, 2018
As at
March 31, 2017
Within one year 1.36 1.55 After one year but not more than five years 3.33 3.33 More than five years 37.27 44.92
41.96 49.80
44 Share based payments - Employee Share option plan of the Company
(i) Detail of employee share option of the Company: The Company has a share option scheme for senior employees of the Company. In accordance with the terms of the plan as approved by shareholders, eligible employees may be granted options to purchase equity shares. Each employee share option convert into one equity share of the Company on exercise. Exercise price payable by the recipient is determined as per scheme. The options when allotted carry rights to dividend and voting power at par with other equity shares. Options may be exercised at the time of vesting to the date of their expiry.
(ii) The number of options granted is in accordance with employee stock option scheme approved by the shareholders and is
subject to approval by the remuneration committee. The scheme rewards senior employees to the extent of Company’s and the individual’s achievement judged against both qualitative and quantitative criteria.
(iii) The following share payments arrangement is in existence during the current year (none in previous year).
Option Detail Number Grate Date Exercise
Period
Exercise Price
(H)
Fair value of option at
grant date
(H)
Vardhman Employee Stock Option 2016 6,04,500 15th Nov-16 2 years
from the
date of
vesting
815/- 352
3,000 9th Feb-17 815/- 352
6,500 10th May-17 815/- 352
6,14,000
Details of vesting
Vesting period from grant date Vesting schedule
On completion of 12 months 10%
On completion of 24 months 20%
On completion of 36 months 20%
On completion of 48 months 20%
On completion of 60 months 30%
(iv) During the current year, the vesting of 61,400 equity shares was due but only 49,250 have been exercised during the year.
Notes to Consolidated Financial Statementsfor the year ended March 31, 2018
(All amount in H crore, unless otherwise stated)

Corporate Overview Statutory Reports Financial Statements Notice 241
Inputs into the model Particulars
Grant date share price (H) 1,056.60 Exercise price (H) 815
Expected volatility 33.78%Option life 2 years
Dividend yield 1.92%Risk free Interest Rate 6.31%
(v) Fair value of options/shares granted in the year
Call option value per option unit using black scholes method is H427.63. The following inputs have been used for computing the fair value:
44 Share based payments - Employee Share option plan of the Company (contd..)
(vi) Moment of share options
Particulars 2017-18 2016-17
Number of
options
Weighted
Average
Exercise price
(H)
Number of
options
Weighted
Average
Exercise price
(H)
Balance at beginning of year 6,07,500 - -
Granted during the year 6,500 815 6,07,500 815
Forfeited during the year - - -
Exercised during the year 49,250 815 - -
Expired during the year - - -
Balance at end of year 5,64,750 - 6,07,500 -
(vii) Share options exercised during the year*
(viii) Amount accounted for in profit and loss for Employee stock options is H12.07 crore.
* For 6,800 shares application money has been received upto 31-03-2018 but allotment was made on 09-04-2018.
Notes to Consolidated Financial Statementsfor the year ended March 31, 2018
(All amount in H crore, unless otherwise stated)
Exercised Exercise date Share price at
exercise date
Granted as per para (iii) above 42,450 08-01-2018 1,405.75

Vardhman Textiles Ltd. Annual Report 2017-18242
45 Related party transactions
45.1 Description of related parties
Joint ventures Key management personnel (KMP)
Vardhman Nisshimbo Garments Company Limited Mr. S.P. Oswal, Chairman and Managing Director
Mr. Sachit Jain, Joint Managing Director
Mrs. Suchita Jain, Joint Managing Director
(w.e.f. August 24, 2016)
Mr. Neeraj Jain, Joint Managing Director
Mr. B.K Choudhary, Managing Director
Associates Mr. Rajeev Thapar, Chief Financial Officer
Vardhman Yarns and Threads Limited Mr. Vivek Gupta, Chief Financial Officer
Vardhman Spinning and General Mills Limited Ms. Karan Kamal Walia, Company Secretary
Vardhman Special Steels Limited upto (1-05-2017)
Mr. Sanjay Gupta, Company Secretary (w.e.f. 01-06-2017)
Ms.Ruchita Vij, Company Secretary upto (August 2017)
Mr.Ankur Gauba, Company Secretary w.e.f (February 2018)
Mr.Satin Katyal, Company Secretary
Relative of KMP
Ms. Soumya Jain
Ms. Sagrika Jain
Post Employment Benefit Plans Trust Enterprises over which KMP have significant influence
Mahavir Employee Gratuity Fund Trust Vardhman Holdings Limited
VAL Gratuity Trust Fund Vardhman Apparels Limited
VMT Gratuity Trust Fund Smt. Banarso Devi Oswal Public Charitable Trust
Mahavir Superannuation scheme Sri Aurobindo Socio Economic and Management Research Institute
VAL Superannuation scheme Adhiswar Enterprises LLP
VMT Superannuation scheme Devakar Investment and Trading Company Private Limited
Santon Finance and Investment Company Limited
Flamingo Finance and Investment Company Limited
Ramaniya Finance and Investment Company Limited
Mahavir Spinning Mills Private Limited
Northern Trading Company
Amber Syndicate
Paras Syndicate
Mahavir Traders
Notes to Consolidated Financial Statementsfor the year ended March 31, 2018
(All amount in H crore, unless otherwise stated)

Corporate Overview Statutory Reports Financial Statements Notice 243
45.2 Transactions with related parties
For the year ended
March 31, 2018
For the year ended
March 31, 2017
Sale /processing of goods to:
Associates 5.31 6.71
Joint ventures 15.97 13.98
Enterprises over which KMP have significant influence 31.55 18.29
52.83 38.98
Purchase/processing of goods from:
Associates 17.73 10.83
Joint ventures 0.31 0.06
18.04 10.89
Purchase of property, plant & equipment from:
Associates 0.31 28.22
0.31 28.22
Sales of property, plant & equipment to:
Associates 0.81 63.57
Joint Venture - 0.02
0.81 63.59
Rent paid
Associates - -
Enterprises over which KMP have significant influence 0.12 0.10
0.12 0.10
Rent received
Associates 0.23 0.34
0.23 0.34
Dividend received
Associates 6.09 -
6.09 -
Interest received
Associates 1.10 1.18
Joint Venture 0.90 0.92
2.00 2.10
Reimbursement of expenses received from
Associates 0.12 5.91
Joint Venture 0.16 0.03
0.28 5.94
Notes to Consolidated Financial Statementsfor the year ended March 31, 2018
(All amount in H crore, unless otherwise stated)

Vardhman Textiles Ltd. Annual Report 2017-18244
For the year ended
March 31, 2018
For the year ended
March 31, 2017
Reimbursement of expenses paid
Associates 0.32 4.85
Joint Venture 0.06 0.16
0.38 5.01
Purchase of DEPB Licences
Associates - 0.07
- 0.07
Recepit against corporate services agreement
Associates 4.16 4.20
Joint Venture 0.03 0.03
4.19 4.23
Payment against licence agreement
Enterprises over which KMP have significant influence 1.56 1.56
1.56 1.56
Donations to
Enterprises over which KMP have significant influence 14.82 4.19
14.82 4.19
Salary paid to
Relatives of KMP 0.10 0.07
0.10 0.07
Loan given to
Joint Venture 14.49 13.99
14.49 13.99
Loan received back from
Joint Venture 2.50 2.00
2.50 2.00
Contribution to post employment benefit plans
Post Employment Benefit Plans Trust 3.68 4.70
3.68 4.70
45.2 Transactions with related parties (contd..)
Notes to Consolidated Financial Statementsfor the year ended March 31, 2018
(All amount in H crore, unless otherwise stated)

Corporate Overview Statutory Reports Financial Statements Notice 245
45.3 Outstanding Balances:
As at
March 31, 2018
As at
March 31, 2017
Receivables
Associates - 0.04
Joint Venture 7.49 2.96
7.49 3.00
Payables
Associates 4.48 4.80
4.48 4.80
Loan given outstanding
Associates 15.00 15.00
Joint Venture 11.99 11.99
26.99 26.99
45.4 Key management personnel compensation
For the year ended
March 31, 2018
For the year ended
March 31, 2017
Short-term benefits* 22.16 31.83
22.16 31.83
* excluding provision for employee benefits,employee stock options but includes sitting fees and commission paid / payable to non executive directors
46 Employee benefits
46.1 Defined contribution plans:
For the year ended
March 31, 2018
For the year ended
March 31, 2017
Superannuation fund 0.95 0.94
Provident fund administered through Regional Provident Fund Commissioner 27.26 26.59
Employees’ State Insurance Corporation 8.30 7.19
Other Funds 0.17 0.36
36.68 35.08
Amounts recognized in the statement of profit and loss are as under:
The expenses incurred on account of the above defined contribution plans have been included in Note 33 “Employee Benefits Expenses” under the head “Contribution to provident and other funds”
Notes to Consolidated Financial Statementsfor the year ended March 31, 2018
(All amount in H crore, unless otherwise stated)

Vardhman Textiles Ltd. Annual Report 2017-18246
46.2 Defined benefit plans
The Company sponsors funded defined benefit plan for qualifying employees. This defined benefit plan of gratuity is administered by a separate trust that is legally separate from the entity. The trustees are required by the law to act in the interest of the trust and all the relevant stakeholders i.e. active employees, inactive employees, retired employees and employers, etc. The trust is responsible for investment policy with regard to the assets of the trust. The Company has a gratuity plan wherein every employee is entitled to the benefit equivalent to 15 days salary last drawn for each completed year of service. Gratuity is payable to all eligible employees of the Company on retirement, separation, death or permanent disablement, in terms of the provisions
of the Payment of Gratuity Act, 1972 or as per the Company’s plan, whichever is more beneficial.
(i) These plans typically expose the Company to actuarial risks such as investment risk, interest rate risk, longevity risk and
salary risk.
Investment Risk
The probability or likelihood of occurrence of losses relative to the expected return on any particular investment.
Salary Risk
The present value of defined benefit plan is calculated with the assumption of salary increase rate of plan participants in future. Deviation in rate of increase in salary in future for plan participants from the rate of increase in salary used to determine the
present value of obligation will have a bearing on the plan’s liability.
Interest Risk
The plan exposes the Company to the risk of fall in interest rates. A fall in interest rates will result in an increase in the ultimate cost of providing the above benefit and will thus result in an increase in value of the liability.
Longevity Risk
The present value of defined benefit plan liability is calculated by reference to the best estimate of the mortality of plan participants both during and after employment. An increase in the life expectancy of the plan participants will increase the plans liability.
(ii) The principal assumption used for the purpose of the actuarial valuation were as follows:
As at
March 31, 2018
As at
March 31, 2017
Discount Rate 7.71% 7.35%
Salary increase 6.00% 6.00%
Expected average remaining working life 27.53 years 26.94 years
Mortality Rates IALM (2006-08) IALM (2006-08)
Method used Project unit credit
method
Project unit credit
method
The cost of the defined benefit plans and other long term benefits are determined using actuarial valuations. An actuarial valuations involves making various assumptions that may differ from actual developments in the future. These includes the determination of the discount rate, future salary increases and mortality rate. Due to these complexity involved in the valuation it is highly sensitive to the changes in these assumptions. All assumptions are reviewed at each reporting date. The present value of the defined benefit obligation and the related current service cost and planned service cost were measured using the projected unit cost method.
Notes to Consolidated Financial Statementsfor the year ended March 31, 2018
(All amount in H crore, unless otherwise stated)

Corporate Overview Statutory Reports Financial Statements Notice 247
46 Employee benefits (contd..)
(iv) Amounts recognised in Other Comprehensive Income:
For the year ended
March 31, 2018
For the year ended
March 31, 2017
Current Service cost 7.56 7.32 Past service cost and (gain) /loss from settlements 2.04 -
Net interest expenses 0.21 0.23 9.81 7.55
For the year ended
March 31, 2018
For the year ended
March 31, 2017
Return on plan assets (excluding amounts included in net interest expenses) 0.37 0.75 Actuarial gain/(losses) arising from changes in financial assumptions - -
Actuarial gain/(losses) arising from changes in experience adjustments 2.10 (1.35) 2.47 (0.60)
The current service cost,past service cost and the net interest expenses for the year are included in Note 33 “Employee Benefits Expenses” under the head “Contribution to provident and other funds”.
(v)Theamountincludedinbalancesheetarisingfromtheentity’sobligationinrespectofitsdefinedbenefitplansisasfollows:
As at
March 31, 2018
As at
March 31, 2017
Present value of funded defined benefit obligation 57.91 51.46 Fair Value of Plan Assets 55.60 48.67 Surplus / (Deficit) (2.31) (2.79)
Effect of asset ceiling, if any - -
Net assets / (liability) (2.31) (2.79)
(iii)Amountsrecognisedinstatementofprofitandlossinrespectofthesebenefitplansareasfollows:
(vi)Movementsinthepresentvalueofdefinedbenefitobligationareasfollows:
For the year ended
March 31, 2018
For the year ended
March 31, 2017
Opening defined benefit obligation 51.46 44.64 Transferred during the year 0.15 Current Service Cost 7.56 7.31 Interest Cost 3.97 3.51 Actuarial (gain)/losses arising from changes in financial assumptions - -
Past service cost including curtailment gains/losses 2.04 -
Actuarial (gain)/losses arising from changes in experience adjustments (2.10) 1.35 Benefits paid (5.02) (5.50)Closing defined benefit obligation 57.91 51.46
Notes to Consolidated Financial Statementsfor the year ended March 31, 2018
(All amount in H crore, unless otherwise stated)
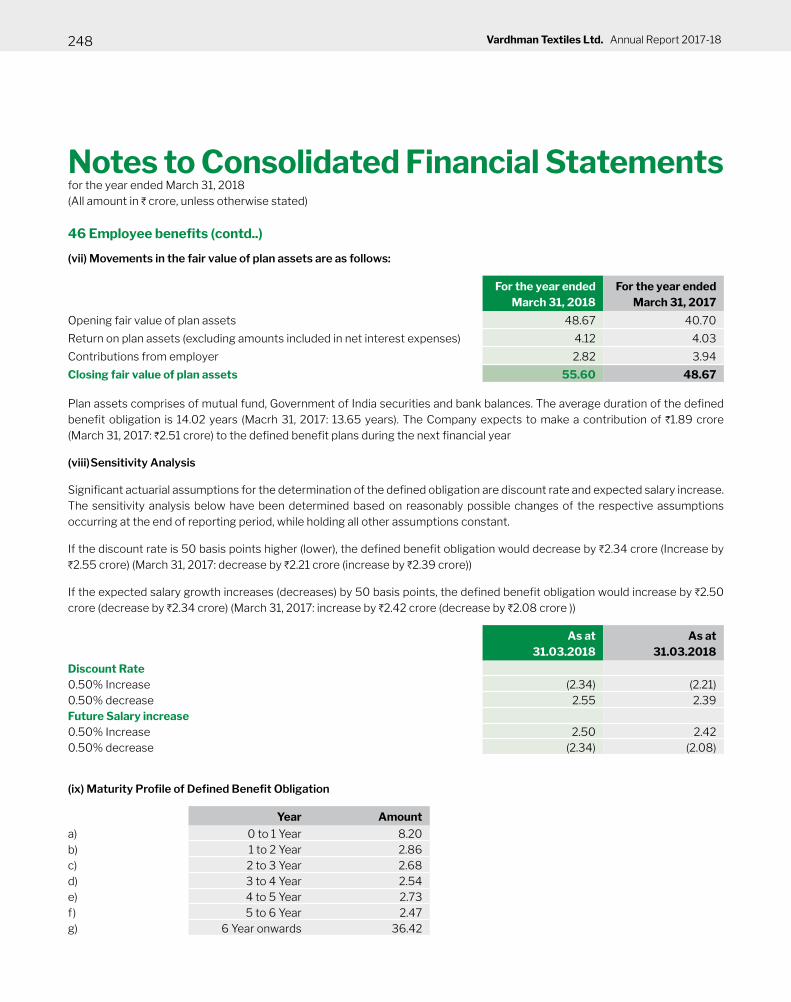
Vardhman Textiles Ltd. Annual Report 2017-18248
46 Employee benefits (contd..)
(vii) Movements in the fair value of plan assets are as follows:
For the year ended
March 31, 2018
For the year ended
March 31, 2017
Opening fair value of plan assets 48.67 40.70
Return on plan assets (excluding amounts included in net interest expenses) 4.12 4.03
Contributions from employer 2.82 3.94
Closing fair value of plan assets 55.60 48.67
Plan assets comprises of mutual fund, Government of India securities and bank balances. The average duration of the defined benefit obligation is 14.02 years (Macrh 31, 2017: 13.65 years). The Company expects to make a contribution of H1.89 crore (March 31, 2017: H2.51 crore) to the defined benefit plans during the next financial year
(viii) Sensitivity Analysis
Significant actuarial assumptions for the determination of the defined obligation are discount rate and expected salary increase. The sensitivity analysis below have been determined based on reasonably possible changes of the respective assumptions
occurring at the end of reporting period, while holding all other assumptions constant.
If the discount rate is 50 basis points higher (lower), the defined benefit obligation would decrease by H2.34 crore (Increase by H2.55 crore) (March 31, 2017: decrease by H2.21 crore (increase by H2.39 crore))
If the expected salary growth increases (decreases) by 50 basis points, the defined benefit obligation would increase by H2.50 crore (decrease by H2.34 crore) (March 31, 2017: increase by H2.42 crore (decrease by H2.08 crore ))
As at
31.03.2018
As at
31.03.2018
Discount Rate
0.50% Increase (2.34) (2.21)0.50% decrease 2.55 2.39 Future Salary increase
0.50% Increase 2.50 2.42 0.50% decrease (2.34) (2.08)
(ix)MaturityProfileofDefinedBenefitObligation
Year Amount
a) 0 to 1 Year 8.20 b) 1 to 2 Year 2.86 c) 2 to 3 Year 2.68 d) 3 to 4 Year 2.54 e) 4 to 5 Year 2.73 f) 5 to 6 Year 2.47 g) 6 Year onwards 36.42
Notes to Consolidated Financial Statementsfor the year ended March 31, 2018
(All amount in H crore, unless otherwise stated)

Corporate Overview Statutory Reports Financial Statements Notice 249
46 Employee benefits (contd..)
47 Additional disclosures
46.3 Other long term employee benefit
(i) Amount recognised in profit and loss in note no.33 “Employee benefit expense” under the head “Salaries and Wages” towards leave encashment is is H3.06 crore (March 31, 2017 H6.95 core)
(ii) Amount taken to balance sheet
2017-18 2016-17
Current 3.19 1.99
Non Current 7.69 9.56
47.1 Disclosure required by Regulation 34 read with Schedule V of SEBI (Listing obligations and Disclosure Requirements) Regulations,2015:-
(i) The Company has given inter corporate deposits aggregating to Nil (March 31, 2017: Nil) to Vardhman Special Steels Limited during the year. The maximum amount outstanding during the year was H15.00 crore (March 31, 2017: H15.00 crore). The balance outstanding as on March 31, 2018 is H15.00 crore (March 31, 2017: H15.00 crore).
(ii) The Company has given inter corporate deposits aggregating to 2.50 crore (March 31, 2017: H2.00 crore) to Vardhman Nisshinbo Garments Company Limited during the year. The maximum amount outstanding during the year was H14.49 crore (March 31, 2017: H11.99 crore). The balance outstanding as on March 31, 2018 is H11.99 crore (March 31, 2017: H11.99 crore).
47.2 Assets pledged as security:
Particulars As at
March 31, 2018
As at
March 31, 2017
Current assets
Financial assets
Trade receviables 757.53 733.50
Non-financial assets
Inventory 2,256.64 1,752.81
Total current assets pledged as security 3,014.17 2,486.31
Non-current assets
Property, plant & equipment 2,614.59 2,571.31
Total non-current assets pledged as security 2,614.59 2,571.31
Total assets pledged as security 5,628.76 5,057.62
Notes to Consolidated Financial Statementsfor the year ended March 31, 2018
(All amount in H crore, unless otherwise stated)

Vardhman Textiles Ltd. Annual Report 2017-18250
47.3 Amount required to be spent as per section 135 of the Companies Act 2013.
(c) Activity
Amount
Promoting Education 10.24
Promoting Healthcare 2.83
Rural Development Projects 1.79
Measures for the benefit of armed forces veterans, war widows and their dependents 0.01
Promoting Art and Culture 0.03
Environmental Sustainability 0.37
Total 15.27
47.4 There has been no delay in transferring amounts, required to be transferred, to the investor education and protection fund
(IEPF) by the parent and its subsdary companies,associate companies and joint venture company.
47.5 During the financial year 2016-17, the company has sold its 40% equity stake in Vardhman Yarns & Threads Limited (VYTL), equivalent to 22,802,541 equity shares, to its Joint Venture partner namely American & Efird Global (A & E). Now the company holds 11% equity stake in VYTL equivalent to 62,69,699 equity shares. In view of changed situation, Vardhman Yarns and Threads Limited was Joint Venture of Vardhman Textiles Limited upto 31.08.2016 but it has become the associate of Vardhman Textiles Limited w.e.f. 01.09.2016
47 Additional disclosures (contd..)
47.3 Amount required to be spent as per section 135 of the Companies Act 2013.
Details of expenditure towards Corporate Social Responsibility (CSR) activities:
a) Gross amount required to be spent by the Group during the year was H17.98 crore (March 31, 2017 H15.43 crore).
b) Amount spent during the year :H15.27 crore (March 31, 2017 H5.92 crore)
Amount unspent during the year was H2.71 crore (March 31, 2017 H9.51 crore).
Notes to Consolidated Financial Statementsfor the year ended March 31, 2018
(All amount in H crore, unless otherwise stated)

Corporate Overview Statutory Reports Financial Statements Notice 251
48 Interest in Other Entities
(a) The Consolidated Financial Statements present the Consolidated Accounts of Vardhman Textiles Limited with its following Subsidiaries, Joint Ventures & Associates.
Name of Company Country of
Incorporation
Proportion of Ownership of Interest
Activities As at
March 31, 2018
As at
March 31, 2017
A. Subsidiaries
(i) Vardhman Acrylics Limited India Fibre 70.74% 70.74% (ii) VMT Spinning Co. Limited India Textiles 100.00% 89.44% (iii) VTL Investments Limited India Lending & Investing 100.00% 100.00%B. Joint Ventures
(i) Vardhman Nisshinbo Garments Co. Limited India
Manufacturing &
Sales of Garments 51.00% 51.00%C. Associates
(i) Vardhman Yarns & Threads Limited #India
Manufacturing &
Sales of Threads 11.00% 11.00% (ii) Vardhman Spinning & General Mills
Limited India
Trading of Cotton &
Manmade Fibre 50.00% 50.00% (iii) Vardhman Special Steels Limited
India
Manufacturing of
Steels 27.20% 32.61%
Notes to Consolidated Financial Statementsfor the year ended March 31, 2018
(All amount in H crore, unless otherwise stated)

Vardhman Textiles Ltd. Annual Report 2017-18252
48
In
tere
st
in O
the
r E
nti
tie
s (
co
ntd
..)
(b) S
um
ma
rize
d F
ina
nc
ial I
nfo
rma
tio
n
Pa
rtic
ula
rsJo
int
Ve
ntu
reA
ss
oc
iate
s
Va
rdh
ma
n N
iss
hin
bo
Ga
rme
nts
Co
. Lim
ite
d
Va
rdh
ma
n Y
arn
s &
Th
rea
ds
Lim
ite
d
Va
rdh
ma
n S
pin
nin
g &
Ge
ne
ral M
ills
Lim
ite
d
Va
rdh
ma
n S
pe
cia
l Ste
els
Lim
ite
d
As
at
Ma
rch
31,
20
18
As
at
Ma
rch
31,
20
17
As
at
Ma
rch
31,
20
18
As
at
Ma
rch
31,
20
17
As
at
Ma
rch
31,
20
18
As
at
Ma
rch
31,
20
17
As
at
Ma
rch
31,
20
18
As
at
Ma
rch
31,
20
17
I.
As
se
ts
(A
) N
on
Cu
rre
nt
As
se
ts 2
4.0
8
24
.92
30
3.3
4
310
.99
-
-
2
78.8
3
277
.60
(B
) C
urr
en
t A
ss
ets
i) C
ash
& C
ash
Eq
uiv
ale
nt
-
0.1
2 2
1.5
5
29
.96
0
.13
0
.13
7
.49
5
.95
ii)
Oth
ers
3
2.3
9
28
.10
3
43
.72
33
5.3
9
0.0
3
0.0
2 3
90
.34
3
29.1
3
To
tal C
urr
en
t A
ss
ets
32
.39
2
8.2
2
36
5.2
7
36
5.3
5
0.1
6
0.1
5
39
7.8
3
33
5.0
8
T
ota
l As
se
ts (
A+
B)
56
.47
5
3.1
4
66
8.6
1 6
76
.34
0
.16
0
.15
6
76
.66
6
12.6
8
II.
Lia
bil
itie
s
(A
) N
on
Cu
rre
nt
Lia
bil
itie
s
i) Fi
nanc
ial L
iabi
litie
s 1
3.2
7 1
7.6
2 5
6.2
1 9
0.0
7 -
-
1
01.
46
1
15.4
6
ii)
Non
Fin
anci
al L
iabi
litie
s 0
.99
0
.99
1
6.9
5
15
.66
-
-
0
.87
1.0
0
To
tal N
on
Cu
rre
nt
Lia
bil
itie
s 1
4.2
6
18
.61
73
.16
1
05
.73
-
-
1
02
.33
1
16.4
6
(B
) C
urr
en
t L
iab
ilit
ies
i) Fi
nanc
ial L
iabi
litie
s 3
6.0
7 2
8.7
2 1
04
.82
31.
07
-
-
23
1.3
5
29
0.8
1
ii)
Non
Fin
anci
al L
iabi
litie
s 0
.46
0
.47
13
.90
8
0.6
2 0
.04
0
.04
3
.66
7
.33
To
tal C
urr
en
t L
iab
ilit
ies
36
.53
2
9.1
9
118
.72
1
11.6
9
0.0
4
0.0
4
23
5.0
1 2
98
.14
T
ota
l Lia
bil
itie
s (
A+
B)
50
.79
4
7.8
0
19
1.8
8
217
.42
0
.04
0
.04
3
37
.34
4
14.6
0
Ne
t A
ss
ets
(I-
II)
5.6
8
5.3
4
47
6.7
3
45
8.9
2
0.1
2
0.1
1 3
39
.32
1
98
.08
No
tes
to
Co
ns
olid
ate
d F
ina
nc
ial S
tate
me
nts
for
the
ye
ar
en
de
d M
arc
h 3
1, 2
018
(All
am
ou
nt
in H
cro
re, u
nle
ss o
the
rwis
e s
tate
d)
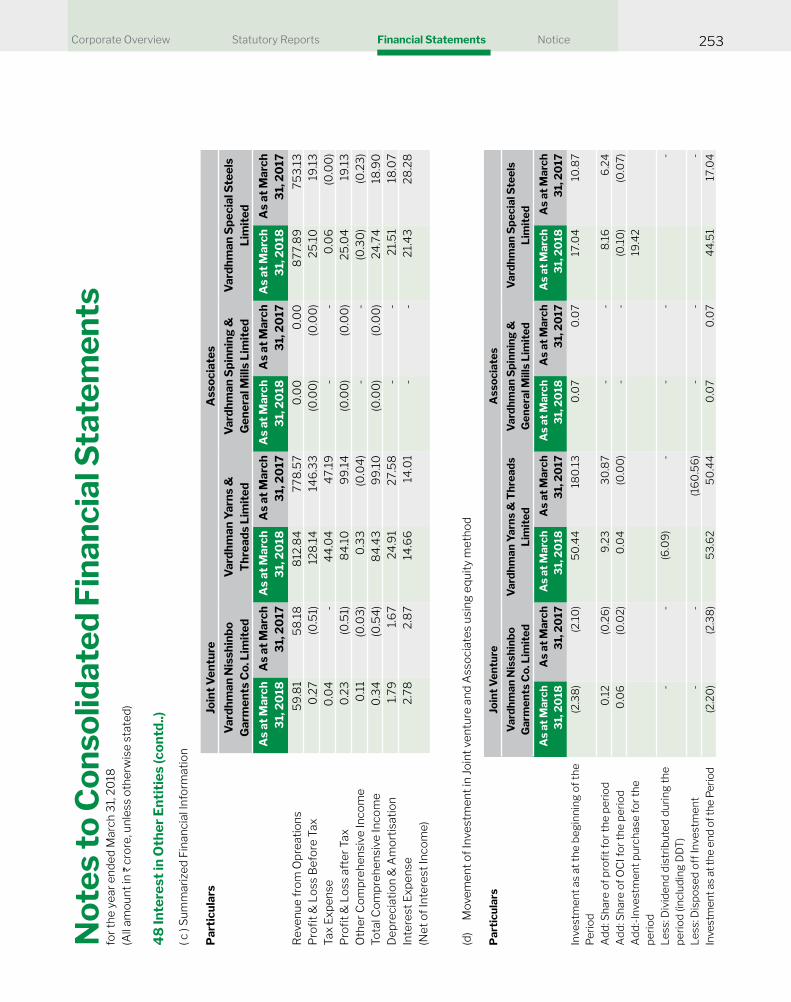
Corporate Overview Statutory Reports Financial Statements Notice 253
Pa
rtic
ula
rsJo
int
Ve
ntu
reA
ss
oc
iate
s
Va
rdh
ma
n N
iss
hin
bo
Ga
rme
nts
Co
. Lim
ite
d
Va
rdh
ma
n Y
arn
s &
Th
rea
ds
Lim
ite
d
Va
rdh
ma
n S
pin
nin
g &
Ge
ne
ral M
ills
Lim
ite
d
Va
rdh
ma
n S
pe
cia
l Ste
els
Lim
ite
d
As
at
Ma
rch
31,
20
18
As
at
Ma
rch
31,
20
17
As
at
Ma
rch
31,
20
18
As
at
Ma
rch
31,
20
17
As
at
Ma
rch
31,
20
18
As
at
Ma
rch
31,
20
17
As
at
Ma
rch
31,
20
18
As
at
Ma
rch
31,
20
17
Re
ven
ue
fro
m O
pre
ati
on
s 5
9.8
1 5
8.1
8
812
.84
7
78.5
7 0
.00
0
.00
8
77.8
9
75
3.1
3
Pro
fit &
Los
s B
efor
e Ta
x 0
.27
(0.5
1) 1
28.1
4
14
6.3
3
(0.0
0)
(0.0
0)
25
.10
1
9.1
3
Tax
Expe
nse
0.0
4
-
44
.04
4
7.19
-
-
0
.06
(0
.00
)P
rofi
t & L
oss
afte
r Tax
0.2
3
(0.5
1) 8
4.1
0
99
.14
(0
.00
) (0
.00
) 2
5.0
4
19
.13
O
the
r C
om
pre
he
nsi
ve In
co
me
0.1
1 (0
.03
) 0
.33
(0
.04
) -
-
(0
.30
) (0
.23
)T
ota
l Co
mp
reh
en
sive
Inc
om
e 0
.34
(0
.54
) 8
4.4
3
99
.10
(0
.00
) (0
.00
) 2
4.7
4
18
.90
D
ep
rec
iati
on
& A
mo
rtis
ati
on
1.7
9
1.6
7 2
4.9
1 2
7.5
8
-
-
21.
51
18
.07
Inte
rest
Exp
ense
(Ne
t o
f In
tere
st In
co
me
)
2.7
8
2.8
7 1
4.6
6
14
.01
-
-
21.
43
2
8.2
8
( c )
Su
mm
ari
zed
Fin
an
cia
l In
form
ati
on
48
In
tere
st
in O
the
r E
nti
tie
s (
co
ntd
..)
(d)
Mo
vem
en
t o
f In
vest
me
nt
in J
oin
t ve
ntu
re a
nd
Ass
oc
iate
s u
sin
g e
qu
ity
me
tho
d
Pa
rtic
ula
rsJo
int
Ve
ntu
reA
ss
oc
iate
s
Va
rdh
ma
n N
iss
hin
bo
Ga
rme
nts
Co
. Lim
ite
d
Va
rdh
ma
n Y
arn
s &
Th
rea
ds
Lim
ite
d
Va
rdh
ma
n S
pin
nin
g &
Ge
ne
ral M
ills
Lim
ite
d
Va
rdh
ma
n S
pe
cia
l Ste
els
Lim
ite
d
As
at
Ma
rch
31,
20
18
As
at
Ma
rch
31,
20
17
As
at
Ma
rch
31,
20
18
As
at
Ma
rch
31,
20
17
As
at
Ma
rch
31,
20
18
As
at
Ma
rch
31,
20
17
As
at
Ma
rch
31,
20
18
As
at
Ma
rch
31,
20
17
Inve
stm
en
t a
s a
t th
e b
eg
inn
ing
of
the
Pe
rio
d
(2.3
8)
(2.1
0)
50
.44
1
80
.13
0
.07
0.0
7 1
7.0
4
10
.87
Add
: Sha
re o
f pro
fit f
or th
e pe
riod
0.1
2 (0
.26
) 9
.23
3
0.8
7 -
-
8
.16
6
.24
A
dd: S
hare
of O
CI f
or th
e pe
riod
0.0
6
(0.0
2) 0
.04
(0
.00
) -
-
(0
.10
) (0
.07)
Add
:-Inv
estm
ent p
urch
ase
for t
he
pe
rio
d
19
.42
Less
: Div
iden
d di
stri
bute
d du
ring
the
pe
rio
d (i
nc
lud
ing
DD
T)
-
-
(6.0
9)
-
-
-
-
Less
: Dis
pose
d of
f Inv
estm
ent
-
-
(16
0.5
6)
-
-
-
Inve
stm
en
t a
s a
t th
e e
nd
of
the
Pe
rio
d (2
.20
) (2
.38
) 5
3.6
2 5
0.4
4
0.0
7 0
.07
44
.51
17.
04
No
tes
to
Co
ns
olid
ate
d F
ina
nc
ial S
tate
me
nts
for
the
ye
ar
en
de
d M
arc
h 3
1, 2
018
(All
am
ou
nt
in H
cro
re, u
nle
ss o
the
rwis
e s
tate
d)

Vardhman Textiles Ltd. Annual Report 2017-18254
49
(a) F
or D
iscl
osur
e m
anda
ted
by S
ched
ule
III o
f Com
pani
es A
ct 2
013
, by
way
of a
ddit
iona
l inf
orm
atio
n, re
fer b
elow
:
Na
me
of
En
terp
ris
eA
s a
t 3
1st
Ma
rch
,20
18A
s a
t 3
1st
Ma
rch
,20
17A
s a
t 3
1st
Ma
rch
,20
18A
s a
t 3
1st
Ma
rch
,20
17
Ne
t A
ss
ets
i.e
to
tal
as
se
ts m
inu
s t
ota
l
lia
bil
itie
s
Ne
t A
ss
ets
i.e
to
tal
as
se
ts m
inu
s t
ota
l
lia
bil
itie
s
Sh
are
in T
ota
l
co
mp
reh
en
siv
e in
co
me
Sh
are
in T
ota
l
co
mp
reh
en
siv
e in
co
me
As
% o
f
co
ns
oli
ate
d
ne
t a
ss
ets
Am
ou
nt
As
% o
f
co
ns
oli
ate
d
ne
t a
ss
ets
Am
ou
nt
As
% o
f
co
ns
oli
ate
d
pro
fit
or lo
ss
Am
ou
nt
As
% o
f
co
ns
oli
ate
d
pro
fit
or lo
ss
Am
ou
nt
Pa
ren
t
Var
dhm
an T
exti
les
Lim
ited
91.
50
% 4
,63
1.9
6
90
.89
% 3
,98
5.8
5
93
.94
% 5
47.
46
10
2.0
8%
1,0
01.
37
Less
:- U
nrea
lised
pro
fit o
n S
tock
-0.0
4%
(1.7
8)
-0.0
2% (0
.95
)0
.00
% -
0
.00
% -
Add
:- D
efer
red
tax
asse
t on
Sto
ck0
.01%
0.6
6
0.0
0%
-
0.0
0%
-
0.0
0%
-
Su
bs
ida
rie
s
Ind
ian
Var
dhm
an A
rcyl
ics
Lim
ited
6.3
1% 3
19.3
8
6.7
4%
29
5.4
1 6
.60
% 3
8.4
8
4.1
8%
40
.99
V
MT
Spi
nnin
g C
o.Li
mite
d2.
10%
10
6.2
6
2.3
8%
10
4.4
8
0.3
0%
1.7
8
0.8
4%
8.2
6
VT
L In
vest
men
t Lim
ited
1.20
% 6
0.8
0
1.15
% 5
0.5
5
1.76
% 1
0.2
4
0.9
9%
9.7
5
Ad
just
me
nt
du
e t
o c
on
solid
ati
on
-3.8
7% (1
96
.01)
-4.2
6%
(18
6.7
9)
-3.6
6%
(21.
43
)-1
0.5
4%
(10
3.3
8)
No
n C
on
tro
llin
g I
nte
res
t in
su
bs
ida
rie
s2
.15
% 1
08
.78
2
.56
% 1
12.1
9
-1.9
4%
(11
.28
)-1
.31%
(12
.86
)
As
so
cia
tes
(In
ve
stm
en
t a
s p
er
the
eq
uit
y m
eth
od
)
Ind
ian
Var
dhm
an S
peci
al S
teel
s Li
mite
d0
.88
% 4
4.5
1 0
.39
% 1
7.0
4
1.3
8%
8.0
7 0
.63
% 6
.17
Var
dhm
an S
pinn
ing
& G
ener
al M
ills
Lim
ited
0.0
0%
0.0
7 0
.00
% 0
.07
0.0
0%
(0.0
0)
0.0
0%
(0.0
0)
Var
dhm
an Y
arns
& T
hrea
ds L
imite
d1.
06
% 5
3.6
2 1.
15%
50
.44
1.
59
% 9
.27
3.1
6%
30
.96
L
es
s:-
In
ve
stm
en
ts in
As
so
cia
tes
-1.0
4%
(5
2.7
7)
-0.7
6%
(3
3.3
5)
0.0
0%
-
0.0
0%
-
Join
t V
en
ture
s
(in
ve
stm
en
t a
s p
er
the
eq
uit
y m
eth
od
)
Ind
ian
Var
dhm
an N
issh
imbo
Gar
men
ts C
ompa
ny
Lim
ited
0.1
5%
7.8
0
0.1
7% 7
.62
0.0
3%
0.1
7 -0
.03
% (0
.27)
Le
ss
: In
ve
stm
en
t in
Jo
int
Ve
ntu
res
-0.3
4%
(17
.14
)-0
.39
% (
17.1
4)
0.0
0%
-
0.0
0%
-
Less
:- D
efer
red
Tax
Liab
iliti
es o
n un
dist
ribu
ted
profi
ts o
n as
soci
ates
and
join
t ven
ture
s-0
.07%
(3.6
6)
0.0
0%
-
0.0
0%
-
0.0
0%
-
To
tal
100
% 5
,06
2.4
8
100
% 4
,38
5.4
2
100
% 5
82
.76
10
0%
98
0.9
9
No
tes
to
Co
ns
olid
ate
d F
ina
nc
ial S
tate
me
nts
for
the
ye
ar
en
de
d M
arc
h 3
1, 2
018
(All
am
ou
nt
in H
cro
re, u
nle
ss o
the
rwis
e s
tate
d)

Corporate Overview Statutory Reports Financial Statements Notice 255
49 (b) Previous year figures in the consolidated financial statements, including the notes thereto, have been reclassified wherever required to confirm to the current year presentation/classification.These are not material and do not affect the previously reported net profit or equity.
For and on behalf of the Board of Directors
Sanjay Gupta Rajeev Thapar Suchita Jain S.P. Oswal
Company Secretary Chief Financial Joint Managing Director Chairman and Managing
Membership No:-4935 Officer DIN:00746471 Director DIN: 00121737
Place : LudhianaDate: May 12, 2018
Notes to Consolidated Financial Statementsfor the year ended March 31, 2018
(All amount in H crore, unless otherwise stated)

Vardhman Textiles Ltd. Annual Report 2017-18256
NOTICE
Notice is hereby given that the 45TH ANNUAL GENERAL
MEETING of Vardhman Textiles Limited will be held on
Thursday, the 27th day of September, 2018 at 11:00 a.m. at
the Registered Office of the Company situated at Chandigarh Road, Ludhiana, to transact the following business:-
ORDINARY BUSINESS:
Item No. 1 – To adopt financial statements
To receive, consider and adopt the Audited Financial
Statements (including the consolidated financial statements) of the Company for the financial year ended 31st March, 2018 together with Report of Board of Directors and Auditors
thereon.
Item No. 2 – To declare Dividend
To declare a dividend of H 15 per equity share for the year
ended 31st March, 2018.
Item No. 3 – To re-appoint Mr. Sachit Jain as a director liable to retire by rotation
To appoint a Director in place of Mr. Sachit Jain (DIN No. 00746409), who retires by rotation in terms of Section 152(6) of the Companies Act, 2013 and being eligible, offers himself for re-appointment.
SPECIAL BUSINESS:
Item No. 4 – To appoint Dr. Parampal Singh as an Independent Director of the Company
To consider and if thought fit, to pass, with or without modification(s), the following resolution as an Ordinary Resolution:-
“RESOLVED THAT pursuant to the provisions of Sections
149, 152 and any other applicable provisions, if any, of the
Companies Act, 2013 read with Schedule IV to the Companies Act, 2013, the rules made thereunder and Regulations 16 & 25 of the SEBI (Listing Obligations and Disclosure Requirements) Regulations, 2015 (including any statutory modification(s) or re-enactment thereof for the time being in force), Dr. Parampal Singh (DIN: 07995388), who was appointed as an
Additional Director of the Company and in respect of whom the Company has received a notice in writing from a member proposing his candidature for the office of Director, be and is hereby appointed as an Independent Director of the Company not liable to retire by rotation for a term of consecutive three
years starting from 27th November, 2017.”
Item No. 5 – To re-appoint Mr. Devendra Bhushan Jain as an Independent Director of the Company
To consider and if thought fit, to pass, with or without modification(s), the following resolution as a Special Resolution:-
“RESOLVED THAT pursuant to the provisions of Sections 149,
152 and any other applicable provisions, if any, of the Companies Act, 2013 read with Schedule IV to the Companies Act, 2013, the rules made thereunder and Regulations 16, 17 & 25 of the SEBI (Listing Obligations and Disclosure Requirements) Regulations, 2015 (including any statutory modification(s) or re-enactment thereof for the time being in force), Mr. Devendra Bhushan Jain (DIN 06911676), who was appointed as an Additional Director of the Company and in respect of whom the Company has received a notice in writing from a member proposing his candidature for the office of Director, be and is hereby appointed as an Independent Director of the Company not liable to retire by rotation for a term of consecutive three
years starting from 8th November, 2017.”
Item No. 6 – To ratify remuneration payable to Cost Auditors for the financial year ending 31st March, 2019
To consider and if thought fit, to pass, with or without modification(s), the following resolution as an Ordinary Resolution:-
“RESOLVED THAT pursuant to the provisions of Section
148 and all other applicable provisions of the Companies Act, 2013 and the Companies (Audit and Auditors) Rules, 2014 and Companies Cost Audit Rules, 2014 (including any statutory modification(s) or re-enactment thereof, for the time being in force), M/s. Ramanath Iyer & Company, Cost Auditors, New Delhi appointed by the Board of Directors of the Company, to conduct the audit of the cost records of the Company for the financial year ending 31st March, 2019, be paid the remuneration of H 5,16,880/-.

Corporate Overview Statutory Reports Financial Statements Notice 257
RESOLVED FURTHER THAT Mr. Shri Paul Oswal, Chairman & Managing Director and Mr. Sanjay Gupta, Company Secretary, be and are hereby severally authorized to do all acts and take all such steps as may be necessary or expedient to give effect to this
resolution.”
Item No. 7 – To re-appoint Mr. Shri Paul Oswal as the Managing Director of the company
To consider and if thought fit, to pass, with or without modification(s), the following resolution as a Special Resolution:-
“RESOLVED THAT pursuant to the provisions of Section 196, 197, 203 & Schedule V of Companies Act, 2013 and Companies (Appointment and Remuneration of Managerial Personnel) Rules, 2014, Mr. Shri Paul Oswal (DIN: 00121737), be and is hereby re- appointed as the Managing Director of the Company for a period of 5 years starting from 1st June, 2019 to 31st May, 2024.
RESOLVED FURTHER THAT Mr. Shri Paul Oswal shall be paid remuneration and other perquisites as per terms and conditions as detailed below:-
S.
No.
Remuneration Details
I. Salary In the scale of H 5,00,000 - 10,000 - 5,40,000 per month.
II. Commission Equal to 2% of net profit calculated as per Section 198 of the Companies Act, 2013 subject to total remuneration being within the limits as prescribed in Part-II of Schedule-V to the Companies Act, 2013.
III. Perquisites The perquisites are allowed in addition to salary and commission as per details
given below, however, such perks are restricted to an amount equal to one year’s
salary during each year.
a) Housing Free residential accommodation or House Rent Allowance equal to 40% per cent
of the basic salary. Free furnishing is provided by the Company along with other amenities.
b) Medical Reimbursement Reimbursement of medical expenses incurred by the appointee (including medi-
claim insurance premium) on self and his family, subject to a ceiling of one month’s salary in a year or five months’ salary over a period of five years.
c) Leave Travel Concession The expenses incurred on leave travel by the appointee on self and his family are
reimbursed once in a year in accordance with the rules specified by the Company.
d) Club Fees Fees of clubs subject to a maximum of two clubs. This does not include admission and life membership fees.
e) Personal Accident Insurance Premium not to exceed H 5,000/- per annum.
f) Car & Communication Expenses Free use of Company’s car for official work as well as for personal purposes along with Driver. All communication expenses at residence or otherwise shall be at
Company’s cost.
g) Provident Fund & other funds Contribution to provident fund, superannuation fund or annuity fund subject to the rules framed by the Company in this respect.
h) Gratuity Gratuity payable not exceeding half a month’s salary for each completed year of service subject to the ceiling prescribed by the Central Government from time to time.
IV Travelling Expenses Expense incurred for travelling, boarding and lodging including for spouse and
attendant(s) during business trips on actual basis which shall not be considered as perquisites.
V Security Expenses The expenses, as may be borne by the Company for providing security to Mr. S.P. Oswal and his family which shall not be considered as perquisites.

Vardhman Textiles Ltd. Annual Report 2017-18258
Explanation: “Family” means the spouse and the dependent
children of the appointee.
RESOLVED FURTHER THAT Mr. Darshan Lal Sharma, Director, be and is hereby authorised to enter into an agreement with
Mr. Shri Paul Oswal in respect of his re-appointment as Managing Director of the Company, for and on behalf of the Company.”
Item No. 8– To approve continuation of directorship of Dr. Subash Khanchand Bijlani as a Non- Executive Director of the Company
To consider and if thought fit, to pass, with or without modification(s), the following resolution as a Special Resolution:-
“RESOLVED THAT pursuant to the provisions of Regulation
17 of SEBI (Listing Obligations and Disclosure Requirements) Regulations, 2015 as amended vide SEBI (Listing Obligations and Disclosure Requirements) (Amendment) Regulations, 2018, approval of the members of the Company, be and is hereby given for continuation of the directorship of Dr.
Subash Khanchand Bijlani (DIN: 01040271) after April 1, 2019, as per his existing terms of appointment, as a non- executive
director of the Company.”
Item No. 9– To approve continuation of directorship of Mr. Prafull Anubhai as a Non- Executive Director of the Company
To consider and if thought fit, to pass, with or without modification(s), the following resolution as a Special Resolution:-
“RESOLVED THAT pursuant to the provisions of Regulation
17 of SEBI (Listing Obligations and Disclosure Requirements) Regulations, 2015 as amended vide SEBI (Listing Obligations and Disclosure Requirements) (Amendment) Regulations, 2018, approval of the members of the Company, be and is hereby given for continuation of the directorship of Mr. Prafull Anubhai (DIN: 00040837) after April 1, 2019, as per his existing terms of appointment, as a non- executive director of
the Company.”
Item No. 10– To approve continuation of directorship of Mr. Ashok Kumar Kundra as a Non- Executive Director of the Company
To consider and if thought fit, to pass, with or without modification(s), the following resolution as Special Resolution:-
“RESOLVED THAT pursuant to the provisions of Regulation
17 of SEBI (Listing Obligations and Disclosure Requirements) Regulations, 2015 as amended vide SEBI (Listing Obligations and Disclosure Requirements) (Amendment) Regulations, 2018, approval of the members of the Company, be and is hereby given for continuation of the directorship of Mr. Ashok Kumar Kundra (DIN: 00154024) after April 1, 2019, as per his existing terms of appointment, as a non- executive director of
the Company.”
By Order of the Board
Place: Ludhiana (Sanjay Gupta)Dated: 13th August, 2018 Company Secretary
NOTES:
1. A MEMBER ENTITLED TO ATTEND AND VOTE AT THE MEETING IS ENTITLED TO APPOINT A PROXY TO ATTEND AND VOTE ON A POLL INSTEAD OF HIMSELF/HERSELF AND SUCH PROXY NEED NOT BE A MEMBER OF THE COMPANY. THE PROXY, IN ORDER TO BE EFFECTIVE MUST BE RECEIVED BY THE COMPANY NOT LESS THAN 48 HOURS BEFORE THE MEETING. THE BLANK PROXY FORM IS ENCLOSED ALONGWITH ATTENDENCE SLIP.
However, a person can act as proxy on behalf of members
not exceeding fifty (50) and holding in the aggregate not more than ten percent of the total share capital of the
Company.
2. The Statement pursuant to Section 102 of the Companies Act, 2013, which sets out details relating to Special Business at the meeting, is annexed hereto.
3. The Register of Members and the Share Transfer Books of the Company shall remain closed from closed from 17th September, 2018 to 27th September, 2018 (both days inclusive).
4. The Members holding shares in physical mode are requested to notify the change in their address, if any, at
the earliest to the Registrar & Transfer Agent/Company. However members, holding shares in electronic mode
may notify the change in their address, if any, to their
respective Depository Participants.
5. The information pursuant to Regulation 36 of the SEBI (Listing Obligations and Disclosure Requirements)

Corporate Overview Statutory Reports Financial Statements Notice 259
Regulations, 2015 regarding the Directors seeking
appointment/re-appointment in the Annual General Meeting is also being annexed hereto separately and forms part of the Notice. The Director has furnished the
requisite declarations for his re-appointment.
6. Members desiring any information, as regards Accounts, are requested to write to the Company at its Registered Office at least 10 days before the date of Annual General Meeting so as to enable the Management to keep the information ready.
7. The copies of relevant documents can be inspected at
the Registered Office of the Company on any working day between 10:30 A.M. to 12:30 P.M.
8. Members holding shares in the same/identical name(s) under different folios are requested to apply for
consolidation of such folios and send relevant share
certificates to the Company/Registrar and Transfer Agent.
9. The Ministry of Corporate Affairs, Government of India, has taken a “Green Initiative in Corporate Governance” by allowing paperless compliances by the Companies and has issued circulars allowing Companies to send official documents to their members electronically.
In support of the Green Initiative, your Company proposes to send the documents like Notice calling the Annual
General Meeting and Annual Report containing Balance Sheet, Statement of Profit & Loss and Director’s Report etc. and other communications in electronic form.
The Members are requested to support this Green Initiative by registering/ updating their e-mail addresses with the Depository Participant (in case of shares held in
dematerialized form) or with Registrar & Transfer Agent, Alankit Assignments Limited, New Delhi (in case of shares
held in physical form).
10. The Annual Report 2017-18 is being sent through
electronic mode only to the members whose email
addresses are registered with the Company/ Depository Participant(s), unless any member has requested for a physical copy of the report. For members who have
not registered their email addresses, physical copies of
the Annual Report 2017-18 are being sent by permitted
mode.
11. The Securities and Exchange Board of India (SEBI) has mandated the submission of the Permanent Account
Number (PAN) by every participant in the securities market. Members holding shares in electronic form are, therefore, requested to submit their PAN to their
Depository Participant(s). Members holding shares in physical form are requested to submit their PAN and
Bank Account details to the Registrar and Share Transfer
Agent. A blank form in this regard is being sent with this
Annual Report.
12. The Securities and Exchange Board of India (SEBI) vide its notification dated June 8, 2018 has mandated that w.e.f. December 5, 2018, the transfer of shares would be
carried out in dematerialized form only, except in case of
transmission or transposition of securities. Hence, all the
shareholders holding shares in physical form are hereby
requested to get their physical shares dematerialized.
13. Voting through electronic means:
In compliance with the provisions of Section 108 of the Companies Act, 2013 and Rule 20 of the Companies (Management and Administration) Rules, 2014, and Regulation 44 of the SEBI (Listing Obligations and Disclosure Requirements Regulations), 2015, the Company is pleased to provide members a facility to exercise their right to vote at the 45th Annual General Meeting (AGM) by electronic means and the business may be transacted through e-Voting Services provided
by Central Depository Services (India) Limited (CDSL).
The instructions for shareholders voting electronically
are as under:
(i) The e-voting period commences on 24th September, 2018 (9:00 a.m.) and ends on 26th September, 2018 (5:00 p.m.). During this period shareholders of the Company, holding shares either in physical form or in dematerialized form, as on the cut-off date of 20th
September, 2018, may cast their vote electronically.
The e-voting module shall be disabled by CDSL for voting after end of voting period on 26th September,
2018. Once the vote on a resolution is cast by the
shareholder, the shareholder shall not be allowed to
change it subsequently.
(ii) Shareholders who have already voted prior to the meeting date would not be entitled to vote at the
meeting venue.
(iii) The shareholders should log on to the e-voting website www.evotingindia.com.

Vardhman Textiles Ltd. Annual Report 2017-18260
(iv) Click on Shareholders.
(v) Now Enter your User ID
a. For CDSL: 16 digits beneficiary ID,
b. For NSDL: 8 Character DP ID followed by 8 Digits Client ID,
c. Members holding shares in Physical Form should enter Folio Number registered with the Company.
(vi) Next enter the Image Verification as displayed and Click on Login.
(vii) If you are holding shares in demat form and had logged on to www.evotingindia.com and voted on
an earlier voting of any company, then your existing
password is to be used.
(viii) If you are a first time user follow the steps given below:
For Members holding shares in Demat Form and Physical Form
PAN
Enter your 10 digit alpha-numeric *PAN
issued by Income Tax Department (Applicable for both demat shareholders as
well as physical shareholders)
• Members who have not updated their PAN with the Company/Depository Participant are requested to use the
first two letters of their name and the 8 digits of the sequence number in the
PAN field. Sequence number is printed on Attendance slip provided with the
Annual report.
• In case the sequence number is less than 8 digits enter the applicable number of
0’s before the number after the first two characters of the name in CAPITAL letters. Eg. if your name is Ramesh Kumar
with sequence number 1 then enter
RA00000001 in the PAN field.
For Members holding shares in Demat Form and Physical Form
Dividend
Bank
Details
OR Date
of Birth
(DOB)
Enter the Dividend Bank Details or Date of
Birth (in dd/mm/yyyy format) as recorded in your demat account or in the company
records in order to login.
• If both the details are not recorded with the depository or company please enter
the member id / folio number in the Dividend Bank details field as mentioned in instruction (v).
(ix) After entering these details appropriately, click on “SUBMIT” tab.
(x) Members holding shares in physical form will then directly reach the Company selection screen. However, members holding shares in demat form
will now reach ‘Password Creation’ menu wherein they are required to mandatorily enter their
login password in the new password field. Kindly note that this password is also to be used by the
demat holders for voting for resolutions of any
other company on which they are eligible to vote,
provided that company opts for e-voting through
CDSL platform. It is strongly recommended not to share your password with any other person and take
utmost care to keep your password confidential.
(xi) For Members holding shares in physical form, the details can be used only for e-voting on the
resolutions contained in this Notice.
(xii) Click on the EVSN: 180823006 for <VARDHMAN TEXTILES LIMITED> on which you choose to vote.
(xiii) On the voting page, you will see “RESOLUTION DESCRIPTION” and against the same the option “YES/NO” for voting. Select the option YES or NO as desired. The option YES implies that you assent to the Resolution and option NO implies that you
dissent to the Resolution.
(xiv) Click on the “RESOLUTIONS FILE LINK” if you wish to view the entire Resolution details.
(xv) After selecting the resolution you have decided to vote on, click on “SUBMIT”. A confirmation box will be displayed. If you wish to confirm your vote, click on “OK”, else to change your vote, click on
“CANCEL” and accordingly modify your vote.

Corporate Overview Statutory Reports Financial Statements Notice 261
(xvi) Once you “CONFIRM” your vote on the resolution, you will not be allowed to modify your vote.
(xvii) You can also take out print of the voting done by you by clicking on “Click here to print” option on the Voting page.
(xviii) If Demat account holder has forgotten the login password then Enter the User ID and the image verification code and click on Forgot Password & enter the details as prompted by the system.
(xix) Shareholders can also cast their vote using CDSL’s mobile app “m-Voting” available for android based
mobiles. The m-Voting app can be downloaded
from Google Play Store. Apple and Windows phone users can download the app from the App Store
and the Windows Phone Store, respectively. Please follow the instructions as prompted by the mobile
app while voting on your mobile.
(xx) Note for Non – Individual Shareholders and Custodians
• Non-Individual shareholders (i.e. other than Individuals, HUF, NRI etc.) and Custodian are required to log on to www.evotingindia.com
and register themselves as Corporates.
• A scanned copy of the Registration Form
bearing the stamp and sign of the entity should
be emailed to helpdesk.evoting@cdslindia.
com.
• After receiving the login details a compliance
user should be created using the admin login
and password. The Compliance user would be able to link the account(s) for which they wish to vote on.
• The list of accounts should be mailed to
[email protected] and on
approval of the accounts they would be able to
cast their vote.
• A scanned copy of the Board Resolution and
Power of Attorney (POA) which they have issued in favour of the Custodian, if any, should be uploaded in PDF format in the system for
the scrutinizer to verify the same.
(xxi) Any person, who acquires shares of the Company and become Member of the Company after dispatch of the Notice and holding shares as on the cut-off
date i.e. 20th September, 2018 may follow the same
instructions as mentioned above for e-Voting.
(xxii) In case you have any queries or issues regarding e-voting, you may refer the Frequently Asked
Questions (“FAQs”) and e-voting manual available at www.evotingindia.com, under help section or
write an email to [email protected]
14. M/s. B.K. Gupta & Associates, Company Secretaries, have been appointed as the Scrutinizer to scrutinize
the e-voting process in a fair and transparent manner
(including the ballot forms received from members
who do not have access to the e- voting process). The Scrutinizer shall upon the conclusion of E-voting period,
unblock the votes in presence of at least two witnesses
not in employment of the Company and make a report of the votes cast in favour or against, if any, forthwith to the
Chairman of the Company.
15. The Results of the resolutions passed at the AGM of the Company will be declared within 48 hours of conclusion of AGM. The results declared along with the Scrutinizer’s report shall be simultaneously placed on the Company’s website www.vardhman.com and on the website of CDSL and will be communicated to the stock exchanges.
16. MEMBERS HOLDING EQUITY SHARES IN ELECTRONIC FORM, AND PROXIES THEREOF, ARE REQUESTED TO BRING THEIR DP ID AND CLIENT ID FOR IDENTIFICATION.
17. The requirement to place the matter relating to
appointment of Auditors for ratification by members at every Annual General Meeting is done away with vide notification dated May 7, 2018 issued by the Ministry of Corporate Affairs. Accordingly, no resolution is proposed for ratification of the appointment of Auditors, who were appointed in the Annual General Meeting held on 22nd September, 2017.
By Order of the Board
Place: Ludhiana (Sanjay Gupta)Dated: 13th August, 2018 Company Secretary

Vardhman Textiles Ltd. Annual Report 2017-18262
Item No. 4:
The Board of Directors of the Company vide its resolution dated 25th November, 2017, had appointed Dr. Parampal
Singh as an Additional Director of the Company pursuant to section 161(1) of the Companies Act, 2013 and Articles of Association of the Company. He will hold office upto the date of ensuing Annual General Meeting.
The Company has received requisite notice in writing from a member proposing the appointment of Dr. Parampal Singh
as a candidate for the office of Independent Director of the Company for a term of consecutive three years starting from 27th November, 2017.
The Company has received consent from Dr. Parampal Singh and also a declaration confirming that he is not disqualified from being appointed as a Director in terms of Section
164 of the Companies Act, 2013 and meet the criteria of independence as prescribed under Section 149(6) of the Companies Act, 2013 as well as Regulation 16(b) of the SEBI (Listing Obligations and Disclosure Requirements) Regulations, 2015 with the Stock Exchanges.
Dr. Parampal Singh is independent of the Management and in the opinion of the Board, fulfills the conditions specified in the Companies Act, 2013 and rules made thereunder for appointment as an Independent Director of the Company. A copy of the draft letter for appointment as an Independent Director setting out the terms and conditions would be
available for inspection without any fee to the Members at the Registered Office of the Company during normal business hours on any working day. A brief profile of Dr. Parampal Singh is provided at the end of this statement.
The Board recommends the Ordinary Resolution as set out at
item number 4 of the Notice for approval by the Members.
Memorandum of Interest:
Except Dr. Parampal Singh, being appointee, none of the
Directors and Key Managerial Personnel of the Company or their relatives are concerned or interested financially or otherwise, in the resolution set out at Item No. 4.
The following statement sets out all material facts relating to the Special Business mentioned in the Notice:
Item No. 5:
The Board of Directors of the Company had appointed Mr. Devendra Bhushan Jain as an Additional Director of the Company pursuant to section 161(1) of the Companies Act, 2013 and Articles of Association of the Company. He will hold office upto the date of ensuing Annual General Meeting.
The Company has received requisite notice in writing from a member proposing appointment of Mr. Devendra Bhushan Jain as a candidate for the office of Independent Director of the Company for a term of consecutive three years starting from 8th November, 2017.
The Company has received consent from Mr. Devendra Bhushan Jain and also a declaration confirming that he is not disqualified from being appointed as a Director in terms of Section 164 of the Companies Act, 2013 and meet the criteria of independence as prescribed under Section 149(6) of the Companies Act, 2013 as well as Regulation 16(b) of the SEBI (Listing Obligations and Disclosure Requirements) Regulations, 2015 with the Stock Exchanges.
Mr. Devendra Bhushan Jain is independent of the Management and in the opinion of the Board, fulfills the conditions specified in the Companies Act, 2013 and rules made thereunder for appointment as an Independent Director of the Company. A copy of the draft letter for appointment as an Independent Director setting out the terms and conditions would be
available for inspection without any fee to the Members at the Registered Office of the Company during normal business hours on any working day. A brief profile of Mr. Devendra Bhushan Jain is provided at the end of this statement.
Further, pursuant to the provisions of Regulation 17 of
SEBI (Listing Obligations and Disclosure Requirements) Regulations, 2015 as amended vide SEBI (Listing Obligations and Disclosure Requirements) (Amendment) Regulations, 2018, w.e.f April 1, 2019, approval of the Members is required by way of a Special Resolution for continuing the directorship
of non-executive director who has attained the age of 75
years. As Mr. Devendra Bhushan Jain is aged above 76 years, the proposed resolution also meets compliance of the said
Regulation 17.
ANNEXURE TO THE NOTICEStatement pursuant to Section 102 of the Companies Act, 2013

Corporate Overview Statutory Reports Financial Statements Notice 263
The Board recommends the Special Resolution as set out at
item number 5 of the Notice for approval by the Members.
Memorandum of Interest:
Except Mr. Devendra Bhushan Jain, being appointee, none of the Directors and Key Managerial Personnel of the Company or their relatives are concerned or interested financially or otherwise, in the resolution set out at Item No. 5.
Item No. 6:
Pursuant to the provisions of the Section 148 of the Companies Act, 2013 read with Companies (Audit and Auditors) Rules, 2014, the Cost Audit is required to be conducted in respect of the Cost Accounts maintained by the Company. Upon the recommendations of Audit Committee, the Board of Directors in its meeting held on 12th May, 2018 had appointed M/s. Ramanath Iyer & Co., 808, Pearls Business Park, Netaji Subhash Place, New Delhi as Cost Auditors of the Company to conduct Cost Audit for Financial Year ending 31st March, 2019.
Accordingly, consent of the Members is solicited for passing an Ordinary Resolution as set out at Item No. 7 of the notice for ratification of payment of remuneration of H 5,16,880/- to the Cost Auditors for the Financial Year ending 31st March, 2019. The Board recommends the Ordinary Resolution as set
out at Item No. 6 of the Notice for approval by the Members.
Memorandum of Interest:
None of the Directors/ Key Managerial Personnel (KMP) of the Company/ their relatives are concerned or interested, financial or otherwise, in the resolution set out at Item No. 6.
Item No. 7:
The Board of Directors vide resolution dated 23rd May, 2014 had re-appointed Mr. Shri Paul Oswal as the Chairman and Managing Director of the Company for a period of 5 years with effect from 1st June, 2014 to 31st May, 2019. His appointment was approved by the Members in their Annual General meeting held on 24th September, 2014.
The Board of Directors of the Company vide its resolution dated 13th August, 2018 had re-appointed Mr. Shri Paul Oswal as Managing Director of the Company for a term of 5 years starting from 1st June, 2019 to 31st May, 2024. The terms and conditions of the remuneration being paid to him are detailed
in the resolution. His appointment is subject to approval of Members of the Company. Accordingly, your approval is solicited.
Memorandum of Interest:
Except Mr. Shri Paul Oswal, being appointee, Mr. Sachit Jain and Mrs. Suchita Jain being appointee’s relative, none of the Directors and Key Managerial Personnel of the Company or their relatives are concerned or interested financially or otherwise, in the resolution set out at Item No. 7.
Item No. 8:
Pursuant to the provisions of Regulation 17 of SEBI (Listing Obligations and Disclosure Requirements) Regulations, 2015 as amended vide SEBI (Listing Obligations and Disclosure Requirements) (Amendment) Regulations, 2018, w.e.f April 1, 2019 approval of the Members is required by way of a Special Resolution for continuing the directorship of non-executive
director who has attained the age of 75 years.
Now, pursuant to these provisions, for continuation of
directorship of Dr. S.K. Bijlani who is aged about 76 years, a Special Resolution by the Members of the Company is required.
Dr. Subash Khanchand Bijlani holds Degree in B.SC. Tech. (Mech. Eng.) from Manchester, UK, Post Graduate Diploma in Computer Management, Mumbai University, Post Graduate Diploma in Finance from Punjab University and Doctorate in Management (D.M.) from Maryland, USA. He is having a rich experience of more than 50 Years of Industry and Business. Now, considering his vast and rich experience and expertise
in industry and Business, the Board of Directors recommends
this Special Resolution for approval of the Members.
Memorandum of Interest:
Except Dr. Subash Khanchand Bijlani, being appointee, none of the Directors and Key Managerial Personnel of the Company or their relatives are concerned or interested financially or otherwise, in the proposed Special Resolution as set out at
Item No. 8 of the Notice.
Item No. 9:
Pursuant to the provisions of Regulation 17 of SEBI (Listing Obligations and Disclosure Requirements) Regulations, 2015 as amended vide SEBI (Listing Obligations and Disclosure Requirements) (Amendment) Regulations, 2018, w.e.f April 1, 2019, approval of the shareholders is required by way of
a special resolution for continuing the directorship of non-
executive director who has attained the age of 75 years.

Vardhman Textiles Ltd. Annual Report 2017-18264
Now, pursuant to these provisions, for continuation of
directorship of Mr. Prafull Anubhai who is aged about 79 years, a Special Resolution by the Members of the Company is required.
Mr. Prafull Anubhai holds Bachelor’s degree in Commerce and Bachelor’s degree in Science (Eco.) from London University. He is having a rich and varied experience of more than 43 years as a Business Consultant. Now, considering his vast and rich experience, the Board of Directors recommends this
Special Resolution for approval of the Members.
Memorandum of Interest:
Except Mr. Prafulbhai Anubhai, being appointee, none of the Directors and Key Managerial Personnel of the Company or their relatives are concerned or interested financially or otherwise, in the proposed Special Resolution as set out at
Item No. 9 of the Notice
Item No. 10:
Pursuant to the provisions of Regulation 17 of SEBI (Listing Obligations and Disclosure Requirements) Regulations, 2015 as amended vide SEBI (Listing Obligations and Disclosure
Requirements) (Amendment) Regulations, 2018, w.e.f April 1, 2019, approval of the Members is required by way of a special resolution for continuing the directorship of non-executive
director who has attained the age of 75 years.
Now, pursuant to these provisions, for continuation of
directorship of Mr. Ashok Kumar Kundra who is aged about 75 years, a Special Resolution by the Members of the Company is required.
Mr. Ashok Kumar Kundra holds Master’s degree in Economies and Doctorate of Philosophy. He is a retired IAS Officer. He has over 44 years of experience in policy making and Govt. related issues in State/Central Government. Now, considering his vast and rich experience, the Board of Directors recommends this
Special Resolution for approval of the Members.
Memorandum of Interest:
Except Mr. Ashok Kumar Kundra, being appointee, none of the Directors and Key Managerial Personnel of the Company or their relatives are concerned or interested financially or otherwise, in the proposed Special Resolution as set out at
Item No. 10 of the Notice.

Corporate Overview Statutory Reports Financial Statements Notice 265
Information Pursuant to Regulation 36 of the SEBI (Listing Obligations and Disclosure Requirements) Regulations, 2015 regarding the Directors seeking appointment/ re-appointment in the Annual General Meeting.
Name of the Director Mr. Shri Paul Oswal Mr. Sachit Jain Dr. Parampal Singh Mr. Devendra Bhushan Jain
Date of Birth 08.04.1942 08.07.1966 12.03.1973 26.08.1942
Date of Appointment 23.05.2014 13.06.1994 27.11.2017 08.11.2017
Expertise in specific functional area
Experience of 50
years in Textile
Industry.
Business Executive
having experience of
more than 28 years in
Textile Industry.
Experience of over 17
years in teaching.
Rich experience in the
field of marketing.
Qualification M.Com (Gold Medalist) B. Tech., MBA M.Sc. Hons. (Microbiology), MBA (Marketing) and Ph.D. in Marketing.
B.Sc.
Directorships in Other Listed Companies as on 31st March, 2018
1. Vardhman Holdings
Limited
2. Vardhman Acrylics
Limited
1. Vardhman Special
Steels Limited
2. Vardhman Holdings
Limited
3. Vardhman Acrylics Limited
Nil Nil
Chairman/Member of Committees of Other Listed Companies as on 31st March, 2018
Nil Stakeholders Relationship Committee:
Vardhman Holdings
Limited
Nil Nil
Shareholding in the Company
5,97,591 Nil Nil Nil
Relationship with other Director(s)
Mr. Sachit Jain is the son-in law and
Mrs. Suchita Jain is daughter of Mr. Shri Paul Oswal.
Mr. Shri Paul Oswal is father-in-law and Mrs. Suchita Jain is wife of Mr. Sachit Jain.
Not related to any
Director
Not related to any
Director

VARDHMAN TEXTILES LIMITED
Vardhman Premises, Chandigarh Road,Ludhiana, Punjab, 141010
Phone : 0161-2228943-48, & Fax : 0161-2601048E-mail:[email protected] & Website: www.vardhman.com
CIN: L17111PB1973PLC003345
30th August, 2018
Dear Shareholder(s),
In order to facilitate payment of dividends, the Securities and Exchange Board of India (SEBI) vide its Circular No. SEBI/HO/MIRSD/DOP1/CIR/P/2018/73 dated April 20, 2018, as amended vide Circular dated July 16, 2018, has mandated the Company/ RTA to obtain copy of PAN Card and Bank account details from all the shareholders holding shares in physical form.
Accordingly, you are requested to furnish self-attested copy of your PAN card and original cancelled cheque leaf / attested bank passbook showing the name of account holder along with the details mentioned in Annexure ‘A’.
You may send the above details latest by 22nd September, 2018 to the M/s. Alankit Assignments Limited, at 1E/13, Alankit Heights, Jhandewalan Extension, New Delhi - 110055.
Thanking you,
Yours faithfully,FOR VARDHMAN TEXTILES LIMITED
Sd/-Sanjay GuptaCompany Secretary

Annexure-A
To
M/s. Alankit Assignments Limited,1E/13, Alankit Heights, Jhandewalan Extension,New Delhi -110055.
Dear Sir,
I/We hereby furnishing the following details as required by you. Kindly update the same in your records:
Signature of Shareholder (s)
Name __________________________________
Name of Shareholder (s)
Folio No.
Pan (Enclose self-attested copy of Pan card/s of all holders)
Bank Account No.
(Enclose name printed original cancelled cheque / attested copy of passbook)
Name of Bank
Branch Address
IFSC No.
MICR No.
Email ID
Mobile / Telephone number


CORPORATE INFORMATION
Board of Directors
Mr. Shri Paul Oswal
Chairman & Managing Director
Mr. Prafull Anubhai
Mr. Sachit Jain
Dr. Subash Khanchand Bijlani
Mr. Ashok Kumar Kundra
Mr. Darshan Lal Sharma
Mr. Devendra Bhushan Jain
Mr. Rajender Mohan Malla
Dr. Parampal Singh
Mrs. Suchita Jain
Joint Managing Director
Mr. Neeraj Jain
Joint Managing Director
Chief Financial Officer
Mr. Rajeev Thapar
Company Secretary
Mr. Sanjay Gupta
Auditors
M/s. Deloitte Haskins & Sells LLP,
Chartered Accountants, New Delhi
Bankers
Allahabad Bank ICICI Bank Limited
Punjab National Bank State Bank of India
Bank of India
Corporation Bank
IDBI Bank Limited
Canara Bank
Standard Chartered Bank
Exim Bank
Oriental Bank of Commerce
HDFC Bank
Registrar & Transfer Agent
Alankit Assignments Limited, New Delhi
Works
• Anant Spinning Mills, Mandideep
• Arihant Spinning Mill, Malerkotla
• Arisht Spinning Mills, Baddi
• Auro Dyeing (Unit-I & II), Baddi
• Auro Spinning Mills, Baddi
• Auro Textiles (Unit- I & II), Baddi
• Auro Weaving Mills, Baddi • Mahavir Spinning Mills (Textile Division), Baddi • Mahavir Spinning Mills (Textile Division) (Unit-II), Baddi• Vardhman Spinning and General Mills, Ludhiana
• Vardhman Spinning Mills, Baddi
• Vardhman Fabrics, Budhni • Vardhman Yarns, Satlapur
• Vardhman Fabrics (Power Division), Budhni • Vardhman Yarns (Power Division), Satlapur
Branches
• P-22, 3rd Floor, Flat No. 6, C.I.T. Road, Scheme IV,
Kolkata-700 014.
• Chandigarh Road, Ludhiana-141010.
• 314, Solaris II, Opposite L & T Gate No. 6, Saki Vihar
Road, Andheri (East), Mumbai-400 072.
• 504, Dalamal House, Nariman Point, Mumbai - 400 021.
• 309-310, Surya Kiran Building, 19, Kasturba Gandhi Marg, New Delhi-110 001.
• 377-B, Muthuswami Industrial Complex, Palladam
Road, Tirupur - 638 604.
• 1st Floor, Palm Court, Opposite Management
Development Institute, MG Road, Sector -16, Gurugram - 122 001.

VARDHAMAN TEXTILES LIMITED
CHANDIGARH ROAD, LUDHIANA - 141 010
CIN: L17111PB1973PLC003345
a K
&A
cre
ati
on
|
ww
w.k
alo
lwa
la.c
o.i
n

