delivering sustainable growth - britvic plc/media/files/b/britvic-v3/documents/pdf/... · mountain...
TRANSCRIPT

Delivering sustainable growthAnnual Report and Accounts 2017
Britvic’s vision is to be the most dynamic, creative and trusted soft drinks company in the world, which we will achieve through our purpose of making life’s everyday moments more enjoyable.
We fulfi l our purpose through our uniquely broad portfolio of 30 much-loved own brands, including iconic brands such as Robinsons, MiWadi, Maguary and Teisseire, which bring joy to millions of people around the world every day.
Alongside our own brands, we are proud to produce and sell PepsiCo brands such as Pepsi and 7UP, which Britvic produces in GB and Ireland under exclusive PepsiCo agreements. We also bottle and distribute Lipton Ice Tea in the UK as part of a licensing agreement with PepsiCo and Unilever.
Headquartered in the UK, with operations in France, Brazil, Ireland and the United States, we have invested signifi cantly in our supply chain and manufacturing sites, our innovation capability and our people, to deliver sustainable growth today and in the future.
Britvic – making life’s everyday moments more enjoyable.
STRATEGIC REPORT1 Our highlights2 A year of achievements4 Our business at a glance5 Our brands6 Our business model8 Chairman’s statement10 Chief Executive’s statement14 Market review16 Our strategy at a glance18 Our strategy in action26 Key performance indicators28 Risk management29 Principal risks and uncertainties33 Viability statement34 Sustainable business review40 Chief Financial Offi cer’s review
GOVERNANCE44 Chairman’s introduction
to governance45 Board Diversity46 Board of Directors48 Executive team50 Corporate governance50 Leadership54 Eff ectiveness56 Nomination committee58 Accountability58 Audit committee report62 Directors’ remuneration report
64 Remuneration at a glance67 Directors’ remuneration policy75 Annual report on remuneration86 Directors’ report89 Statement of directors’
responsibility
FINANCIAL STATEMENTS90 Independent Auditor’s Report
to the members of Britvic plc 96 Consolidated income statement97 Consolidated statement of
comprehensive income 98 Consolidated balance sheet99 Consolidated statement of
cash fl ows100 Consolidated statement of
changes in equity101 Notes to the consolidated
fi nancial statements140 Company balance sheet141 Company statement of
changes in equity142 Notes to the company fi nancial
statements
ADDITIONAL INFORMATION149 Shareholder information151 Glossary152 Non-GAAP reconciliations
Cautionary note regarding forward-looking statementsThis report includes statements that are forward-looking in nature. Forward-looking statements involve known and unknown risks, uncertainties and other factors which may cause the actual results, performance or achievements of the Group to be materially different from any future results, performance or achievements expressed or implied by such forward-looking statements. Except as required by the Listing Rules and applicable law, Britvic undertakes no obligation to update or change any forward-looking statements to reflect events occurring after the date such statements are published.
Adjusted EBITA*(£ millions)
Profi t after tax (£ millions)
Dividend per share (pence)
Revenue (£ millions)
Adjusted EBITA margin*(%)
Adjusted earnings per share*(pence)
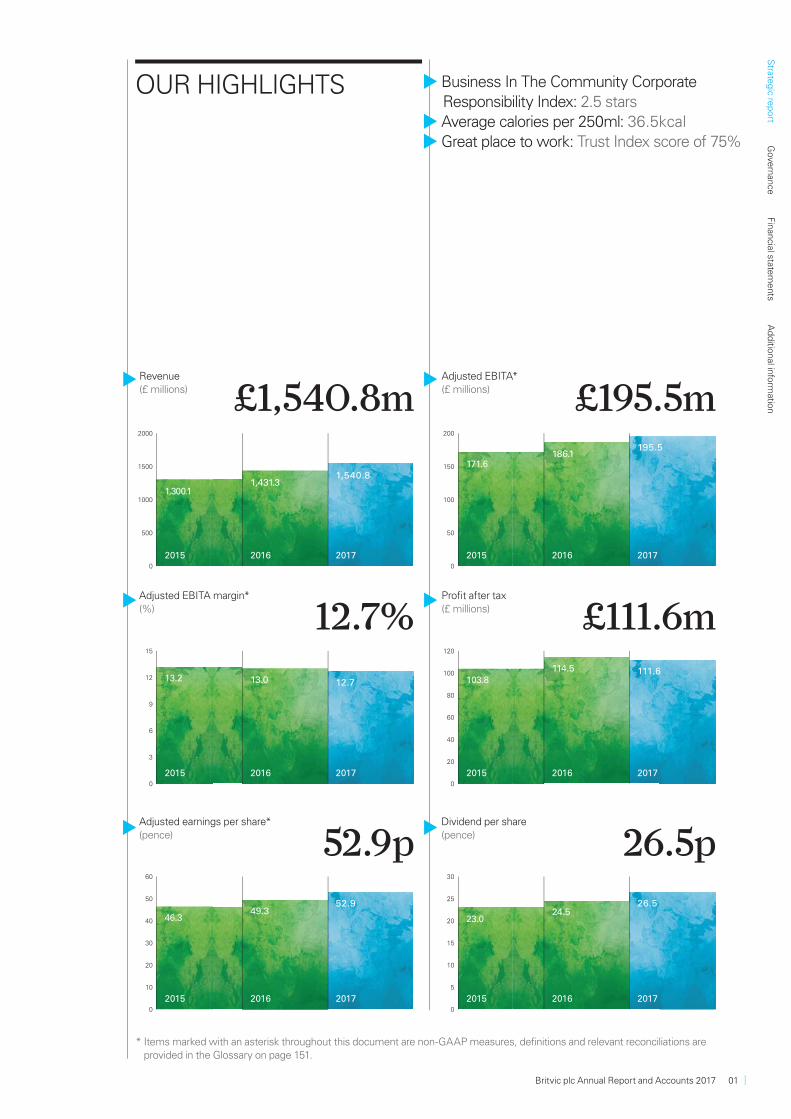
Business In The Community Corporate Responsibility Index: 2.5 stars
Average calories per 250ml: 36.5kcal Great place to work: Trust Index score of 75%
£195.5m
£111.6m
26.5p
£1,540.8m
12.7%
52.9p
OUR HIGHLIGHTS
* Items marked with an asterisk throughout this document are non-GAAP measures, definitions and relevant reconciliations are provided in the Glossary on page 151.
0
500
1000
1500
2000
1,300.1
2015
1,431.3
2016
1,540.8
20170
50
100
150
200
171.6
2015
186.1
2016
195.5
2017
0
3
6
9
12
15
13.2
2015
13.0
2016
12.7
20170
20
40
60
80
100
120
103.8
2015
114.5
2016
111.6
2017
0
10
20
30
40
50
60
46.3
2015
49.3
2016
52.9
20170
5
10
15
20
25
30
23.0
2015
24.5
2016
26.5
2017
Strate
gic re
port
Gove
rnan
ceFin
ancial state
ments
Ad
ditio
nal info
rmatio
n
Britvic plc Annual Report and Accounts 2017 01

A YEAR OF ACHIEVEMENTSQUENCHING THE THIRST FOR A BETTER WORLD
SUPPLY CHAIN INVESTMENTWe have investednet capital of £144m in our supply chain capability over the past two years
75% Great Place to Work Trust Index score
We’re proud to be an inspiring place to work for our colleagues in Europe and around the world
£144m
Robinsons Refresh’d Since its launch in April 2017, Robinsons Refresh’d has achieved retail sales value of £4m
20bn Over 20bn annualised calorie reduction across our GB drinks portfolio since 2013
02 www.britvic.com
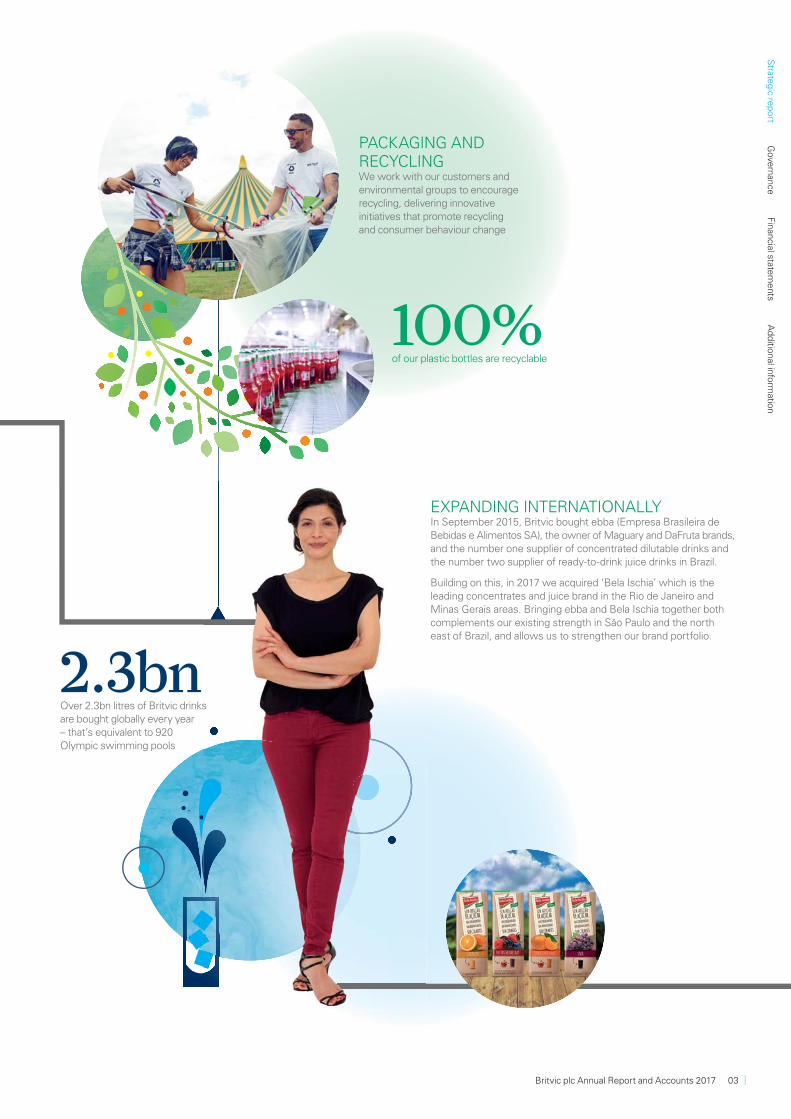
2.3bnOver 2.3bn litres of Britvic drinks are bought globally every year – that’s equivalent to 920 Olympic swimming pools
PACKAGING AND RECYCLINGWe work with our customers and environmental groups to encourage recycling, delivering innovative initiatives that promote recycling and consumer behaviour change
EXPANDING INTERNATIONALLYIn September 2015, Britvic bought ebba (Empresa Brasileira de Bebidas e Alimentos SA), the owner of Maguary and DaFruta brands, and the number one supplier of concentrated dilutable drinks and the number two supplier of ready-to-drink juice drinks in Brazil.
Building on this, in 2017 we acquired ‘Bela Ischia’ which is the leading concentrates and juice brand in the Rio de Janeiro and Minas Gerais areas. Bringing ebba and Bela Ischia together both complements our existing strength in São Paulo and the north east of Brazil, and allows us to strengthen our brand portfolio.
100%of our plastic bottles are recyclable
Strate
gic re
port
Gove
rnan
ceFin
ancial state
ments
Ad
ditio
nal info
rmatio
n
Britvic plc Annual Report and Accounts 2017 03
OUR BUSINESS AT A GLANCE
Britvic sets itself apart from its competitors by our unrivalled combination of market leading brands and track record in innovation, our expert knowledge of the soft drinks market, longstanding and sustainable relationships with our partners, including PepsiCo, and a highly talented and committed workforce.
BUILT ON STRONG HERITAGE
Mid 19th century
In Chelmsford a chemist begins creating homemade soft drinks
1938
The company is acquired by James MacPherson & Co Ltd, and develops the business to introduce soft drinks as an aff ordable source of vitamins for the people of the UK
1949
A range of juices are launched under the name of British Vitamin Products
1954
The British Vitamin Products Company is sold to Vine Products Limited and the fi rst factory is built
1968
The British Vitamin Products Company becomes part of Allied Breweries Limited and Minister Minerals Limited
1971
The British Vitamin Product Company formally changes its name to Britvic
1972
The Britvic brand of original mixers is introduced
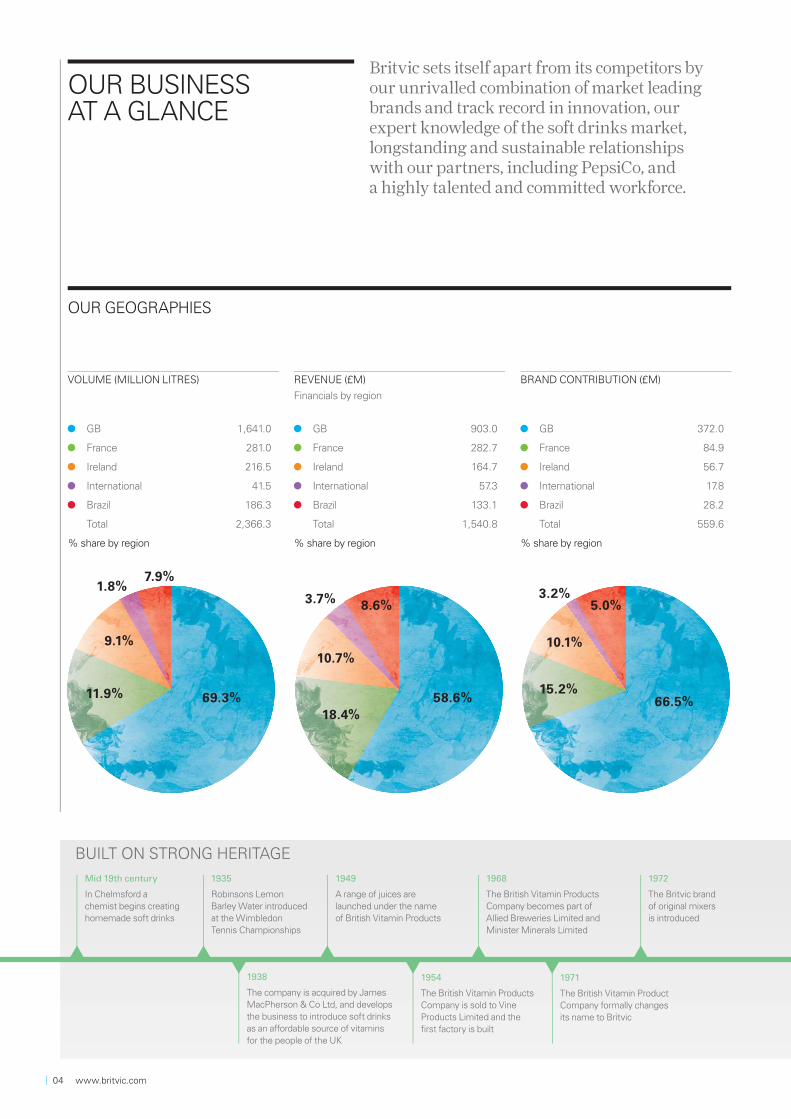
OUR GEOGRAPHIES
VOLUME (MILLION LITRES) REVENUE (£M)
Financials by region
BRAND CONTRIBUTION (£M)
GB 1,641.0 GB 903.0 GB 372.0
France 281.0 France 282.7 France 84.9
Ireland 216.5 Ireland 164.7 Ireland 56.7
International 41.5 International 57.3 International 17.8
Brazil 186.3 Brazil 133.1 Brazil 28.2
Total 2,366.3 Total 1,540.8 Total 559.6
% share by region % share by region % share by region
1935
Robinsons Lemon Barley Water introduced at the Wimbledon Tennis Championships
69.3% 58.6% 66.5%11.9%
18.4%
15.2%
9.1%10.7%
10.1%
1.8%3.7% 3.2%
7.9%
8.6% 5.0%
04 www.britvic.com
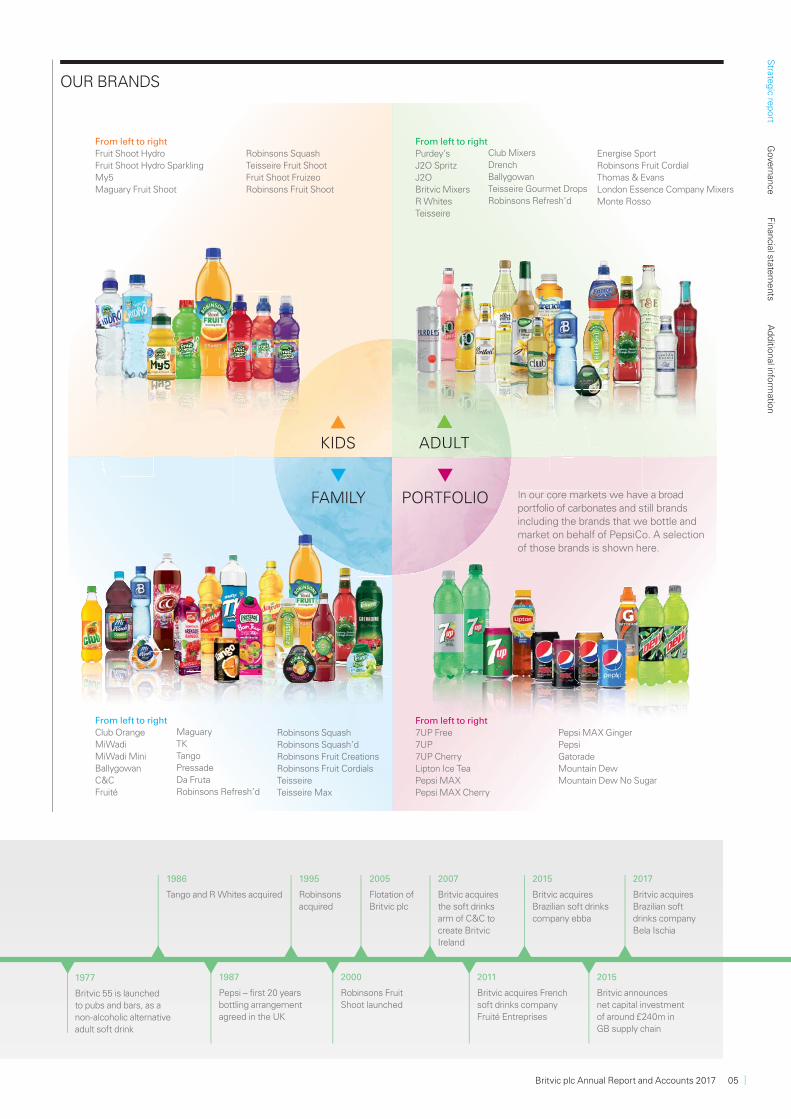
OUR BRANDS
2007
Britvic acquires the soft drinks arm of C&C to create Britvic Ireland
1977
Britvic 55 is launched to pubs and bars, as a non-alcoholic alternative adult soft drink
1986
Tango and R Whites acquired
1987
Pepsi – fi rst 20 years bottling arrangement agreed in the UK
1995
Robinsons acquired
2000
Robinsons Fruit Shoot launched
2011
Britvic acquires French soft drinks company Fruité Entreprises
2015
Britvic announces net capital investment of around £240m in GB supply chain
2015
Britvic acquires Brazilian soft drinks company ebba
2017
Britvic acquires Brazilian soft drinks company Bela Ischia
In our core markets we have a broad portfolio of carbonates and still brands including the brands that we bottle and market on behalf of PepsiCo. A selection of those brands is shown here.
From left to right7UP Free7UP7UP CherryLipton Ice TeaPepsi MAXPepsi MAX Cherry
Pepsi MAX GingerPepsiGatoradeMountain DewMountain Dew No Sugar
From left to rightPurdey’sJ2O SpritzJ2OBritvic MixersR WhitesTeisseire
From left to rightClub OrangeMiWadiMiWadi MiniBallygowanC&CFruité
From left to rightFruit Shoot HydroFruit Shoot Hydro Sparkling My5Maguary Fruit Shoot
Robinsons SquashTeisseire Fruit ShootFruit Shoot FruizeoRobinsons Fruit Shoot
ADULTKIDS
FAMILY PORTFOLIO
Energise SportRobinsons Fruit CordialThomas & EvansLondon Essence Company MixersMonte Rosso
Club MixersDrenchBallygowanTeisseire Gourmet DropsRobinsons Refresh’d
MaguaryTKTangoPressadeDa FrutaRobinsons Refresh’d
Robinsons SquashRobinsons Squash’dRobinsons Fruit CreationsRobinsons Fruit CordialsTeisseire Teisseire Max
2005
Flotation of Britvic plc
UULLLTTTT
we hav
Strate
gic re
port
Gove
rnan
ceFin
ancial state
ments
Ad
ditio
nal info
rmatio
n
Britvic plc Annual Report and Accounts 2017 05
OUR COMPANY VALUES
BE PROUD BE BOLD BE DISCIPLINED
1 2 3
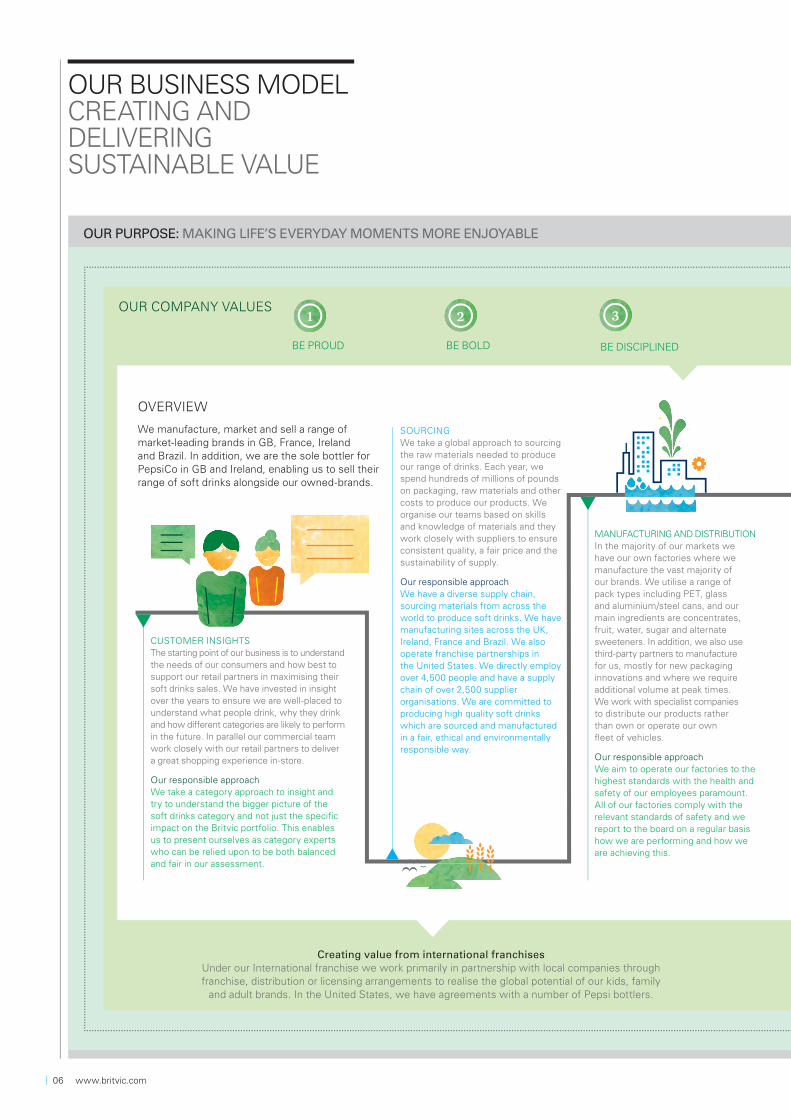
Creating value from international franchisesUnder our International franchise we work primarily in partnership with local companies through franchise, distribution or licensing arrangements to realise the global potential of our kids, family
and adult brands. In the United States, we have agreements with a number of Pepsi bottlers.
OVERVIEW
We manufacture, market and sell a range of market-leading brands in GB, France, Ireland and Brazil. In addition, we are the sole bottler for PepsiCo in GB and Ireland, enabling us to sell their range of soft drinks alongside our owned-brands.
CUSTOMER INSIGHTSThe starting point of our business is to understand the needs of our consumers and how best to support our retail partners in maximising their soft drinks sales. We have invested in insight over the years to ensure we are well-placed to understand what people drink, why they drink and how diff erent categories are likely to perform in the future. In parallel our commercial team work closely with our retail partners to deliver a great shopping experience in-store.
Our responsible approachWe take a category approach to insight and try to understand the bigger picture of the soft drinks category and not just the specifi c impact on the Britvic portfolio. This enables us to present ourselves as category experts who can be relied upon to be both balanced and fair in our assessment.
SOURCINGWe take a global approach to sourcing the raw materials needed to produce our range of drinks. Each year, we spend hundreds of millions of pounds on packaging, raw materials and other costs to produce our products. We organise our teams based on skills and knowledge of materials and they work closely with suppliers to ensure consistent quality, a fair price and the sustainability of supply.
Our responsible approachWe have a diverse supply chain, sourcing materials from across the world to produce soft drinks. We have manufacturing sites across the UK, Ireland, France and Brazil. We also operate franchise partnerships in the United States. We directly employ over 4,500 people and have a supply chain of over 2,500 supplier organisations. We are committed to producing high quality soft drinks which are sourced and manufactured in a fair, ethical and environmentally responsible way.
MANUFACTURING AND DISTRIBUTIONIn the majority of our markets we have our own factories where we manufacture the vast majority of our brands. We utilise a range of pack types including PET, glass and aluminium/steel cans, and our main ingredients are concentrates, fruit, water, sugar and alternate sweeteners. In addition, we also use third-party partners to manufacture for us, mostly for new packaging innovations and where we require additional volume at peak times. We work with specialist companies to distribute our products rather than own or operate our own fl eet of vehicles.
Our responsible approachWe aim to operate our factories to the highest standards with the health and safety of our employees paramount. All of our factories comply with the relevant standards of safety and we report to the board on a regular basis how we are performing and how we are achieving this.
OUR PURPOSE: MAKING LIFE’S EVERYDAY MOMENTS MORE ENJOYABLE
OUR BUSINESS MODEL CREATING AND DELIVERING SUSTAINABLE VALUE
06 www.britvic.com
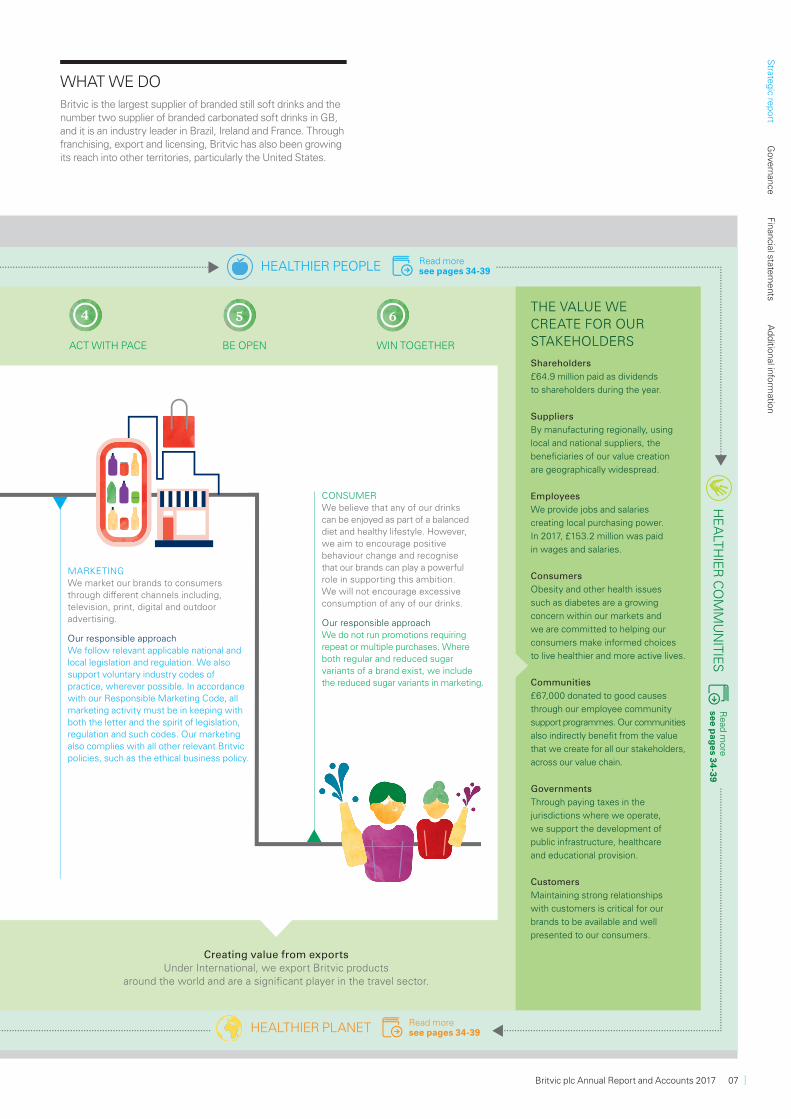
ACT WITH PACE BE OPEN WIN TOGETHER
THE VALUE WE CREATE FOR OUR STAKEHOLDERS
Shareholders
£64.9 million paid as dividends
to shareholders during the year.
Suppliers
By manufacturing regionally, using
local and national suppliers, the
benefi ciaries of our value creation
are geographically widespread.
Employees
We provide jobs and salaries
creating local purchasing power.
In 2017, £153.2 million was paid
in wages and salaries.
Consumers
Obesity and other health issues
such as diabetes are a growing
concern within our markets and
we are committed to helping our
consumers make informed choices
to live healthier and more active lives.
Communities
£67,000 donated to good causes
through our employee community
support programmes. Our communities
also indirectly benefi t from the value
that we create for all our stakeholders,
across our value chain.
Governments
Through paying taxes in the
jurisdictions where we operate,
we support the development of
public infrastructure, healthcare
and educational provision.
Customers
Maintaining strong relationships
with customers is critical for our
brands to be available and well
presented to our consumers.
4 5 6
Creating value from exportsUnder International, we export Britvic products
around the world and are a signifi cant player in the travel sector.
MARKETINGWe market our brands to consumers through diff erent channels including, television, print, digital and outdoor advertising.
Our responsible approachWe follow relevant applicable national and local legislation and regulation. We also support voluntary industry codes of practice, wherever possible. In accordance with our Responsible Marketing Code, all marketing activity must be in keeping with both the letter and the spirit of legislation, regulation and such codes. Our marketing also complies with all other relevant Britvic policies, such as the ethical business policy.
CONSUMERWe believe that any of our drinks can be enjoyed as part of a balanced diet and healthy lifestyle. However, we aim to encourage positive behaviour change and recognise that our brands can play a powerful role in supporting this ambition. We will not encourage excessive consumption of any of our drinks.
Our responsible approachWe do not run promotions requiring repeat or multiple purchases. Where both regular and reduced sugar variants of a brand exist, we include the reduced sugar variants in marketing.
WHAT WE DO Britvic is the largest supplier of branded still soft drinks and the number two supplier of branded carbonated soft drinks in GB, and it is an industry leader in Brazil, Ireland and France. Through franchising, export and licensing, Britvic has also been growing its reach into other territories, particularly the United States.
HEALTHIER PLANET Read moresee pages 34-39
HEALTHIER PEOPLE Read moresee pages 34-39
HE
ALT
HIE
R C
OM
MU
NIT
IES
Re
ad m
ore
see p
ag
es 3
4-3
9
Strate
gic re
port
Gove
rnan
ceFin
ancial state
ments
Ad
ditio
nal info
rmatio
n
Britvic plc Annual Report and Accounts 2017 07

IntroductionI am honoured to have the opportunity to write to you as we report our full year results for 2017 having been appointed as Chairman in September. I would like to pay tribute to Gerald Corbett who has guided the company since its debut as a public company in 2005. Under his stewardship Britvic has diversified its presence into new markets and quadrupled its market valuation. On behalf of everyone at Britvic I would like to thank him for his service and commitment to Britvic and we wish him well for the future.
Review of the YearOur 2017 results delivered a solid growth in revenue to £1,540.8m (2016: £1,431.3m), despite continued challenging market conditions. Adjusted EBITA* increased by 5.1% to £195.5m, translating into adjusted earnings per share* of 52.9p. Statutory profit after tax declined 2.5% to £111.6m, reflecting the costs incurred by the business which related to the three-year business capability programme which started in 2016. During 2017, the Executive team have successfully overseen and delivered transformational change to the business which has included:
• In relation to the business capability programme we have installed new production lines, built new on-site warehousing and undertaken major groundworks for the fi nal phase. This will enable the business to be more effi cient and able to compete at the highest level
• The completion of two acquisitions, in Ireland and Brazil. Both these businesses are complementary to the company’s strategy and will support our growth ambitions in the respective markets.
Further information of our performance can be found on pages 40 to 43.
Our PeopleOur employees are at the heart of this business. This year has been a testing one for many of them, the business capability programme has put pressure on them to deliver change whilst maintaining service to our customers and ultimately our consumers.
CHAIRMAN’S STATEMENTFOCUSED ON THE FUTUREJohn Daly Chairman
Britvic is in a strong position today and I am confident in its ability to grow and capitalise on opportunities as they arise in the future.
08 www.britvic.com
Having visited some of our sites I am extremely impressed by the tenacity, passion and commitment that they have demonstrated. This level of commitment and passion exists throughout Britvic and on behalf of the Board I would like to thank all of them for their hard work. In October we announced a proposal to close our Norwich site with the loss of 242 roles. This was not an easy decision for the Board and senior management team but one that we felt necessary to protect the long-term prospects of the business. As a Board, we are committed to treating those affected with respect and dignity and the proposal in no way reflected their performance. Every effort will be made to re-deploy those who wish to transfer to other sites and we will provide every assistance for those seeking to find new roles elsewhere.
The BoardHaving succeeded Gerald as Chairman we have made some further changes to the board. Sue Clark has been appointed Chair of the Remuneration Committee and Ian McHoul appointed Senior Independent Director whilst remaining Chair of the Audit Committee. Both Sue and Ian have extensive multinational experience that has benefited the Board since they joined in recent years. In September, Joanne Averiss stepped down from the board as the PepsiCo nominated director. Ben Gordon will reach the end of his ninth year of tenure in 2018 and it has been agreed that Ben will step down in early 2018 and will not seek re-election at the AGM. Both Joanne and Ben have made valuable contributions during their tenure and I would like to thank them for their support and wish them well for the future. In view of Joanne and Ben’s retirement from the Board, I am delighted to announce the appointment of Suniti Chauhan and William Eccleshare, effective 29 November 2017. Suniti brings significant M&A, corporate finance and development experience whilst William has a strong background in marketing and innovation. They are excellent additions to the the Board as we look to continue to develop our business in the UK and internationally.
Looking AheadThe long-term prospects for this business are good and on behalf of the Board, we look forward to continuing to support Simon, Mat and the wider management team as they continue to deliver the strategy. Next year the business faces a unique event with the introduction of the Soft Drinks Industry Levy (SDIL) in both the UK and Ireland. Whilst this may well lead to some short-term volatility in the industry, I am confident we have the right portfolio to navigate through this challenge. Britvic is in a strong position today and I am confident in its ability to grow and capitalise on opportunities as they arise in the future.
The AGM will be held at 11am on 31 January 2018 at the offices of Linklaters LLP and I look forward to seeing you there. Further information can be found in the Notice of Meeting which is available on the Britvic website atwww.britvic.com/investors.
John Daly Chairman28 November 2017
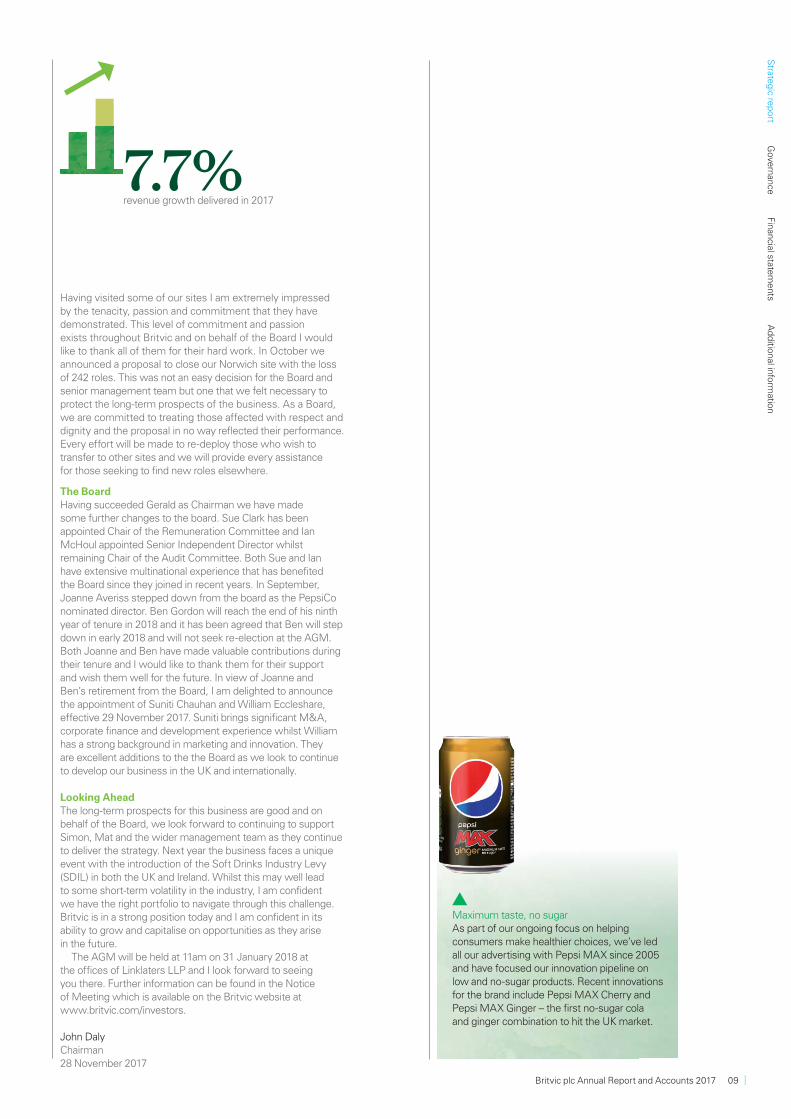
7.7%revenue growth delivered in 2017
Maximum taste, no sugarAs part of our ongoing focus on helping consumers make healthier choices, we’ve led all our advertising with Pepsi MAX since 2005 and have focused our innovation pipeline on low and no-sugar products. Recent innovations for the brand include Pepsi MAX Cherry and Pepsi MAX Ginger – the first no-sugar cola and ginger combination to hit the UK market.
Strate
gic re
port
Gove
rnan
ceFin
ancial state
ments
Ad
ditio
nal info
rmatio
n
Britvic plc Annual Report and Accounts 2017 09

CHIEF EXECUTIVE’SSTATEMENTCAPITALISE ON EXISTING AND FUTURE OPPORTUNITIESSimon LitherlandChief Executive Officer
This year we have continued to make good progress delivering our long-term strategic goals. The challenges we face in all our markets have been well documented, however our continued focus on meeting consumer needs, successfully executing our commercial plans and driving cost efficiency has translated into a strong full year performance. We have delivered revenue and margin growth and our adjusted EBITA* increased by 5.1%, enabling us to deliver an 8.2% increase in the full year dividend.
Generate profitable growth in our core marketsGBThe GB soft drinks market, as measured by Nielsen, has for the first time in several years seen value growth ahead of volume. Thanks to disciplined revenue management we have led the value growth in the soft drinks category and successfully protected our profitability in response to rising costs driven by underlying cost inflation and the weakening of sterling. Margins improved in the second half of the year following the implementation of revenue management changes.
In the carbonates category, we have continued to focus on no and low-sugar offerings. Despite a highly competitive grocery market, Pepsi MAX has continued to gain volume and value share and we have seen an excellent performance from the R Whites brand, following the introduction of a premium range last year. In GB stills, whilst we have seen a decline in revenue, our performance trajectory has improved year on year and, encouragingly, we have returned to volume growth. Robinsons and Fruit Shoot have faced pricing pressure in grocery, largely due to aggressive private label and branded competition. Whilst we anticipated a weaker final quarter, it was worse than expected due to the poor weather in July and August. Warm weather during the school holidays is particularly beneficial to our portfolio of still brands.
We have continued to benefit from a strong performance in our portfolio of immediate refreshment packs, while in the leisure channel we have won or retained major accounts such as Mitchells & Butlers, Marston’s and KFC.
Our recent innovations, which we believe offer significant future growth opportunities, have performed well and now represent 5.4% of total revenue. Purdey’s, a healthier, more natural energy drink, is resonating with consumers and increased its retail value by 55% this year. In the second half of the year we launched Robinsons Refresh’d and we are really pleased with its early performance, achieving £4m retail sales value in 19 weeks since launch. This ready-to-drink format offers naturally sourced ingredients and no added sugar, enabling consumers to enjoy tasty, healthy hydration at only 55 calories per bottle.
FranceThe soft drinks market, as measured by IRI, has remained subdued, reflecting both the poor summer weather and the continued impact of the consolidation of procurement by grocery retailers. Despite these headwinds, our revenues increased, driven by the growth of our branded portfolio. We have focused our juice brand marketing on the organic Pressade brand and have seen consumers respond positively to the introduction of the “Bonjour” range of breakfast time
We have again demonstrated our ability to deliver both our short-term financial goals and our long-term strategic priorities in the face of a challenging external environment.
10 www.britvic.com
SIMON LITHERLANDANSWERS TOPICAL SHAREHOLDER QUESTIONS
How do you see the consumer environment, any adverse change in consumer behaviour this year?We have yet to see any material change in consumer demand for our products in any of our sales channels in GB. In Ireland, the retail environment has remained deflationary and in France, the consumer environment has remained stable this year. The macroeconomic environment in Brazil has been challenging this year for consumer goods companies, and soft drinks has been affected as have many other categories. There is pressure on disposable incomes, unemployment has remained high and so people have been cutting back.
Why has profi t after tax gone down?
Profit after tax is a statutory measure and takes into account one-off costs that have been incurred. In our case the bulk of these one-off costs relate to our business capability programme and cover things such as scrapping old assets and dual-running costs of old and new lines. Adjusted EBITA* which adjusts for these one-off costs generated growth of over 5%.
Are you feeling more or less confi dent on the prospects for Fruit Shoot in the USA than last year? We have made steady progress over the last 12 months, growing distribution and market share. As we head into 2018 we are clear on our priorities of delivering consistent, quality in-store execution. Improving availability on-shelf, great feature and display as well as building awareness through sampling and trial are all key areas to focus on.
juices. In addition, Fruit Shoot has continued to grow, benefiting from the recent introduction of new flavour variants and the launch of a higher-juice Fruit Shoot range called Fruizeo, that uses spring water and has no added sugar.
IrelandThe year has seen continued success in Ireland, with growth in both our own brand portfolio and the Counterpoint wholesale business. Growth in Counterpoint has been further boosted by additional business in Dublin following the successful completion of the acquisition of East Coast in January. Our owned brands, including Ballygowan and MiWadi, have grown whilst 7UP declined in a competitive lemon and lime category.
Realise global opportunities in kids, family and adult categoriesAfter a very successful first year in Brazil, we have seen the well-publicised macro environment challenges have an adverse effect on consumer spending and FMCG categories. Our focus has been twofold. Firstly, we have looked to protect margins in the short term to ensure our business is well positioned now and for the future. We have increased prices to offset high cost inflation, yet continued to take share thanks to our strong in-store execution. Secondly, we have continued to invest in the long-term opportunities we see; we continued to expand our brand portfolio including continuing the roll out of Fruit Shoot, and we have extended our geographic reach through the acquisition of Bela Ischia, where we will exceed the planned R$10m cost synergies. We believe we are taking the right actions to build a strong, sustainable position for future long-term growth.
We continue to invest in our international business for long-term growth, and our efforts to improve the profitability of the business unit are delivering results. In the United States Fruit Shoot has made steady progress this year. We continue to work with PepsiCo to grow the presence of singles outside of the convenience & gas channel into areas such as foodservice and leisure. In the grocery channel, we are now lapping the first year of multi-pack in market. We have retained key listings and retailer feedback has been positive as we head into year two. The focus is to ensure we deliver the best experience in outlet. Alongside this we are working behind the scenes to optimise the supply chain framework to improve profitability. To date we have seen enough proof points to support our belief that there is a meaningful opportunity for us to invest in, but is still too early to call it a long-term success.
Continue to step-change our business capabilityWe are now two years into the three year business capability programme and this year we have a seen a significant amount of progress. Our Leeds site is now close to completion, with both the big and small PET lines up and running and the automation of the new warehouse due for completion in the coming months. Our London site is now fully operational with a new flexible PET line and on-site warehouse completed. The site that has seen the most change this year is Rugby, where we have installed three new can lines and started the groundworks for the new warehouse and aseptic line that will come on-stream next year. We are ahead of schedule on the delivery of benefits, with £3m feeding through to the bottom line in 2017.
In October, we announced the proposed closure of our Norwich site in 2019. Subject to completion of consultation, production of Robinsons and Fruit Shoot is then proposed to transfer to our other GB sites, with additional PET lines proposed to be installed to accommodate this. We are fully committed to treating our employees fairly and with respect, and will be providing a full support package including redeployment, assistance to find jobs elsewhere and redundancy packages.
Upon completion of the proposed works in early 2019, we will then be in a position to realise the full benefits of the programme from 2020 in line with previously stated guidance. As well as greater production efficiency, we will benefit from reduced distribution costs and will be able to unlock a working capital benefit by carrying lower inventory. Free cash flow conversion should accelerate significantly, as capital
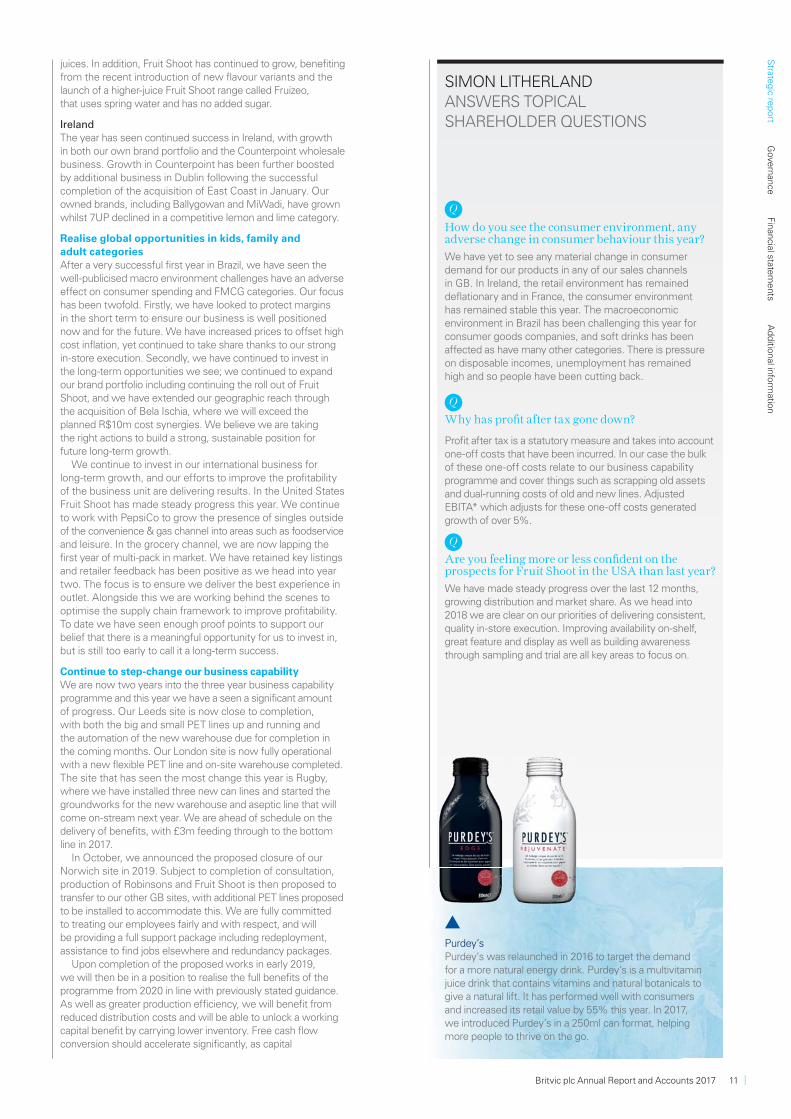
Purdey’sPurdey’s was relaunched in 2016 to target the demand for a more natural energy drink. Purdey’s is a multivitamin juice drink that contains vitamins and natural botanicals to give a natural lift. It has performed well with consumers and increased its retail value by 55% this year. In 2017, we introduced Purdey’s in a 250ml can format, helping more people to thrive on the go.
Strate
gic re
port
Gove
rnan
ceFin
ancial state
ments
Ad
ditio
nal info
rmatio
n
Britvic plc Annual Report and Accounts 2017 11
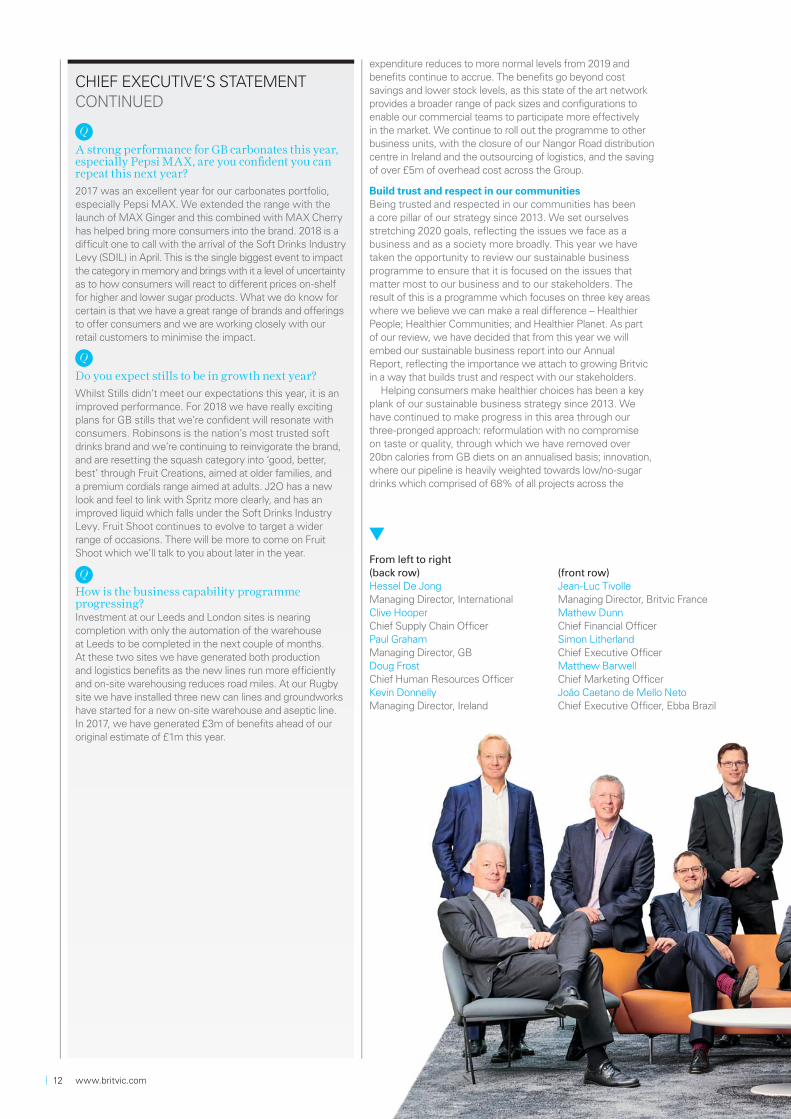
From left to right (back row)Hessel De JongManaging Director, InternationalClive HooperChief Supply Chain OfficerPaul GrahamManaging Director, GBDoug FrostChief Human Resources OfficerKevin DonnellyManaging Director, Ireland
(front row)Jean-Luc TivolleManaging Director, Britvic FranceMathew DunnChief Financial OfficerSimon LitherlandChief Executive OfficerMatthew BarwellChief Marketing OfficerJoão Caetano de Mello NetoChief Executive Officer, Ebba Brazil
CHIEF EXECUTIVE’S STATEMENTCONTINUED
A strong performance for GB carbonates this year, especially Pepsi MAX, are you confi dent you can repeat this next year?2017 was an excellent year for our carbonates portfolio, especially Pepsi MAX. We extended the range with the launch of MAX Ginger and this combined with MAX Cherry has helped bring more consumers into the brand. 2018 is a difficult one to call with the arrival of the Soft Drinks Industry Levy (SDIL) in April. This is the single biggest event to impact the category in memory and brings with it a level of uncertainty as to how consumers will react to different prices on-shelf for higher and lower sugar products. What we do know for certain is that we have a great range of brands and offerings to offer consumers and we are working closely with our retail customers to minimise the impact.
Do you expect stills to be in growth next year?Whilst Stills didn’t meet our expectations this year, it is an improved performance. For 2018 we have really exciting plans for GB stills that we’re confident will resonate with consumers. Robinsons is the nation’s most trusted soft drinks brand and we’re continuing to reinvigorate the brand, and are resetting the squash category into ‘good, better, best’ through Fruit Creations, aimed at older families, and a premium cordials range aimed at adults. J2O has a new look and feel to link with Spritz more clearly, and has an improved liquid which falls under the Soft Drinks Industry Levy. Fruit Shoot continues to evolve to target a wider range of occasions. There will be more to come on Fruit Shoot which we’ll talk to you about later in the year.
How is the business capability programme progressing?Investment at our Leeds and London sites is nearing completion with only the automation of the warehouse at Leeds to be completed in the next couple of months. At these two sites we have generated both production and logistics benefits as the new lines run more efficiently and on-site warehousing reduces road miles. At our Rugby site we have installed three new can lines and groundworks have started for a new on-site warehouse and aseptic line. In 2017, we have generated £3m of benefits ahead of our original estimate of £1m this year.
expenditure reduces to more normal levels from 2019 and benefits continue to accrue. The benefits go beyond cost savings and lower stock levels, as this state of the art network provides a broader range of pack sizes and configurations to enable our commercial teams to participate more effectively in the market. We continue to roll out the programme to other business units, with the closure of our Nangor Road distribution centre in Ireland and the outsourcing of logistics, and the saving of over £5m of overhead cost across the Group.
Build trust and respect in our communitiesBeing trusted and respected in our communities has been a core pillar of our strategy since 2013. We set ourselves stretching 2020 goals, reflecting the issues we face as a business and as a society more broadly. This year we have taken the opportunity to review our sustainable business programme to ensure that it is focused on the issues that matter most to our business and to our stakeholders. The result of this is a programme which focuses on three key areas where we believe we can make a real difference – Healthier People; Healthier Communities; and Healthier Planet. As part of our review, we have decided that from this year we will embed our sustainable business report into our Annual Report, reflecting the importance we attach to growing Britvic in a way that builds trust and respect with our stakeholders.
Helping consumers make healthier choices has been a key plank of our sustainable business strategy since 2013. We have continued to make progress in this area through our three-pronged approach: reformulation with no compromise on taste or quality, through which we have removed over 20bn calories from GB diets on an annualised basis; innovation, where our pipeline is heavily weighted towards low/no-sugar drinks which comprised of 68% of all projects across the
12 www.britvic.com
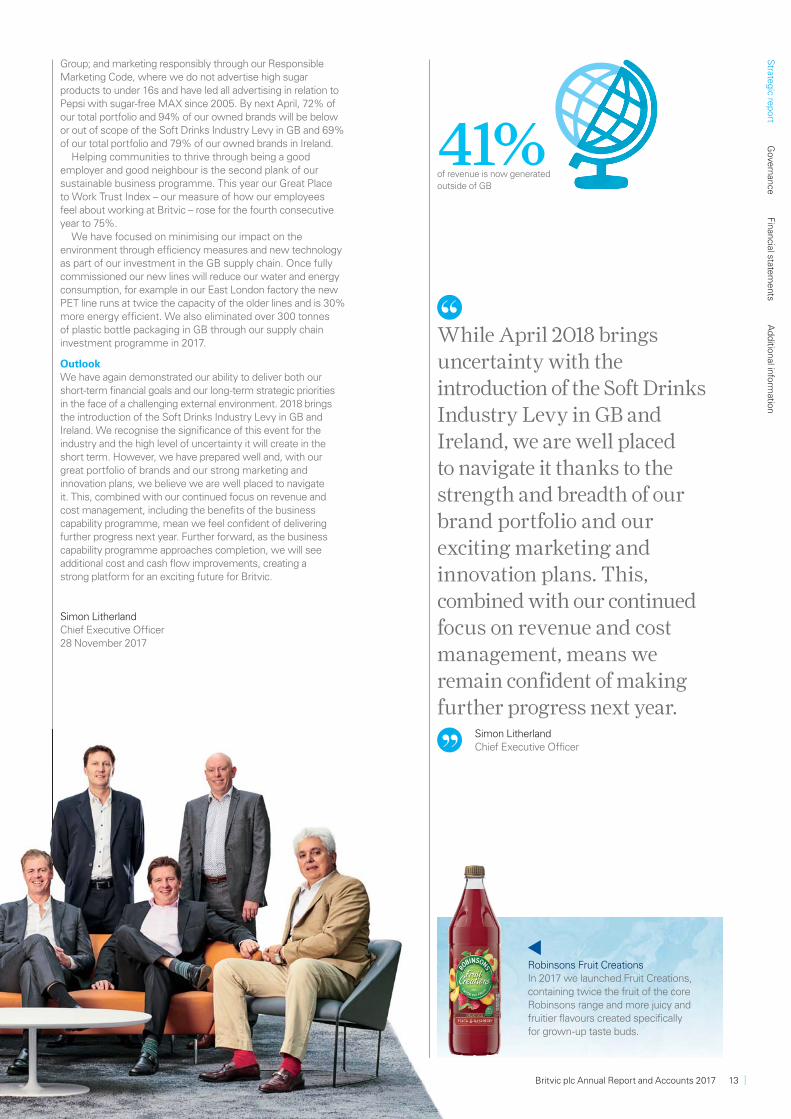
41%of revenue is now generated outside of GB
Robinsons Fruit CreationsIn 2017 we launched Fruit Creations, containing twice the fruit of the core Robinsons range and more juicy and fruitier flavours created specifically for grown-up taste buds.
While April 2018 brings uncertainty with the introduction of the Soft Drinks Industry Levy in GB and Ireland, we are well placed to navigate it thanks to the strength and breadth of our brand portfolio and our exciting marketing and innovation plans. This, combined with our continued focus on revenue and cost management, means we remain confident of making further progress next year.
Simon LitherlandChief Executive Officer
Group; and marketing responsibly through our Responsible Marketing Code, where we do not advertise high sugar products to under 16s and have led all advertising in relation to Pepsi with sugar-free MAX since 2005. By next April, 72% of our total portfolio and 94% of our owned brands will be below or out of scope of the Soft Drinks Industry Levy in GB and 69% of our total portfolio and 79% of our owned brands in Ireland.
Helping communities to thrive through being a good employer and good neighbour is the second plank of our sustainable business programme. This year our Great Place to Work Trust Index – our measure of how our employees feel about working at Britvic – rose for the fourth consecutive year to 75%.
We have focused on minimising our impact on the environment through efficiency measures and new technology as part of our investment in the GB supply chain. Once fully commissioned our new lines will reduce our water and energy consumption, for example in our East London factory the new PET line runs at twice the capacity of the older lines and is 30% more energy efficient. We also eliminated over 300 tonnes of plastic bottle packaging in GB through our supply chain investment programme in 2017.
OutlookWe have again demonstrated our ability to deliver both our short-term financial goals and our long-term strategic priorities in the face of a challenging external environment. 2018 brings the introduction of the Soft Drinks Industry Levy in GB and Ireland. We recognise the significance of this event for the industry and the high level of uncertainty it will create in the short term. However, we have prepared well and, with our great portfolio of brands and our strong marketing and innovation plans, we believe we are well placed to navigate it. This, combined with our continued focus on revenue and cost management, including the benefits of the business capability programme, mean we feel confident of delivering further progress next year. Further forward, as the business capability programme approaches completion, we will see additional cost and cash flow improvements, creating a strong platform for an exciting future for Britvic.
Simon LitherlandChief Executive Officer28 November 2017
Strate
gic re
port
Gove
rnan
ceFin
ancial state
ments
Ad
ditio
nal info
rmatio
n
Britvic plc Annual Report and Accounts 2017 13
MARKET REVIEW RESPONDING TO THE TRENDS SHAPING OUR MARKETS
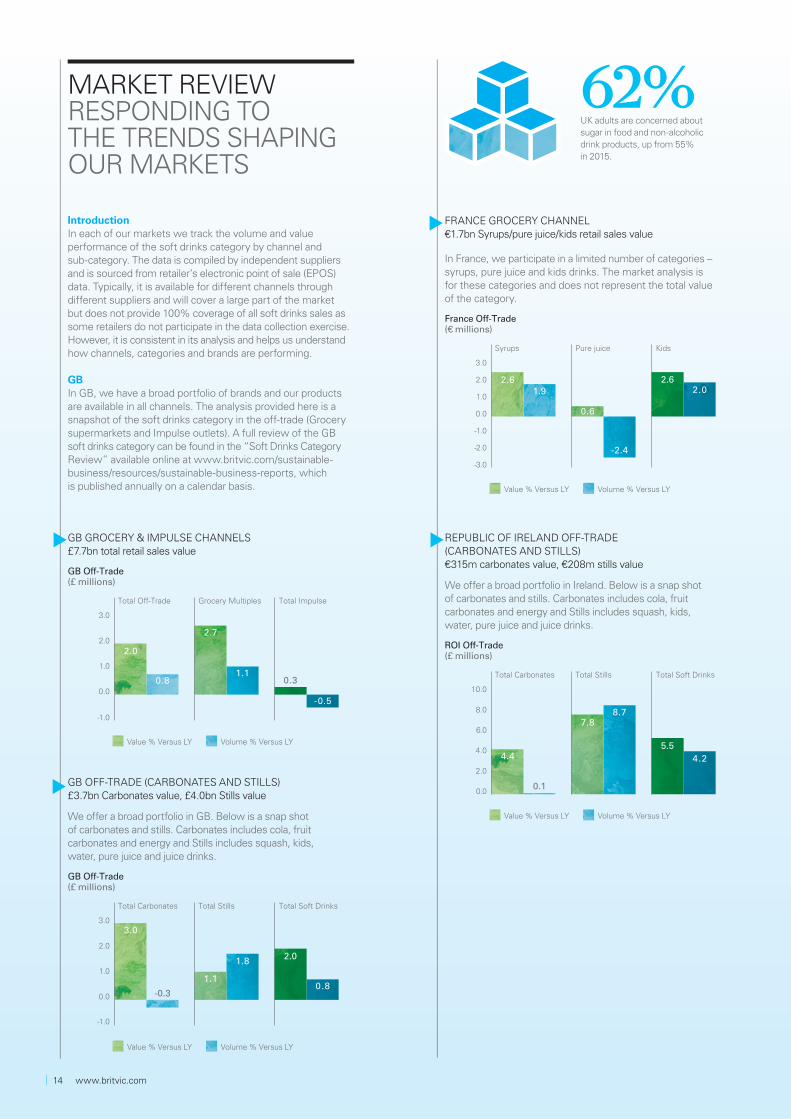
GB OFF-TRADE (CARBONATES AND STILLS) £3.7bn Carbonates value, £4.0bn Stills value
We offer a broad portfolio in GB. Below is a snap shot of carbonates and stills. Carbonates includes cola, fruit carbonates and energy and Stills includes squash, kids, water, pure juice and juice drinks.
GB Off-Trade(£ millions)
Value % Versus LY Volume % Versus LY
3.0
1.1
2.0
-0.3
1.8
0.8
Total StillsTotal Carbonates Total Soft Drinks
3.0
2.0
1.0
0.0
-1.0
FRANCE GROCERY CHANNEL €1.7bn Syrups/pure juice/kids retail sales value
In France, we participate in a limited number of categories – syrups, pure juice and kids drinks. The market analysis is for these categories and does not represent the total value of the category.
France Off-Trade(€ millions)
Value % Versus LY Volume % Versus LY
2.6
0.6
2.61.9
-2.4
2.0
Pure juiceSyrups Kids
3.0
2.0
1.0
-1.0
-2.0
0.0
-3.0
GB GROCERY & IMPULSE CHANNELS£7.7bn total retail sales value
GB Off-Trade(£ millions)
Value % Versus LY Volume % Versus LY
2.0
2.7
0.30.81.1
-0.5
Grocery MultiplesTotal Off-Trade Total Impulse
3.0
2.0
1.0
0.0
-1.0
REPUBLIC OF IRELAND OFF-TRADE (CARBONATES AND STILLS)€315m carbonates value, €208m stills value
We offer a broad portfolio in Ireland. Below is a snap shot of carbonates and stills. Carbonates includes cola, fruit carbonates and energy and Stills includes squash, kids, water, pure juice and juice drinks.
ROI Off-Trade(£ millions)
Value % Versus LY Volume % Versus LY
4.4
7.8
5.5
0.1
8.7
4.2
Total StillsTotal Carbonates Total Soft Drinks
10.0
8.0
6.0
2.0
4.0
0.0
62%UK adults are concerned about sugar in food and non-alcoholic drink products, up from 55% in 2015.
IntroductionIn each of our markets we track the volume and value performance of the soft drinks category by channel and sub-category. The data is compiled by independent suppliers and is sourced from retailer’s electronic point of sale (EPOS) data. Typically, it is available for different channels through different suppliers and will cover a large part of the market but does not provide 100% coverage of all soft drinks sales as some retailers do not participate in the data collection exercise. However, it is consistent in its analysis and helps us understand how channels, categories and brands are performing.
GBIn GB, we have a broad portfolio of brands and our products are available in all channels. The analysis provided here is a snapshot of the soft drinks category in the off-trade (Grocery supermarkets and Impulse outlets). A full review of the GB soft drinks category can be found in the “Soft Drinks Category Review” available online at www.britvic.com/sustainable-business/resources/sustainable-business-reports, which is published annually on a calendar basis.
14 www.britvic.com
Key macro trends in soft drinks & how Britvic are reacting to them The trends driving the soft drinks industry are rooted in evolving consumer lifestyles, societal challenges around health and the environment, and increased government intervention in the market. Collectively, these trends have driven reformulation and innovation in the soft drinks market on a significant scale. The three major outcomes of these trends dominating the market include:
1. Greater demand for healthier choices2. A drive towards premium options3. Convenience: more choices of soft
drinks available in more places
1
Healthier choicesFor several years, consumers have been embracing healthier lifestyles and they are actively choosing ‘better for you’ soft drinks options, as well as drinking less alcohol. At the same time, obesity levels globally are rising putting significant strains on public health services and prompting calls for governments to take action. As a result, both the UK and Irish governments will be introducing a Soft Drinks Industry Levy (SDIL) on drinks with more than 5g/100ml of added sugar in April 2018.
How is Britvic helping consumers make healthier choices?Our purpose is to make life’s everyday moments more enjoyable and part of doing that is by helping consumers make healthier choices through making drinks that taste great and are better for you. Since 2013, we embarked on a bold, 3-pronged strategy of reformulation, innovation and using the power of our brands responsibly to help consumers make healthier choices. As a result of our actions, we have removed over 20bn calories from our portfolio since 2013 on an annualised basis.
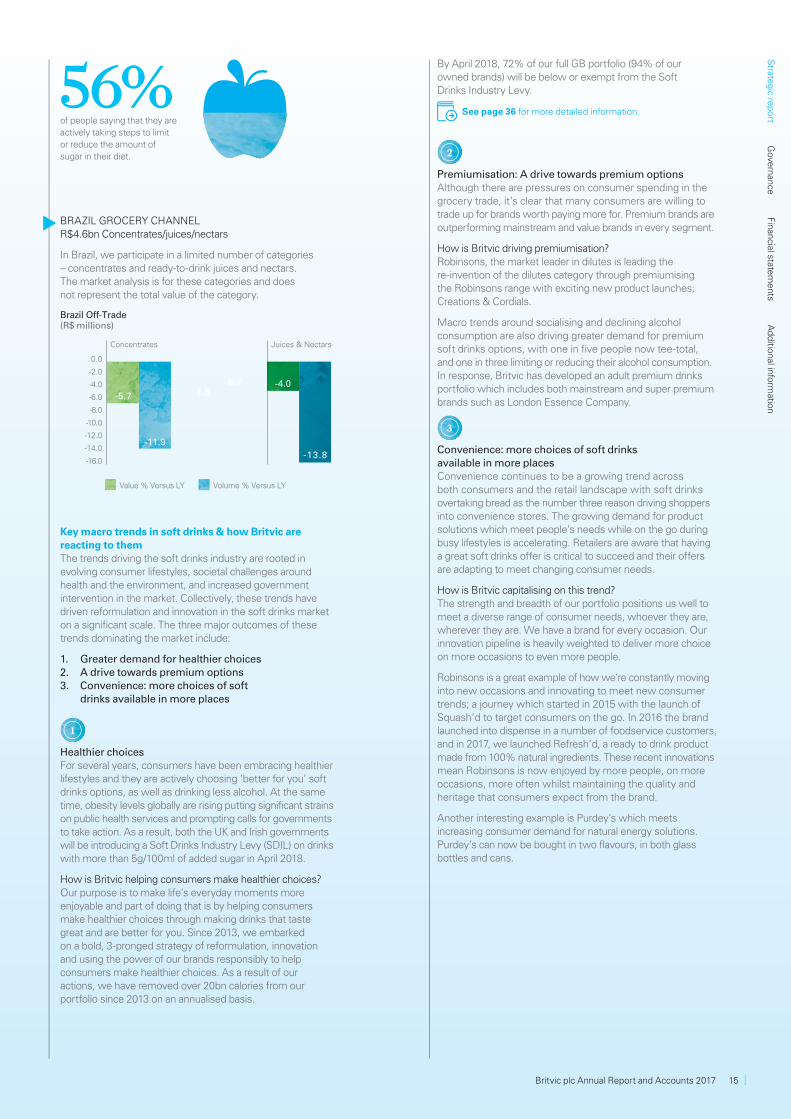
BRAZIL GROCERY CHANNEL R$4.6bn Concentrates/juices/nectars
In Brazil, we participate in a limited number of categories – concentrates and ready-to-drink juices and nectars. The market analysis is for these categories and does not represent the total value of the category.
Brazil Off-Trade(R$ millions)
Value % Versus LY Volume % Versus LY
-5.7 7.8-4.0
-11.9
8.7
-13.8
Concentrates Juices & Nectars
0.0
-6.0
-4.0
-2.0
-8.0
-10.0
-14.0
-12.0
-16.0
56%of people saying that they are actively taking steps to limit or reduce the amount of sugar in their diet.
By April 2018, 72% of our full GB portfolio (94% of our owned brands) will be below or exempt from the Soft Drinks Industry Levy.
See page 36 for more detailed information.
2
Premiumisation: A drive towards premium optionsAlthough there are pressures on consumer spending in the grocery trade, it’s clear that many consumers are willing to trade up for brands worth paying more for. Premium brands are outperforming mainstream and value brands in every segment.
How is Britvic driving premiumisation?Robinsons, the market leader in dilutes is leading the re-invention of the dilutes category through premiumising the Robinsons range with exciting new product launches; Creations & Cordials.
Macro trends around socialising and declining alcohol consumption are also driving greater demand for premium soft drinks options, with one in five people now tee-total, and one in three limiting or reducing their alcohol consumption. In response, Britvic has developed an adult premium drinks portfolio which includes both mainstream and super premium brands such as London Essence Company.
3
Convenience: more choices of soft drinks available in more placesConvenience continues to be a growing trend across both consumers and the retail landscape with soft drinks overtaking bread as the number three reason driving shoppers into convenience stores. The growing demand for product solutions which meet people’s needs while on the go during busy lifestyles is accelerating. Retailers are aware that having a great soft drinks offer is critical to succeed and their offers are adapting to meet changing consumer needs.
How is Britvic capitalising on this trend?The strength and breadth of our portfolio positions us well to meet a diverse range of consumer needs, whoever they are, wherever they are. We have a brand for every occasion. Our innovation pipeline is heavily weighted to deliver more choice on more occasions to even more people.
Robinsons is a great example of how we’re constantly moving into new occasions and innovating to meet new consumer trends; a journey which started in 2015 with the launch of Squash’d to target consumers on the go. In 2016 the brand launched into dispense in a number of foodservice customers, and in 2017, we launched Refresh’d, a ready to drink product made from 100% natural ingredients. These recent innovations mean Robinsons is now enjoyed by more people, on more occasions, more often whilst maintaining the quality and heritage that consumers expect from the brand.
Another interesting example is Purdey’s which meets increasing consumer demand for natural energy solutions. Purdey’s can now be bought in two flavours, in both glass bottles and cans.
Britvic plc Annual Report and Accounts 2017 15
Strate
gic re
port
Gove
rnan
ceFin
ancial state
ments
Ad
ditio
nal info
rmatio
n
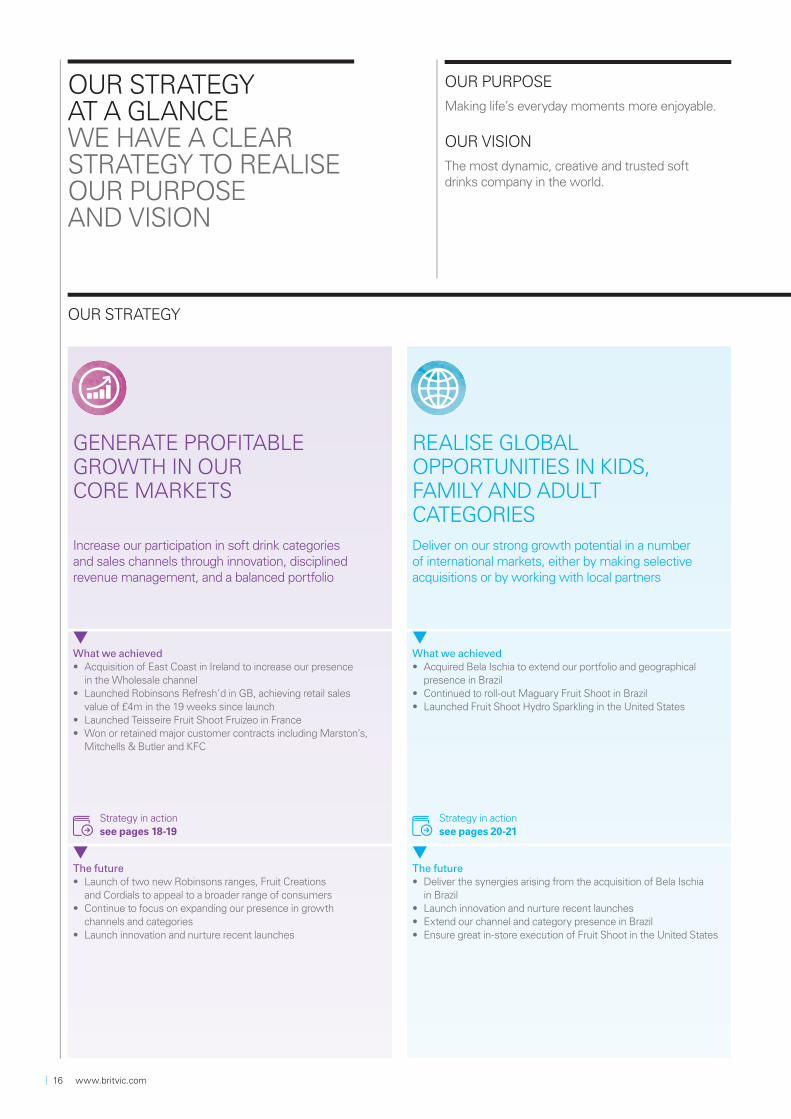
OUR STRATEGY AT A GLANCEWE HAVE A CLEAR STRATEGY TO REALISE OUR PURPOSE AND VISION
OUR PURPOSE
Making life’s everyday moments more enjoyable.
OUR VISION
The most dynamic, creative and trusted soft drinks company in the world.
OUR STRATEGY
GENERATE PROFITABLE GROWTH IN OUR CORE MARKETS
REALISE GLOBAL OPPORTUNITIES IN KIDS, FAMILY AND ADULT CATEGORIES
Increase our participation in soft drink categories and sales channels through innovation, disciplined revenue management, and a balanced portfolio
Deliver on our strong growth potential in a number of international markets, either by making selective acquisitions or by working with local partners
What we achieved• Acquisition of East Coast in Ireland to increase our presence
in the Wholesale channel• Launched Robinsons Refresh’d in GB, achieving retail sales
value of £4m in the 19 weeks since launch• Launched Teisseire Fruit Shoot Fruizeo in France• Won or retained major customer contracts including Marston’s,
Mitchells & Butler and KFC
What we achieved• Acquired Bela Ischia to extend our portfolio and geographical
presence in Brazil• Continued to roll-out Maguary Fruit Shoot in Brazil• Launched Fruit Shoot Hydro Sparkling in the United States
Strategy in actionsee pages 18-19
Strategy in actionsee pages 20-21
The future• Launch of two new Robinsons ranges, Fruit Creations
and Cordials to appeal to a broader range of consumers• Continue to focus on expanding our presence in growth
channels and categories• Launch innovation and nurture recent launches
The future• Deliver the synergies arising from the acquisition of Bela Ischia
in Brazil• Launch innovation and nurture recent launches• Extend our channel and category presence in Brazil• Ensure great in-store execution of Fruit Shoot in the United States
16 www.britvic.com
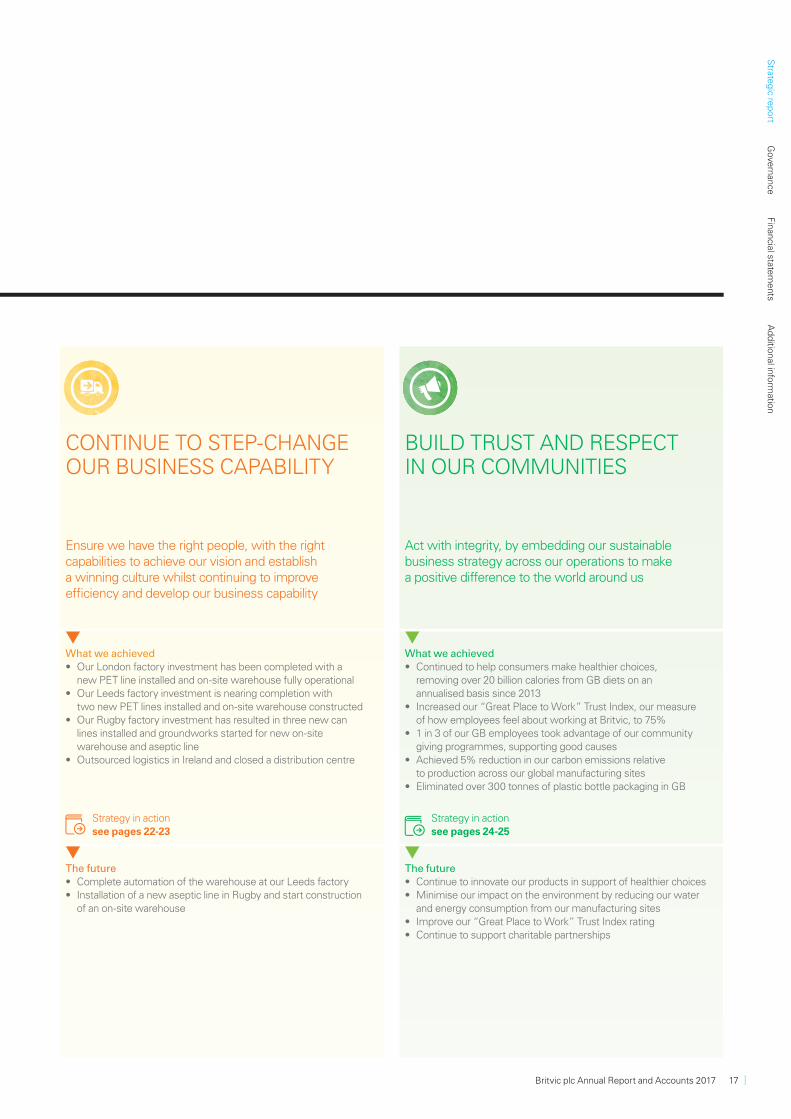
CONTINUE TO STEP-CHANGE OUR BUSINESS CAPABILITY
BUILD TRUST AND RESPECT IN OUR COMMUNITIES
Ensure we have the right people, with the right capabilities to achieve our vision and establish a winning culture whilst continuing to improve effi ciency and develop our business capability
Act with integrity, by embedding our sustainable business strategy across our operations to make a positive diff erence to the world around us
What we achieved• Our London factory investment has been completed with a
new PET line installed and on-site warehouse fully operational• Our Leeds factory investment is nearing completion with
two new PET lines installed and on-site warehouse constructed • Our Rugby factory investment has resulted in three new can
lines installed and groundworks started for new on-site warehouse and aseptic line
• Outsourced logistics in Ireland and closed a distribution centre
What we achieved• Continued to help consumers make healthier choices,
removing over 20 billion calories from GB diets on an annualised basis since 2013
• Increased our “Great Place to Work” Trust Index, our measure of how employees feel about working at Britvic, to 75%
• 1 in 3 of our GB employees took advantage of our community giving programmes, supporting good causes
• Achieved 5% reduction in our carbon emissions relative to production across our global manufacturing sites
• Eliminated over 300 tonnes of plastic bottle packaging in GB
Strategy in actionsee pages 22-23
Strategy in actionsee pages 24-25
The future• Complete automation of the warehouse at our Leeds factory• Installation of a new aseptic line in Rugby and start construction
of an on-site warehouse
The future• Continue to innovate our products in support of healthier choices• Minimise our impact on the environment by reducing our water
and energy consumption from our manufacturing sites• Improve our “Great Place to Work” Trust Index rating• Continue to support charitable partnerships
Britvic plc Annual Report and Accounts 2017 17
Strate
gic re
port
Gove
rnan
ceFin
ancial state
ments
Ad
ditio
nal info
rmatio
n

Purdey’sPurdey’s has performed well with consumers and increased its retail value by 55% this year. Purdey’s offers a healthier and more natural alternative to traditional energy drinks with no caffeine, taurine or added sugar
OUR STRATEGY IN ACTION:
GENERATE PROFITABLE GROWTH IN OUR CORE MARKETS
Increasing our participation in soft drink categories and sales channels
through innovation, disciplined revenue management, and
a balanced portfolio
18 www.britvic.com

4.6%revenue growth in core markets (GB, Ireland and France)
We have delivered revenue growth across our core markets in 2017
Simon LitherlandChief Executive Officer
Britvic plc Annual Report and Accounts 2017 19
Strate
gic re
port
Gove
rnan
ceFin
ancial state
ments
Ad
ditio
nal info
rmatio
n

OUR STRATEGY IN ACTION:
REALISE GLOBAL OPPORTUNITIES IN KIDS,
FAMILY AND ADULT CATEGORIES
Delivering on our strong growth potential in a number
of international markets, either by making selective acquisitions or by working with local partners
20 www.britvic.com
growth potential in a number of international markets, either
by making selective acquisitions oor by working with local partners
20 www.britvic.com
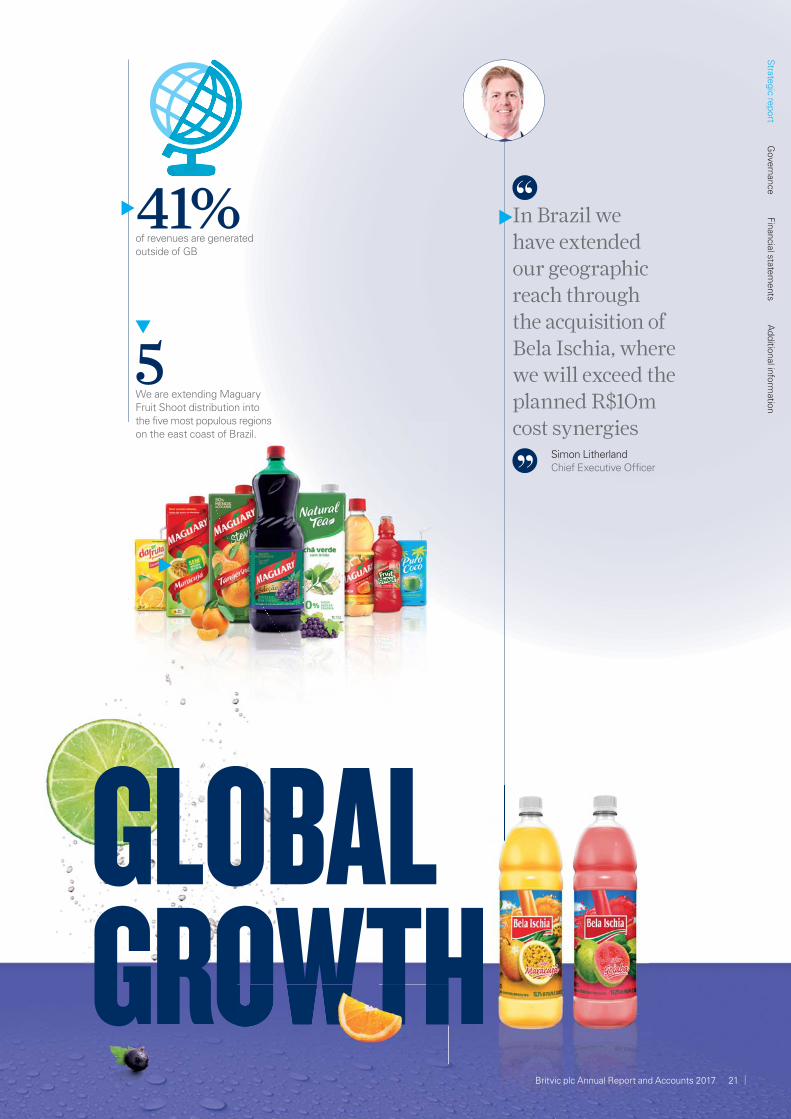
GLOBAL GROWTH
5We are extending Maguary Fruit Shoot distribution into the five most populous regions on the east coast of Brazil.
In Brazil we have extended our geographic reach through the acquisition of Bela Ischia, where we will exceed the planned R$10m cost synergies
Simon LitherlandChief Executive Officer
Britvic plc Annual Report and Accounts 2017 21
Strate
gic re
port
Gove
rnan
ceFin
ancial state
ments
Ad
ditio
nal info
rmatio
n
41%of revenues are generated outside of GB

OUR STRATEGY IN ACTION: £144m
We have invested net capital of £144m in our supply chain capability over the past two years
INVESTING IN THE FUTURE
22 www.britvic.com

We are now two years into the three-year business capability programme and this year we have a seen a significant amount of progress
Clive Hooper Chief Supply Chain Officer
J2OIn 2017, J2O and J2O Spritz underwent a rebrand, rolling out with a tasty new recipe and new packaging design to reflect a more modern and contemporary feel across the full range
CONTINUE TO STEP-CHANGE OUR
BUSINESS CAPABILITY
We ensure that we have the right people, with the right capabilities to achieve our vision and establish a winning culture whilst continuing
to invest in our supply chain, improve effi ciency and develop
our business capability
Britvic plc Annual Report and Accounts 2017 23
Strate
gic re
port
Gove
rnan
ceFin
ancial state
ments
Ad
ditio
nal info
rmatio
n

Making healthier 20bn over 20bn calories removed from GB diets on an annualised basis through reformulation since 2013
OUR STRATEGY IN ACTION:
Squash’d With 0% sugar and no artificial flavours and preservatives, it provides a healthier choice on the go. Robinsons Squash’d achieved £11m in the first full year of sales, making it one of the top soft drinks launches of 2015/2016
300tnsof plastic bottle packaging in GB eliminated through moving to new bottling lines
24 www.britvic.com
over 20bn calories removed from GB diets on an annualised basis through reformulation since 2013
22424242424242442224244 wwwwwwwwwwwwwwwwwwwwwwwwwwwwwwwwwwwwwwwwwwwwwwww ...br.b.brbbrbrbrbrbrbrbrbr.bbrbrbrbriitiitttvtvtvtvtvtvtvititttvtvtvtvviitttttvvittttvititittttvvittttttvititttitttttvtttttttttttvvvtttttttvvttttvvviciccc.cic.ic.iciciciiiic comcomcomcomcommmcommcommmcommmmo

choices
1 in 3 GB employees took advantage of our community support programmes
5% reduction in our carbon emissions relative to production across our global manufacturing sites
This year we have taken the opportunity to review our sustainable business programme to ensure that it is focused on the issues that matter most to our business and to our stakeholders. The result of this is a programme which focuses on three key areas where we believe we can make a real diff erence – Healthier People; Healthier Communities; and Healthier Planet
Matt BarwellChief Marketing Officer
£4mretail sales value of Robinsons Refresh’d since launching in April 2017
BUILD TRUST AND RESPECT IN OUR COMMUNITIES
We have been bringing joy to millions of everyday moments for over a century through our much-loved brands and we are committed to continuing to earn the trust and respect of our communities by making a positive difference to the world
around us through our sustainable business programme
Britvic plc Annual Report and Accounts 2017 25
Strate
gic re
port
Gove
rnan
ceFin
ancial state
ments
Ad
ditio
nal info
rmatio
n
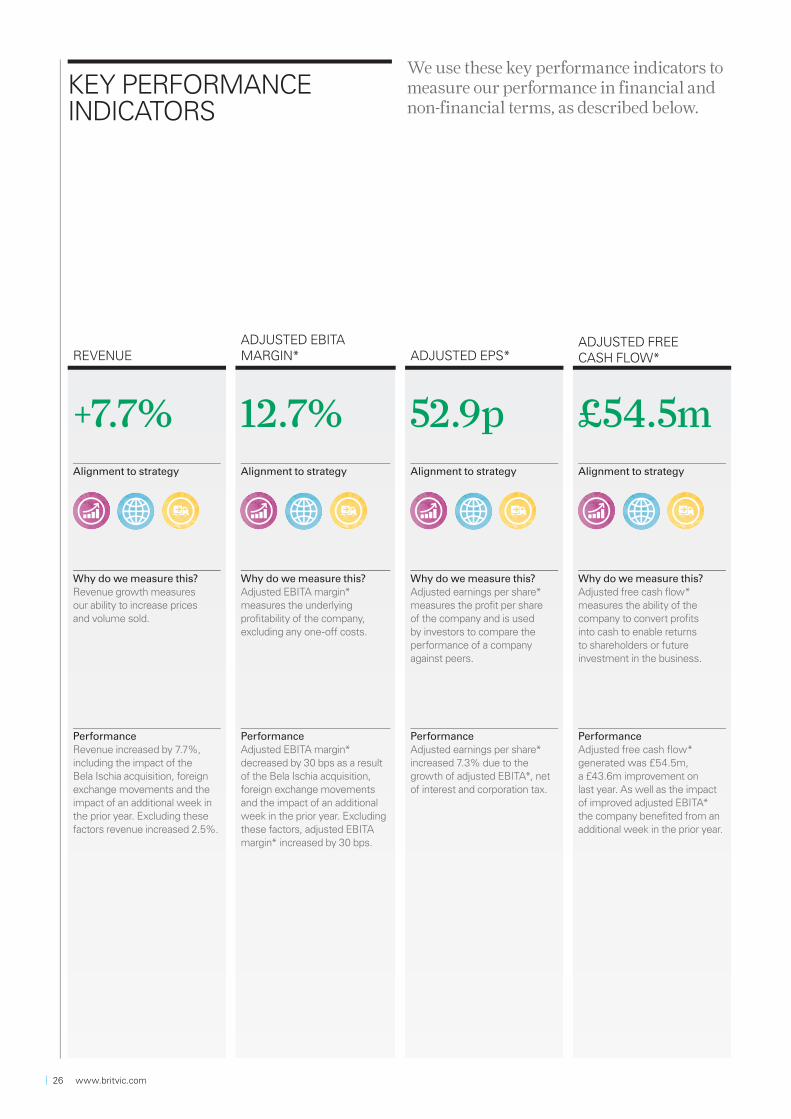
REVENUEADJUSTED EBITA MARGIN* ADJUSTED EPS*
ADJUSTED FREECASH FLOW*
+7.7% 12.7% 52.9p £54.5mAlignment to strategy Alignment to strategy Alignment to strategy Alignment to strategy
Why do we measure this?Revenue growth measures our ability to increase prices and volume sold.
Why do we measure this?Adjusted EBITA margin* measures the underlying profitability of the company, excluding any one-off costs.
Why do we measure this?Adjusted earnings per share* measures the profit per share of the company and is used by investors to compare the performance of a company against peers.
Why do we measure this?Adjusted free cash flow* measures the ability of the company to convert profits into cash to enable returns to shareholders or future investment in the business.
PerformanceRevenue increased by 7.7%, including the impact of the Bela Ischia acquisition, foreign exchange movements and the impact of an additional week in the prior year. Excluding these factors revenue increased 2.5%.
PerformanceAdjusted EBITA margin* decreased by 30 bps as a result of the Bela Ischia acquisition, foreign exchange movements and the impact of an additional week in the prior year. Excluding these factors, adjusted EBITA margin* increased by 30 bps.
PerformanceAdjusted earnings per share* increased 7.3% due to the growth of adjusted EBITA*, net of interest and corporation tax.
PerformanceAdjusted free cash flow* generated was £54.5m, a £43.6m improvement on last year. As well as the impact of improved adjusted EBITA* the company benefited from an additional week in the prior year.
KEY PERFORMANCE INDICATORS
We use these key performance indicators to measure our performance in financial and non-financial terms, as described below.
26 www.britvic.com
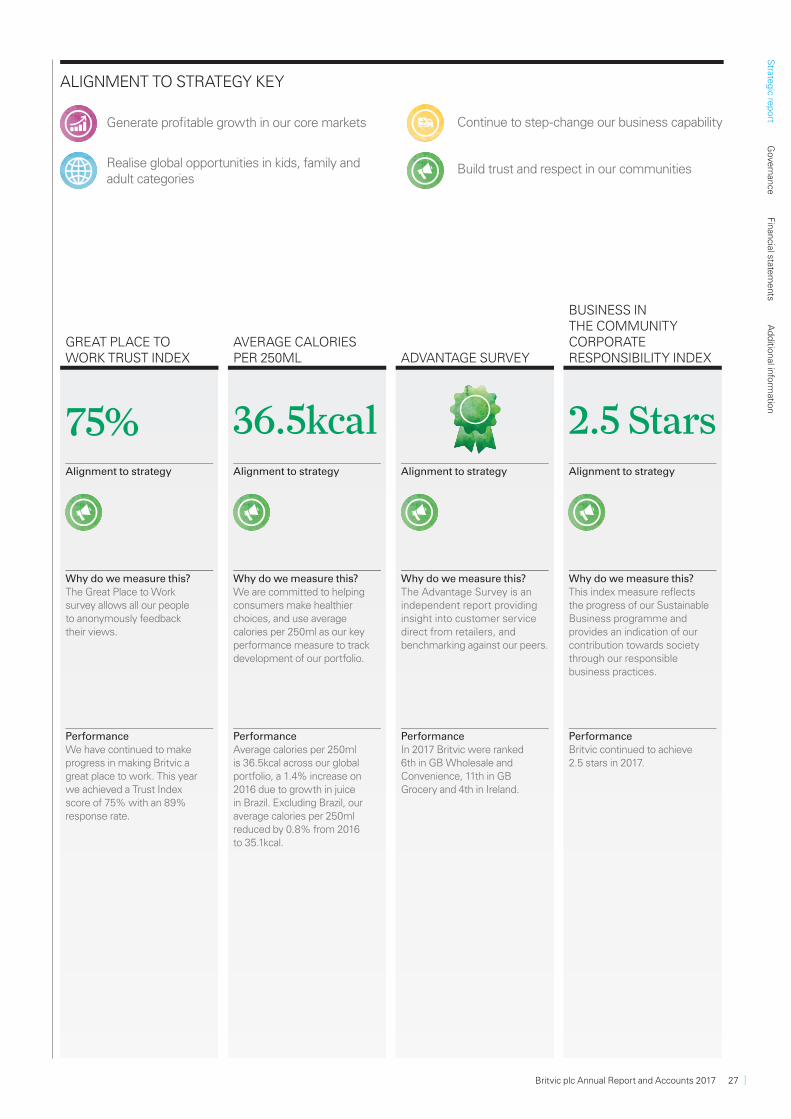
GREAT PLACE TO WORK TRUST INDEX
AVERAGE CALORIES PER 250ML ADVANTAGE SURVEY
BUSINESS IN THE COMMUNITY CORPORATE RESPONSIBILITY INDEX
75% 36.5kcal 2.5 StarsAlignment to strategy Alignment to strategy Alignment to strategy Alignment to strategy
Why do we measure this?The Great Place to Work survey allows all our people to anonymously feedback their views.
Why do we measure this?We are committed to helping consumers make healthier choices, and use average calories per 250ml as our key performance measure to track development of our portfolio.
Why do we measure this?The Advantage Survey is an independent report providing insight into customer service direct from retailers, and benchmarking against our peers.
Why do we measure this?This index measure reflects the progress of our Sustainable Business programme and provides an indication of our contribution towards society through our responsible business practices.
PerformanceWe have continued to make progress in making Britvic a great place to work. This year we achieved a Trust Index score of 75% with an 89% response rate.
PerformanceAverage calories per 250ml is 36.5kcal across our global portfolio, a 1.4% increase on 2016 due to growth in juice in Brazil. Excluding Brazil, our average calories per 250ml reduced by 0.8% from 2016 to 35.1kcal.
PerformanceIn 2017 Britvic were ranked 6th in GB Wholesale and Convenience, 11th in GB Grocery and 4th in Ireland.
PerformanceBritvic continued to achieve 2.5 stars in 2017.
ALIGNMENT TO STRATEGY KEY
Generate profi table growth in our core markets
Realise global opportunities in kids, family and adult categories
Continue to step-change our business capability
Build trust and respect in our communities
Britvic plc Annual Report and Accounts 2017 27
Strate
gic re
port
Gove
rnan
ceFin
ancial state
ments
Ad
ditio
nal info
rmatio
n
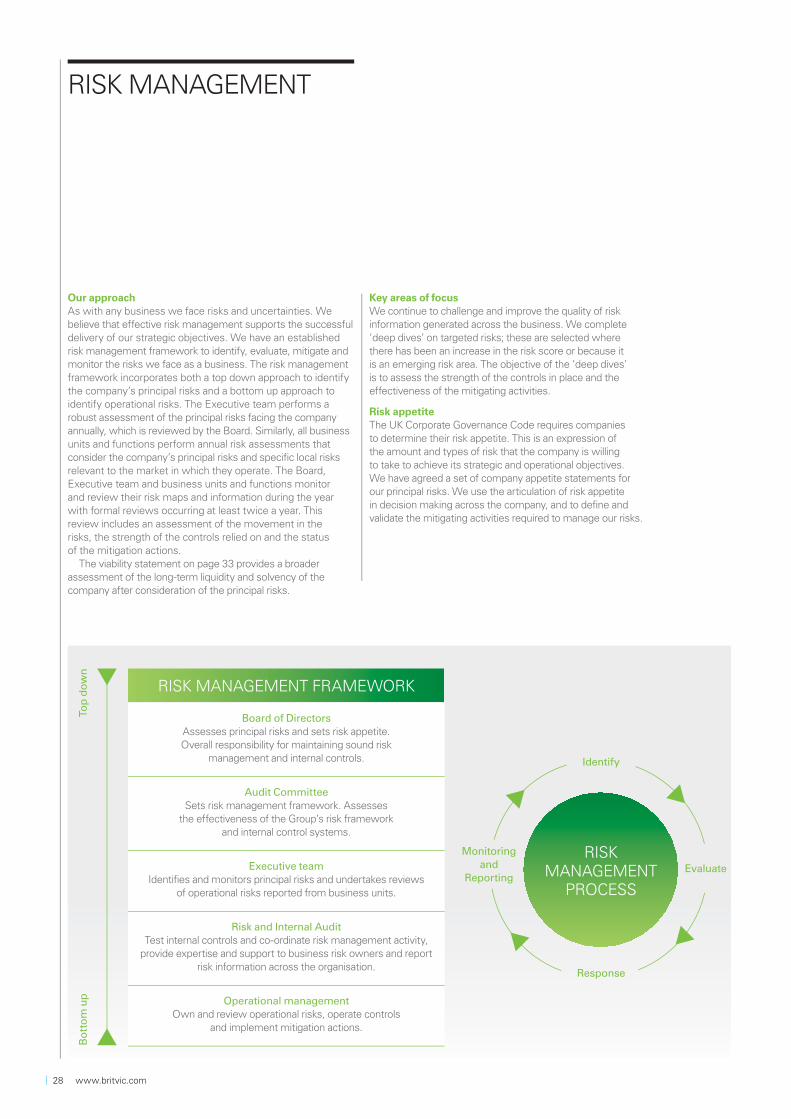
RISK MANAGEMENT
Our approachAs with any business we face risks and uncertainties. We believe that effective risk management supports the successful delivery of our strategic objectives. We have an established risk management framework to identify, evaluate, mitigate and monitor the risks we face as a business. The risk management framework incorporates both a top down approach to identify the company’s principal risks and a bottom up approach to identify operational risks. The Executive team performs a robust assessment of the principal risks facing the company annually, which is reviewed by the Board. Similarly, all business units and functions perform annual risk assessments that consider the company’s principal risks and specific local risks relevant to the market in which they operate. The Board, Executive team and business units and functions monitor and review their risk maps and information during the year with formal reviews occurring at least twice a year. This review includes an assessment of the movement in the risks, the strength of the controls relied on and the status of the mitigation actions.
The viability statement on page 33 provides a broader assessment of the long-term liquidity and solvency of the company after consideration of the principal risks.
Key areas of focusWe continue to challenge and improve the quality of risk information generated across the business. We complete ‘deep dives’ on targeted risks; these are selected where there has been an increase in the risk score or because it is an emerging risk area. The objective of the ‘deep dives’ is to assess the strength of the controls in place and the effectiveness of the mitigating activities.
Risk appetiteThe UK Corporate Governance Code requires companies to determine their risk appetite. This is an expression of the amount and types of risk that the company is willing to take to achieve its strategic and operational objectives. We have agreed a set of company appetite statements for our principal risks. We use the articulation of risk appetite in decision making across the company, and to define and validate the mitigating activities required to manage our risks.
RISK MANAGEMENT FRAMEWORK
Board of DirectorsAssesses principal risks and sets risk appetite. Overall responsibility for maintaining sound risk
management and internal controls.
Audit CommitteeSets risk management framework. Assesses
the effectiveness of the Group’s risk framework and internal control systems.
Executive teamIdentifies and monitors principal risks and undertakes reviews
of operational risks reported from business units.
Risk and Internal AuditTest internal controls and co-ordinate risk management activity,
provide expertise and support to business risk owners and report risk information across the organisation.
Operational managementOwn and review operational risks, operate controls
and implement mitigation actions.
Response
RISKMANAGEMENT
PROCESS
Top
do
wn
Bo
tto
m u
p
Monitoring and
ReportingEvaluate
Identify
28 www.britvic.com
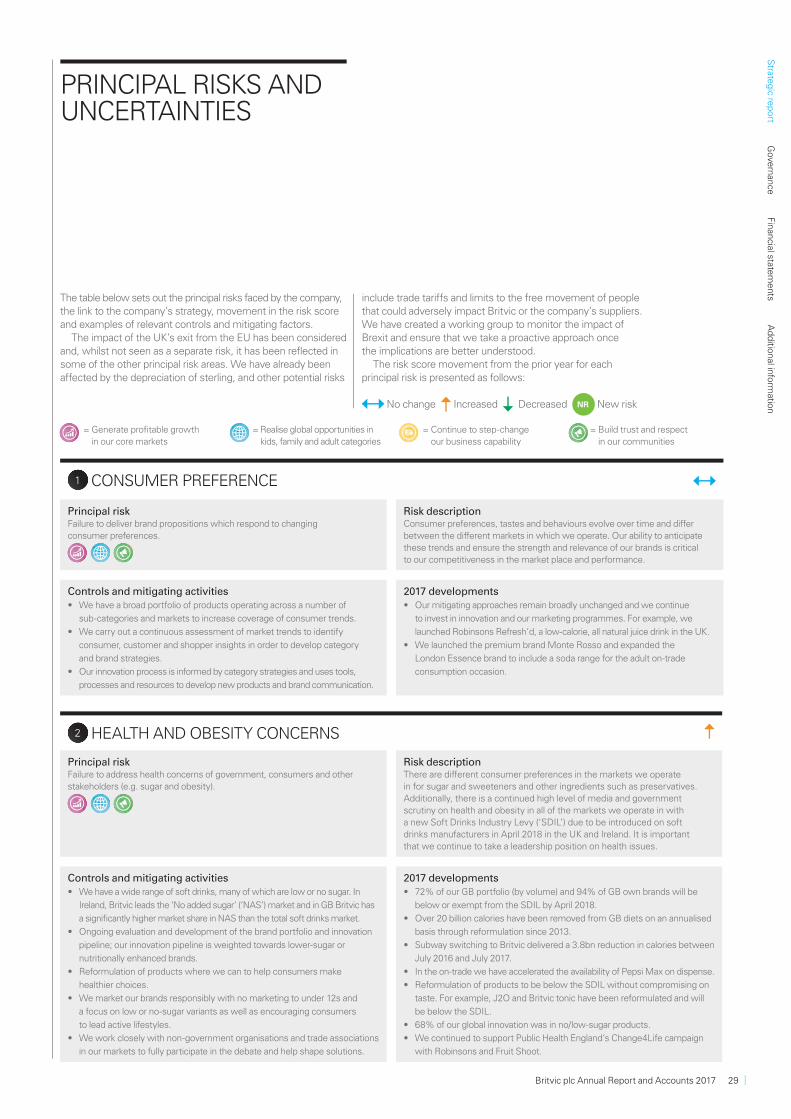
PRINCIPAL RISKS AND UNCERTAINTIES
1 CONSUMER PREFERENCE
Principal riskFailure to deliver brand propositions which respond to changing consumer preferences.
Risk descriptionConsumer preferences, tastes and behaviours evolve over time and diff er between the diff erent markets in which we operate. Our ability to anticipate these trends and ensure the strength and relevance of our brands is critical to our competitiveness in the market place and performance.
Controls and mitigating activities• We have a broad portfolio of products operating across a number of
sub-categories and markets to increase coverage of consumer trends.
• We carry out a continuous assessment of market trends to identify
consumer, customer and shopper insights in order to develop category
and brand strategies.
• Our innovation process is informed by category strategies and uses tools,
processes and resources to develop new products and brand communication.
2017 developments• Our mitigating approaches remain broadly unchanged and we continue
to invest in innovation and our marketing programmes. For example, we
launched Robinsons Refresh’d, a low-calorie, all natural juice drink in the UK.
• We launched the premium brand Monte Rosso and expanded the
London Essence brand to include a soda range for the adult on-trade
consumption occasion.
2 HEALTH AND OBESITY CONCERNS
Principal riskFailure to address health concerns of government, consumers and other stakeholders (e.g. sugar and obesity).
Risk descriptionThere are diff erent consumer preferences in the markets we operate in for sugar and sweeteners and other ingredients such as preservatives. Additionally, there is a continued high level of media and government scrutiny on health and obesity in all of the markets we operate in with a new Soft Drinks Industry Levy (‘SDIL’) due to be introduced on soft drinks manufacturers in April 2018 in the UK and Ireland. It is important that we continue to take a leadership position on health issues.
Controls and mitigating activities• We have a wide range of soft drinks, many of which are low or no sugar. In
Ireland, Britvic leads the ‘No added sugar’ (‘NAS’) market and in GB Britvic has
a signifi cantly higher market share in NAS than the total soft drinks market.
• Ongoing evaluation and development of the brand portfolio and innovation
pipeline; our innovation pipeline is weighted towards lower-sugar or
nutritionally enhanced brands.
• Reformulation of products where we can to help consumers make
healthier choices.
• We market our brands responsibly with no marketing to under 12s and
a focus on low or no-sugar variants as well as encouraging consumers
to lead active lifestyles.
• We work closely with non-government organisations and trade associations
in our markets to fully participate in the debate and help shape solutions.
2017 developments• 72% of our GB portfolio (by volume) and 94% of GB own brands will be
below or exempt from the SDIL by April 2018.
• Over 20 billion calories have been removed from GB diets on an annualised
basis through reformulation since 2013.
• Subway switching to Britvic delivered a 3.8bn reduction in calories between
July 2016 and July 2017.
• In the on-trade we have accelerated the availability of Pepsi Max on dispense.
• Reformulation of products to be below the SDIL without compromising on
taste. For example, J2O and Britvic tonic have been reformulated and will
be below the SDIL.
• 68% of our global innovation was in no/low-sugar products.
• We continued to support Public Health England’s Change4Life campaign
with Robinsons and Fruit Shoot.
The table below sets out the principal risks faced by the company, the link to the company’s strategy, movement in the risk score and examples of relevant controls and mitigating factors.
The impact of the UK’s exit from the EU has been considered and, whilst not seen as a separate risk, it has been reflected in some of the other principal risk areas. We have already been affected by the depreciation of sterling, and other potential risks
include trade tariffs and limits to the free movement of people that could adversely impact Britvic or the company’s suppliers. We have created a working group to monitor the impact of Brexit and ensure that we take a proactive approach once the implications are better understood.
The risk score movement from the prior year for each principal risk is presented as follows:
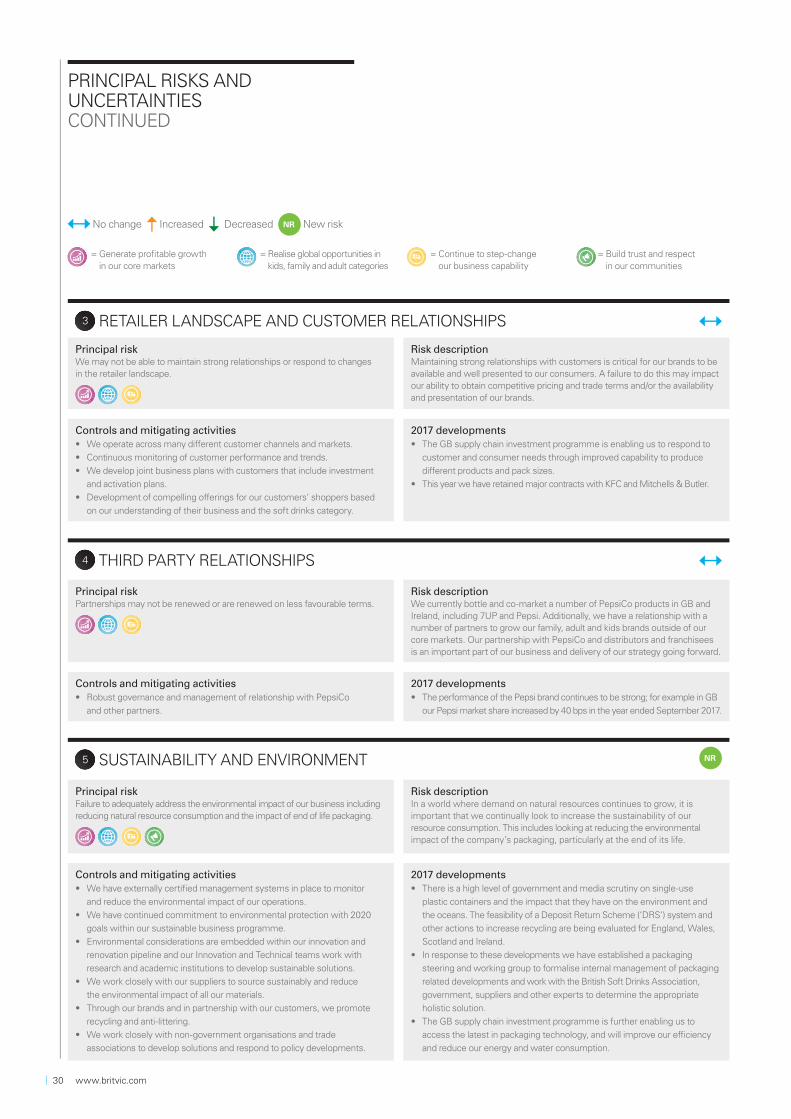
No change Increased Decreased NR New risk
= Generate profi table growth
in our core markets = Realise global opportunities in
kids, family and adult categories = Continue to step-change
our business capability = Build trust and respect
in our communities
Britvic plc Annual Report and Accounts 2017 29
Strate
gic re
port
Gove
rnan
ceFin
ancial state
ments
Ad
ditio
nal info
rmatio
n
PRINCIPAL RISKS AND UNCERTAINTIESCONTINUED
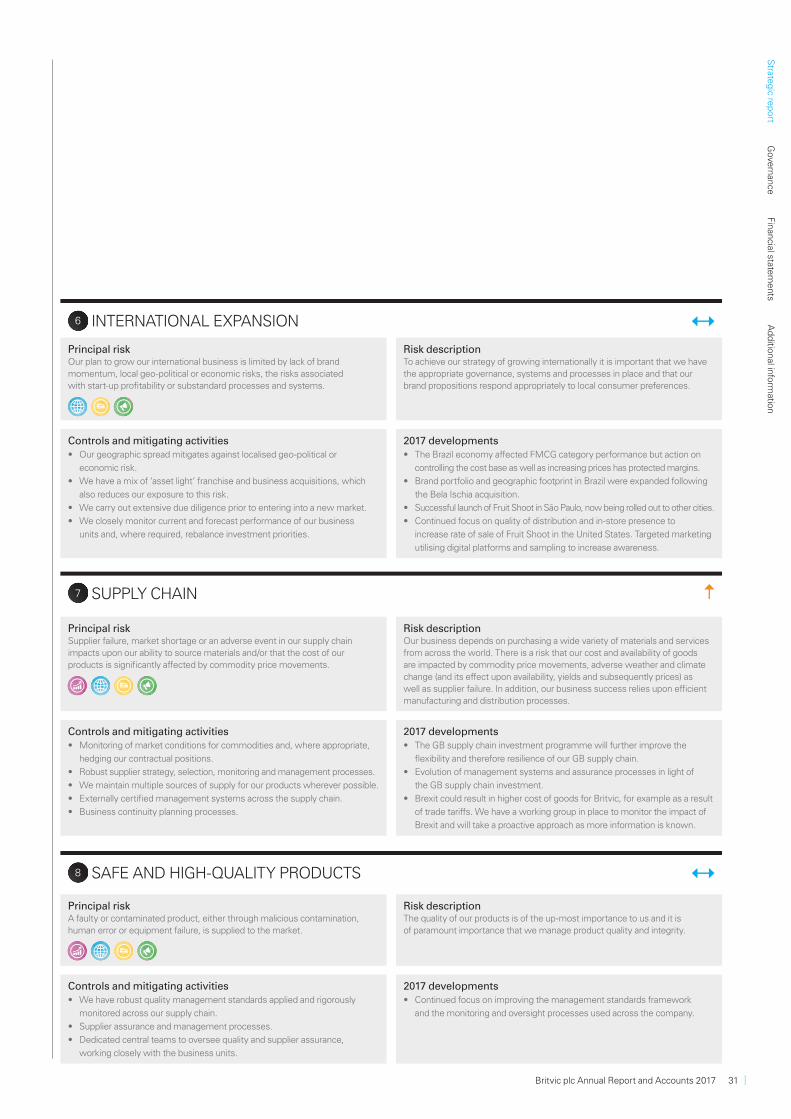
3 RETAILER LANDSCAPE AND CUSTOMER RELATIONSHIPS
Principal riskWe may not be able to maintain strong relationships or respond to changes in the retailer landscape.
Risk descriptionMaintaining strong relationships with customers is critical for our brands to be available and well presented to our consumers. A failure to do this may impact our ability to obtain competitive pricing and trade terms and/or the availability and presentation of our brands.
Controls and mitigating activities• We operate across many diff erent customer channels and markets.
• Continuous monitoring of customer performance and trends.
• We develop joint business plans with customers that include investment
and activation plans.
• Development of compelling off erings for our customers’ shoppers based
on our understanding of their business and the soft drinks category.
2017 developments• The GB supply chain investment programme is enabling us to respond to
customer and consumer needs through improved capability to produce
diff erent products and pack sizes.
• This year we have retained major contracts with KFC and Mitchells & Butler.
4 THIRD PARTY RELATIONSHIPS
Principal riskPartnerships may not be renewed or are renewed on less favourable terms.
Risk descriptionWe currently bottle and co-market a number of PepsiCo products in GB and Ireland, including 7UP and Pepsi. Additionally, we have a relationship with a number of partners to grow our family, adult and kids brands outside of our core markets. Our partnership with PepsiCo and distributors and franchisees is an important part of our business and delivery of our strategy going forward.
Controls and mitigating activities• Robust governance and management of relationship with PepsiCo
and other partners.
2017 developments• The performance of the Pepsi brand continues to be strong; for example in GB
our Pepsi market share increased by 40 bps in the year ended September 2017.
5 SUSTAINABILITY AND ENVIRONMENT NR
Principal riskFailure to adequately address the environmental impact of our business including reducing natural resource consumption and the impact of end of life packaging.
Risk descriptionIn a world where demand on natural resources continues to grow, it is important that we continually look to increase the sustainability of our resource consumption. This includes looking at reducing the environmental impact of the company’s packaging, particularly at the end of its life.
Controls and mitigating activities• We have externally certifi ed management systems in place to monitor
and reduce the environmental impact of our operations.
• We have continued commitment to environmental protection with 2020
goals within our sustainable business programme.
• Environmental considerations are embedded within our innovation and
renovation pipeline and our Innovation and Technical teams work with
research and academic institutions to develop sustainable solutions.
• We work closely with our suppliers to source sustainably and reduce
the environmental impact of all our materials.
• Through our brands and in partnership with our customers, we promote
recycling and anti-littering.
• We work closely with non-government organisations and trade
associations to develop solutions and respond to policy developments.
2017 developments• There is a high level of government and media scrutiny on single-use
plastic containers and the impact that they have on the environment and
the oceans. The feasibility of a Deposit Return Scheme (‘DRS’) system and
other actions to increase recycling are being evaluated for England, Wales,
Scotland and Ireland.
• In response to these developments we have established a packaging
steering and working group to formalise internal management of packaging
related developments and work with the British Soft Drinks Association,
government, suppliers and other experts to determine the appropriate
holistic solution.
• The GB supply chain investment programme is further enabling us to
access the latest in packaging technology, and will improve our effi ciency
and reduce our energy and water consumption.
No change Increased Decreased NR New risk
= Generate profi table growth in our core markets
= Realise global opportunities in kids, family and adult categories
= Continue to step-change our business capability
= Build trust and respect in our communities
30 www.britvic.com
6 INTERNATIONAL EXPANSION
Principal riskOur plan to grow our international business is limited by lack of brand momentum, local geo-political or economic risks, the risks associated with start-up profi tability or substandard processes and systems.
Risk descriptionTo achieve our strategy of growing internationally it is important that we have the appropriate governance, systems and processes in place and that our brand propositions respond appropriately to local consumer preferences.
Controls and mitigating activities• Our geographic spread mitigates against localised geo-political or
economic risk.
• We have a mix of ‘asset light’ franchise and business acquisitions, which
also reduces our exposure to this risk.
• We carry out extensive due diligence prior to entering into a new market.
• We closely monitor current and forecast performance of our business
units and, where required, rebalance investment priorities.
2017 developments• The Brazil economy aff ected FMCG category performance but action on
controlling the cost base as well as increasing prices has protected margins.
• Brand portfolio and geographic footprint in Brazil were expanded following
the Bela Ischia acquisition.
• Successful launch of Fruit Shoot in São Paulo, now being rolled out to other cities.
• Continued focus on quality of distribution and in-store presence to
increase rate of sale of Fruit Shoot in the United States. Targeted marketing
utilising digital platforms and sampling to increase awareness.
7 SUPPLY CHAIN
Principal riskSupplier failure, market shortage or an adverse event in our supply chain impacts upon our ability to source materials and/or that the cost of our products is signifi cantly aff ected by commodity price movements.
Risk descriptionOur business depends on purchasing a wide variety of materials and services from across the world. There is a risk that our cost and availability of goods are impacted by commodity price movements, adverse weather and climate change (and its eff ect upon availability, yields and subsequently prices) as well as supplier failure. In addition, our business success relies upon effi cient manufacturing and distribution processes.
Controls and mitigating activities• Monitoring of market conditions for commodities and, where appropriate,
hedging our contractual positions.
• Robust supplier strategy, selection, monitoring and management processes.
• We maintain multiple sources of supply for our products wherever possible.
• Externally certifi ed management systems across the supply chain.
• Business continuity planning processes.
2017 developments• The GB supply chain investment programme will further improve the
fl exibility and therefore resilience of our GB supply chain.
• Evolution of management systems and assurance processes in light of
the GB supply chain investment.
• Brexit could result in higher cost of goods for Britvic, for example as a result
of trade tariff s. We have a working group in place to monitor the impact of
Brexit and will take a proactive approach as more information is known.
8 SAFE AND HIGH-QUALITY PRODUCTS
Principal riskA faulty or contaminated product, either through malicious contamination, human error or equipment failure, is supplied to the market.
Risk descriptionThe quality of our products is of the up-most importance to us and it is of paramount importance that we manage product quality and integrity.
Controls and mitigating activities• We have robust quality management standards applied and rigorously
monitored across our supply chain.
• Supplier assurance and management processes.
• Dedicated central teams to oversee quality and supplier assurance,
working closely with the business units.
2017 developments• Continued focus on improving the management standards framework
and the monitoring and oversight processes used across the company.
Britvic plc Annual Report and Accounts 2017 31
Strate
gic re
port
Gove
rnan
ceFin
ancial state
ments
Ad
ditio
nal info
rmatio
n

9 LEGAL AND REGULATORY
Principal riskNon-compliance with local laws or regulations or breach of our internal policies and standards.
Risk descriptionBritvic is subject to a wide range of legislation, regulation, guidance and codes of practice in areas such as composition, labelling, packaging, marketing claims, advertising, safety, environment, competition, tax and employee health and safety. Failure to comply with such requirements could have a signifi cant impact on our reputation and incur fi nancial penalties.
Controls and mitigating activities• Britvic code of conduct and our key company policies embedded and rolled
out to employees.
• Monitoring processes to ensure compliance with our Group policies and all
relevant legislation and regulations.
• We work closely with our external advisors and the regulators, government
bodies and trade associations regarding current and future legislation which
would impact upon the business.
• Whistle blowing processes in place.
2017 developments• Continue to monitor changes in law and regulation and compliance with
company policies.
10 TECHNOLOGY AND INFORMATION SECURITY
Principal riskWe experience a major failure of IT infrastructure or breach in system or information security.
Risk descriptionWe interact electronically with customers, suppliers and consumers and our supply chain operations are dependent on reliable IT systems and infrastructure. Disruption to our IT systems could have a signifi cant impact on our sales, cash fl ows and profi ts. Additionally, and in common with many businesses, cyber security breaches could lead to unauthorised access to, or loss of, sensitive information.
Controls and mitigating activities• Disaster recovery plans tested every year.
• Central governance and decision-making processes for system changes.
• Information and IT policies in place. IT security standards are closely
monitored to protect systems and information.
• Incident response plans in place, recognising that whilst this risk can be
managed it cannot be eliminated.
2017 developments• In 2016/17 a number of major organisations were subject to ransom cyber
incidents. Britvic was unimpacted by these attacks.
• We have increased investment to improve information security processes
and cyber risk awareness.
11 TREASURY AND PENSION
Principal riskChanges to exchange rates and interest rates can have an impact on profi ts and cash fl ows.
Risk descriptionBritvic is exposed to a variety of external fi nancial risks relating to treasury and pension. Changes to exchange rates and interest rates can have an impact on business results and the cost of interest on our debt. Additionally, the GB and Ireland businesses have defi ned benefi t pension plans which, whilst closed to new employees and future accruals, are exposed to movements in interest rates, values of assets and increased life expectancy.
Controls and mitigating activities• Robust monitoring of exchange rates and interest rates.
• Active risk management and hedging strategies in place to manage
exchange and interest fl uctuations.
• Pricing strategy and execution processes.
• Monitoring of investment and funding strategies for the pension fund.
2017 developments• The recent depreciation of sterling has led to higher input costs across
a number of our key commodities. However, we are taking action through
procurement initiatives to reduce some of this impact.
• The tri-annual valuation of the GB defi ned benefi t pension scheme was
completed in 2017.
PRINCIPAL RISKS AND UNCERTAINTIESCONTINUED
No change Increased Decreased NR New risk
= Generate profi table growth in our core markets
= Realise global opportunities in kids, family and adult categories
= Continue to step-change our business capability
= Build trust and respect in our communities
32 www.britvic.com
VIABILITY STATEMENT
AssessmentDuring the year, the Directors assessed the viability of the company, taking into account the company’s current financial position and the principal risks, particularly those that could threaten the business model. These risks and the actions being taken to manage or mitigate them are set out on pages 29-32. The Directors have determined that a three year period is an appropriate timeframe for the assessment given the dynamic nature of the FMCG sector and this is in line with the company’s strategic planning period. The starting point for the viability assessment is the strategic and financial plan, which makes assumptions relating to the economic climate in each of our markets, the growth of the soft drinks category, input cost inflation and growth from the company’s value drivers. The process for assessing the viability of the company involved input from a number of functions across the business to model a series of theoretical ‘stress test’ scenarios based on the materialisation of principal risks:
• Firstly, the Directors considered the impact of severe but plausible scenarios for each principal risk. For example, the trend towards health and the introduction of the Soft Drinks Industry Levy in the UK and Ireland results in a reduction in the soft drinks category size, further depreciation of sterling increases the cost of Britvic’s goods, or a major IT breach results in an outage in key systems, resulting in the temporary inability to selling goods.
• Secondly, the Directors assessed diff erent scenarios that group together principal risks. As part of this the Directors considered the interconnectivity between principal risks but also scenarios where unconnected risks occur at the same time. The stress test scenarios were reviewed against the company’s current and projected debt and liquidity position.
• Finally, a reverse stress test was performed which allowed the Directors to assess the circumstances that would render the business model unviable. To support the fi nal conclusion on viability, the assessment also took into account the mitigations available to the company to protect against these downside scenarios.
Based on the results of this analysis, the Directors have a reasonable expectation that the company will be able to continue in operation and meet its liabilities as they fall due over the three year period to September 2020.
Britvic plc Annual Report and Accounts 2017 33
Strate
gic re
port
Gove
rnan
ceFin
ancial state
ments
Ad
ditio
nal info
rmatio
n
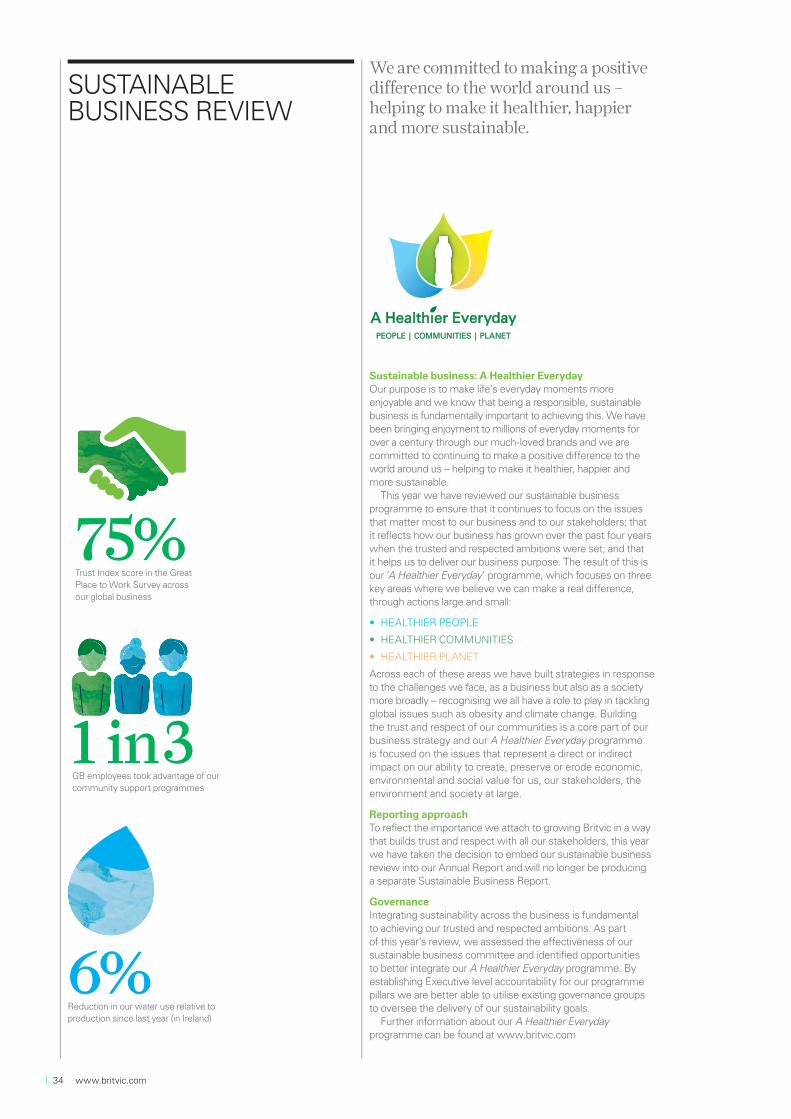
SUSTAINABLE BUSINESS REVIEW
We are committed to making a positive difference to the world around us – helping to make it healthier, happier and more sustainable.
Sustainable business: A Healthier EverydayOur purpose is to make life’s everyday moments more enjoyable and we know that being a responsible, sustainable business is fundamentally important to achieving this. We have been bringing enjoyment to millions of everyday moments for over a century through our much-loved brands and we are committed to continuing to make a positive difference to the world around us – helping to make it healthier, happier and more sustainable.
This year we have reviewed our sustainable business programme to ensure that it continues to focus on the issues that matter most to our business and to our stakeholders; that it reflects how our business has grown over the past four years when the trusted and respected ambitions were set; and that it helps us to deliver our business purpose. The result of this is our ‘A Healthier Everyday’ programme, which focuses on three key areas where we believe we can make a real difference, through actions larg e and small:
• HEALTHIER PEOPLE
• HEALTHIER COMMUNITIES
• HEALTHIER PLANET
Across each of these areas we have built strategies in response to the challenges we face, as a business but also as a society more broadly – recognising we all have a role to play in tackling global issues such as obesity and climate change. Building the trust and respect of our communities is a core part of our business strategy and our A Healthier Everyday programme is focused on the issues that represent a direct or indirect impact on our ability to create, preserve or erode economic, environmental and social value for us, our stakeholders, the environment and society at large.
Reporting approachTo reflect the importance we attach to growing Britvic in a way that builds trust and respect with all our stakeholders, this year we have taken the decision to embed our sustainable business review into our Annual Report and will no longer be producing a separate Sustainable Business Report.
GovernanceIntegrating sustainability across the business is fundamental to achieving our trusted and respected ambitions. As part of this year’s review, we assessed the effectiveness of our sustainable business committee and identified opportunities to better integrate our A Healthier Everyday programme. By establishing Executive level accountability for our programme pillars we are better able to utilise existing governance groups to oversee the delivery of our sustainability goals.
Further information about our A Healthier Everyday programme can be found at www.britvic.com
75%Trust Index score in the Great Place to Work Survey across our global business
6%Reduction in our water use relative to production since last year (in Ireland)
1 in 3GB employees took advantage of our community support programmes
34 www.britvic.com
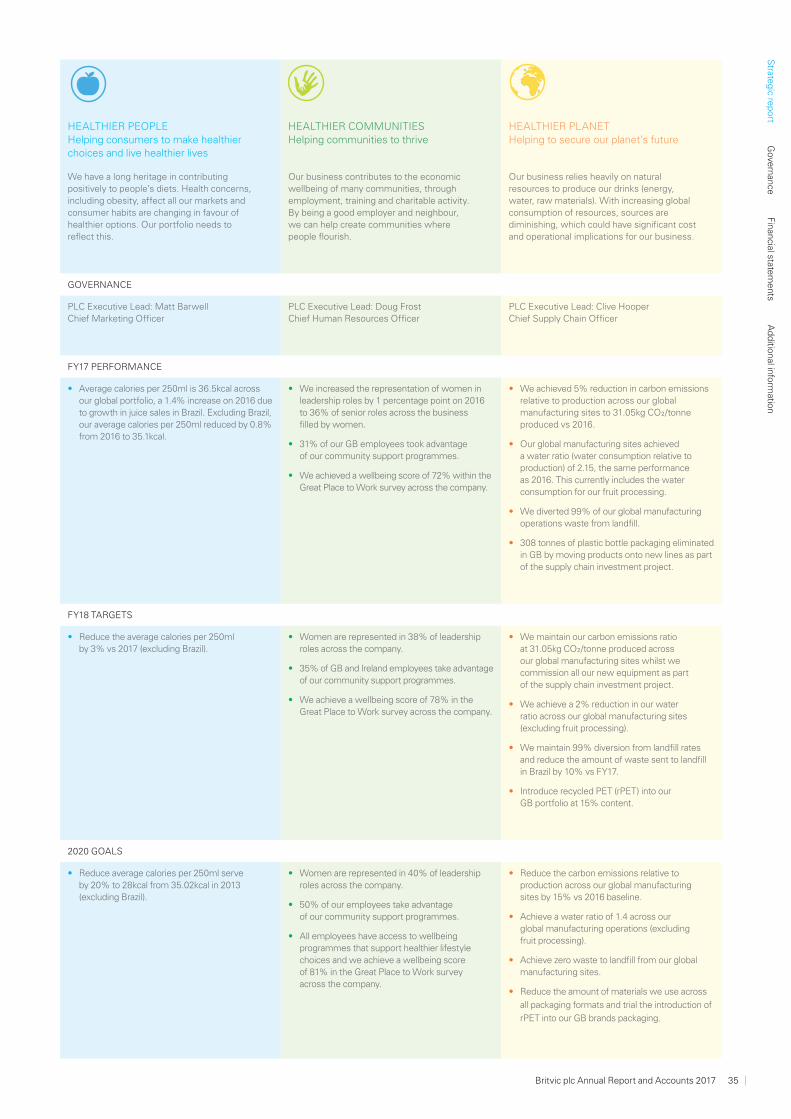
HEALTHIER PEOPLEHelping consumers to make healthier choices and live healthier lives
We have a long heritage in contributing positively to people’s diets. Health concerns, including obesity, affect all our markets and consumer habits are changing in favour of healthier options. Our portfolio needs to reflect this.
HEALTHIER COMMUNITIESHelping communities to thrive
Our business contributes to the economic wellbeing of many communities, through employment, training and charitable activity.By being a good employer and neighbour, we can help create communities where people flourish.
HEALTHIER PLANETHelping to secure our planet’s future
Our business relies heavily on natural resources to produce our drinks (energy, water, raw materials). With increasing global consumption of resources, sources are diminishing, which could have significant cost and operational implications for our business.
GOVERNANCE
PLC Executive Lead: Matt BarwellChief Marketing Officer
PLC Executive Lead: Doug FrostChief Human Resources Officer
PLC Executive Lead: Clive HooperChief Supply Chain Officer
FY17 PERFORMANCE
• Average calories per 250ml is 36.5kcal across our global portfolio, a 1.4% increase on 2016 due to growth in juice sales in Brazil. Excluding Brazil, our average calories per 250ml reduced by 0.8% from 2016 to 35.1kcal.
• We increased the representation of women in leadership roles by 1 percentage point on 2016 to 36% of senior roles across the business fi lled by women.
• 31% of our GB employees took advantage of our community support programmes.
• We achieved a wellbeing score of 72% within the Great Place to Work survey across the company.
• We achieved 5% reduction in carbon emissions relative to production across our global manufacturing sites to 31.05kg CO2/tonne produced vs 2016.
• Our global manufacturing sites achieved a water ratio (water consumption relative to production) of 2.15, the same performance as 2016. This currently includes the water consumption for our fruit processing.
• We diverted 99% of our global manufacturing operations waste from landfi ll.
• 308 tonnes of plastic bottle packaging eliminated in GB by moving products onto new lines as part of the supply chain investment project.
FY18 TARGETS
• Reduce the average calories per 250ml by 3% vs 2017 (excluding Brazil).
• Women are represented in 38% of leadership roles across the company.
• 35% of GB and Ireland employees take advantage of our community support programmes.
• We achieve a wellbeing score of 78% in the Great Place to Work survey across the company.
• We maintain our carbon emissions ratio at 31.05kg CO2/tonne produced across our global manufacturing sites whilst we commission all our new equipment as part of the supply chain investment project.
• We achieve a 2% reduction in our water ratio across our global manufacturing sites (excluding fruit processing).
• We maintain 99% diversion from landfi ll rates and reduce the amount of waste sent to landfi ll in Brazil by 10% vs FY17.
• Introduce recycled PET (rPET) into our GB portfolio at 15% content.
2020 GOALS
• Reduce average calories per 250ml serve by 20% to 28kcal from 35.02kcal in 2013 (excluding Brazil).
• Women are represented in 40% of leadership roles across the company.
• 50% of our employees take advantage of our community support programmes.
• All employees have access to wellbeing programmes that support healthier lifestyle choices and we achieve a wellbeing score of 81% in the Great Place to Work survey across the company.
• Reduce the carbon emissions relative to production across our global manufacturing sites by 15% vs 2016 baseline.
• Achieve a water ratio of 1.4 across our global manufacturing operations (excluding fruit processing).
• Achieve zero waste to landfi ll from our global manufacturing sites.
• Reduce the amount of materials we use across
all packaging formats and trial the introduction of
rPET into our GB brands packaging.
Britvic plc Annual Report and Accounts 2017 35
Strate
gic re
port
Gove
rnan
ceFin
ancial state
ments
Ad
ditio
nal info
rmatio
n
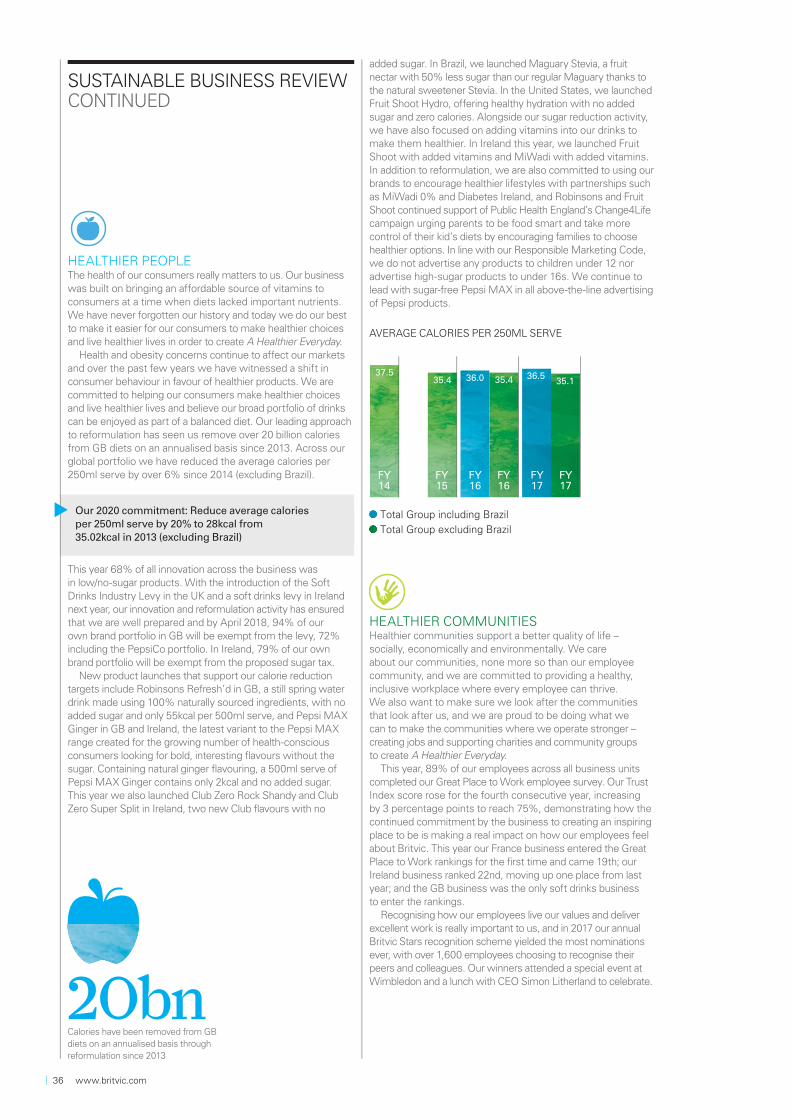
HEALTHIER PEOPLEThe health of our consumers really matters to us. Our business was built on bringing an affordable source of vitamins to consumers at a time when diets lacked important nutrients. We have never forgotten our history and today we do our best to make it easier for our consumers to make healthier choices and live healthier lives in order to create A Healthier Everyday.
Health and obesity concerns continue to affect our markets and over the past few years we have witnessed a shift in consumer behaviour in favour of healthier products. We are committed to helping our consumers make healthier choices and live healthier lives and believe our broad portfolio of drinks can be enjoyed as part of a balanced diet. Our leading approach to reformulation has seen us remove over 20 billion calories from GB diets on an annualised basis since 2013. Across our global portfolio we have reduced the average calories per 250ml serve by over 6% since 2014 (excluding Brazil).
Our 2020 commitment: Reduce average calories per 250ml serve by 20% to 28kcal from 35.02kcal in 2013 (excluding Brazil)
This year 68% of all innovation across the business was in low/no-sugar products. With the introduction of the Soft Drinks Industry Levy in the UK and a soft drinks levy in Ireland next year, our innovation and reformulation activity has ensured that we are well prepared and by April 2018, 94% of our own brand portfolio in GB will be exempt from the levy, 72% including the PepsiCo portfolio. In Ireland, 79% of our own brand portfolio will be exempt from the proposed sugar tax.
New product launches that support our calorie reduction targets include Robinsons Refresh’d in GB, a still spring water drink made using 100% naturally sourced ingredients, with no added sugar and only 55kcal per 500ml serve, and Pepsi MAX Ginger in GB and Ireland, the latest variant to the Pepsi MAX range created for the growing number of health-conscious consumers looking for bold, interesting flavours without the sugar. Containing natural ginger flavouring, a 500ml serve of Pepsi MAX Ginger contains only 2kcal and no added sugar. This year we also launched Club Zero Rock Shandy and Club Zero Super Split in Ireland, two new Club flavours with no
HEALTHIER COMMUNITIES Healthier communities support a better quality of life – socially, economically and environmentally. We care about our communities, none more so than our employee community, and we are committed to providing a healthy, inclusive workplace where every employee can thrive. We also want to make sure we look after the communities that look after us, and we are proud to be doing what we can to make the communities where we operate stronger – creating jobs and supporting charities and community groups to create A Healthier Everyday.
This year, 89% of our employees across all business units completed our Great Place to Work employee survey. Our Trust Index score rose for the fourth consecutive year, increasing by 3 percentage points to reach 75%, demonstrating how the continued commitment by the business to creating an inspiring place to be is making a real impact on how our employees feel about Britvic. This year our France business entered the Great Place to Work rankings for the first time and came 19th; our Ireland business ranked 22nd, moving up one place from last year; and the GB business was the only soft drinks business to enter the rankings.
Recognising how our employees live our values and deliver excellent work is really important to us, and in 2017 our annual Britvic Stars recognition scheme yielded the most nominations ever, with over 1,600 employees choosing to recognise their peers and colleagues. Our winners attended a special event at Wimbledon and a lunch with CEO Simon Litherland to celebrate.
SUSTAINABLE BUSINESS REVIEWCONTINUED
20bnCalories have been removed from GB diets on an annualised basis through reformulation since 2013
AVERAGE CALORIES PER 250ML SERVE
added sugar. In Brazil, we launched Maguary Stevia, a fruit nectar with 50% less sugar than our regular Maguary thanks to the natural sweetener Stevia. In the United States, we launched Fruit Shoot Hydro, offering healthy hydration with no added sugar and zero calories. Alongside our sugar reduction activity, we have also focused on adding vitamins into our drinks to make them healthier. In Ireland this year, we launched Fruit Shoot with added vitamins and MiWadi with added vitamins. In addition to reformulation, we are also committed to using our brands to encourage healthier lifestyles with partnerships such as MiWadi 0% and Diabetes Ireland, and Robinsons and Fruit Shoot continued support of Public Health England’s Change4Life campaign urging parents to be food smart and take more control of their kid’s diets by encouraging families to choose healthier options. In line with our Responsible Marketing Code, we do not advertise any products to children under 12 nor advertise high-sugar products to under 16s. We continue to lead with sugar-free Pepsi MAX in all above-the-line advertising of Pepsi products.
Total Group including Brazil
Total Group excluding Brazil
37.5
FY16
FY16
FY15
FY14
FY17
FY17
35.4 35.436.0 36.5 35.1
36 www.britvic.com

Diversity & InclusionWe are passionate about creating an inspiring and great place to work for our employees and recognise that this can only be achieved by creating an environment where everyone feels they can be themselves and where everyone’s voice is heard, valued and treated with respect. As a consumer-focused organisation, reflecting the global, cultural and socio-demographic diversity of our consumers within our workforce is key to ensuring the continued growth of our business.
We are committed to providing equal opportunities to our current and potential employees and apply fair and equitable employment practices. We value diversity and we recruit and promote talent on the basis of ability, skills, experience, behaviour, performance and potential for the job. Our selection, training, development and promotion policies ensure equal opportunities for all employees regardless of factors such as age, disability (including colleagues who become disabled during service), gender (including gender reassignment), marital status, pregnancy and maternity, race, nationality, religion or belief, or sexual orientation.
Our 2020 commitment: Women are represented in 40% of leadership roles across the company
This year we have developed our Diversity & Inclusion strategy to help embed a culture of inclusion across every part of Britvic and meet our guiding vision to build an inclusive organisation where our employees reflect the diverse communities and consumers they serve. Our strategy is delivered through five key focus areas:
• Build ownership and accountability in our Diversity & Inclusion strategy.
• Empower our people so that everyone’s voice is heard.• Step-change the make-up of our people to refl ect the
diversity of our consumer.• Deliver talent plans that leverage our diverse population• Build trust and fairness through the right policies
and training.
We have put in place a range of initiatives to deliver our ambitions, including focus groups to understand how our people feel about diversity and supporting International Women’s Day celebrating the women we have within the business. The latest Great Place to Work employee survey reported a 2% improvement in how employees view diversity and equality within the company.
The overall gender balance across all employees within the business at 1 October 2017 was 28% female and 72% male. This figure is indicative of our industry, with a high proportion of operational employees typically being male, and has remained static since the previous reporting period. This year we increased the representation of women in leadership roles by one percentage point from 2016 to 36% of senior roles across the business. Our Board level gender diversity changed this year to 14% female and 86% male with the departure of Joanne Averiss.
Male Female
Board 6 (86%) 1 (14%)
Executive Committee 10 (91%) 1 (9%)
Senior managers (Band D+) 241 (64%) 134 (36%)
All employees 3,375 (72%) 1,297 (28%)
Health, safety and wellbeingAcross our global operations, at year end, we employed over 4,700 people and safeguarding their health, safety and wellbeing continues to be a top priority. We focus on risk management, employee training and competence, and targeted initiatives to ensure that we maintain a strong safety culture.
This year our Accident Frequency Rate (‘AFR’) performance saw a 18% increase across the business, which was largely driven by a reduction in our working hours from activities with a typically low AFR and inclusion of our Brazilian manufacturing sites. We will focus on reducing our AFR next year by reinforcing our compliance culture and optimising our approach to occupational health and wellbeing. Overall, our combined safety performance (total accidents and lost-time accidents) remained stable and we are pleased to report that we reduced total accidents from 208 to 203 and, importantly, experienced 6 fewer lost time accidents across the company (38 vs 44 in 2016). This reduction in overall accidents was achieved by firmly embedding our safety management processes to reduce risk and actively encouraging employee engagement through our ‘Contribution to Safety’ programme in GB and Ireland. We also celebrated some standout achievements this year, including our sites in Beckton GB and Bricfruit France, which achieved an impressive record of three years without a lost time accident.
Our 2020 commitment: All employees have access to wellbeing programmes that support healthier lifestyle choices
Employee wellbeing goes beyond just ‘wellness’ and we recognise that it is a complex blend of the physical, psychological, social and relationship aspects of employees’ working lives. It is hugely important that our employees feel supported in their wellbeing as part of our Great Place to Work ambitions.
Across our markets we offer a variety of programmes that support our employees’ wellbeing and encourage healthier lifestyle choices. These programmes provide support for life’s everyday moments – for example, in GB and Ireland we provide a dedicated Employee Assistance helpline available 24/7 to provide everything from guidance on handling the stresses of everyday life to specialist counselling in bereavement support.
In Ireland, we were one of the first companies to achieve Ibec’s KeepWell™ Mark, an evidence based accreditation award to recognise the positive steps we have taken as an employer in support of our employees’ health and wellbeing.
Human rightsOur Ethical Business Policy details our commitment to human rights and covers bribery and corruption, conducting business with respect, integrity and equality, and managing personal activities and interests. Our approach is guided by international conventions and standards, including the United Nations (UN) Universal Declaration of Human Rights and the UN Guiding Principles on Business and Human Rights. Our policy extends to our suppliers and other trading partners and compliance is monitored through our responsible sourcing programme.
Responsible sourcing We are committed to sourcing all our materials in a responsible manner, working alongside our suppliers to drive best practice in respect to human rights, employment practices and the environment. This year we continued to make progress with our responsible sourcing programme, requesting 75% of our GB and Ireland business high-risk suppliers to be audited against the Sedex Members Ethical Trade Audit (SMETA) 4 Pillar standard (or equivalent) and working with others through our membership of the AIM PROGRESS group to improve the standards across our shared supply chain.
Modern slaveryWe do not tolerate any form of modern slavery and we recognise the risk of modern slavery within our supply chain. Our Modern Slavery Statement details the steps we are taking to tackle it and can be found on our website at www.britvic.com/sustainable-business/modern-slavery-statement
Britvic plc Annual Report and Accounts 2017 37
Strate
gic re
port
Gove
rnan
ceFin
ancial state
ments
Ad
ditio
nal info
rmatio
n
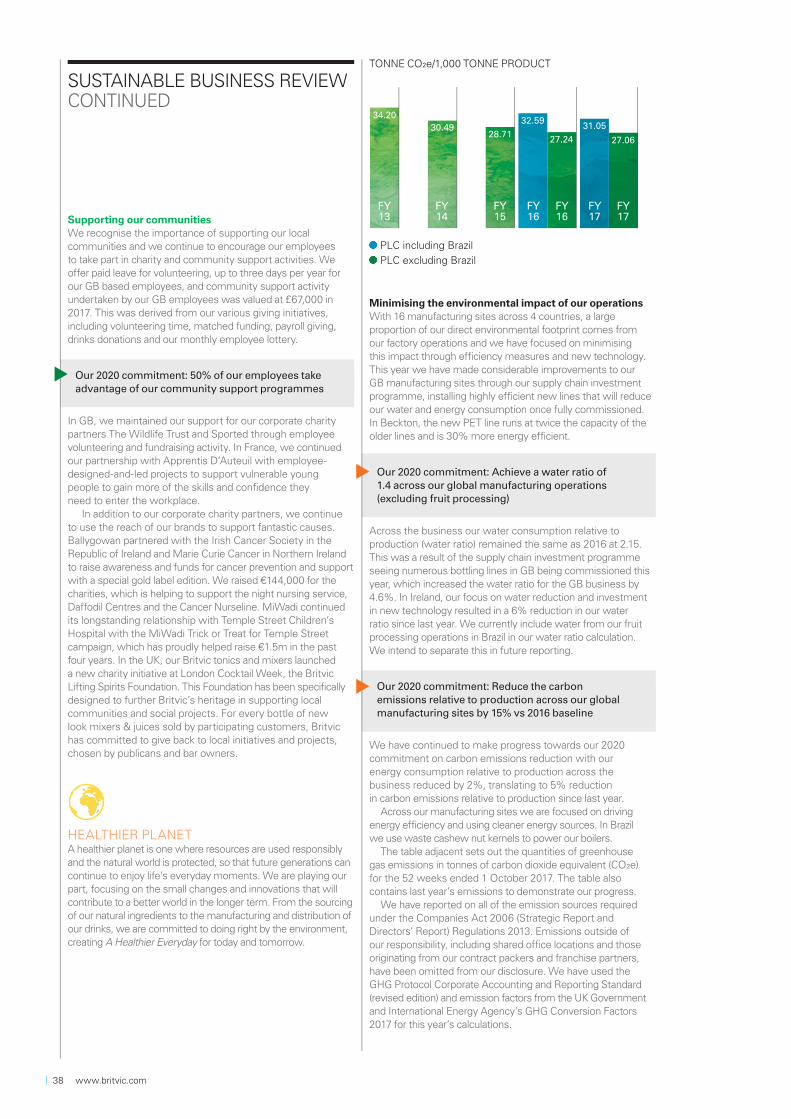
SUSTAINABLE BUSINESS REVIEWCONTINUED
Supporting our communitiesWe recognise the importance of supporting our local communities and we continue to encourage our employees to take part in charity and community support activities. We offer paid leave for volunteering, up to three days per year for our GB based employees, and community support activity undertaken by our GB employees was valued at £67,000 in 2017. This was derived from our various giving initiatives, including volunteering time, matched funding, payroll giving, drinks donations and our monthly employee lottery.
Our 2020 commitment: 50% of our employees takeadvantage of our community support programmes
In GB, we maintained our support for our corporate charity partners The Wildlife Trust and Sported through employee volunteering and fundraising activity. In France, we continued our partnership with Apprentis D’Auteuil with employee-designed-and-led projects to support vulnerable young people to gain more of the skills and confidence they need to enter the workplace.
In addition to our corporate charity partners, we continue to use the reach of our brands to support fantastic causes. Ballygowan partnered with the Irish Cancer Society in the Republic of Ireland and Marie Curie Cancer in Northern Ireland to raise awareness and funds for cancer prevention and support with a special gold label edition. We raised €144,000 for the charities, which is helping to support the night nursing service, Daffodil Centres and the Cancer Nurseline. MiWadi continued its longstanding relationship with Temple Street Children’s Hospital with the MiWadi Trick or Treat for Temple Street campaign, which has proudly helped raise €1.5m in the past four years. In the UK, our Britvic tonics and mixers launched a new charity initiative at London Cocktail Week, the Britvic Lifting Spirits Foundation. This Foundation has been specifically designed to further Britvic’s heritage in supporting local communities and social projects. For every bottle of new look mixers & juices sold by participating customers, Britvic has committed to give back to local initiatives and projects, chosen by publicans and bar owners.
HEALTHIER PLANETA healthier planet is one where resources are used responsibly and the natural world is protected, so that future generations can continue to enjoy life’s everyday moments. We are playing our part, focusing on the small changes and innovations that will contribute to a better world in the longer term. From the sourcing of our natural ingredients to the manufacturing and distribution of our drinks, we are committed to doing right by the environment, creating A Healthier Everyday for today and tomorrow.
Minimising the environmental impact of our operationsWith 16 manufacturing sites across 4 countries, a large proportion of our direct environmental footprint comes from our factory operations and we have focused on minimising this impact through efficiency measures and new technology. This year we have made considerable improvements to our GB manufacturing sites through our supply chain investment programme, installing highly efficient new lines that will reduce our water and energy consumption once fully commissioned. In Beckton, the new PET line runs at twice the capacity of the older lines and is 30% more energy efficient.
Our 2020 commitment: Achieve a water ratio of 1.4 across our global manufacturing operations (excluding fruit processing)
Across the business our water consumption relative to production (water ratio) remained the same as 2016 at 2.15. This was a result of the supply chain investment programme seeing numerous bottling lines in GB being commissioned this year, which increased the water ratio for the GB business by 4.6%. In Ireland, our focus on water reduction and investment in new technology resulted in a 6% reduction in our water ratio since last year. We currently include water from our fruit processing operations in Brazil in our water ratio calculation. We intend to separate this in future reporting.
Our 2020 commitment: Reduce the carbon emissions relative to production across our global manufacturing sites by 15% vs 2016 baseline
We have continued to make progress towards our 2020 commitment on carbon emissions reduction with our energy consumption relative to production across the business reduced by 2%, translating to 5% reduction in carbon emissions relative to production since last year.
Across our manufacturing sites we are focused on driving energy efficiency and using cleaner energy sources. In Brazil we use waste cashew nut kernels to power our boilers.
The table adjacent sets out the quantities of greenhouse gas emissions in tonnes of carbon dioxide equivalent (CO2e) for the 52 weeks ended 1 October 2017. The table also contains last year’s emissions to demonstrate our progress.
We have reported on all of the emission sources required under the Companies Act 2006 (Strategic Report and Directors’ Report) Regulations 2013. Emissions outside of our responsibility, including shared office locations and those originating from our contract packers and franchise partners, have been omitted from our disclosure. We have used the GHG Protocol Corporate Accounting and Reporting Standard (revised edition) and emission factors from the UK Government and International Energy Agency’s GHG Conversion Factors 2017 for this year’s calculations.
TONNE CO2e/1,000 TONNE PRODUCT
PLC including Brazil
PLC excluding Brazil
34.20
FY15
FY14
FY13
FY16
FY16
FY17
FY17
30.4928.71
32.59
27.2431.05
27.06
38 www.britvic.com
300tnsWe eliminated over 300 tonnes of plastic bottle packaging in GB
2015 - 2016 Emissions
(Tonnes CO2e)
2016 - 2017 Emissions
(Tonnes CO2e)
Total Scope 1 & 2 CO2e emissions 67,494 63,541
Emissions from:
Scope 1: Combustion of fuel and operation of facilities 31,131 28,391
Scope 2: Electricity, heat, steam and cooling purchased for our own use 36,363 35,150
Intensity measure:
Scope 1 & 2 emissions reported above normalised to per thousand tonne of product output
32.59 tonnes CO2e/1000
tonnes
31.05 tonnes CO2e/1000
tonnes
Notes:
1. Emissions relate to those generated by our manufacturing
sites in GB, Ireland, France and Brazil only.
2. Our reporting scope extended this year to include our latest
acquisition Bela Ischia.
3. FY16 data restated to improve robustness.
In addition to our direct emissions, we are also committed to reducing our indirect Scope 3 emissions arising from our business travel and logistics operations. This year we achieved a 28% reduction in emissions arising from our business flights across the business (excluding Brazil) equating to 2,840 tonnes CO2e. In GB, we have increased the total representation of electric and alternative fuel vehicles to 18% of our total car fleet. This means our current average CO2/km for our car fleet is 103g/km. We have offset 3,750 tonnes CO2e as part of our continued support of a rainforest conservation project in the Amazon.
Reducing wasteWe are committed to making our business more efficient by reducing, reusing, recycling and recovering our waste and ensuring that the waste residues that remain are disposed of using the most environmentally responsible options available.
This year, we diverted 99% of our global manufacturing operations waste from landfill and we established the waste performance of our Brazilian business, which sent 368 tonnes to landfill. We are working closely with our waste management providers to understand the challenges associated with waste disposal in Brazil and have targets to reduce this waste to landfill next year.
202 0 commitment: Achieve zero waste to landfill from our global manufacturing sites
Optimising our packagingPackaging is a critically important component of our products and we have a responsibility to ensure the environmental impacts are minimised throughout its lifecycle, from the materials we use to produce the packa ging through to how our consumers dispose of it.
SUMMARY ASSURANCE STATEMENT FROM BUREAU VERITAS UK LT DBureau Veritas UK Ltd (‘Bureau Veritas’) has provided limited independent assurance to Britvic plc over selected sustainability data contained within the Group’s 2017 Annual Report. The information and data reviewed in this assurance process covered the period 3 October 2016 – 1 October 2017.
The full assurance statement, including Bureau Veritas’ verification opinion, scope, summary of the work performed, limitations and exclusions, additional commentary, and a statement of independence and impartiality, can be found on the Britvic website:
www.britvic.com
Bureau Veritas UKNovember 2017
2020 commitment: Reduce the amount of materials we use across all packaging formats and ensure 15% of PET comes from recycled or renewable materials
Lightweighting our packaging has been a major focus for us as we strive to reduce its environmental impact. We work closely with our packaging suppliers, and through the supply chain investment programme in GB we have avoided 308 tonnes of primary plastic bottle packaging by moving products onto our new bottling lines and accessing lighterweight bottles. In GB, we are also replacing our steel cans with aluminium cans avoiding 8,000 tonnes of packaging material per annum once completed by April 2018.
In support of the circular economy we also recognise that we have a role to play in ensuring that the packaging material is recovered and recycled and consideration to the end of life of our packaging is a fundamental part of our packaging design process. All of our plastic bottles are 100% recyclable and we encourage our consumers to recycle as much of our packaging as possible with on-pack messaging and campaigns in partnership with our customers. This year we supported our customer Live Nation with a recycling campaign at V Festival in the UK to promote recycling and anti-littering with festival goers.
This year, working alongside PepsiCo, we have trialled the inclusion of rPET in our bottles. We recognise that using recycled plastics is becoming increasingly popular with our stakeholders and could play a role in reducing the environmental impact associated with plastic packaging. We are committed to investigating this further across our brands.
Britvic plc Annual Report and Accounts 2017 39
Strate
gic re
port
Gove
rnan
ceFin
ancial state
ments
Ad
ditio
nal info
rmatio
n
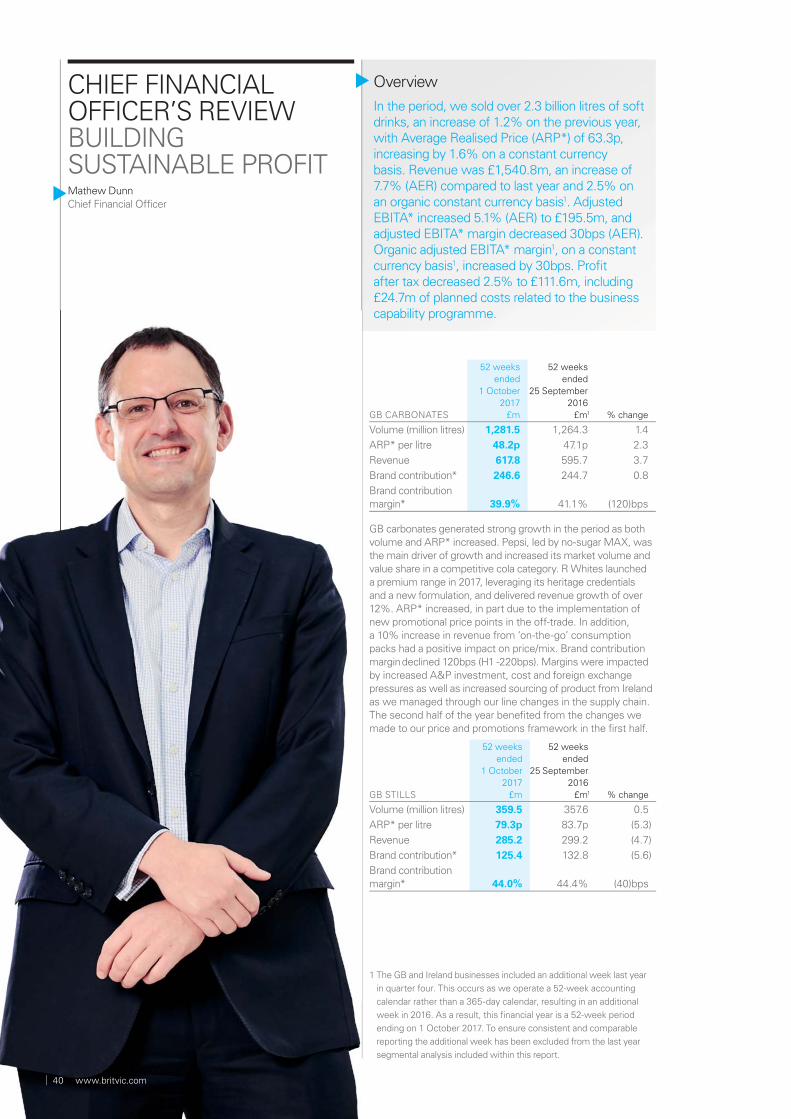
CHIEF FINANCIAL OFFICER’S REVIEWBUILDING SUSTAINABLE PROFITMathew DunnChief Financial Officer
GB CARBONATES
52 weeks ended
1 October 2017
£m
52 weeks ended
25 September 2016
£m1 % change
Volume (million litres) 1,281.5 1,264.3 1.4
ARP* per litre 48.2p 47.1p 2.3
Revenue 617.8 595.7 3.7
Brand contribution* 246.6 244.7 0.8
Brand contribution margin* 39.9% 41.1% (120)bps
GB carbonates generated strong growth in the period as both volume and ARP* increased. Pepsi, led by no-sugar MAX, was the main driver of growth and increased its market volume and value share in a competitive cola category. R Whites launched a premium range in 2017, leveraging its heritage credentials and a new formulation, and delivered revenue growth of over 12%. ARP* increased, in part due to the implementation of new promotional price points in the off-trade. In addition, a 10% increase in revenue from ‘on-the-go’ consumption packs had a positive impact on price/mix. Brand contribution margin declined 120bps (H1 -220bps). Margins were impacted by increased A&P investment, cost and foreign exchange pressures as well as increased sourcing of product from Ireland as we managed through our line changes in the supply chain. The second half of the year benefited from the changes we made to our price and promotions framework in the first half.
GB STILLS
52 weeks ended
1 October 2017
£m
52 weeks ended
25 September 2016
£m1 % change
Volume (million litres) 359.5 357.6 0.5
ARP* per litre 79.3p 83.7p (5.3)
Revenue 285.2 299.2 (4.7)
Brand contribution* 125.4 132.8 (5.6)
Brand contribution margin* 44.0% 44.4% (40)bps
Overview
In the period, we sold over 2.3 billion litres of soft drinks, an increase of 1.2% on the previous year, with Average Realised Price (ARP*) of 63.3p, increasing by 1.6% on a constant currency basis. Revenue was £1,540.8m, an increase of 7.7% (AER) compared to last year and 2.5% on an organic constant currency basis1. Adjusted EBITA* increased 5.1% (AER) to £195.5m, and adjusted EBITA* margin decreased 30bps (AER). Organic adjusted EBITA* margin1, on a constant currency basis1, increased by 30bps. Profi t after tax decreased 2.5% to £111.6m, including £24.7m of planned costs related to the business capability programme.
1 The GB and Ireland businesses included an additional week last year
in quarter four. This occurs as we operate a 52-week accounting
calendar rather than a 365-day calendar, resulting in an additional
week in 2016. As a result, this financial year is a 52-week period
ending on 1 October 2017. To ensure consistent and comparable
reporting the additional week has been excluded from the last year
segmental analysis included within this report.
40 www.britvic.com
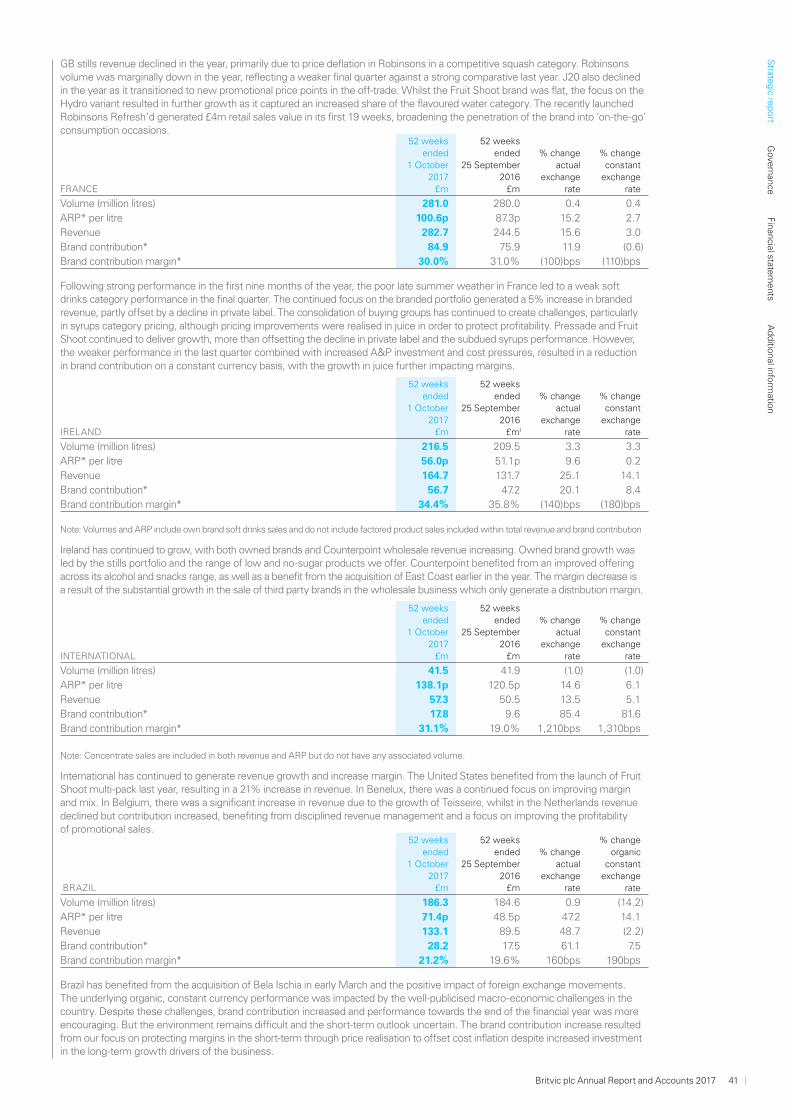
GB stills revenue declined in the year, primarily due to price deflation in Robinsons in a competitive squash category. Robinsons volume was marginally down in the year, reflecting a weaker final quarter against a strong comparative last year. J20 also declined in the year as it transitioned to new promotional price points in the off-trade. Whilst the Fruit Shoot brand was flat, the focus on the Hydro variant resulted in further growth as it captured an increased share of the flavoured water category. The recently launched Robinsons Refresh’d generated £4m retail sales value in its first 19 weeks, broadening the penetration of the brand into ‘on-the-go’ consumption occasions.
FRANCE
52 weeks ended
1 October 2017
£m
52 weeks ended
25 September 2016
£m
% change actual
exchange rate
% change constant
exchange rate
Volume (million litres) 281.0 280.0 0.4 0.4
ARP* per litre 100.6p 87.3p 15.2 2.7
Revenue 282.7 244.5 15.6 3.0
Brand contribution* 84.9 75.9 11.9 (0.6)
Brand contribution margin* 30.0% 31.0% (100)bps (110)bps
Following strong performance in the first nine months of the year, the poor late summer weather in France led to a weak soft drinks category performance in the final quarter. The continued focus on the branded portfolio generated a 5% increase in branded revenue, partly offset by a decline in private label. The consolidation of buying groups has continued to create challenges, particularly in syrups category pricing, although pricing improvements were realised in juice in order to protect profitability. Pressade and Fruit Shoot continued to deliver growth, more than offsetting the decline in private label and the subdued syrups performance. However, the weaker performance in the last quarter combined with increased A&P investment and cost pressures, resulted in a reduction in brand contribution on a constant currency basis, with the growth in juice further impacting margins.
IRELAND
52 weeks ended
1 October 2017
£m
52 weeks ended
25 September 2016
£m1
% change actual
exchange rate
% change constant
exchange rate
Volume (million litres) 216.5 209.5 3.3 3.3
ARP* per litre 56.0p 51.1p 9.6 0.2
Revenue 164.7 131.7 25.1 14.1
Brand contribution* 56.7 47.2 20.1 8.4
Brand contribution margin* 34.4% 35.8% (140)bps (180)bps
Note: Volumes and ARP include own brand soft drinks sales and do not include factored product sales included within total revenue and brand contribution
Ireland has continued to grow, with both owned brands and Counterpoint wholesale revenue increasing. Owned brand growth was led by the stills portfolio and the range of low and no-sugar products we offer. Counterpoint benefited from an improved offering across its alcohol and snacks range, as well as a benefit from the acquisition of East Coast earlier in the year. The margin decrease is a result of the substantial growth in the sale of third party brands in the wholesale business which only generate a distribution margin.
INTERNATIONAL
52 weeks ended
1 October 2017
£m
52 weeks ended
25 September 2016
£m
% change actual
exchange rate
% change constant
exchange rate
Volume (million litres) 41.5 41.9 (1.0) (1.0)
ARP* per litre 138.1p 120.5p 14.6 6.1
Revenue 57.3 50.5 13.5 5.1
Brand contribution* 17.8 9.6 85.4 81.6
Brand contribution margin* 31.1% 19.0% 1,210bps 1,310bps
Note: Concentrate sales are included in both revenue and ARP but do not have any associated volume.
International has continued to generate revenue growth and increase margin. The United States benefited from the launch of Fruit Shoot multi-pack last year, resulting in a 21% increase in revenue. In Benelux, there was a continued focus on improving margin and mix. In Belgium, there was a significant increase in revenue due to the growth of Teisseire, whilst in the Netherlands revenue declined but contribution increased, benefiting from disciplined revenue management and a focus on improving the profitability of promotional sales.
BRAZIL
52 weeks ended
1 October 2017
£m
52 weeks ended
25 September 2016
£m
% change actual
exchange rate
% change organic
constant exchange
rate
Volume (million litres) 186.3 184.6 0.9 (14.2)
ARP* per litre 71.4p 48.5p 47.2 14.1
Revenue 133.1 89.5 48.7 (2.2)
Brand contribution* 28.2 17.5 61.1 7.5
Brand contribution margin* 21.2% 19.6% 160bps 190bps
Brazil has benefited from the acquisition of Bela Ischia in early March and the positive impact of foreign exchange movements. The underlying organic, constant currency performance was impacted by the well-publicised macro-economic challenges in the country. Despite these challenges, brand contribution increased and performance towards the end of the financial year was more encouraging. But the environment remains difficult and the short-term outlook uncertain. The brand contribution increase resulted from our focus on protecting margins in the short-term through price realisation to offset cost inflation despite increased investment in the long-term growth drivers of the business.
Britvic plc Annual Report and Accounts 2017 41
Strate
gic re
port
Gove
rnan
ceFin
ancial state
ments
Ad
ditio
nal info
rmatio
n
FIXED COSTS – PRE ADJUSTING ITEMS
52 weeks ended
1 October 2017
£m
52 weeks ended
25 September 2016
£m
% change actual
exchange rate
% change organic
constant exchange
rate
Non-brand A&P (10.1) (12.1) 16.5 17.2
Fixed supply chain (105.1) (95.8) (9.7) (3.0)
Selling costs (132.4) (124.9) (6.0) 0.5
Overheads and other (127.2) (120.6) (5.5) 1.3
Total (374.8) (353.4) (6.1) 0.3
Total A&P investment (67.8) (68.6)
A&P as a % of own-brand revenue 4.5% 4.9%
A&P spend declined £0.8m (AER) and by £3.6m on a constant currency basis. Whilst branded spend decreased marginally, a large element of the reduction was as a result of efficiencies in our non-working A&P spend, which continues to reduce as a percentage of our overall investment. Fixed supply chain costs have increased due to incremental depreciation from our GB investment programme, whilst selling and overheads and other costs have benefited from our rigorous approach to cost control. We took proactive cost action by extending our business capability programme to incorporate £5m of overhead savings in 2017. This includes a flattening of our structure in some areas as well as reducing duplication between our business units through the combination of some roles. Reported fixed costs on a 52 week basis (AER) increased 6.1% due to the inclusion of Bela Ischia and the impact of foreign exchange movements.
Adjusting items In the period, we accounted for a net charge of £25.9m of pre-tax adjusting items. These include:
• Strategic restructuring – business capability programme of £24.7m;
• Unwind of discount on deferred consideration of £4.9m;• Acquisition and integration costs of £3.7m;• Net impairment reversal of intangible asset carrying value
of £(2.6)m;• Fair value gains of £(5.0)m; and• Net other items of £0.2m.
The cash costs of adjusting items pre-tax in the period were a £4.4m inflow, reflecting gains on derivatives received and proceeds from property sales. Further detail on adjusting items can be found on page 152.
Interest The adjusted net finance charge* for the 52 week period for the Group was £20.1m, compared with £20.8m (53 week) in the prior year, reflecting the benefits of our refinancing activities in the earlier part of the fiscal year. The reported net finance charge was £24.2m (2016: £24.5m)
Taxation The adjusted tax charge* was £36.3m, which equates to an effective tax rate of 22.0% (2016: 23.0%), primarily resulting from a decrease in UK and French tax rates, beneficial overseas profit mix and fewer losses arising internationally. The reported net tax charge was £27.2m (2016: £37.4m).
Earnings per shareAdjusted basic EPS* for the period was 52.9p, up 7.3% on the same period last year. Basic EPS for the period was 42.4p, compared with 43.8p for last year.
DividendsThe board is recommending a final dividend of 19.3p per share, an increase of 10.3% on the dividend declared last year, with a total value of £50.9m. The final dividend for 2017 will be paid on 5 February 2018 to shareholders on record as at 8 December 2017. The ex-dividend date is 7 December 2017.
Cash flow and net debtAdjusted free cash flow* was a £54.5m inflow, compared to a £10.9m inflow the previous year. Working capital generated an inflow of £26.0m (2016: £25.8m outflow), benefiting from the reversal of the additional payment run incurred in 2016 due to the additional week last year and a continued focus on working capital management across the business. Inventory costs increased, primarily due to a proactive decision to build stock to mitigate risk from the business capability programme. Capital expenditure was £24.8m higher than last year, driven by the continuation of the transformational business capability programme in GB. Overall adjusted net debt* increased by £86.5m, partly due to the acquisitions of Bela Ischia and East Coast. Adjusted net debt leverage increased to 2.0x EBITDA* from 1.8x last year.
Treasury managementThe financial risks faced by the Group are identified and managed by a central treasury department, whose activities are carried out in accordance with Board approved policies and subject to regular Audit and Treasury Committee reviews. The department does not operate as a profit centre and no transaction is entered into for trading or speculative purposes. Key financial risks managed by the treasury department include exposures to movements in interest rates and foreign exchange rates whilst managing the Group’s debt and liquidity, currency risk, interest rate risk and cash management. The Group uses financial instruments to hedge against interest rate and foreign currency exposures. At 1 October 2017 the Group had £1,045.0m of committed debt facilities, consisting of a £400.0m bank facility which matures in 2021, and a series of private placement notes with maturities between 2017 and 2032, providing the business with a secure funding platform.
At 1 October 2017, the Group’s unadjusted net debt of £589.9m (excluding derivative hedges) consisted of £23.7m drawn under the Group’s committed bank facilities, £645.0m of private placement notes, £3.0m of accrued interest and £3.0m of finance leases, offset by net cash and cash equivalents of
CHIEF FINANCIAL OFFICER’S REVIEWCONTINUED
42 www.britvic.com

£82.5m and unamortised loan issue costs of £2.3m. After taking into account the element of the fair value of interest rate currency swaps hedging the balance sheet value of the private placement notes, the Group’s adjusted net debt was £502.9m, which compares to £416.4m at 2 October 2016.
PensionsAt 1 October 2017, the Group had IAS 19 pension surpluses in Great Britain and Northern Ireland totalling £40.5m and IAS 19 pension deficits in Ireland and France totalling £9.3m, resulting in a net pension surplus of £31.2m (2 October 2016: net liability of £17.4m). The net surplus has increased primarily due to changes in the financial and demographic assumptions and additional employer contributions made to the GB plan of £20.0m, partially offset by a loss on scheme assets. The defined benefit section of the GB plan was closed to new members on 1 August 2002, and closed to future accrual for active members from 1 April 2011, with new employees being invited to join the defined contribution scheme. The Northern Ireland scheme is only open to future accrual for members who joined before 28 February 2006, and new employees are eligible to join the defined contribution scheme. All new employees in Ireland join the defined contribution plan. The 31 March 2016 actuarial valuation of the GB plan was recently completed. Agreement has been made with the scheme trustee on a number of key principles, including allowing a longer period to fund the deficit and agreeing that no additional contributions will be payable over and above those payments to 2019 agreed at the 2013 valuation. Future contributions beyond 2019 will be on a contingent basis. The Ireland and Northern Ireland Defined Benefit Pension schemes have an investment strategy journey plan to manage the risks as the funding position improves. The GB Pension scheme mainly has credit-type investments and the Trustees have developed proposals to manage the investment risks.
Risk management processAs with any business we face risks and uncertainties. We believe that effective risk management supports the successful delivery of our strategic objectives. The management of these risks is based on a balance of risk and reward determined through assessment of the likelihood and impact as well as the company’s risk appetite. The Executive team performs a formal robust assessment of the principal risks facing the company annually, which is reviewed by the Board. Similarly, all business units and functions perform formal annual risk assessments that consider the company’s principal risks and specific local risks relevant to the market in which they operate. Risks are monitored throughout the year with consideration to internal and external factors, the company’s risk appetite and updates to risks and mitigation plans are made as required. The principal risks that could potentially have a significant impact on our business in the future are set out on pages 29 to 32.
Implementation of IFRS 15: Revenue from Contracts with CustomersBritvic is committed to continually improving both the quality and transparency of its financial reporting and will therefore be early adopting IFRS 15 (Revenue from Contracts with Customers), from the accounting period starting 2 October 2017 with full retrospective application.
IFRS 15 establishes a comprehensive framework for determining and recognising revenue as well as requiring entities to provide users of financial statements with more informative and relevant disclosures. The primary impact for
The London Essence Company (LEC)LEC super premium mixers, made by Britvic-backed incubator Wisehead Productions, are now listed in 200 premium outlets in London.
Britvic on implementing IFRS 15 will be a reclassification of certain rebates offered to customers that had previously been recognised as selling and distribution costs to revenue and the reclassification of certain incentives received, from revenue, to cost of sales. Adoption of the standard is expected to have no impact on profit before tax. The impact of this standard on the Group if it had been adopted in the current year would have been a reduction in revenue of £110.3m with a decrease in cost of sales of £57.1m, a decrease in selling and distribution costs of £52.3m and a decrease in administration expenses of £0.9m.
The Chief Financial Officer’s review was approved by the Boardand signed on its behalf by Mathew Dunn.
Mathew DunnChief Financial Officer28 November 2017
The Strategic Report was approved by the Board and signed on its behalf by Simon Litherland.
Simon LitherlandChief Executive Officer28 November 2017
Britvic plc Annual Report and Accounts 2017 43
Strate
gic re
port
Gove
rnan
ceFin
ancial state
ments
Ad
ditio
nal info
rmatio
n
JOHN DALYANSWERS QUESTIONS ON CULTURE AND THE ROLE OF THE BOARD
Dear Shareholder,I am pleased to present the Corporate Governance Report for the financial year ended 1 October 2017. This report sets out our approach to corporate governance and serves to provide shareholders with a clear view of how governance principles and practices have operated during the year.
Board effectivenessYour Board is committed to remaining effective and recognises that to do so it must ensure that it has the right balance of skills, independence and knowledge of the company to enable it to discharge its duties and responsibilities. The Board is satisfied that each Board member is able to devote sufficient time to the company and carefully considers additional external commitments on an ongoing basis.
Board successionFollowing the departure of Gerald Corbett and Joanne Averiss during the year, the Board has continued to review the composition of the Board and its committees. As Ben Gordon will reach his ninth year of tenure in January 2018, the Board has focused on succession planning and is pleased to announce the appointment of Suniti Chauhan and William Eccleshare as Non-Executive Directors, effective on 29 November 2017. To ensure orderly transition, Ben Gordon will remain on the Board until 30 January 2018 and will not seek re-election at the AGM on 31 January 2018. Further details can be found in the Nomination Committee’s report on pages 56-57.
Board evaluationThe Board has carried out an internal Board evaluation during the year and has agreed that an external facilitated evaluation will take place during the summer of 2018. Following a tender for Board evaluation services, it has been agreed that Lintstock will conduct the evaluation. Further information on the results of the Board evaluation for the year can be found on pages 54-55.
Fair, balanced and understandableDuring the year the Board reviewed the requirement for directors to make a statement that they consider the annual report and accounts, taken as a whole, to be fair, balanced and understandable. The Audit Committee met to consider the criteria for a fair, balanced and understandable annual report and to review the processes underpinning the compilation and assurance of the report, in relation to financial and non-financial information. On behalf of the Board, I confirm that we believe that this Annual Report and Financial Statements presents a fair, balanced and understandable assessment of the company’s position, its performance and its prospects as well as its business model and strategy.
John DalyChairman28 November 2017
John Daly Chairman
What is Board culture?
Firstly, it is my responsibility to cultivate a healthy Board culture. It is essential that the Board is engaged, can constructively challenge and support the Executive team and work together using the power of our collective contribution, personal attributes, skills and knowledge to drive the business to succeed. It is important that the Board sets the correct ‘tone from the top’.
How are you developing Board culture?
I acknowledge the importance of building a balanced Board based on diversity of background, skills and experience. I believe in creating an open and inclusive environment which demonstrates the Britvic values and builds respectful and sustainable relationships amongst individual directors and the Executive team. We design our calendar for the year to allow for the Board to meet formally and informally, which we believe drives a better quality of relationship which is not solely focused on life in the boardroom.
What is the role of the Board?
The Board is collectively responsible to shareholders for the company’s performance, the strategic direction of the Group, its values and its governance. The Board provides the leadership and oversight necessary for the Group to meet its performance objectives and drive long-term sustainable value for shareholders.
CHAIRMAN’SINTRODUCTIONTO GOVERNANCE
44 www.britvic.com
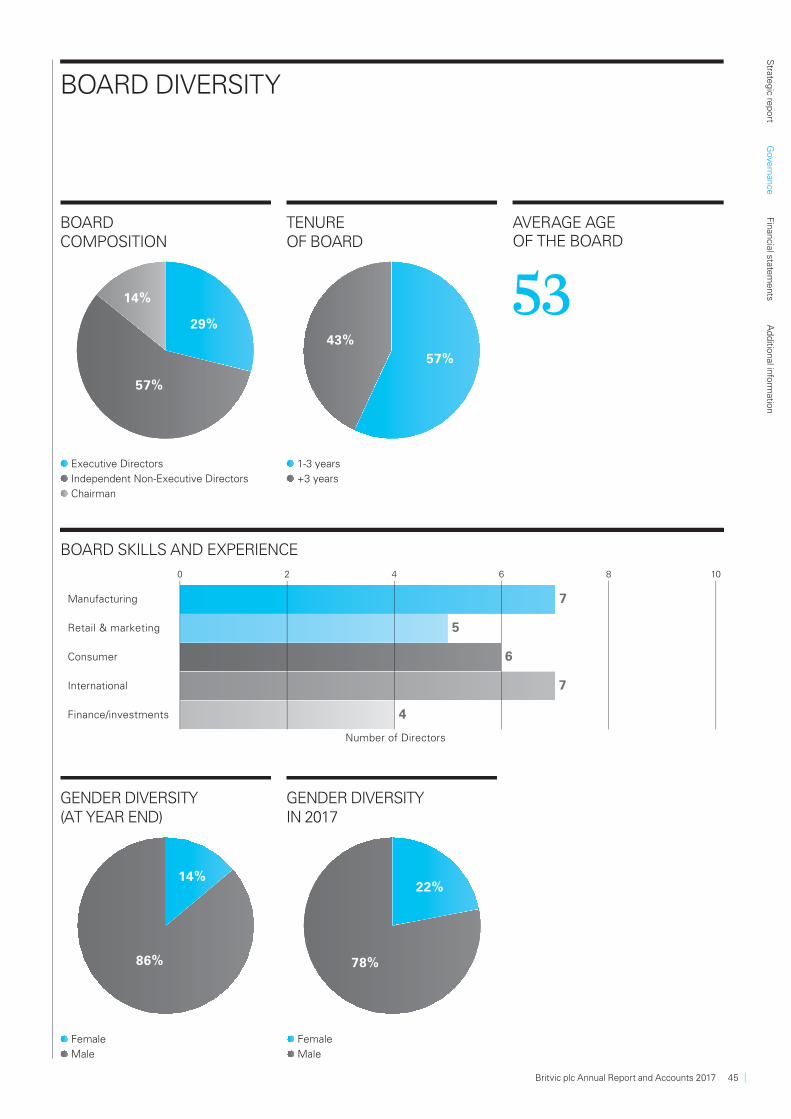
BOARD DIVERSIT Y
BOARD COMPOSITION
14%
57%
29%
Executive Directors
Independent Non-Executive Directors
Chairman
GENDER DIVERSITY(AT YEAR END)
86%
14%
Female
Male
TENURE OF BOARD
43%
57%
1-3 years
+3 years
GENDER DIVERSITYIN 2017
78%
22%
Female
Male
7
5
6
7
4
0 2 4 6 8 10
BOARD SKILLS AND EXPERIENCE
Manufacturing
Retail & marketing
Consumer
International
Finance/investments
Number of Directors
AVERAGE AGE OF THE BOARD
53
Britvic plc Annual Report and Accounts 2017 45
Stra
tegic
rep
ort
Govern
ance
Fin
ancia
l sta
tem
ents
Ad
ditio
nal in
form
atio
n

15
37
2
Simon LitherlandChief Executive Offi cer
Simon Litherland was appointed Chief Executive Offi cer in February 2013 and is responsible for overseeing the delivery of the company’s business strategy. He joined Britvic in September 2011, initially as Managing Director of Britvic GB.
Skills, competence and experience:Prior to this, he had a career spanning 20 years with Diageo. His last role was MD of Diageo Great Britain, having previously run Diageo’s businesses in South Africa, Ireland and Central and Eastern Europe. During his time at Diageo, Simon was responsible for an extensive portfolio of brands, including Guinness, Johnnie Walker, Baileys, Smirnoff and Captain Morgan. In his earlier career he held a variety of International Finance Director roles in Diageo, IDV and Grand Metropolitan.
Simon qualifi ed as a Chartered Accountant with Deloitte in South Africa and holds a business degree from the University of Cape Town.
External directorships:• Non-Executive Director
of Persimmon plc and a member of its Audit, Nomination and Remuneration Committees
1
John DalyNon-Executive Chairman
John Daly was appointed Chairman of the Board on 1 September 2017. John joined the Board as a Non-Executive Director on 27 January 2015 and prior to his appointment as Chairman served as Senior Independent Director.
Skills, competence and experience:John brings strong international and consumer expertise to the Board having held various executive leadership positions over the course of 20 years at British American Tobacco plc (‘BAT’). His most recent positions at BAT were Chief Operating Offi cer (2010-2014) and Regional Director for Asia Pacifi c, based in Hong Kong (2004-2010). John is a former Director of Reynolds American Inc., a US public company owned 42% by BAT. Prior to his time with BAT, John held various sales and marketing positions with Johnson & Johnson, Bristol-Myers Squibb, Pennwalt Corporation and Schering-Plough.
Committee membership:
N R
External directorships: • Non-Executive
Director of Ferguson plc (formerly Wolseley plc) and a member of all Board Committees (2014-present)
• Non-Executive Director of G4S PLC (2015-date), Chair of the Remuneration Committee and a member of the Audit Committee
4
Ian McHoulSenior Independent Director
Ian McHoul was appointed Senior Independent Director on 1 September 2017. Ian joined the Board as a Non-Executive Director on 10 March 2014.
Skills, competence and experience:Ian is a Chartered Accountant and has extensive fi nance, strategy, beverage and retail experience gained through leadership roles at Scottish & Newcastle plc, Inntrepreneur Pub Group and Foster’s Brewing Group. Prior to the acquisition by John Wood Group plc in October 2017, he held the role of Chief Financial Offi cer of Amec Foster Wheeler plc for nine years. Ian served as Non-Executive Director and Chair of the Audit Committee of Premier Foods plc between 2004 and 2013, the last year of which he was also the Senior Independent Director. Ian holds a BSc in Mathematics from the University of Bristol.
Committee membership:
A N, R
External directorships: • Non-Executive Director
of John Wood Group plc• Non-Executive Director
of Bellway plc (eff ective 1 February 2018)
3
Mathew DunnChief Financial Offi cer
Mathew Dunn joined the business in September 2015 and was appointed Chief Financial Offi cer (‘CFO’) on 25 November 2015.
He is responsible for Finance, IT, Legal, Estates, Internal Audit and Risk Management.
Skills, competence and experience:Prior to joining Britvic, Mathew was at SABMiller PLC where he was CFO of South African Breweries Ltd, based in South Africa since 2014. Mathew fi rst joined SABMiller in 2002 where he held various fi nancial planning and management, as well as leadership positions before joining EMI Music Ltd as CFO of the Global Catalogue division in 2009. He returned to SABMiller in 2010 as CFO, Asia (based in China), a role which he held until his 2014 move to South Africa.
External directorships:• None
BOARD OF DIRECTORS
46 www.britvic.com
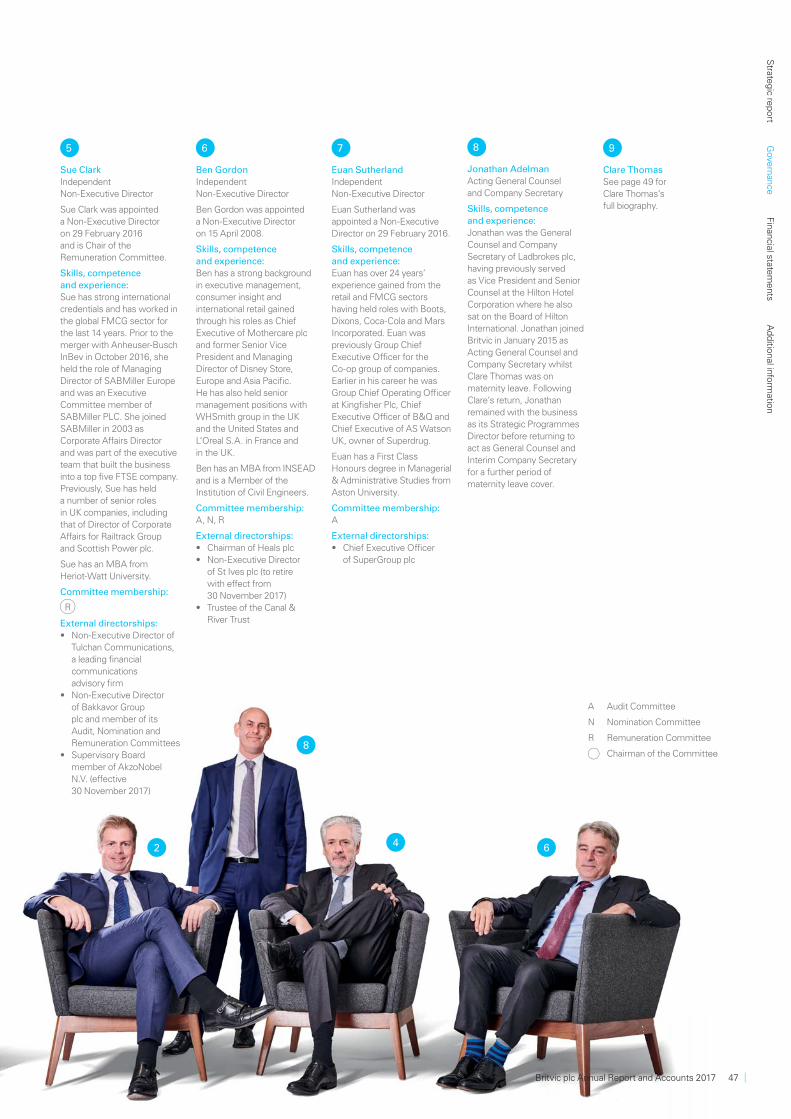
8
642
6
Ben GordonIndependent Non-Executive Director
Ben Gordon was appointed a Non-Executive Director on 15 April 2008.
Skills, competence and experience:Ben has a strong background in executive management, consumer insight and international retail gained through his roles as Chief Executive of Mothercare plc and former Senior Vice President and Managing Director of Disney Store, Europe and Asia Pacifi c. He has also held senior management positions with WHSmith group in the UK and the United States and L’Oreal S.A. in France and in the UK.
Ben has an MBA from INSEAD and is a Member of the Institution of Civil Engineers.
Committee membership:A, N, R
External directorships: • Chairman of Heals plc• Non-Executive Director
of St Ives plc (to retire with eff ect from 30 November 2017)
• Trustee of the Canal & River Trust
7
Euan SutherlandIndependent Non-Executive Director
Euan Sutherland was appointed a Non-Executive Director on 29 February 2016.
Skills, competence and experience:Euan has over 24 years’ experience gained from the retail and FMCG sectors having held roles with Boots, Dixons, Coca-Cola and Mars Incorporated. Euan was previously Group Chief Executive Offi cer for the Co-op group of companies. Earlier in his career he was Group Chief Operating Offi cer at Kingfi sher Plc, Chief Executive Offi cer of B&Q and Chief Executive of AS Watson UK, owner of Superdrug.
Euan has a First Class Honours degree in Managerial & Administrative Studies from Aston University.
Committee membership:A
External directorships:• Chief Executive Offi cer
of SuperGroup plc
9
Clare ThomasSee page 49 for Clare Thomas’s full biography.
5
Sue ClarkIndependent Non-Executive Director
Sue Clark was appointed a Non-Executive Director on 29 February 2016 and is Chair of the Remuneration Committee.
Skills, competence and experience:Sue has strong international credentials and has worked in the global FMCG sector for the last 14 years. Prior to the merger with Anheuser-Busch InBev in October 2016, she held the role of Managing Director of SABMiller Europe and was an Executive Committee member of SABMiller PLC. She joined SABMiller in 2003 as Corporate Aff airs Director and was part of the executive team that built the business into a top fi ve FTSE company. Previously, Sue has held a number of senior roles in UK companies, including that of Director of Corporate Aff airs for Railtrack Group and Scottish Power plc.
Sue has an MBA from Heriot-Watt University.
Committee membership:
R
External directorships:• Non-Executive Director of
Tulchan Communications, a leading fi nancial communications advisory fi rm
• Non-Executive Director of Bakkavor Group plc and member of its Audit, Nomination and Remuneration Committees
• Supervisory Board member of AkzoNobel N.V. (eff ective 30 November 2017)
A Audit Committee
N Nomination Committee
R Remuneration Committee
Chairman of the Committee
8
Jonathan AdelmanActing General Counsel and Company Secretary
Skills, competence and experience:Jonathan was the General Counsel and Company Secretary of Ladbrokes plc, having previously served as Vice President and Senior Counsel at the Hilton Hotel Corporation where he also sat on the Board of Hilton International. Jonathan joined Britvic in January 2015 as Acting General Counsel and Company Secretary whilst Clare Thomas was on maternity leave. Following Clare’s return, Jonathan remained with the business as its Strategic Programmes Director before returning to act as General Counsel and Interim Company Secretary for a further period of maternity leave cover.
Britvic plc Annual Report and Accounts 2017 47
Stra
tegic
rep
ort
Govern
ance
Fin
ancia
l sta
tem
ents
Ad
ditio
nal in
form
atio
n

1
4
7
2
5
8
3
6
9
EXECUTIVE TEAM
48 www.britvic.com
1
Doug FrostChief Human Resources Offi cer
Doug was appointed Human Resources Director in 2004 and became Chief Human Resources Offi cer in October 2016.
Doug previously worked for 15 years with Mars Incorporated in positions in manufacturing, sales and human resources. He started his career in the UK, then worked across several continental European markets and latterly spent several years in Brazil.
6
Clare ThomasGeneral Counsel and Company Secretary
Clare joined the Group as General Counsel and Company Secretary in September 2013.
Clare has a corporate and commercial legal background, and prior to joining Britvic spent 15 years as a corporate / M&A lawyer at law fi rm Addleshaw Goddard LLP, including six years as a partner, with a particular focus on FMCG clients.
3
Kevin DonnellyManaging Director, Ireland
Kevin joined Britvic Ireland in September 2008 as Marketing Director and was appointed Country Director in June 2013.
Kevin has over 25 years’ experience in sales, marketing and general management in FMCG companies, including Unilever and Dairygold.
Kevin holds a First Class Honours degree in Marketing from Trinity College Dublin and a Post Graduate Diploma in Digital Marketing.
7
Jean-Luc TivolleManaging Director, France
Jean-Luc was appointed Managing Director of France in 2010, after 14 years as Vice-Chairman of Fruité Entreprises, which was acquired by Britvic at that time. Prior to this, Jean-Luc held senior roles in Tetra Pak and a variety of positions at Chocolat Poulain (Cadbury Schweppes Group).
2
Paul GrahamManaging Director, GB
Paul was appointed GB Managing Director on 13 April 2015, having joined Britvic as GB General Manager in September 2012.
Before joining Britvic, Paul worked in a range of commercial roles for companies including Mars Confectionery and United Biscuits.
Paul has a BSc in Management Sciences from the University of Manchester and is a member of the Executive Council of The British Soft Drinks Association.
9
Matt BarwellChief Marketing Offi cer
Matt is responsible for all aspects of Britvic’s global brand strategy and execution, innovation, corporate aff airs and the company’s sustainability agenda.
He joined Britvic from Diageo in 2014 where he held a number of senior positions over 15 years, including Marketing and Innovation Director for Diageo Africa and, later, Diageo Europe. He started his career with Mars where he worked for 10 years in both the confectionery and pet food businesses.
Matt is Chairman of the Advertising Association’s Front Foot group and is a Fellow of The Marketing Society.
4
Hessel de JongManaging Director, International
Hessel joined the business in September 2015 with over 20 years of management experience in the international FMCG industry.
Prior to joining Britvic, Hessel worked as an advisor to a number of private equity companies, including Blackstone and Bencis Capital Partners. From 2008 to 2014, he was Managing Director of the Dutch and Benelux operations of the Coca-Cola Company.
Before 2008, Hessel held various regional and global leadership positions at Heineken and SCA Group in Europe and Asia.
Hessel is based in Amsterdam and holds a Master of Business Administration from INSEAD and a Bachelor of Business Administration from Nyenrode University.
8
João Caetano de Mello NetoChief Executive Offi cer, Ebba Brazil
João Caetano joined Britvic following the acquisition of Ebba on 30 September 2015. He brings with him over 30 years of executive management experience in the consumer goods industry.
Previously, João Caetano worked for Cia. Müller de Bebidas (Caninha 51) where he spent 14 years and acted as Chief Executive Offi cer for 7 of those years. He then worked for J. Macedo for 7 years as Chief Executive Offi cer of Hidracor before moving to Ebba, where he remains the Chief Executive Offi cer.
5
Clive HooperChief Supply Chain Offi cer
Clive was appointed Chief Supply Chain Offi cer in October 2016 having joined the business in 2006 as Production Director.
Clive has responsibility for production, procurement, logistics, warehousing, technical and quality, safety and environment across the Britvic sites. Prior to joining Britvic, he has held senior management, production and planning roles at Greencore, Procter & Gamble and CeDo.
Clive has a BEng in Engineering from the Royal Naval Engineering College.
Please see page 46 for Simon Litherland’s and Mathew Dunn’s biographies.
Britvic plc Annual Report and Accounts 2017 49
Stra
tegic
rep
ort
Govern
ance
Fin
ancia
l sta
tem
ents
Ad
ditio
nal in
form
atio
n
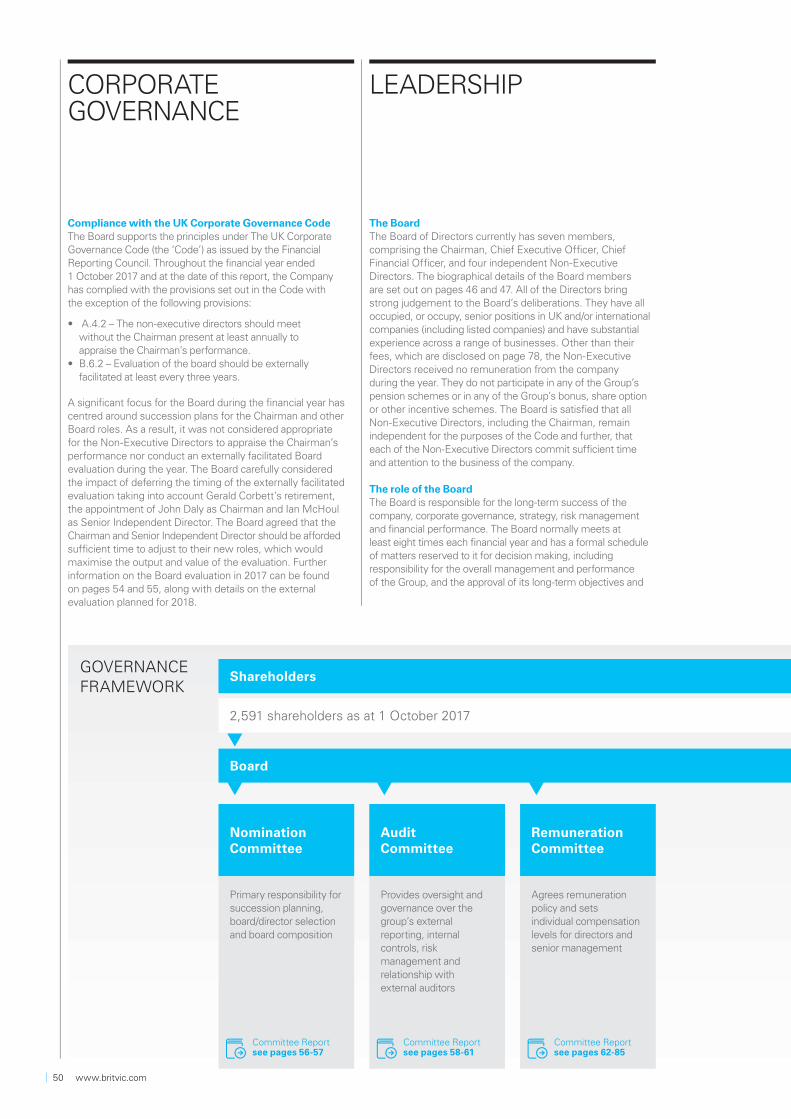
The BoardThe Board of Directors currently has seven members, comprising the Chairman, Chief Executive Officer, Chief Financial Officer, and four independent Non-Executive Directors. The biographical details of the Board members are set out on pages 46 and 47. All of the Directors bring strong judgement to the Board’s deliberations. They have all occupied, or occupy, senior positions in UK and/or international companies (including listed companies) and have substantial experience across a range of businesses. Other than their fees, which are disclosed on page 78, the Non-Executive Directors received no remuneration from the company during the year. They do not participate in any of the Group’s pension schemes or in any of the Group’s bonus, share option or other incentive schemes. The Board is satisfied that all Non-Executive Directors, including the Chairman, remain independent for the purposes of the Code and further, that each of the Non-Executive Directors commit sufficient time and attention to the business of the company.
The role of the BoardThe Board is responsible for the long-term success of the company, corporate governance, strategy, risk management and financial performance. The Board normally meets at least eight times each financial year and has a formal schedule of matters reserved to it for decision making, including responsibility for the overall management and performance of the Group, and the approval of its long-term objectives and
LEADERSHIPCORPORATEGOVERNANCE
Compliance with the UK Corporate Governance Code The Board supports the principles under The UK Corporate Governance Code (the ‘Code’) as issued by the Financial Reporting Council. Throughout the financial year ended 1 October 2017 and at the date of this report, the Company has complied with the provisions set out in the Code with the exception of the following provisions:
• A.4.2 – The non-executive directors should meet without the Chairman present at least annually to appraise the Chairman’s performance.
• B.6.2 – Evaluation of the board should be externally facilitated at least every three years.
A significant focus for the Board during the financial year has centred around succession plans for the Chairman and other Board roles. As a result, it was not considered appropriate for the Non-Executive Directors to appraise the Chairman’s performance nor conduct an externally facilitated Board evaluation during the year. The Board carefully considered the impact of deferring the timing of the externally facilitated evaluation taking into account Gerald Corbett’s retirement, the appointment of John Daly as Chairman and Ian McHoul as Senior Independent Director. The Board agreed that the Chairman and Senior Independent Director should be afforded sufficient time to adjust to their new roles, which would maximise the output and value of the evaluation. Further information on the Board evaluation in 2017 can be found on pages 54 and 55, along with details on the external evaluation planned for 2018.
2,591 shareholders as at 1 October 2017
GOVERNANCE
FRAMEWORK
Nomination Committee
Audit Committee
RemunerationCommittee
Primary responsibility for succession planning, board/director selection and board composition
Provides oversight and governance over the group’s external reporting, internal controls, risk management and relationship with external auditors
Agrees remuneration policy and sets individual compensation levels for directors and senior management
Committee Report see pages 56-57
Committee Report see pages 58-61
Committee Report see pages 62-85
50 www.britvic.com
Board
Shareholders
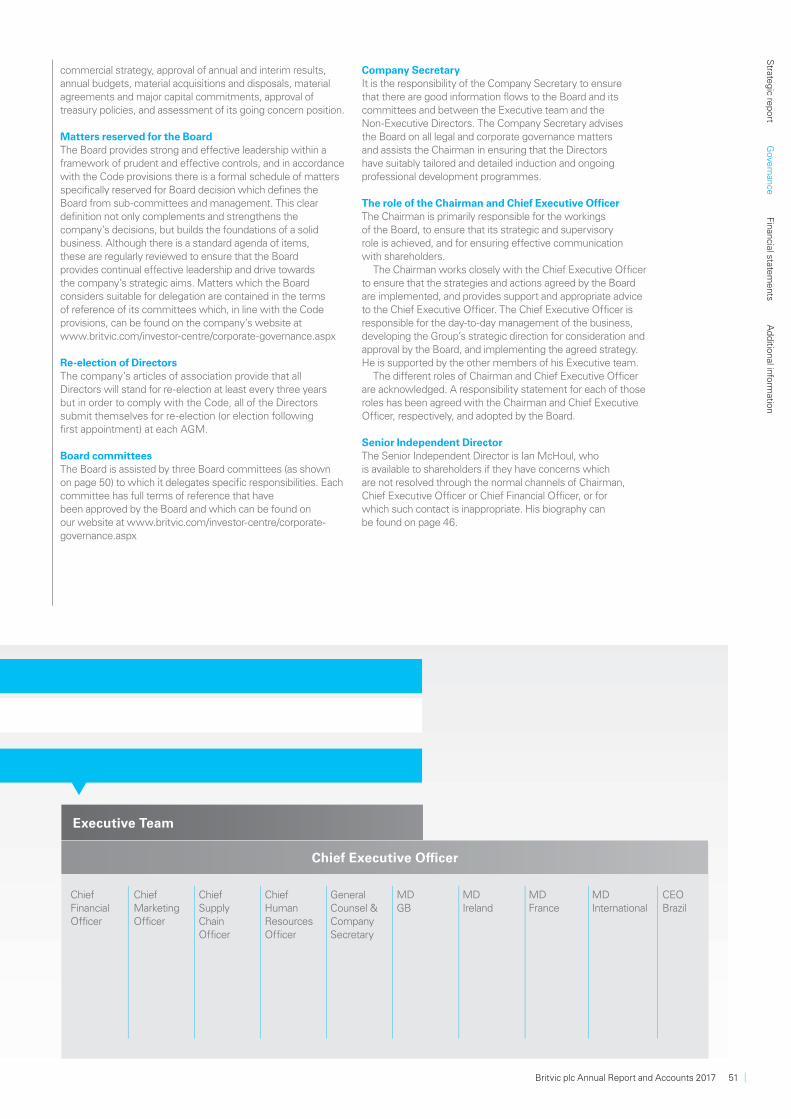
commercial strategy, approval of annual and interim results, annual budgets, material acquisitions and disposals, material agreements and major capital commitments, approval of treasury policies, and assessment of its going concern position.
Matters reserved for the BoardThe Board provides strong and effective leadership within a framework of prudent and effective controls, and in accordance with the Code provisions there is a formal schedule of matters specifically reserved for Board decision which defines the Board from sub-committees and management. This clear definition not only complements and strengthens the company’s decisions, but builds the foundations of a solid business. Although there is a standard agenda of items, these are regularly reviewed to ensure that the Board provides continual effective leadership and drive towards the company’s strategic aims. Matters which the Board considers suitable for delegation are contained in the terms of reference of its committees which, in line with the Code provisions, can be found on the company’s website at www.britvic.com/investor-centre/corporate-governance.aspx
Re-election of DirectorsThe company’s articles of association provide that all Directors will stand for re-election at least every three years but in order to comply with the Code, all of the Directors submit themselves for re-election (or election following first appointment) at each AGM.
Board committees The Board is assisted by three Board committees (as shown on page 50) to which it delegates specific responsibilities. Each committee has full terms of reference that have been approved by the Board and which can be found on our website at www.britvic.com/investor-centre/corporate-governance.aspx
Company SecretaryIt is the responsibility of the Company Secretary to ensure that there are good information flows to the Board and its committees and between the Executive team and the Non-Executive Directors. The Company Secretary advises the Board on all legal and corporate governance matters and assists the Chairman in ensuring that the Directors have suitably tailored and detailed induction and ongoing professional development programmes.
The role of the Chairman and Chief Executive OfficerThe Chairman is primarily responsible for the workings of the Board, to ensure that its strategic and supervisory role is achieved, and for ensuring effective communication with shareholders.
The Chairman works closely with the Chief Executive Officer to ensure that the strategies and actions agreed by the Board are implemented, and provides support and appropriate advice to the Chief Executive Officer. The Chief Executive Officer is responsible for the day-to-day management of the business, developing the Group’s strategic direction for consideration and approval by the Board, and implementing the agreed strategy. He is supported by the other members of his Executive team.
The different roles of Chairman and Chief Executive Officer are acknowledged. A responsibility statement for each of those roles has been agreed with the Chairman and Chief Executive Officer, respectively, and adopted by the Board.
Senior Independent DirectorThe Senior Independent Director is Ian McHoul, who is available to shareholders if they have concerns which are not resolved through the normal channels of Chairman, Chief Executive Officer or Chief Financial Officer, or for which such contact is inappropriate. His biography can be found on page 46.
Chief Executive Offi cer
Chief Financial Officer
Chief Marketing Officer
ChiefHumanResourcesOfficer
Chief Supply Chain Officer
MD Ireland
CEO Brazil
MD GB
MD France
MD International
General Counsel & Company Secretary
Executive Team
Britvic plc Annual Report and Accounts 2017 51
Stra
tegic
rep
ort
Govern
ance
Fin
ancia
l sta
tem
ents
Ad
ditio
nal in
form
atio
n
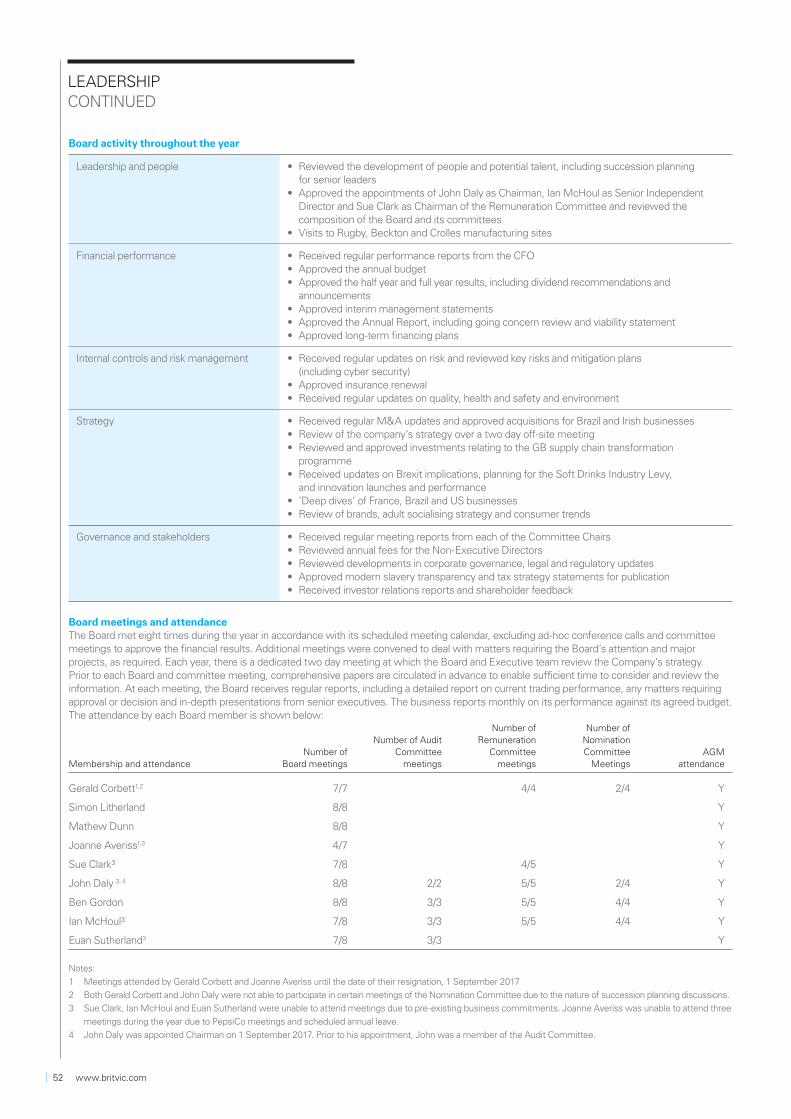
Board activity throughout the year
Leadership and people • Reviewed the development of people and potential talent, including succession planning for senior leaders
• Approved the appointments of John Daly as Chairman, Ian McHoul as Senior Independent Director and Sue Clark as Chairman of the Remuneration Committee and reviewed the composition of the Board and its committees
• Visits to Rugby, Beckton and Crolles manufacturing sites
Financial performance • Received regular performance reports from the CFO• Approved the annual budget• Approved the half year and full year results, including dividend recommendations and
announcements• Approved interim management statements• Approved the Annual Report, including going concern review and viability statement• Approved long-term fi nancing plans
Internal controls and risk management • Received regular updates on risk and reviewed key risks and mitigation plans (including cyber security)
• Approved insurance renewal • Received regular updates on quality, health and safety and environment
Strategy • Received regular M&A updates and approved acquisitions for Brazil and Irish businesses• Review of the company’s strategy over a two day off -site meeting• Reviewed and approved investments relating to the GB supply chain transformation
programme• Received updates on Brexit implications, planning for the Soft Drinks Industry Levy,
and innovation launches and performance • ‘Deep dives’ of France, Brazil and US businesses• Review of brands, adult socialising strategy and consumer trends
Governance and stakeholders • Received regular meeting reports from each of the Committee Chairs• Reviewed annual fees for the Non-Executive Directors• Reviewed developments in corporate governance, legal and regulatory updates• Approved modern slavery transparency and tax strategy statements for publication• Received investor relations reports and shareholder feedback
Board meetings and attendanceThe Board met eight times during the year in accordance with its scheduled meeting calendar, excluding ad-hoc conference calls and committee meetings to approve the financial results. Additional meetings were convened to deal with matters requiring the Board’s attention and major projects, as required. Each year, there is a dedicated two day meeting at which the Board and Executive team review the Company’s strategy. Prior to each Board and committee meeting, comprehensive papers are circulated in advance to enable sufficient time to consider and review the information. At each meeting, the Board receives regular reports, including a detailed report on current trading performance, any matters requiring approval or decision and in-depth presentations from senior executives. The business reports monthly on its performance against its agreed budget. The attendance by each Board member is shown below:
Membership and attendanceNumber of
Board meetings
Number of Audit Committee
meetings
Number of Remuneration
Committee meetings
Number of Nomination Committee
MeetingsAGM
attendance
Gerald Corbett1,2 7/7 4/4 2/4 Y
Simon Litherland 8/8 Y
Mathew Dunn 8/8 Y
Joanne Averiss1,3 4/7 Y
Sue Clark³ 7/8 4/5 Y
John Daly 3, 4 8/8 2/2 5/5 2/4 Y
Ben Gordon 8/8 3/3 5/5 4/4 Y
Ian McHoul³ 7/8 3/3 5/5 4/4 Y
Euan Sutherland3 7/8 3/3 Y
Notes:
1 Meetings attended by Gerald Corbett and Joanne Averiss until the date of their resignation, 1 September 2017
2 Both Gerald Corbett and John Daly were not able to participate in certain meetings of the Nomination Committee due to the nature of succession planning discussions.
3 Sue Clark, Ian McHoul and Euan Sutherland were unable to attend meetings due to pre-existing business commitments. Joanne Averiss was unable to attend three
meetings during the year due to PepsiCo meetings and scheduled annual leave.
4 John Daly was appointed Chairman on 1 September 2017. Prior to his appointment, John was a member of the Audit Committee.
LEADERSHIPCONTINUED
52 www.britvic.com
Tenure of Non-Executive DirectorsThe Code provides that the length of tenure is a factor to consider when determining the independence of Non-Executive Directors. The table below shows the tenure and independence of each of our Non-Executive Directors since the date of their first election by shareholders.
Date first elected by shareholders
Years from first election to 2018 AGM
Considered to be independent by the Board
Sue Clark January 2017 – Yes
John Daly1 January 2016 2 Yes1
Ben Gordon January 2009 9 Yes
Ian McHoul January 2015 3 Yes
Euan Sutherland January 2017 – Yes
Notes:
1 The company considers that, on appointment, the Chairman was independent for the purposes of provision A.3.1 of the Code.
Service contracts and letters of appointmentDetails of the Executive Directors’ service contracts and the Chairman’s and the Non-Executive Directors’ letters of appointment are set out in the Directors’ Remuneration Report on page 84. These documents are available for inspection at the registered office of the company during normal business hours and at the AGM.
Indemnification of DirectorsIn addition to the indemnity granted by the company to Directors in respect of their liabilities incurred as a result of their office in accordance with our articles of association, we maintain a Directors’ and Officers’ liability insurance policy throughout the year. Neither our indemnity nor the insurance provides cover in the event that a Director has proven to have acted dishonestly or fraudulently.
Conflicts of interest The company’s articles of association allow the Board to authorise potential conflicts of interest that may arise and to impose limits or conditions, as appropriate. Any decision of the Board to authorise a conflict of interest, whether matter-specific or situational, is only effective if it is agreed without the participation of the conflicted Director(s), and in making such a decision, as always, the Directors must act in a way they consider in good faith will be most likely to promote the success of the company. The company has an established procedure whereby actual or potential conflicts of interest are reviewed annually and for the appropriate authorisation to be sought prior to the appointment of any new Director or if a new conflict arises.
During the year, the Board considered external appointments for Simon Litherland as Non-Executive Director of Persimmon plc and Sue Clark as Non-Executive Director of Tulchan Communications Group, Bakkavor Group plc and as a Supervisory Board member of AkzoNobel N.V. The Board considered John Daly’s external appointments as Non-Executive Director of G4S plc and Ferguson plc in the context of his appointment as Chairman and concluded that each of the Directors would be able to devote sufficient time to their roles at Britvic and these interests would not impede or affect their respective ability to fully discharge their responsibilities.
Shareholder engagementInvestor relationsThe Board is committed to maintaining good communications with shareholders. Senior executives, including the Chairman, Chief Executive Officer and Chief Financial Officer, have regular dialogue with individual institutional shareholders in order to develop an understanding of their views, which is then discussed with the Board. All Directors are offered the opportunity to meet with major shareholders to listen to their views and, in addition to a monthly report prepared by the Chief Financial Officer, receive regular reports prepared by an independent capital markets advisory firm which provide comprehensive information relating to the company’s major shareholders. Presentations are made to analysts, investors and prospective investors covering the annual and interim results and the company seeks to maintain a dialogue with the various bodies which monitor the company’s governance policies and procedures. The Strategic Report set out on pages 1 to 43 details the financial performance of the company as well as setting out the risks it faces.
Private investorsWe are keen to hear the views of our private shareholders and we encourage them to use our shareholder mailbox ([email protected]) for detailed enquiries and to access our website for our company reports and business information. Specific enquiries to the Company Secretary may be sent to the Secretariat mailbox ([email protected]) or sent to the registered office. At the AGM, the Chief Executive Officer gives a regular update on the positioning and outlook for the business. Shareholders are invited to ask questions formally during the meeting and to follow up these discussions with Directors on a one-to-one basis afterwards. The Chairs of the Board committees and the Senior Independent Director are present and available to respond to questions at the AGM. We look forward to welcoming all our shareholders to our AGM in January 2018 and to updating them on our business developments.
Britvic plc Annual Report and Accounts 2017 53
Stra
tegic
rep
ort
Govern
ance
Fin
ancia
l sta
tem
ents
Ad
ditio
nal in
form
atio
n
Induction and developmentThe Chairman is responsible for preparing and co-ordinating an induction programme for newly appointed Directors, including presentations from senior management on different aspects of the business, as well as guidance on their duties, responsibilities and liabilities as a Director of a listed company. The Non-Executive Directors are encouraged to visit Group manufacturing sites to enable them to gain a greater understanding of the group’s activities and to meet senior managers throughout the business. Directors have access to appropriate training as required and they are encouraged to develop their understanding of the business. To strengthen their knowledge and understanding of the business, Board meetings regularly include updates and briefings on specific areas of the company’s activities, and Board meetings, where possible, are held offsite at other Britvic sites. Following the appointment of Suniti Chauhan and William Eccleshare as Non-Executive Directors on 29 November 2017, it is expected that their induction programme will cover each of the elements listed below:
Type of induction activity
Face-to-face meetings • Meetings with Chairman, CEO and CFO to understand the culture and values, strategy, recent developments, overview of fi nancials (including last year’s Annual Report and Accounts) and key challenges and opportunities
• Meetings with members of the Executive team to gain insight of their role and responsibilities, the structure of their teams, and current challenges and opportunities
Site visits • Visits to manufacturing sites to further their knowledge of operations
Committee inductions • To understand Committee remit and overview of key issues/policies/developments• Meeting with Chair of Committee and advisors to Committee
Investor relations and media views • To gain an overview of investor relations activities, market facing issues and investor concerns
Governance, risk management and litigation
• Matters reserved for the Board and Statement of Authorities, overview of Board procedures and schedule of future meetings
• Directors’ duties and Board procedures for confl icts of interest, and share dealing • Key governance issues aff ecting the company • Principal risk register and risk management approach• Overview of material litigation• Directors’ and Offi cers’ insurance policy
Use of Board portal • To gain access to key materials and policies, allowing each Director to further their knowledge of the work of the Board and annual planning cycles, minutes from previous meetings and other relevant information
The Company Secretary provides support to the Chairman to ensure that ongoing development for the Board is carried out and is tailored for each Board member.
Independent adviceThe Board has approved a procedure for Directors to take independent professional advice at the company’s expense if necessary. No such advice was sought by any Director during the year. In addition, the Directors have direct access to the advice and services of the Company Secretary.
Board evaluationBoard evaluation is reviewed on an annual basis and during the year, it was agreed that an internal evaluation would be carried out. A questionnaire was devised and the results were presented to the Board confirming that the Board and its committees were operating effectively. The 2017 review built on the actions delivered in the prior year which are referred to in the table opposite. In addition, the review confirmed that there were a small number of focus areas for the Board during 2018 which were to:
• maintain focus on building board capability and improve succession planning;• continue to support management in developing the International & Brazilian businesses and growing the UK market; and • improve quality of information relating to brands and marketing metrics.
EFFECTIVENESS
54 www.britvic.com

2016 evaluation Recommendations Actions delivered in year
Continue to focus on shorter-term succession planning and for a successor to the Chairman
The Board continued to focus on succession planning during the 2017 financial year, which resulted in changes amongst the existing Board in the form of a new Chairman, Senior Independent Director and Chair of the Remuneration Committee. The Board continued to develop succession plans for the ongoing refreshment of the Board recognising that Ben Gordon would reach the end of his ninth year of tenure in 2018.
Increase number of deep dives on core strategic priorities Deep dives have been weaved into the Board’s agenda enabling the Board to gain effective insight, demonstrate robust challenge and support for the Executive team during the year.
Improve the quality of Board analytics in financial/commercial performance areas
The quality of information presented to the Board relating to financial/commercial data has improved during the year, bringing more insight to the performance of the business.
Continue with opportunities for the Non-Executive Directors to visit other sites and to meet informally outside of Board meetings
The Board visited the Rugby, Beckton and Crolles sites during the year. Meetings are scheduled to take place off-site with Board dinners to enable discussion outside of the boardroom.
Increased focus on risk management The Board’s agenda has been reshaped with risk as a regular item and includes focus on principal risks, emerging risks, risk appetite, understanding the criteria for scoring risk set against a backdrop of volatility in the macro-economic environment, Brexit and sugar tax.
Under the Code, an external facilitated evaluation should take place every three years. The last external evaluation was carried out in 2013 and as indicated in the 2016 Annual Report, the Board agreed to defer the timing of an external review in light of succession planning for the Chairman and two new Non-Executive Directors joining the Board. In the context of further Board changes, with a new Chairman and Senior Independent Director, the Board agreed that it was sensible to delay the timing of an externally facilitated review until the summer of 2018 and is therefore considered to be non-compliant for the purposes of provision B.6.2 of the Code. The Board carefully considered the rationale for delaying the external evaluation and agreed that this prudent approach would allow the Chairman and the Senior Independent Director to adjust to their new roles being mindful of the benefit, insight and value that an external evaluation brings.
Ahead of the proposed external evaluation in 2018, the Board has carried out a tender for Board evaluation services and has appointed Lintstock to carry out evaluation services over a three year period starting in 2018. Lintstock has no other connection with the company. The Chairman, Senior Independent Director and Company Secretary will work together to agree the scope of the evaluation in early 2018 and further information will be published in next years’ Annual Report.
Britvic plc Annual Report and Accounts 2017 55
Stra
tegic
rep
ort
Govern
ance
Fin
ancia
l sta
tem
ents
Ad
ditio
nal in
form
atio
n

On behalf of the Nomination Committee (the ‘Committee’), I am pleased to present its report for the financial year ended 1 October 2017. It has been a busy year for the Committee with a focus on Chairman succession planning and ongoing succession planning for the Board. This report describes how the Committee has carried out its responsibilities during the year.
Committee members
Gerald Corbett1 (former Chairman)
John Daly (Chairman)
Ben Gordon
Ian McHoul
Note:
1 Gerald Corbett stepped down as Chairman of the Board on
1 September 2017.
The Committee comprises a majority of independent Non-Executive Directors. The Chief Executive Officer also attends by invitation. The Committee meets as necessary and at least twice a year. The Chairman of the Committee also provides a report of Committee meetings to the Board.
The Committee is responsible for considering and recommending to the Board candidates who are appropriate for appointment as Executive and Non-Executive Directors and for other senior management roles, so as to maintain an appropriate balance of skills and experience within the company and on the Board and to ensure progressive refreshing of the Board. In addition, it is the responsibility of the Committee to review the structure, size and composition of the Board and its committees and further that the procedures for appointing Directors is formal, rigourous, transparent, objective, merit-based and has regard for diversity.
Main activities during the yearThe Committee considered and has made recommendations to the Board in respect of:
• a review of the Board and committee membership following the changes to the composition of the Board;
• succession planning and subsequent recommendation of John Daly as Chairman;
• ongoing Non-Executive recruitment plans and subsequent recommendation of appointees to the Board;
• a review of the fi ndings of the 2016/17 Board evaluation (for more information see page 54); and
• annual review of Directors’ potential confl icts of interest.
Appointment of DirectorsThere is a formal, rigorous and transparent procedure for the appointment of new Directors to the Board under which the Committee interviews suitable candidates who are proposed either by existing Board members or by an external search firm. Careful consideration is given to ensure that proposed appointees have enough time available to devote to the role and that the balance of skills, knowledge and experience on the Board is maintained.
When discussions relate to the appointment of a Chairman, the Senior Independent Director will chair the Committee and lead the recruitment process. When the Committee has found a suitable candidate, the Chair of the Committee will make a proposal to the whole Board, which retains responsibility for all such appointments.
Succession planningSuccession planning has continued to be an area of focus of the Committee during the year. The main focus for the year has been on Chairman succession planning as indicated in the 2016 Annual Report. Gerald Corbett had indicated towards the end of 2016 that he intended to step down from the Board as soon as he was assured that the newer members of the Board and other role changes amongst the Board had settled.
During the year, John Daly (former Senior Independent Director) declared his interest in being considered as a candidate for the Chairman’s position. As he was Senior Independent Director at the time, he could not lead the Committee through the Chairman succession process, nor could he participate in any discussions relating to his proposed candidacy. It was agreed that Ian McHoul would lead the Committee through the succession process including the appointment of Zygos Partnership to assist with the planning process. Zygos Partnership has no other connection with the company. Other Non-Executive Directors were co-opted to the Committee to ensure that the views of the entire Board were reflected in the succession process. Following a thorough process, the Committee recommended John Daly’s appointment as Chairman to the Board. In consideration of John Daly’s appointment as Chairman, other changes were recommended by the Committee, with Ian McHoul assuming responsibility as Senior Independent Director and Sue Clark as Chair of the Remuneration Committee. All of these changes became effective on 1 September 2017.
It was agreed that Zygos Partnership be retained for the purposes of continuing the ongoing refreshment of the Board mindful of Ben Gordon reaching his ninth year of tenure. Following the recommendation of the Committee, the Board agreed to appoint Suniti Chauhan and William Eccleshare, effective on 29 November 2017. For orderly transition, it was agreed that Ben Gordon will remain on the Board until the end of January 2018. Ben will not seek re-election at the AGM on 31 January 2018.
John DalyNomination Committee Chair
NOMINATIONCOMMITTEE
56 www.britvic.com
DiversityAt Britvic, diversity is a wider topic than simply gender and the Board recommends to the company that, in order to achieve its future growth aspirations, it should remain committed to building a pipeline of diverse talent and to regularly review its HR processes, including recruitment and performance management frameworks. The Directors’ view, however, remains that we do not feel in a position to publish a target of the percentage of women on the Board. Gender remains an important aspect of overall diversity. The Committee continues to monitor and review the balance of the Board under a lens of diversity recognising the benefits of a truly diverse and inclusive environment. Further details of the company’s statistics on gender diversity may be found on page 37 of the Strategic Report.
Conflicts of interestAs referred to on page 53, the Board operates a formal policy to identify and, where appropriate, manage any potential conflicts of interest that Directors may have. It is the role of the Committee to monitor the situation and determine actions to address any potential or actual conflicts that may arise. The Committee reviews all potential conflicts of interest on an annual basis and when new Directors are formally appointed.
Board evaluationDetails of the review of the Board and its committees undertaken during the year can be found on pages 54 and 55.
Having reviewed the results of the evaluation, the Committee has confirmed to the Board that the present Board and its committees continue to operate effectively and that all of the Non-Executive Directors remained independent, in accordance with the Code and all Directors should stand for re-election (or election in the case of Suniti Chauhan and William Eccleshare) at the AGM.
John DalyChair, Nomination Committee28 November 2017
Britvic plc Annual Report and Accounts 2017 57
Stra
tegic
rep
ort
Govern
ance
Fin
ancia
l sta
tem
ents
Ad
ditio
nal in
form
atio
n
ACCOUNTABILITY AUDIT COMMITTEE REPORT
On behalf of the Audit Committee (the ‘Committee’), I am pleased to present its report for the financial year ended 1 October 2017. The purpose of this report is to describe how the Committee has carried out its responsibilities during the year.
Role of the CommitteeThe Committee’s role is to ensure appropriate oversight and review of the presentation and integrity of the Group’s financial reporting, internal control and risk management, internal audit programmes, changes in regulatory requirements, and the independence and appointment of external auditors. The terms of reference for the Committee can be found on our website at http://britvic.com/investors/corporate-governance/corporate-governance.
To enable the Committee to discharge its responsibilities, discussions on a broad range of topics and reports were held with management, internal audit and the external auditors throughout the year. This provided us with insight into the progress towards the company’s strategic goals, and the challenges and risks and how they are being managed. The activities of the Committee can be found in the table opposite.
The Committee has an open dialogue throughout the year with the Director of Audit and Risk and the external auditors to raise challenges and questions to support understanding whilst sharing experience and an independent perspective.
The most significant matters discussed over the course of the year are described in the report below.
Responsibilities• Reviewing the fi nancial results announcements and
fi nancial statements, and any signifi cant fi nancial reporting, issues and judgements which they may contain.
• Advising the Board on whether the Annual Report and Accounts, taken as a whole, is fair, balanced and understandable and provide the information necessary for shareholders to assess the company’s performance, business model and strategy.
• Ensuring compliance with applicable accounting standards and reviewing the appropriateness of accounting policies and practices in place.
• Assessing the adequacy of the internal control environment and the processes in place to monitor this, including reviewing the activities and performance of the internal audit team.
• Reviewing risk management processes and considering the adequacy of the actions being taken to identify risks and reduce the exposure of the Group to those risks.
• Overseeing the relationship with the external auditors, and make recommendations to the Board in relation to their appointment, remuneration and terms of engagement, independence, objectivity and eff ectiveness.
• Ensuring that appropriate safeguards are in place for individuals to raise issues with the Board where a breach of conduct or compliance, including any fi nancial reporting irregularity, is suspected.
Risk management and internal control The Board has overall responsibility for monitoring the Group’s system of internal control and risk management and for carrying out a review of its effectiveness. In discharging that responsibility, the Board confirms that it has established the procedures necessary to apply the Code, including clear operating procedures, lines of responsibility and delegated authority. These procedures have been in place since the company listed and are regularly reviewed by the Board.
Business performance is managed closely and the Board and the Executive team have established processes, as part of the normal good management of the business, to monitor:
• strategic plan achievement, through a regular review of progress towards strategic objectives;
• maintenance of insurance cover to insure all risk areas of the Group;
• fi nancial performance, within a comprehensive fi nancial planning and accounting framework, including budgeting and forecasting, fi nancial reporting, analysing variances against plan and taking appropriate management action;
• capital investment and asset management performance, with detailed appraisal, authorisation and post investment reviews; and
• the principal risks facing the business, ensuring that the signifi cant risks faced by the Group are being identifi ed, evaluated and appropriately managed, giving consideration to the balance of risk, cost and opportunity.
The Board is supported by the Audit Committee in reviewing the effectiveness of the Group’s risk process and internal control systems. The system of internal control is designed to manage, rather than eliminate, the risk of failure to achieve business objectives and it must be recognised that it can only provide reasonable and not absolute assurance against material misstatement or loss.
Management, with the assistance of the finance function, is responsible for the appropriate maintenance of financial records and processes. This ensures that all financial information is relevant, reliable, in accordance with the applicable laws and regulations, and distributed both internally and externally in a timely manner. A review of the consolidation and financial statements is completed by management to ensure that the financial position and results of the Group are appropriately recorded, circulated to members of the Board and published where appropriate. All financial information published by the Group is subject to the approval of the Board, on the recommendation of the Audit Committee.
Ian McHoulAudit Committee Chairman
58 www.britvic.com
Meetings and composition of the CommitteeThe Committee comprises independent Non-Executive Directors Ben Gordon, Euan Sutherland and Ian McHoul, who is Chair of the Committee. During the year and prior to his appointment as Chairman, John Daly served as a member of the Committee. The Board is satisfied that Ian has recent and relevant financial experience as required by the Code and, further, that the Committee as a whole has competence relevant to the sector in which the company operates.
The Committee meets three times a year: in November and May to review the Annual Report and Accounts and interim report respectively and to consider the external audit findings, and in September to review the activities of the previous year, the plan for the year ahead and to consider any emerging issues. At each meeting the performance and findings of the internal audit team are reviewed and the most recent key risks are considered. The attendance of the Committee for each meeting during the year can be found on page 52. Attendees at each of the meetings are the Committee’s members as well as, by invitation, the Chief Executive Officer, the Chief Financial
Officer, the Director of Financial Controls and Governance, the General Counsel, the Director of Audit and Risk and the external auditor, Ernst & Young LLP.
Each meeting allows time for the Committee to speak with key people without the presence of the others, in particular the external auditors and the Director of Audit and Risk.
Main activities during the year The Committee supports the Board in carrying out its responsibilities in relation to financial reporting, risk management and assessing internal control. It also reviews the effectiveness of the company’s internal audit function and manages the relationship with the external auditors. The Committee ensures that the company has appropriate provision for a confidential and impartial whistleblowing process in line with good practice.
Committee meetings usually take place prior to a Board meeting. The Chair of the Committee subsequently reports on the activities of the Committee and matters of particular relevance to the Board.
The Committee undertook the following activities during the course of the year to discharge its responsibilities:
November – Review of Annual Report and Financial Statements, including changes to accounting policies, key issues and judgements and assessment that the statements are fair, balanced and understandable
– Review of the CFO’s report on accounting issues and judgements
– Review of external audit findings, including any accounting and audit adjustments
– Effectiveness of external auditors, including audit process, independence and objectivity
– Recommendation of the appointment of the external auditors
– Internal audit update, including review of risk management processes
– Review of year end risk and internal control
– Cyber security update
May – Review of interim financial report, including any changes to accounting policies, including the proposed impact of adopting IFRS 15
– Review of the CFO’s report on accounting issues and judgements
– Review of external audit findings, including any accounting and audit adjustments
– Review of the annual external audit plan, including scope of engagement for the year
– Internal audit and risk update and review of risk management processes
– Viability statement update
– Review of treasury policies
– Cyber security update
September – Key accounting judgements for the full year financial statements and any potential issues
– Internal audit and risk update, including approval of audit plan for the next financial year, significant audit findings and progress against previous outstanding audit actions
– Review status of risk management processes, including a review of the viability statement work
– Review progress for adoption of new accounting standard IFRS 15
Fair, balanced and understandable assessment At the request of the Board, the Committee considered whether the 2017 Annual Report and Accounts, taken as a whole, is fair, balanced and understandable and provides the information necessary for shareholders to assess the company’s position and performance, business model and strategy. To enable the Board to have confidence in making this statement, the Committee considered the elements in the table below:
Fair Balanced Understandable
Is the whole story being presented?
Has any sensitive material been omitted that should have been included?
Are the key messages in the narrative reflected in the financial reporting?
Are the KPIs disclosed at an appropriate level based on the financial reporting?
Is there a good level of consistency between the narrative in the front section and the financial reporting in the back section of the report?
Is the Annual Report considered a document fit for shareholders?
Are statutory and adjusted measures explained clearly with appropriate prominence?
Are the key judgements referred to in the narrative reporting and the significant issues reported in the Audit Committee Report consistent with the disclosures of key estimation uncertainties and critical judgements set out in the financial statements?
How do the risks compare with the risks that the auditors plan to include within their report?
Is there a clear and understandable framework to the report?
Are the important messages highlighted appropriately throughout the document?
Is the layout clear with good linkage throughout in a manner which reflects the whole story?
Britvic plc Annual Report and Accounts 2017 59
Stra
tegic
rep
ort
Govern
ance
Fin
ancia
l sta
tem
ents
Ad
ditio
nal in
form
atio
n
To form its opinion, the Committee reflected on the information and reporting it received from management and the external auditors and the discussions that took place during the year. Key considerations for the Committee in 2017 included the following:
• The fi nancial statements comply with all applicable fi nancial reporting standards and any other required regulations.• Material areas of signifi cant judgement have been given due consideration by management and reviewed with the external auditors.• The application of acceptable accounting policies and practices is consistent across the Group.• The disclosures provided are clear, and as required by fi nancial reporting standards.• Reporting and commentary provide a fair and balanced view of company performance.• Any correspondence from regulators received in relation to our fi nancial reporting are considered and disclosures are updated if required.
To ensure that these considerations are met, reviews take place based on information provided by the Chief Financial Officer and his team at each Committee meeting as well as reports from the external auditors based on the outcomes of their half year review and annual audit.
Financial statements and significant issuesSignificant financial and reporting issues considered by the Committee in relation to the 2017 financial statements, and how these were addressed, are shown below:
Revenue recogniti on There has been no change in the Group’s approach to revenue recognition in 2017; however, it remains a key area of focus. The control, accounting and accuracy of long-term discounts, promotional discounts and account development funds are reviewed throughout the year to ensure that they remain consistent and IFRS compliant. Developments in the market have also been discussed with the Committee, where challenging conditions increase the focus of our customers on rebates and promotional spend. The impact of this is continually monitored by management and reviewed with the external auditors to ensure that policy and practice remain consistent. The assessment of the impact of adoption of IFRS 15 has been completed and the company intends to adopt the standard early from the accounting period starting 2 October 2017.
Valuation of goodwill and assets The review of goodwill and intangible assets is based on a calculation of value in use, using cash flow projections based on market measures and financial budgets prepared by senior management and approved by the Board of Directors. The assessment models were reviewed as part of the audit, for which the external auditors, provided reporting to the Committee. The Committee has also considered management reports on potential triggers of impairment and the outcome of sensitivity testing for all areas of the Group, including France, Ireland and Brazil and the potential reversal of prior year impairments. The Committee concluded that it was appropriate to recognise an impairment of the Britvic brands in Ireland of £2.2m, an impairment of the Fruité brand in France of £4.4m and a reversal of impairment in the Ballygowan trademark of £9.2m.
Acquisition accounting Following the acquisition of Bela Ischia and East Coast Suppliers Limited in March 2017, management has calculated the purchase price allocation and resulting goodwill to be accounted for in the Group accounts. The Committee has reviewed and approved the approach to these calculations, including areas of judgement and potential risks. In addition, the Committee has discussed the integration approach, progress and associated one-off costs and is satisfied that the plans, execution and outcome are proportionate to the investment and risk associated with the acquisitions.
Adjusting items In response to the changing landscape around the classification of exceptional items, the Committee agreed that exceptional items no longer be reported as part of the financial statements but rather presented as adjusting items outside of the financial statements. The classification of adjusting items is defined by a group policy, as approved by the Committee, and includes items of significant income and expense which due to their size, nature or frequency merit separate presentation to allow shareholders to understand better the elements of financial performance during the year. Management have reviewed items to be included with the Committee throughout the year to confirm appropriateness.
Derivative and hedging activities The Group has derivative instruments to which hedge accounting is applied and which swap principal and interest of US Private Placement notes. The Committee reviewed reporting on comparisons of valuations to external confirmations and assessment of hedge effectiveness in order to be satisfied with the quality of financial statement disclosures.
Taxation Uncertain tax positions within the Group were reviewed to ensure that the balance sheet provisions are appropriate and the Group effective tax rate is calculated appropriately.
Defined benefit pension scheme valuation The Committee reviewed benchmarks and assumptions that are provided by the Group’s actuaries and used to value the pension liabilities for the four defined benefit schemes. The underlying assumptions based on market conditions and the characteristics of the schemes are reviewed by management and the external auditors and conclusions reported to the Committee. The triennial valuation of the GB scheme was completed in March 2017 and the Committee is satisfied that the resulting financial implications are fairly represented in the financial statements and associated notes.
The Committee subsequently recommended to the Board that, taken as a whole, the Company’s 2017 Annual Report is fair, balanced and understandable and that it provides the information necessary for shareholders to assess the Group’s position and performance, business model and strategy.
AUDIT COMMITTEECONTINUED
60 www.britvic.com
Internal audit and controlThe internal audit function carries out work across the company, acting as a third line of defence. In September, the Committee agreed the audit plan to be undertaken by the internal audit team prior to the start of the year. The audit plan coverage is based on risk, strategic priorities and consideration of the strength of the control environment. The Committee receives a report at each of the Committee meetings and reviews the results of the internal audit reports, looking in detail at any reports where processes and controls require improvement or any reports that are particularly pertinent to delivery of strategic objectives or priorities. Updates are received on progress made against actions agreed from previous audits and on the overall control environment progress related to previous audit areas.
Additional areas were added to the audit plan as required where circumstances gave rise to an increased level of risk and any changes to the agreed audit plan were agreed by the Committee. Detailed updates on specific areas are provided at the request of the Committee.
Risk managementThe risk management process is reviewed at each meeting by the Committee to ensure that it is set up to deliver appropriate risk management across the company.
A particular focus during this year has been on defining the company’s risk appetite. This is an expression of the amount and types of risk that the company is willing to take to achieve its strategic and operational objectives. The Board has agreed these statements which are now being used in decision making processes across the company to define and validate the mitigating activities required to manage our risks. A summary of the key risks and uncertainties to which the business is exposed to can be found on pages 29 to 32.
Viability statementThe Committee reviewed management’s work in conducting a robust assessment of those risks which could threaten the business model and the future viability of the company. This assessment included identifying severe but plausible scenarios for each of our principal risks as well as considering inter-dependencies and scenarios involving multiple risks. Additionally reverse stress testing was carried out, allowing the Committee to assess the circumstances that would render the business unable to pay its liabilities as they fall due. To support the final conclusion on viability, the assessment also took into account the mitigations available to the company to protect against these downside scenarios. Based on this analysis, the Committee recommended to the Board that it could approve and make the Viability Statement on page 33.
Internal controlThe Board is responsible for reviewing the adequacy and effectiveness of the risk management framework and the system of internal controls. The Board has delegated responsibility for this review to the Committee. Management in each business unit are responsible for establishing and maintaining adequate internal controls. Functions such as finance, legal, procurement and quality are responsible for setting out the company policies to be followed by the business units. The Committee, through the internal audit function reviews the adequacy and effectiveness of internal control procedures and identifies any weaknesses and ensures these are addressed within agreed timelines.
The system of internal control has been designed to manage rather than eliminate material risks to the achievement of our strategic and business objectives and can only provide reasonable, and not absolute assurance against material misstatement of loss. The risk management process is reviewed annually by the Committee to ensure that it is set up to deliver appropriate risk management across the group.
The risk management process is continually improving, in particular in relation to embedding across new and developing areas of the business. The Committee believe that the improvements will continue to strengthen the way that the business understands and manages risk.
WhistleblowingThe Group’s ‘whistleblowing’ policy contains arrangements for an independent external service provider to receive, in confidence, complaints on accounting, auditing, risk, internal control and related matters for reporting to the Committee as appropriate. Updates are provided to the Committee at each meeting.
Effectiveness of external audit There are a number of areas that the Committee considers in relation to the effectiveness of the external auditors: their performance in discharging the audit and the interim review, their independence and objectivity, and their reappointment and remuneration. The Chairman of the Committee has regular contact with the external audit partner outside of Committee meetings and without the management of the business present.
The external auditors, Ernst & Young LLP (‘EY’), provided the Committee with their plan for undertaking the year end audit which highlighted the proposed approach and scope of the audit for the coming year and identified the key areas of audit risk, including the audit approach for these areas. The Committee reviewed and appropriately challenged the basis for these before agreeing the proposed approach and scope of the external audit.
EY prepared a detailed report of their audit findings at the year end, which they took the Committee through at the meeting in November 2017. The findings were reviewed and discussed in detail by the Committee, particularly in relation to the areas highlighted above. A similar review of the external auditors’ report of their findings at the half year review is undertaken by the Committee. As part of this review the Committee questioned and challenged the work undertaken, the findings and the key assumptions made, with particular attention to the areas of audit risk identified. The Committee also considers the effectiveness of the audit in relation to the robustness of the audit, the quality of the audit delivery and the quality of the people and service and has concluded that EY remain effective as external auditors.
Audit tendering and CMA Order ComplianceFollowing a comprehensive tender carried out in 2016, EY have remained as the company’s external auditors. The Committee confirms compliance with the Statutory Audit Services for Large Companies Market Investigation (Mandatory Use of Competitive Tender Processes and Audit Committee Responsibilities) Order 2014.
Independence and reappointment The Committee reviews the independence of the auditors throughout the year. The external auditors are required to rotate the lead audit partner every five years. The current lead audit partner began his tenure for the financial year ended 30 September 2013 and in keeping with audit partner rotation, a new partner will lead the FY18 audit. The incoming lead audit partner has shadowed key meetings during the current financial year. Based on the Committee’s recommendation, the Board is proposing that EY be reappointed to office at the AGM in January 2018.
Non-audit feesThe Group has a policy regarding the provision of non-audit services by the external auditors. Any non-audit services provided must be pre-approved by the Committee unless the activity will have a total value of less than £5,000 and falls within the allowed services defined by FRC guidance.
Control over total non-audit fees is also exercised by reviewing spend on all activities proposed or provided by the external auditors and we can confirm that we are significantly below a 1:1 ratio in this financial year as disclosed in note 7 to the financial statements on page 110, and well within the FRC guidance of the 70% cap that will be required from 2019.
Ian McHoulChair, Audit Committee28 November 2017
Britvic plc Annual Report and Accounts 2017 61
Stra
tegic
rep
ort
Govern
ance
Fin
ancia
l sta
tem
ents
Ad
ditio
nal in
form
atio
n
Meetings and Composition of the CommitteeThe Committee comprises Ben Gordon, Ian McHoul, John Daly and myself, as Chair. The company Chairman and Chief Executive Officer (who may attend by invitation) do not attend meetings when their individual remuneration is discussed. The Committee meets as necessary and at least three times a year. As Chair, I report on the outcome of the Committee’s meetings to the Board.
Main activities during the yearFull details of the Committee’s responsibilities and of its activities are set out in the Directors’ Remuneration Report on page 76.
Committee evaluationThe Committee was included in the Board evaluation performed during the year, the details of which can be found on pages 54 and 55.
In my first year as the Chair of the Remuneration Committee (‘Committee’) I am pleased to present the Directors’ Remuneration Report for the financial year ended 1 October 2017. I would like to thank John Daly for leading the Committee prior to my appointment in September 2017 and the other members for welcoming me into my new role. I would also like to take this opportunity to say how pleased the Committee was to continue to receive a very positive response at the January 2017 AGM with 94% votes ‘For’ the Annual Report on Remuneration. The Committee remains very mindful of the current focus on executive pay and its implications across all our stakeholders and so I trust the actions taken over the course of the year and what is disclosed in the Remuneration Report reflect that this responsibility is very much at the forefront of the Committee’s decision making.
The contents of this annual statement provide an overview of the new Remuneration Policy and remuneration outcomes for the financial year ended 1 October 2017 and a summary of the business context in which those outcomes have been determined.
The remainder of the report sets out:
• An ‘at a glance’ summary of the new Remuneration Policy that will be implemented in 2017/18 subject to shareholder approval at the 2018 AGM and the remuneration outcomes for 2016/17. Pages 64 to 66
• The proposed Remuneration Policy for Directors to be voted on by shareholders at the AGM in January 2018. Pages 67 to 74
• The Annual Report on remuneration, along with the Chair’s statement, is subject to shareholder vote at the January 2018 AGM and sets out the detail of payments made to directors in respect of the fi nancial year ended 1 October 2017. Page 84
2017 Remuneration Policy review2016/17 was the final year of the current Remuneration Policy that was approved by our shareholders at the January 2015 AGM. Throughout 2017, the Committee conducted a comprehensive review of the executives’ remuneration arrangements and considered what changes, if any, should be made for the next policy cycle. In conducting this review the Committee was very mindful of the evolving executive pay environment and
DIRECTORS’ REMUNERATION REPORT
the expectations of shareholders, government and the public for how directors should be paid. I was pleased as part of this process to consult with our largest shareholders to understand their points of view and feedback on our remuneration proposals. These have been taken into consideration where possible in the new Remuneration Policy presented in this Remuneration Report.
The result of this review was that the features of the previous Remuneration Policy remain consistent and aligned with our remuneration principles and strategic objectives as a business. The proposed Remuneration Policy is therefore largely unchanged except for a number of amendments to align the remuneration structure with best practice expected by our shareholders and wider stakeholders as follows:
• Introduction of a two year post vesting holding period to the Executive Share Option Plan (ESOP) and Performance Share Plan (PSP) awards under the Long-term Incentive Plan (LTIP);
• Increase the CFO’s minimum shareholding requirement to 200% of salary (from 100%).
• Limit the use of additional LTIP awards on recruitment to only replace awards foregone from the previous employer on a like-for-like basis.
The LTIP will continue to consist of share options under the ESOP and performance shares under the PSP. The purpose of the LTIP is to motivate and incentivise the delivery of sustained, long-term performance and encourage share price and dividend growth over the performance period of the awards.
The Committee noted that there is a drive from certain shareholders for simplification of long-term incentives by consolidating LTIPs into a single vehicle. The Committee is sympathetic to this point of view, however felt that to continue with the current balance of ESOP and PSP given its relevance and link to the strategy was best to align participants with our shareholders and incentivises long-term shareholder value creation. The Committee also noted that emerging shareholder guidance and the Government’s response to the green paper on Corporate Governance Reform encouraged flexibility for companies to design and operate LTIPs that were most relevant to them. The Committee is therefore confident that the continuation of the current LTIP model is the most appropriate to align executives with the long-term strategy of the business.
Sue ClarkChair of the Remuneration Committee
62 www.britvic.com
It is also intended that the performance measures under the LTIP will remain the same. The Committee will retain the flexibility to select the performance measures it considers appropriate each year but intends to operate the same performance measures as currently in place and would only make significant changes following consultation with our shareholders. For clarity:
• ESOP award vesting will be dependent 100% on earnings per share (‘EPS’) performance; and
• PSP award vesting will be dependant 75% on EPS growth and 25% on total shareholder return (‘TSR’) performance relative to a peer group.
EPS growth is one of the business’s key KPIs and performance against this metric will drive long-term shareholder value. The Committee reviewed the target range of 3% to 8% p.a. EPS growth to achieve a payout from threshold to maximum and determined that it remains appropriate and stretching given the business’s internal expectations, consensus estimates and the current economic environment, ensuring that maximum payout can only be achieved where exceptional performance is delivered to our shareholders.
Relative TSR will continue to be measured against a bespoke group of companies in similar industries (no change to the peer group proposed) as the Committee considered it important that executives only receive a portion of value through the LTIP for outperforming peer companies.
Return on invested capital (‘ROIC’) over the performance period will continue to be considered by the Committee when assessing the outcome of the LTIP to ensure that it remains appropriate relative to the EPS growth delivered.
The annual bonus will continue to be payable fully in cash. This maintains an appropriate overall balance of remuneration based on long and nearer term performance.
Changes to the CFO’s remuneration packageWhen the Board appointed the CFO in November 2015, his total package was set significantly below that of his predecessor (circa 18%) and in line with the lower quartile of our benchmarking peer group (based on the top half of the FTSE 250). Specifically, his base salary was set at a 10% discount to the previous CFO, PSP was set at a maximum of 80% of salary (vs 100%) and the ESOP set at a maximum of 200% of salary (vs 250%). Further, no buy-out awards were made to the new CFO on appointment to compensate for awards forgone from his previous employer. This approach reflects the Committee’s commitment to paying only what is required to secure the best talent within the business and this remains our general philosophy in setting pay on recruitment.
The CFO’s package was set on the basis that the Committee would keep it under review and may award increases over the first three years following appointment that exceeded that of the wider workforce (as disclosed in previous remuneration reports) subject to the CFO’s development and performance in role. The Committee noted that the CFO is now fully established in his role and is critical to the execution of Britvic’s strategy and therefore determined it is appropriate to make changes to the CFO’s pay to recognise his performance to date and to ensure that his package appropriately reflects his experience and importance to the business. The Committee therefore intends to:
• Increase the CFO’s base salary to £375,000 from £340,000. This consists of an 8% adjustment to refl ect development and performance in role since appointment and a 2% infl ationary increase in line with that awarded to the wider UK employee population; and
• Increase the CFO’s maximum PSP opportunity from 80% of salary to 100% of salary.
The above changes result in an increase of 16% to the overall target remuneration of the CFO and we would note that this is still lower than the total target pay of the previous CFO and moderately positioned below median versus our peer group.
The Committee is mindful of the sensitivity to large increases in base pay levels and considered the proposed approach carefully in this context. The intention of the salary increase is to bring the CFO’s salary to a level that the Committee considers appropriate given his performance and importance to the business, also noting that the CFO has not received a salary increase since his appointment; this illustrates the Committee’s general commitment to restraint, only making significant changes on a targeted basis where these are felt necessary.
The moderate increase in PSP to bring the CFO in line with the maximum allowed for under the Remuneration Policy recognises his experience in role and will provide stronger alignment for the CFO with the long-term performance of the business and our shareholders. We would note that in making the changes set out above, the CFO’s ESOP maximum opportunity will remain below that allowed for under the Remuneration Policy and that of the previous incumbent.
Given these changes and as set out above, the Committee has concluded that the minimum shareholding requirements for the CFO will be increased to 200% of base salary from the current 100%. This recognises the additional potential value the CFO may receive under the LTIP, improves his alignment with shareholders and is in line with best practice.
Business performance and remuneration outcomes for the yearAs detailed in the Chief Financial Officer’s review, the overall performance of the business has been strong. This has resulted in the following incentive outcomes:
• Annual bonus pay-outs for Executive Directors at 82% of the maximum opportunity, in particular due to strong profi t and cash fl ow performance.
• The PSP awarded in 2014 will vest at 56.2% of the maximum opportunity refl ecting sustained EPS growth over the period and relative TSR performance over the last three years.
• The ESOP awarded in 2014 will vest at 61.1% of the maximum opportunity due to strong EPS growth performance over the last three years.
In line with the remuneration reporting regulations, details of the performance targets and actual achievement against these are set out in the Annual Report on Remuneration.
Additionally, the Committee have agreed to increase the CEO’s base salary from £600,000 to £612,000, an inflationary increase of 2% in line with the 2% awarded to the wider UK employee population.
The Committee is aware of the increasing interest from shareholders and governance organisations on the remit of Remuneration Committee’s with regards to the wider employee population including the publication of additional data such as the ratio of CEO pay to the all employee population. The Committee will review its remit over 2018 in view of evolving regulatory requirements and best practice to ensure it meets the new requirements when they are introduced.
I look forward to receiving your support on the new Remuneration Policy and Annual Report on Remuneration at the January 2018 AGM. Should you have any questions relating to our approach to executive remuneration, please feel free to contact me at [email protected].
Sue Clark Chair of the Remuneration Committee
Britvic plc Annual Report and Accounts 2017 63
Strate
gic re
port
Gove
rnan
ceFin
ancial state
ments
Ad
ditio
nal info
rmatio
n
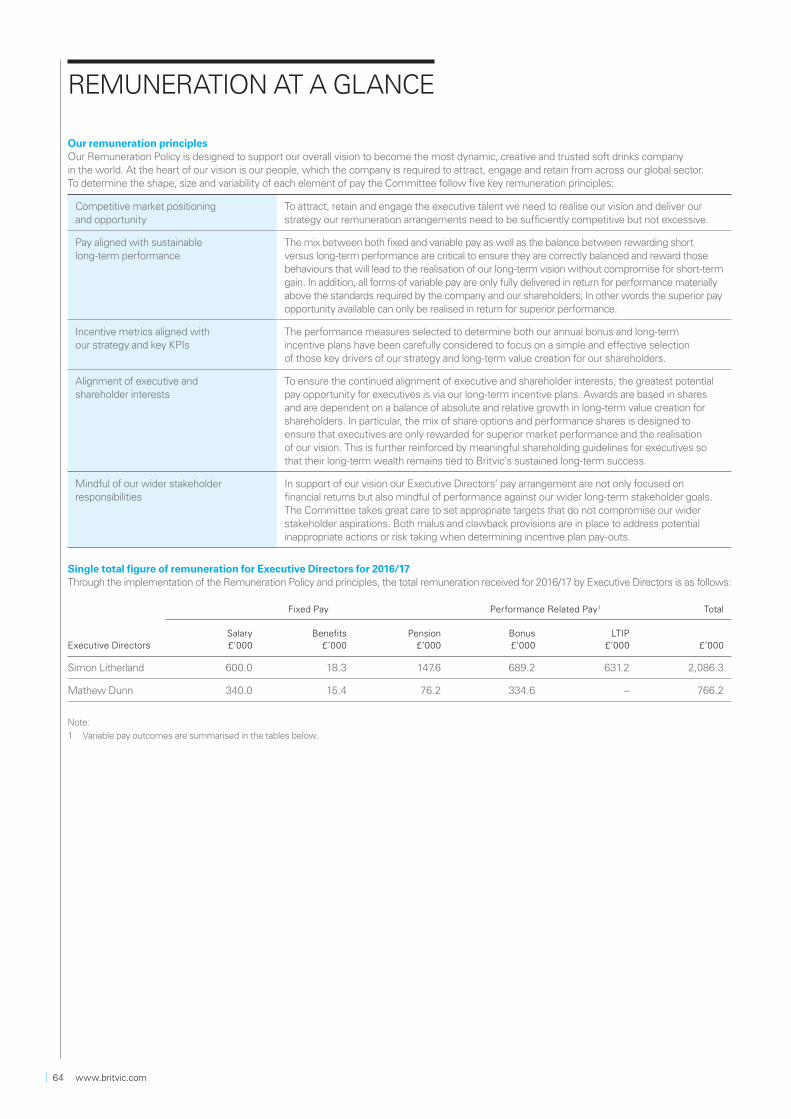
Our remuneration principlesOur Remuneration Policy is designed to support our overall vision to become the most dynamic, creative and trusted soft drinks company in the world. At the heart of our vision is our people, which the company is required to attract, engage and retain from across our global sector. To determine the shape, size and variability of each element of pay the Committee follow five key remuneration principles:
Competitive market positioning and opportunity
To attract, retain and engage the executive talent we need to realise our vision and deliver our strategy our remuneration arrangements need to be sufficiently competitive but not excessive.
Pay aligned with sustainable long-term performance
The mix between both fixed and variable pay as well as the balance between rewarding short versus long-term performance are critical to ensure they are correctly balanced and reward those behaviours that will lead to the realisation of our long-term vision without compromise for short-term gain. In addition, all forms of variable pay are only fully delivered in return for performance materially above the standards required by the company and our shareholders; In other words the superior pay opportunity available can only be realised in return for superior performance.
Incentive metrics aligned with our strategy and key KPIs
The performance measures selected to determine both our annual bonus and long-term incentive plans have been carefully considered to focus on a simple and effective selection of those key drivers of our strategy and long-term value creation for our shareholders.
Alignment of executive and shareholder interests
To ensure the continued alignment of executive and shareholder interests, the greatest potential pay opportunity for executives is via our long-term incentive plans. Awards are based in shares and are dependent on a balance of absolute and relative growth in long-term value creation for shareholders. In particular, the mix of share options and performance shares is designed to ensure that executives are only rewarded for superior market performance and the realisation of our vision. This is further reinforced by meaningful shareholding guidelines for executives so that their long-term wealth remains tied to Britvic’s sustained long-term success.
Mindful of our wider stakeholder responsibilities
In support of our vision our Executive Directors’ pay arrangement are not only focused on financial returns but also mindful of performance against our wider long-term stakeholder goals. The Committee takes great care to set appropriate targets that do not compromise our wider stakeholder aspirations. Both malus and clawback provisions are in place to address potential inappropriate actions or risk taking when determining incentive plan pay-outs.
Single total figure of remuneration for Executive Directors for 2016/17Through the implementation of the Remuneration Policy and principles, the total remuneration received for 2016/17 by Executive Directors is as follows:
Fixed Pay Performance Related Pay1 Total
Executive DirectorsSalary £’000
Benefits £’000
Pension £’000
Bonus £’000
LTIP £’000 £’000
Simon Litherland 600.0 18.3 147.6 689.2 631.2 2,086.3
Mathew Dunn 340.0 15.4 76.2 334.6 – 766.2
Note:
1 Variable pay outcomes are summarised in the tables below.
REMUNERATION AT A GLANCE
64 www.britvic.com
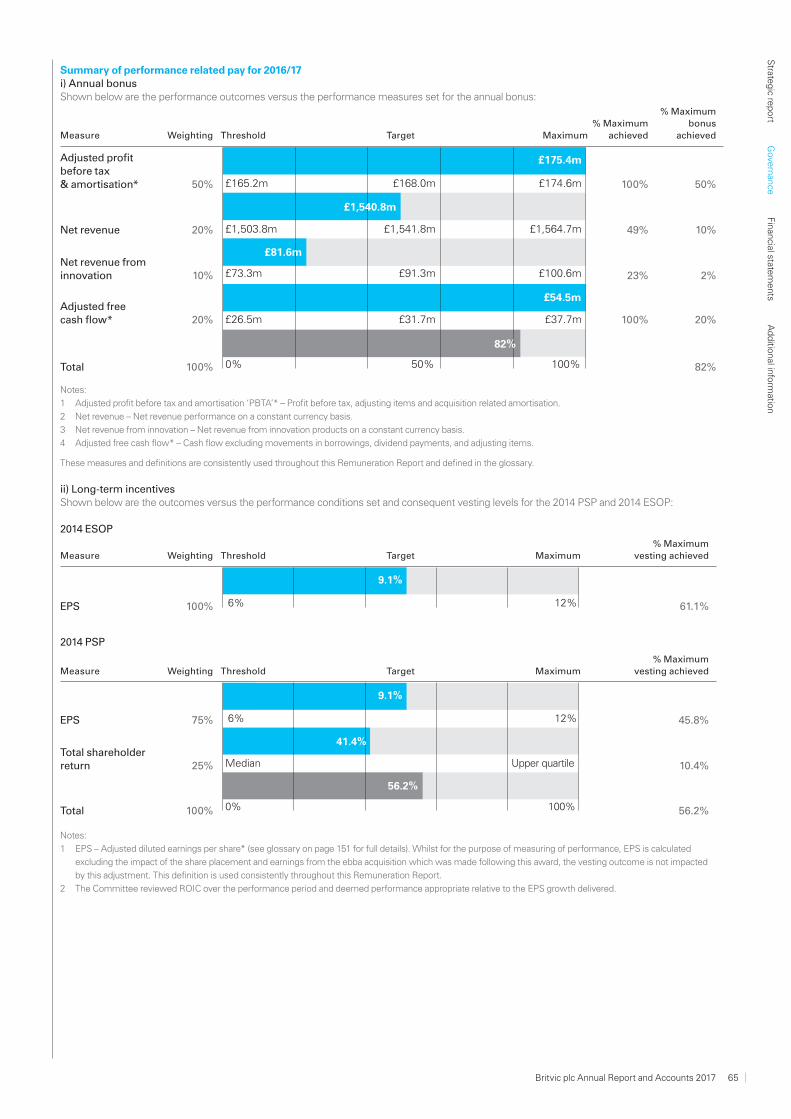
Summary of performance related pay for 2016/17i) Annual bonusShown below are the performance outcomes versus the performance measures set for the annual bonus:
Measure Weighting Threshold Target Maximum% Maximum
achieved
% Maximum bonus
achieved
Adjusted profit before tax & amortisation* 50%
£175.4m
£1,540.8m
£81.6m
82%
£165.2m £168.0m £174.6m
£1,503.8m £1,541.8m £1,564.7m
£73.3m £91.3m £100.6m
£26.5m £31.7m £37.7m
0% 50% 100%
£54.5m
100% 50%
Net revenue 20% 49% 10%
Net revenue from innovation 10% 23% 2%
Adjusted free cash flow* 20% 100% 20%
Total 100% 82%
Notes:
1 Adjusted profit before tax and amortisation ‘PBTA’* – Profit before tax, adjusting items and acquisition related amortisation.
2 Net revenue – Net revenue performance on a constant currency basis.
3 Net revenue from innovation – Net revenue from innovation products on a constant currency basis.
4 Adjusted free cash flow* – Cash flow excluding movements in borrowings, dividend payments, and adjusting items.
These measures and definitions are consistently used throughout this Remuneration Report and defined in the glossary.
ii) Long-term incentivesShown below are the outcomes versus the performance conditions set and consequent vesting levels for the 2014 PSP and 2014 ESOP:
2014 ESOP
Measure Weighting Threshold Target Maximum% Maximum
vesting achieved
EPS 100%
9.1%
6% 12% 61.1%
2014 PSP
Measure Weighting Threshold Target Maximum% Maximum
vesting achieved
EPS 75%
9.1%
6% 12%
41.4%
56.2%
Median Upper quartile
0% 100%
45.8%
Total shareholder return 25% 10.4%
Total 100% 56.2%
Notes:
1 EPS – Adjusted diluted earnings per share* (see glossary on page 151 for full details). Whilst for the purpose of measuring of performance, EPS is calculated
excluding the impact of the share placement and earnings from the ebba acquisition which was made following this award, the vesting outcome is not impacted
by this adjustment. This definition is used consistently throughout this Remuneration Report.
2 The Committee reviewed ROIC over the performance period and deemed performance appropriate relative to the EPS growth delivered.
Britvic plc Annual Report and Accounts 2017 65
Strate
gic re
port
Gove
rnan
ceFin
ancial state
ments
Ad
ditio
nal info
rmatio
n
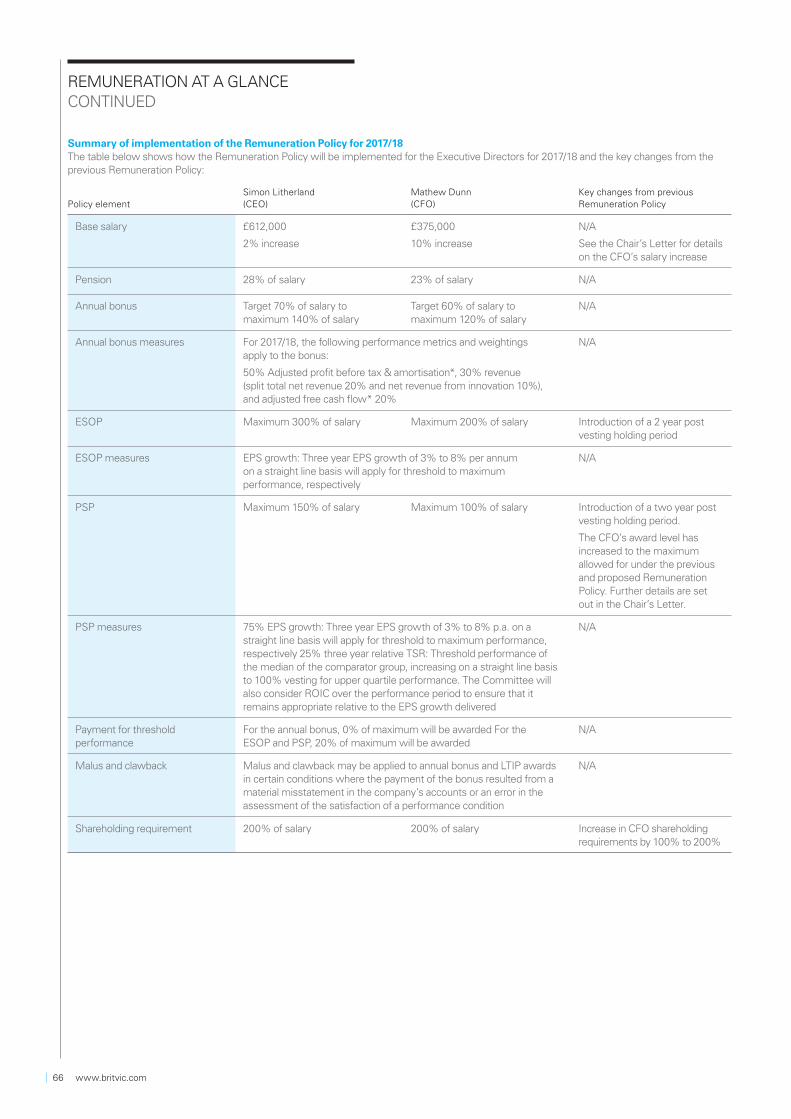
Summary of implementation of the Remuneration Policy for 2017/18The table below shows how the Remuneration Policy will be implemented for the Executive Directors for 2017/18 and the key changes from the previous Remuneration Policy:
Policy elementSimon Litherland (CEO)
Mathew Dunn (CFO)
Key changes from previous Remuneration Policy
Base salary £612,000
2% increase
£375,000
10% increase
N/A
See the Chair’s Letter for details on the CFO’s salary increase
Pension 28% of salary 23% of salary N/A
Annual bonus Target 70% of salary to maximum 140% of salary
Target 60% of salary tomaximum 120% of salary
N/A
Annual bonus measures For 2017/18, the following performance metrics and weightings apply to the bonus:
50% Adjusted profit before tax & amortisation*, 30% revenue (split total net revenue 20% and net revenue from innovation 10%), and adjusted free cash flow* 20%
N/A
ESOP Maximum 300% of salary Maximum 200% of salary Introduction of a 2 year postvesting holding period
ESOP measures EPS growth: Three year EPS growth of 3% to 8% per annum on a straight line basis will apply for threshold to maximum performance, respectively
N/A
PSP Maximum 150% of salary Maximum 100% of salary Introduction of a two year postvesting holding period.
The CFO’s award level has increased to the maximum allowed for under the previous and proposed Remuneration Policy. Further details are set out in the Chair’s Letter.
PSP measures 75% EPS growth: Three year EPS growth of 3% to 8% p.a. on a straight line basis will apply for threshold to maximum performance, respectively 25% three year relative TSR: Threshold performance of the median of the comparator group, increasing on a straight line basis to 100% vesting for upper quartile performance. The Committee will also consider ROIC over the performance period to ensure that it remains appropriate relative to the EPS growth delivered
N/A
Payment for threshold performance
For the annual bonus, 0% of maximum will be awarded For the ESOP and PSP, 20% of maximum will be awarded
N/A
Malus and clawback Malus and clawback may be applied to annual bonus and LTIP awards in certain conditions where the payment of the bonus resulted from a material misstatement in the company’s accounts or an error in the assessment of the satisfaction of a performance condition
N/A
Shareholding requirement 200% of salary 200% of salary Increase in CFO shareholding requirements by 100% to 200%
REMUNERATION AT A GLANCECONTINUED
66 www.britvic.com
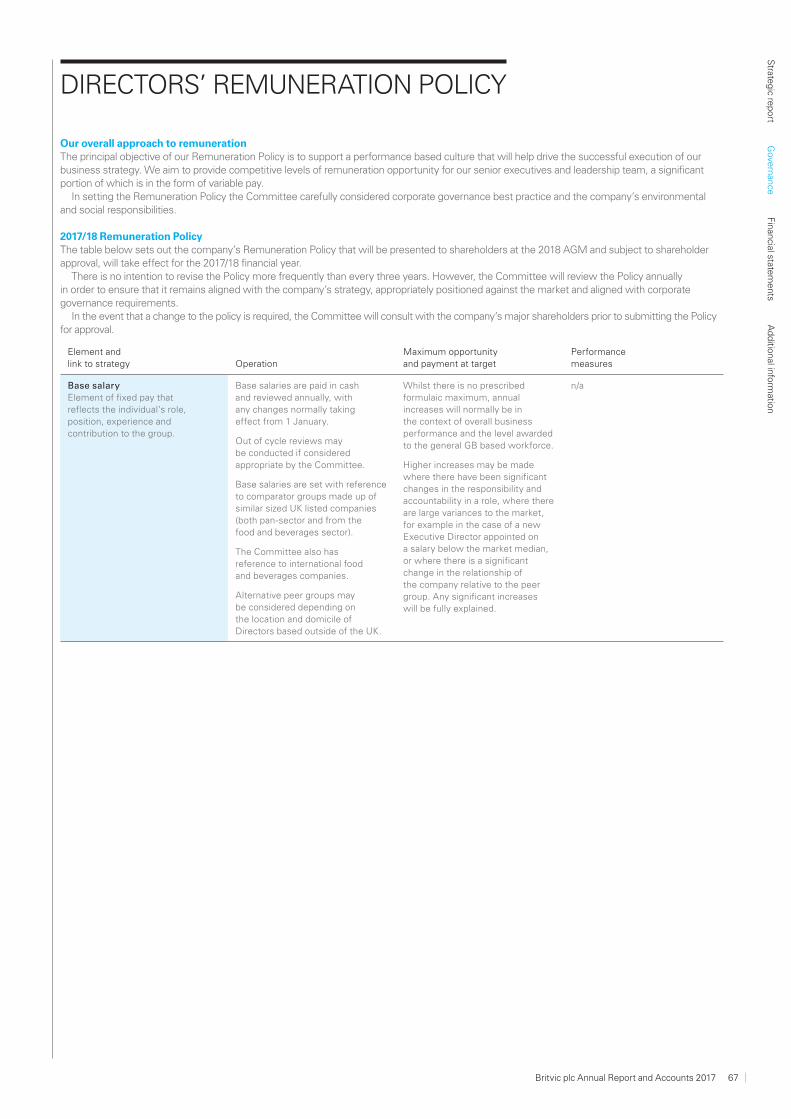
Our overall approach to remunerationThe principal objective of our Remuneration Policy is to support a performance based culture that will help drive the successful execution of our business strategy. We aim to provide competitive levels of remuneration opportunity for our senior executives and leadership team, a significant portion of which is in the form of variable pay.
In setting the Remuneration Policy the Committee carefully considered corporate governance best practice and the company’s environmental and social responsibilities.
2017/18 Remuneration Policy The table below sets out the company’s Remuneration Policy that will be presented to shareholders at the 2018 AGM and subject to shareholder approval, will take effect for the 2017/18 financial year.
There is no intention to revise the Policy more frequently than every three years. However, the Committee will review the Policy annually in order to ensure that it remains aligned with the company’s strategy, appropriately positioned against the market and aligned with corporate governance requirements.
In the event that a change to the policy is required, the Committee will consult with the company’s major shareholders prior to submitting the Policy for approval.
Element and link to strategy Operation
Maximum opportunity and payment at target
Performancemeasures
Base salary Element of fixed pay that reflects the individual’s role, position, experience and contribution to the group.
Base salaries are paid in cash and reviewed annually, with any changes normally taking effect from 1 January.
Out of cycle reviews may be conducted if considered appropriate by the Committee.
Base salaries are set with reference to comparator groups made up of similar sized UK listed companies (both pan-sector and from the food and beverages sector).
The Committee also has reference to international food and beverages companies.
Alternative peer groups may be considered depending on the location and domicile of Directors based outside of the UK.
Whilst there is no prescribed formulaic maximum, annual increases will normally be in the context of overall business performance and the level awarded to the general GB based workforce.
Higher increases may be made where there have been significant changes in the responsibility and accountability in a role, where there are large variances to the market, for example in the case of a new Executive Director appointed on a salary below the market median, or where there is a significant change in the relationship of the company relative to the peer group. Any significant increases will be fully explained.
n/a
DIRECTORS’ REMUNERATION POLICY
Britvic plc Annual Report and Accounts 2017 67
Strate
gic re
port
Gove
rnan
ceFin
ancial state
ments
Ad
ditio
nal info
rmatio
n
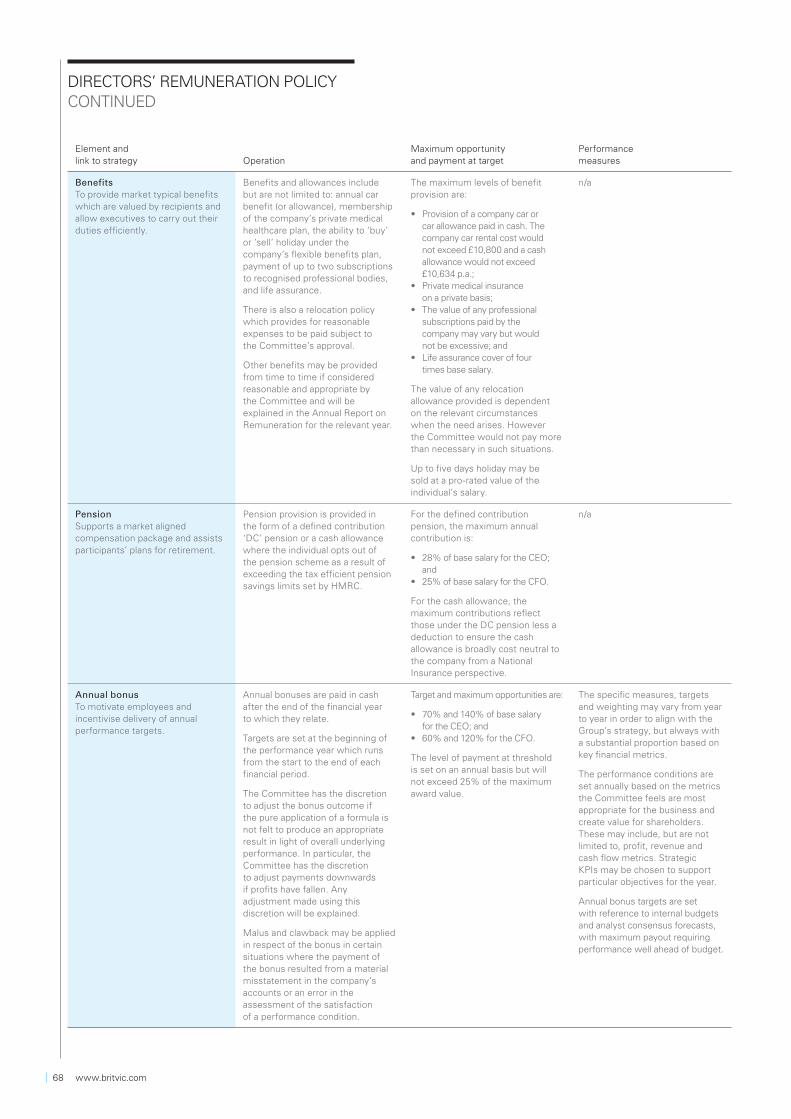
Element and link to strategy Operation
Maximum opportunity and payment at target
Performancemeasures
Benefits To provide market typical benefits which are valued by recipients and allow executives to carry out their duties efficiently.
Benefits and allowances include but are not limited to: annual car benefit (or allowance), membership of the company’s private medical healthcare plan, the ability to ‘buy’ or ’sell’ holiday under the company’s flexible benefits plan, payment of up to two subscriptions to recognised professional bodies, and life assurance.
There is also a relocation policy which provides for reasonable expenses to be paid subject to the Committee’s approval.
Other benefits may be provided from time to time if considered reasonable and appropriate by the Committee and will be explained in the Annual Report on Remuneration for the relevant year.
The maximum levels of benefit provision are:
• Provision of a company car or car allowance paid in cash. The company car rental cost would not exceed £10,800 and a cash allowance would not exceed £10,634 p.a.;
• Private medical insurance on a private basis;
• The value of any professional subscriptions paid by the company may vary but would not be excessive; and
• Life assurance cover of four times base salary.
The value of any relocation allowance provided is dependent on the relevant circumstances when the need arises. However the Committee would not pay more than necessary in such situations.
Up to five days holiday may be sold at a pro-rated value of the individual’s salary.
n/a
PensionSupports a market aligned compensation package and assists participants’ plans for retirement.
Pension provision is provided in the form of a defined contribution ‘DC’ pension or a cash allowance where the individual opts out of the pension scheme as a result of exceeding the tax efficient pension savings limits set by HMRC.
For the defined contribution pension, the maximum annual contribution is:
• 28% of base salary for the CEO; and
• 25% of base salary for the CFO.
For the cash allowance, the maximum contributions reflect those under the DC pension less a deduction to ensure the cash allowance is broadly cost neutral to the company from a National Insurance perspective.
n/a
Annual bonus To motivate employees and incentivise delivery of annual performance targets.
Annual bonuses are paid in cash after the end of the financial year to which they relate.
Targets are set at the beginning of the performance year which runs from the start to the end of each financial period.
The Committee has the discretion to adjust the bonus outcome if the pure application of a formula is not felt to produce an appropriate result in light of overall underlying performance. In particular, the Committee has the discretion to adjust payments downwards if profits have fallen. Any adjustment made using this discretion will be explained.
Malus and clawback may be applied in respect of the bonus in certain situations where the payment of the bonus resulted from a material misstatement in the company’s accounts or an error in the assessment of the satisfaction of a performance condition.
Target and maximum opportunities are:
• 70% and 140% of base salary for the CEO; and
• 60% and 120% for the CFO.
The level of payment at threshold is set on an annual basis but will not exceed 25% of the maximum award value.
The specific measures, targets and weighting may vary from year to year in order to align with the Group’s strategy, but always with a substantial proportion based on key financial metrics.
The performance conditions are set annually based on the metrics the Committee feels are most appropriate for the business and create value for shareholders. These may include, but are not limited to, profit, revenue and cash flow metrics. Strategic KPIs may be chosen to support particular objectives for the year.
Annual bonus targets are set with reference to internal budgets and analyst consensus forecasts, with maximum payout requiring performance well ahead of budget.
DIRECTORS’ REMUNERATION POLICYCONTINUED
68 www.britvic.com
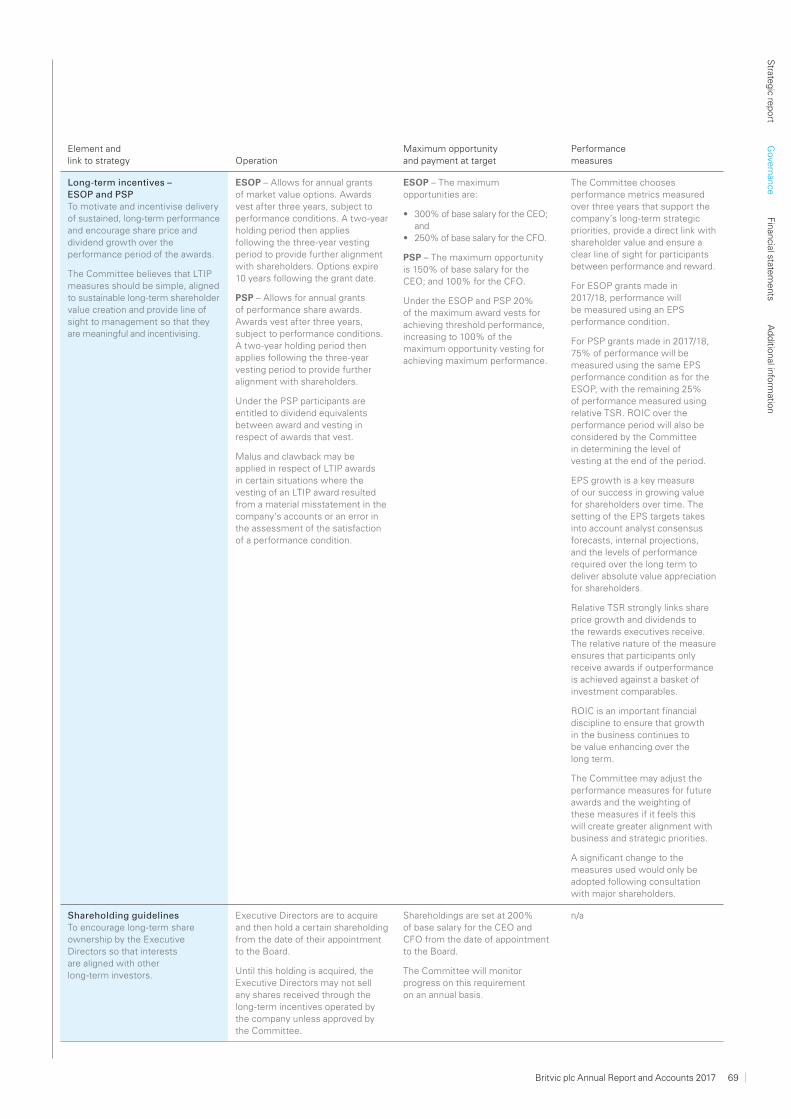
Element and link to strategy Operation
Maximum opportunity and payment at target
Performancemeasures
Long-term incentives – ESOP and PSPTo motivate and incentivise delivery of sustained, long-term performance and encourage share price and dividend growth over the performance period of the awards.
The Committee believes that LTIP measures should be simple, aligned to sustainable long-term shareholder value creation and provide line of sight to management so that they are meaningful and incentivising.
ESOP – Allows for annual grants of market value options. Awards vest after three years, subject to performance conditions. A two-year holding period then applies following the three-year vesting period to provide further alignment with shareholders. Options expire 10 years following the grant date.
PSP – Allows for annual grants of performance share awards. Awards vest after three years, subject to performance conditions. A two-year holding period then applies following the three-year vesting period to provide further alignment with shareholders.
Under the PSP participants are entitled to dividend equivalents between award and vesting in respect of awards that vest.
Malus and clawback may be applied in respect of LTIP awards in certain situations where the vesting of an LTIP award resulted from a material misstatement in the company’s accounts or an error in the assessment of the satisfaction of a performance condition.
ESOP – The maximum opportunities are:
• 300% of base salary for the CEO; and
• 250% of base salary for the CFO.
PSP – The maximum opportunity is 150% of base salary for the CEO; and 100% for the CFO.
Under the ESOP and PSP 20% of the maximum award vests for achieving threshold performance, increasing to 100% of the maximum opportunity vesting for achieving maximum performance.
The Committee chooses performance metrics measured over three years that support the company’s long-term strategic priorities, provide a direct link with shareholder value and ensure a clear line of sight for participants between performance and reward.
For ESOP grants made in 2017/18, performance will be measured using an EPS performance condition.
For PSP grants made in 2017/18, 75% of performance will be measured using the same EPS performance condition as for the ESOP, with the remaining 25% of performance measured using relative TSR. ROIC over the performance period will also be considered by the Committee in determining the level of vesting at the end of the period.
EPS growth is a key measure of our success in growing value for shareholders over time. The setting of the EPS targets takes into account analyst consensus forecasts, internal projections, and the levels of performance required over the long term to deliver absolute value appreciation for shareholders.
Relative TSR strongly links share price growth and dividends to the rewards executives receive. The relative nature of the measure ensures that participants only receive awards if outperformance is achieved against a basket of investment comparables.
ROIC is an important financial discipline to ensure that growth in the business continues to be value enhancing over the long term.
The Committee may adjust the performance measures for future awards and the weighting of these measures if it feels this will create greater alignment with business and strategic priorities.
A significant change to the measures used would only be adopted following consultation with major shareholders.
Shareholding guidelinesTo encourage long-term share ownership by the Executive Directors so that interests are aligned with other long-term investors.
Executive Directors are to acquire and then hold a certain shareholding from the date of their appointment to the Board.
Until this holding is acquired, the Executive Directors may not sell any shares received through the long-term incentives operated by the company unless approved by the Committee.
Shareholdings are set at 200% of base salary for the CEO and CFO from the date of appointment to the Board.
The Committee will monitor progress on this requirementon an annual basis.
n/a
Britvic plc Annual Report and Accounts 2017 69
Strate
gic re
port
Gove
rnan
ceFin
ancial state
ments
Ad
ditio
nal info
rmatio
n
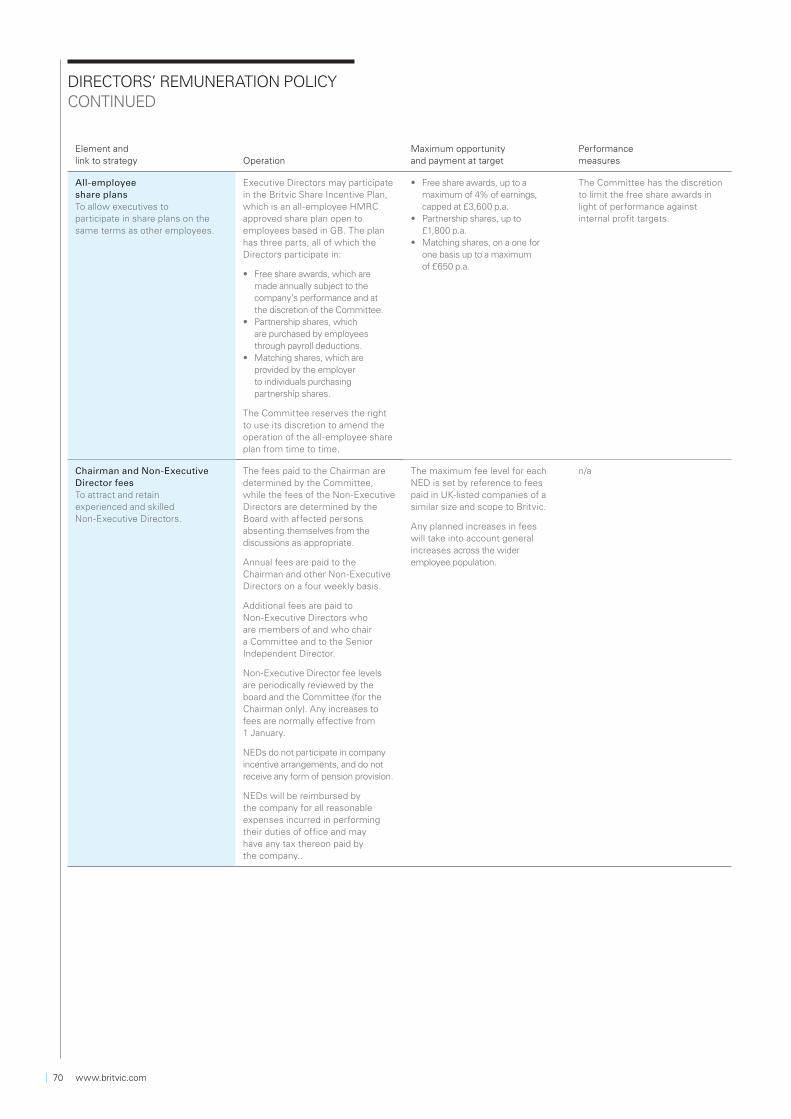
Element and link to strategy Operation
Maximum opportunity and payment at target
Performancemeasures
All-employee share plansTo allow executives to participate in share plans on the same terms as other employees.
Executive Directors may participate in the Britvic Share Incentive Plan, which is an all-employee HMRC approved share plan open to employees based in GB. The plan has three parts, all of which the Directors participate in:
• Free share awards, which are made annually subject to the company’s performance and at the discretion of the Committee.
• Partnership shares, which are purchased by employees through payroll deductions.
• Matching shares, which are provided by the employer to individuals purchasing partnership shares.
The Committee reserves the right to use its discretion to amend the operation of the all-employee share plan from time to time.
• Free share awards, up to a maximum of 4% of earnings, capped at £3,600 p.a.
• Partnership shares, up to £1,800 p.a.
• Matching shares, on a one for one basis up to a maximum of £650 p.a.
The Committee has the discretion to limit the free share awards in light of performance against internal profit targets.
Chairman and Non-Executive Director feesTo attract and retain experienced and skilled Non-Executive Directors.
The fees paid to the Chairman are determined by the Committee, while the fees of the Non-Executive Directors are determined by the Board with affected persons absenting themselves from the discussions as appropriate.
Annual fees are paid to the Chairman and other Non-Executive Directors on a four weekly basis.
Additional fees are paid to Non-Executive Directors who are members of and who chair a Committee and to the Senior Independent Director.
Non-Executive Director fee levels are periodically reviewed by the board and the Committee (for the Chairman only). Any increases to fees are normally effective from 1 January.
NEDs do not participate in company incentive arrangements, and do not receive any form of pension provision.
NEDs will be reimbursed by the company for all reasonable expenses incurred in performing their duties of office and may have any tax thereon paid by the company..
The maximum fee level for each NED is set by reference to fees paid in UK-listed companies of a similar size and scope to Britvic.
Any planned increases in fees will take into account general increases across the wider employee population.
n/a
DIRECTORS’ REMUNERATION POLICYCONTINUED
70 www.britvic.com
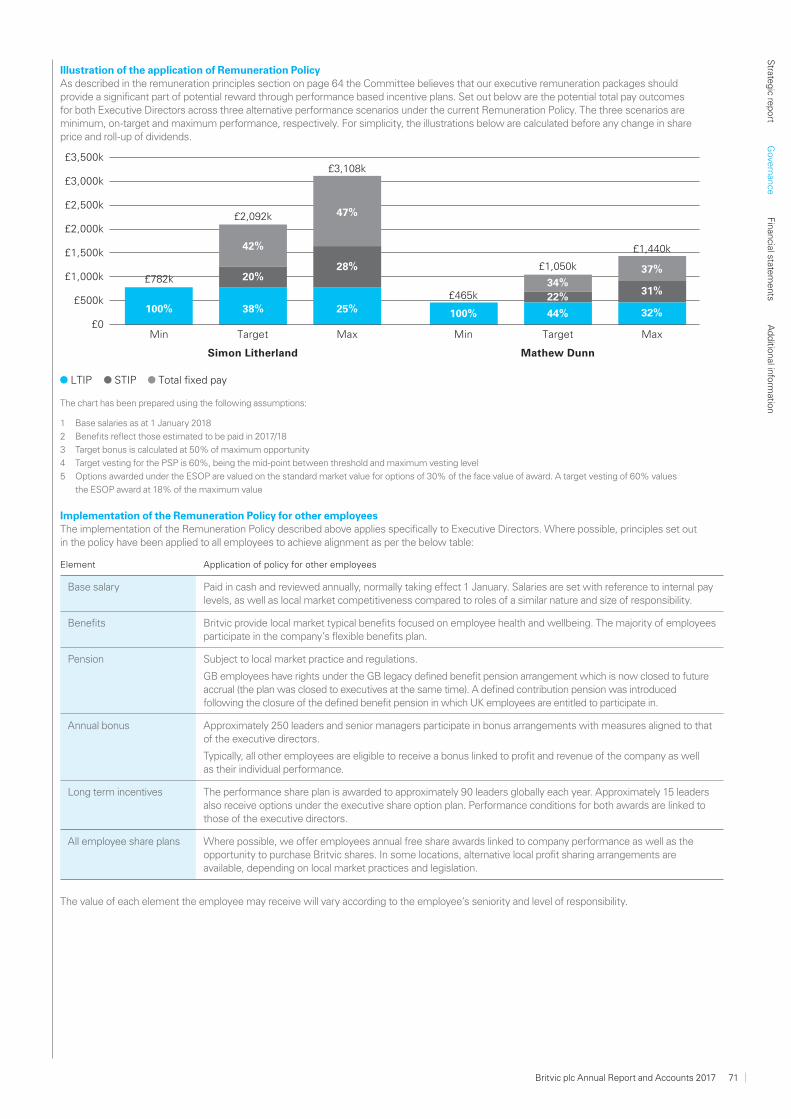
Illustration of the application of Remuneration PolicyAs described in the remuneration principles section on page 64 the Committee believes that our executive remuneration packages should provide a significant part of potential reward through performance based incentive plans. Set out below are the potential total pay outcomes for both Executive Directors across three alternative performance scenarios under the current Remuneration Policy. The three scenarios are minimum, on-target and maximum performance, respectively. For simplicity, the illustrations below are calculated before any change in share price and roll-up of dividends.
Simon Litherland Mathew Dunn
TargetMin£0
£3,500k
£3,000k
£2,500k
£2,000k
£1,500k
£1,000k
£500k
Max TargetMin Max
100% 38% 25% 100% 44% 32%
20%28%
22%31%
42%
47%
34%37%
£782k
£2,092k
£3,108k
£465k
£1,050k
£1,440k
LTIP STIP Total fixed pay
The chart has been prepared using the following assumptions:
1 Base salaries as at 1 January 2018
2 Benefits reflect those estimated to be paid in 2017/18
3 Target bonus is calculated at 50% of maximum opportunity
4 Target vesting for the PSP is 60%, being the mid-point between threshold and maximum vesting level
5 Options awarded under the ESOP are valued on the standard market value for options of 30% of the face value of award. A target vesting of 60% values
the ESOP award at 18% of the maximum value
Implementation of the Remuneration Policy for other employeesThe implementation of the Remuneration Policy described above applies specifically to Executive Directors. Where possible, principles set out in the policy have been applied to all employees to achieve alignment as per the below table:
Element Application of policy for other employees
Base salary Paid in cash and reviewed annually, normally taking effect 1 January. Salaries are set with reference to internal pay levels, as well as local market competitiveness compared to roles of a similar nature and size of responsibility.
Benefits Britvic provide local market typical benefits focused on employee health and wellbeing. The majority of employees participate in the company’s flexible benefits plan.
Pension Subject to local market practice and regulations.
GB employees have rights under the GB legacy defined benefit pension arrangement which is now closed to future accrual (the plan was closed to executives at the same time). A defined contribution pension was introduced following the closure of the defined benefit pension in which UK employees are entitled to participate in.
Annual bonus Approximately 250 leaders and senior managers participate in bonus arrangements with measures aligned to that of the executive directors.
Typically, all other employees are eligible to receive a bonus linked to profit and revenue of the company as well as their individual performance.
Long term incentives The performance share plan is awarded to approximately 90 leaders globally each year. Approximately 15 leaders also receive options under the executive share option plan. Performance conditions for both awards are linked to those of the executive directors.
All employee share plans Where possible, we offer employees annual free share awards linked to company performance as well as the opportunity to purchase Britvic shares. In some locations, alternative local profit sharing arrangements are available, depending on local market practices and legislation.
The value of each element the employee may receive will vary according to the employee’s seniority and level of responsibility.
Britvic plc Annual Report and Accounts 2017 71
Strate
gic re
port
Gove
rnan
ceFin
ancial state
ments
Ad
ditio
nal info
rmatio
n
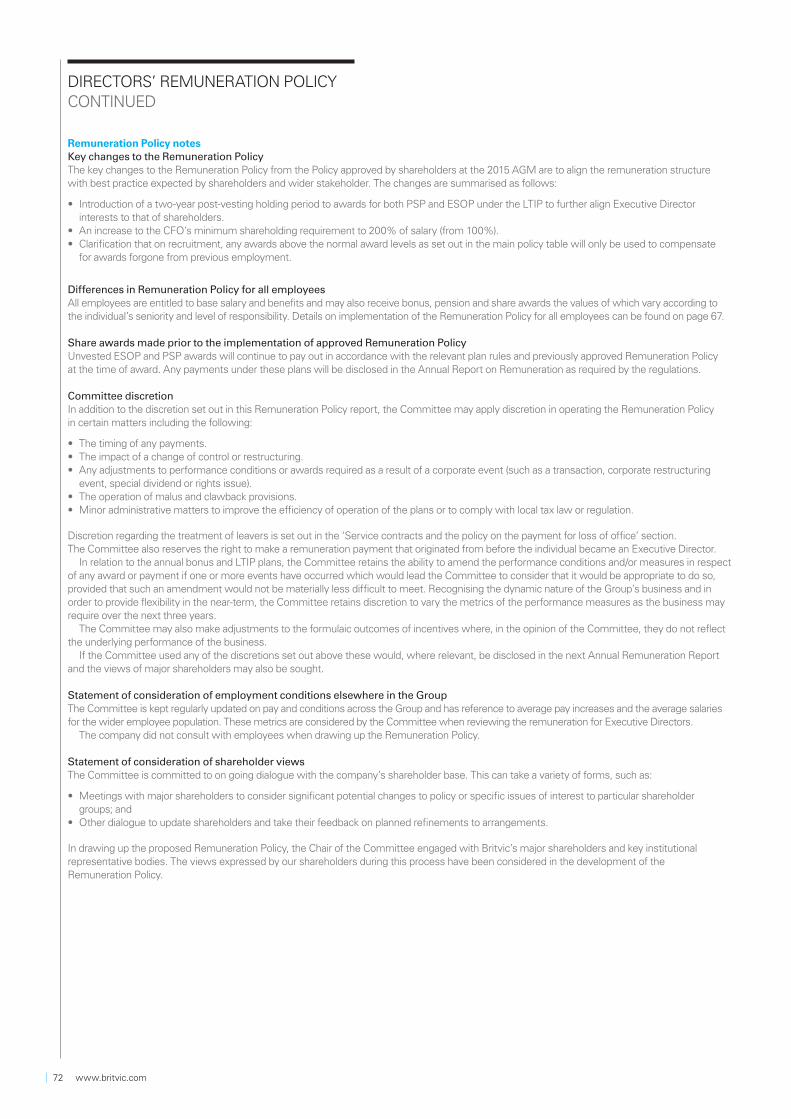
Remuneration Policy notesKey changes to the Remuneration PolicyThe key changes to the Remuneration Policy from the Policy approved by shareholders at the 2015 AGM are to align the remuneration structure with best practice expected by shareholders and wider stakeholder. The changes are summarised as follows:
• Introduction of a two-year post-vesting holding period to awards for both PSP and ESOP under the LTIP to further align Executive Director interests to that of shareholders.
• An increase to the CFO’s minimum shareholding requirement to 200% of salary (from 100%).• Clarifi cation that on recruitment, any awards above the normal award levels as set out in the main policy table will only be used to compensate
for awards forgone from previous employment.
Differences in Remuneration Policy for all employeesAll employees are entitled to base salary and benefits and may also receive bonus, pension and share awards the values of which vary according to the individual’s seniority and level of responsibility. Details on implementation of the Remuneration Policy for all employees can be found on page 67.
Share awards made prior to the implementation of approved Remuneration PolicyUnvested ESOP and PSP awards will continue to pay out in accordance with the relevant plan rules and previously approved Remuneration Policy at the time of award. Any payments under these plans will be disclosed in the Annual Report on Remuneration as required by the regulations.
Committee discretionIn addition to the discretion set out in this Remuneration Policy report, the Committee may apply discretion in operating the Remuneration Policy in certain matters including the following:
• The timing of any payments.• The impact of a change of control or restructuring.• Any adjustments to performance conditions or awards required as a result of a corporate event (such as a transaction, corporate restructuring
event, special dividend or rights issue).• The operation of malus and clawback provisions.• Minor administrative matters to improve the effi ciency of operation of the plans or to comply with local tax law or regulation.
Discretion regarding the treatment of leavers is set out in the ‘Service contracts and the policy on the payment for loss of office’ section.The Committee also reserves the right to make a remuneration payment that originated from before the individual became an Executive Director.
In relation to the annual bonus and LTIP plans, the Committee retains the ability to amend the performance conditions and/or measures in respect of any award or payment if one or more events have occurred which would lead the Committee to consider that it would be appropriate to do so, provided that such an amendment would not be materially less difficult to meet. Recognising the dynamic nature of the Group’s business and in order to provide flexibility in the near-term, the Committee retains discretion to vary the metrics of the performance measures as the business may require over the next three years.
The Committee may also make adjustments to the formulaic outcomes of incentives where, in the opinion of the Committee, they do not reflect the underlying performance of the business.
If the Committee used any of the discretions set out above these would, where relevant, be disclosed in the next Annual Remuneration Report and the views of major shareholders may also be sought.
Statement of consideration of employment conditions elsewhere in the GroupThe Committee is kept regularly updated on pay and conditions across the Group and has reference to average pay increases and the average salaries for the wider employee population. These metrics are considered by the Committee when reviewing the remuneration for Executive Directors.
The company did not consult with employees when drawing up the Remuneration Policy.
Statement of consideration of shareholder viewsThe Committee is committed to on going dialogue with the company’s shareholder base. This can take a variety of forms, such as:
• Meetings with major shareholders to consider signifi cant potential changes to policy or specifi c issues of interest to particular shareholder groups; and
• Other dialogue to update shareholders and take their feedback on planned refi nements to arrangements.
In drawing up the proposed Remuneration Policy, the Chair of the Committee engaged with Britvic’s major shareholders and key institutional representative bodies. The views expressed by our shareholders during this process have been considered in the development of the Remuneration Policy.
DIRECTORS’ REMUNERATION POLICYCONTINUED
72 www.britvic.com
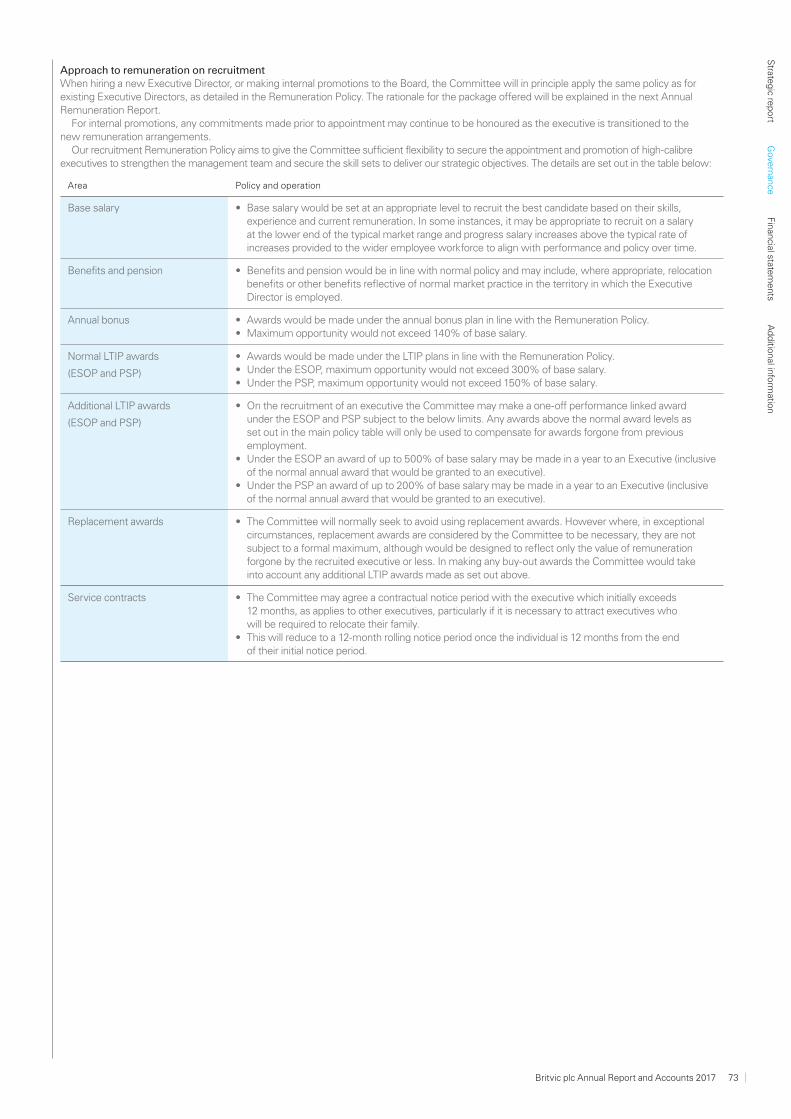
Approach to remuneration on recruitmentWhen hiring a new Executive Director, or making internal promotions to the Board, the Committee will in principle apply the same policy as for existing Executive Directors, as detailed in the Remuneration Policy. The rationale for the package offered will be explained in the next Annual Remuneration Report.
For internal promotions, any commitments made prior to appointment may continue to be honoured as the executive is transitioned to the new remuneration arrangements.
Our recruitment Remuneration Policy aims to give the Committee sufficient flexibility to secure the appointment and promotion of high-calibre executives to strengthen the management team and secure the skill sets to deliver our strategic objectives. The details are set out in the table below:
Area Policy and operation
Base salary • Base salary would be set at an appropriate level to recruit the best candidate based on their skills, experience and current remuneration. In some instances, it may be appropriate to recruit on a salary at the lower end of the typical market range and progress salary increases above the typical rate of increases provided to the wider employee workforce to align with performance and policy over time.
Benefits and pension • Benefi ts and pension would be in line with normal policy and may include, where appropriate, relocation benefi ts or other benefi ts refl ective of normal market practice in the territory in which the Executive Director is employed.
Annual bonus • Awards would be made under the annual bonus plan in line with the Remuneration Policy.• Maximum opportunity would not exceed 140% of base salary.
Normal LTIP awards
(ESOP and PSP)
• Awards would be made under the LTIP plans in line with the Remuneration Policy.• Under the ESOP, maximum opportunity would not exceed 300% of base salary.• Under the PSP, maximum opportunity would not exceed 150% of base salary.
Additional LTIP awards
(ESOP and PSP)
• On the recruitment of an executive the Committee may make a one-off performance linked award under the ESOP and PSP subject to the below limits. Any awards above the normal award levels as set out in the main policy table will only be used to compensate for awards forgone from previous employment.
• Under the ESOP an award of up to 500% of base salary may be made in a year to an Executive (inclusive of the normal annual award that would be granted to an executive).
• Under the PSP an award of up to 200% of base salary may be made in a year to an Executive (inclusive of the normal annual award that would be granted to an executive).
Replacement awards • The Committee will normally seek to avoid using replacement awards. However where, in exceptional circumstances, replacement awards are considered by the Committee to be necessary, they are not subject to a formal maximum, although would be designed to refl ect only the value of remuneration forgone by the recruited executive or less. In making any buy-out awards the Committee would take into account any additional LTIP awards made as set out above.
Service contracts • The Committee may agree a contractual notice period with the executive which initially exceeds 12 months, as applies to other executives, particularly if it is necessary to attract executives who will be required to relocate their family.
• This will reduce to a 12-month rolling notice period once the individual is 12 months from the end of their initial notice period.
Britvic plc Annual Report and Accounts 2017 73
Strate
gic re
port
Gove
rnan
ceFin
ancial state
ments
Ad
ditio
nal info
rmatio
n
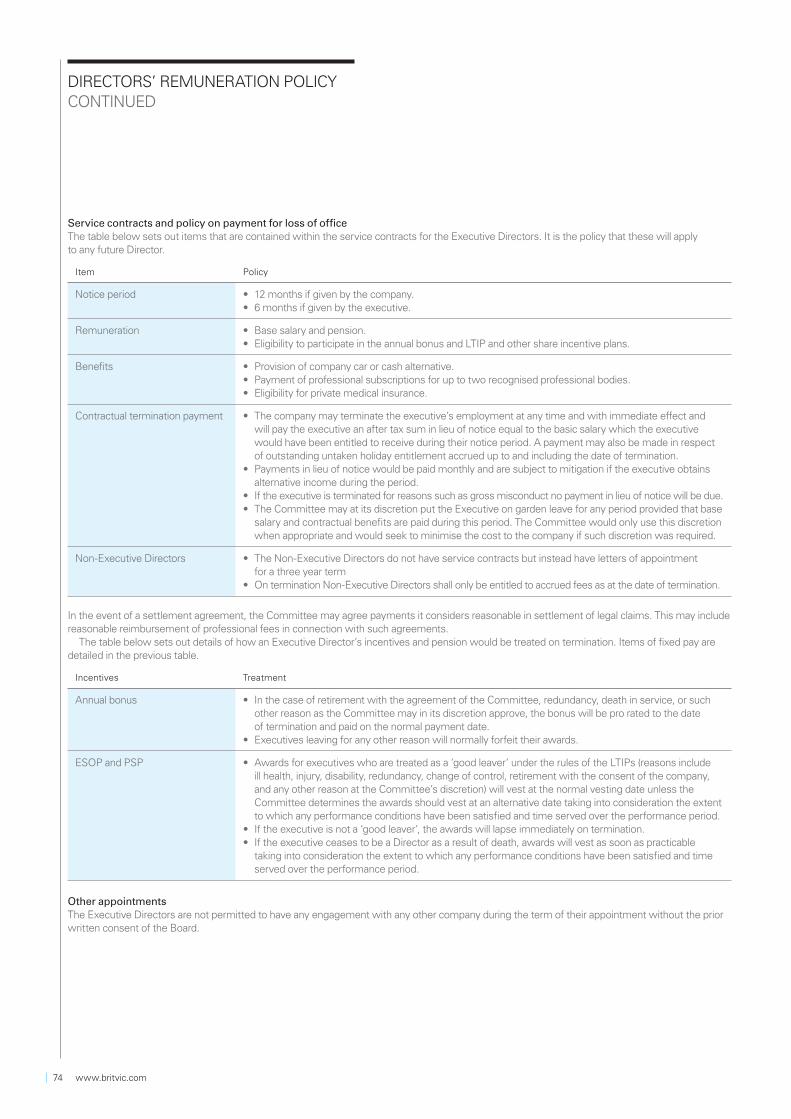
Service contracts and policy on payment for loss of office The table below sets out items that are contained within the service contracts for the Executive Directors. It is the policy that these will apply to any future Director.
Item Policy
Notice period • 12 months if given by the company.• 6 months if given by the executive.
Remuneration • Base salary and pension.• Eligibility to participate in the annual bonus and LTIP and other share incentive plans.
Benefits • Provision of company car or cash alternative.• Payment of professional subscriptions for up to two recognised professional bodies.• Eligibility for private medical insurance.
Contractual termination payment • The company may terminate the executive’s employment at any time and with immediate eff ect and will pay the executive an after tax sum in lieu of notice equal to the basic salary which the executive would have been entitled to receive during their notice period. A payment may also be made in respect of outstanding untaken holiday entitlement accrued up to and including the date of termination.
• Payments in lieu of notice would be paid monthly and are subject to mitigation if the executive obtains alternative income during the period.
• If the executive is terminated for reasons such as gross misconduct no payment in lieu of notice will be due.• The Committee may at its discretion put the Executive on garden leave for any period provided that base
salary and contractual benefi ts are paid during this period. The Committee would only use this discretion when appropriate and would seek to minimise the cost to the company if such discretion was required.
Non-Executive Directors • The Non-Executive Directors do not have service contracts but instead have letters of appointment for a three year term
• On termination Non-Executive Directors shall only be entitled to accrued fees as at the date of termination.
In the event of a settlement agreement, the Committee may agree payments it considers reasonable in settlement of legal claims. This may include reasonable reimbursement of professional fees in connection with such agreements.
The table below sets out details of how an Executive Director’s incentives and pension would be treated on termination. Items of fixed pay are detailed in the previous table.
Incentives Treatment
Annual bonus • In the case of retirement with the agreement of the Committee, redundancy, death in service, or such other reason as the Committee may in its discretion approve, the bonus will be pro rated to the date of termination and paid on the normal payment date.
• Executives leaving for any other reason will normally forfeit their awards.
ESOP and PSP • Awards for executives who are treated as a ‘good leaver’ under the rules of the LTIPs (reasons include ill health, injury, disability, redundancy, change of control, retirement with the consent of the company, and any other reason at the Committee’s discretion) will vest at the normal vesting date unless the Committee determines the awards should vest at an alternative date taking into consideration the extent to which any performance conditions have been satisfi ed and time served over the performance period.
• If the executive is not a ‘good leaver’, the awards will lapse immediately on termination.• If the executive ceases to be a Director as a result of death, awards will vest as soon as practicable
taking into consideration the extent to which any performance conditions have been satisfi ed and time served over the performance period.
Other appointments The Executive Directors are not permitted to have any engagement with any other company during the term of their appointment without the prior written consent of the Board.
DIRECTORS’ REMUNERATION POLICYCONTINUED
74 www.britvic.com
CONSIDERATION BY THE DIRECTORS OF MATTERS RELATING TO DIRECTORS’ REMUNERATION
Membership of the Remuneration Committee
During the year, the Committee consisted wholly of independent Non-Executive Directors:
• Sue Clark (Chair)• John Daly• Ben Gordon • Gerald Corbett (ceased to be a member of the Committee when he stepped down on 1 September 2017)• Ian McHoul
At the invitation of the Chair of the Committee, the Chief Executive Officer, Chief Financial Officer, Chief Human Resources Officer, Director of Compensation and Benefits and General Counsel and Company Secretary attend the meetings of the Committee to provide input to assist with the consideration of particular items, except when their own remuneration is under consideration. Details of the attendance by Committee members at Committee meetings are shown in the Corporate Governance section on page 52.
Composition and terms of reference The Committee’s composition and terms of reference are in line with the 2014 UK Corporate Governance Code and are available on the company’s website or on request from the Company Secretary. While the Chairman, who was independent on initial appointment, is a member of the Committee, he is not present when his own remuneration is under discussion.
The Committee meets no less than three times a year and has responsibility for:
• Reviewing executives’ remuneration in terms of the pay policy of the company as a whole, pay and conditions elsewhere in the Group, and the overall cost on behalf of shareholders;
• Determining, within agreed terms of reference, and taking into account corporate performance on environmental, social and governance issues, the remuneration of the Chairman and specifi c remuneration packages for each of the Executive Directors and other members of the executive team, including pension rights, any compensation payments and benefi ts;
• Approving the design and operation of the company’s incentive arrangements, both short and long-term. This includes agreeing the targets that are applied to awards made to senior executives;
• Responsibility for all of the company’s employee share plans and the share dilution position; and• Ensuring, via regular reviews, that the company’s pay policies remain appropriate and relevant.
ANNUAL REPORT ON REMUNERATION
Britvic plc Annual Report and Accounts 2017 75
Strate
gic re
port
Gove
rnan
ceFin
ancial state
ments
Ad
ditio
nal info
rmatio
n
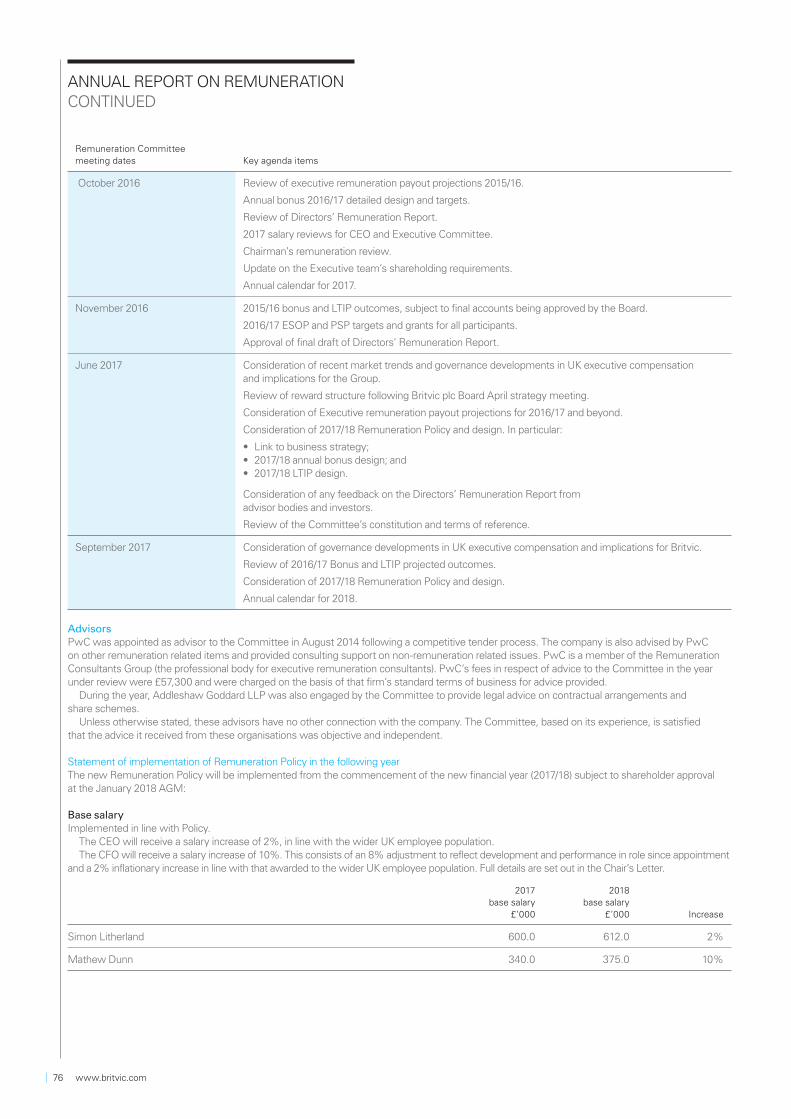
Remuneration Committee meeting dates Key agenda items
October 2016 Review of executive remuneration payout projections 2015/16.
Annual bonus 2016/17 detailed design and targets.
Review of Directors’ Remuneration Report.
2017 salary reviews for CEO and Executive Committee.
Chairman’s remuneration review.
Update on the Executive team’s shareholding requirements.
Annual calendar for 2017.
November 2016 2015/16 bonus and LTIP outcomes, subject to final accounts being approved by the Board.
2016/17 ESOP and PSP targets and grants for all participants.
Approval of final draft of Directors’ Remuneration Report.
June 2017 Consideration of recent market trends and governance developments in UK executive compensation and implications for the Group.
Review of reward structure following Britvic plc Board April strategy meeting.
Consideration of Executive remuneration payout projections for 2016/17 and beyond.
Consideration of 2017/18 Remuneration Policy and design. In particular:
• Link to business strategy; • 2017/18 annual bonus design; and • 2017/18 LTIP design.
Consideration of any feedback on the Directors’ Remuneration Report from advisor bodies and investors.
Review of the Committee’s constitution and terms of reference.
September 2017 Consideration of governance developments in UK executive compensation and implications for Britvic.
Review of 2016/17 Bonus and LTIP projected outcomes.
Consideration of 2017/18 Remuneration Policy and design.
Annual calendar for 2018.
Advisors PwC was appointed as advisor to the Committee in August 2014 following a competitive tender process. The company is also advised by PwC on other remuneration related items and provided consulting support on non-remuneration related issues. PwC is a member of the Remuneration Consultants Group (the professional body for executive remuneration consultants). PwC’s fees in respect of advice to the Committee in the year under review were £57,300 and were charged on the basis of that firm’s standard terms of business for advice provided.
During the year, Addleshaw Goddard LLP was also engaged by the Committee to provide legal advice on contractual arrangements and share schemes.
Unless otherwise stated, these advisors have no other connection with the company. The Committee, based on its experience, is satisfied that the advice it received from these organisations was objective and independent.
Statement of implementation of Remuneration Policy in the following yearThe new Remuneration Policy will be implemented from the commencement of the new financial year (2017/18) subject to shareholder approval at the January 2018 AGM:
Base salaryImplemented in line with Policy.
The CEO will receive a salary increase of 2%, in line with the wider UK employee population.The CFO will receive a salary increase of 10%. This consists of an 8% adjustment to reflect development and performance in role since appointment
and a 2% inflationary increase in line with that awarded to the wider UK employee population. Full details are set out in the Chair’s Letter.
2017 base salary
£’000
2018 base salary
£’000 Increase
Simon Litherland 600.0 612.0 2%
Mathew Dunn 340.0 375.0 10%
ANNUAL REPORT ON REMUNERATIONCONTINUED
76 www.britvic.com
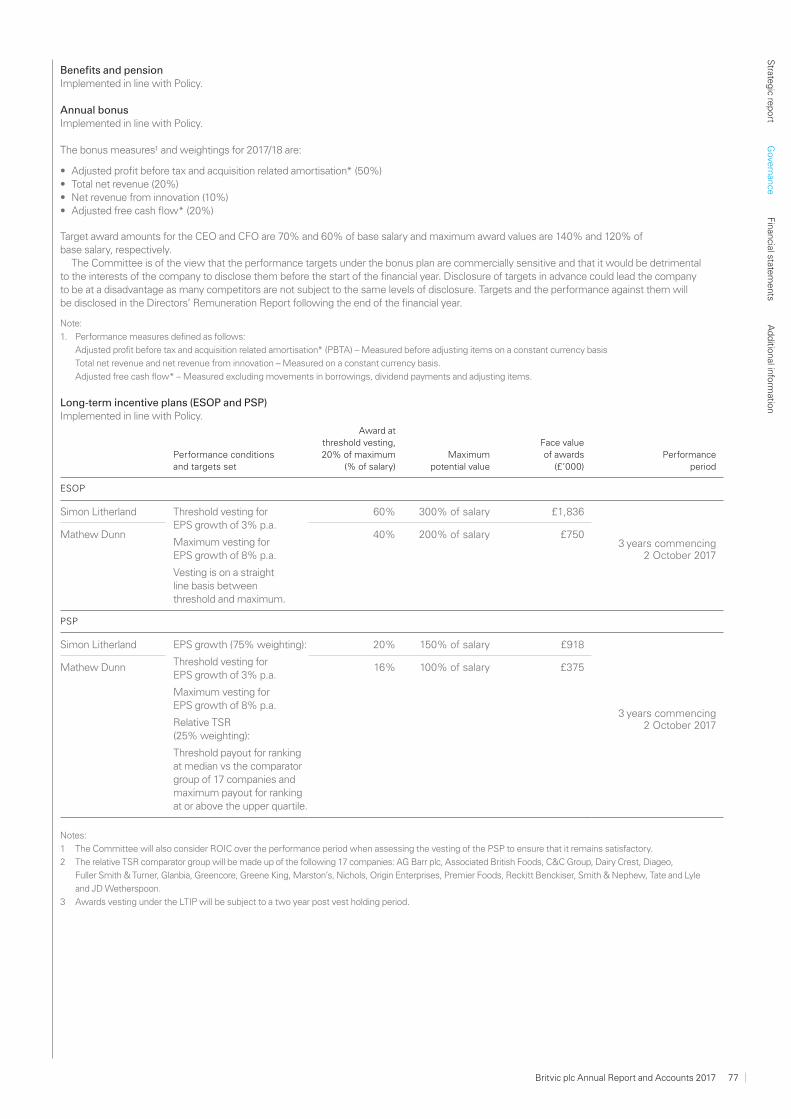
Benefits and pensionImplemented in line with Policy.
Annual bonus Implemented in line with Policy.
The bonus measures¹ and weightings for 2017/18 are:
• Adjusted profi t before tax and acquisition related amortisation* (50%)• Total net revenue (20%)• Net revenue from innovation (10%)• Adjusted free cash fl ow* (20%)
Target award amounts for the CEO and CFO are 70% and 60% of base salary and maximum award values are 140% and 120% of base salary, respectively.
The Committee is of the view that the performance targets under the bonus plan are commercially sensitive and that it would be detrimental to the interests of the company to disclose them before the start of the financial year. Disclosure of targets in advance could lead the company to be at a disadvantage as many competitors are not subject to the same levels of disclosure. Targets and the performance against them will be disclosed in the Directors’ Remuneration Report following the end of the financial year.
Note:
1. Performance measures defined as follows:
Adjusted profit before tax and acquisition related amortisation* (PBTA) – Measured before adjusting items on a constant currency basis
Total net revenue and net revenue from innovation – Measured on a constant currency basis.
Adjusted free cash flow* – Measured excluding movements in borrowings, dividend payments and adjusting items.
Long-term incentive plans (ESOP and PSP)Implemented in line with Policy.
Performance conditions and targets set
Award at threshold vesting, 20% of maximum
(% of salary)Maximum
potential value
Face value of awards
(£’000) Performance
period
ESOP
Simon Litherland Threshold vesting for EPS growth of 3% p.a.
Maximum vesting for EPS growth of 8% p.a.
Vesting is on a straight line basis between threshold and maximum.
60% 300% of salary £1,836
3 years commencing2 October 2017
Mathew Dunn 40% 200% of salary £750
PSP
Simon Litherland EPS growth (75% weighting):
Threshold vesting for EPS growth of 3% p.a.
Maximum vesting for EPS growth of 8% p.a.
Relative TSR (25% weighting):
Threshold payout for ranking at median vs the comparator group of 17 companies and maximum payout for ranking at or above the upper quartile.
20% 150% of salary £918
3 years commencing2 October 2017
Mathew Dunn 16% 100% of salary £375
Notes:
1 The Committee will also consider ROIC over the performance period when assessing the vesting of the PSP to ensure that it remains satisfactory.
2 The relative TSR comparator group will be made up of the following 17 companies: AG Barr plc, Associated British Foods, C&C Group, Dairy Crest, Diageo,
Fuller Smith & Turner, Glanbia, Greencore, Greene King, Marston’s, Nichols, Origin Enterprises, Premier Foods, Reckitt Benckiser, Smith & Nephew, Tate and Lyle
and JD Wetherspoon.
3 Awards vesting under the LTIP will be subject to a two year post vest holding period.
Britvic plc Annual Report and Accounts 2017 77
Strate
gic re
port
Gove
rnan
ceFin
ancial state
ments
Ad
ditio
nal info
rmatio
n
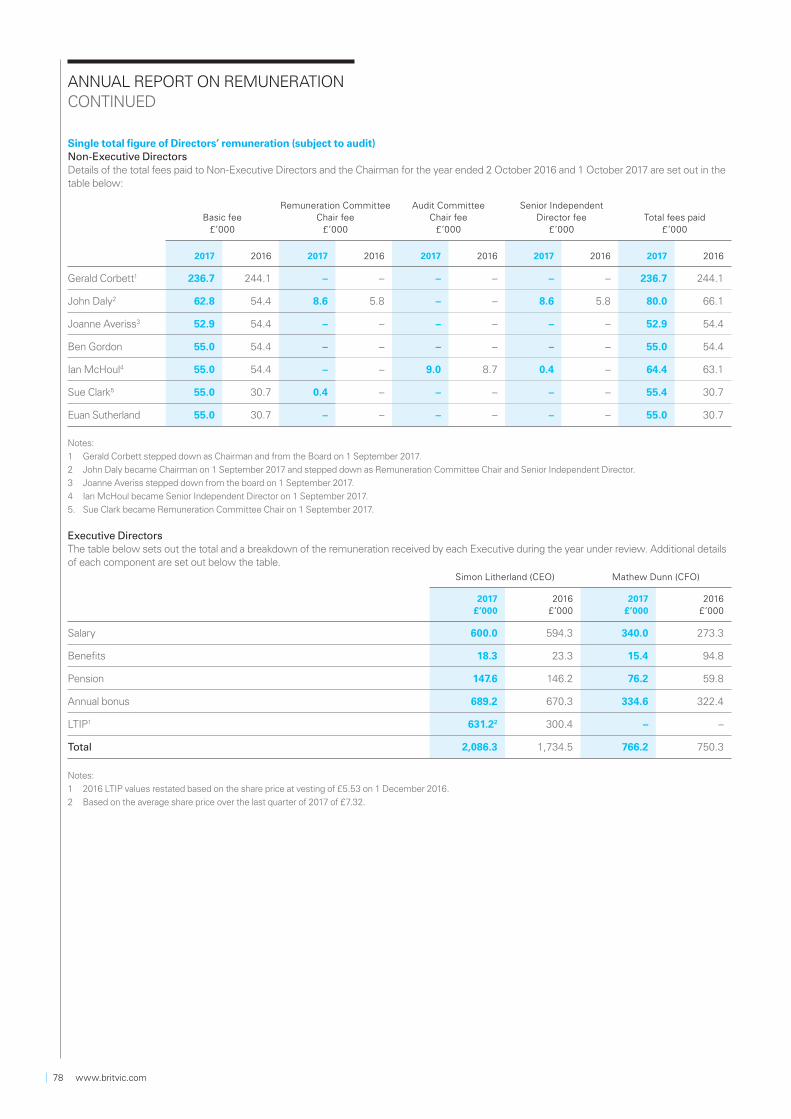
Single total figure of Directors’ remuneration (subject to audit)Non-Executive DirectorsDetails of the total fees paid to Non-Executive Directors and the Chairman for the year ended 2 October 2016 and 1 October 2017 are set out in the table below:
Basic fee £’000
Remuneration Committee Chair fee
£’000
Audit Committee Chair fee
£’000
Senior Independent Director fee
£’000Total fees paid
£’000
2017 2016 2017 2016 2017 2016 2017 2016 2017 2016
Gerald Corbett1 236.7 244.1 – – – – – – 236.7 244.1
John Daly2 62.8 54.4 8.6 5.8 – – 8.6 5.8 80.0 66.1
Joanne Averiss3 52.9 54.4 – – – – – – 52.9 54.4
Ben Gordon 55.0 54.4 – – – – – – 55.0 54.4
Ian McHoul4 55.0 54.4 – – 9.0 8.7 0.4 – 64.4 63.1
Sue Clark5 55.0 30.7 0.4 – – – – – 55.4 30.7
Euan Sutherland 55.0 30.7 – – – – – – 55.0 30.7
Notes:
1 Gerald Corbett stepped down as Chairman and from the Board on 1 September 2017.
2 John Daly became Chairman on 1 September 2017 and stepped down as Remuneration Committee Chair and Senior Independent Director.
3 Joanne Averiss stepped down from the board on 1 September 2017.
4 Ian McHoul became Senior Independent Director on 1 September 2017.
5. Sue Clark became Remuneration Committee Chair on 1 September 2017.
Executive DirectorsThe table below sets out the total and a breakdown of the remuneration received by each Executive during the year under review. Additional details of each component are set out below the table.
Simon Litherland (CEO) Mathew Dunn (CFO)
2017£’000
2016£’000
2017£’000
2016£’000
Salary 600.0 594.3 340.0 273.3
Benefits 18.3 23.3 15.4 94.8
Pension 147.6 146.2 76.2 59.8
Annual bonus 689.2 670.3 334.6 322.4
LTIP1 631.22 300.4 – –
Total 2,086.3 1,734.5 766.2 750.3
Notes:
1 2016 LTIP values restated based on the share price at vesting of £5.53 on 1 December 2016.
2 Based on the average share price over the last quarter of 2017 of £7.32.
ANNUAL REPORT ON REMUNERATIONCONTINUED
78 www.britvic.com
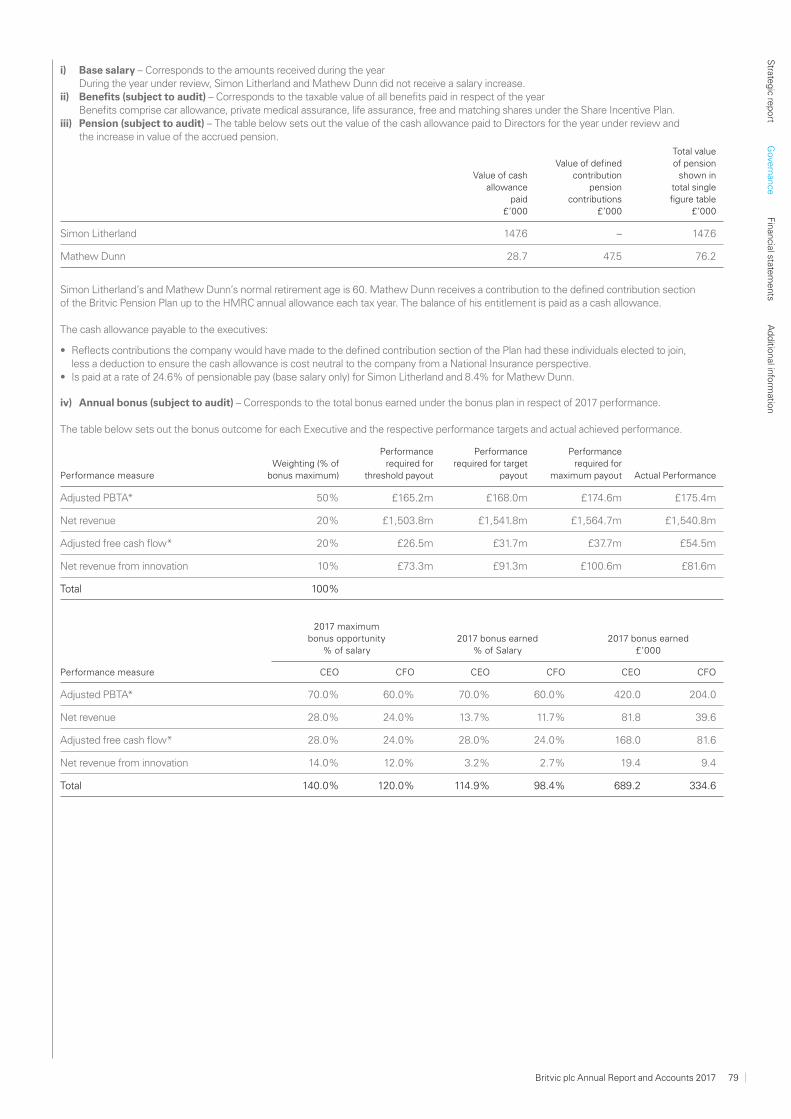
i) Base salary – Corresponds to the amounts received during the year During the year under review, Simon Litherland and Mathew Dunn did not receive a salary increase.ii) Benefits (subject to audit) – Corresponds to the taxable value of all benefits paid in respect of the year Benefits comprise car allowance, private medical assurance, life assurance, free and matching shares under the Share Incentive Plan. iii) Pension (subject to audit) – The table below sets out the value of the cash allowance paid to Directors for the year under review and
the increase in value of the accrued pension.
Value of cash allowance
paid £’000
Value of defined contribution
pension contributions
£’000
Total value of pension
shown in total single figure table
£’000
Simon Litherland 147.6 – 147.6
Mathew Dunn 28.7 47.5 76.2
Simon Litherland’s and Mathew Dunn’s normal retirement age is 60. Mathew Dunn receives a contribution to the defined contribution section of the Britvic Pension Plan up to the HMRC annual allowance each tax year. The balance of his entitlement is paid as a cash allowance.
The cash allowance payable to the executives:
• Refl ects contributions the company would have made to the defi ned contribution section of the Plan had these individuals elected to join, less a deduction to ensure the cash allowance is cost neutral to the company from a National Insurance perspective.
• Is paid at a rate of 24.6% of pensionable pay (base salary only) for Simon Litherland and 8.4% for Mathew Dunn.
iv) Annual bonus (subject to audit) – Corresponds to the total bonus earned under the bonus plan in respect of 2017 performance.
The table below sets out the bonus outcome for each Executive and the respective performance targets and actual achieved performance.
Performance measureWeighting (% of
bonus maximum)
Performance required for
threshold payout
Performance required for target
payout
Performance required for
maximum payout Actual Performance
Adjusted PBTA* 50% £165.2m £168.0m £174.6m £175.4m
Net revenue 20% £1,503.8m £1,541.8m £1,564.7m £1,540.8m
Adjusted free cash flow* 20% £26.5m £31.7m £37.7m £54.5m
Net revenue from innovation 10% £73.3m £91.3m £100.6m £81.6m
Total 100%
2017 maximum bonus opportunity
% of salary2017 bonus earned
% of Salary2017 bonus earned
£’000
Performance measure CEO CFO CEO CFO CEO CFO
Adjusted PBTA* 70.0% 60.0% 70.0% 60.0% 420.0 204.0
Net revenue 28.0% 24.0% 13.7% 11.7% 81.8 39.6
Adjusted free cash flow* 28.0% 24.0% 28.0% 24.0% 168.0 81.6
Net revenue from innovation 14.0% 12.0% 3.2% 2.7% 19.4 9.4
Total 140.0% 120.0% 114.9% 98.4% 689.2 334.6
Britvic plc Annual Report and Accounts 2017 79
Strate
gic re
port
Gove
rnan
ceFin
ancial state
ments
Ad
ditio
nal info
rmatio
n
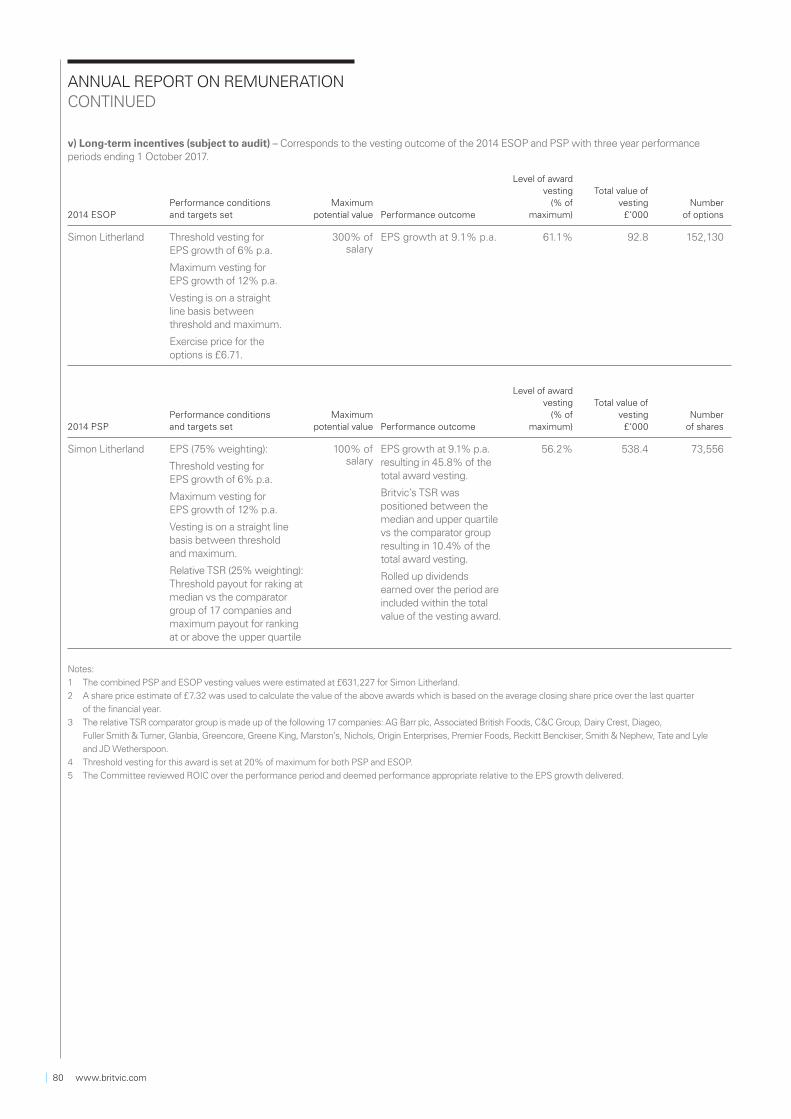
v) Long-term incentives (subject to audit) – Corresponds to the vesting outcome of the 2014 ESOP and PSP with three year performance periods ending 1 October 2017.
2014 ESOPPerformance conditions and targets set
Maximum potential value Performance outcome
Level of award vesting
(% of maximum)
Total value of vesting
£‘000Number
of options
Simon Litherland Threshold vesting for EPS growth of 6% p.a.
Maximum vesting for EPS growth of 12% p.a.
Vesting is on a straight line basis between threshold and maximum.
Exercise price for the options is £6.71.
300% of salary
EPS growth at 9.1% p.a. 61.1% 92.8 152,130
2014 PSPPerformance conditions and targets set
Maximum potential value Performance outcome
Level of award vesting
(% of maximum)
Total value of vesting
£‘000Number
of shares
Simon Litherland EPS (75% weighting):
Threshold vesting for EPS growth of 6% p.a.
Maximum vesting for EPS growth of 12% p.a.
Vesting is on a straight line basis between threshold and maximum.
Relative TSR (25% weighting): Threshold payout for raking at median vs the comparator group of 17 companies and maximum payout for ranking at or above the upper quartile
100% of salary
EPS growth at 9.1% p.a. resulting in 45.8% of the total award vesting.
Britvic’s TSR was positioned between the median and upper quartile vs the comparator group resulting in 10.4% of the total award vesting.
Rolled up dividends earned over the period are included within the total value of the vesting award.
56.2% 538.4 73,556
Notes:
1 The combined PSP and ESOP vesting values were estimated at £631,227 for Simon Litherland.
2 A share price estimate of £7.32 was used to calculate the value of the above awards which is based on the average closing share price over the last quarter
of the financial year.
3 The relative TSR comparator group is made up of the following 17 companies: AG Barr plc, Associated British Foods, C&C Group, Dairy Crest, Diageo,
Fuller Smith & Turner, Glanbia, Greencore, Greene King, Marston’s, Nichols, Origin Enterprises, Premier Foods, Reckitt Benckiser, Smith & Nephew, Tate and Lyle
and JD Wetherspoon.
4 Threshold vesting for this award is set at 20% of maximum for both PSP and ESOP.
5 The Committee reviewed ROIC over the performance period and deemed performance appropriate relative to the EPS growth delivered.
ANNUAL REPORT ON REMUNERATIONCONTINUED
80 www.britvic.com
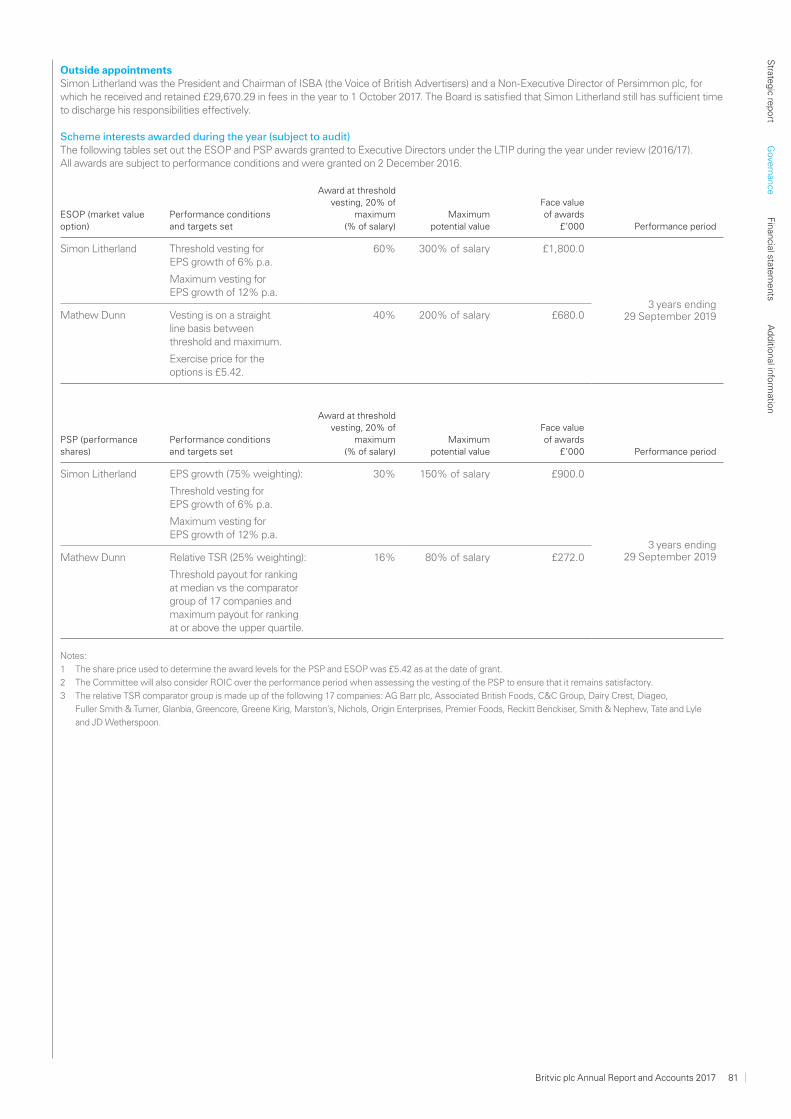
Outside appointmentsSimon Litherland was the President and Chairman of ISBA (the Voice of British Advertisers) and a Non-Executive Director of Persimmon plc, for which he received and retained £29,670.29 in fees in the year to 1 October 2017. The Board is satisfied that Simon Litherland still has sufficient time to discharge his responsibilities effectively.
Scheme interests awarded during the year (subject to audit) The following tables set out the ESOP and PSP awards granted to Executive Directors under the LTIP during the year under review (2016/17). All awards are subject to performance conditions and were granted on 2 December 2016.
ESOP (market value option)
Performance conditions and targets set
Award at threshold vesting, 20% of
maximum (% of salary)
Maximum potential value
Face value of awards
£’000 Performance period
Simon Litherland Threshold vesting for EPS growth of 6% p.a.
Maximum vesting for EPS growth of 12% p.a.
60% 300% of salary £1,800.0
3 years ending 29 September 2019Mathew Dunn Vesting is on a straight
line basis between threshold and maximum.
Exercise price for the options is £5.42.
40% 200% of salary £680.0
PSP (performance shares)
Performance conditions and targets set
Award at threshold vesting, 20% of
maximum (% of salary)
Maximum potential value
Face value of awards
£’000 Performance period
Simon Litherland EPS growth (75% weighting):
Threshold vesting for EPS growth of 6% p.a.
Maximum vesting for EPS growth of 12% p.a.
30% 150% of salary £900.0
3 years ending 29 September 2019Mathew Dunn Relative TSR (25% weighting):
Threshold payout for ranking at median vs the comparator group of 17 companies and maximum payout for ranking at or above the upper quartile.
16% 80% of salary £272.0
Notes:
1 The share price used to determine the award levels for the PSP and ESOP was £5.42 as at the date of grant.
2 The Committee will also consider ROIC over the performance period when assessing the vesting of the PSP to ensure that it remains satisfactory.
3 The relative TSR comparator group is made up of the following 17 companies: AG Barr plc, Associated British Foods, C&C Group, Dairy Crest, Diageo,
Fuller Smith & Turner, Glanbia, Greencore, Greene King, Marston’s, Nichols, Origin Enterprises, Premier Foods, Reckitt Benckiser, Smith & Nephew, Tate and Lyle
and JD Wetherspoon.
Britvic plc Annual Report and Accounts 2017 81
Strate
gic re
port
Gove
rnan
ceFin
ancial state
ments
Ad
ditio
nal info
rmatio
n
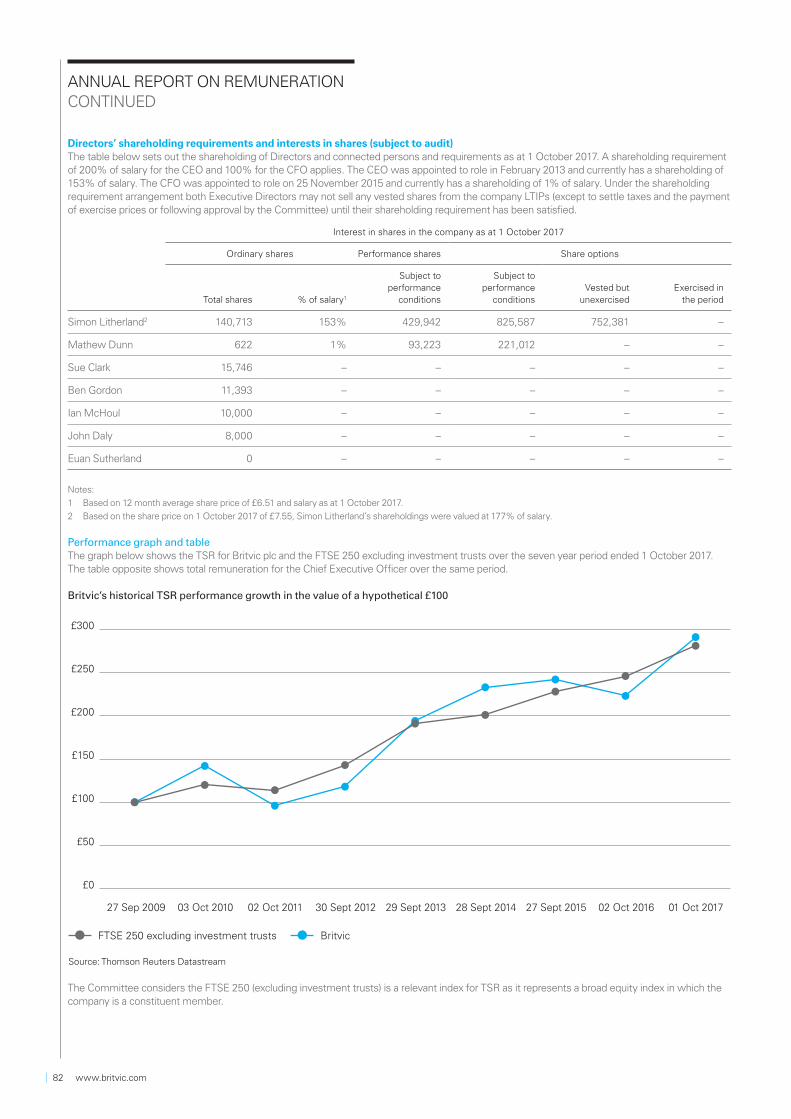
Directors’ shareholding requirements and interests in shares (subject to audit)The table below sets out the shareholding of Directors and connected persons and requirements as at 1 October 2017. A shareholding requirement of 200% of salary for the CEO and 100% for the CFO applies. The CEO was appointed to role in February 2013 and currently has a shareholding of 153% of salary. The CFO was appointed to role on 25 November 2015 and currently has a shareholding of 1% of salary. Under the shareholding requirement arrangement both Executive Directors may not sell any vested shares from the company LTIPs (except to settle taxes and the payment of exercise prices or following approval by the Committee) until their shareholding requirement has been satisfied.
Interest in shares in the company as at 1 October 2017
Ordinary shares Performance shares Share options
Total shares % of salary1
Subject to performance
conditions
Subject to performance
conditionsVested but
unexercisedExercised in
the period
Simon Litherland2 140,713 153% 429,942 825,587 752,381 –
Mathew Dunn 622 1% 93,223 221,012 – –
Sue Clark 15,746 – – – – –
Ben Gordon 11,393 – – – – –
Ian McHoul 10,000 – – – – –
John Daly 8,000 – – – – –
Euan Sutherland 0 – – – – –
Notes:
1 Based on 12 month average share price of £6.51 and salary as at 1 October 2017.
2 Based on the share price on 1 October 2017 of £7.55, Simon Litherland’s shareholdings were valued at 177% of salary.
Performance graph and table The graph below shows the TSR for Britvic plc and the FTSE 250 excluding investment trusts over the seven year period ended 1 October 2017. The table opposite shows total remuneration for the Chief Executive Officer over the same period.
Britvic’s historical TSR performance growth in the value of a hypothetical £100
Source: Thomson Reuters Datastream
FTSE 250 excluding investment trusts
£0
£50
£100
£150
£200
£250
£300
01 Oct 2017 02 Oct 2016 27 Sept 2015 28 Sept 2014 29 Sept 2013 30 Sept 2012 02 Oct 2011 03 Oct 2010 27 Sep 2009
Britvic
The Committee considers the FTSE 250 (excluding investment trusts) is a relevant index for TSR as it represents a broad equity index in which the company is a constituent member.
ANNUAL REPORT ON REMUNERATIONCONTINUED
82 www.britvic.com

Remuneration history for Chief Executive Officer from 2010 to 2017£’000 2010 2011 2012 2013 2014 2015 2016 2017
Simon Litherland total single figure of remuneration
n/a n/a n/a 1,114.6 1,964.3 3,075.2 1,734.5 2,086.3
Paul Moody total single figure of remuneration
1,955.3 1,819.7 670.1 1,412.6 n/a n/a n/a n/a
Bonus (% of maximum 95% 0% 0% 0% for Paul
Moody, 98.6%
for Simon Litherland
72.2% 53.3% 80.6% 82.1%
LTIP (% of maximum) 100%(ESOP 100%
PSP 100%)
89.6%(ESOP 86%
PSP 91%)
0%(ESOP 0%
PSP 0%)
0% for Paul Moody(ESOP 0%
PSP 0%)n/a for Simon
Litherland
63.6%(ESOP 69.0%
PSP 50%
100%(ESOP 100%
PSP 100%)
91.0%(ESOP 100%
PSP 65.8%
59.4%(ESOP 61.1%,
PSP 56.2%)
Percentage change in remuneration for CEOThe table below shows how the percentage change in the Chief Executive’s salary, benefits and bonus between 2016 and 2017 compared with the percentage change in the weighted average of each of those components for all full-time equivalent employees based in Great Britain (GB). The GB employee workforce was chosen as a suitable comparator group as the CEO is based in GB (albeit with a global role and responsibilities) and pay changes across the Group vary widely depending on local market conditions.
ElementChief Executive
% increaseGB Employees
% increase
Base salary 1%1 (1.6%)2
Taxable benefits (21.5%) (1.2%)
Bonus 2.8% (4.2%)
Notes
1. Increase in CEO salary reflects the annualisation of the previous increase in salary effective 1 January 2016
2. Decresase in salary reflects a reduction in the senior management population combined with increased internal promotions. An average 1.5% increase was applied
to professional and supply chain employees in January 2017.
Relative importance of spend on pay The following chart sets out this information as it applies to the company, comparing figures for the year under review and the previous year. Adjusted profit after tax* and capital expenditure are also shown below for context:
+5%
+7%
+6%
+20%
DISTRIBUTION STATEMENT (£m)
Wages and salaries
Dividend payout
Adjusted profit after tax
Capital expenditure
145.3
153.2
60.9
121.6
121.9
146.7
128.4
64.9
FY16 FY17
*
Notes:
1 Capital expenditure is defined as net cash flow from the purchase of both tangible and intangible assets.
2 Adjusted profit after tax* is before the deduction of adjusting items and acquisition related amortisation.
Britvic plc Annual Report and Accounts 2017 83
Strate
gic re
port
Gove
rnan
ceFin
ancial state
ments
Ad
ditio
nal info
rmatio
n
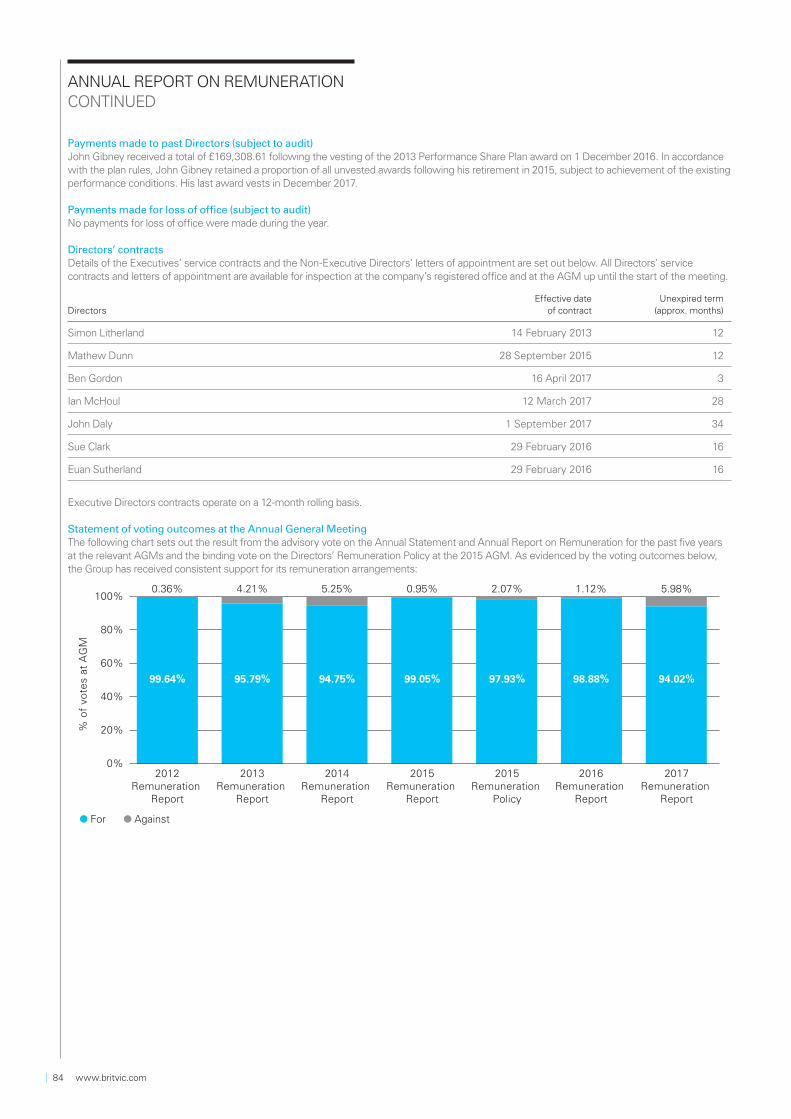
Payments made to past Directors (subject to audit)John Gibney received a total of £169,308.61 following the vesting of the 2013 Performance Share Plan award on 1 December 2016. In accordance with the plan rules, John Gibney retained a proportion of all unvested awards following his retirement in 2015, subject to achievement of the existing performance conditions. His last award vests in December 2017.
Payments made for loss of office (subject to audit)No payments for loss of office were made during the year.
Directors’ contractsDetails of the Executives’ service contracts and the Non-Executive Directors’ letters of appointment are set out below. All Directors’ service contracts and letters of appointment are available for inspection at the company’s registered office and at the AGM up until the start of the meeting.
DirectorsEffective date
of contract Unexpired term
(approx. months)
Simon Litherland 14 February 2013 12
Mathew Dunn 28 September 2015 12
Ben Gordon 16 April 2017 3
Ian McHoul 12 March 2017 28
John Daly 1 September 2017 34
Sue Clark 29 February 2016 16
Euan Sutherland 29 February 2016 16
Executive Directors contracts operate on a 12-month rolling basis.
Statement of voting outcomes at the Annual General MeetingThe following chart sets out the result from the advisory vote on the Annual Statement and Annual Report on Remuneration for the past five years at the relevant AGMs and the binding vote on the Directors’ Remuneration Policy at the 2015 AGM. As evidenced by the voting outcomes below, the Group has received consistent support for its remuneration arrangements:
2013Remuneration
Report
2012Remuneration
Report
% o
f vo
tes
at A
GM
0%
100%
20%
80%
60%
40%
2014Remuneration
Report
2015Remuneration
Policy
2015Remuneration
Report
2017Remuneration
Report
2016Remuneration
Report
99.64%
0.36%
95.79% 94.75% 97.93%
2.07%
98.88% 94.02%
4.21% 5.25% 1.12% 5.98%
For Against
99.05%
0.95%
ANNUAL REPORT ON REMUNERATIONCONTINUED
84 www.britvic.com

Report/Policy Votes For Votes Against Votes Withheld
2017 Remuneration Report 187,437,492 11,921,615 1,398,509
2016 Remuneration Report 196,632,194 2,226,303 201,153
2015 Remuneration Policy 188,539,826 3,994,950 586,370
2015 Remuneration Report 190,958,650 1,828,072 334,424
2014 Remuneration Report 174,219,763 9,661,732 8,809,241
2013 Remuneration Report 171,751,061 7,555,269 2,582,938
2012 Remuneration Report 154,461,496 560,016 6,315,270
Note:
At the 2018 AGM, this Directors’ Remuneration Report will be subject to an advisory vote and the Director’s Remuneration Policy will be subject to a binding vote.
Britvic plc Annual Report and Accounts 2017 85
Strate
gic re
port
Gove
rnan
ceFin
ancial state
ments
Ad
ditio
nal info
rmatio
n
Directors’ reportThe Directors present their report and the audited consolidated financial statements of the company and the Group for the 52 weeks ended 1 October 2017.
Additional disclosuresOther information that is relevant to this report and which is also incorporated by reference, including information required in accordance with the UK Companies Act 2006 and Listing Rule 9.8.4R, can be located as follows:
Business model Pages 6-7
Strategy for delivering objectives Pages 16-17
Results Pages 40-43
Financial assets and liabilities Page 98
Principal risks Pages 29-32
Corporate responsibility Pages 34-39
Greenhouse gas emissions Page 39
Our people Pages 37-38
Going concern Page 88
Viability statement Page 33
Long term incentive plans* Pages 134-136
Dividend waiver* Page 87
* as required under Listing Rule 9.8.4R
Business review and future developmentA review of the group’s operations during the year and its plans for the future is given in the Chairman’s introduction, the Chief Executive Officer’s Review and the Chief Financial Officer’s Review between pages 8 to 43. Details of the Group’s business model and strategy are summarised on pages 6, 7, 16 and 17.
Results and dividendsThe Group’s profit before taxation attributable to the equity shareholders amounted to £138.8m (2016: £151.9m) and the profit after taxation amounted to £111.6m (2016: £114.5m). An interim dividend of 7.2 pence (2016: 7.0 pence) per ordinary share was paid on 14 July 2017.
Subject to shareholder approval, the Directors have proposed a final dividend of 19.3 pence (2016: 17.5 pence) per ordinary share payable on 5 February 2018 to shareholders on the register at the close of business on 8 December 2017, giving a total dividend in respect of 2017 of 26.5 pence (2016: 24.5 pence), an increase of 8.2% over the previous year.
Articles of associationThe company’s articles may only be amended by a special resolution at a general meeting of shareholders. No amendments to the articles are being proposed at the AGM.
DirectorsThe following were Directors of the company during the year: Gerald Corbett (resigned on 1 September 2017), Joanne Averiss (resigned 1 September 2017), Sue Clark, Mathew Dunn, John Daly, Ben Gordon, Simon Litherland, Ian McHoul and Euan Sutherland.
Subject to company law and the company’s articles, the Directors may exercise all of the powers of the company and may delegate their power and discretion to committees. The executive team is responsible for the day-to-day management of the group. The articles give the Directors power to appoint and replace Directors. Under the terms of reference of the Nomination Committee, any appointment must be recommended by the Nomination Committee for approval by the Board. The articles also require Directors to retire and submit themselves for election to the first AGM following appointment and to retire at the AGM held in the third calendar year after election or last re-election, but to comply with the UK Corporate Governance Code (the ‘Code’) all of the directors will submit themselves for election or re-election at the AGM, as appropriate. As a result of ongoing refreshment of the Board and as indicated on page 56, Ben Gordon will not be seeking re-election at the AGM. The biographical details of the Directors are set out on pages 46 and 47 of this report and in the Notice of Meeting which is available on the company’s website. The service contracts of the Executive Directors and letters of appointment of the Non-Executive Directors are available for inspection at the company’s registered office.
Directors’ interestsThe Directors’ interests in ordinary shares of the company are shown within the Directors’ Remuneration Report on page 82. No Director has any other interest in any shares or loan stock of any Group company. No Director was or is materially interested in any contract, other than under their service contract or letter of appointment, which was subsisting during or existing at the end of year and which was significant in relation to the Group’s business. There are procedures in place to deal with any conflicts of interest and these have operated effectively during the year.
Directors’ liabilitiesAs at the date of this report, customary indemnities are in place under which the company has agreed, to the extent permitted by law and the company’s articles, to indemnify:
• The Directors, in respect of all losses arising out of, or in connection with, the execution of their powers, duties and responsibilities as Directors of the company or any of its subsidiaries; and
• Directors of companies which are corporate trustees of the group’s pension schemes against liability incurred in connection with those companies’ activities as trustees of such schemes.
Directors’ remunerationThe Remuneration Committee, on behalf of the Board, has adopted a policy that aims to attract and retain the directors needed to run the group effectively. The policy which will be presented to shareholders at the AGM and is subject to shareholder approval is contained within the Directors’ Remuneration Report on pages 67 to 74.
Jonathan AdelmanActing General Counsel and Company Secretary
DIRECTORS’ REPORT
86 www.britvic.com
EmployeesFull information on our employees, including the areas of learning and development, employee communication and engagement, health, safety and wellbeing and equal opportunities are included in our Sustainable business review on pages 34 to 39.
Human rightsThe Group’s Ethical Business Policy sets out guidelines on ethical standards and human rights, and applies to employees and all third parties acting on the Group’s behalf. It provides for the protection of human rights by mandating that wherever the Group and its suppliers work in the world, there is a clean and safe environment, proper standards of employment and compliance with local laws. The Group only works with suppliers who adopt the standards required under the Ethical Business Policy.
Political donationsNo political donations were made by the Group and its subsidiaries (2016: nil).
Greenhouse gas emissionsDetails of the greenhouse gas emissions in tonnes of carbon dioxide equivalent (CO
2e) for our office and
manufacturing locations are set out in the Sustainable business review on pages 38 and 39.
Major shareholdersAt 1 October 2017, the company had been notified, in accordance with the Disclosure and Transparency Rules, of the following interests amounting to 3% or more of the voting rights in the issued ordinary share capital of the company:
Number of ordinary
sharesPercentage of
voting rightsNature of
holding
FMR LLC 18,432,163 7.00% Indirect
Prudential plc group of companies 16,549,600 6.27% Indirect
APG Asset Management N.V. 16,080,643 6.12% Direct
Standard Life Investments Ltd Below 5% Below 5% Direct/Indirect
BlackRock, Inc Below 5% Below 5% Indirect
Share capitalThe company’s issued share capital comprised a single class of shares divided into ordinary shares of 20 pence each (referred to as ‘ordinary shares’). As at 1 October 2017, the company’s issued share capital comprised 263,797,000 ordinary shares.
Rights and restrictions attaching to sharesOn a show of hands at a general meeting of the company, every holder of ordinary shares present in person and entitled to vote shall have one vote, and on a poll, every member present in person or by proxy and entitled to vote shall have one vote for every ordinary share held. Any notice of general meeting issued by the company will specify deadlines for exercising voting rights and in appointing a proxy or proxies in relation to resolutions to be proposed at the general meeting. All proxy votes are counted and the numbers for, against or withheld in relation to each resolution are announced at the general meeting and published on the company’s website after the meeting.
There are no restrictions on the transfer of ordinary shares in the company other than:
• Certain restrictions which may from time to time be imposed by laws and regulations (for example, insider trading laws); and
• Pursuant to the Listing Rules of the Financial Conduct Authority and the Group’s share dealing code whereby certain employees of the Group require the approval of the company to deal in its ordinary shares.
The company is not aware of any agreements between shareholders that may result in restrictions on the transfer of securities and/or voting rights.
Dividend waiverThe trustees of the Britvic Share Incentive Plan have elected to waive dividends on shares held under trust relating to dividends payable during the year.
Shares held in employee benefit trustsUnder the rules of the Britvic Share Incentive Plan (‘the Plan’) eligible employees are entitled to acquire shares in the company. Plan shares are held in trust for participants by Equiniti Share Plan Trustees Limited (‘the Trustees’). Voting rights are exercised by the Trustees on receipt of participants’ instructions. If a participant does not submit an instruction to the Trustees no vote is registered. In addition, the Trustees do not vote on any unawarded shares held under the Plan as surplus assets. As at 28 November 2017, the Trustees held 1.31% (2016: 1.24%) of the issued share capital of the company.
Similarly, if First Names (Jersey) Limited, as Trustee of the Britvic Employee Benefit Trust (the ‘Trustee’), holds ordinary shares on trust for the benefit of the executive directors, senior executives and managers of the Group, a dividend waiver is in place. The Trustee is not permitted to vote on any unvested shares held in the trust unless expressly directed to do so by the company. The Trustees held 0.21% of the issued share capital as at 28 November 2017 (2016: 0.19%).
Change of control provisionsThere are no agreements between the company and its directors or employees providing for compensation for loss of office or employment (whether through resignation, purported redundancy or otherwise) that occurs because of a takeover bid. The company’s banking arrangements are terminable upon a change of control of the company. Certain other indebtedness becomes repayable if a change of control leads to a downgrade in the credit rating of the company. The company’s agreements with PepsiCo are terminable upon a change of control.
Britvic plc Annual Report and Accounts 2017 87
Strate
gic re
port
Gove
rnan
ceFin
ancial state
ments
Ad
ditio
nal info
rmatio
n
Financial risk managementIt is the group’s objective to manage its financial risk so as to minimise the adverse fluctuations in the financial markets on the group’s reported profitability and cash flows. The policies for managing each of the group’s main financial risk areas are referred to in the Treasury management section of the Chief Financial Officer’s review on page 42 and in more detail within note 24 of the consolidated financial statements.
Research and developmentThe Group carries out research and development necessary to support its principal activities as a manufacturer and distributor of soft drinks.
BranchesAs a global Group, our interests and activities are held or operated through subsidiaries, branches, joint arrangements or associates which are established in, and subject to the laws and regulations of, many different jurisdictions.
Going concern and viabilityThe Directors consider that the Group and the company have adequate resources to remain in operation for the foreseeable future and have therefore continued to adopt the going concern basis in preparing the financial statements. The Code requires the Directors to assess and report on the prospects of the Group over a longer period. This longer term viability statement is set out on page 33.
Events since the balance sheet dateFollowing a detailed review of our manufacturing sites and distribution network Britvic announced on 3 October 2017 a proposal to transfer production of Robinsons and Fruit Shoot from our Norwich site to our manufacturing sites in East London, Leeds and Rugby. The proposal is being made to improve the efficiency and productivity of our manufacturing operations and, as a result, Britvic is proposing to close the Norwich manufacturing site. The proposal has been approved by the Board for consultation with impacted employees and, subject to full and proper consultation, it is proposed that the site will close towards the end of 2019.
Annual general meetingThe AGM will be held at 11.00am on 31 January 2018 at the offices of Linklaters LLP, One Silk Street, London EC2Y 8HQ. Details of the resolutions to be proposed at the AGM are set out in a separate circular which has been sent to all shareholders and is available on the Britvic website at http://www.britvic.com/investors/shareholder-centre/agm.
DIRECTORS’ REPORTCONTINUED
DisclaimerThe purpose of this Annual Report is to provide information to the members of the company and it has been prepared for, and only for, the members of the company as a body, and no other persons. The company, its Directors and employees, agents and advisors do not accept or assume responsibility to any other person to whom this document is shown or into whose hands it may come and any such responsibility or liability is expressly disclaimed. A cautionary statement in respect of forward-looking statements contained in this Annual Report appears on the inside front cover of this document.
The Directors’ report was approved by the Board on 28 November 2017.
On behalf of the Board
Jonathan AdelmanActing General Counsel and Company SecretaryBritvic plc
Company No. 5604923
88 www.britvic.com
STATEMENT OF DIRECTORS’ RESPONSIBILITY
Statement of directors’ responsibilities in respect of the annual report and the financial statementsThe directors are responsible for preparing the annual report and the financial statements in accordance with applicable law and regulations. Company law requires the directors to prepare financial statements for each financial year. Under that law the directors have elected to prepare the group financial statements in accordance with International Financial Reporting Standards (IFRSs) as adopted by the European Union, and the parent company financial statements in accordance with United Kingdom Generally Accepted Accounting Practice (United Kingdom Accounting Standards and applicable law), including Financial Reporting Standard 101 Reduced Disclosure Framework (FRS 101).
Under company law the directors must not approve the financial statements unless they are satisfied that they give a true and fair view of the state of affairs of the group and company and of their profit or loss for that period.
In preparing these financial statements, the directors are required to:
• Select suitable accounting policies and then apply them consistently;
• make judgements and estimates that are reasonable and prudent;
• in respect of the group fi nancial statements, state whether IFRSs they as adopted by the European Union have been followed, subject to any material departures disclosed and explained in the fi nancial statements;
• provide additional disclosures when compliance with the specifi c requirements in IFRSs is insuffi cient to enable users to understand the impact of particular transactions, other events and conditions on the group’s fi nancial position and fi nancial performance;
• in respect of the parent company fi nancial statements, state whether applicable UK Accounting Standards, including FRS 10, have been followed, subject to any material departures disclosed and explained in the fi nancial statements; and
• prepare the fi nancial statements on the going concern basis unless it is inappropriate to presume that the company and/or the group will continue in business.
The directors are responsible for keeping adequate accounting records that are sufficient to show and explain the parent company’s transactions and disclose with reasonable accuracy at any time the financial position of the company and the group and enable them to ensure that its financial statements comply with the Companies Act 2006 and with respect to the group financial statements, Article 4 of the IAS Regulation. They are also responsible for safeguarding the assets of the company and group and hence for taking reasonable steps for the prevention of fraud and other irregularities.
Under applicable law and regulations, the directors are also responsible for preparing a Strategic report, Directors’ report, Remuneration report and Corporate governance statement that complies with that law and those regulations.
The directors are responsible for the maintenance and integrity of the corporate and financial information included on the company’s website. Legislation in the UK governing the preparation and dissemination of financial statements may differ from legislation in other jurisdictions.
Directors’ declaration in relation to relevant audit informationThe Directors who were members of the Board at the time of approving the Directors’ Report are listed on pages 46 and 47. Having made enquiries of fellow Directors and of the company’s auditor, each of these Directors confirms that:
• to the best of each Directors’ knowledge and belief, there is no information relevant of which the company’s auditor is unaware; and
• each Director has taken all the steps a Director might reasonably be expected to have taken to be aware of relevant audit information and to establish that the company’s auditor is aware of that information.
Responsibility statement of the Directors in respect the annual report The Directors confirm that to the best of their knowledge:
• that the consolidated fi nancial statements prepared in accordance with IFRSs as adopted by the European Union give a true and fair view of the assets, liabilities, fi nancial position and profi t of the company and undertakings included in the consolidation taken as a whole;
• that the annual report, including the strategic report, includes a fair review of the development and performance of the business and the position of the company and undertakings included in the consolidation as a whole, together with a description of the principal risks and uncertainties that they face; and
• having taken into account all matters considered by the Board and brought to the attention of the Board during the year, the Directors consider that the annual report, taken as a whole, is fair, balanced and understandable. The Directors believe that the disclosures set out in this annual report provide the information necessary for shareholders to assess the company’s performance, business model and strategy.
On behalf of the Board
Simon Litherland Mathew DunnChief Executive Officer Chief Financial Officer
Britvic plc Annual Report and Accounts 2017 89
Strate
gic re
port
Gove
rnan
ceFin
ancial state
ments
Ad
ditio
nal info
rmatio
n
INDEPENDENT AUDITOR’S REPORT TO THE MEMBERS OF BRITVIC PLC
OpinionIn our opinion:
• Britvic plc’s group fi nancial statements and parent company fi nancial statements (the “fi nancial statements”) give a true and fair view of the state of the group’s and of the parent company’s aff airs as at 1 October 2017 and of the group’s profi t for the period then ended;
• the group fi nancial statements have been properly prepared in accordance with IFRSs as adopted by the European Union;
• the parent company fi nancial statements have been properly prepared in accordance with United Kingdom generally accepted accounting practice including FRS 101; and
• the fi nancial statements have been prepared in accordance with the requirements of the Companies Act 2006, and, as regards the group fi nancial statements, Article 4 of the IAS Regulation.
We have audited the financial statements of Britvic plc which comprise:
Group Parent company
Consolidated income statement for the 52 week period ended 1 October 2017
Balance sheet as at 1 October 2017
Consolidated statement of comprehensive incomefor the 52 week period ended 1 October 2017
Statement of changes in equity for the 52 week period ended 1 October 2017
Consolidated balance sheet as at 1 October 2017
Related notes 1 to 13 to the financial statements including a summary of significant accounting policies
Consolidated statement of cash flows for the 52 week period ended 1 October 2017
Consolidated statement of changes in equity for the 52 week period ended 1 October 2017
Related notes 1 to 32 to the financial statements, including a summary of significant accounting policies
The financial reporting framework that has been applied in their preparation is applicable law and International Financial Reporting Standards (IFRSs) as adopted by the European Union and, as regards the parent company financial statements, UK GAAP including FRS 101 ‘Reduced Disclosure Framework’, as applied in accordance with the provisions of the Companies Act 2006.
Basis for opinion We conducted our audit in accordance with International Standards on Auditing (UK) (ISAs (UK)) and applicable law. Our responsibilities under those standards are further described in the Auditor’s responsibilities for the audit of the financial statements section of our report below. We are independent of the group and parent company in accordance with the ethical requirements that are relevant to our audit of the financial statements in the UK, including the FRC’s Ethical Standard as applied to listed public interest entities, and we have fulfilled our other ethical responsibilities in accordance with these requirements.
We believe that the audit evidence we have obtained is sufficient and appropriate to provide a basis for our opinion.
Conclusions relating to principal risks, going concern and viability statementWe have nothing to report in respect of the following information in the annual report, in relation to which the ISAs(UK) require us to report to you whether we have anything material to add or draw attention to:
• the disclosures in the annual report set out on pages 28 to 32 that describe the principal risks and explain how they are being managed or mitigated;
• the directors’ confi rmation set out on page 28 in the annual report that they have carried out a robust assessment of the principal risks facing the entity, including those that would threaten its business model, future performance, solvency or liquidity;
• the directors’ statement set out on page 88 in the fi nancial statements about whether they considered it appropriate to adopt the going concern basis of accounting in preparing them, and their identifi cation of any material uncertainties to the entity’s ability to continue to do so over a period of at least twelve months from the date of approval of the fi nancial statements;
• whether the directors’ statement in relation to going concern required under the Listing Rules in accordance with Listing Rule 9.8.6R(3) is materially inconsistent with our knowledge obtained in the audit; or
• the directors’ explanation set out on page 33 in the annual report as to how they have assessed the prospects of the entity, over what period they have done so and why they consider that period to be appropriate, and their statement as to whether they have a reasonable expectation that the entity will be able to continue in operation and meet its liabilities as they fall due over the period of their assessment, including any related disclosures drawing attention to any necessary qualifi cations or assumptions.
90 www.britvic.com
Overview of our audit approach
Key audit matters
• Fraud Risk – Revenue Recognition through inappropriate manual journal entries or through manipulation of the cut-off of revenue transactions in jurisdictions where judgement is required to determine correct cut-off
• Fraud Risk – Management Override of Internal Controls over Customer Discounts
• Fraud Risk – Management Override of Internal Controls over Customer Claims and Other Financial Items
Audit scope • We performed full audit procedures over the Group level functions in addition to the fi nancial information of seven components and audit procedures on specifi c balances for one further component. We further perform specifi c audit procedures over six further components.
• The components where we performed full or specifi c audit procedures accounted for 110% of profi t before tax stated before adjusting items, 92% of revenue and 87% of total assets.
Materiality • Overall group materiality of £8.2m which represents 5% of profi t before tax stated before adjusting items as defi ned on page 152.
Key audit mattersKey audit matters are those matters that, in our professional judgment, were of most significance in our audit of the financial statements of the current period and include the most significant assessed risks of material misstatement (whether or not due to fraud) that we identified. These matters included those which had the greatest effect on: the overall audit strategy, the allocation of resources in the audit; and directing the efforts of the engagement team. These matters were addressed in the context of our audit of the financial statements as a whole, and in our opinion thereon, and we do not provide a separate opinion on these matters.
The risks noted below are discussed in the Audit Committee Report on page 60 and in the accounting policy notes on pages 101 to 108.
Risk – revenue recognition
Description of riskGiven the market focus on the group’s revenue performance we consider there to be a risk in relation to the potential overstatement of revenue. Management reward and incentive schemes based on achieving profit targets may also place pressure on management to manipulate revenue recognition.
There is a risk that management may override controls to intentionally misstate revenue transactions by recording fictitious revenue transactions, either through inappropriate manual journal entries or through manipulation of the cut-off of revenue transactions in the Brazil business unit where judgement is required to determine correct cut-off.
Our response to this risk• we understood the group’s revenue recognition policies
and how they are applied, including the relevant controls;• we tested journal entries posted to revenue accounts,
applying a number of parameters designed to identify and test entries that were not in accordance with our expectations. This included analysing and selecting journals for testing which appeared unusual in nature either due to size, preparer or being manually posted. We verifi ed the journals to originating documentation to confi rm that the entries were valid;
• for the GB and Republic of Ireland full scope components, which together form 64% of the group’s total revenue, we performed data analysis over the entire revenue process from revenue recognition through to invoice settlement. Where the postings did not follow our expectation, we investigated outliers and tested these entries to ensure their validity by agreeing back to source documentation;
• we selected a sample of post year end credit notes and ensured that, where corroborating evidence demonstrated that the credit note related to the audit period, these credit notes were appropriately provided for in the fi nancial statements; and
• we performed cut-off testing for a sample of revenue transactions around the period end date, to check that they were recognised in the appropriate period with specifi c focus on Britvic Brazil where there can be a large time lag between the despatch of goods and them reaching their destination.
The above work was performed at all full scope locations.Within International Standard on Auditing (UK) 240 there
is a presumption that there are risks of fraud in revenue recognition. We therefore evaluated the revenue transactions or assertions which give rise to such risk in the current period as noted above.
Key observations communicated to the Audit CommitteeBased on our procedures we have not identified evidence of inappropriate management override in respect of the amount of revenue recorded through either inappropriate journal entries or manipulation of the Brazil business unit cut-off estimate.
Britvic plc Annual Report and Accounts 2017 91
Strate
gic re
port
Gove
rnan
ceFin
ancial state
ments
Ad
ditio
nal info
rmatio
n
Risk – management override of internal controls overcustomer claims and other financial items
Description of riskThe risk of material misstatement due to management override of controls is considered a risk in every audit. Management has the primary responsibility to prevent and detect fraud. We are required by professional auditing standards to consider how this risk may manifest itself and design appropriate procedures;
There are a number of judgemental accruals which are susceptible to manipulation by management including customer claims in GB&I, group wide bonuses and contingent liabilities associated with the acquisition of Bela Ischia.
Our response to this risk• We performed procedures, including analytical procedures
and journal entry testing, suffi cient to address the identifi ed risk in respect of subjective areas which were considered to be most susceptible to management override.
• For GB&I customer claims: – we held bi-annual discussions with a sample of customer
account teams directly involved in negotiations with customers, including those responsible for the relationship with the big supermarkets. Through these discussions we understood the current relationship with each customer and the status of any claims;
– we tested the methodology and process by which claims have been accrued for appropriateness and consistency with the prior year, specifi cally around the process for identifying claims which have not been received and audited a sample of payments made after the year end to audit the accuracy of the accrued amounts; and
– we compared the level of aged debt held in relation to signifi cant customers to the customer claims provision and investigated any additional signifi cant un-provided aged debts that did not have a corresponding provision within the customer claims provision.
• For other fi nancial items (including group wide bonuses): – we audited the inputs and assumptions into the estimates
made by management to determine if balanced judgements and accurate calculations have been applied;
– where possible, we have tested post year payments to validate the amounts recorded at the reporting period end; and
– where similar accruals and provisions were held in the previous period we compared assumptions used in the current period calculations to those used previously and tested any changes in assumptions to gain assurance that they are appropriate.
• For the contingent liabilities arising on the acquisition of Bela Ischia: – we have inspected the contract terms of the sale and
purchase agreement to understand the nature of any items covered by warranties given in the sale and purchase agreement;
– we have traced the gross liabilities through to supporting documentation; and
– we have assessed the appropriateness of the weighted average probability applied to the gross liabilities to arrive at the fair value.
Key observations communicated to the Audit Committee Based on our procedures, we have identified no instances of inappropriate management override in the areas noted.
INDEPENDENT AUDITOR’S REPORT TO THE MEMBERS OF BRITVIC PLC CONTINUED
Risk – management override of internal controlsover discounts
Description of riskThe risk of material misstatement due to management override of controls is considered a risk in every audit. Management has the primary responsibility to prevent and detect fraud. We are required by professional auditing standards to consider how this risk may manifest itself and design appropriate procedures.
Management could manipulate results through incomplete recording of expenses and liabilities, including the accounting for promotional discounts and long term discounts which are deducted from revenue and account development funds that are separately classified within selling and distribution costs.
Our response to this risk• we obtained an understanding of the group’s processes
for the recognition and management of discounts provided to customers including obtaining an understanding of the design of the controls in place within the GB and Ireland divisions where such discounts are most prevalent;
• we tested a sample of long term and promotional discount expenses and account development fund expenses throughout the period and the period end accruals by agreeing balances through to supporting documentation and ensured that the revenue recognition policies adopted complied with IFRS;
• we performed analytical procedures including the correlation of revenue to discounts to assess completeness of discounts;
• we performed testing of post year end discounts, both settled and recorded, as evidence of the appropriateness of discount accruals recognised at the year end;
• we selected a sample of post year end credit notes and ensured that, where audit evidence demonstrated that the credit note related to the audit period, that these credit notes were appropriately provided for in the fi nancial statements;
• we held bi-annual meetings with the customer account teams in GB to update our knowledge of the status of customer negotiations and the process by which discounts have been recorded; and
• we performed targeted journal entry testing at both the general ledger and rebate transaction front-end system levels. Our testing was focused on manual journal entries posted, both to the period end accruals and to the rebate income statement accounts, with a particular focus on journal entries posted close to the period end.
Key observations communicated to the Audit Committee Based on our procedures, we have identified no instances of inappropriate management override of the discounts either expensed or accrued in the financial statements.
92 www.britvic.com
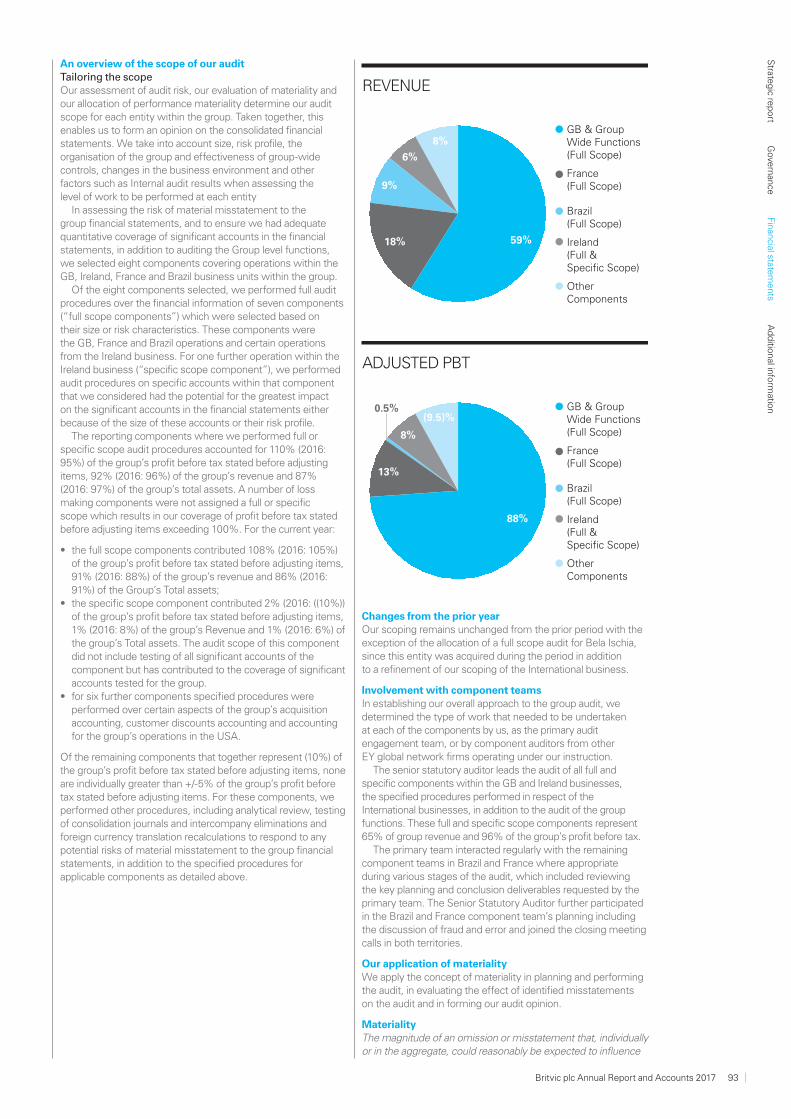
An overview of the scope of our auditTailoring the scopeOur assessment of audit risk, our evaluation of materiality and our allocation of performance materiality determine our audit scope for each entity within the group. Taken together, this enables us to form an opinion on the consolidated financial statements. We take into account size, risk profile, the organisation of the group and effectiveness of group-wide controls, changes in the business environment and other factors such as Internal audit results when assessing the level of work to be performed at each entity
In assessing the risk of material misstatement to the group financial statements, and to ensure we had adequate quantitative coverage of significant accounts in the financial statements, in addition to auditing the Group level functions, we selected eight components covering operations within the GB, Ireland, France and Brazil business units within the group.
Of the eight components selected, we performed full audit procedures over the financial information of seven components (“full scope components”) which were selected based on their size or risk characteristics. These components were the GB, France and Brazil operations and certain operations from the Ireland business. For one further operation within the Ireland business (“specific scope component”), we performed audit procedures on specific accounts within that component that we considered had the potential for the greatest impact on the significant accounts in the financial statements either because of the size of these accounts or their risk profile.
The reporting components where we performed full or specific scope audit procedures accounted for 110% (2016: 95%) of the group’s profit before tax stated before adjusting items, 92% (2016: 96%) of the group’s revenue and 87% (2016: 97%) of the group’s total assets. A number of loss making components were not assigned a full or specific scope which results in our coverage of profit before tax stated before adjusting items exceeding 100%. For the current year:
• the full scope components contributed 108% (2016: 105%) of the group’s profi t before tax stated before adjusting items, 91% (2016: 88%) of the group’s revenue and 86% (2016: 91%) of the Group’s Total assets;
• the specifi c scope component contributed 2% (2016: ((10%)) of the group’s profi t before tax stated before adjusting items, 1% (2016: 8%) of the group’s Revenue and 1% (2016: 6%) of the group’s Total assets. The audit scope of this component did not include testing of all signifi cant accounts of the component but has contributed to the coverage of signifi cant accounts tested for the group.
• for six further components specifi ed procedures were performed over certain aspects of the group’s acquisition accounting, customer discounts accounting and accounting for the group’s operations in the USA.
Of the remaining components that together represent (10%) of the group’s profit before tax stated before adjusting items, none are individually greater than +/-5% of the group’s profit before tax stated before adjusting items. For these components, we performed other procedures, including analytical review, testing of consolidation journals and intercompany eliminations and foreign currency translation recalculations to respond to any potential risks of material misstatement to the group financial statements, in addition to the specified procedures for applicable components as detailed above.
REVENUE
18%
9%
6%
8%
59%
GB & Group Wide Functions (Full Scope)
France (Full Scope)
Brazil (Full Scope)
Ireland (Full & Specific Scope)
Other Components
ADJUSTED PBT
13%
8%
0.5%(9.5)%
88%
GB & Group Wide Functions (Full Scope)
France (Full Scope)
Brazil (Full Scope)
Ireland (Full & Specific Scope)
Other Components
Changes from the prior year Our scoping remains unchanged from the prior period with the exception of the allocation of a full scope audit for Bela Ischia, since this entity was acquired during the period in addition to a refinement of our scoping of the International business.
Involvement with component teams In establishing our overall approach to the group audit, we determined the type of work that needed to be undertaken at each of the components by us, as the primary audit engagement team, or by component auditors from other EY global network firms operating under our instruction.
The senior statutory auditor leads the audit of all full and specific components within the GB and Ireland businesses, the specified procedures performed in respect of the International businesses, in addition to the audit of the group functions. These full and specific scope components represent 65% of group revenue and 96% of the group’s profit before tax.
The primary team interacted regularly with the remaining component teams in Brazil and France where appropriate during various stages of the audit, which included reviewing the key planning and conclusion deliverables requested by the primary team. The Senior Statutory Auditor further participated in the Brazil and France component team’s planning including the discussion of fraud and error and joined the closing meeting calls in both territories.
Our application of materialityWe apply the concept of materiality in planning and performing the audit, in evaluating the effect of identified misstatements on the audit and in forming our audit opinion.
MaterialityThe magnitude of an omission or misstatement that, individually or in the aggregate, could reasonably be expected to influence
Britvic plc Annual Report and Accounts 2017 93
Strate
gic re
port
Gove
rnan
ceFin
ancial state
ments
Ad
ditio
nal info
rmatio
n
INDEPENDENT AUDITOR’S REPORT TO THE MEMBERS OF BRITVIC PLC CONTINUED
the economic decisions of the users of the financial statements. Materiality provides a basis for determining the nature and extent of our audit procedures.
We determined materiality for the group to be £8.2 million (2016: £7.7 million), which is 5% of profit before tax stated before adjusting items (2016: 5% of profit before tax adjusting for the exceptional costs associated with the acquisition and integration of Britvic Brazil). We believe that profit before tax stated before adjusting items is the most relevant measure of the underlying financial performance of the group.
Performance materialityThe application of materiality at the individual account or balance level. It is set at an amount to reduce to an appropriately low level the probability that the aggregate of uncorrected and undetected misstatements exceeds materiality.
On the basis of our risk assessments, together with our assessment of the group’s overall control environment, our judgement was that performance materiality was 50% (2016: 75%) of our planning materiality, namely £4.1m (2016: £5.8m). We reduced the performance materiality factor from 75%, in the prior year, to 50% given there were a small number of individually immaterial misstatements identified in our prior period audit.
Audit work at component locations for the purpose of obtaining audit coverage over significant financial statement accounts is undertaken based on a percentage of total performance materiality. The performance materiality set for each component is based on the relative scale and risk of the component to the group as a whole and our assessment of the risk of misstatement at that component. In the current year, the range of performance materiality allocated to components was £0.8m to £4.1m (2016: £0.6m to £4.9m).
Reporting thresholdAn amount below which identified misstatements are considered as being clearly trivial.
We agreed with the Audit Committee that we would report to them all uncorrected audit differences in excess of £0.41m (2016: £0.39m), which is set at 5% of planning materiality, as well as differences below that threshold that, in our view, warranted reporting on qualitative grounds.
We evaluate any uncorrected misstatements against both the quantitative measures of materiality discussed above and in light of other relevant qualitative considerations in forming our opinion.
Other information The other information comprises the information included in the annual report set out on pages 1 to 89 and 149 to 154, including the Strategic Report, set out on pages 1 to 43, Governance, set out on pages 44 to 89, and Additional Information, set out on
pages 149 to 154, other than the financial statements and our auditor’s report thereon. The directors are responsible for the other information.
Our opinion on the financial statements does not cover the other information and, except to the extent otherwise explicitly stated in this report, we do not express any form of assurance conclusion thereon.
In connection with our audit of the financial statements, our responsibility is to read the other information and, in doing so, consider whether the other information is materially inconsistent with the financial statements or our knowledge obtained in the audit or otherwise appears to be materially misstated. If we identify such material inconsistencies or apparent material misstatements, we are required to determine whether there is a material misstatement in the financial statements or a material misstatement of the other information. If, based on the work we have performed, we conclude that there is a material misstatement of the other information, we are required to report that fact.
We have nothing to report in this regard.
In this context, we also have nothing to report in regard to our responsibility to specifically address the following items in the other information and to report any uncorrected material misstatements of the other information where we conclude that those items meet the following conditions:
• Fair, balanced and understandable set out on page 89 – the statement given by the directors that they consider the annual report and fi nancial statements taken as a whole is fair, balanced and understandable and provides the information necessary for shareholders to assess the group’s performance, business model and strategy, is materially inconsistent with our knowledge obtained in the audit; or
• Audit committee reporting set out on pages 58 to 61 – the section describing the work of the audit committee does not appropriately address matters communicated by us to the audit committee; or
• Directors’ statement of compliance with the UK Corporate Governance Code set out on page 50 – the parts of the directors’ statement required under the Listing Rules relating to the company’s compliance with the UK Corporate Governance Code containing provisions specifi ed for review by the auditor in accordance with Listing Rule 9.8.10R(2) do not properly disclose a departure from a relevant provision of the UK Corporate Governance Code.
Opinions on other matters prescribed by the Companies Act 2006In our opinion, the part of the directors’ remuneration report to be audited has been properly prepared in accordance with the Companies Act 2006.
In our opinion, based on the work undertaken in the course of the audit:
• the information given in the strategic report and the directors’ report for the fi nancial year for which the fi nancial statements are prepared is consistent with the fi nancial statements; and
• the strategic report and the directors’ report have been prepared in accordance with applicable legal requirements.
Matters on which we are required to report by exceptionIn light of the knowledge and understanding of the group and the parent company and its environment obtained in the course of the audit, we have not identified material misstatements in the strategic report or the directors’ report.
We have nothing to report in respect of the following matters in relation to which the Companies Act 2006 requires us to report to you if, in our opinion:
• adequate accounting records have not been kept by the parent company, or returns adequate for our audit have not been received from branches not visited by us; or
• the parent company fi nancial statements and the part of the Directors’ Remuneration Report to be audited are not in agreement with the accounting records and returns; or
• certain disclosures of directors’ remuneration specifi ed by law are not made; or
Starting basis
Adjustments
Materiality
Profit before tax of £138.8m as per the Annual report
Adjusting items totalling £25.9m (£21.8m included in operating profit and £4.1m included in finance costs) per page 152 of the Annual Report
Represents 5% of the profit before tax stated before adjusting items
94 www.britvic.com
• we have not received all the information and explanations we require for our audit.
Responsibilities of directorsAs explained more fully in the directors’ responsibilities statement set out on page 89, the directors are responsible for the preparation of the financial statements and for being satisfied that they give a true and fair view, and for such internal control as the directors determine is necessary to enable the preparation of financial statements that are free from material misstatement, whether due to fraud or error.
In preparing the financial statements, the directors are responsible for assessing the group and parent company’s ability to continue as a going concern, disclosing, as applicable, matters related to going concern and using the going concern basis of accounting unless the directors either intend to liquidate the group or the parent company or to cease operations, or have no realistic alternative but to do so.
Auditor’s responsibilities for the audit of the financial statements Our objectives are to obtain reasonable assurance about whether the financial statements as a whole are free from material misstatement, whether due to fraud or error, and to issue an auditor’s report that includes our opinion. Reasonable assurance is a high level of assurance, but is not a guarantee that an audit conducted in accordance with ISAs (UK) will always detect a material misstatement when it exists. Misstatements can arise from fraud or error and are considered material if, individually or in the aggregate, they could reasonably be expected to influence the economic decisions of users taken on the basis of these financial statements.
Explanation as to what extent the audit was considered capable of detecting irregularities, including fraudThe objectives of our audit, in respect to fraud, are; to identify and assess the risks of material misstatement of the financial statements due to fraud; to obtain sufficient appropriate audit evidence regarding the assessed risks of material misstatement due to fraud, through designing and implementing appropriate responses; and to respond appropriately to fraud or suspected fraud identified during the audit. However, the primary responsibility for the prevention and detection of fraud rests with both those charged with governance of the entity and management.
Our approach was as follows:
• We obtained an understanding of the legal and regulatory frameworks that are applicable to the group and determined that the most signifi cant frameworks which are directly relevant to specifi c assertions in the fi nancial statements are those that relate to the reporting framework (IFRS, FRS 101, the Companies Act 2006 and UK Corporate Governance Code) and the relevant tax compliance regulations in the jurisdictions in which the group operates. In addition, we concluded that there are certain signifi cant laws and regulations which may have an eff ect on the determination of the amounts and disclosures in the fi nancial statements being the Listing Rules of the UK Listing Authority, and those laws and regulations relating to occupational health and safety and data protection.
• We understood how the group is complying with those frameworks by making enquiries of management, internal audit and those responsible for legal and compliance procedures. We corroborated our enquiries through our review of board minutes, papers provided to the Audit Committee and any correspondence received from regulatory bodies.
• We assessed the susceptibility of the group’s fi nancial statements to material misstatement, including how fraud might occur by meeting with management from various parts of the business to understand where it considered there was susceptibility to fraud. We also considered performance targets and their infl uence on eff orts made by management to manage earnings or infl uence the perceptions of analysts. We considered the programs and controls that the group has established to address risks
identifi ed, or that otherwise prevent, deter and detect fraud; and how senior management monitors those programs and controls. Where the risk was considered to be higher, we performed audit procedures to address each identifi ed fraud risk. These procedures included testing manual journals and were designed to provide reasonable assurance that the fi nancial statements were free from fraud or error.
• Based on this understanding we designed our audit procedures to identify non-compliance with such laws and regulations identifi ed in the paragraphs above. Our procedures involved: journal entry testing, with a focus on manual consolidation journals and journals indicating large or unusual transactions based on our understanding of the business; enquiries of legal counsel, group management, internal audit, divisional management and all full and specifi c scope management; and focused testing, as referred to in the key audit matters section above.
This report is made solely to the company’s members, as a body, in accordance with Chapter 3 of Part 16 of the Companies Act 2006. Our audit work has been undertaken so that we might state to the company’s members those matters we are required to state to them in an auditor’s report and for no other purpose. To the fullest extent permitted by law, we do not accept or assume responsibility to anyone other than the company and the company’s members as a body, for our audit work, for this report, or for the opinions we have formed.
A further description of our responsibilities for the audit of the financial statements is located on the
Financial Reporting Council’s website at https://www.frc.org.uk/auditorsresponsibilities. This description forms part of our auditor’s report.
Other matters we are required to address• Following the recommendation of the audit committee
after the completion of a competitive tender process, we were reappointed as auditors by the shareholders and signed an engagement letter dated 16 May 2017. We were appointed by the company at the AGM on 31 January 2017 to audit the fi nancial statements for the 52 week period ending 1 October 2017 and subsequent fi nancial periods. The period of total uninterrupted engagements including previous renewals and reappointments since Britvic became a standalone entity upon its fl otation is 12 years, covering the 52 week period ending 1 October 2006 to the 52 week period ending 1 October 2017.
• The non-audit services prohibited by the FRC’s Ethical Standard were not provided to the group or the parent company during the 52 week period ended 1 October 2017 and we remain independent of the group and the parent company in conducting the audit.
• The audit opinion is consistent with the additional report to the audit committee
Simon O’Neill (Senior statutory auditor)
for and on behalf of Ernst & Young LLP, Statutory AuditorBirmingham28 November 2017
Notes:1. The maintenance and integrity of the Britvic group plc web site
is the responsibility of the directors; the work carried out by the auditor does not involve consideration of these matters and accordingly the auditors accept no responsibility for any changes that may have occurred to the financial statements since they were initially presented on the website.
2. Legislation in the United Kingdom governing the preparation and dissemination of the financial statements may differ from legislation in other jurisdictions.
Britvic plc Annual Report and Accounts 2017 95
Strate
gic re
port
Gove
rnan
ceFin
ancial state
ments
Ad
ditio
nal info
rmatio
n
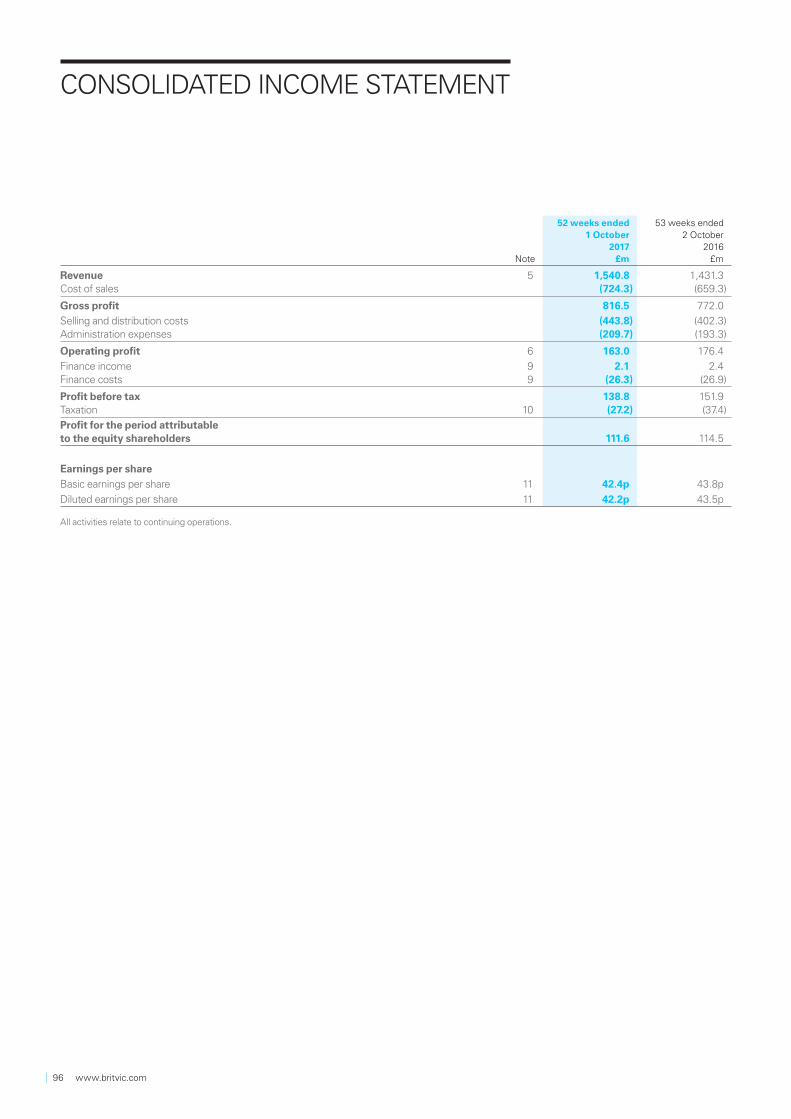
Note
52 weeks ended 1 October
2017 £m
53 weeks ended2 October
2016 £m
Revenue 5 1,540.8 1,431.3Cost of sales (724.3) (659.3)
Gross profit 816.5 772.0
Selling and distribution costs (443.8) (402.3)Administration expenses (209.7) (193.3)
Operating profit 6 163.0 176.4
Finance income 9 2.1 2.4Finance costs 9 (26.3) (26.9)
Profit before tax 138.8 151.9Taxation 10 (27.2) (37.4)
Profit for the period attributable to the equity shareholders 111.6 114.5
Earnings per share
Basic earnings per share 11 42.4p 43.8p
Diluted earnings per share 11 42.2p 43.5p
All activities relate to continuing operations.
CONSOLIDATED INCOME STATEMENT
96 www.britvic.com
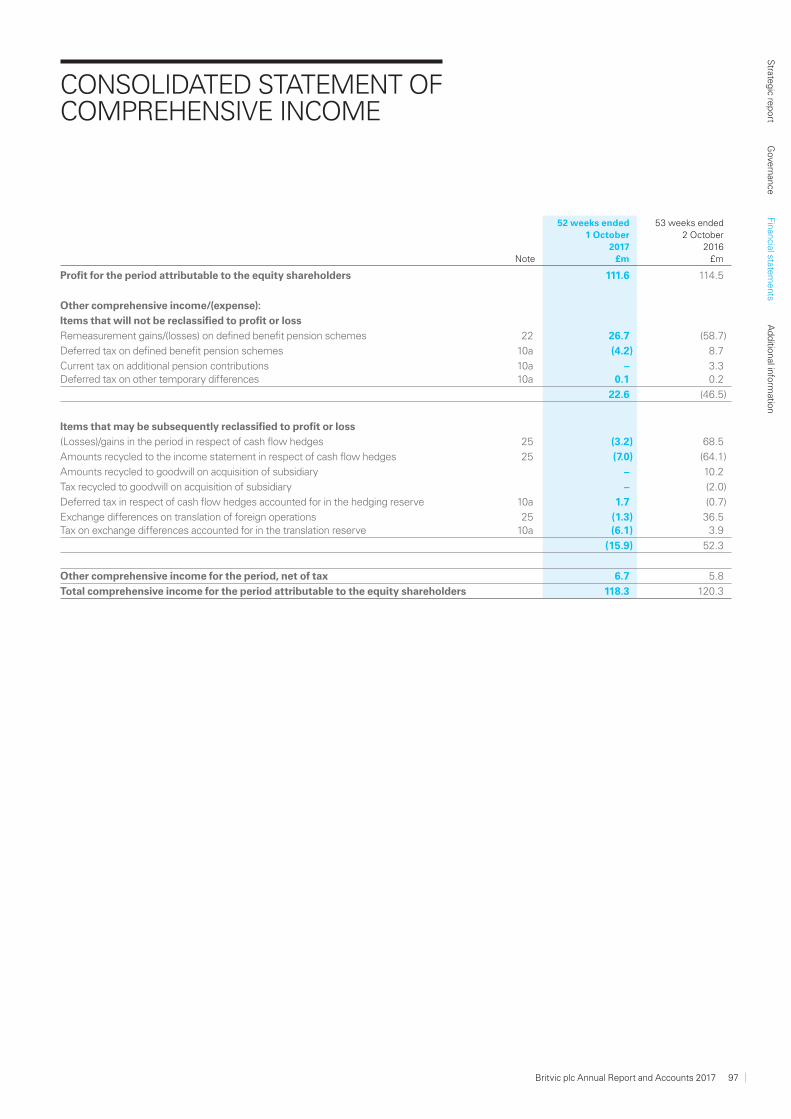
CONSOLIDATED STATEMENT OF COMPREHENSIVE INCOME
Note
52 weeks ended1 October
2017 £m
53 weeks ended2 October
2016£m
Profit for the period attributable to the equity shareholders 111.6 114.5
Other comprehensive income/(expense):
Items that will not be reclassified to profit or loss
Remeasurement gains/(losses) on defined benefit pension schemes 22 26.7 (58.7)
Deferred tax on defined benefit pension schemes 10a (4.2) 8.7
Current tax on additional pension contributions 10a – 3.3Deferred tax on other temporary differences 10a 0.1 0.2
22.6 (46.5)
Items that may be subsequently reclassified to profit or loss
(Losses)/gains in the period in respect of cash flow hedges 25 (3.2) 68.5
Amounts recycled to the income statement in respect of cash flow hedges 25 (7.0) (64.1)
Amounts recycled to goodwill on acquisition of subsidiary – 10.2
Tax recycled to goodwill on acquisition of subsidiary – (2.0)
Deferred tax in respect of cash flow hedges accounted for in the hedging reserve 10a 1.7 (0.7)
Exchange differences on translation of foreign operations 25 (1.3) 36.5Tax on exchange differences accounted for in the translation reserve 10a (6.1) 3.9
(15.9) 52.3
Other comprehensive income for the period, net of tax 6.7 5.8
Total comprehensive income for the period attributable to the equity shareholders 118.3 120.3
Britvic plc Annual Report and Accounts 2017 97
Strate
gic re
port
Gove
rnan
ceFin
ancial state
ments
Ad
ditio
nal info
rmatio
n
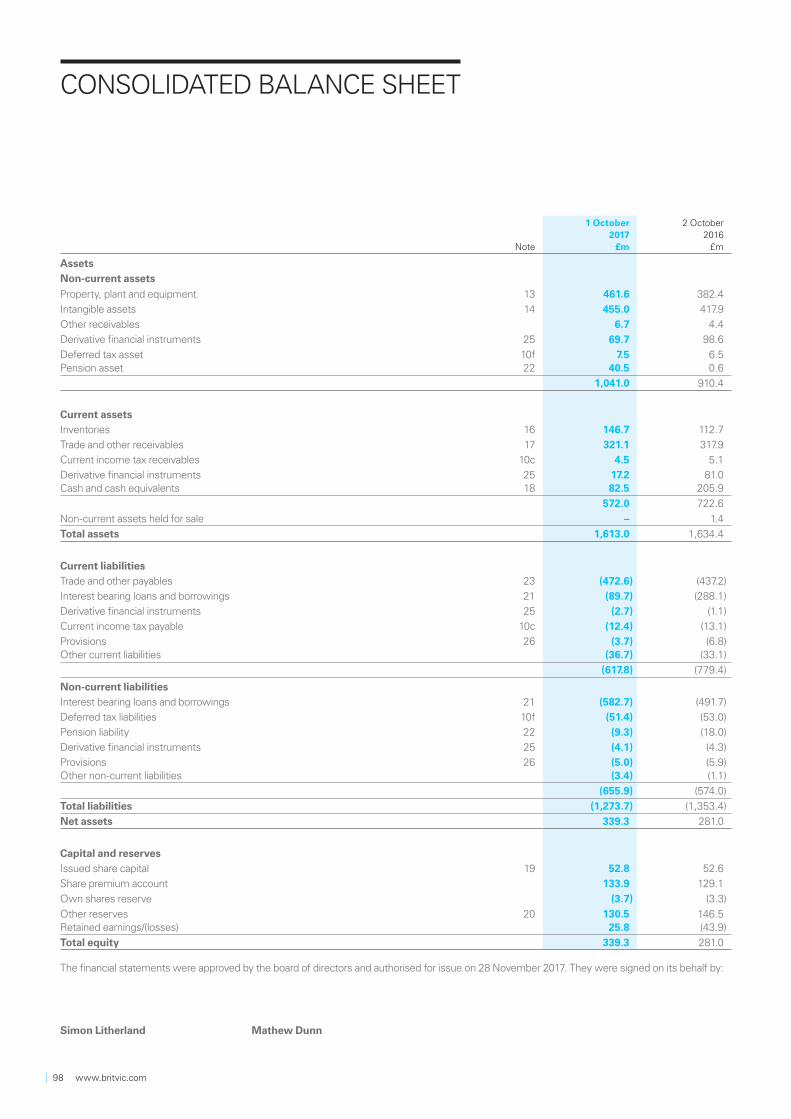
CONSOLIDATED BALANCE SHEET
Note
1 October 2017
£m
2 October 2016
£m
Assets
Non-current assets
Property, plant and equipment 13 461.6 382.4
Intangible assets 14 455.0 417.9
Other receivables 6.7 4.4
Derivative financial instruments 25 69.7 98.6
Deferred tax asset 10f 7.5 6.5Pension asset 22 40.5 0.6
1,041.0 910.4
Current assets
Inventories 16 146.7 112.7
Trade and other receivables 17 321.1 317.9
Current income tax receivables 10c 4.5 5.1
Derivative financial instruments 25 17.2 81.0Cash and cash equivalents 18 82.5 205.9
572.0 722.6
Non-current assets held for sale – 1.4
Total assets 1,613.0 1,634.4
Current liabilities
Trade and other payables 23 (472.6) (437.2)
Interest bearing loans and borrowings 21 (89.7) (288.1)
Derivative financial instruments 25 (2.7) (1.1)
Current income tax payable 10c (12.4) (13.1)
Provisions 26 (3.7) (6.8)Other current liabilities (36.7) (33.1)
(617.8) (779.4)
Non-current liabilities
Interest bearing loans and borrowings 21 (582.7) (491.7)
Deferred tax liabilities 10f (51.4) (53.0)
Pension liability 22 (9.3) (18.0)
Derivative financial instruments 25 (4.1) (4.3)
Provisions 26 (5.0) (5.9)Other non-current liabilities (3.4) (1.1)
(655.9) (574.0)
Total liabilities (1,273.7) (1,353.4)
Net assets 339.3 281.0
Capital and reserves
Issued share capital 19 52.8 52.6
Share premium account 133.9 129.1
Own shares reserve (3.7) (3.3)
Other reserves 20 130.5 146.5Retained earnings/(losses) 25.8 (43.9)
Total equity 339.3 281.0
The financial statements were approved by the board of directors and authorised for issue on 28 November 2017. They were signed on its behalf by:
Simon Litherland Mathew Dunn
98 www.britvic.com

CONSOLIDATED STATEMENT OF CASH FLOWS
Note
52 weeks ended1 October
2017 £m
53 weeks ended2 October
2016 £m
Cash flows from operating activities
Profit before tax 138.8 151.9
Net finance costs 9 24.2 24.5
Other financial instruments 13.5 (13.6)
Impairment of property, plant and equipment and intangible assets 13,14 (2.6) 0.7
Depreciation 13 40.3 33.2
Amortisation 14 19.0 16.3
Share based payments 27 6.3 6.6
Net pension charge less contributions (22.1) (25.9)
Increase in inventory (24.2) (0.3)
Decrease in trade and other receivables 4.3 10.9
Increase/(decrease) in trade and other payables 41.2 (40.3)
(Decrease)/increase in provisions (4.9) 3.3
Loss/(profit) on disposal of property, plant and equipment and intangible assets 1.6 (0.3)Income tax paid (37.4) (34.2)
Net cash flows from operating activities 198.0 132.8
Cash flows from investing activities
Proceeds from sale of property, plant and equipment 17.7 6.7
Purchases of property, plant and equipment (139.8) (114.2)
Purchases of intangible assets (6.9) (7.7)
Interest received 0.8 1.7Acquisition of subsidiaries, net of cash acquired 31 (60.3) (41.2)
Net cash flows used in investing activities (188.5) (154.7)
Cash flows from financing activities
Interest paid, net of derivative financial instruments (20.8) (22.2)
Net movement on revolving credit facility 21 (91.4) 104.7
Other interest bearing loans repaid 21 (0.6) (0.1)
Net repayment of finance leases 21 (0.8) (0.1)
Acquired debt repaid 21 (2.4) (38.0)
Partial repayment of USPP Notes 21 (119.6) –
Issue of 2017 USPP Notes 21 175.0 –
Issue costs paid 21 (0.7) –
Issue of shares relating to incentive schemes for employees 0.7 5.9
Issue of shares under a non pre-emptive placing, net of costs 19 – (1.1)
Purchase of own shares (5.3) (2.1)Dividends paid to equity shareholders 12 (64.9) (60.9)
Net cash flows used in financing activities (130.8) (13.9)
Net decrease in cash and cash equivalents (121.3) (35.8)
Cash and cash equivalents at beginning of period 205.9 239.6Exchange rate differences 28 (2.1) 2.1
Cash and cash equivalents at the end of the period 18 82.5 205.9
Britvic plc Annual Report and Accounts 2017 99
Strate
gic re
port
Gove
rnan
ceFin
ancial state
ments
Ad
ditio
nal info
rmatio
n
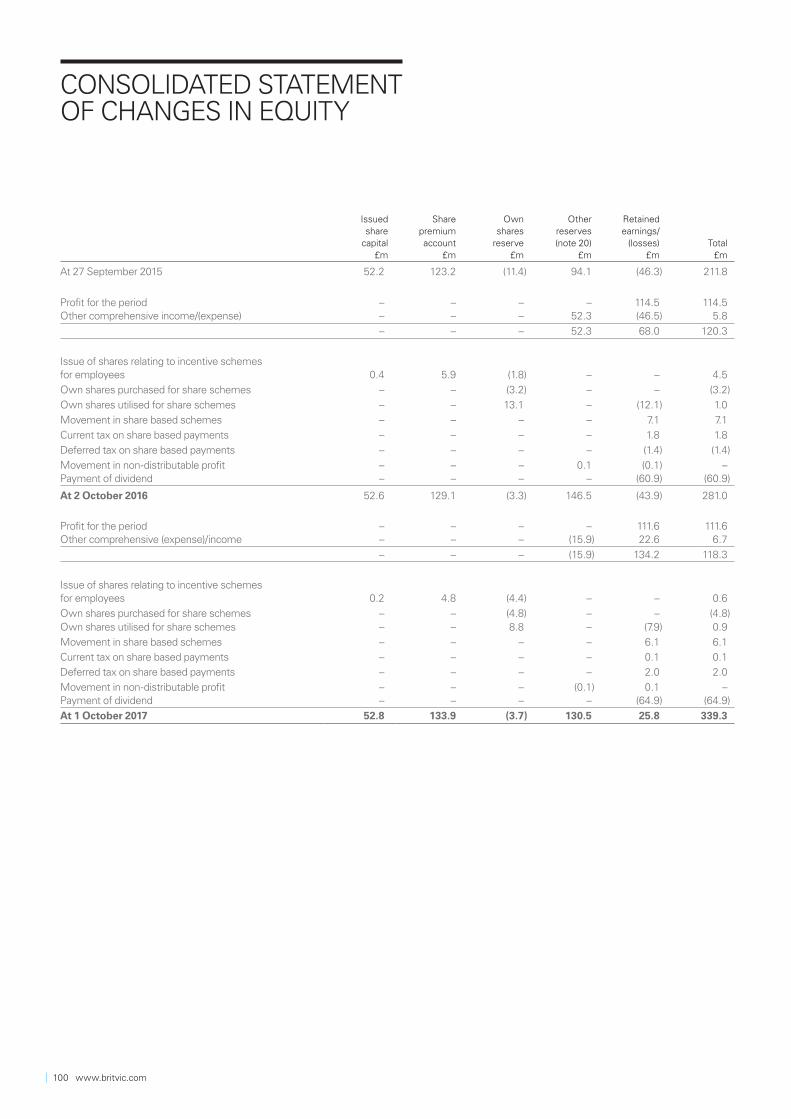
CONSOLIDATED STATEMENT OF CHANGES IN EQUITY
Issuedshare
capital£m
Sharepremiumaccount
£m
Ownshares
reserve£m
Otherreserves (note 20)
£m
Retained earnings/
(losses)£m
Total£m
At 27 September 2015 52.2 123.2 (11.4) 94.1 (46.3) 211.8
Profit for the period – – – – 114.5 114.5Other comprehensive income/(expense) – – – 52.3 (46.5) 5.8
– – – 52.3 68.0 120.3
Issue of shares relating to incentive schemes for employees 0.4 5.9 (1.8) – – 4.5
Own shares purchased for share schemes – – (3.2) – – (3.2)
Own shares utilised for share schemes – – 13.1 – (12.1) 1.0
Movement in share based schemes – – – – 7.1 7.1
Current tax on share based payments – – – – 1.8 1.8
Deferred tax on share based payments – – – – (1.4) (1.4)
Movement in non-distributable profit – – – 0.1 (0.1) –Payment of dividend – – – – (60.9) (60.9)
At 2 October 2016 52.6 129.1 (3.3) 146.5 (43.9) 281.0
Profit for the period – – – – 111.6 111.6Other comprehensive (expense)/income – – – (15.9) 22.6 6.7
– – – (15.9) 134.2 118.3
Issue of shares relating to incentive schemes for employees 0.2 4.8 (4.4) – – 0.6
Own shares purchased for share schemes – – (4.8) – – (4.8)Own shares utilised for share schemes – – 8.8 – (7.9) 0.9
Movement in share based schemes – – – – 6.1 6.1
Current tax on share based payments – – – – 0.1 0.1
Deferred tax on share based payments – – – – 2.0 2.0
Movement in non-distributable profit – – – (0.1) 0.1 –Payment of dividend – – – – (64.9) (64.9)
At 1 October 2017 52.8 133.9 (3.7) 130.5 25.8 339.3
100 www.britvic.com
1. General information
Britvic plc (the ’company’) is a company incorporated in the United Kingdom under the Companies Act 2006. It is a public limited company domiciled in England & Wales and its ordinary shares are traded on the London Stock Exchange. Britvic plc and its subsidiaries (together the ‘group’) operate in the soft drinks manufacturing and distribution industry, principally in the United Kingdom, Republic of Ireland, France and Brazil.
The financial year represents 52 weeks ended 1 October 2017 (prior financial year 53 weeks ended 2 October 2016).
The financial statements were authorised for issue by the board of directors on 28 November 2017.
2. Statement of compliance
The financial information has been prepared on the basis of applicable International Financial Reporting Standards as adopted by the European Union (IFRS), as they apply to the financial statements of the group.
3. Accounting policies
Basis of preparation
The financial statements have been prepared on a going concern basis.
The consolidated financial statements have been prepared on a historical cost basis except where measurement of balances at fair value is required as explained below. The consolidated financial statements of the group are presented in pounds sterling, which is also the functional currency of the company, and all values are rounded to the nearest 0.1 million except where otherwise indicated.
Going concern
The directors are confident that it is appropriate for the going concern basis to be adopted in preparing the financial statements. As at 1 October 2017, the consolidated balance sheet is showing a net assets position of £339.3m (2 October 2016: net assets of £281.0m).
Group reserves are low due to the capital restructuring undertaken at the time of flotation. This does not impact on Britvic plc’s ability to make dividend payments.
The liquidity of the group remains strong, the group has a £400.0m bank facility, on which the group had drawn down £22.3m as at 1 October 2017, with an extended maturity date of November 2021, and £645.0m of private placement notes which have maturity dates between 2017 and 2032.
Basis of consolidation
The consolidated financial statements of the group incorporate the financial information of the company and the entities controlled by the company (its subsidiaries) in accordance with IFRS 10 ‘Consolidated financial statements’. Control is achieved when the company:
• Has the power over the investee;• Is exposed, or has rights, to variable returns from its involvement with the investee; and• Has the ability to use its power to aff ect its returns.
The financial statements of subsidiaries are prepared using consistent accounting policies. All intra-group transactions, balances, income and expenses are eliminated on consolidation. The results of subsidiary undertakings acquired in the year are included in the consolidated income statement from the date the group gains control or up to the date control ceases respectively.
Change in accounting policy
The group has made a change to its accounting policies in the current period. Specifically the group has removed the separable classification of exceptional items from the consolidated income statement.
Revenue recognition
Revenue is recognised to the extent that it is probable that the economic benefits will flow to the group and the revenue can be reliably measured, regardless of when payment is being made.
Revenue is recognised when goods are delivered and accepted by customers, when the significant risks and rewards of ownership of the goods have passed to the buyer and the amount can be measured reliably.
Revenue is the value of sales, excluding transactions with or between subsidiaries, after the deduction of sales related discounts and rebates, value added tax and other sales related taxes. Sales related discounts comprise:
• Long term discounts and rebates – which are sales incentives to customers to encourage them to purchase increased volumes and are related to total volumes purchased and sales growth
• Short term promotional discounts – which are directly related to promotions run by customers
Where sales related rebates and discounts are earned, management make an accrual where it is probable that the rebate will be earned by the customer. Accruals are made for each individual promotion or rebate based on the specific terms and conditions of the customer agreement. Management make estimates on an ongoing basis to assess customer performance and sales volume to calculate total amounts earned to be recorded as deductions from revenue.
NOTES TO THE CONSOLIDATED FINANCIAL STATEMENTS
Britvic plc Annual Report and Accounts 2017 101
Strate
gic re
port
Gove
rnan
ceFin
ancial state
ments
Ad
ditio
nal info
rmatio
n
NOTES TO THE CONSOLIDATED FINANCIAL STATEMENTS CONTINUED
3. Accounting policies (continued)
Property, plant and equipment
Property, plant and equipment are stated at cost less accumulated depreciation and any impairment losses. Cost comprises the aggregate amount paid and the fair value of any other consideration given to acquire the asset and includes costs directly attributable to making the asset capable of operating as intended.
Assets under construction are carried at cost. Depreciation of these assets commences when they are ready for use.
Depreciation is calculated so as to write off the cost of an asset, less its estimated residual value, on a straight-line basis, over the useful economic life of that asset as follows:
Plant and machinery 3 to 20 yearsVehicles (included in plant and machinery) 5 to 7 yearsEquipment in retail outlets (included in fixtures, fittings, tools and equipment) 5 to 10 yearsOther fixtures and fittings (included in fixtures, fittings, tools and equipment) 3 to 10 years
Land is not depreciated.
Freehold properties are depreciated over 50 years.
Leasehold properties are depreciated over 50 years, or over the unexpired lease term when this is less than 50 years.
An item of property, plant and equipment is derecognised upon disposal or when no future economic benefits are expected to arise from the continued use of the asset. Gains and losses on disposals are determined by comparing proceeds with carrying amount, and are included in the consolidated income statement in the period of derecognition.
The carrying values of property, plant and equipment are reviewed for impairment when events or changes in circumstances indicate the carrying value may not be recoverable and are written down immediately to their recoverable amount. Useful lives and residual amounts are reviewed annually and where adjustments are required these are made prospectively.
Non-current assets held for sale
The group classifies non-current assets as held for sale if their carrying amounts will be recovered principally through a sale rather than continuing use. Such non-current assets as held for sale are measured at the lower of their carrying value and fair value less costs to sell.
Property, plant and equipment and intangibles assets are not depreciated or amortised once classified as held for sale.
Assets classified as held for sale are presented separately beneath current items in the consolidated balance sheet.
Business combinations and goodwill
While the original acquisition of Britannia Soft Drinks Limited was accounted for under the merger method, business combinations on or after 4 October 2004 have been accounted for under IFRS 3 ‘Business Combinations’ using the acquisition method. The consideration transferred in a business combination is measured at fair value which includes recording deferred consideration at discounted values where the impact of discounting is material.
On acquisition, the assets, liabilities and contingent liabilities of a subsidiary are measured at their fair values at the date of acquisition. Any excess of the cost of acquisition over the fair values of the identifiable net assets acquired is recognised as goodwill. Any deficiency of the cost of acquisition below the fair values of the identifiable net assets acquired (discount on acquisition) is credited to the consolidated income statement in the period of acquisition.
Following initial recognition, goodwill is measured at cost less accumulated impairment losses. Goodwill is not amortised.
On disposal of a subsidiary the attributable amount of goodwill is included in the determination of the profit or loss on disposal.
102 www.britvic.com

3. Accounting policies (continued)
Intangible assets
Software costs
Software expenditure is recognised as an intangible asset only after its technical feasibility and commercial viability can be demonstrated. Acquired computer software licences and software developed in-house are capitalised on the basis of the costs incurred to acquire and bring to use the specific software. Costs include resources focussed on delivery of capital projects where the choice has been made to use internal resources rather than external resources. These costs are amortised over their estimated useful lives of three to seven years on a straight line basis.
Trademarks, franchise rights and customer lists
Intangible assets acquired separately are measured on initial recognition at the fair value of consideration paid. Following initial recognition, intangible assets are carried at cost less any accumulated amortisation or impairment losses. An intangible asset acquired as part of a business combination is recognised outside goodwill, at fair value at the date of acquisition, if the asset is separable or arises from contractual or other legal rights and its fair value can be measured reliably.
The useful lives of intangible assets are assessed to be either finite or indefinite. Amortisation is charged on assets with finite lives on a straight-line basis over a period appropriate to the asset’s useful life.
The carrying values of intangible assets with finite and indefinite lives are reviewed for impairment when events or changes in circumstances indicate that the carrying value may not be recoverable.
Intangible assets with indefinite useful lives are also tested for impairment annually either individually or, if the intangible asset does not generate cash flows that are largely independent of those from other assets or groups of assets, as part of the cash generating unit to which it belongs. Such intangibles are not amortised. The useful life of an intangible asset with an indefinite life is reviewed annually to determine whether indefinite life assessment continues to be supportable. If not, the change in the useful life assessment from indefinite to finite is made on a prospective basis.
Research and development
Research costs are expensed as incurred. Development expenditure is recognised as an intangible asset when the group can demonstrate:
• The technical feasibility of completing the intangible asset so that the asset will be available for use• Its intention to complete and its ability to use the asset• How the asset will generate future economic benefi ts• The availability of resources to complete the asset• The ability to measure reliably the expenditure during development• The ability to use the intangible asset generated
Following initial recognition of development expenditure as an asset, the asset is carried at cost less any accumulated amortisation and accumulated impairment losses. Amortisation of the asset begins when development is complete and available for use. It is amortised over the period of expected future benefit. During the period of development, the asset is tested for impairment annually.
Impairment of goodwill and intangible assets
Goodwill and indefinite life intangible assets are reviewed for impairment at least annually and whenever events or changes in circumstances indicate that the carrying value may be impaired. For all remaining intangible assets the group assesses at each reporting date whether there is an indication that an asset may be impaired. Where impairment testing for an asset is required, the group makes an estimate of the asset’s recoverable amount or the recoverable amount of the Cash Generating Unit (“CGU”) to which the asset belongs if it does not generate largely independent cash flows. An asset’s recoverable amount is the higher of an asset’s fair value less costs to sell and its value in use and is determined for an individual asset, unless the asset does not generate cash inflows that are largely independent of those from other assets or groups of assets. Where the carrying amount of an asset exceeds its recoverable amount, the asset is considered impaired and is written down to its recoverable amount. In assessing value in use, the estimated future cash flows are discounted to their present value using a pre-tax discount rate that reflects senior management’s estimate of the cost of capital. Impairment losses of continuing operations are recognised in the consolidated income statement in those expense categories consistent with the function of the impaired asset.
An assessment is made at each reporting date as to whether there is any indication that previously recognised impairment losses may no longer exist or may have decreased. If such an indication exists, the recoverable amount is estimated. A previously recognised impairment loss is reversed only if there has been a change in the estimates used to determine the asset’s recoverable amount since the last impairment loss was recognised. If that is the case the carrying amount of the asset is increased to its recoverable amount. That increased amount cannot exceed the carrying amount that would have been determined, net of depreciation, had no impairment loss been recognised for the asset in prior years. Goodwill impairment losses cannot subsequently be reversed.
Inventories and work in progress
Inventories are stated at the lower of cost and net realisable value. Cost comprises direct materials and, where applicable, direct labour costs and those overheads that have been incurred in bringing inventories to their present location and condition. Cost is determined using the weighted average cost method. Net realisable value represents the estimated selling price less all estimated costs of completion and costs to be incurred in marketing, selling and distribution.
Britvic plc Annual Report and Accounts 2017 103
Strate
gic re
port
Gove
rnan
ceFin
ancial state
ments
Ad
ditio
nal info
rmatio
n
NOTES TO THE CONSOLIDATED FINANCIAL STATEMENTS CONTINUED
3. Accounting policies (continued)
Financial assets
The group determines the classification of its financial assets at initial recognition. When financial assets are recognised initially, they are measured at fair value, which is normally the transaction price, plus directly attributable transaction costs for those financial assets not subsequently measured at fair value through profit or loss. The group assesses at each reporting date whether a financial asset or group of financial assets is impaired.
Loans and receivables
The group has financial assets that are classified as loans and receivables. Loans and receivables are non-derivative financial assets with fixed or determinable payments that are not quoted in an active market, do not qualify as trading assets and have not been designated as either fair value through profit or loss or available for sale. Such assets are carried at amortised cost using the effective interest method if the time value of money is significant. Gains and losses are recognised in the consolidated income statement when loans and receivables are derecognised or impaired.
Trade and other receivables
Trade receivables, which generally have 30-90 day terms, are recognised at the lower of their original invoiced value and recoverable amount.
Provision is made when collection of the full amount is no longer considered probable. Balances are written off when the probability of recovery is assessed as being remote.
Fair value
The group measures financial instruments, such as derivatives, at fair value at each balance sheet date.
Fair value is the price that would be received to sell an asset or paid to transfer a liability in an orderly transaction between market participants at the measurement date. The fair value measurement is based on the presumption that the transaction to sell the asset or transfer the liability takes place either:
• In the principal market for the asset or liability; or• In the absence of a principal market, in the most advantageous market for the asset or liability.
The fair value of an asset or liability is measured using the assumptions that market participants would use when pricing the asset or liability, assuming that market participants act in their economic best interest.
The group uses valuation techniques that are appropriate in the circumstance and for which sufficient data is available to measure fair value, maximising the use of relevant observable inputs and minimising the use of unobservable inputs.
All assets and liabilities for which fair value is measured or disclosed in the financial statements are categorised within the fair value hierarchy, described as follows, based on the lowest level input that is significant to the fair value measurement as a whole:
Level 1: quoted (unadjusted) prices in active markets for identical assets or liabilities.
Level 2: other techniques for which all inputs which have a significant effect on the recorded fair value are observable, either directly or indirectly.
Level 3: techniques which use inputs which have a significant effect on the recorded fair value that are not based on observable market data.
For assets and liabilities that are recognised in the financial statements on a recurring basis, the group determines whether transfers have occurred between levels in the hierarchy by re-assessing categorisation at the end of each reporting period.
Derivative financial instruments and hedging
The group uses derivative financial instruments such as forward currency contracts and interest rate swaps to hedge its risks associated with foreign currency and interest rate fluctuations. All derivative financial instruments are initially recognised and subsequently remeasured at fair value. Derivatives are carried as assets when the fair value is positive and as liabilities when the fair value is negative.
The fair value of forward currency contracts is calculated by reference to current forward exchange rates for contracts with similar maturity profiles. The fair value of interest rate swap contracts is determined by reference to market values for similar instruments.
For those derivatives designated as hedges and for which hedge accounting is appropriate, the hedging relationship is documented at its inception. This documentation identifies the hedging instrument, the hedged item or transaction, the nature of the risk being hedged and how effectiveness will be measured throughout its duration. Such hedges are expected at inception to be highly effective.
Any gains or losses arising from changes in the fair value of derivatives that do not qualify for hedge accounting are taken to the consolidated income statement. The treatment of gains and losses arising from revaluing derivatives designated as hedging instruments depends on the nature of the hedging relationship, as follows:
104 www.britvic.com
3. Accounting policies (continued)
Derivative financial instruments and hedging (continued)
Cash flow hedges
Hedges are classified as cash flow hedges when hedging exposure to variability in cash flows that is either attributable to a particular risk associated with a recognised asset or liability or a highly probable forecast transaction. For cash flow hedges, the effective portion of the gain or loss on the hedging instrument is recognised in other comprehensive income, while the ineffective portion is recognised in the consolidated income statement.Amounts previously recognised in other comprehensive income are transferred to the consolidated income statement in the period in which the hedged item affects profit or loss, such as when a forecast sale occurs. However, when the forecast transaction results in the recognition of a non-financial asset or liability, the amounts previously recognised in other comprehensive income are included in the initial carrying amount of the asset or liability.
If a forecast transaction is no longer expected to occur, amounts previously recognised in other comprehensive income are transferred to the consolidated income statement. If the hedging instrument expires or is sold, terminated or exercised without replacement or rollover, or if its designation as a hedge is revoked, amounts previously recognised in other comprehensive income remain in equity until the forecast transaction occurs and are then transferred to the consolidated income statement or included in the initial carrying amount of a non-financial asset or liability as above.
Net investment hedges
Financial instruments are classified as net investment hedges when they hedge the group’s net investment in foreign operations. Some of the group’s foreign currency borrowings qualify as hedging instruments that hedge foreign currency net investment balances. The effective portion of gains or losses on translation of borrowings designated as net investment hedges is recognised in other comprehensive income. Any ineffective portion is recognised immediately in the consolidated income statement. Upon disposal of the associated investment in foreign operations any cumulative gain or loss previously recognised in other comprehensive income is recycled through the consolidated income statement.
Fair value hedges
Hedges of the change in fair value of recognised assets or liabilities are classified as fair value hedges. For fair value hedges, the gain or loss on the fair value of the hedging instrument is recognised in the consolidated income statement. The gain or loss on the hedged item attributable to the hedged risk adjusts the carrying amount of the hedged item and is also recognised in the consolidated income statement. If the hedge relationship no longer meets the criteria for hedge accounting, the hedged item would no longer be adjusted and the cumulative adjustment to its carrying amount would be amortised to the consolidated income statement based on a recalculated effective interest rate. The fair value gain or loss on the hedging instrument would continue to be recorded in the consolidated income statement.
Derecognition of financial instruments
The derecognition of a financial asset takes place when the contractual rights to the cash flows expire, or when the contractual rights to the cash flows have either been transferred or an obligation has been assumed to pass them through to a third party and the group does not retain substantially all the risks and rewards of the asset.
Financial liabilities are only derecognised when they are extinguished, that is, when the obligation is discharged, cancelled or expires.
Share-based payments
The cost of equity-settled transactions with employees is measured by reference to the fair value at the date at which they are granted. Fair value is determined by an external valuer using an appropriate pricing model. In valuing equity-settled transactions, no account is taken of any performance conditions, other than conditions linked to the price of the shares (‘market conditions’).
The cost of equity-settled transactions is recognised, together with a corresponding increase in equity, over the period in which the performance conditions are fulfilled, ending on the date on which the relevant employees become fully entitled to the award (‘vesting date’). The cumulative expense recognised for equity-settled transactions at each reporting date until the vesting date reflects the extent to which the vesting period has expired and the number of equity instruments that, in the opinion of the Directors and based on the best available estimate at that date, will ultimately vest (or in the case of an instrument subject to a market condition, be treated as vesting as described below). The consolidated income statement charge or credit for a period represents the movement in cumulative expense recognised as at the beginning and end of that period.
No expense is recognised for awards that do not ultimately vest, except for awards where vesting is conditional upon a market condition, which are treated as vesting irrespective of whether or not the market condition is satisfied, provided that all other performance conditions are satisfied.
Taxation
The current income tax expense is based on taxable profits for the period, after any adjustments in respect of prior periods. It is calculated using taxation rates enacted or substantively enacted by the balance sheet date and is measured at the amount expected to be recovered from or paid to the taxation authorities.
Provision is made for deferred tax liabilities, or credit taken for deferred tax assets, on all material temporary differences between the tax base of assets and liabilities and their carrying values in the consolidated financial statements.
The principal temporary differences arise from accelerated capital allowances, intangible assets, provisions for pensions and other post-retirement benefits, provisions for share-based payments and unutilised losses incurred in overseas jurisdictions.
Deferred tax assets are recognised to the extent that it is regarded as probable that future taxable profits will be available against which the temporary differences can be utilised.
Deferred tax is calculated at the tax rates that are expected to apply in the periods in which the asset or liability will be settled based on the tax rates enacted or substantively enacted by the balance sheet date.
Provisions
Provisions are recognised when the group has a present legal or constructive obligation as a result of past events; it is probable that an outflow of resources will be required to settle the obligation; and the amount can be reliably estimated. Provisions are not recognised for future operating losses.
Provisions are measured at the present value of the expenditures expected to be required to settle the obligation using a pre-tax rate that reflects current market assessments of the time value of money and the risks specific to the obligation. The increase in the provision due to passage of time is recognised as a finance cost.
Britvic plc Annual Report and Accounts 2017 105
Strate
gic re
port
Gove
rnan
ceFin
ancial state
ments
Ad
ditio
nal info
rmatio
n
NOTES TO THE CONSOLIDATED FINANCIAL STATEMENTS CONTINUED
3. Accounting policies (continued)
Pensions and post retirement benefits
The group operates a number of pension schemes. These include both defined benefit and defined contribution plans.
Defined benefit plans
The defined benefit pension liability or asset in the balance sheet comprises the total for each plan of the present value of the defined benefit obligation less the fair value of plan assets out of which the obligations are to be settled directly. The cost of providing benefits is determined using the projected unit credit method, with actuarial valuations being carried out at the end of each reporting period.
Remeasurement, comprising actuarial gains and losses, the effect of the asset ceiling and the return on plan assets (excluding interest), is reflected immediately in the statement of financial position with a charge or credit recognised in other comprehensive income in the period in which they occur. Remeasurement recognised in other comprehensive income is reflected immediately in retained earnings and will not be reclassified to profit or loss.
Past service cost is recognised in the consolidated income statement in the period of a plan amendment. Net interest is calculated by applying the discount rate at the beginning of the period to the net defined benefit liability or asset.
Defined benefit costs are categorised as follows:
• Service cost (including current service cost, past service cost, as well as gains and losses on curtailments and settlements);• Net interest expense or income; and• Remeasurement.
The retirement benefit obligation recognised in the consolidated balance sheet represents the deficit or surplus in the group’s defined benefit plans. Any surplus resulting from this calculation is limited to the present value of any economic benefits available in the form of refunds from the plans or reductions in future contributions to the plans.
Defined contribution plans
Under defined contribution plans, contributions payable for the period are charged to the consolidated income statement as an operating expense.
Employee benefits
Wages, salaries, bonuses and paid annual leave are accrued in the period in which the associated services are rendered by the employees of the group.
Leases
Leases in which substantially all the risks and rewards of ownership of the leased asset are retained by the lessor are classified as operating leases by the group. Leases in which the group assumes substantially all the risks and rewards of ownership are classified as finance leases.
Rentals payable under operating leases are charged to income on a straight-line basis over the term of the relevant lease. Any lease incentives received are credited to the consolidated income statement on a straight-line basis over the term of the leases to which they relate.
Cash and cash equivalents
Cash and cash equivalents includes cash in hand, on demand deposits with banks and other short-term, highly liquid investments with original maturities of three months or less, which are readily convertible into known amounts of cash and subject to insignificant risk of changes in value. For the purposes of the statement of cash flows, bank overdrafts repayable on demand are a component of cash and cash equivalents.
Interest bearing loans and borrowings
Interest bearing loans and borrowings are initially recognised in the balance sheet at fair value less directly attributable transaction costs and are subsequently measured at amortised cost using the effective interest rate method.
Gains and losses arising on the repurchase, settlement or otherwise cancellation of liabilities are recognised respectively in finance income and finance cost.
On a refinancing any unamortised financing charges are accelerated through the consolidated income statement.
106 www.britvic.com
3. Accounting policies (continued)
Foreign currencies
Functional and presentation currency
The consolidated financial statements of the group are presented in pounds sterling. The presentation currency of the consolidated financial statements is the same as the functional currency of the company. For each entity the Group determines the functional currency and items, included in the financial statements of each entity, are measured using that functional currency.
Transactions and balances
Transactions in foreign currencies are recorded at the rate ruling at the date of the transaction. Monetary assets and liabilities denominated in foreign currencies are translated at the rate of exchange ruling at the balance sheet date. All differences are taken to the consolidated income statement, except when hedge accounting is applied and for differences in monetary assets and liabilities that form part of the group’s net investment in a foreign operation. These are taken in other comprehensive income until the disposal of the net investment, at which time they are recognised in the consolidated income statement.
Foreign operations
The consolidated income statement and statement of cash flows of foreign operations are translated at the average rate of exchange during the period. The balance sheet is translated at the rate ruling at the reporting date. Exchange differences arising on opening net assets and arising on the translation of results at an average rate compared to a closing rate are both recognised in other comprehensive income. On disposal of a foreign operation, the accumulated exchange differences previously recognised in other comprehensive income are included in the consolidated income statement.
Certain of the group’s financial instruments are classified as net investment hedges when they hedge the group’s net investment in foreign operations. See derivative financial instruments and hedging policy above for further detail.
Issued share capital
Ordinary shares are classified as equity. Incremental costs directly attributable to the issue of new shares or options are shown in equity as a deduction, net of tax, from the proceeds.
Own shares
The cost of own shares held in employee share trusts and in treasury is deducted from shareholders’ equity until the shares are cancelled, reissued or disposed. Where such shares are subsequently sold or reissued, the fair value of any consideration received is also included in shareholders’ equity.
New standards adopted in the current period
During the period, the group did not adopt any new standards.
New standards and interpretations not applied
The group has not applied the following IFRSs, which may be applicable to the group, that have been issued (although in some cases not yet adopted by the EU) but are not yet effective:
International Financial Reporting Standards (IFRS)
Effective date – periods commencing
on or after
IFRS 9 Financial Instruments 1 January 2018
IFRS 15 Revenue from contracts with customers 1 January 2018IFRS 16 Leases 1 January 2019
International Accounting Standards (IAS)
IAS 7 Disclosure Initiative – Amendments to IAS 7 1 January 2017
IAS 12 Recognition if Deferred Tax Assets for Unrealised Losses – Amendments to IAS 12 1 January 2017
Annual IFRS Improvement Process
AIP IFRS 12 Disclosure of Interests in Other Entities – Clarification of the scope of the disclosure requirements in IFRS 12 1 January 2017
The group is currently confirming the impacts of the above new standards and interpretations on its results, balance sheet and cash flows, which are not expected to have a material impact on the financial statements with the exception of the following standards;
Britvic plc Annual Report and Accounts 2017 107
Strate
gic re
port
Gove
rnan
ceFin
ancial state
ments
Ad
ditio
nal info
rmatio
n
NOTES TO THE CONSOLIDATED FINANCIAL STATEMENTS CONTINUED
3. Accounting policies (continued)
IFRS 9: Financial Instruments; The new standard will impact the way the group accounts for certain financial assets and liabilities. None of these changes are expected to be material.
IFRS 15: Revenue from Contracts with Customers, establishes a comprehensive framework for determining and recognising revenue and is effective for accounting periods beginning on or after 1 January 2018. The standard is therefore mandatory for the group for the accounting period starting 1 October 2018. The group however intends to adopt this standard early, from the accounting period starting 2 October 2017 with full retrospective application.
The group has completed its assessment of the impact of adoption of IFRS 15 on its consolidated financial statements. The main impact of adopting the standard is a reclassification of certain rebates offered to customers that had previously been recognised as selling and distribution costs to revenue and the reclassification of certain incentives received, from revenue, to cost of sales. Adoption of the standard is expected to have no impact on profit before tax.
The impact of this standard on the group if it had been adopted in the current year would have been a reduction in revenue of £110.3m with a decrease in cost of sales of £57.1m, a decrease in selling and distribution costs of £52.3m and a decrease in administration expenses of £0.9m.
Further disclosures will be provided in the 2018 Interims and 2018 Annual Report in respect of the transitional effect of IFRS 15 in addition to updated accounting policies and impact on relevant KPIs.
IFRS 16: Leases; The new standard provides a single lessee accounting model, requiring lessees to recognise right of use assets and lease liabilities on the balance sheet for all applicable leases. The group is in the process of assessing the impact of the standard which is likely to result in material changes to EBITDA and finance costs but is not expected to have a material impact on profit before tax. In addition there is expected to be a material increase in property, plant and equipment with a corresponding increase in loans and borrowings as applicable leases are brought onto the balance sheet.
4. Key judgements and estimates
The preparation of financial statements requires management to make judgements, estimates and assumptions that affect the amounts reported for assets and liabilities as at the balance sheet date and the amounts reported for revenues and expenses during the year. However, the nature of estimation means that the actual outcomes could differ from those estimates. In the process of applying the group’s accounting policies, management has made the following judgements and estimates which have the most significant effect on the amounts recognised in the financial statements.
Judgements
Franchise rights
Franchise rights represent franchise agreements acquired as part of the Britvic Ireland business combination which provides long term rights to distribute certain soft drinks. These agreements were allocated a 35 year useful economic life at the time of acquisition based on a third party assessment. As at 1 October 2017 these intangible assets have a remaining useful life of 25 years. The franchise agreement itself has a remaining contract life of 8 years which is less than the useful economic life. The useful economic life has been determined on the basis that the renewal of the franchise agreements, without significant cost, is highly probable. Evidence to support this conclusion is:
• Signifi cant emphasis on maintaining a strong relationship with Pepsi, strengthened through the addition of Pepsico products to Britvic’s portfolio in recent years;
• Lack of alternative suppliers; and• High barriers of entry to the Irish soft drinks bottling market.
Intangible assets with indefinite lives
Management have made a judgement that certain intangible assets relating to brands have indefinite lives.
It is expected that the trademarks with indefinite lives will be held and supported for an indefinite period of time and are expected to generate economic benefits. The group is committed to supporting its trademarks and invests in significant consumer marketing promotional spend.
Estimates
Post-retirement benefits
The determination of the pension and other post-retirement benefits cost and obligation is based on assumptions determined with independent actuarial advice. The assumptions include discount rate, inflation, pension and salary increases, mortality and other demographic assumptions. These key assumptions are disclosed in note 22.
Impairment of goodwill
Determining whether goodwill is impaired requires an estimation of the value in use of the cash generating units to which the goodwill has been allocated. The value in use calculation requires an estimate of the future cash flows expected to arise from the cash-generating unit and a suitable discount rate in order to calculate present value. Further details are given in note 15.
108 www.britvic.com
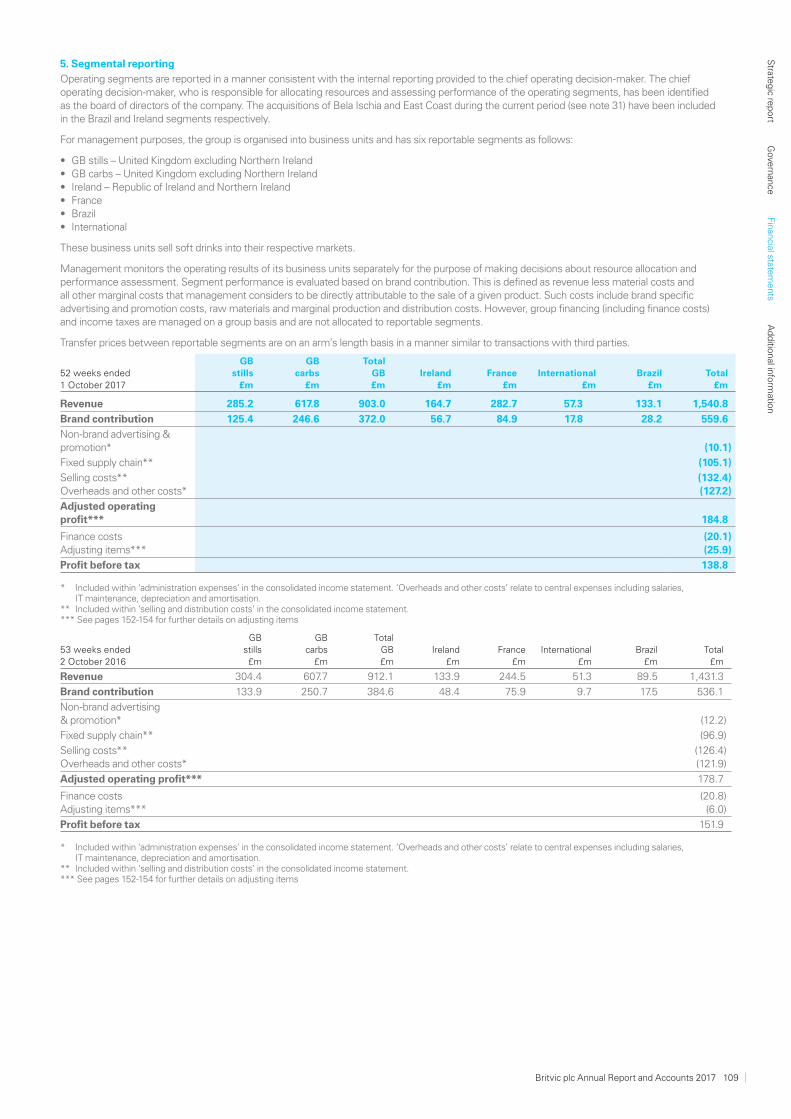
5. Segmental reporting
Operating segments are reported in a manner consistent with the internal reporting provided to the chief operating decision-maker. The chief operating decision-maker, who is responsible for allocating resources and assessing performance of the operating segments, has been identified as the board of directors of the company. The acquisitions of Bela Ischia and East Coast during the current period (see note 31) have been included in the Brazil and Ireland segments respectively.
For management purposes, the group is organised into business units and has six reportable segments as follows:
• GB stills – United Kingdom excluding Northern Ireland• GB carbs – United Kingdom excluding Northern Ireland• Ireland – Republic of Ireland and Northern Ireland• France• Brazil• International
These business units sell soft drinks into their respective markets.
Management monitors the operating results of its business units separately for the purpose of making decisions about resource allocation and performance assessment. Segment performance is evaluated based on brand contribution. This is defined as revenue less material costs and all other marginal costs that management considers to be directly attributable to the sale of a given product. Such costs include brand specific advertising and promotion costs, raw materials and marginal production and distribution costs. However, group financing (including finance costs) and income taxes are managed on a group basis and are not allocated to reportable segments.
Transfer prices between reportable segments are on an arm’s length basis in a manner similar to transactions with third parties.
52 weeks ended 1 October 2017
GBstills
£m
GBcarbs
£m
TotalGB£m
Ireland£m
France£m
International£m
Brazil£m
Total£m
Revenue 285.2 617.8 903.0 164.7 282.7 57.3 133.1 1,540.8
Brand contribution 125.4 246.6 372.0 56.7 84.9 17.8 28.2 559.6
Non-brand advertising & promotion* (10.1)
Fixed supply chain** (105.1)
Selling costs** (132.4)Overheads and other costs* (127.2)
Adjusted operating profit*** 184.8
Finance costs (20.1)Adjusting items*** (25.9)
Profit before tax 138.8
* Included within ‘administration expenses’ in the consolidated income statement. ‘Overheads and other costs’ relate to central expenses including salaries, IT maintenance, depreciation and amortisation.
** Included within ‘selling and distribution costs’ in the consolidated income statement.*** See pages 152-154 for further details on adjusting items
53 weeks ended 2 October 2016
GBstills£m
GBcarbs
£m
TotalGB£m
Ireland£m
France£m
International£m
Brazil£m
Total£m
Revenue 304.4 607.7 912.1 133.9 244.5 51.3 89.5 1,431.3
Brand contribution 133.9 250.7 384.6 48.4 75.9 9.7 17.5 536.1
Non-brand advertising & promotion* (12.2)
Fixed supply chain** (96.9)
Selling costs** (126.4)Overheads and other costs* (121.9)
Adjusted operating profit*** 178.7
Finance costs (20.8)Adjusting items*** (6.0)
Profit before tax 151.9
* Included within ‘administration expenses’ in the consolidated income statement. ‘Overheads and other costs’ relate to central expenses including salaries, IT maintenance, depreciation and amortisation.
** Included within ‘selling and distribution costs’ in the consolidated income statement.*** See pages 152-154 for further details on adjusting items
Britvic plc Annual Report and Accounts 2017 109
Strate
gic re
port
Gove
rnan
ceFin
ancial state
ments
Ad
ditio
nal info
rmatio
n
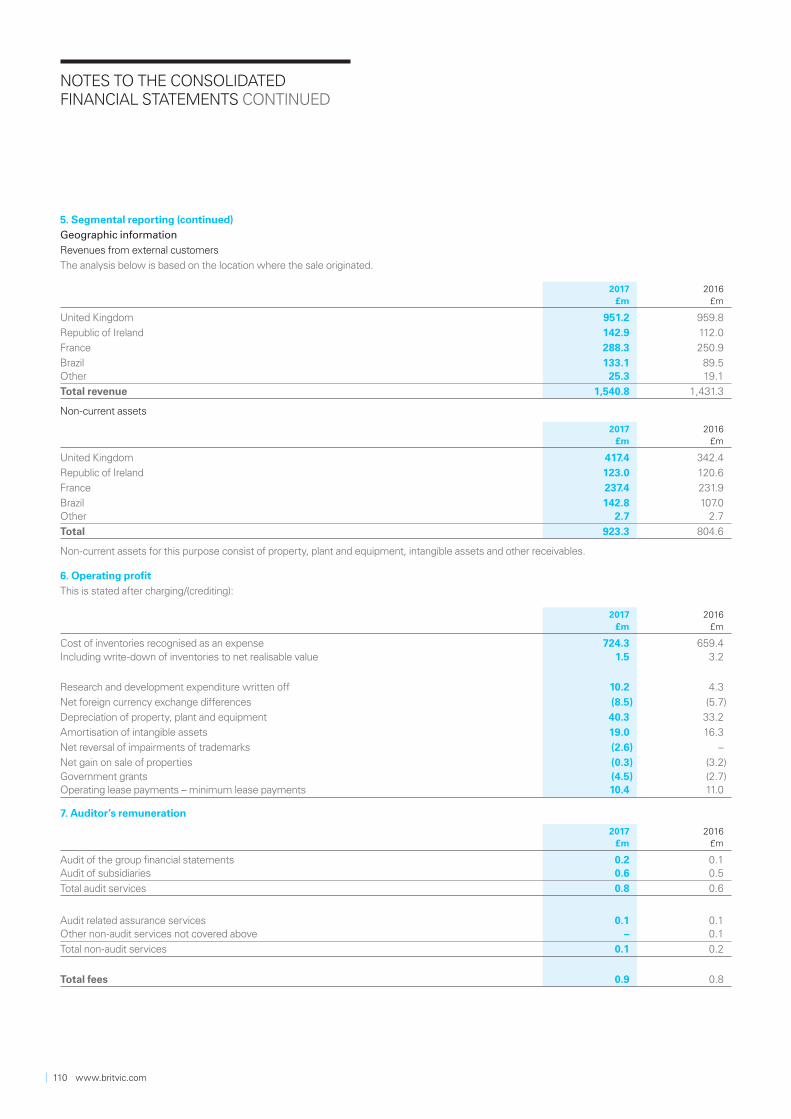
NOTES TO THE CONSOLIDATED FINANCIAL STATEMENTS CONTINUED
5. Segmental reporting (continued)
Geographic information
Revenues from external customers
The analysis below is based on the location where the sale originated.
2017£m
2016£m
United Kingdom 951.2 959.8
Republic of Ireland 142.9 112.0
France 288.3 250.9
Brazil 133.1 89.5Other 25.3 19.1
Total revenue 1,540.8 1,431.3
Non-current assets
2017£m
2016£m
United Kingdom 417.4 342.4
Republic of Ireland 123.0 120.6
France 237.4 231.9
Brazil 142.8 107.0Other 2.7 2.7
Total 923.3 804.6
Non-current assets for this purpose consist of property, plant and equipment, intangible assets and other receivables.
6. Operating profit
This is stated after charging/(crediting):
2017 £m
2016 £m
Cost of inventories recognised as an expense 724.3 659.4Including write-down of inventories to net realisable value 1.5 3.2
Research and development expenditure written off 10.2 4.3
Net foreign currency exchange differences (8.5) (5.7)
Depreciation of property, plant and equipment 40.3 33.2
Amortisation of intangible assets 19.0 16.3
Net reversal of impairments of trademarks (2.6) –
Net gain on sale of properties (0.3) (3.2)Government grants (4.5) (2.7)Operating lease payments – minimum lease payments 10.4 11.0
7. Auditor’s remuneration
2017 £m
2016 £m
Audit of the group financial statements 0.2 0.1Audit of subsidiaries 0.6 0.5
Total audit services 0.8 0.6
Audit related assurance services 0.1 0.1Other non-audit services not covered above – 0.1
Total non-audit services 0.1 0.2
Total fees 0.9 0.8
110 www.britvic.com
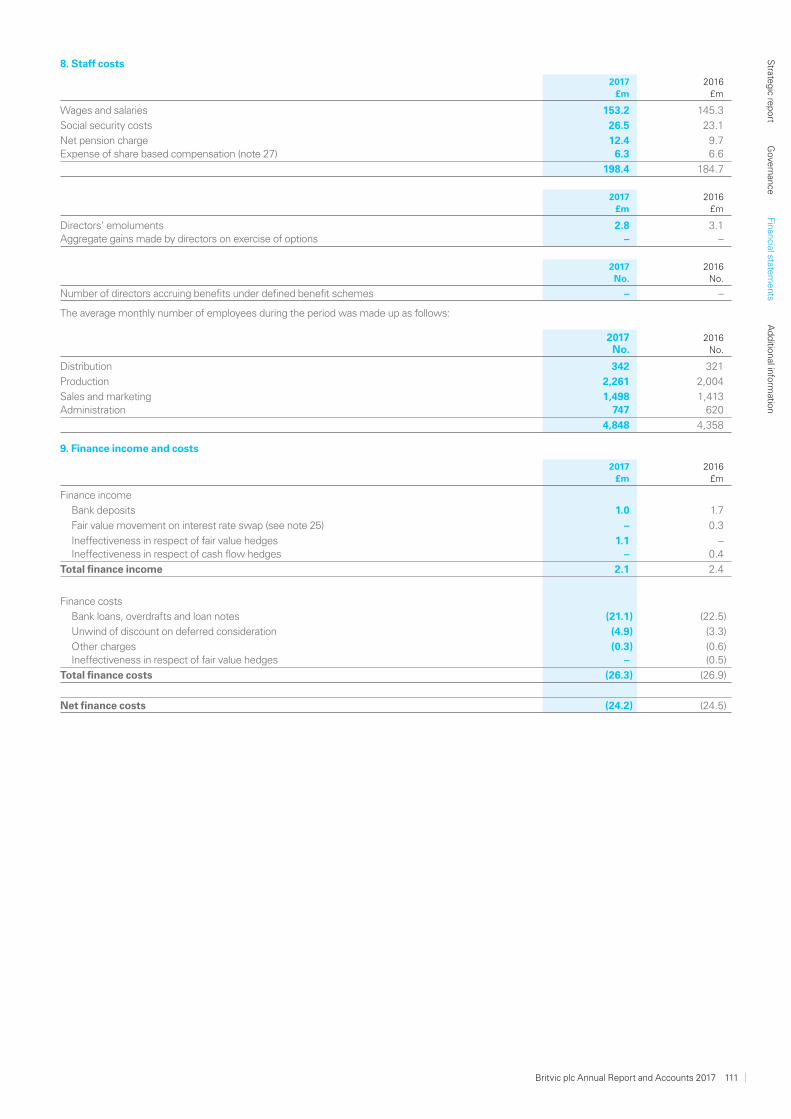
8. Staff costs
2017 £m
2016 £m
Wages and salaries 153.2 145.3
Social security costs 26.5 23.1
Net pension charge 12.4 9.7Expense of share based compensation (note 27) 6.3 6.6
198.4 184.7
2017 £m
2016 £m
Directors’ emoluments 2.8 3.1Aggregate gains made by directors on exercise of options – –
2017 No.
2016No.
Number of directors accruing benefits under defined benefit schemes – –
The average monthly number of employees during the period was made up as follows:
2017 No.
2016No.
Distribution 342 321
Production 2,261 2,004
Sales and marketing 1,498 1,413Administration 747 620
4,848 4,358
9. Finance income and costs
2017 £m
2016 £m
Finance income
Bank deposits 1.0 1.7
Fair value movement on interest rate swap (see note 25) – 0.3
Ineffectiveness in respect of fair value hedges 1.1 –Ineffectiveness in respect of cash flow hedges – 0.4
Total finance income 2.1 2.4
Finance costs
Bank loans, overdrafts and loan notes (21.1) (22.5)
Unwind of discount on deferred consideration (4.9) (3.3)
Other charges (0.3) (0.6)Ineffectiveness in respect of fair value hedges – (0.5)
Total finance costs (26.3) (26.9)
Net finance costs (24.2) (24.5)
Britvic plc Annual Report and Accounts 2017 111
Strate
gic re
port
Gove
rnan
ceFin
ancial state
ments
Ad
ditio
nal info
rmatio
n

NOTES TO THE CONSOLIDATED FINANCIAL STATEMENTS CONTINUED
10. Taxation
a) Tax on profit on continuing operations
2017£m
2016 £m
Income statement
Current income tax
Current income tax charge (30.3) (34.2)Amounts (under)/over provided in previous years (2.1) 2.4
Total current income tax charge (32.4) (31.8)
Deferred income tax
Origination and reversal of temporary differences 3.8 (4.1)Amounts over/(under) provided in previous years 1.4 (1.5)
Total deferred tax credit/(charge) 5.2 (5.6)
Total tax charge in the income statement (27.2) (37.4)
Statement of comprehensive income/(expense)
Current tax on additional pension contributions – 3.3
Deferred tax on defined benefit plans (4.2) 8.7
Deferred tax in respect of cash flow hedges accounted for in the hedging reserve 1.7 (0.7)
Tax recycled to goodwill on acquisition of subsidiary – (2.0)
Tax on exchange differences accounted for in the translation reserve (6.1) 3.9Deferred tax on other temporary differences 0.1 0.2
Total tax (charge)/credit in the statement of comprehensive income/(expense) (8.5) 13.4
Statement of changes in equity
Current tax on share options exercised 0.1 1.8Deferred tax on share options granted to employees 2.0 (1.4)
Total tax credit in the statement of changes in equity 2.1 0.4
b) Reconciliation of the total tax charge
The tax expense in the consolidated income statement is higher (2016: higher) than the standard rate of UK corporation tax of 19.5% (2016: 20.0%). The differences are reconciled below:
2017£m
2016£m
Profit before tax 138.8 151.9
Profit multiplied by the UK average rate of corporation tax of 19.5% (2016: 20.0%) (27.1) (30.4)Permanent differences (4.7) (2.8)Impact of change in tax rates on deferred tax liability 5.1 1.4Current tax/deferred tax rate differential 0.8 –Deferred tax write off (0.8) –Tax over/(under) provided in previous years (0.7) 1.0Overseas tax rate differences 1.2 (1.2)Movement in deferred tax not recognised (1.0) (5.4)
(27.2) (37.4)
Effective income tax rate 19.6% 24.6%
Permanent differences have increased in comparison to the prior year due to additional capital expenditure for the business capability programme.
A one-off deferred tax credit has arisen in the period as a result of a reduction in the enacted French corporate income tax rate from 33.33% to 28%. The deferred tax balances have been re-measured based on the tax rate expected to apply on reversal.
The reduction in overseas tax rate difference reflect changing profit mix arising from overseas profits. The pre-adjusted effective tax rate for future periods will continue to be impacted by the profit mix arising from the group’s operations.
In comparison to the prior year, there is a reduction in the level of current year losses in respect of which a deferred tax asset has not been recognised, primarily due to the closure of loss-making Indian business in the prior year.
112 www.britvic.com
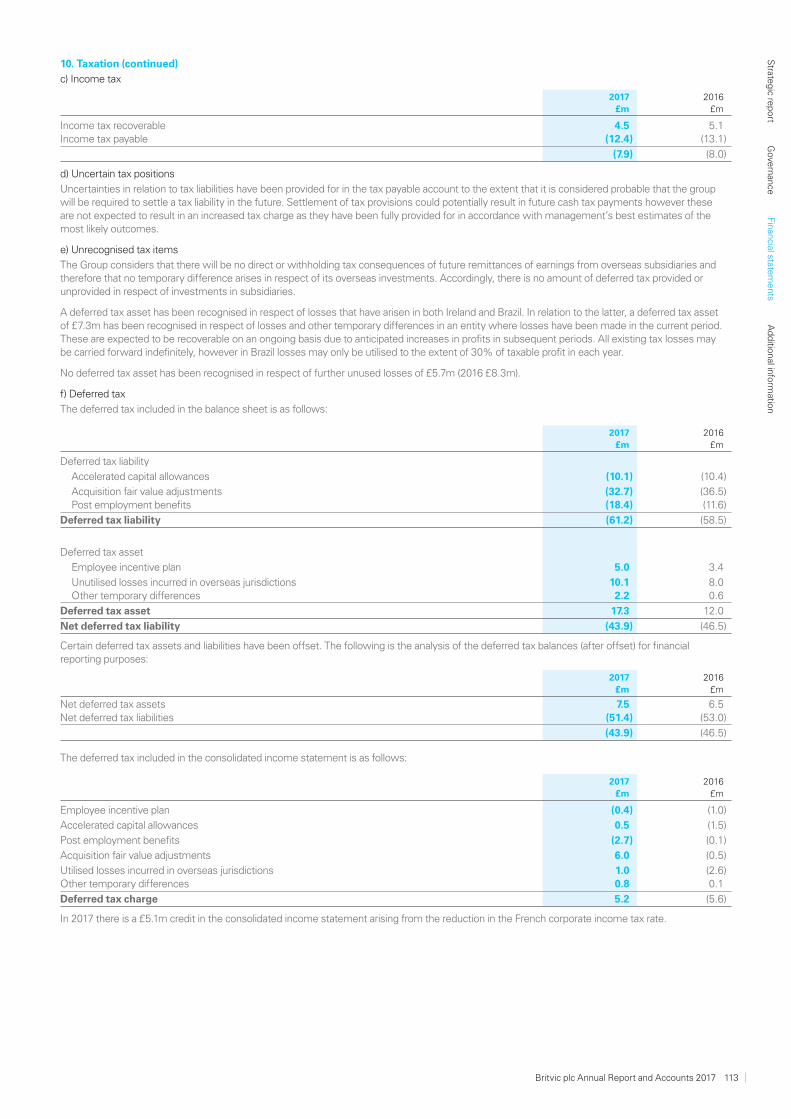
10. Taxation (continued)
c) Income tax
2017 £m
2016 £m
Income tax recoverable 4.5 5.1Income tax payable (12.4) (13.1)
(7.9) (8.0)
d) Uncertain tax positions
Uncertainties in relation to tax liabilities have been provided for in the tax payable account to the extent that it is considered probable that the group will be required to settle a tax liability in the future. Settlement of tax provisions could potentially result in future cash tax payments however these are not expected to result in an increased tax charge as they have been fully provided for in accordance with management’s best estimates of the most likely outcomes.
e) Unrecognised tax items
The Group considers that there will be no direct or withholding tax consequences of future remittances of earnings from overseas subsidiaries and therefore that no temporary difference arises in respect of its overseas investments. Accordingly, there is no amount of deferred tax provided or unprovided in respect of investments in subsidiaries.
A deferred tax asset has been recognised in respect of losses that have arisen in both Ireland and Brazil. In relation to the latter, a deferred tax asset of £7.3m has been recognised in respect of losses and other temporary differences in an entity where losses have been made in the current period. These are expected to be recoverable on an ongoing basis due to anticipated increases in profits in subsequent periods. All existing tax losses may be carried forward indefinitely, however in Brazil losses may only be utilised to the extent of 30% of taxable profit in each year.
No deferred tax asset has been recognised in respect of further unused losses of £5.7m (2016 £8.3m).
f) Deferred tax
The deferred tax included in the balance sheet is as follows:
2017 £m
2016 £m
Deferred tax liability
Accelerated capital allowances (10.1) (10.4)
Acquisition fair value adjustments (32.7) (36.5)Post employment benefits (18.4) (11.6)
Deferred tax liability (61.2) (58.5)
Deferred tax asset
Employee incentive plan 5.0 3.4
Unutilised losses incurred in overseas jurisdictions 10.1 8.0Other temporary differences 2.2 0.6
Deferred tax asset 17.3 12.0
Net deferred tax liability (43.9) (46.5)
Certain deferred tax assets and liabilities have been offset. The following is the analysis of the deferred tax balances (after offset) for financial reporting purposes:
2017 £m
2016 £m
Net deferred tax assets 7.5 6.5Net deferred tax liabilities (51.4) (53.0)
(43.9) (46.5)
The deferred tax included in the consolidated income statement is as follows:
2017 £m
2016 £m
Employee incentive plan (0.4) (1.0)
Accelerated capital allowances 0.5 (1.5)
Post employment benefits (2.7) (0.1)
Acquisition fair value adjustments 6.0 (0.5)
Utilised losses incurred in overseas jurisdictions 1.0 (2.6)Other temporary differences 0.8 0.1
Deferred tax charge 5.2 (5.6)
In 2017 there is a £5.1m credit in the consolidated income statement arising from the reduction in the French corporate income tax rate.
Britvic plc Annual Report and Accounts 2017 113
Strate
gic re
port
Gove
rnan
ceFin
ancial state
ments
Ad
ditio
nal info
rmatio
n
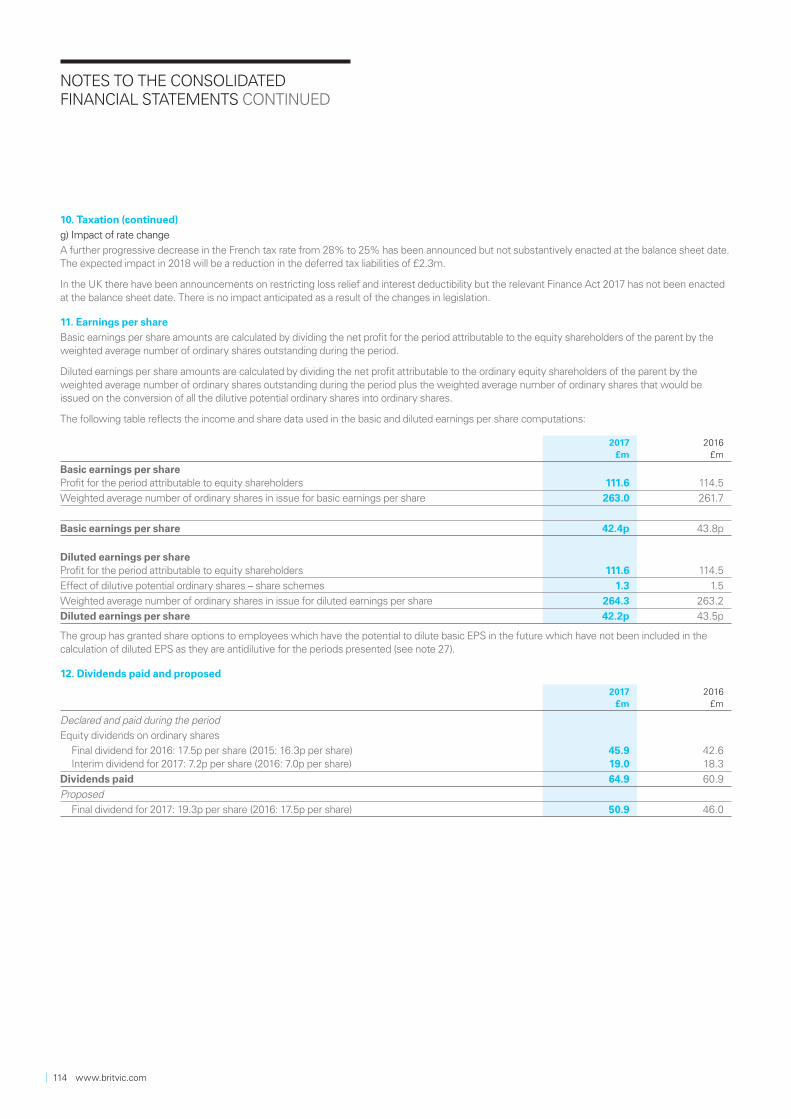
NOTES TO THE CONSOLIDATED FINANCIAL STATEMENTS CONTINUED
10. Taxation (continued)
g) Impact of rate change
A further progressive decrease in the French tax rate from 28% to 25% has been announced but not substantively enacted at the balance sheet date. The expected impact in 2018 will be a reduction in the deferred tax liabilities of £2.3m.
In the UK there have been announcements on restricting loss relief and interest deductibility but the relevant Finance Act 2017 has not been enacted at the balance sheet date. There is no impact anticipated as a result of the changes in legislation.
11. Earnings per share
Basic earnings per share amounts are calculated by dividing the net profit for the period attributable to the equity shareholders of the parent by the weighted average number of ordinary shares outstanding during the period.
Diluted earnings per share amounts are calculated by dividing the net profit attributable to the ordinary equity shareholders of the parent by the weighted average number of ordinary shares outstanding during the period plus the weighted average number of ordinary shares that would be issued on the conversion of all the dilutive potential ordinary shares into ordinary shares.
The following table reflects the income and share data used in the basic and diluted earnings per share computations:
2017 £m
2016 £m
Basic earnings per shareProfit for the period attributable to equity shareholders 111.6 114.5
Weighted average number of ordinary shares in issue for basic earnings per share 263.0 261.7
Basic earnings per share 42.4p 43.8p
Diluted earnings per shareProfit for the period attributable to equity shareholders 111.6 114.5
Effect of dilutive potential ordinary shares – share schemes 1.3 1.5
Weighted average number of ordinary shares in issue for diluted earnings per share 264.3 263.2
Diluted earnings per share 42.2p 43.5p
The group has granted share options to employees which have the potential to dilute basic EPS in the future which have not been included in the calculation of diluted EPS as they are antidilutive for the periods presented (see note 27).
12. Dividends paid and proposed
2017 £m
2016 £m
Declared and paid during the period
Equity dividends on ordinary shares
Final dividend for 2016: 17.5p per share (2015: 16.3p per share) 45.9 42.6Interim dividend for 2017: 7.2p per share (2016: 7.0p per share) 19.0 18.3
Dividends paid 64.9 60.9
Proposed
Final dividend for 2017: 19.3p per share (2016: 17.5p per share) 50.9 46.0
114 www.britvic.com
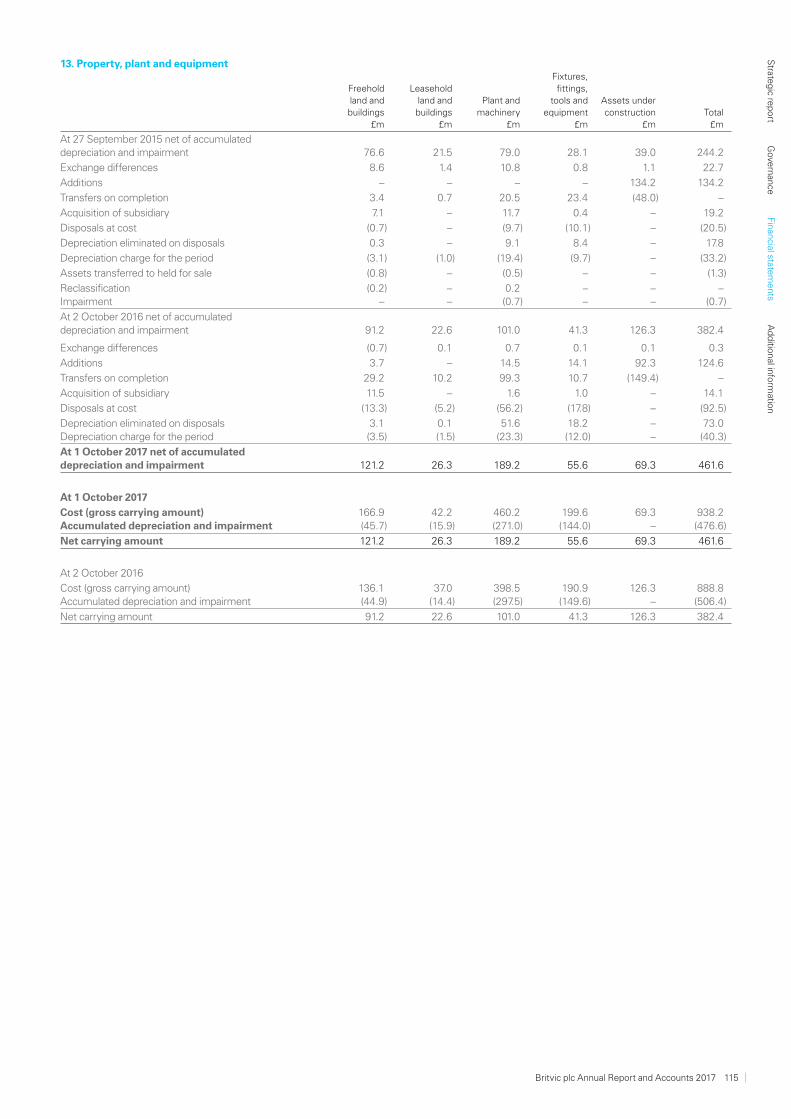
13. Property, plant and equipment
Freeholdland andbuildings
£m
Leaseholdland andbuildings
£m
Plant andmachinery
£m
Fixtures,fittings,
tools andequipment
£m
Assets under construction
£mTotal
£m
At 27 September 2015 net of accumulated depreciation and impairment 76.6 21.5 79.0 28.1 39.0 244.2
Exchange differences 8.6 1.4 10.8 0.8 1.1 22.7
Additions – – – – 134.2 134.2
Transfers on completion 3.4 0.7 20.5 23.4 (48.0) –
Acquisition of subsidiary 7.1 – 11.7 0.4 – 19.2
Disposals at cost (0.7) – (9.7) (10.1) – (20.5)
Depreciation eliminated on disposals 0.3 – 9.1 8.4 – 17.8
Depreciation charge for the period (3.1) (1.0) (19.4) (9.7) – (33.2)
Assets transferred to held for sale (0.8) – (0.5) – – (1.3)
Reclassification (0.2) – 0.2 – – –Impairment – – (0.7) – – (0.7)
At 2 October 2016 net of accumulated depreciation and impairment 91.2 22.6 101.0 41.3 126.3 382.4
Exchange differences (0.7) 0.1 0.7 0.1 0.1 0.3
Additions 3.7 – 14.5 14.1 92.3 124.6
Transfers on completion 29.2 10.2 99.3 10.7 (149.4) –
Acquisition of subsidiary 11.5 – 1.6 1.0 – 14.1
Disposals at cost (13.3) (5.2) (56.2) (17.8) – (92.5)
Depreciation eliminated on disposals 3.1 0.1 51.6 18.2 – 73.0Depreciation charge for the period (3.5) (1.5) (23.3) (12.0) – (40.3)
At 1 October 2017 net of accumulated depreciation and impairment 121.2 26.3 189.2 55.6 69.3 461.6
At 1 October 2017
Cost (gross carrying amount) 166.9 42.2 460.2 199.6 69.3 938.2Accumulated depreciation and impairment (45.7) (15.9) (271.0) (144.0) – (476.6)
Net carrying amount 121.2 26.3 189.2 55.6 69.3 461.6
At 2 October 2016
Cost (gross carrying amount) 136.1 37.0 398.5 190.9 126.3 888.8Accumulated depreciation and impairment (44.9) (14.4) (297.5) (149.6) – (506.4)
Net carrying amount 91.2 22.6 101.0 41.3 126.3 382.4
Britvic plc Annual Report and Accounts 2017 115
Strate
gic re
port
Gove
rnan
ceFin
ancial state
ments
Ad
ditio
nal info
rmatio
n
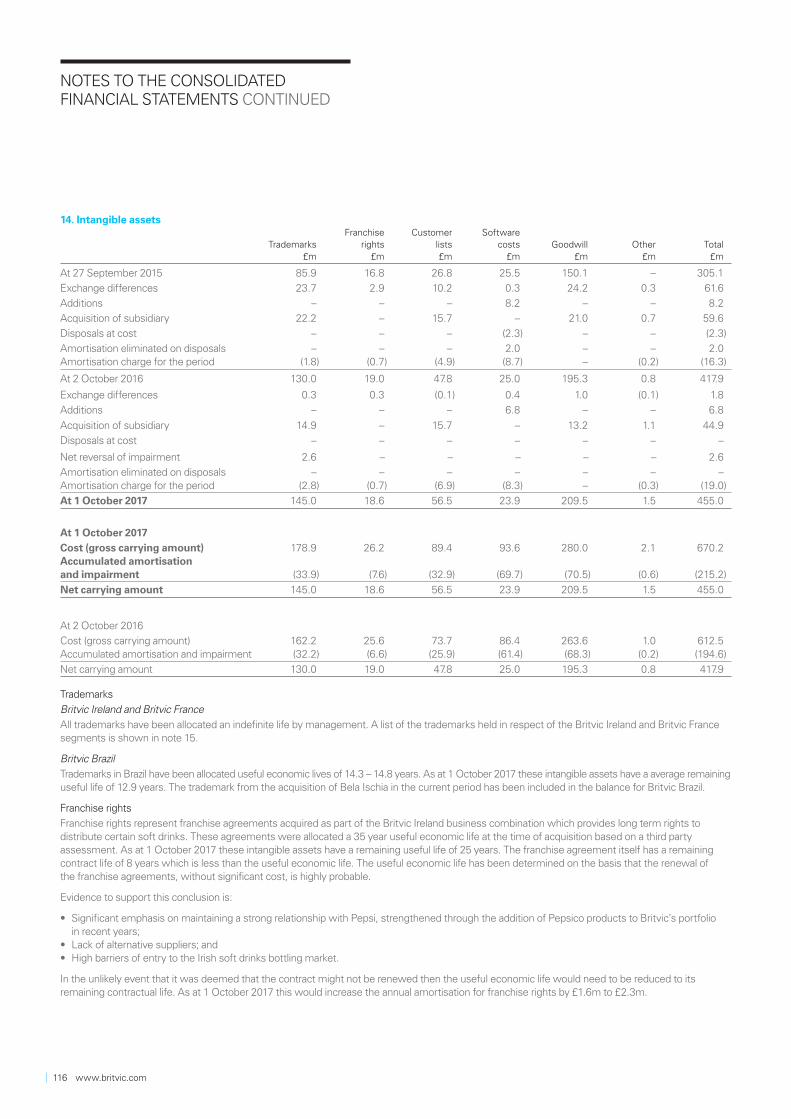
NOTES TO THE CONSOLIDATED FINANCIAL STATEMENTS CONTINUED
14. Intangible assets
Trademarks£m
Franchiserights
£m
Customerlists£m
Softwarecosts
£mGoodwill
£mOther
£mTotal
£m
At 27 September 2015 85.9 16.8 26.8 25.5 150.1 – 305.1
Exchange differences 23.7 2.9 10.2 0.3 24.2 0.3 61.6
Additions – – – 8.2 – – 8.2
Acquisition of subsidiary 22.2 – 15.7 – 21.0 0.7 59.6
Disposals at cost – – – (2.3) – – (2.3)
Amortisation eliminated on disposals – – – 2.0 – – 2.0Amortisation charge for the period (1.8) (0.7) (4.9) (8.7) – (0.2) (16.3)
At 2 October 2016 130.0 19.0 47.8 25.0 195.3 0.8 417.9
Exchange differences 0.3 0.3 (0.1) 0.4 1.0 (0.1) 1.8
Additions – – – 6.8 – – 6.8
Acquisition of subsidiary 14.9 – 15.7 – 13.2 1.1 44.9
Disposals at cost – – – – – – –
Net reversal of impairment 2.6 – – – – – 2.6
Amortisation eliminated on disposals – – – – – – –Amortisation charge for the period (2.8) (0.7) (6.9) (8.3) – (0.3) (19.0)
At 1 October 2017 145.0 18.6 56.5 23.9 209.5 1.5 455.0
At 1 October 2017
Cost (gross carrying amount) 178.9 26.2 89.4 93.6 280.0 2.1 670.2Accumulated amortisation and impairment (33.9) (7.6) (32.9) (69.7) (70.5) (0.6) (215.2)
Net carrying amount 145.0 18.6 56.5 23.9 209.5 1.5 455.0
At 2 October 2016
Cost (gross carrying amount) 162.2 25.6 73.7 86.4 263.6 1.0 612.5Accumulated amortisation and impairment (32.2) (6.6) (25.9) (61.4) (68.3) (0.2) (194.6)
Net carrying amount 130.0 19.0 47.8 25.0 195.3 0.8 417.9
Trademarks
Britvic Ireland and Britvic France
All trademarks have been allocated an indefinite life by management. A list of the trademarks held in respect of the Britvic Ireland and Britvic France segments is shown in note 15.
Britvic Brazil
Trademarks in Brazil have been allocated useful economic lives of 14.3 – 14.8 years. As at 1 October 2017 these intangible assets have a average remaining useful life of 12.9 years. The trademark from the acquisition of Bela Ischia in the current period has been included in the balance for Britvic Brazil.
Franchise rights
Franchise rights represent franchise agreements acquired as part of the Britvic Ireland business combination which provides long term rights to distribute certain soft drinks. These agreements were allocated a 35 year useful economic life at the time of acquisition based on a third party assessment. As at 1 October 2017 these intangible assets have a remaining useful life of 25 years. The franchise agreement itself has a remaining contract life of 8 years which is less than the useful economic life. The useful economic life has been determined on the basis that the renewal of the franchise agreements, without significant cost, is highly probable.
Evidence to support this conclusion is:
• Signifi cant emphasis on maintaining a strong relationship with Pepsi, strengthened through the addition of Pepsico products to Britvic’s portfolio in recent years;
• Lack of alternative suppliers; and• High barriers of entry to the Irish soft drinks bottling market.
In the unlikely event that it was deemed that the contract might not be renewed then the useful economic life would need to be reduced to its remaining contractual life. As at 1 October 2017 this would increase the annual amortisation for franchise rights by £1.6m to £2.3m.
116 www.britvic.com
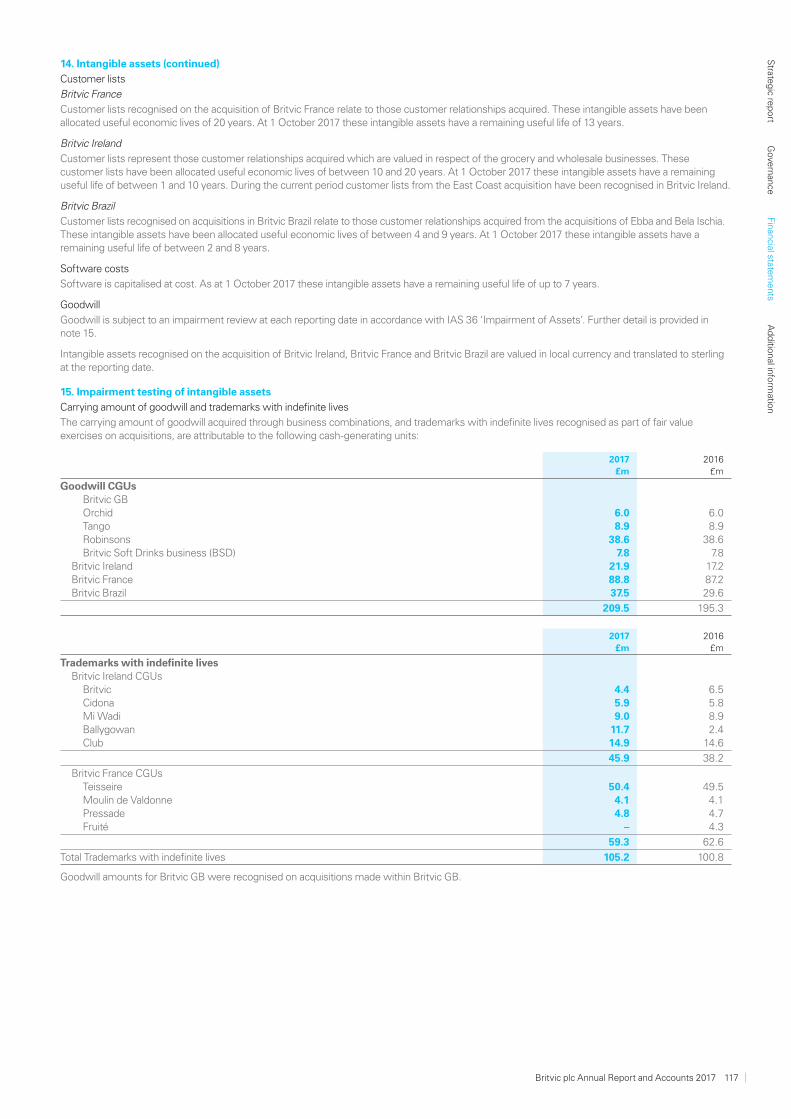
14. Intangible assets (continued)
Customer lists
Britvic France
Customer lists recognised on the acquisition of Britvic France relate to those customer relationships acquired. These intangible assets have been allocated useful economic lives of 20 years. At 1 October 2017 these intangible assets have a remaining useful life of 13 years.
Britvic Ireland
Customer lists represent those customer relationships acquired which are valued in respect of the grocery and wholesale businesses. These customer lists have been allocated useful economic lives of between 10 and 20 years. At 1 October 2017 these intangible assets have a remaining useful life of between 1 and 10 years. During the current period customer lists from the East Coast acquisition have been recognised in Britvic Ireland.
Britvic Brazil
Customer lists recognised on acquisitions in Britvic Brazil relate to those customer relationships acquired from the acquisitions of Ebba and Bela Ischia. These intangible assets have been allocated useful economic lives of between 4 and 9 years. At 1 October 2017 these intangible assets have a remaining useful life of between 2 and 8 years.
Software costs
Software is capitalised at cost. As at 1 October 2017 these intangible assets have a remaining useful life of up to 7 years.
Goodwill
Goodwill is subject to an impairment review at each reporting date in accordance with IAS 36 ‘Impairment of Assets’. Further detail is provided in note 15.
Intangible assets recognised on the acquisition of Britvic Ireland, Britvic France and Britvic Brazil are valued in local currency and translated to sterling at the reporting date.
15. Impairment testing of intangible assets
Carrying amount of goodwill and trademarks with indefinite lives
The carrying amount of goodwill acquired through business combinations, and trademarks with indefinite lives recognised as part of fair value exercises on acquisitions, are attributable to the following cash-generating units:
2017 £m
2016 £m
Goodwill CGUsBritvic GBOrchid 6.0 6.0Tango 8.9 8.9Robinsons 38.6 38.6Britvic Soft Drinks business (BSD) 7.8 7.8
Britvic Ireland 21.9 17.2Britvic France 88.8 87.2Britvic Brazil 37.5 29.6
209.5 195.3
2017 £m
2016 £m
Trademarks with indefinite livesBritvic Ireland CGUs
Britvic 4.4 6.5Cidona 5.9 5.8Mi Wadi 9.0 8.9Ballygowan 11.7 2.4Club 14.9 14.6
45.9 38.2
Britvic France CGUsTeisseire 50.4 49.5Moulin de Valdonne 4.1 4.1Pressade 4.8 4.7Fruité – 4.3
59.3 62.6
Total Trademarks with indefinite lives 105.2 100.8
Goodwill amounts for Britvic GB were recognised on acquisitions made within Britvic GB.
Britvic plc Annual Report and Accounts 2017 117
Strate
gic re
port
Gove
rnan
ceFin
ancial state
ments
Ad
ditio
nal info
rmatio
n

NOTES TO THE CONSOLIDATED FINANCIAL STATEMENTS CONTINUED
15. Impairment testing of intangible assets (continued)
Trademarks with indefinite lives were recognised as part of the fair value exercises relating to the 2007 acquisition of Britvic Ireland and the 2010 acquisition of Britvic France. They were allocated by senior management to the individual cash-generating units for impairment testing as shown in the table above.
Goodwill in Brazil comprises goodwill relating to the acquisition of Ebba and Bela Ischia. Management consider this to be a single CGU based on the integration of Bela Ischia into the overall Britvic Brazil business and the presentation of Britvic Brazil results to the Chief Operating Decision Maker.
Method of impairment testing
Goodwill and intangible assets with indefinite lives
Impairment reviews of goodwill and intangible assets are undertaken by senior management annually. Value in use calculations are performed for each cash-generating unit using cash flow projections and are based on the latest annual financial budgets prepared by senior management and approved by the board of directors. Senior management expectations are formed in line with performance to date and experience, as well as available external market data.
Discount rates reflect senior management’s estimate of the pre-tax cost of capital adjusted where necessary to reflect the different risks of different countries in which the group operates. The estimated pre-tax cost of capital is the benchmark used by management to assess operating performance and to evaluate future capital investment proposals. The group has considered the impact of the current economic climate in determining the appropriate discount rate to use in impairment testing. The same discount rate is relevant to all CGUs in each country as the group only operates in the soft drinks manufacturing and distribution market sector. The applicable pre-tax discount rate for cash flow projections is:
At 1 October 2017
At 2 October 2016
Britvic GB 7.1% 9.4%
Britvic Ireland 8.1% 8.4%
Britvic France 8.1% 10.9%Britvic Brazil 12.8% 17.9%
Key assumptions used in value in use calculations
The following describes each key assumption on which management has based its cash flow projections to undertake impairment testing of goodwill.
Volume growth rates – reflect senior management expectations of volume growth based on growth achieved to date, current strategy and expected market trends and will vary according to each CGU.
Marginal contribution – being revenue less material costs and all other marginal costs that management considers to be directly attributable to the sale of a given product. Marginal contribution is based on financial budgets approved by the Britvic plc board. Key assumptions are made within these budgets about pricing, discounts and costs based on historical data, current strategy and expected market trends.
Advertising and promotional spend – financial budgets approved by senior management are used to determine the value assigned to advertising and promotional spend. This is based on the planned spend for year one and strategic intent thereafter.
Raw materials price, production and distribution costs, selling costs and other overhead inflation – the basis used to determine the value assigned to inflation is the forecast increase in consumer price indices in the relevant market. This has been used in all value in use calculations performed.
Cash flows are based on the latest approved budgets and forecasts (in most cases this is periods beyond one year). The applicable long term growth rates are:
At 1 October 2017
At 2 October 2016
Britvic GB 2.2% 2.1%
Britvic Ireland 2.0% 2.7%
Britvic France 1.7% 1.6%Britvic Brazil 2.9% 2.9%
Intangible assets with finite lives
No indicators of impairment were identified on intangible assets with finite lives and no impairment was recognised against these assets.
Results and conclusions
During the 52 week period ended 1 October 2017 an impairment of £4.4m was made on the Fruité trademark in Britvic France and an impairment of £2.2m was made on the Britvic Brand in Britvic Ireland. Additionally £9.2m of impairment from prior years was reversed on the Ballygowan brand in Britvic Ireland. In 2016 no impairments were identified.
Other than for the goodwill held in Britvic Brazil the directors do not consider that a reasonably possible change in the assumptions used to calculate the value in use of remaining goodwill and intangible assets would result in any impairment. For Britvic Brazil there is a high degree of uncertainty in the general economic climate and future growth rates of the country. A reduction in the long term growth rate from 2.9% to 0.7% would result in an impairment charge of £0.3m.
118 www.britvic.com
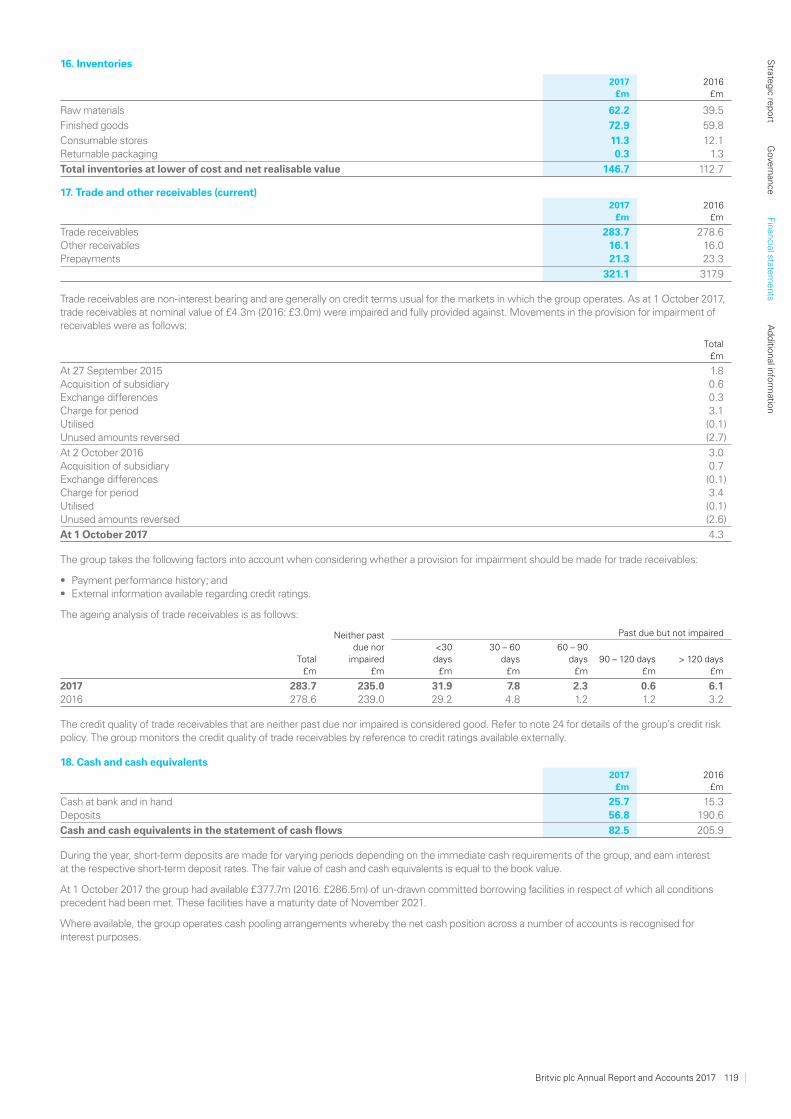
16. Inventories
2017£m
2016£m
Raw materials 62.2 39.5
Finished goods 72.9 59.8
Consumable stores 11.3 12.1Returnable packaging 0.3 1.3
Total inventories at lower of cost and net realisable value 146.7 112.7
17. Trade and other receivables (current) 2017
£m2016
£m
Trade receivables 283.7 278.6Other receivables 16.1 16.0Prepayments 21.3 23.3
321.1 317.9
Trade receivables are non-interest bearing and are generally on credit terms usual for the markets in which the group operates. As at 1 October 2017, trade receivables at nominal value of £4.3m (2016: £3.0m) were impaired and fully provided against. Movements in the provision for impairment of receivables were as follows:
Total£m
At 27 September 2015 1.8Acquisition of subsidiary 0.6Exchange differences 0.3Charge for period 3.1Utilised (0.1)Unused amounts reversed (2.7)
At 2 October 2016 3.0Acquisition of subsidiary 0.7Exchange differences (0.1)Charge for period 3.4Utilised (0.1)Unused amounts reversed (2.6)
At 1 October 2017 4.3
The group takes the following factors into account when considering whether a provision for impairment should be made for trade receivables:
• Payment performance history; and • External information available regarding credit ratings.
The ageing analysis of trade receivables is as follows:
Neither past due nor
impaired£m
Past due but not impaired
Total£m
<30 days
£m
30 – 60 days
£m
60 – 90 days
£m90 – 120 days
£m> 120 days
£m
2017 283.7 235.0 31.9 7.8 2.3 0.6 6.12016 278.6 239.0 29.2 4.8 1.2 1.2 3.2
The credit quality of trade receivables that are neither past due nor impaired is considered good. Refer to note 24 for details of the group’s credit risk policy. The group monitors the credit quality of trade receivables by reference to credit ratings available externally.
18. Cash and cash equivalents2017
£m2016
£m
Cash at bank and in hand 25.7 15.3Deposits 56.8 190.6
Cash and cash equivalents in the statement of cash flows 82.5 205.9
During the year, short-term deposits are made for varying periods depending on the immediate cash requirements of the group, and earn interest at the respective short-term deposit rates. The fair value of cash and cash equivalents is equal to the book value.
At 1 October 2017 the group had available £377.7m (2016: £286.5m) of un-drawn committed borrowing facilities in respect of which all conditions precedent had been met. These facilities have a maturity date of November 2021.
Where available, the group operates cash pooling arrangements whereby the net cash position across a number of accounts is recognised for interest purposes.
Britvic plc Annual Report and Accounts 2017 119
Strate
gic re
port
Gove
rnan
ceFin
ancial state
ments
Ad
ditio
nal info
rmatio
n
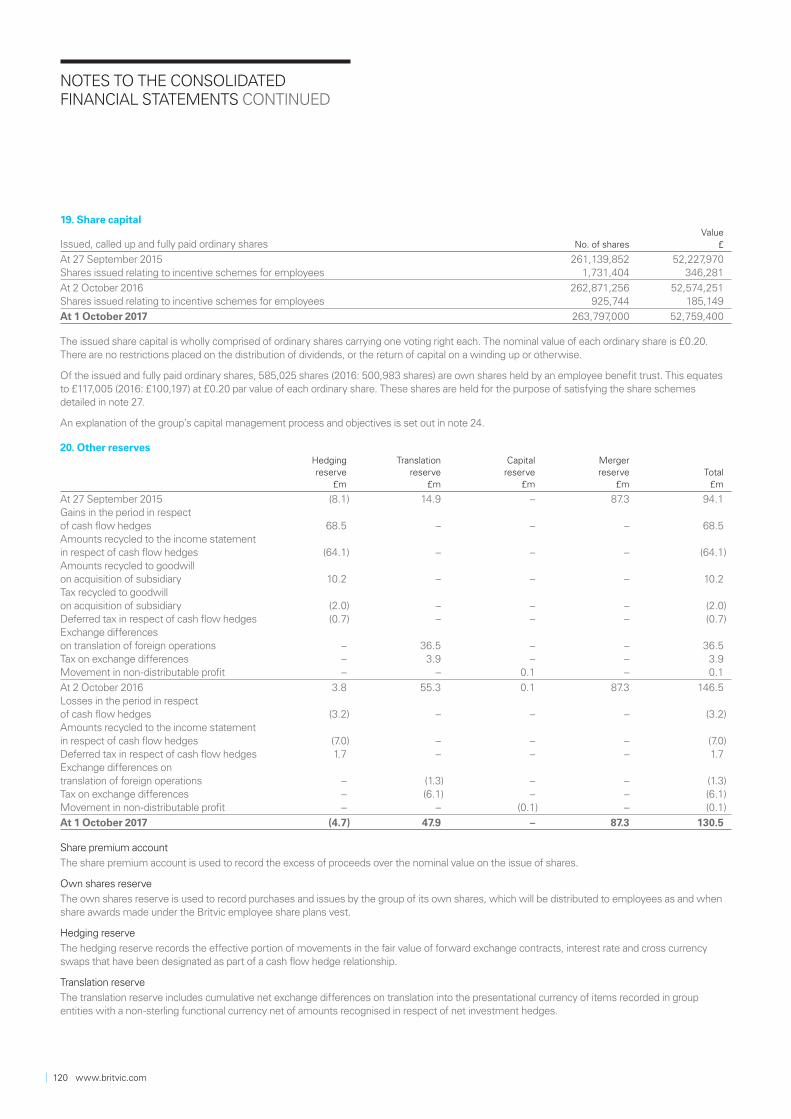
NOTES TO THE CONSOLIDATED FINANCIAL STATEMENTS CONTINUED
19. Share capital
Issued, called up and fully paid ordinary shares No. of sharesValue
£
At 27 September 2015 261,139,852 52,227,970Shares issued relating to incentive schemes for employees 1,731,404 346,281
At 2 October 2016 262,871,256 52,574,251Shares issued relating to incentive schemes for employees 925,744 185,149
At 1 October 2017 263,797,000 52,759,400
The issued share capital is wholly comprised of ordinary shares carrying one voting right each. The nominal value of each ordinary share is £0.20. There are no restrictions placed on the distribution of dividends, or the return of capital on a winding up or otherwise.
Of the issued and fully paid ordinary shares, 585,025 shares (2016: 500,983 shares) are own shares held by an employee benefit trust. This equates to £117,005 (2016: £100,197) at £0.20 par value of each ordinary share. These shares are held for the purpose of satisfying the share schemes detailed in note 27.
An explanation of the group’s capital management process and objectives is set out in note 24.
20. Other reservesHedging reserve
£m
Translation reserve
£m
Capital reserve
£m
Merger reserve
£mTotal
£m
At 27 September 2015 (8.1) 14.9 – 87.3 94.1Gains in the period in respect of cash flow hedges 68.5 – – – 68.5Amounts recycled to the income statement in respect of cash flow hedges (64.1) – – – (64.1)Amounts recycled to goodwill on acquisition of subsidiary 10.2 – – – 10.2Tax recycled to goodwill on acquisition of subsidiary (2.0) – – – (2.0)Deferred tax in respect of cash flow hedges (0.7) – – – (0.7)Exchange differences on translation of foreign operations – 36.5 – – 36.5Tax on exchange differences – 3.9 – – 3.9Movement in non-distributable profit – – 0.1 – 0.1
At 2 October 2016 3.8 55.3 0.1 87.3 146.5Losses in the period in respect of cash flow hedges (3.2) – – – (3.2)Amounts recycled to the income statement in respect of cash flow hedges (7.0) – – – (7.0)Deferred tax in respect of cash flow hedges 1.7 – – – 1.7Exchange differences on translation of foreign operations – (1.3) – – (1.3)Tax on exchange differences – (6.1) – – (6.1)Movement in non-distributable profit – – (0.1) – (0.1)
At 1 October 2017 (4.7) 47.9 – 87.3 130.5
Share premium account
The share premium account is used to record the excess of proceeds over the nominal value on the issue of shares.
Own shares reserve
The own shares reserve is used to record purchases and issues by the group of its own shares, which will be distributed to employees as and when share awards made under the Britvic employee share plans vest.
Hedging reserve
The hedging reserve records the effective portion of movements in the fair value of forward exchange contracts, interest rate and cross currency swaps that have been designated as part of a cash flow hedge relationship.
Translation reserve
The translation reserve includes cumulative net exchange differences on translation into the presentational currency of items recorded in group entities with a non-sterling functional currency net of amounts recognised in respect of net investment hedges.
120 www.britvic.com
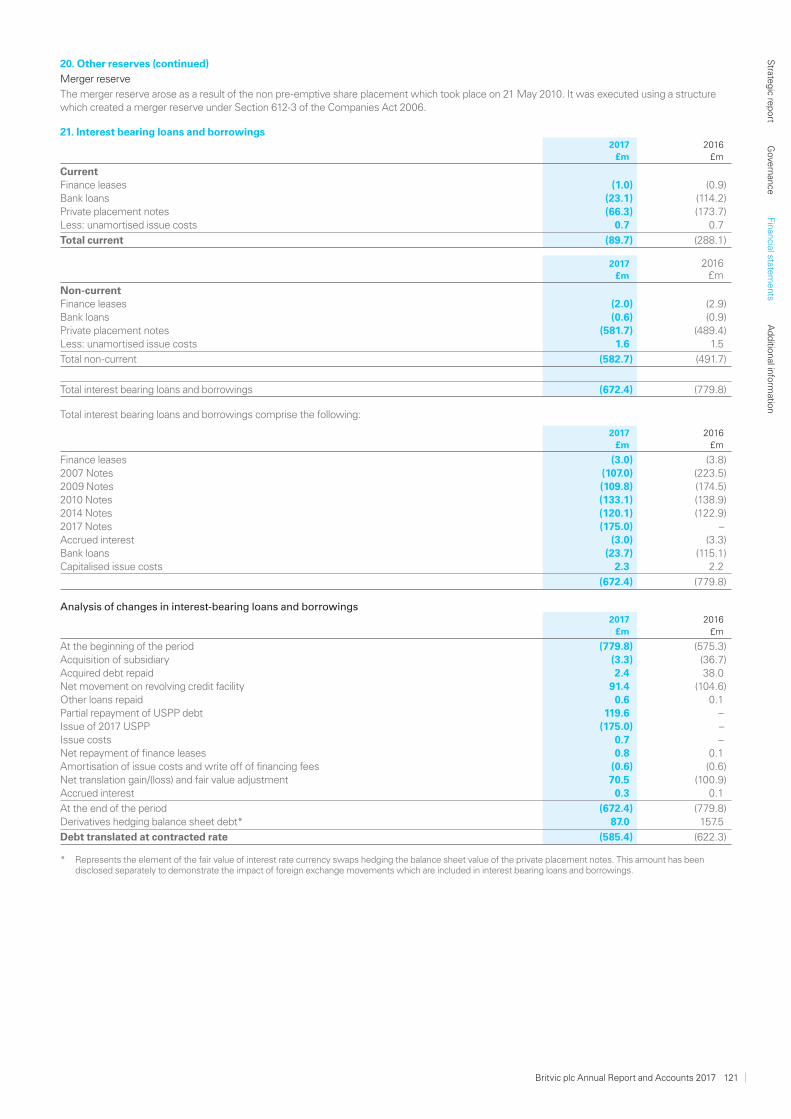
20. Other reserves (continued)
Merger reserve
The merger reserve arose as a result of the non pre-emptive share placement which took place on 21 May 2010. It was executed using a structure which created a merger reserve under Section 612-3 of the Companies Act 2006.
21. Interest bearing loans and borrowings2017
£m2016
£m
CurrentFinance leases (1.0) (0.9)Bank loans (23.1) (114.2)Private placement notes (66.3) (173.7)Less: unamortised issue costs 0.7 0.7
Total current (89.7) (288.1)
2017£m
2016£m
Non-currentFinance leases (2.0) (2.9)Bank loans (0.6) (0.9)Private placement notes (581.7) (489.4)Less: unamortised issue costs 1.6 1.5
Total non-current (582.7) (491.7)
Total interest bearing loans and borrowings (672.4) (779.8)
Total interest bearing loans and borrowings comprise the following:
2017£m
2016£m
Finance leases (3.0) (3.8)2007 Notes (107.0) (223.5)2009 Notes (109.8) (174.5)2010 Notes (133.1) (138.9)2014 Notes (120.1) (122.9)2017 Notes (175.0) –Accrued interest (3.0) (3.3)Bank loans (23.7) (115.1)Capitalised issue costs 2.3 2.2
(672.4) (779.8)
Analysis of changes in interest-bearing loans and borrowings2017
£m2016
£m
At the beginning of the period (779.8) (575.3)Acquisition of subsidiary (3.3) (36.7)Acquired debt repaid 2.4 38.0Net movement on revolving credit facility 91.4 (104.6)Other loans repaid 0.6 0.1Partial repayment of USPP debt 119.6 –Issue of 2017 USPP (175.0) –Issue costs 0.7 –Net repayment of finance leases 0.8 0.1Amortisation of issue costs and write off of financing fees (0.6) (0.6)Net translation gain/(loss) and fair value adjustment 70.5 (100.9)Accrued interest 0.3 0.1
At the end of the period (672.4) (779.8)Derivatives hedging balance sheet debt* 87.0 157.5
Debt translated at contracted rate (585.4) (622.3)
* Represents the element of the fair value of interest rate currency swaps hedging the balance sheet value of the private placement notes. This amount has been disclosed separately to demonstrate the impact of foreign exchange movements which are included in interest bearing loans and borrowings.
Britvic plc Annual Report and Accounts 2017 121
Strate
gic re
port
Gove
rnan
ceFin
ancial state
ments
Ad
ditio
nal info
rmatio
n
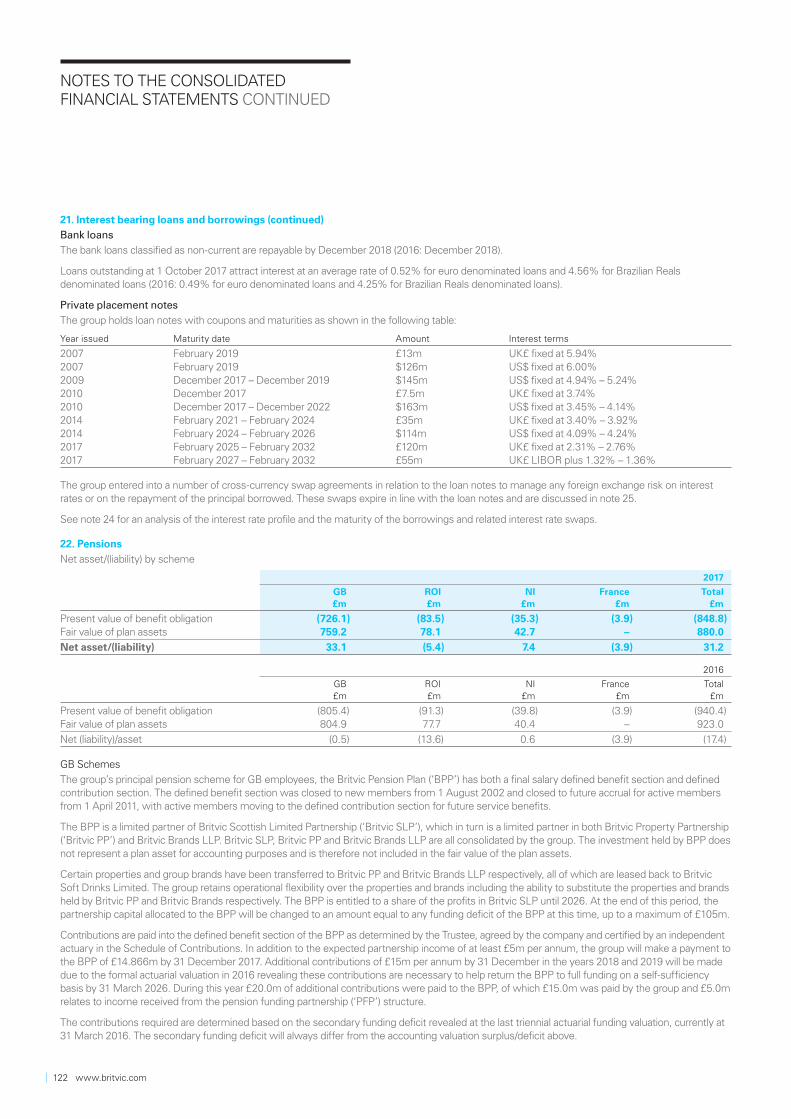
NOTES TO THE CONSOLIDATED FINANCIAL STATEMENTS CONTINUED
21. Interest bearing loans and borrowings (continued)
Bank loans
The bank loans classified as non-current are repayable by December 2018 (2016: December 2018).
Loans outstanding at 1 October 2017 attract interest at an average rate of 0.52% for euro denominated loans and 4.56% for Brazilian Reals denominated loans (2016: 0.49% for euro denominated loans and 4.25% for Brazilian Reals denominated loans).
Private placement notes
The group holds loan notes with coupons and maturities as shown in the following table:
Year issued Maturity date Amount Interest terms
2007 February 2019 £13m UK£ fixed at 5.94%2007 February 2019 $126m US$ fixed at 6.00%2009 December 2017 – December 2019 $145m US$ fixed at 4.94% – 5.24%2010 December 2017 £7.5m UK£ fixed at 3.74%2010 December 2017 – December 2022 $163m US$ fixed at 3.45% – 4.14%2014 February 2021 – February 2024 £35m UK£ fixed at 3.40% – 3.92%2014 February 2024 – February 2026 $114m US$ fixed at 4.09% – 4.24%2017 February 2025 – February 2032 £120m UK£ fixed at 2.31% – 2.76%2017 February 2027 – February 2032 £55m UK£ LIBOR plus 1.32% – 1.36%
The group entered into a number of cross-currency swap agreements in relation to the loan notes to manage any foreign exchange risk on interest rates or on the repayment of the principal borrowed. These swaps expire in line with the loan notes and are discussed in note 25.
See note 24 for an analysis of the interest rate profile and the maturity of the borrowings and related interest rate swaps.
22. Pensions
Net asset/(liability) by scheme
2017
GB£m
ROI£m
NI£m
France£m
Total£m
Present value of benefit obligation (726.1) (83.5) (35.3) (3.9) (848.8)Fair value of plan assets 759.2 78.1 42.7 – 880.0
Net asset/(liability) 33.1 (5.4) 7.4 (3.9) 31.2
2016
GB£m
ROI£m
NI£m
France£m
Total£m
Present value of benefit obligation (805.4) (91.3) (39.8) (3.9) (940.4)Fair value of plan assets 804.9 77.7 40.4 – 923.0
Net (liability)/asset (0.5) (13.6) 0.6 (3.9) (17.4)
GB Schemes
The group’s principal pension scheme for GB employees, the Britvic Pension Plan (‘BPP’) has both a final salary defined benefit section and defined contribution section. The defined benefit section was closed to new members from 1 August 2002 and closed to future accrual for active members from 1 April 2011, with active members moving to the defined contribution section for future service benefits.
The BPP is a limited partner of Britvic Scottish Limited Partnership (‘Britvic SLP’), which in turn is a limited partner in both Britvic Property Partnership (‘Britvic PP’) and Britvic Brands LLP. Britvic SLP, Britvic PP and Britvic Brands LLP are all consolidated by the group. The investment held by BPP does not represent a plan asset for accounting purposes and is therefore not included in the fair value of the plan assets.
Certain properties and group brands have been transferred to Britvic PP and Britvic Brands LLP respectively, all of which are leased back to Britvic Soft Drinks Limited. The group retains operational flexibility over the properties and brands including the ability to substitute the properties and brands held by Britvic PP and Britvic Brands respectively. The BPP is entitled to a share of the profits in Britvic SLP until 2026. At the end of this period, the partnership capital allocated to the BPP will be changed to an amount equal to any funding deficit of the BPP at this time, up to a maximum of £105m.
Contributions are paid into the defined benefit section of the BPP as determined by the Trustee, agreed by the company and certified by an independent actuary in the Schedule of Contributions. In addition to the expected partnership income of at least £5m per annum, the group will make a payment to the BPP of £14.866m by 31 December 2017. Additional contributions of £15m per annum by 31 December in the years 2018 and 2019 will be made due to the formal actuarial valuation in 2016 revealing these contributions are necessary to help return the BPP to full funding on a self-sufficiency basis by 31 March 2026. During this year £20.0m of additional contributions were paid to the BPP, of which £15.0m was paid by the group and £5.0m relates to income received from the pension funding partnership (‘PFP’) structure.
The contributions required are determined based on the secondary funding deficit revealed at the last triennial actuarial funding valuation, currently at 31 March 2016. The secondary funding deficit will always differ from the accounting valuation surplus/deficit above.
122 www.britvic.com

22. Pensions (continued)
Accounting standards require all companies to discount their projected cashflows at a standard rate based on high quality corporate bonds and not to allow for prudence when calculating the value of the liabilities. This is in contrast to the funding valuation where prudence is a requirement when assessing the value of the liabilities. This, in combination with the Plan being invested in relatively low risk assets as part of the funding strategy agreed, results in the funding valuation being expected to show a higher deficit than the accounting valuation. The benefits of adopting a low risk approach to funding is that there is less volatility expected in the Company’s future contribution requirements.
In addition when comparing the surplus/deficit, consideration of the different dates of the valuations need to be taken into account. The accounting valuation is assessed at the current balance sheet date of 1 October 2017, whereas the contributions agreed were based on the funding valuation at 31 March 2016.
Britvic’s business in GB also has a secured unfunded, unregistered retirement benefit scheme called The Britvic Executive Top Up Scheme (‘BETUS’) which provides benefits for members who have historically exceeded the Earnings Cap, or the Lifetime Allowance whilst members of the defined benefit section of the BPP. BETUS closed to future accrual on 10 April 2011 which coincided with the closure of the defined benefit section of the BPP.
The amount recognised as an expense in relation to the BPP defined contribution scheme in the consolidated income statement for 2017 was £10.6m (2016: £12.0m).
Republic of Ireland scheme
The Britvic Ireland Pension Plan (‘BIPP’) is a defined benefit pension plan. Following legislative changes made in 2012 no deficit recovery contributions are currently required. The Trustee has been undertaking investment de-risking to protect the on-going funding position achieved as a result of the 2012 changes. The latest triennial valuation was carried out as at 1 January 2015. The scheme remains open to future accrual for current members.
The amount recognised as an expense in relation to the Irish defined contribution schemes in the consolidated income statement for 2017 was £0.8m (2016: £0.7m).
Northern Ireland scheme
The Britvic Northern Ireland Pension Plan (‘BNIPP’) is a defined benefit pension plan which was closed to new members on 28 February 2006, and since this date new employees have been eligible to join a Stakeholder plan with Legal & General. The latest formal actuarial valuation for contribution purposes was carried out as at 31 December 2014.
Contributions are paid into the BNIPP as determined by the Trustee, agreed by the company and certified by an independent actuary in the Schedule of Contributions. Additional contributions of £1.5m per annum will be paid on a monthly basis up to 30 June 2022. The scheme remains open to future accrual for current members.
France schemes
Britvic France operates two defined benefit schemes: in the first, employees receive long-service cash payments at various stages throughout their careers. From the second, employees receive a lump sum at retirement. Payment amounts are dependent upon salary and service with the company. The schemes are unfunded therefore these benefits are paid directly as they fall due.
All group pension schemes are administered by trustees who are independent of the group’s finances, except for the Britvic France schemes which are operated directly by the company.
IFRIC 14
IFRIC 14 is applicable for accounting periods commencing on or after 1 January 2008. For the GB schemes the Trustee of the Plan previously made a change to the Rules of the Plan to clarify that any surplus may be returned directly to the Company without prior Trustee approval on the death or leaving of the final member of the Plan. Furthermore, any such refund should be treated as income for tax purposes. These two points should mean that IFRIC 14 does not have any practical impact on the Plan and so no allowance for it (and, in particular, no allowance for the asset ceiling) has been made in the calculated figures. BETUS is treated as unfunded for the purposes of IAS 19, so IFRIC 14 is not applicable.
For the Northern Ireland scheme the group has determined that it has an unconditional right to a refund of surplus from the Plan again on the final member leaving the plan and therefore the group has recognised the attributable IAS 19 surplus in full.
Changes to IFRIC 14 have been proposed which may change the assessment of how this interpretation is applied and may result in a cap being placed on the amount of surplus that can be recognised in the balance sheet. The group will consider the impact of these changes once they have been finalised and a revised IFRIC issued.
Net benefit (expense)/income2017
Total£m
2016 Total
£m
Current service cost (1.8) (1.3)Past service credit – 2.2Net interest on net defined benefit asset/(liability) 0.1 1.1Curtailment/settlement gain 1.1 1.2
Net (expense)/income (0.6) 3.2
The curtailment/settlement gain in the current and prior period arose due to the retirement of executives and the exchange of their benefits in the BETUS for a cash lump sum recognised in administration expenses. The past service cost gain during the prior period arose on the GB scheme due to a Pension Increase Exchange that was offered to members, in which members were given the option to exchange pensions which will receive future inflationary increases, for a higher pension now which will not increase in future.
Other than stated below, the net expense detailed above is recognised in arriving at net profit from continuing operations before tax and finance costs/income, and is included within cost of sales, selling and distribution costs and administration expenses.
Britvic plc Annual Report and Accounts 2017 123
Strate
gic re
port
Gove
rnan
ceFin
ancial state
ments
Ad
ditio
nal info
rmatio
n
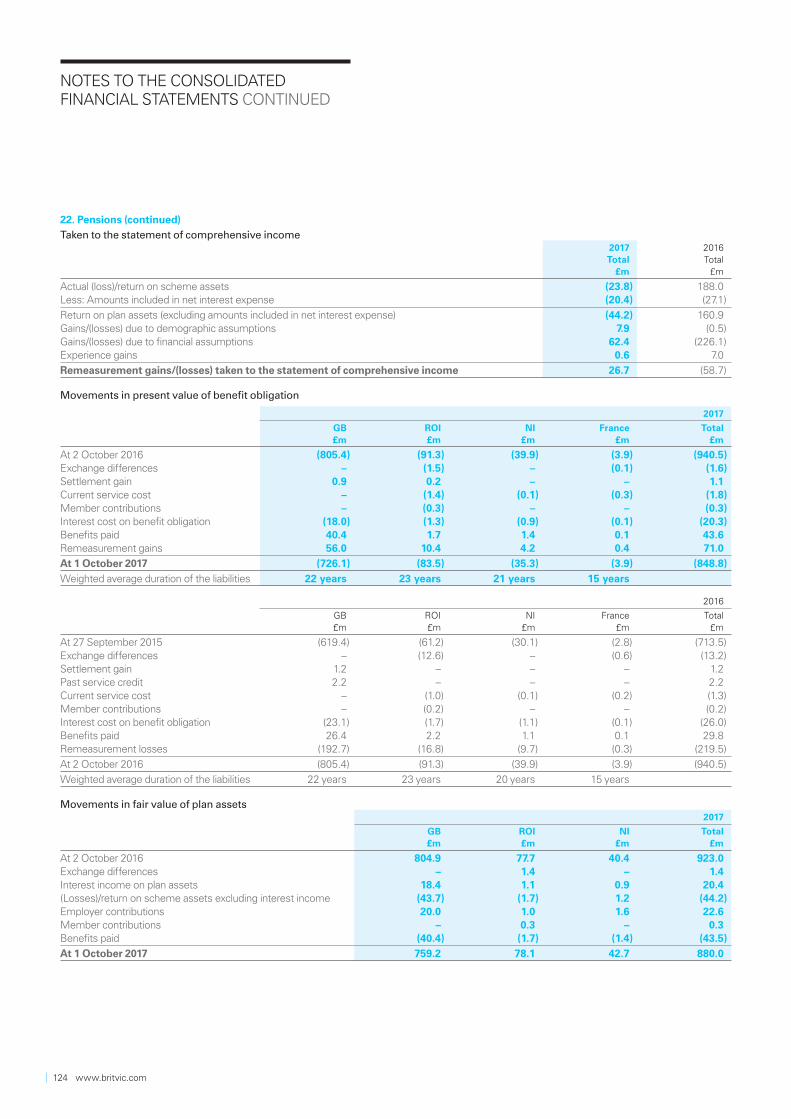
NOTES TO THE CONSOLIDATED FINANCIAL STATEMENTS CONTINUED
22. Pensions (continued)
Taken to the statement of comprehensive income2017
Total£m
2016 Total
£m
Actual (loss)/return on scheme assets (23.8) 188.0Less: Amounts included in net interest expense (20.4) (27.1)
Return on plan assets (excluding amounts included in net interest expense) (44.2) 160.9Gains/(losses) due to demographic assumptions 7.9 (0.5)Gains/(losses) due to financial assumptions 62.4 (226.1)Experience gains 0.6 7.0
Remeasurement gains/(losses) taken to the statement of comprehensive income 26.7 (58.7)
Movements in present value of benefit obligation
2017
GB£m
ROI£m
NI£m
France£m
Total£m
At 2 October 2016 (805.4) (91.3) (39.9) (3.9) (940.5)Exchange differences – (1.5) – (0.1) (1.6)Settlement gain 0.9 0.2 – – 1.1Current service cost – (1.4) (0.1) (0.3) (1.8)Member contributions – (0.3) – – (0.3)Interest cost on benefit obligation (18.0) (1.3) (0.9) (0.1) (20.3)Benefits paid 40.4 1.7 1.4 0.1 43.6Remeasurement gains 56.0 10.4 4.2 0.4 71.0
At 1 October 2017 (726.1) (83.5) (35.3) (3.9) (848.8)
Weighted average duration of the liabilities 22 years 23 years 21 years 15 years
2016
GB£m
ROI£m
NI£m
France£m
Total£m
At 27 September 2015 (619.4) (61.2) (30.1) (2.8) (713.5)Exchange differences – (12.6) – (0.6) (13.2)Settlement gain 1.2 – – – 1.2Past service credit 2.2 – – – 2.2Current service cost – (1.0) (0.1) (0.2) (1.3)Member contributions – (0.2) – – (0.2)Interest cost on benefit obligation (23.1) (1.7) (1.1) (0.1) (26.0)Benefits paid 26.4 2.2 1.1 0.1 29.8Remeasurement losses (192.7) (16.8) (9.7) (0.3) (219.5)
At 2 October 2016 (805.4) (91.3) (39.9) (3.9) (940.5)
Weighted average duration of the liabilities 22 years 23 years 20 years 15 years
Movements in fair value of plan assets2017
GB£m
ROI£m
NI£m
Total£m
At 2 October 2016 804.9 77.7 40.4 923.0Exchange differences – 1.4 – 1.4Interest income on plan assets 18.4 1.1 0.9 20.4(Losses)/return on scheme assets excluding interest income (43.7) (1.7) 1.2 (44.2)Employer contributions 20.0 1.0 1.6 22.6Member contributions – 0.3 – 0.3Benefits paid (40.4) (1.7) (1.4) (43.5)
At 1 October 2017 759.2 78.1 42.7 880.0
124 www.britvic.com
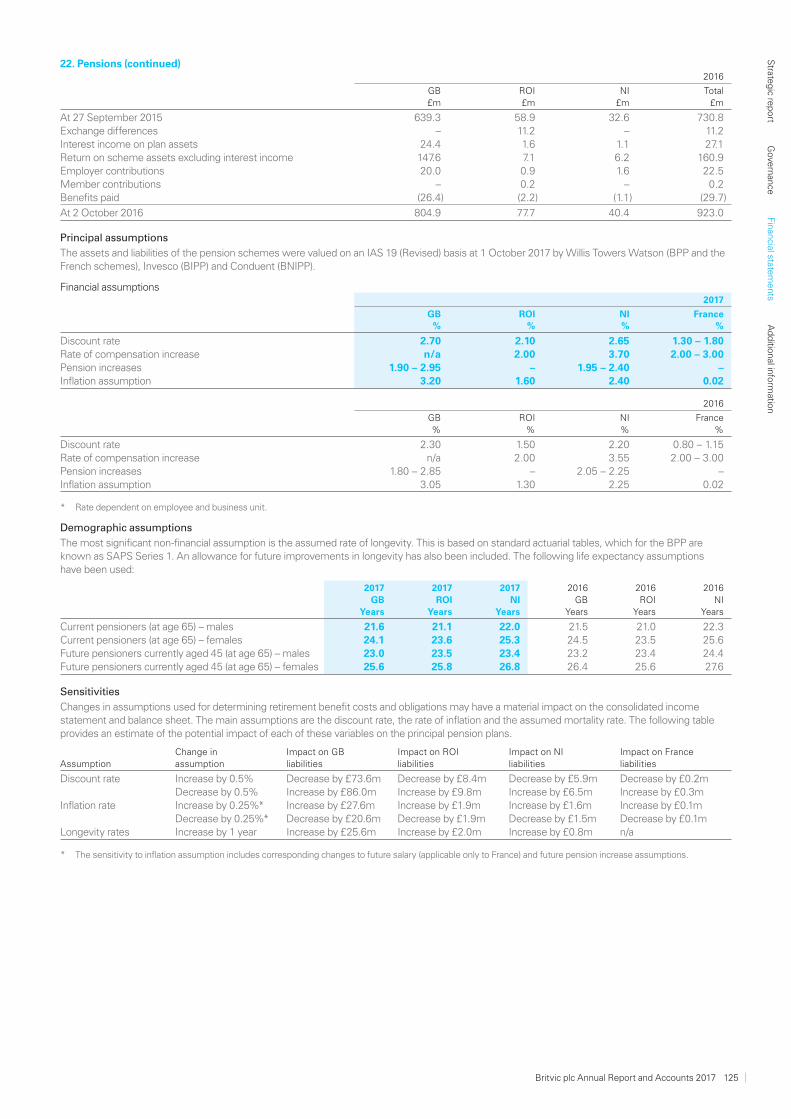
22. Pensions (continued)2016
GB£m
ROI£m
NI£m
Total£m
At 27 September 2015 639.3 58.9 32.6 730.8Exchange differences – 11.2 – 11.2Interest income on plan assets 24.4 1.6 1.1 27.1Return on scheme assets excluding interest income 147.6 7.1 6.2 160.9Employer contributions 20.0 0.9 1.6 22.5Member contributions – 0.2 – 0.2Benefits paid (26.4) (2.2) (1.1) (29.7)
At 2 October 2016 804.9 77.7 40.4 923.0
Principal assumptions
The assets and liabilities of the pension schemes were valued on an IAS 19 (Revised) basis at 1 October 2017 by Willis Towers Watson (BPP and the French schemes), Invesco (BIPP) and Conduent (BNIPP).
Financial assumptions2017
GB%
ROI%
NI%
France%
Discount rate 2.70 2.10 2.65 1.30 – 1.80Rate of compensation increase n/a 2.00 3.70 2.00 – 3.00Pension increases 1.90 – 2.95 – 1.95 – 2.40 –Inflation assumption 3.20 1.60 2.40 0.02
2016
GB%
ROI%
NI%
France%
Discount rate 2.30 1.50 2.20 0.80 – 1.15Rate of compensation increase n/a 2.00 3.55 2.00 – 3.00Pension increases 1.80 – 2.85 – 2.05 – 2.25 –Inflation assumption 3.05 1.30 2.25 0.02
* Rate dependent on employee and business unit.
Demographic assumptions
The most significant non-financial assumption is the assumed rate of longevity. This is based on standard actuarial tables, which for the BPP are known as SAPS Series 1. An allowance for future improvements in longevity has also been included. The following life expectancy assumptions have been used:
2017 GB
Years
2017ROI
Years
2017 NI
Years
2016 GB
Years
2016 ROI
Years
2016 NI
Years
Current pensioners (at age 65) – males 21.6 21.1 22.0 21.5 21.0 22.3Current pensioners (at age 65) – females 24.1 23.6 25.3 24.5 23.5 25.6Future pensioners currently aged 45 (at age 65) – males 23.0 23.5 23.4 23.2 23.4 24.4Future pensioners currently aged 45 (at age 65) – females 25.6 25.8 26.8 26.4 25.6 27.6
Sensitivities
Changes in assumptions used for determining retirement benefit costs and obligations may have a material impact on the consolidated income statement and balance sheet. The main assumptions are the discount rate, the rate of inflation and the assumed mortality rate. The following table provides an estimate of the potential impact of each of these variables on the principal pension plans.
AssumptionChange inassumption
Impact on GBliabilities
Impact on ROIliabilities
Impact on NIliabilities
Impact on Franceliabilities
Discount rate Increase by 0.5% Decrease by £73.6m Decrease by £8.4m Decrease by £5.9m Decrease by £0.2mDecrease by 0.5% Increase by £86.0m Increase by £9.8m Increase by £6.5m Increase by £0.3m
Inflation rate Increase by 0.25%* Increase by £27.6m Increase by £1.9m Increase by £1.6m Increase by £0.1mDecrease by 0.25%* Decrease by £20.6m Decrease by £1.9m Decrease by £1.5m Decrease by £0.1m
Longevity rates Increase by 1 year Increase by £25.6m Increase by £2.0m Increase by £0.8m n/a
* The sensitivity to inflation assumption includes corresponding changes to future salary (applicable only to France) and future pension increase assumptions.
Britvic plc Annual Report and Accounts 2017 125
Strate
gic re
port
Gove
rnan
ceFin
ancial state
ments
Ad
ditio
nal info
rmatio
n

NOTES TO THE CONSOLIDATED FINANCIAL STATEMENTS CONTINUED
22. Pensions (continued)
Categories of scheme assets as a percentage of the fair value of total scheme assets
2017
GB£m
ROI£m
NI£m
Total£m
Total%
UK equities 19.9 – 10.9 30.8 4Overseas equities 23.0 31.4 10.7 65.1 7Properties 23.4 3.4 – 26.8 3Corporate bonds 374.1 – 6.0 380.1 43Fixed interest gilts – – 6.1 6.1 1Index linked gilts – 43.3 8.2 51.5 6Liability-driven investments* 312.5 – – 312.5 35Cash and other assets 6.3 – 0.8 7.1 1
Total 759.2 78.1 42.7 880.0 100
2016
GB£m
ROI£m
NI£m
Total£m
Total%
UK equities 21.2 2.3 10.0 33.5 4Overseas equities 5.2 30.1 9.9 45.2 5Properties 3.4 – – 3.4 1Corporate bonds 339.1 – 5.9 345.0 37Fixed interest gilts – 41.6 5.8 47.4 5Index linked gilts – – 8.3 8.3 1Liability-driven investments* 365.3 – – 365.3 39Cash and other assets 70.7 3.7 0.5 74.9 8
Total 804.9 77.7 40.4 923.0 100
* These assets were previously shown in UK equities, fixed interest gilts and index linked gilts but have been reclassified to liability-driven investments to better reflect the underlying nature of these assets.
The fair values of the above equity and debt instruments are determined based on quoted market prices in active markets whereas the fair values of properties are not based on quoted market prices. The fixed interest and index linked asset classes include leveraged gilt funds.
Liability-driven investments are a portfolio of assets used in the GB scheme to hedge the the exposure to changes in interest rates and inflation. It consists of equities, fixed interest gilts and index linked gilts including leveraged gilt funds. The fair value of these assets is derived from quoted market prices of the underlying funds held. These funds are held as part of the strategy by the trustees of the GB scheme to invest in low risk assets that provide a hedge against interest rates and inflation.
Normal contributions of £1.1m are expected to be paid into the defined benefit pension schemes during the 2018 financial year.
Additional contributions of £21.5m are expected to be paid into the defined benefit pension schemes during the 2018 financial year, of which £16.5m is expected to be paid by the group and £5.0m by the partnership.
Risks
For defined contribution sections and plans, the group’s liability is limited to the requirement to pay contributions on behalf of each employee. In these arrangements the associated risks are borne by the members.
For defined benefit sections and plans, the group bears the risks of operation. The main risk that the group runs in respect of the defined benefit schemes is that additional contributions are required to pay for the benefits if investment returns are not sufficient. The contributions required for the schemes are in general determined at each triennial actuarial funding valuation. The key factors that will affect the need for additional contributions include levels of long-term inflation and interest rates and the assessment of how long members are expected to live, along with the level of investment return achieved. The level of investment return achieved is subject to a range of risks typical of the asset classes held, in particular market risk on equities, credit risk on corporate bonds and exposure to the property market. The discount rates used to calculate the liabilities are set by reference to yields on high quality corporate bonds. There is therefore a mismatch between the assets held and the way that the liabilities are calculated, meaning that the net balance sheet position disclosed under IAS 19 could fluctuate.
For the BPP, the trustee holds the power to determine the contribution rates that the group should pay, although the group fully uses the opportunity to make representation to the trustee on this point. The trustee of the BPP agreed to implement an investment strategy which consists of a diverse range of fixed interest and index-linked securities, which will provides a significant hedge against inflation and interest rate risk. The intention is to continue to remove equities from the investment portfolio to further reduce investment risk.
The funding partnership mitigates the risk that additional cash contributions will be required after 31 March 2026, as the partnership will pay up to £105m to remove any funding deficit at 31 March 2026.
126 www.britvic.com
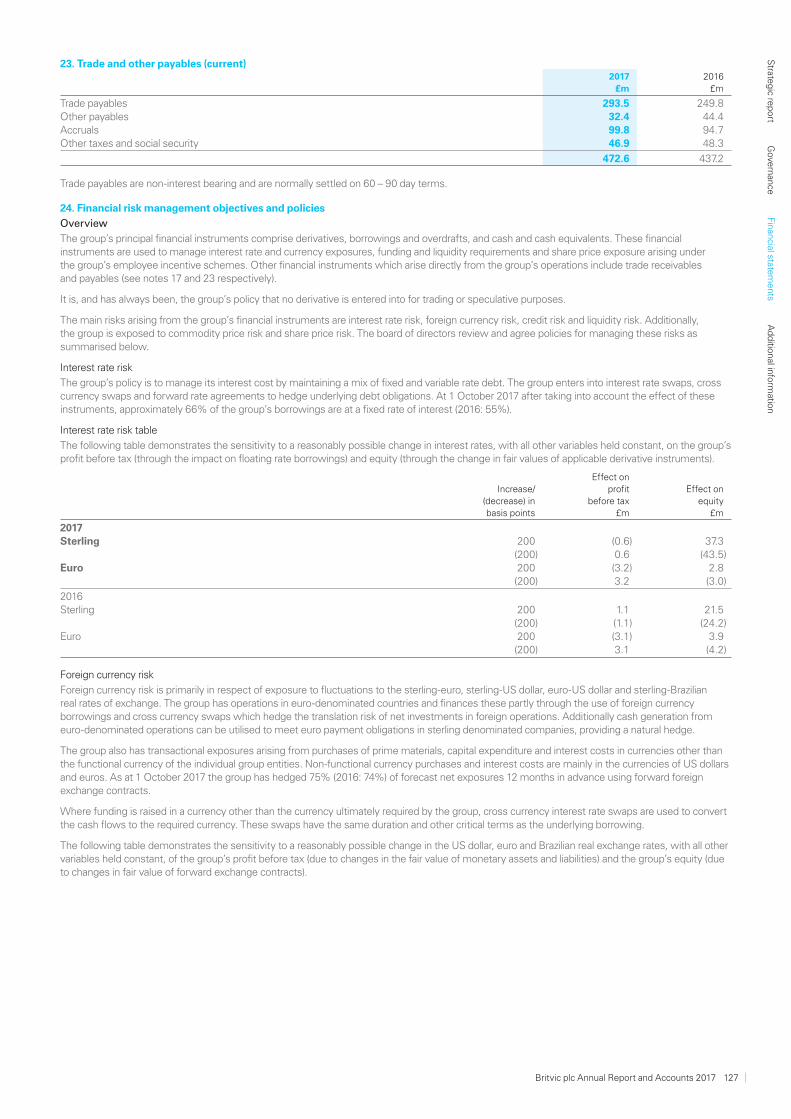
23. Trade and other payables (current) 2017 £m
2016 £m
Trade payables 293.5 249.8Other payables 32.4 44.4Accruals 99.8 94.7Other taxes and social security 46.9 48.3
472.6 437.2
Trade payables are non-interest bearing and are normally settled on 60 – 90 day terms.
24. Financial risk management objectives and policies
Overview
The group’s principal financial instruments comprise derivatives, borrowings and overdrafts, and cash and cash equivalents. These financial instruments are used to manage interest rate and currency exposures, funding and liquidity requirements and share price exposure arising under the group’s employee incentive schemes. Other financial instruments which arise directly from the group’s operations include trade receivables and payables (see notes 17 and 23 respectively).
It is, and has always been, the group’s policy that no derivative is entered into for trading or speculative purposes.
The main risks arising from the group’s financial instruments are interest rate risk, foreign currency risk, credit risk and liquidity risk. Additionally, the group is exposed to commodity price risk and share price risk. The board of directors review and agree policies for managing these risks as summarised below.
Interest rate risk
The group’s policy is to manage its interest cost by maintaining a mix of fixed and variable rate debt. The group enters into interest rate swaps, cross currency swaps and forward rate agreements to hedge underlying debt obligations. At 1 October 2017 after taking into account the effect of these instruments, approximately 66% of the group’s borrowings are at a fixed rate of interest (2016: 55%).
Interest rate risk table
The following table demonstrates the sensitivity to a reasonably possible change in interest rates, with all other variables held constant, on the group’s profit before tax (through the impact on floating rate borrowings) and equity (through the change in fair values of applicable derivative instruments).
Increase/(decrease) inbasis points
Effect onprofit
before tax £m
Effect onequity
£m
2017Sterling 200 (0.6) 37.3
(200) 0.6 (43.5)Euro 200 (3.2) 2.8
(200) 3.2 (3.0)
2016Sterling 200 1.1 21.5
(200) (1.1) (24.2)Euro 200 (3.1) 3.9
(200) 3.1 (4.2)
Foreign currency risk
Foreign currency risk is primarily in respect of exposure to fluctuations to the sterling-euro, sterling-US dollar, euro-US dollar and sterling-Brazilian real rates of exchange. The group has operations in euro-denominated countries and finances these partly through the use of foreign currency borrowings and cross currency swaps which hedge the translation risk of net investments in foreign operations. Additionally cash generation from euro-denominated operations can be utilised to meet euro payment obligations in sterling denominated companies, providing a natural hedge.
The group also has transactional exposures arising from purchases of prime materials, capital expenditure and interest costs in currencies other than the functional currency of the individual group entities. Non-functional currency purchases and interest costs are mainly in the currencies of US dollars and euros. As at 1 October 2017 the group has hedged 75% (2016: 74%) of forecast net exposures 12 months in advance using forward foreign exchange contracts.
Where funding is raised in a currency other than the currency ultimately required by the group, cross currency interest rate swaps are used to convert the cash flows to the required currency. These swaps have the same duration and other critical terms as the underlying borrowing.
The following table demonstrates the sensitivity to a reasonably possible change in the US dollar, euro and Brazilian real exchange rates, with all other variables held constant, of the group’s profit before tax (due to changes in the fair value of monetary assets and liabilities) and the group’s equity (due to changes in fair value of forward exchange contracts).
Britvic plc Annual Report and Accounts 2017 127
Strate
gic re
port
Gove
rnan
ceFin
ancial state
ments
Ad
ditio
nal info
rmatio
n
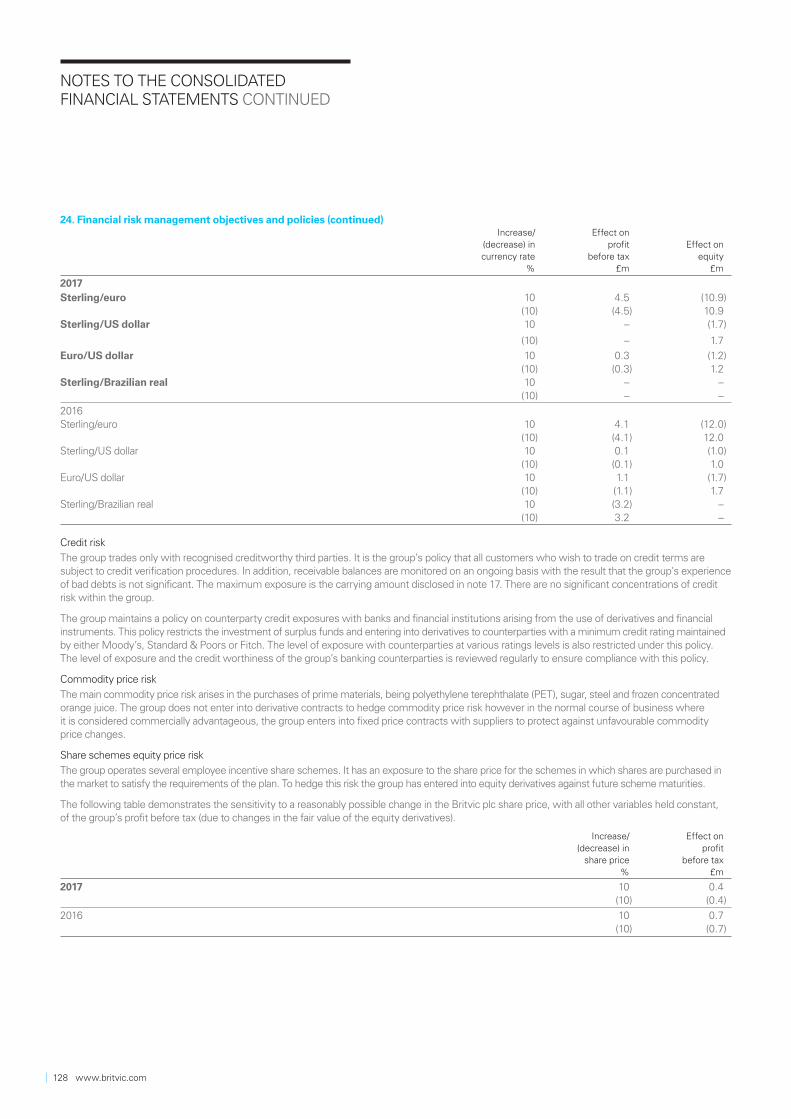
NOTES TO THE CONSOLIDATED FINANCIAL STATEMENTS CONTINUED
24. Financial risk management objectives and policies (continued)Increase/
(decrease) incurrency rate
%
Effect onprofit
before tax £m
Effect onequity
£m
2017Sterling/euro 10 4.5 (10.9)
(10) (4.5) 10.9Sterling/US dollar 10 – (1.7)
(10) – 1.7
Euro/US dollar 10 0.3 (1.2)(10) (0.3) 1.2
Sterling/Brazilian real 10 – –(10) – –
2016Sterling/euro 10 4.1 (12.0)
(10) (4.1) 12.0Sterling/US dollar 10 0.1 (1.0)
(10) (0.1) 1.0Euro/US dollar 10 1.1 (1.7)
(10) (1.1) 1.7Sterling/Brazilian real 10 (3.2) –
(10) 3.2 –
Credit risk
The group trades only with recognised creditworthy third parties. It is the group’s policy that all customers who wish to trade on credit terms are subject to credit verification procedures. In addition, receivable balances are monitored on an ongoing basis with the result that the group’s experience of bad debts is not significant. The maximum exposure is the carrying amount disclosed in note 17. There are no significant concentrations of credit risk within the group.
The group maintains a policy on counterparty credit exposures with banks and financial institutions arising from the use of derivatives and financial instruments. This policy restricts the investment of surplus funds and entering into derivatives to counterparties with a minimum credit rating maintained by either Moody’s, Standard & Poors or Fitch. The level of exposure with counterparties at various ratings levels is also restricted under this policy. The level of exposure and the credit worthiness of the group’s banking counterparties is reviewed regularly to ensure compliance with this policy.
Commodity price risk
The main commodity price risk arises in the purchases of prime materials, being polyethylene terephthalate (PET), sugar, steel and frozen concentrated orange juice. The group does not enter into derivative contracts to hedge commodity price risk however in the normal course of business where it is considered commercially advantageous, the group enters into fixed price contracts with suppliers to protect against unfavourable commodity price changes.
Share schemes equity price risk
The group operates several employee incentive share schemes. It has an exposure to the share price for the schemes in which shares are purchased in the market to satisfy the requirements of the plan. To hedge this risk the group has entered into equity derivatives against future scheme maturities.
The following table demonstrates the sensitivity to a reasonably possible change in the Britvic plc share price, with all other variables held constant, of the group’s profit before tax (due to changes in the fair value of the equity derivatives).
Increase/(decrease) in
share price%
Effect onprofit
before tax£m
2017 10 0.4(10) (0.4)
2016 10 0.7(10) (0.7)
128 www.britvic.com
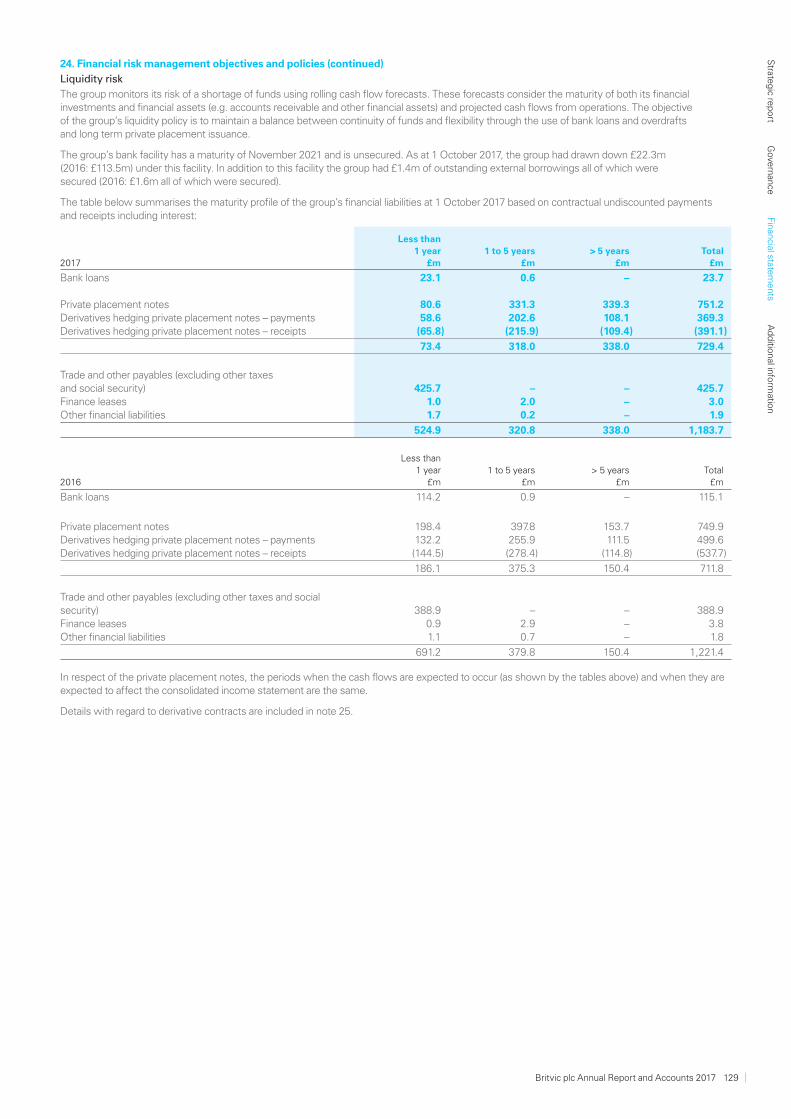
24. Financial risk management objectives and policies (continued)
Liquidity risk
The group monitors its risk of a shortage of funds using rolling cash flow forecasts. These forecasts consider the maturity of both its financial investments and financial assets (e.g. accounts receivable and other financial assets) and projected cash flows from operations. The objective of the group’s liquidity policy is to maintain a balance between continuity of funds and flexibility through the use of bank loans and overdrafts and long term private placement issuance.
The group’s bank facility has a maturity of November 2021 and is unsecured. As at 1 October 2017, the group had drawn down £22.3m (2016: £113.5m) under this facility. In addition to this facility the group had £1.4m of outstanding external borrowings all of which were secured (2016: £1.6m all of which were secured).
The table below summarises the maturity profile of the group’s financial liabilities at 1 October 2017 based on contractual undiscounted payments and receipts including interest:
2017
Less than 1 year
£m1 to 5 years
£m> 5 years
£mTotal
£m
Bank loans 23.1 0.6 – 23.7
Private placement notes 80.6 331.3 339.3 751.2Derivatives hedging private placement notes – payments 58.6 202.6 108.1 369.3Derivatives hedging private placement notes – receipts (65.8) (215.9) (109.4) (391.1)
73.4 318.0 338.0 729.4
Trade and other payables (excluding other taxes and social security) 425.7 – – 425.7Finance leases 1.0 2.0 – 3.0Other financial liabilities 1.7 0.2 – 1.9
524.9 320.8 338.0 1,183.7
2016
Less than 1 year
£m1 to 5 years
£m> 5 years
£mTotal
£m
Bank loans 114.2 0.9 – 115.1
Private placement notes 198.4 397.8 153.7 749.9Derivatives hedging private placement notes – payments 132.2 255.9 111.5 499.6Derivatives hedging private placement notes – receipts (144.5) (278.4) (114.8) (537.7)
186.1 375.3 150.4 711.8
Trade and other payables (excluding other taxes and social security) 388.9 – – 388.9Finance leases 0.9 2.9 – 3.8Other financial liabilities 1.1 0.7 – 1.8
691.2 379.8 150.4 1,221.4
In respect of the private placement notes, the periods when the cash flows are expected to occur (as shown by the tables above) and when they are expected to affect the consolidated income statement are the same.
Details with regard to derivative contracts are included in note 25.
Britvic plc Annual Report and Accounts 2017 129
Strate
gic re
port
Gove
rnan
ceFin
ancial state
ments
Ad
ditio
nal info
rmatio
n
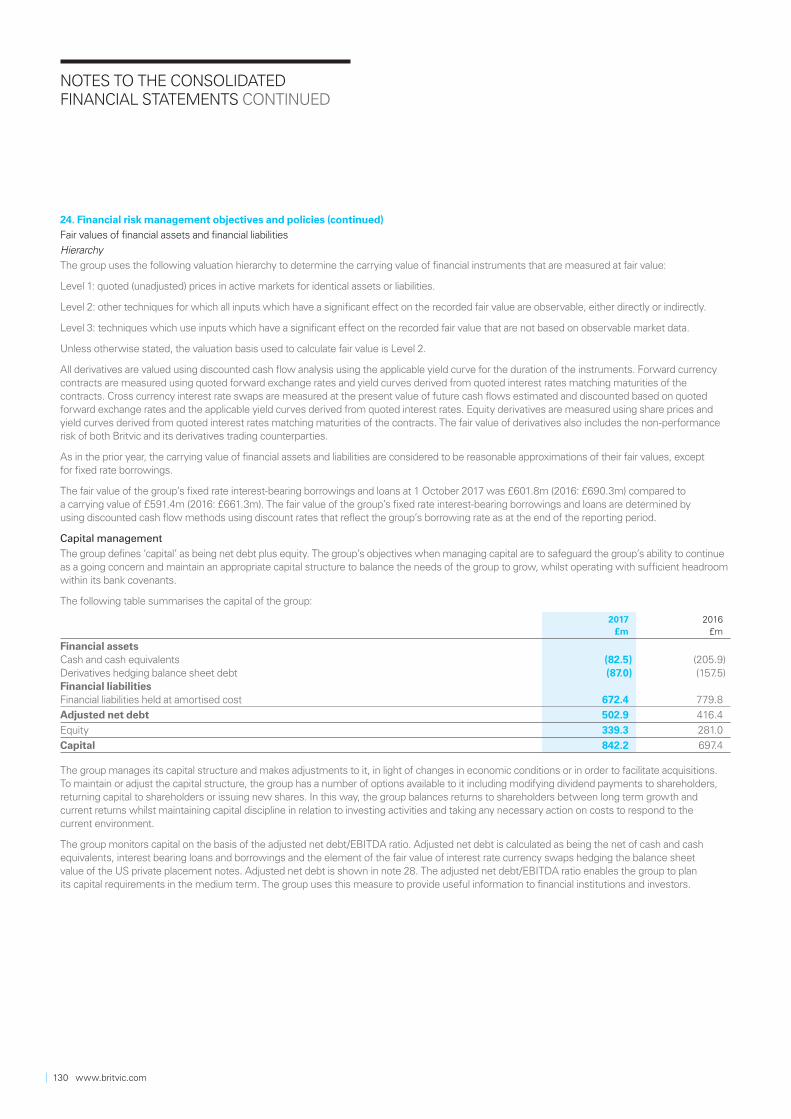
NOTES TO THE CONSOLIDATED FINANCIAL STATEMENTS CONTINUED
24. Financial risk management objectives and policies (continued)
Fair values of financial assets and financial liabilities
Hierarchy
The group uses the following valuation hierarchy to determine the carrying value of financial instruments that are measured at fair value:
Level 1: quoted (unadjusted) prices in active markets for identical assets or liabilities.
Level 2: other techniques for which all inputs which have a significant effect on the recorded fair value are observable, either directly or indirectly.
Level 3: techniques which use inputs which have a significant effect on the recorded fair value that are not based on observable market data.
Unless otherwise stated, the valuation basis used to calculate fair value is Level 2.
All derivatives are valued using discounted cash flow analysis using the applicable yield curve for the duration of the instruments. Forward currency contracts are measured using quoted forward exchange rates and yield curves derived from quoted interest rates matching maturities of the contracts. Cross currency interest rate swaps are measured at the present value of future cash flows estimated and discounted based on quoted forward exchange rates and the applicable yield curves derived from quoted interest rates. Equity derivatives are measured using share prices and yield curves derived from quoted interest rates matching maturities of the contracts. The fair value of derivatives also includes the non-performance risk of both Britvic and its derivatives trading counterparties.
As in the prior year, the carrying value of financial assets and liabilities are considered to be reasonable approximations of their fair values, except for fixed rate borrowings.
The fair value of the group’s fixed rate interest-bearing borrowings and loans at 1 October 2017 was £601.8m (2016: £690.3m) compared to a carrying value of £591.4m (2016: £661.3m). The fair value of the group’s fixed rate interest-bearing borrowings and loans are determined by using discounted cash flow methods using discount rates that reflect the group’s borrowing rate as at the end of the reporting period.
Capital management
The group defines ‘capital’ as being net debt plus equity. The group’s objectives when managing capital are to safeguard the group’s ability to continue as a going concern and maintain an appropriate capital structure to balance the needs of the group to grow, whilst operating with sufficient headroom within its bank covenants.
The following table summarises the capital of the group:
2017 £m
2016 £m
Financial assetsCash and cash equivalents (82.5) (205.9)Derivatives hedging balance sheet debt (87.0) (157.5)Financial liabilitiesFinancial liabilities held at amortised cost 672.4 779.8
Adjusted net debt 502.9 416.4
Equity 339.3 281.0
Capital 842.2 697.4
The group manages its capital structure and makes adjustments to it, in light of changes in economic conditions or in order to facilitate acquisitions. To maintain or adjust the capital structure, the group has a number of options available to it including modifying dividend payments to shareholders, returning capital to shareholders or issuing new shares. In this way, the group balances returns to shareholders between long term growth and current returns whilst maintaining capital discipline in relation to investing activities and taking any necessary action on costs to respond to the current environment.
The group monitors capital on the basis of the adjusted net debt/EBITDA ratio. Adjusted net debt is calculated as being the net of cash and cash equivalents, interest bearing loans and borrowings and the element of the fair value of interest rate currency swaps hedging the balance sheet value of the US private placement notes. Adjusted net debt is shown in note 28. The adjusted net debt/EBITDA ratio enables the group to plan its capital requirements in the medium term. The group uses this measure to provide useful information to financial institutions and investors.
130 www.britvic.com
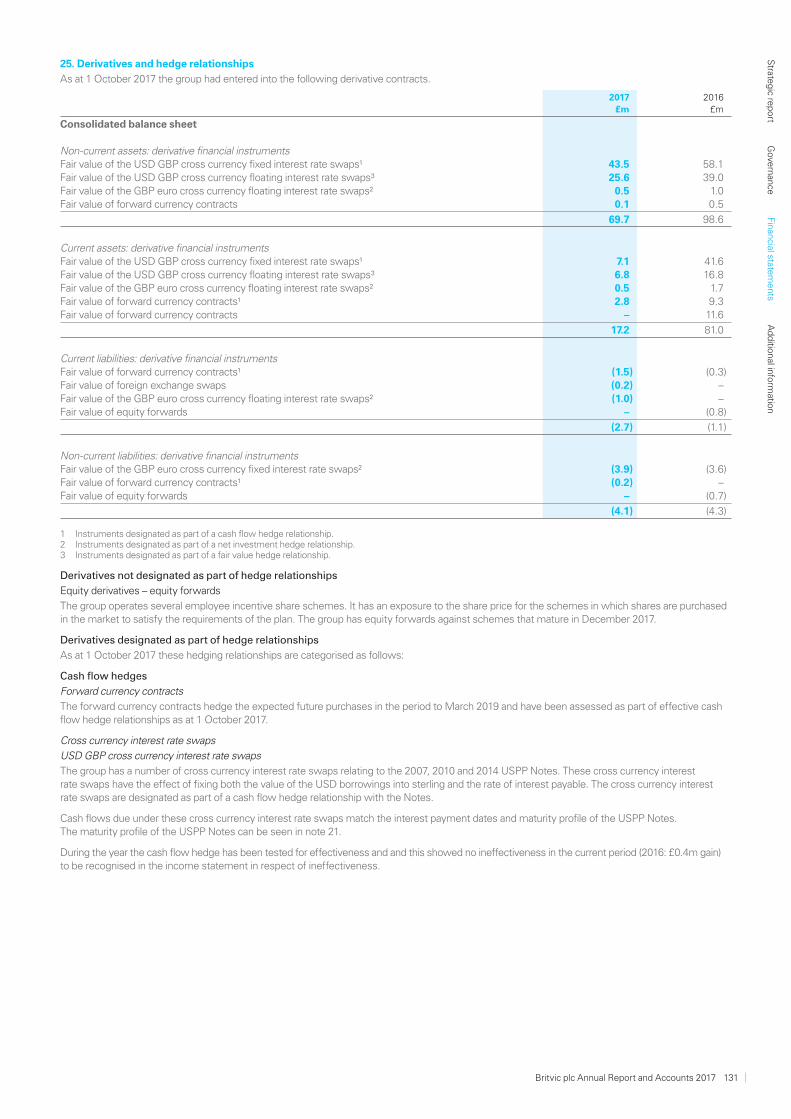
25. Derivatives and hedge relationships
As at 1 October 2017 the group had entered into the following derivative contracts.
2017 £m
2016 £m
Consolidated balance sheet
Non-current assets: derivative financial instrumentsFair value of the USD GBP cross currency fixed interest rate swaps¹ 43.5 58.1Fair value of the USD GBP cross currency floating interest rate swaps³ 25.6 39.0Fair value of the GBP euro cross currency floating interest rate swaps² 0.5 1.0Fair value of forward currency contracts 0.1 0.5
69.7 98.6
Current assets: derivative financial instrumentsFair value of the USD GBP cross currency fixed interest rate swaps¹ 7.1 41.6Fair value of the USD GBP cross currency floating interest rate swaps³ 6.8 16.8Fair value of the GBP euro cross currency floating interest rate swaps² 0.5 1.7Fair value of forward currency contracts¹ 2.8 9.3Fair value of forward currency contracts – 11.6
17.2 81.0
Current liabilities: derivative financial instrumentsFair value of forward currency contracts¹ (1.5) (0.3)Fair value of foreign exchange swaps (0.2) –Fair value of the GBP euro cross currency floating interest rate swaps² (1.0) –Fair value of equity forwards – (0.8)
(2.7) (1.1)
Non-current liabilities: derivative financial instrumentsFair value of the GBP euro cross currency fixed interest rate swaps² (3.9) (3.6)Fair value of forward currency contracts¹ (0.2) –Fair value of equity forwards – (0.7)
(4.1) (4.3)
1 Instruments designated as part of a cash flow hedge relationship. 2 Instruments designated as part of a net investment hedge relationship. 3 Instruments designated as part of a fair value hedge relationship.
Derivatives not designated as part of hedge relationships
Equity derivatives – equity forwards
The group operates several employee incentive share schemes. It has an exposure to the share price for the schemes in which shares are purchased in the market to satisfy the requirements of the plan. The group has equity forwards against schemes that mature in December 2017.
Derivatives designated as part of hedge relationships
As at 1 October 2017 these hedging relationships are categorised as follows:
Cash flow hedges
Forward currency contracts
The forward currency contracts hedge the expected future purchases in the period to March 2019 and have been assessed as part of effective cash flow hedge relationships as at 1 October 2017.
Cross currency interest rate swaps
USD GBP cross currency interest rate swaps
The group has a number of cross currency interest rate swaps relating to the 2007, 2010 and 2014 USPP Notes. These cross currency interest rate swaps have the effect of fixing both the value of the USD borrowings into sterling and the rate of interest payable. The cross currency interest rate swaps are designated as part of a cash flow hedge relationship with the Notes.
Cash flows due under these cross currency interest rate swaps match the interest payment dates and maturity profile of the USPP Notes. The maturity profile of the USPP Notes can be seen in note 21.
During the year the cash flow hedge has been tested for effectiveness and and this showed no ineffectiveness in the current period (2016: £0.4m gain) to be recognised in the income statement in respect of ineffectiveness.
Britvic plc Annual Report and Accounts 2017 131
Strate
gic re
port
Gove
rnan
ceFin
ancial state
ments
Ad
ditio
nal info
rmatio
n
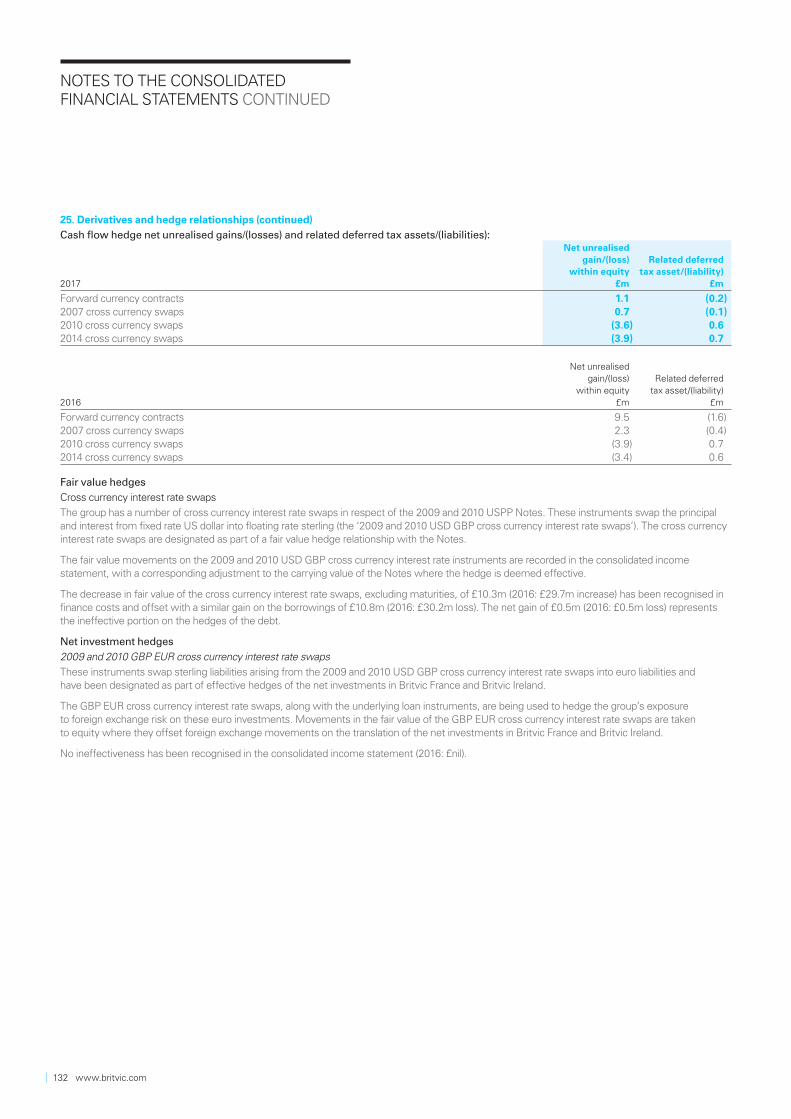
NOTES TO THE CONSOLIDATED FINANCIAL STATEMENTS CONTINUED
25. Derivatives and hedge relationships (continued)
Cash flow hedge net unrealised gains/(losses) and related deferred tax assets/(liabilities):
2017
Net unrealised gain/(loss)
within equity £m
Related deferred tax asset/(liability)
£m
Forward currency contracts 1.1 (0.2)2007 cross currency swaps 0.7 (0.1)2010 cross currency swaps (3.6) 0.62014 cross currency swaps (3.9) 0.7
2016
Net unrealised gain/(loss)
within equity £m
Related deferred tax asset/(liability)
£m
Forward currency contracts 9.5 (1.6)2007 cross currency swaps 2.3 (0.4)2010 cross currency swaps (3.9) 0.72014 cross currency swaps (3.4) 0.6
Fair value hedges
Cross currency interest rate swaps
The group has a number of cross currency interest rate swaps in respect of the 2009 and 2010 USPP Notes. These instruments swap the principal and interest from fixed rate US dollar into floating rate sterling (the ‘2009 and 2010 USD GBP cross currency interest rate swaps’). The cross currency interest rate swaps are designated as part of a fair value hedge relationship with the Notes.
The fair value movements on the 2009 and 2010 USD GBP cross currency interest rate instruments are recorded in the consolidated income statement, with a corresponding adjustment to the carrying value of the Notes where the hedge is deemed effective.
The decrease in fair value of the cross currency interest rate swaps, excluding maturities, of £10.3m (2016: £29.7m increase) has been recognised in finance costs and offset with a similar gain on the borrowings of £10.8m (2016: £30.2m loss). The net gain of £0.5m (2016: £0.5m loss) represents the ineffective portion on the hedges of the debt.
Net investment hedges
2009 and 2010 GBP EUR cross currency interest rate swaps
These instruments swap sterling liabilities arising from the 2009 and 2010 USD GBP cross currency interest rate swaps into euro liabilities and have been designated as part of effective hedges of the net investments in Britvic France and Britvic Ireland.
The GBP EUR cross currency interest rate swaps, along with the underlying loan instruments, are being used to hedge the group’s exposure to foreign exchange risk on these euro investments. Movements in the fair value of the GBP EUR cross currency interest rate swaps are taken to equity where they offset foreign exchange movements on the translation of the net investments in Britvic France and Britvic Ireland.
No ineffectiveness has been recognised in the consolidated income statement (2016: £nil).
132 www.britvic.com
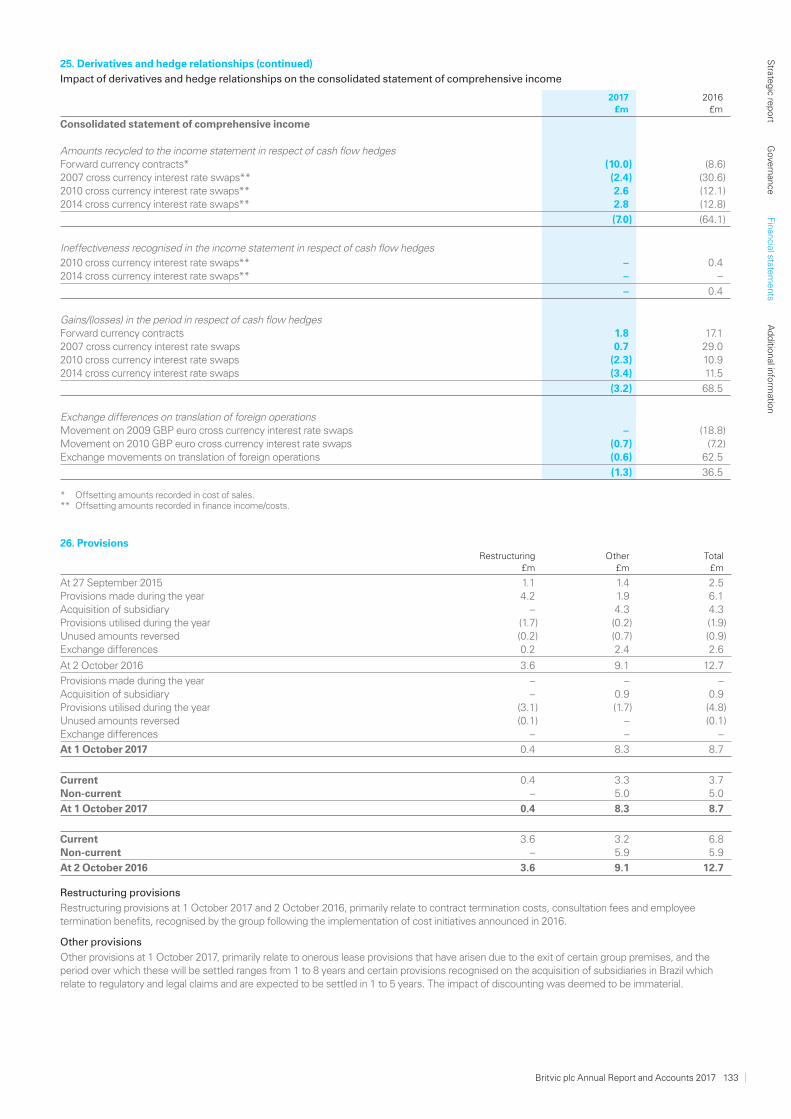
25. Derivatives and hedge relationships (continued)
Impact of derivatives and hedge relationships on the consolidated statement of comprehensive income
2017 £m
2016 £m
Consolidated statement of comprehensive income
Amounts recycled to the income statement in respect of cash flow hedgesForward currency contracts* (10.0) (8.6)2007 cross currency interest rate swaps** (2.4) (30.6)2010 cross currency interest rate swaps** 2.6 (12.1)2014 cross currency interest rate swaps** 2.8 (12.8)
(7.0) (64.1)
Ineffectiveness recognised in the income statement in respect of cash flow hedges
2010 cross currency interest rate swaps** – 0.42014 cross currency interest rate swaps** – –
– 0.4
Gains/(losses) in the period in respect of cash flow hedgesForward currency contracts 1.8 17.12007 cross currency interest rate swaps 0.7 29.02010 cross currency interest rate swaps (2.3) 10.92014 cross currency interest rate swaps (3.4) 11.5
(3.2) 68.5
Exchange differences on translation of foreign operationsMovement on 2009 GBP euro cross currency interest rate swaps – (18.8)Movement on 2010 GBP euro cross currency interest rate swaps (0.7) (7.2)Exchange movements on translation of foreign operations (0.6) 62.5
(1.3) 36.5
* Offsetting amounts recorded in cost of sales. ** Offsetting amounts recorded in finance income/costs.
26. Provisions Restructuring
£mOther
£mTotal
£m
At 27 September 2015 1.1 1.4 2.5Provisions made during the year 4.2 1.9 6.1Acquisition of subsidiary – 4.3 4.3Provisions utilised during the year (1.7) (0.2) (1.9)Unused amounts reversed (0.2) (0.7) (0.9)Exchange differences 0.2 2.4 2.6
At 2 October 2016 3.6 9.1 12.7
Provisions made during the year – – –Acquisition of subsidiary – 0.9 0.9Provisions utilised during the year (3.1) (1.7) (4.8)Unused amounts reversed (0.1) – (0.1)Exchange differences – – –
At 1 October 2017 0.4 8.3 8.7
Current 0.4 3.3 3.7Non-current – 5.0 5.0
At 1 October 2017 0.4 8.3 8.7
Current 3.6 3.2 6.8Non-current – 5.9 5.9
At 2 October 2016 3.6 9.1 12.7
Restructuring provisions
Restructuring provisions at 1 October 2017 and 2 October 2016, primarily relate to contract termination costs, consultation fees and employee termination benefits, recognised by the group following the implementation of cost initiatives announced in 2016.
Other provisions
Other provisions at 1 October 2017, primarily relate to onerous lease provisions that have arisen due to the exit of certain group premises, and the period over which these will be settled ranges from 1 to 8 years and certain provisions recognised on the acquisition of subsidiaries in Brazil which relate to regulatory and legal claims and are expected to be settled in 1 to 5 years. The impact of discounting was deemed to be immaterial.
Britvic plc Annual Report and Accounts 2017 133
Strate
gic re
port
Gove
rnan
ceFin
ancial state
ments
Ad
ditio
nal info
rmatio
n
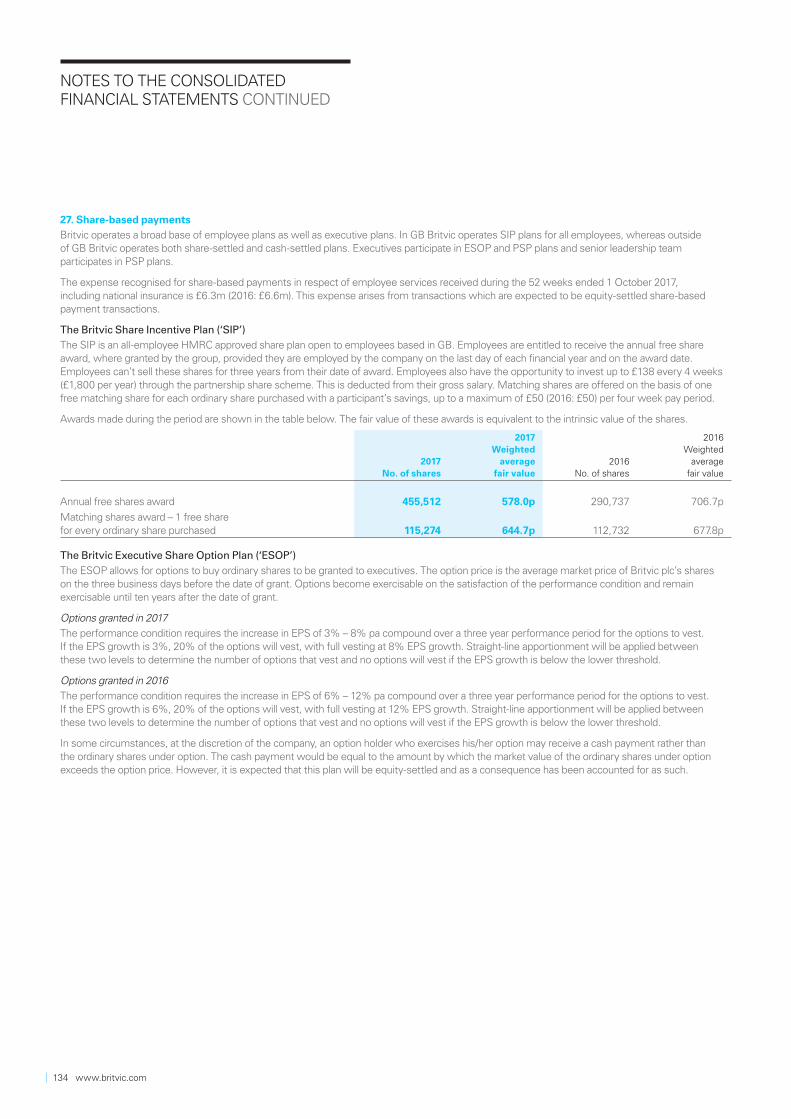
NOTES TO THE CONSOLIDATED FINANCIAL STATEMENTS CONTINUED
27. Share-based payments
Britvic operates a broad base of employee plans as well as executive plans. In GB Britvic operates SIP plans for all employees, whereas outside of GB Britvic operates both share-settled and cash-settled plans. Executives participate in ESOP and PSP plans and senior leadership team participates in PSP plans.
The expense recognised for share-based payments in respect of employee services received during the 52 weeks ended 1 October 2017, including national insurance is £6.3m (2016: £6.6m). This expense arises from transactions which are expected to be equity-settled share-based payment transactions.
The Britvic Share Incentive Plan (‘SIP’)
The SIP is an all-employee HMRC approved share plan open to employees based in GB. Employees are entitled to receive the annual free share award, where granted by the group, provided they are employed by the company on the last day of each financial year and on the award date. Employees can’t sell these shares for three years from their date of award. Employees also have the opportunity to invest up to £138 every 4 weeks (£1,800 per year) through the partnership share scheme. This is deducted from their gross salary. Matching shares are offered on the basis of one free matching share for each ordinary share purchased with a participant’s savings, up to a maximum of £50 (2016: £50) per four week pay period.
Awards made during the period are shown in the table below. The fair value of these awards is equivalent to the intrinsic value of the shares.
2017 No. of shares
2017 Weighted
average fair value
2016No. of shares
2016Weighted average fair value
Annual free shares award 455,512 578.0p 290,737 706.7p
Matching shares award – 1 free share for every ordinary share purchased 115,274 644.7p 112,732 677.8p
The Britvic Executive Share Option Plan (‘ESOP’)
The ESOP allows for options to buy ordinary shares to be granted to executives. The option price is the average market price of Britvic plc’s shares on the three business days before the date of grant. Options become exercisable on the satisfaction of the performance condition and remain exercisable until ten years after the date of grant.
Options granted in 2017
The performance condition requires the increase in EPS of 3% – 8% pa compound over a three year performance period for the options to vest. If the EPS growth is 3%, 20% of the options will vest, with full vesting at 8% EPS growth. Straight-line apportionment will be applied between these two levels to determine the number of options that vest and no options will vest if the EPS growth is below the lower threshold.
Options granted in 2016
The performance condition requires the increase in EPS of 6% – 12% pa compound over a three year performance period for the options to vest. If the EPS growth is 6%, 20% of the options will vest, with full vesting at 12% EPS growth. Straight-line apportionment will be applied between these two levels to determine the number of options that vest and no options will vest if the EPS growth is below the lower threshold.
In some circumstances, at the discretion of the company, an option holder who exercises his/her option may receive a cash payment rather than the ordinary shares under option. The cash payment would be equal to the amount by which the market value of the ordinary shares under option exceeds the option price. However, it is expected that this plan will be equity-settled and as a consequence has been accounted for as such.
134 www.britvic.com
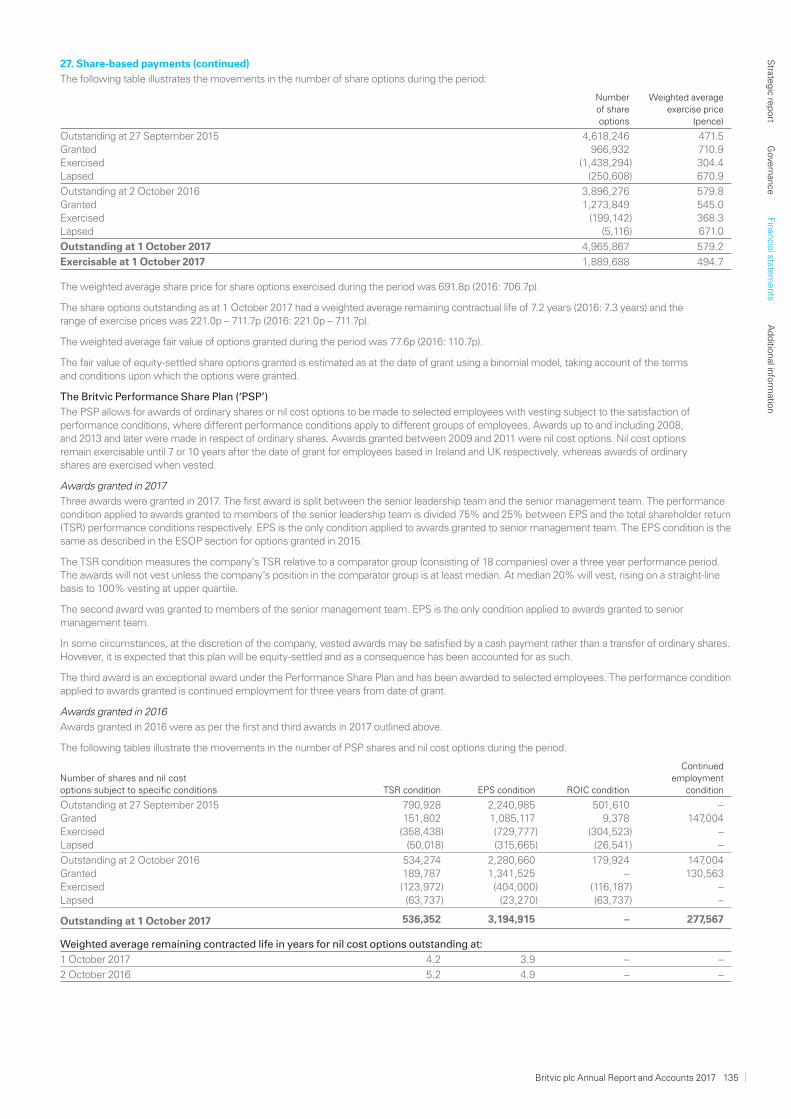
27. Share-based payments (continued)
The following table illustrates the movements in the number of share options during the period:
Number of share options
Weighted average exercise price
(pence)
Outstanding at 27 September 2015 4,618,246 471.5Granted 966,932 710.9Exercised (1,438,294) 304.4Lapsed (250,608) 670.9
Outstanding at 2 October 2016 3,896,276 579.8 Granted 1,273,849 545.0Exercised (199,142) 368.3Lapsed (5,116) 671.0
Outstanding at 1 October 2017 4,965,867 579.2
Exercisable at 1 October 2017 1,889,688 494.7
The weighted average share price for share options exercised during the period was 691.8p (2016: 706.7p).
The share options outstanding as at 1 October 2017 had a weighted average remaining contractual life of 7.2 years (2016: 7.3 years) and the range of exercise prices was 221.0p – 711.7p (2016: 221.0p – 711.7p).
The weighted average fair value of options granted during the period was 77.6p (2016: 110.7p).
The fair value of equity-settled share options granted is estimated as at the date of grant using a binomial model, taking account of the terms and conditions upon which the options were granted.
The Britvic Performance Share Plan (‘PSP’)
The PSP allows for awards of ordinary shares or nil cost options to be made to selected employees with vesting subject to the satisfaction of performance conditions, where different performance conditions apply to different groups of employees. Awards up to and including 2008, and 2013 and later were made in respect of ordinary shares. Awards granted between 2009 and 2011 were nil cost options. Nil cost options remain exercisable until 7 or 10 years after the date of grant for employees based in Ireland and UK respectively, whereas awards of ordinary shares are exercised when vested.
Awards granted in 2017
Three awards were granted in 2017. The first award is split between the senior leadership team and the senior management team. The performance condition applied to awards granted to members of the senior leadership team is divided 75% and 25% between EPS and the total shareholder return (TSR) performance conditions respectively. EPS is the only condition applied to awards granted to senior management team. The EPS condition is the same as described in the ESOP section for options granted in 2015.
The TSR condition measures the company’s TSR relative to a comparator group (consisting of 18 companies) over a three year performance period. The awards will not vest unless the company’s position in the comparator group is at least median. At median 20% will vest, rising on a straight-line basis to 100% vesting at upper quartile.
The second award was granted to members of the senior management team. EPS is the only condition applied to awards granted to senior management team.
In some circumstances, at the discretion of the company, vested awards may be satisfied by a cash payment rather than a transfer of ordinary shares. However, it is expected that this plan will be equity-settled and as a consequence has been accounted for as such.
The third award is an exceptional award under the Performance Share Plan and has been awarded to selected employees. The performance condition applied to awards granted is continued employment for three years from date of grant.
Awards granted in 2016
Awards granted in 2016 were as per the first and third awards in 2017 outlined above.
The following tables illustrate the movements in the number of PSP shares and nil cost options during the period.
Number of shares and nil cost options subject to specific conditions TSR condition EPS condition ROIC condition
Continued employment
condition
Outstanding at 27 September 2015 790,928 2,240,985 501,610 –Granted 151,802 1,085,117 9,378 147,004Exercised (358,438) (729,777) (304,523) –Lapsed (50,018) (315,665) (26,541) –
Outstanding at 2 October 2016 534,274 2,280,660 179,924 147,004Granted 189,787 1,341,525 – 130,563Exercised (123,972) (404,000) (116,187) –Lapsed (63,737) (23,270) (63,737) –
Outstanding at 1 October 2017 536,352 3,194,915 – 277,567
Weighted average remaining contracted life in years for nil cost options outstanding at:
1 October 2017 4.2 3.9 – –
2 October 2016 5.2 4.9 – –
Britvic plc Annual Report and Accounts 2017 135
Strate
gic re
port
Gove
rnan
ceFin
ancial state
ments
Ad
ditio
nal info
rmatio
n
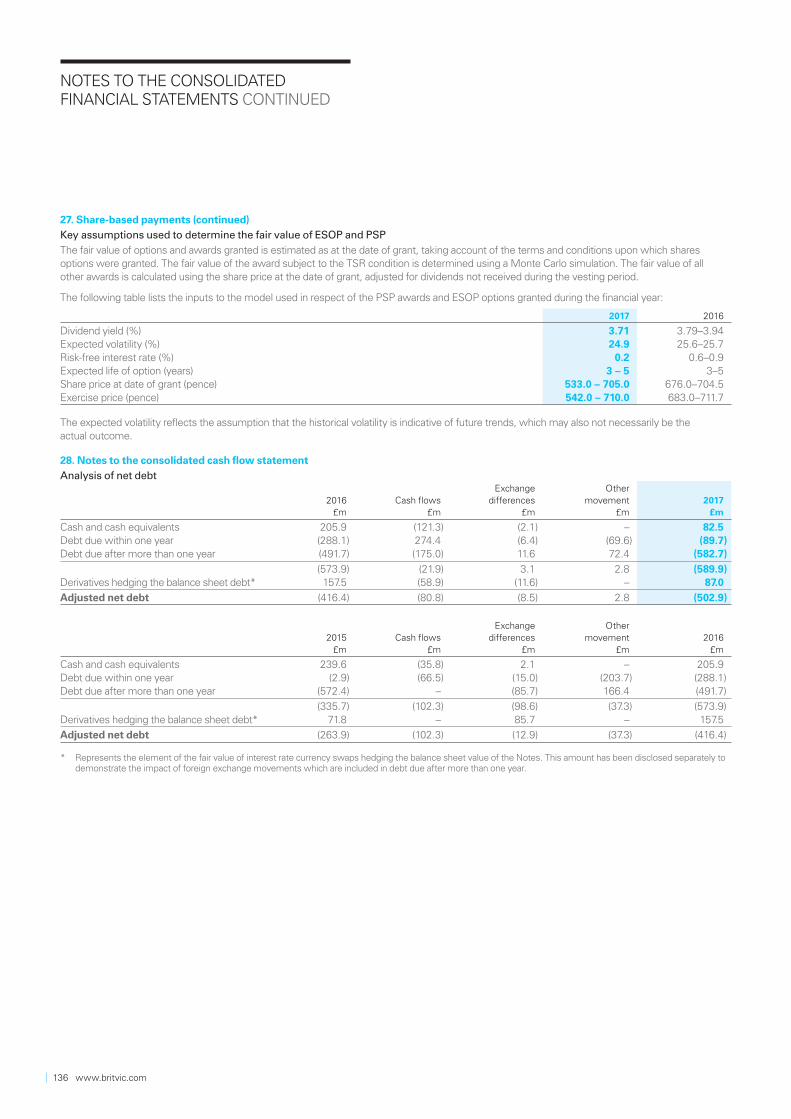
NOTES TO THE CONSOLIDATED FINANCIAL STATEMENTS CONTINUED
27. Share-based payments (continued)
Key assumptions used to determine the fair value of ESOP and PSP
The fair value of options and awards granted is estimated as at the date of grant, taking account of the terms and conditions upon which shares options were granted. The fair value of the award subject to the TSR condition is determined using a Monte Carlo simulation. The fair value of all other awards is calculated using the share price at the date of grant, adjusted for dividends not received during the vesting period.
The following table lists the inputs to the model used in respect of the PSP awards and ESOP options granted during the financial year:
2017 2016
Dividend yield (%) 3.71 3.79–3.94Expected volatility (%) 24.9 25.6–25.7Risk-free interest rate (%) 0.2 0.6–0.9Expected life of option (years) 3 – 5 3–5 Share price at date of grant (pence) 533.0 – 705.0 676.0–704.5Exercise price (pence) 542.0 – 710.0 683.0–711.7
The expected volatility reflects the assumption that the historical volatility is indicative of future trends, which may also not necessarily be the actual outcome.
28. Notes to the consolidated cash flow statement
Analysis of net debt
2016 £m
Cash flows £m
Exchange differences
£m
Other movement
£m 2017
£m
Cash and cash equivalents 205.9 (121.3) (2.1) – 82.5Debt due within one year (288.1) 274.4 (6.4) (69.6) (89.7)Debt due after more than one year (491.7) (175.0) 11.6 72.4 (582.7)
(573.9) (21.9) 3.1 2.8 (589.9)Derivatives hedging the balance sheet debt* 157.5 (58.9) (11.6) – 87.0
Adjusted net debt (416.4) (80.8) (8.5) 2.8 (502.9)
2015
£m Cash flows
£m
Exchange differences
£m
Other movement
£m2016
£m
Cash and cash equivalents 239.6 (35.8) 2.1 – 205.9Debt due within one year (2.9) (66.5) (15.0) (203.7) (288.1)Debt due after more than one year (572.4) – (85.7) 166.4 (491.7)
(335.7) (102.3) (98.6) (37.3) (573.9)Derivatives hedging the balance sheet debt* 71.8 – 85.7 – 157.5
Adjusted net debt (263.9) (102.3) (12.9) (37.3) (416.4)
* Represents the element of the fair value of interest rate currency swaps hedging the balance sheet value of the Notes. This amount has been disclosed separately to demonstrate the impact of foreign exchange movements which are included in debt due after more than one year.
136 www.britvic.com
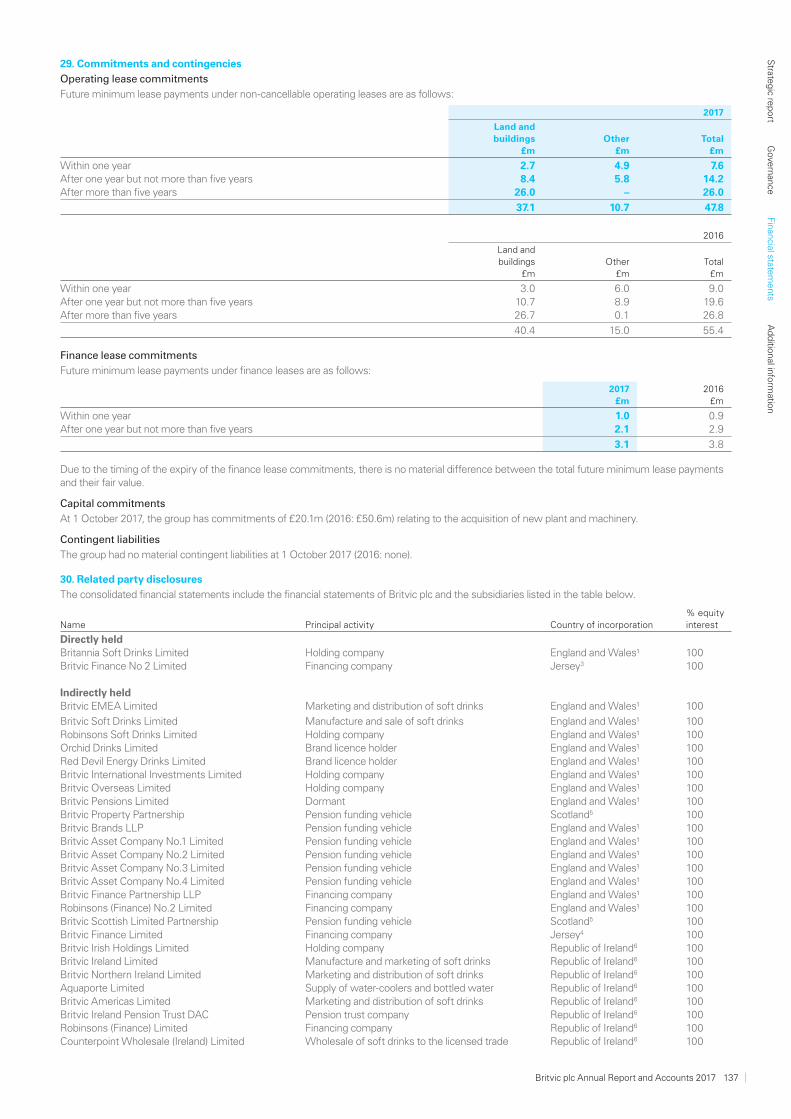
29. Commitments and contingencies
Operating lease commitments
Future minimum lease payments under non-cancellable operating leases are as follows:
2017
Land and buildings
£mOther
£mTotal
£m
Within one year 2.7 4.9 7.6After one year but not more than five years 8.4 5.8 14.2After more than five years 26.0 – 26.0
37.1 10.7 47.8
2016
Land and buildings
£mOther
£mTotal
£m
Within one year 3.0 6.0 9.0After one year but not more than five years 10.7 8.9 19.6After more than five years 26.7 0.1 26.8
40.4 15.0 55.4
Finance lease commitments
Future minimum lease payments under finance leases are as follows:
2017 £m
2016 £m
Within one year 1.0 0.9After one year but not more than five years 2.1 2.9
3.1 3.8
Due to the timing of the expiry of the finance lease commitments, there is no material difference between the total future minimum lease payments and their fair value.
Capital commitments
At 1 October 2017, the group has commitments of £20.1m (2016: £50.6m) relating to the acquisition of new plant and machinery.
Contingent liabilities
The group had no material contingent liabilities at 1 October 2017 (2016: none).
30. Related party disclosures
The consolidated financial statements include the financial statements of Britvic plc and the subsidiaries listed in the table below.
Name Principal activity Country of incorporation% equity interest
Directly heldBritannia Soft Drinks Limited Holding company England and Wales¹ 100Britvic Finance No 2 Limited Financing company Jersey3 100
Indirectly heldBritvic EMEA Limited Marketing and distribution of soft drinks England and Wales¹ 100
Britvic Soft Drinks Limited Manufacture and sale of soft drinks England and Wales¹ 100Robinsons Soft Drinks Limited Holding company England and Wales¹ 100Orchid Drinks Limited Brand licence holder England and Wales¹ 100Red Devil Energy Drinks Limited Brand licence holder England and Wales¹ 100Britvic International Investments Limited Holding company England and Wales¹ 100Britvic Overseas Limited Holding company England and Wales¹ 100Britvic Pensions Limited Dormant England and Wales¹ 100Britvic Property Partnership Pension funding vehicle Scotland5 100Britvic Brands LLP Pension funding vehicle England and Wales¹ 100Britvic Asset Company No.1 Limited Pension funding vehicle England and Wales¹ 100Britvic Asset Company No.2 Limited Pension funding vehicle England and Wales¹ 100Britvic Asset Company No.3 Limited Pension funding vehicle England and Wales¹ 100Britvic Asset Company No.4 Limited Pension funding vehicle England and Wales¹ 100Britvic Finance Partnership LLP Financing company England and Wales¹ 100Robinsons (Finance) No.2 Limited Financing company England and Wales¹ 100Britvic Scottish Limited Partnership Pension funding vehicle Scotland5 100Britvic Finance Limited Financing company Jersey4 100Britvic Irish Holdings Limited Holding company Republic of Ireland6 100Britvic Ireland Limited Manufacture and marketing of soft drinks Republic of Ireland6 100Britvic Northern Ireland Limited Marketing and distribution of soft drinks Republic of Ireland6 100Aquaporte Limited Supply of water-coolers and bottled water Republic of Ireland6 100Britvic Americas Limited Marketing and distribution of soft drinks Republic of Ireland6 100Britvic Ireland Pension Trust DAC Pension trust company Republic of Ireland6 100Robinsons (Finance) Limited Financing company Republic of Ireland6 100Counterpoint Wholesale (Ireland) Limited Wholesale of soft drinks to the licensed trade Republic of Ireland6 100
Britvic plc Annual Report and Accounts 2017 137
Strate
gic re
port
Gove
rnan
ceFin
ancial state
ments
Ad
ditio
nal info
rmatio
n
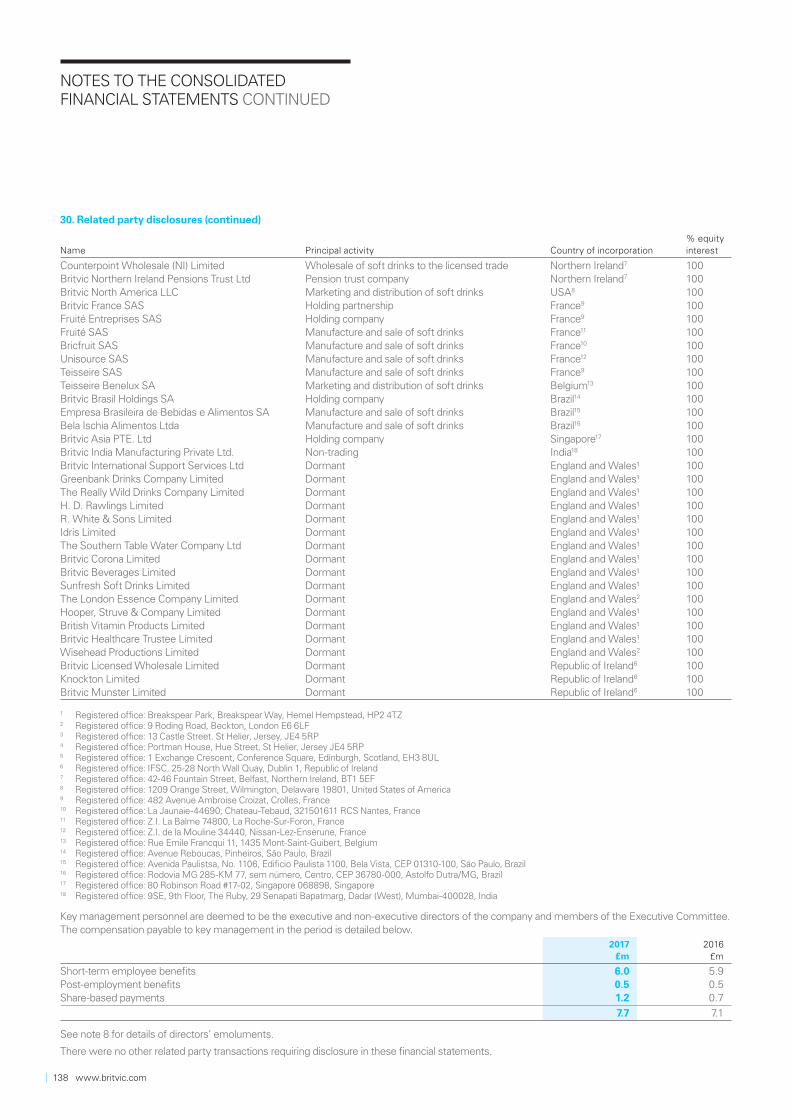
NOTES TO THE CONSOLIDATED FINANCIAL STATEMENTS CONTINUED
Name Principal activity Country of incorporation% equity interest
Counterpoint Wholesale (NI) Limited Wholesale of soft drinks to the licensed trade Northern Ireland7 100Britvic Northern Ireland Pensions Trust Ltd Pension trust company Northern Ireland7 100Britvic North America LLC Marketing and distribution of soft drinks USA8 100Britvic France SAS Holding partnership France9 100Fruité Entreprises SAS Holding company France9 100Fruité SAS Manufacture and sale of soft drinks France11 100Bricfruit SAS Manufacture and sale of soft drinks France10 100Unisource SAS Manufacture and sale of soft drinks France12 100Teisseire SAS Manufacture and sale of soft drinks France9 100Teisseire Benelux SA Marketing and distribution of soft drinks Belgium13 100Britvic Brasil Holdings SA Holding company Brazil14 100Empresa Brasileira de Bebidas e Alimentos SA Manufacture and sale of soft drinks Brazil15 100Bela Ischia Alimentos Ltda Manufacture and sale of soft drinks Brazil16 100Britvic Asia PTE. Ltd Holding company Singapore17 100Britvic India Manufacturing Private Ltd. Non-trading India18 100Britvic International Support Services Ltd Dormant England and Wales¹ 100Greenbank Drinks Company Limited Dormant England and Wales¹ 100The Really Wild Drinks Company Limited Dormant England and Wales¹ 100H. D. Rawlings Limited Dormant England and Wales¹ 100R. White & Sons Limited Dormant England and Wales¹ 100Idris Limited Dormant England and Wales¹ 100The Southern Table Water Company Ltd Dormant England and Wales¹ 100Britvic Corona Limited Dormant England and Wales¹ 100Britvic Beverages Limited Dormant England and Wales¹ 100Sunfresh Soft Drinks Limited Dormant England and Wales¹ 100The London Essence Company Limited Dormant England and Wales2 100Hooper, Struve & Company Limited Dormant England and Wales¹ 100British Vitamin Products Limited Dormant England and Wales¹ 100Britvic Healthcare Trustee Limited Dormant England and Wales¹ 100Wisehead Productions Limited Dormant England and Wales2 100Britvic Licensed Wholesale Limited Dormant Republic of Ireland6 100Knockton Limited Dormant Republic of Ireland6 100Britvic Munster Limited Dormant Republic of Ireland6 100
1 Registered office: Breakspear Park, Breakspear Way, Hemel Hempstead, HP2 4TZ2 Registered office: 9 Roding Road, Beckton, London E6 6LF3 Registered office: 13 Castle Street. St Helier, Jersey, JE4 5RP4 Registered office: Portman House, Hue Street, St Helier, Jersey JE4 5RP5 Registered office: 1 Exchange Crescent, Conference Square, Edinburgh, Scotland, EH3 8UL6 Registered office: IFSC, 25-28 North Wall Quay, Dublin 1, Republic of Ireland7 Registered office: 42-46 Fountain Street, Belfast, Northern Ireland, BT1 5EF8 Registered office: 1209 Orange Street, Wilmington, Delaware 19801, United States of America9 Registered office: 482 Avenue Ambroise Croizat, Crolles, France10 Registered office: La Jaunaie-44690, Chateau-Tebaud, 321501611 RCS Nantes, France11 Registered office: Z.I. La Balme 74800, La Roche-Sur-Foron, France12 Registered office: Z.I. de la Mouline 34440, Nissan-Lez-Enserune, France13 Registered office: Rue Emile Francqui 11, 1435 Mont-Saint-Guibert, Belgium14 Registered office: Avenue Reboucas, Pinheiros, São Paulo, Brazil15 Registered office: Avenida Paulistsa, No. 1106, Edificio Paulista 1100, Bela Vista, CEP 01310-100, São Paulo, Brazil16 Registered office: Rodovia MG 285-KM 77, sem número, Centro, CEP 36780-000, Astolfo Dutra/MG, Brazil17 Registered office: 80 Robinson Road #17-02, Singapore 068898, Singapore 18 Registered office: 9SE, 9th Floor, The Ruby, 29 Senapati Bapatmarg, Dadar (West), Mumbai-400028, India
Key management personnel are deemed to be the executive and non-executive directors of the company and members of the Executive Committee. The compensation payable to key management in the period is detailed below.
2017 £m
2016 £m
Short-term employee benefits 6.0 5.9Post-employment benefits 0.5 0.5Share-based payments 1.2 0.7
7.7 7.1
See note 8 for details of directors’ emoluments.
There were no other related party transactions requiring disclosure in these financial statements.
30. Related party disclosures (continued)
138 www.britvic.com
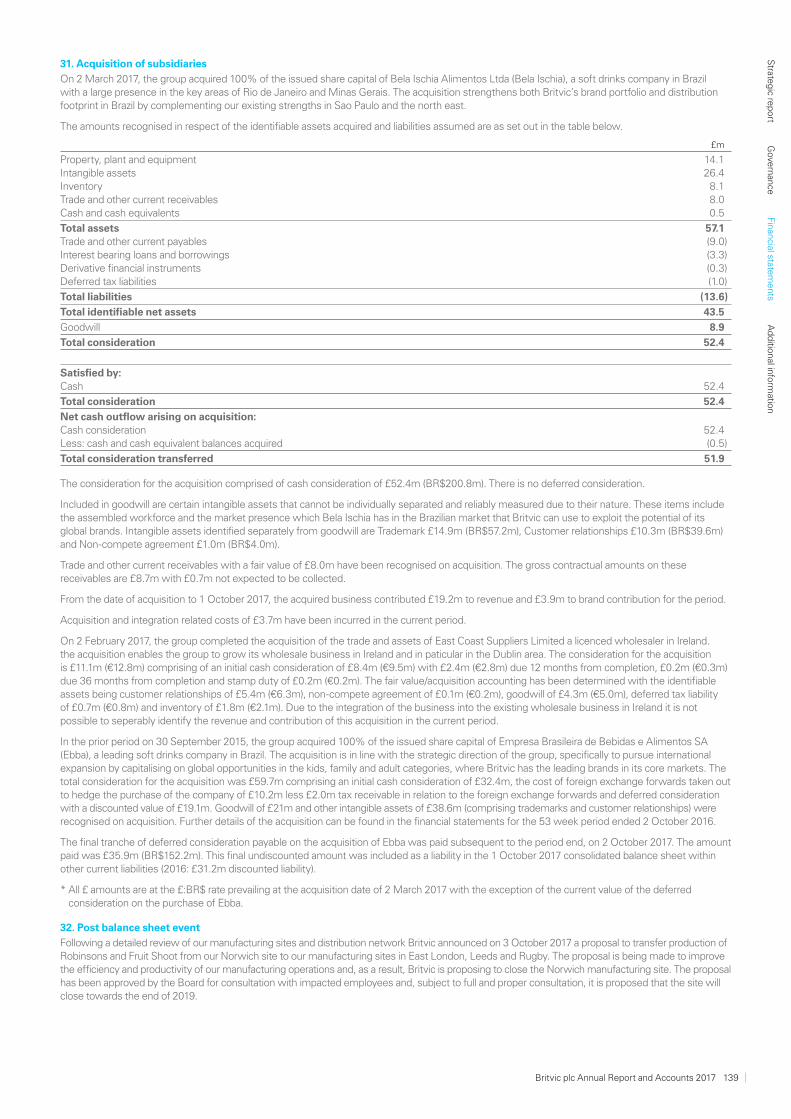
31. Acquisition of subsidiaries
On 2 March 2017, the group acquired 100% of the issued share capital of Bela Ischia Alimentos Ltda (Bela Ischia), a soft drinks company in Brazil with a large presence in the key areas of Rio de Janeiro and Minas Gerais. The acquisition strengthens both Britvic’s brand portfolio and distribution footprint in Brazil by complementing our existing strengths in Sao Paulo and the north east.
The amounts recognised in respect of the identifiable assets acquired and liabilities assumed are as set out in the table below.
£m
Property, plant and equipment 14.1Intangible assets 26.4Inventory 8.1Trade and other current receivables 8.0Cash and cash equivalents 0.5
Total assets 57.1Trade and other current payables (9.0)Interest bearing loans and borrowings (3.3)Derivative financial instruments (0.3)Deferred tax liabilities (1.0)
Total liabilities (13.6)
Total identifiable net assets 43.5
Goodwill 8.9
Total consideration 52.4
Satisfied by:Cash 52.4
Total consideration 52.4
Net cash outflow arising on acquisition:Cash consideration 52.4Less: cash and cash equivalent balances acquired (0.5)
Total consideration transferred 51.9
The consideration for the acquisition comprised of cash consideration of £52.4m (BR$200.8m). There is no deferred consideration.
Included in goodwill are certain intangible assets that cannot be individually separated and reliably measured due to their nature. These items include the assembled workforce and the market presence which Bela Ischia has in the Brazilian market that Britvic can use to exploit the potential of its global brands. Intangible assets identified separately from goodwill are Trademark £14.9m (BR$57.2m), Customer relationships £10.3m (BR$39.6m) and Non-compete agreement £1.0m (BR$4.0m).
Trade and other current receivables with a fair value of £8.0m have been recognised on acquisition. The gross contractual amounts on these receivables are £8.7m with £0.7m not expected to be collected.
From the date of acquisition to 1 October 2017, the acquired business contributed £19.2m to revenue and £3.9m to brand contribution for the period.
Acquisition and integration related costs of £3.7m have been incurred in the current period.
On 2 February 2017, the group completed the acquisition of the trade and assets of East Coast Suppliers Limited a licenced wholesaler in Ireland. the acquisition enables the group to grow its wholesale business in Ireland and in paticular in the Dublin area. The consideration for the acquisition is £11.1m (€12.8m) comprising of an initial cash consideration of £8.4m (€9.5m) with £2.4m (€2.8m) due 12 months from completion, £0.2m (€0.3m) due 36 months from completion and stamp duty of £0.2m (€0.2m). The fair value/acquisition accounting has been determined with the identifiable assets being customer relationships of £5.4m (€6.3m), non-compete agreement of £0.1m (€0.2m), goodwill of £4.3m (€5.0m), deferred tax liability of £0.7m (€0.8m) and inventory of £1.8m (€2.1m). Due to the integration of the business into the existing wholesale business in Ireland it is not possible to seperably identify the revenue and contribution of this acquisition in the current period.
In the prior period on 30 September 2015, the group acquired 100% of the issued share capital of Empresa Brasileira de Bebidas e Alimentos SA (Ebba), a leading soft drinks company in Brazil. The acquisition is in line with the strategic direction of the group, specifically to pursue international expansion by capitalising on global opportunities in the kids, family and adult categories, where Britvic has the leading brands in its core markets. The total consideration for the acquisition was £59.7m comprising an initial cash consideration of £32.4m, the cost of foreign exchange forwards taken out to hedge the purchase of the company of £10.2m less £2.0m tax receivable in relation to the foreign exchange forwards and deferred consideration with a discounted value of £19.1m. Goodwill of £21m and other intangible assets of £38.6m (comprising trademarks and customer relationships) were recognised on acquisition. Further details of the acquisition can be found in the financial statements for the 53 week period ended 2 October 2016.
The final tranche of deferred consideration payable on the acquisition of Ebba was paid subsequent to the period end, on 2 October 2017. The amount paid was £35.9m (BR$152.2m). This final undiscounted amount was included as a liability in the 1 October 2017 consolidated balance sheet within other current liabilities (2016: £31.2m discounted liability).
* All £ amounts are at the £:BR$ rate prevailing at the acquisition date of 2 March 2017 with the exception of the current value of the deferred consideration on the purchase of Ebba.
32. Post balance sheet event
Following a detailed review of our manufacturing sites and distribution network Britvic announced on 3 October 2017 a proposal to transfer production of Robinsons and Fruit Shoot from our Norwich site to our manufacturing sites in East London, Leeds and Rugby. The proposal is being made to improve the efficiency and productivity of our manufacturing operations and, as a result, Britvic is proposing to close the Norwich manufacturing site. The proposal has been approved by the Board for consultation with impacted employees and, subject to full and proper consultation, it is proposed that the site will close towards the end of 2019.
Britvic plc Annual Report and Accounts 2017 139
Strate
gic re
port
Gove
rnan
ceFin
ancial state
ments
Ad
ditio
nal info
rmatio
n
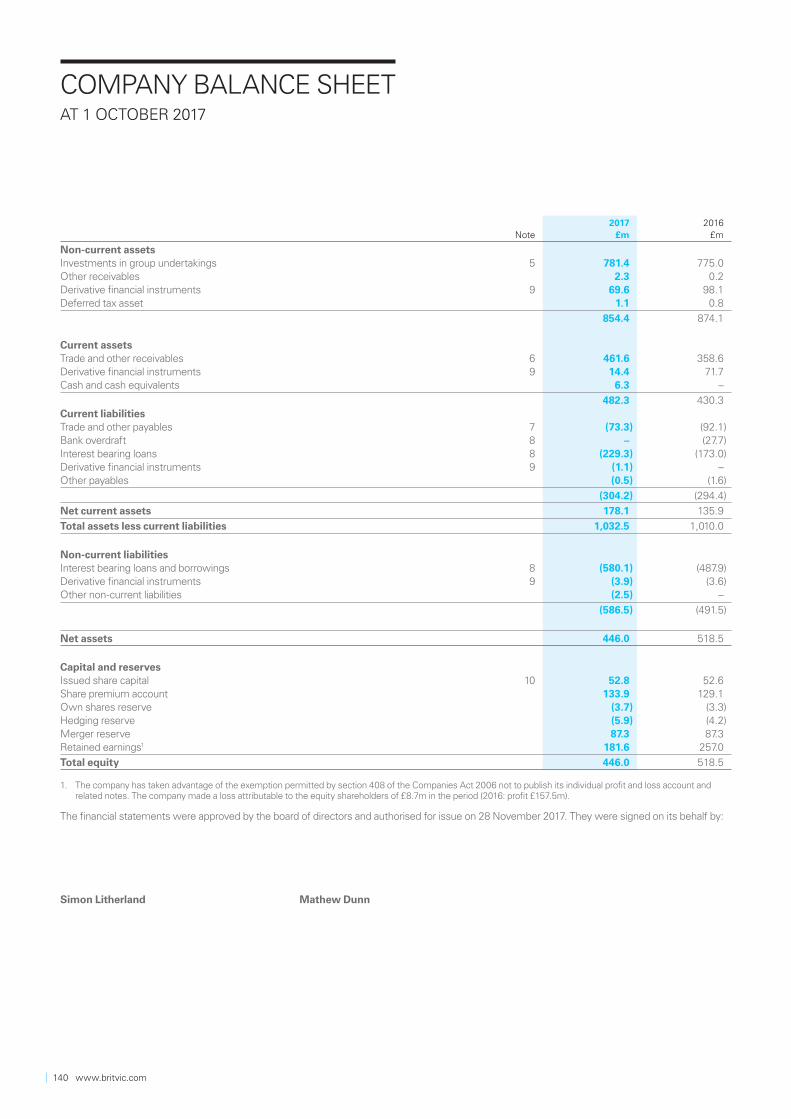
Note2017
£m2016
£m
Non-current assetsInvestments in group undertakings 5 781.4 775.0Other receivables 2.3 0.2Derivative financial instruments 9 69.6 98.1Deferred tax asset 1.1 0.8
854.4 874.1
Current assetsTrade and other receivables 6 461.6 358.6Derivative financial instruments 9 14.4 71.7Cash and cash equivalents 6.3 –
482.3 430.3Current liabilitiesTrade and other payables 7 (73.3) (92.1)Bank overdraft 8 – (27.7)Interest bearing loans 8 (229.3) (173.0)Derivative financial instruments 9 (1.1) –Other payables (0.5) (1.6)
(304.2) (294.4)
Net current assets 178.1 135.9
Total assets less current liabilities 1,032.5 1,010.0
Non-current liabilitiesInterest bearing loans and borrowings 8 (580.1) (487.9)Derivative financial instruments 9 (3.9) (3.6)Other non-current liabilities (2.5) –
(586.5) (491.5)
Net assets 446.0 518.5
Capital and reservesIssued share capital 10 52.8 52.6Share premium account 133.9 129.1Own shares reserve (3.7) (3.3)Hedging reserve (5.9) (4.2)Merger reserve 87.3 87.3Retained earnings1 181.6 257.0
Total equity 446.0 518.5
1. The company has taken advantage of the exemption permitted by section 408 of the Companies Act 2006 not to publish its individual profit and loss account and related notes. The company made a loss attributable to the equity shareholders of £8.7m in the period (2016: profit £157.5m).
The financial statements were approved by the board of directors and authorised for issue on 28 November 2017. They were signed on its behalf by:
Simon Litherland Mathew Dunn
COMPANY BALANCE SHEETAT 1 OCTOBER 2017
140 www.britvic.com
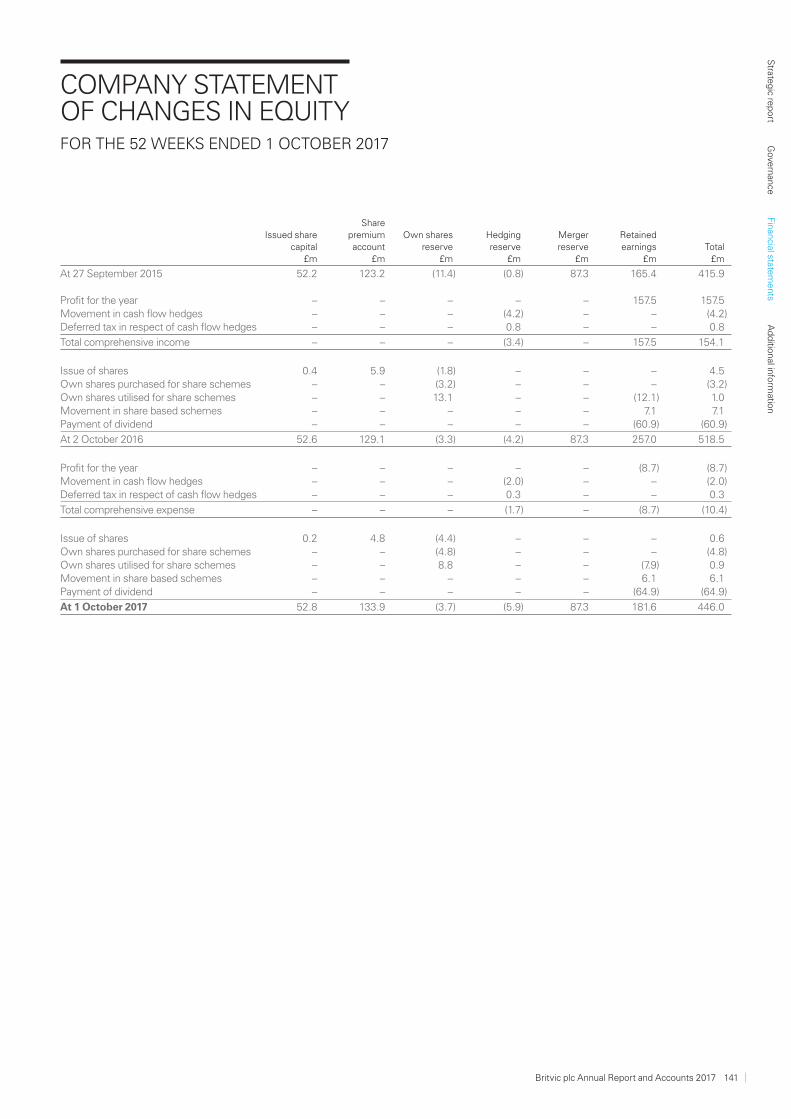
Issued share capital
£m
Share premium account
£m
Own shares reserve
£m
Hedging reserve
£m
Merger reserve
£m
Retained earnings
£mTotal
£m
At 27 September 2015 52.2 123.2 (11.4) (0.8) 87.3 165.4 415.9
Profit for the year – – – – – 157.5 157.5Movement in cash flow hedges – – – (4.2) – – (4.2)Deferred tax in respect of cash flow hedges – – – 0.8 – – 0.8
Total comprehensive income – – – (3.4) – 157.5 154.1
Issue of shares 0.4 5.9 (1.8) – – – 4.5Own shares purchased for share schemes – – (3.2) – – – (3.2)Own shares utilised for share schemes – – 13.1 – – (12.1) 1.0Movement in share based schemes – – – – – 7.1 7.1Payment of dividend – – – – – (60.9) (60.9)
At 2 October 2016 52.6 129.1 (3.3) (4.2) 87.3 257.0 518.5
Profit for the year – – – – – (8.7) (8.7)Movement in cash flow hedges – – – (2.0) – – (2.0)Deferred tax in respect of cash flow hedges – – – 0.3 – – 0.3
Total comprehensive expense – – – (1.7) – (8.7) (10.4)
Issue of shares 0.2 4.8 (4.4) – – – 0.6Own shares purchased for share schemes – – (4.8) – – – (4.8)Own shares utilised for share schemes – – 8.8 – – (7.9) 0.9Movement in share based schemes – – – – – 6.1 6.1Payment of dividend – – – – – (64.9) (64.9)
At 1 October 2017 52.8 133.9 (3.7) (5.9) 87.3 181.6 446.0
COMPANY STATEMENT OF CHANGES IN EQUITY FOR THE 52 WEEKS ENDED 1 OCTOBER 2017
Britvic plc Annual Report and Accounts 2017 141
Strate
gic re
port
Gove
rnan
ceFin
ancial state
ments
Ad
ditio
nal info
rmatio
n
1. Significant accounting policies, judgements, estimates and assumptions
Statement of compliance with Financial Reporting Standard 101 Reduced Disclosure Framework (FRS 101)
The company meets the definition of a qualifying entity under Financial Reporting Standard 100 (FRS 100) issued by the Financial Reporting Council. Accordingly, these financial statements were prepared in accordance with Financial Reporting Standard 101 Reduced Disclosure Framework (FRS 101) and in accordance with the provisions of the Companies Act 2006.
Basis of preparation
These financial statements are prepared on a going concern basis and in accordance with the Companies Act 2006 and applicable UK accounting standards and present information about the company as an individual undertaking, and not about its group.
The financial statements are prepared under the historical cost convention except for the measurement of derivative instruments at fair value. The company has taken advantage of the exemption permitted by section 408 of the Companies Act 2006 not to publish its individual profit and loss account and related notes.
The financial statements are presented in GBP sterling and all values are rounded to the nearest million pounds (£ million).
As permitted by FRS 101, the company has taken advantage of the disclosure exemptions available in relation to:
(a) the requirements of IFRS 7 ‘Financial Instruments: Disclosures’;(b) the requirements of paragraphs 10(d), 10(f), 16, 38A, 38B, 38C, 38D, 40A, 40B, 40C, 40D, 111 and 134 to 136 of IAS 1
‘Presentation of Financial Statements’;(c) the requirements of IAS 7 ‘Statement of Cash Flows’;(d) the requirements of paragraphs 30 and 31 of IAS 8 ‘Accounting Policies, Changes in Accounting Estimates and Errors’ in relation
to standards not yet effective;(e) the requirements of paragraphs 17 and 18A of IAS 24 ‘Related Party Disclosures’; and(f) the requirements of IAS 24 ‘Related Party Disclosures’ to disclose related party transactions entered into between two or more
members of a group, provided that any subsidiary which is a party to the transaction is wholly owned by such a member.
Where required, equivalent disclosures are given in the consolidated financial statements of Britvic plc.
Significant accounting policies: use of judgement, estimates and assumptions
The preparation of financial statements requires management to make judgements, estimates and assumptions that affect the amounts reported for assets and liabilities as at the balance sheet date and the amounts reported for income and expenditure during the year. However, the nature of estimation means that the actual outcomes could differ from those estimates. There are no significant judgements and estimates relevant to these financial statements.
Foreign currency translations
The company’s financial statements are presented in sterling, which is also the company’s functional currency.
Transactions in foreign currencies are initially recorded in the entity’s functional currency by applying the spot exchange rate ruling at the date of the transaction. Monetary assets and liabilities denominated in foreign currencies are retranslated at the rate of exchange ruling at the balance sheet date. Any resulting exchange differences are included in the income statement and should be read in conjunction with the information provided under Derivative financial instrument and hedging in Notes 3, 24 and 25 of the consolidated financial statements.
Non-monetary items that are measured in terms of historical cost in a foreign currency are translated using the exchange rates as at the dates of the initial transactions. Non-monetary items measured at fair value in a foreign currency are translated using the exchange rates at the date when the fair value was determined.
Investments
The company recognises its investments in subsidiaries at cost less any provisions made for impairment. The company assesses investments for impairment whenever events or changes in circumstances indicate that the carrying value of an investment may not be recoverable. If any such indication of impairment exists, the company makes an estimate of its recoverable amount. Where the carrying amount of an investment exceeds its recoverable amount, the investment is considered impaired and is written down to its recoverable amount.
In respect of IFRS 2 ‘Share based payment’, the company records an increase in its investment in subsidiaries to reflect the share-based compensation expense recorded by its subsidiaries.
NOTES TO THE COMPANYFINANCIAL STATEMENTS
142 www.britvic.com
1. Significant accounting policies, judgements, estimates and assumptions (continued)
Share-based payments
The cost of the equity-settled transactions with employees of other members within of the group is measured by reference to the fair value at the date at which equity instruments are granted and is recognised as a capital contribution in investments in subsidiary undertakings over the vesting period, which ends on the date on which the employees become fully entitled to the award. A corresponding credit is recognised within equity. Fair value is determined by using an appropriate, widely used, valuation model. In valuing equity-settled transactions, no account is taken of any vesting conditions, other than conditions linked to the price of the shares of the company (market conditions).
Cash and cash equivalents
Cash and cash equivalents includes cash in hand, deposits held at call with banks and other short-term highly liquid investments with original maturities of three months or less, which are readily convertible into known amounts of cash and subject to insignificant risk of changes in value. For the purposes of the statement of cash flows, bank overdrafts repayable on demand are a component of cash and cash equivalents.
Income taxes
The current income tax is based on taxable profits for the period, after any adjustments in respect of prior periods. It is calculated using taxation rates enacted or substantively enacted by the balance sheet date and is measured at the amount expected to be recovered from or paid to the taxation authorities.
Provision is made for deferred tax liabilities, or credit taken for deferred tax assets, on all material temporary differences between the tax base of assets and liabilities and their carrying values in the financial statements.
Deferred tax assets are recognised to the extent that it is regarded as probable that future taxable profits will be available against which the temporary differences can be utilised.
Financial assets
All financial assets held by the company are classified as loans and receivables. Financial assets include cash and cash equivalents, other receivables and loans. The company determines the classification of its financial assets at initial recognition. Financial assets are recognised initially at fair value, normally being the transaction price plus directly attributable transaction costs.
Loans and receivables are non-derivative financial assets with fixed or determinable payments that are not quoted in active markets, do not qualify as trading assets and have been designated as either fair value through profit or loss or available for sale. Such assets are carried at amortised cost using the effective interest method if the time value of money is significant. Gains and losses are recognised in the profit and loss account when loans and receivables are derecognised or impaired.
Finance costs arising from the outstanding loan balance and finance charges are charged to the profit and loss account using an effective interest rate method.
Financial liabilities
All financial liabilities are initially recognised in the balance sheet at fair value less directly attributable transactions costs and are subsequently measured at amortised cost using the effective interest rate method.
Gain and losses arising on the repurchase, settlement or otherwise cancellation of liabilities are recognised respectively in finance income and finance cost.
Dividends
Dividend income is recognised when the company’s right to receive payment is established. Final dividends are recorded in the financial statements in the period in which they are approved by the company’s shareholders. Interim dividends are recorded in the period in which they are declared.
Derivative financial instruments
The company uses derivative financial instruments such as forward currency contracts and interest rate swaps to hedge its risks associated with foreign currency and interest rate fluctuations. All derivative financial instruments are initially recognised and subsequently remeasured at fair value. Derivatives are carried as assets when the fair value is positive and as liabilities when the fair value is negative.
The fair value of forward currency contracts is calculated by reference to current forward exchange rates for contracts with similar maturity profiles. The fair value of interest rate swap contracts is determined by reference to market values for similar instruments.
For those derivatives designated as hedges and for which hedge accounting is appropriate, the hedging relationship is documented at its inception. This documentation identifies the hedging instrument, the hedged item or transaction, the nature of the risk being hedged and how effectiveness will be measured throughout its duration. Such hedges are expected at inception to be highly effective.
Any gains or losses arising from changes in the fair value of derivatives that do not qualify for hedge accounting are taken to the profit and loss account. The treatment of gains and losses arising from revaluing derivatives designated as hedging instruments depends on the nature of the hedging relationship, as follows:
Britvic plc Annual Report and Accounts 2017 143
Strate
gic re
port
Gove
rnan
ceFin
ancial state
ments
Ad
ditio
nal info
rmatio
n
1. Significant accounting policies, judgements, estimates and assumptions (continued)
Cash flow hedges
Hedges are classified as cash flow hedges when hedging exposure to variability in cash flows that is either attributable to a particular risk associated with a recognised asset or liability or a highly probable forecast transaction. For cash flow hedges, the effective portion of the gain or loss on the hedging instrument is recognised in other comprehensive income, while the ineffective portion is recognised in the profit and loss account.Amounts previously recognised in other comprehensive income are transferred to the profit and loss account in the period in which the hedged item affects profit or loss, such as when a forecast sale occurs. However, when the forecast transaction results in the recognition of a non-financial asset or liability, the amounts previously recognised in other comprehensive income are included in the initial carrying amount of the asset or liability.
If a forecast transaction is no longer expected to occur, amounts previously recognised in other comprehensive income are transferred to the profit and loss account. If the hedging instrument expires or is sold, terminated or exercised without replacement or rollover, or if its designation as a hedge is revoked, amounts previously recognised in other comprehensive income remain in equity until the forecast transaction occurs and are then transferred to the profit and loss account or included in the initial carrying amount of a non-financial asset or liability as above.
Fair value hedges
Hedges of the change in fair value of recognised assets or liabilities are classified as fair value hedges. For fair value hedges, the gain or loss on the fair value of the hedging instrument is recognised in the profit and loss account. The gain or loss on the hedged item attributable to the hedged risk adjusts the carrying amount of the hedged item and is also recognised in the profit and loss account. If the hedge relationship no longer meets the criteria for hedge accounting, the hedged item would no longer be adjusted and the cumulative adjustment to its carrying amount would be amortised to the profit and loss account based on a recalculated effective interest rate. The fair value gain on loss on the hedging instrument would continue to be recorded in the profit and loss account.
Issued share capital
Ordinary shares are classified as equity. Incremental costs directly attributable to the issue of new shares or options are shown in equity as a deduction, net of tax, from the proceeds.
Other reserves
Share premium account
The share premium account is used to record the excess of proceeds over the nominal value on the issue of shares.
Own shares reserve
The own shares reserve is used to record purchases and issues by the company of its own shares, which will be distributed to employees as and when share awards made under the Britvic employee share plans vest.
Hedging reserve
The hedging reserve records the effective portion of movements in the fair value of forward exchange contracts, interest rate and cross currency swaps that have been designated as hedging instruments in cash flow hedges.
Merger reserve
The merger reserve arose as a result of the non pre-emptive share placement which took place on 21 May 2010. It was executed using a structure which created a merger reserve under Section 612-3 of the Companies Act 2006.
Own shares
The cost of own shares held in employee share trusts and in treasury is deducted from shareholders’ equity until the shares are cancelled, reissued or disposed. Where such shares are subsequently sold or reissued, the fair value of any consideration received is also included in shareholders’ equity.
New standards and interpretations not applied
See note 3 of the consolidated accounts for details of new standards and interpretations not applied.
NOTES TO THE COMPANY FINANCIAL STATEMENTS CONTINUED
144 www.britvic.com
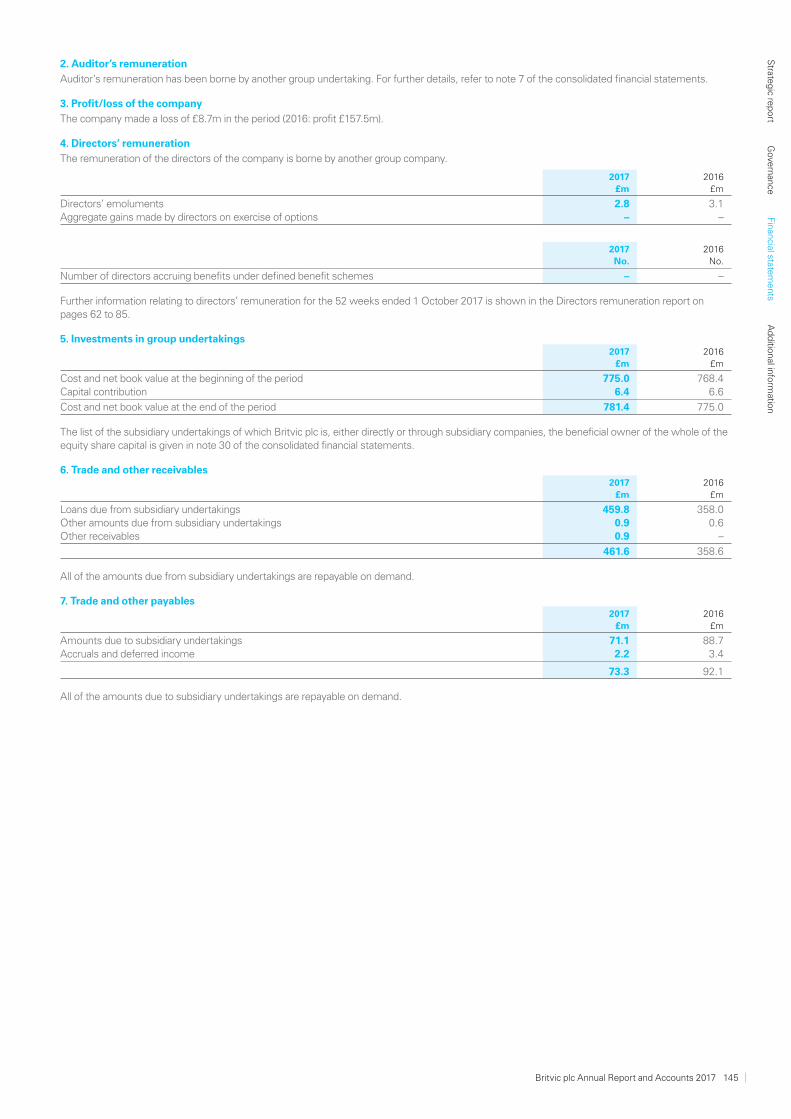
2. Auditor’s remuneration
Auditor’s remuneration has been borne by another group undertaking. For further details, refer to note 7 of the consolidated financial statements.
3. Profit/loss of the company
The company made a loss of £8.7m in the period (2016: profit £157.5m).
4. Directors’ remuneration
The remuneration of the directors of the company is borne by another group company.
2017 £m
2016 £m
Directors’ emoluments 2.8 3.1Aggregate gains made by directors on exercise of options – –
2017 No.
2016 No.
Number of directors accruing benefits under defined benefit schemes – –
Further information relating to directors’ remuneration for the 52 weeks ended 1 October 2017 is shown in the Directors remuneration report on pages 62 to 85.
5. Investments in group undertakings2017
£m2016
£m
Cost and net book value at the beginning of the period 775.0 768.4Capital contribution 6.4 6.6
Cost and net book value at the end of the period 781.4 775.0
The list of the subsidiary undertakings of which Britvic plc is, either directly or through subsidiary companies, the beneficial owner of the whole of the equity share capital is given in note 30 of the consolidated financial statements.
6. Trade and other receivables 2017
£m 2016
£m
Loans due from subsidiary undertakings 459.8 358.0Other amounts due from subsidiary undertakings 0.9 0.6Other receivables 0.9 –
461.6 358.6
All of the amounts due from subsidiary undertakings are repayable on demand.
7. Trade and other payables2017
£m2016
£m
Amounts due to subsidiary undertakings 71.1 88.7Accruals and deferred income 2.2 3.4
73.3 92.1
All of the amounts due to subsidiary undertakings are repayable on demand.
Britvic plc Annual Report and Accounts 2017 145
Strate
gic re
port
Gove
rnan
ceFin
ancial state
ments
Ad
ditio
nal info
rmatio
n
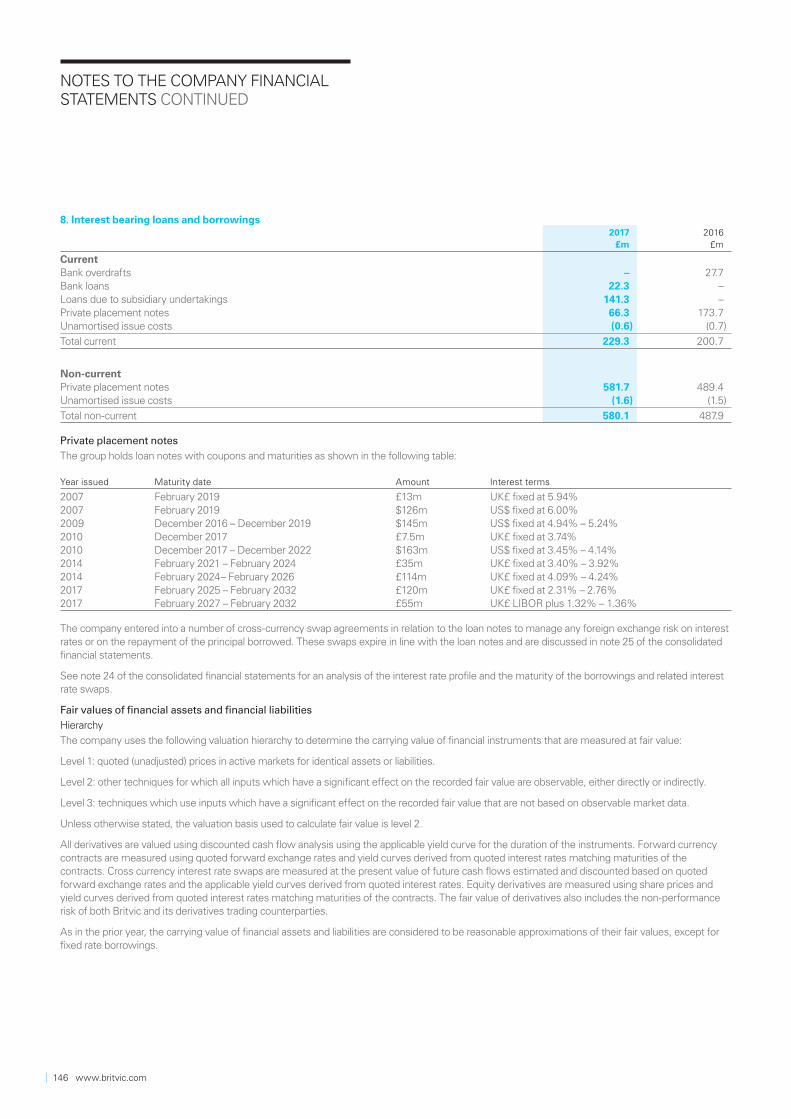
8. Interest bearing loans and borrowings2017
£m2016
£m
CurrentBank overdrafts – 27.7Bank loans 22.3 –Loans due to subsidiary undertakings 141.3 –Private placement notes 66.3 173.7Unamortised issue costs (0.6) (0.7)
Total current 229.3 200.7
Non-currentPrivate placement notes 581.7 489.4Unamortised issue costs (1.6) (1.5)
Total non-current 580.1 487.9
Private placement notes
The group holds loan notes with coupons and maturities as shown in the following table:
Year issued Maturity date Amount Interest terms
2007 February 2019 £13m UK£ fixed at 5.94%2007 February 2019 $126m US$ fixed at 6.00%2009 December 2016 – December 2019 $145m US$ fixed at 4.94% – 5.24%2010 December 2017 £7.5m UK£ fixed at 3.74%2010 December 2017 – December 2022 $163m US$ fixed at 3.45% – 4.14%2014 February 2021 – February 2024 £35m UK£ fixed at 3.40% – 3.92%2014 February 2024– February 2026 £114m UK£ fixed at 4.09% – 4.24%2017 February 2025 – February 2032 £120m UK£ fixed at 2.31% – 2.76%2017 February 2027 – February 2032 £55m UK£ LIBOR plus 1.32% – 1.36%
The company entered into a number of cross-currency swap agreements in relation to the loan notes to manage any foreign exchange risk on interest rates or on the repayment of the principal borrowed. These swaps expire in line with the loan notes and are discussed in note 25 of the consolidated financial statements.
See note 24 of the consolidated financial statements for an analysis of the interest rate profile and the maturity of the borrowings and related interest rate swaps.
Fair values of financial assets and financial liabilities
Hierarchy
The company uses the following valuation hierarchy to determine the carrying value of financial instruments that are measured at fair value:
Level 1: quoted (unadjusted) prices in active markets for identical assets or liabilities.
Level 2: other techniques for which all inputs which have a significant effect on the recorded fair value are observable, either directly or indirectly.
Level 3: techniques which use inputs which have a significant effect on the recorded fair value that are not based on observable market data.
Unless otherwise stated, the valuation basis used to calculate fair value is level 2.
All derivatives are valued using discounted cash flow analysis using the applicable yield curve for the duration of the instruments. Forward currency contracts are measured using quoted forward exchange rates and yield curves derived from quoted interest rates matching maturities of the contracts. Cross currency interest rate swaps are measured at the present value of future cash flows estimated and discounted based on quoted forward exchange rates and the applicable yield curves derived from quoted interest rates. Equity derivatives are measured using share prices and yield curves derived from quoted interest rates matching maturities of the contracts. The fair value of derivatives also includes the non-performance risk of both Britvic and its derivatives trading counterparties.
As in the prior year, the carrying value of financial assets and liabilities are considered to be reasonable approximations of their fair values, except for fixed rate borrowings.
NOTES TO THE COMPANY FINANCIALSTATEMENTS CONTINUED
146 www.britvic.com
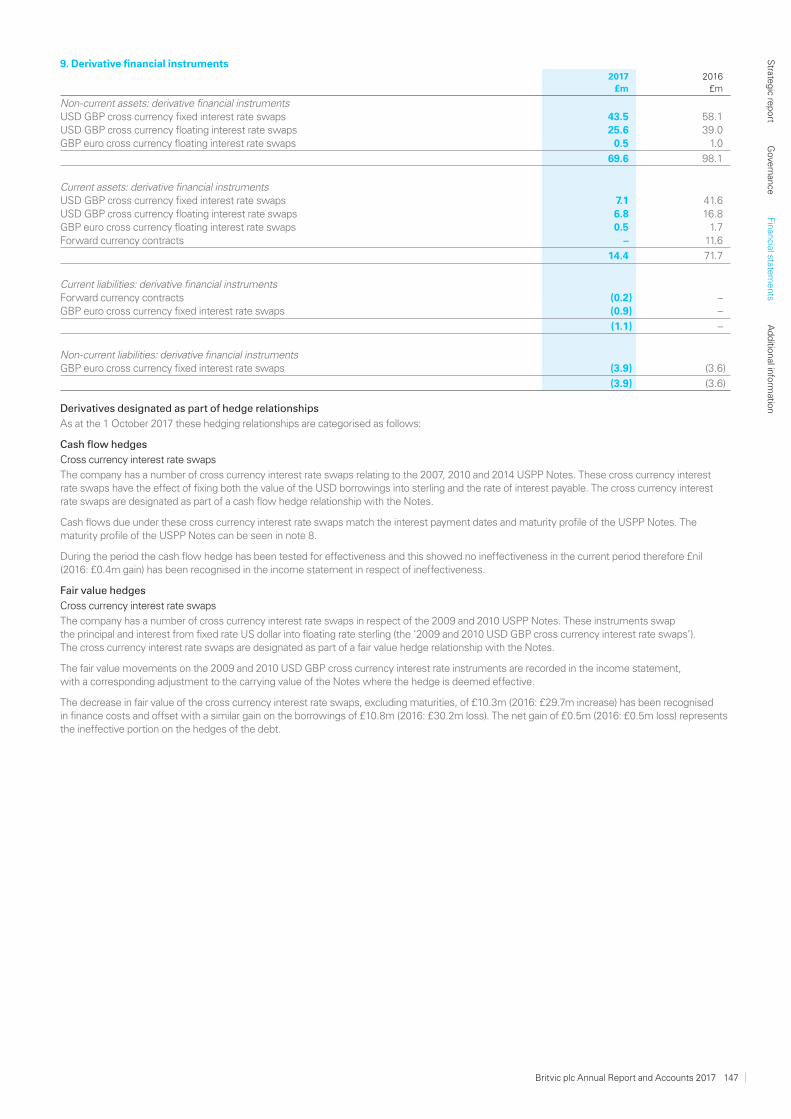
9. Derivative financial instruments
2017
£m 2016
£m
Non-current assets: derivative financial instruments USD GBP cross currency fixed interest rate swaps 43.5 58.1USD GBP cross currency floating interest rate swaps 25.6 39.0GBP euro cross currency floating interest rate swaps 0.5 1.0
69.6 98.1
Current assets: derivative financial instrumentsUSD GBP cross currency fixed interest rate swaps 7.1 41.6USD GBP cross currency floating interest rate swaps 6.8 16.8GBP euro cross currency floating interest rate swaps 0.5 1.7Forward currency contracts – 11.6
14.4 71.7
Current liabilities: derivative financial instrumentsForward currency contracts (0.2) –GBP euro cross currency fixed interest rate swaps (0.9) –
(1.1) –
Non-current liabilities: derivative financial instrumentsGBP euro cross currency fixed interest rate swaps (3.9) (3.6)
(3.9) (3.6)
Derivatives designated as part of hedge relationships
As at the 1 October 2017 these hedging relationships are categorised as follows:
Cash flow hedges
Cross currency interest rate swaps
The company has a number of cross currency interest rate swaps relating to the 2007, 2010 and 2014 USPP Notes. These cross currency interest rate swaps have the effect of fixing both the value of the USD borrowings into sterling and the rate of interest payable. The cross currency interest rate swaps are designated as part of a cash flow hedge relationship with the Notes.
Cash flows due under these cross currency interest rate swaps match the interest payment dates and maturity profile of the USPP Notes. The maturity profile of the USPP Notes can be seen in note 8.
During the period the cash flow hedge has been tested for effectiveness and this showed no ineffectiveness in the current period therefore £nil (2016: £0.4m gain) has been recognised in the income statement in respect of ineffectiveness.
Fair value hedges
Cross currency interest rate swaps
The company has a number of cross currency interest rate swaps in respect of the 2009 and 2010 USPP Notes. These instruments swap the principal and interest from fixed rate US dollar into floating rate sterling (the ‘2009 and 2010 USD GBP cross currency interest rate swaps’). The cross currency interest rate swaps are designated as part of a fair value hedge relationship with the Notes.
The fair value movements on the 2009 and 2010 USD GBP cross currency interest rate instruments are recorded in the income statement, with a corresponding adjustment to the carrying value of the Notes where the hedge is deemed effective.
The decrease in fair value of the cross currency interest rate swaps, excluding maturities, of £10.3m (2016: £29.7m increase) has been recognised in finance costs and offset with a similar gain on the borrowings of £10.8m (2016: £30.2m loss). The net gain of £0.5m (2016: £0.5m loss) represents the ineffective portion on the hedges of the debt.
Britvic plc Annual Report and Accounts 2017 147
Strate
gic re
port
Gove
rnan
ceFin
ancial state
ments
Ad
ditio
nal info
rmatio
n

10. Issued share capital
The issued share capital is wholly comprised of ordinary shares carrying one voting right each. The nominal value of each ordinary share is £0.20. There are no restrictions placed on the distribution of dividends, or the return of capital on a winding up or otherwise.
Issued, called up and fully paid ordinary shares No. of sharesValue
£
At 27 September 2015 261,139,852 52,227,970Shares issued relating to incentive schemes for employees 1,731,404 346,281
At 2 October 2016 262,871,256 52,574,251
Shares issued relating to incentive schemes for employees 925,744 185,149
At 1 October 2017 263,797,000 52,759,400
Of the issued and fully paid ordinary shares, 585,025 shares (2016: 500,983 shares) are own shares held by an employee benefit trust. This equates to £117,005 (2016: £100,197) at £0.20 par value of each ordinary share. These shares are held for the purpose of satisfying the share schemes detailed in note 27 of the consolidated financial statements.
An explanation of the group’s capital management process and objectives is set out in note 24 of the consolidated financial statements.
11. Dividends paid and proposed2017
£m2016
£m
Declared and paid during the period
Equity dividends on ordinary shares
Final dividend for 2016: 17.5p per share (2015: 16.3p per share) 45.9 42.6
Interim dividend for 2017: 7.2p per share (2016: 7.0p per share) 19.0 18.3
Dividends paid 64.9 60.9
Proposed
Final dividend for 2017: 19.3p per share (2016: 17.5p per share) 50.9 46.0
12. Contingent liabilities
The company is co-guarantor of the group’s bank loan and overdraft facilities.
13. Related undertakings
In accordance with Section 409 of the Companies Act 2006, a full list of related undertakings, the country of incorporation and the percentage of share capital owned as at 1 October 2017 is disclosed in Note 30 in the consolidated financial statements.
Subsidiary undertakings are controlled by the group and their results are fully consolidated in the group’s financial statements.
NOTES TO THE COMPANY FINANCIALSTATEMENTS CONTINUED
148 www.britvic.com
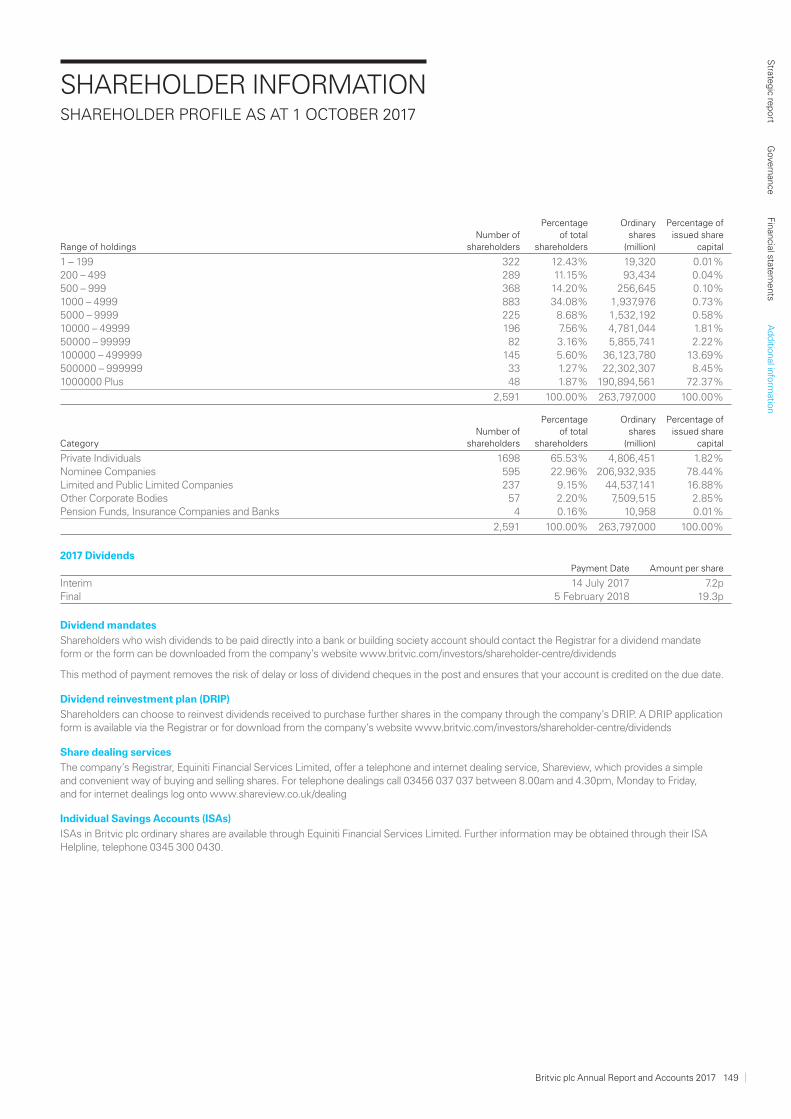
SHAREHOLDER INFORMATIONSHAREHOLDER PROFILE AS AT 1 OCTOBER 2017
Range of holdingsNumber of
shareholders
Percentage of total
shareholders
Ordinary shares
(million)
Percentage of issued share
capital
1 – 199 322 12.43% 19,320 0.01%200 – 499 289 11.15% 93,434 0.04%500 – 999 368 14.20% 256,645 0.10%1000 – 4999 883 34.08% 1,937,976 0.73%5000 – 9999 225 8.68% 1,532,192 0.58%10000 – 49999 196 7.56% 4,781,044 1.81%50000 – 99999 82 3.16% 5,855,741 2.22%100000 – 499999 145 5.60% 36,123,780 13.69%500000 – 999999 33 1.27% 22,302,307 8.45%1000000 Plus 48 1.87% 190,894,561 72.37%
2,591 100.00% 263,797,000 100.00%
CategoryNumber of
shareholders
Percentage of total
shareholders
Ordinary shares
(million)
Percentage of issued share
capital
Private Individuals 1698 65.53% 4,806,451 1.82%Nominee Companies 595 22.96% 206,932,935 78.44%Limited and Public Limited Companies 237 9.15% 44,537,141 16.88%Other Corporate Bodies 57 2.20% 7,509,515 2.85%Pension Funds, Insurance Companies and Banks 4 0.16% 10,958 0.01%
2,591 100.00% 263,797,000 100.00%
2017 DividendsPayment Date Amount per share
Interim 14 July 2017 7.2pFinal 5 February 2018 19.3p
Dividend mandates
Shareholders who wish dividends to be paid directly into a bank or building society account should contact the Registrar for a dividend mandate form or the form can be downloaded from the company’s website www.britvic.com/investors/shareholder-centre/dividends
This method of payment removes the risk of delay or loss of dividend cheques in the post and ensures that your account is credited on the due date.
Dividend reinvestment plan (DRIP)
Shareholders can choose to reinvest dividends received to purchase further shares in the company through the company’s DRIP. A DRIP application form is available via the Registrar or for download from the company’s website www.britvic.com/investors/shareholder-centre/dividends
Share dealing services
The company’s Registrar, Equiniti Financial Services Limited, offer a telephone and internet dealing service, Shareview, which provides a simple and convenient way of buying and selling shares. For telephone dealings call 03456 037 037 between 8.00am and 4.30pm, Monday to Friday, and for internet dealings log onto www.shareview.co.uk/dealing
Individual Savings Accounts (ISAs)
ISAs in Britvic plc ordinary shares are available through Equiniti Financial Services Limited. Further information may be obtained through their ISA Helpline, telephone 0345 300 0430.
Britvic plc Annual Report and Accounts 2017 149
Strate
gic re
port
Gove
rnan
ceFin
ancial state
ments
Ad
ditio
nal info
rmatio
n
American Depository Receipts (ADRs)
Britvic American Depository Receipts are traded on the Over The Counter (OTC) market under the symbol BTVCY. One ADR represents two Britvic plc ordinary shares. This is a sponsored Level 1 ADR programme for which The Bank of New York Mellon acts as both Depositary Bank and Registrar. For the issuance and management of ADRs and any general ADR questions, please contact:
BNY Mellon Shareowner ServicesPO Box 505000LouisvilleKY 40233-5000USA
Direct mailing for overnight packages:
BNY Mellon Shareowner Services
462 South 4th Street
Suite 1600
Louisville
KY 40202
USA
Investor Helpline: +1-888-BNY-ADRs (USA caller, toll free) +1-201-680-6825 (non-USA caller)
Email: [email protected]
Website: http://www.mybnymdr.com
Warning to shareholders – boiler room fraud and other investment scams
Share or investment scams are often run from ‘boiler rooms’ where fraudsters cold-call investors offering them worthless, overpriced or even non-existent shares, or offer to buy their shares in a company at a higher price than the market value. Shareholders are advised to be very wary of any unsolicited advice, offers to buy shares at a discount, or offers of free reports about the company. Even seasoned investors have been caught out by such fraudsters and it is estimated that £200 million is lost in this way in the UK each year.
The FCA have some helpful information about such scams on their website, including tips to protect your savings and how to report a suspected investment scam. Britvic encourages shareholders to read the information on the site which can be accessed at www.fca.org.uk/consumers/scams/investment-scams
Financial calendar
Ex-dividend date – 7 December 2017
Record date – 8 December 2017
Annual general meeting – 31 January 2018
Payment of final dividend – 5 February 2018
Interim results announcement – 23 May 2018* (provisional date)
Electronic communications
Shareholders can elect to receive shareholder documents electronically by registering with Shareview at www.shareview.co.uk. This will save on printing and distribution costs, creating environmental benefits. When you register, you will be sent an email notification to say when shareholder documents are available on our website and you will be provided with a link to that information. When registering, you will need your shareholder reference number which can be found on your share certificate or proxy form. Please contact Equiniti if you require any assistance or further information.
Contacts
The Company Secretary is Clare Thomas. The registered office is Breakspear Park, Breakspear Way, Hemel Hempstead, Hertfordshire HP2 4TZ, telephone +44 (0)1442 284411, fax +44 (0)1442 284402, website www.britvic.com
Shareholder inquiries to the Company Secretary may also be submitted to [email protected]
Investor Relations enquiries may be submitted to: [email protected]
This report is available to download via the company’s website http://www.britvic.com/investors/results-and-presentations/2017.
The company’s Registrar is Equiniti, Aspect House, Spencer Road, Lancing, West Sussex BN99 6DA, telephone +44 371 384 2550* (UK callers), +44 121 415 7019 (non-UK callers).
* For those with hearing difficulties, a textphone is available on 0371 384 2255 for UK callers with compatible equipment.
SHAREHOLDER INFORMATION CONTINUED
150 www.britvic.com
GLOSSARY
Non-GAAP measures are provided because they are closely tracked by management to evaluate Britvic’s operating performance and to make financial, strategic and operating decisions.
Volume is defined as number of litres sold, excluding factored brands sold by Counterpoint in Ireland. No volume is recorded in respect of international concentrate sales.
AER refers to Actual Exchange Rate where variances are calculated on sterling values translated at actual exchange rate.
ARP is defined as average revenue per litre sold, excluding factored brands and concentrate sales.
Revenue is defined as sales achieved by the group net of price promotional investment and retailer discounts.
Brand contribution is a non-GAAP measure and is defined as revenue less material costs and all other marginal costs that management considers to be directly attributable to the sale of a given product. Such costs include brand specific advertising and promotion costs, raw materials, and marginal production and distribution costs.
Brand contribution margin is a non-GAAP measure and is a percentage measure calculated as brand contribution, divided by revenue. Each business unit’s performance is reported down to the brand contribution level.
Adjusted EBITDA is a non-GAAP measure defined as operating profit before adjusting items, depreciation, amortisation, impairment of PPE/intangible assets and profit/loss from sale of PPE/intangible assets.
Adjusted EBITA is a non-GAAP measure and is defined as operating profit before adjusting items and amortisation. Only amortisation attributable to intangibles related to acquisitions is added back, in the period this is £10.7m (2016: £7.4m). EBITA margin is EBITA as a proportion of group revenue.
Adjusted earnings per share are a non-GAAP measure calculated by dividing adjusted earnings by the average number of shares during the period. Adjusted earnings is defined as the profit/(loss) attributable to ordinary equity shareholders before adjusting items and adjusted for the adding back of acquisition related amortisation. Average number of shares during the period is defined as the weighted average number of ordinary shares outstanding during the period excluding any own shares held by Britvic that are used to satisfy various employee share-based incentive programmes. The weighted average number of ordinary shares in issue for adjusted earnings per share for the period was 263.0m (2016: 261.7m).
Adjusted free cash flow is a non-GAAP measure and is defined as net cash flow excluding movements in borrowings, dividend payments and adjusting items.
Adjusted net debt is a non-GAAP measure and is defined as group net debt, adding back the impact of derivatives hedging the balance sheet debt.
Organic is a non-GAAP measure and excludes the impact of the acquisition of Bela Ischia and on a constant currency basis.
Innovation is defined as new launches over the last three years, excluding new flavours and pack sizes of established brands.
Revenue management is a measure and is used to define a range of actions to affect ARP. It includes, but is not limited to, price increases, changes to price promotions and variation of pack size.
Quality distribution is a measure used to describe the placement of products in the appropriate outlets for the specified product.
Retail market value and volume is a measure and is a measure of the recorded sales at the retail point of purchase. This data is typically collated by independent organisations such as Nielsen and IRI from data supplied by retailers.
A&P is a measure of marketing spend including marketing, research and advertising.
Non-working A&P is a measure of marketing spend that is not spent directly on consumer facing activity. It would include, but not limited to, agency fees, research and production costs.
Constant currency is a non-GAAP measure of performance in the underlying currency to eliminate the impact of foreign exchange movements.
Great Place to Work (GPTW) is a methodology process adopted by businesses to measure employee engagement.
Britvic plc Annual Report and Accounts 2017 151
Strate
gic re
port
Gove
rnan
ceFin
ancial state
ments
Ad
ditio
nal info
rmatio
n
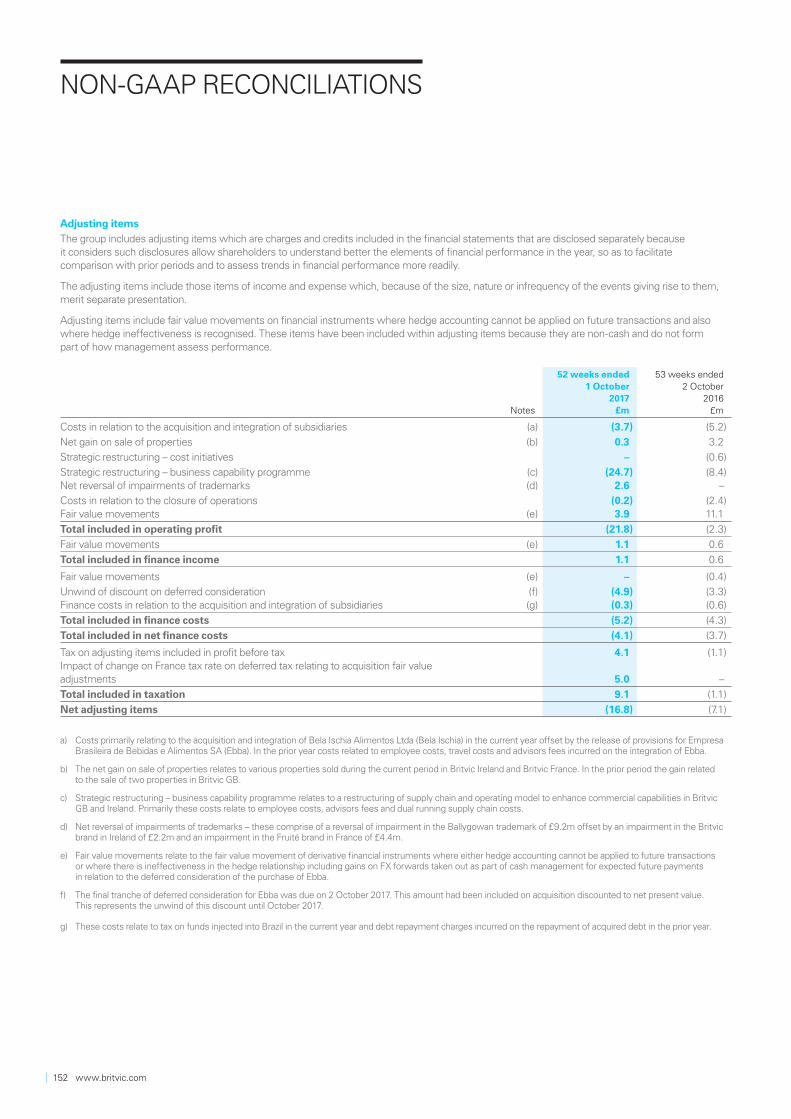
NON-GAAP RECONCILIATIONS
Adjusting items
The group includes adjusting items which are charges and credits included in the financial statements that are disclosed separately because it considers such disclosures allow shareholders to understand better the elements of financial performance in the year, so as to facilitate comparison with prior periods and to assess trends in financial performance more readily.
The adjusting items include those items of income and expense which, because of the size, nature or infrequency of the events giving rise to them, merit separate presentation.
Adjusting items include fair value movements on financial instruments where hedge accounting cannot be applied on future transactions and also where hedge ineffectiveness is recognised. These items have been included within adjusting items because they are non-cash and do not form part of how management assess performance.
Notes
52 weeks ended1 October
2017 £m
53 weeks ended2 October
2016 £m
Costs in relation to the acquisition and integration of subsidiaries (a) (3.7) (5.2)
Net gain on sale of properties (b) 0.3 3.2
Strategic restructuring – cost initiatives – (0.6)
Strategic restructuring – business capability programme (c) (24.7) (8.4)Net reversal of impairments of trademarks (d) 2.6 –
Costs in relation to the closure of operations (0.2) (2.4)Fair value movements (e) 3.9 11.1
Total included in operating profit (21.8) (2.3)
Fair value movements (e) 1.1 0.6
Total included in finance income 1.1 0.6
Fair value movements (e) – (0.4)
Unwind of discount on deferred consideration (f) (4.9) (3.3)Finance costs in relation to the acquisition and integration of subsidiaries (g) (0.3) (0.6)
Total included in finance costs (5.2) (4.3)
Total included in net finance costs (4.1) (3.7)
Tax on adjusting items included in profit before tax 4.1 (1.1)Impact of change on France tax rate on deferred tax relating to acquisition fair value adjustments 5.0 –
Total included in taxation 9.1 (1.1)
Net adjusting items (16.8) (7.1)
a) Costs primarily relating to the acquisition and integration of Bela Ischia Alimentos Ltda (Bela Ischia) in the current year offset by the release of provisions for Empresa Brasileira de Bebidas e Alimentos SA (Ebba). In the prior year costs related to employee costs, travel costs and advisors fees incurred on the integration of Ebba.
b) The net gain on sale of properties relates to various properties sold during the current period in Britvic Ireland and Britvic France. In the prior period the gain related to the sale of two properties in Britvic GB.
c) Strategic restructuring – business capability programme relates to a restructuring of supply chain and operating model to enhance commercial capabilities in Britvic GB and Ireland. Primarily these costs relate to employee costs, advisors fees and dual running supply chain costs.
d) Net reversal of impairments of trademarks – these comprise of a reversal of impairment in the Ballygowan trademark of £9.2m offset by an impairment in the Britvic brand in Ireland of £2.2m and an impairment in the Fruité brand in France of £4.4m.
e) Fair value movements relate to the fair value movement of derivative financial instruments where either hedge accounting cannot be applied to future transactions or where there is ineffectiveness in the hedge relationship including gains on FX forwards taken out as part of cash management for expected future payments in relation to the deferred consideration of the purchase of Ebba.
f) The final tranche of deferred consideration for Ebba was due on 2 October 2017. This amount had been included on acquisition discounted to net present value. This represents the unwind of this discount until October 2017.
g) These costs relate to tax on funds injected into Brazil in the current year and debt repayment charges incurred on the repayment of acquired debt in the prior year.
152 www.britvic.com
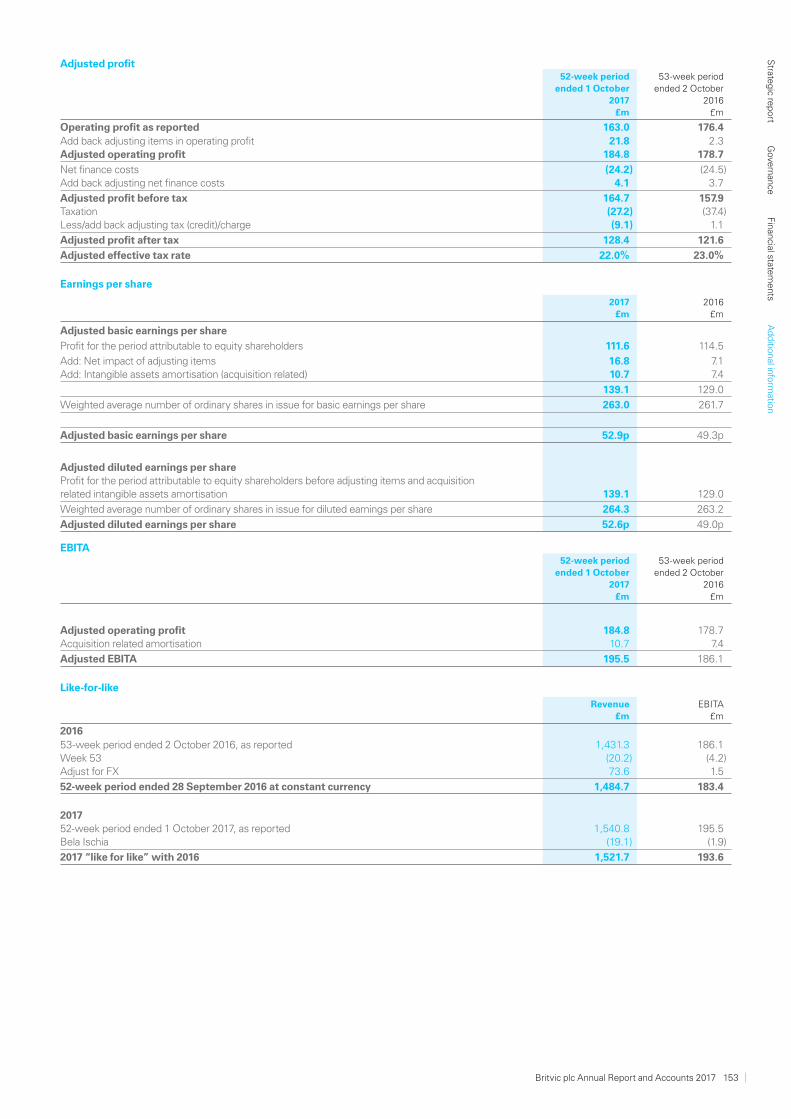
Adjusted profit
52-week period ended 1 October
2017 £m
53-week period ended 2 October
2016£m
Operating profit as reported 163.0 176.4Add back adjusting items in operating profit 21.8 2.3Adjusted operating profit 184.8 178.7
Net finance costs (24.2) (24.5)Add back adjusting net finance costs 4.1 3.7
Adjusted profit before tax 164.7 157.9Taxation (27.2) (37.4)Less/add back adjusting tax (credit)/charge (9.1) 1.1
Adjusted profit after tax 128.4 121.6
Adjusted effective tax rate 22.0% 23.0%
Earnings per share
2017 £m
2016 £m
Adjusted basic earnings per share
Profit for the period attributable to equity shareholders 111.6 114.5
Add: Net impact of adjusting items 16.8 7.1Add: Intangible assets amortisation (acquisition related) 10.7 7.4
139.1 129.0
Weighted average number of ordinary shares in issue for basic earnings per share 263.0 261.7
Adjusted basic earnings per share 52.9p 49.3p
Adjusted diluted earnings per shareProfit for the period attributable to equity shareholders before adjusting items and acquisition related intangible assets amortisation 139.1 129.0
Weighted average number of ordinary shares in issue for diluted earnings per share 264.3 263.2
Adjusted diluted earnings per share 52.6p 49.0p
EBITA52-week period
ended 1 October 2017
£m
53-week period ended 2 October
2016£m
Adjusted operating profit 184.8 178.7Acquisition related amortisation 10.7 7.4
Adjusted EBITA 195.5 186.1
Like-for-like
Revenue
£mEBITA
£m
201653-week period ended 2 October 2016, as reported 1,431.3 186.1Week 53 (20.2) (4.2)Adjust for FX 73 .6 1.5
52-week period ended 28 September 2016 at constant currency 1,484.7 183.4
201752-week period ended 1 October 2017, as reported 1,540.8 195.5Bela Ischia (19.1) (1.9)
2017 “like for like” with 2016 1,521.7 193.6
Britvic plc Annual Report and Accounts 2017 153
Strate
gic re
port
Gove
rnan
ceFin
ancial state
ments
Ad
ditio
nal info
rmatio
n
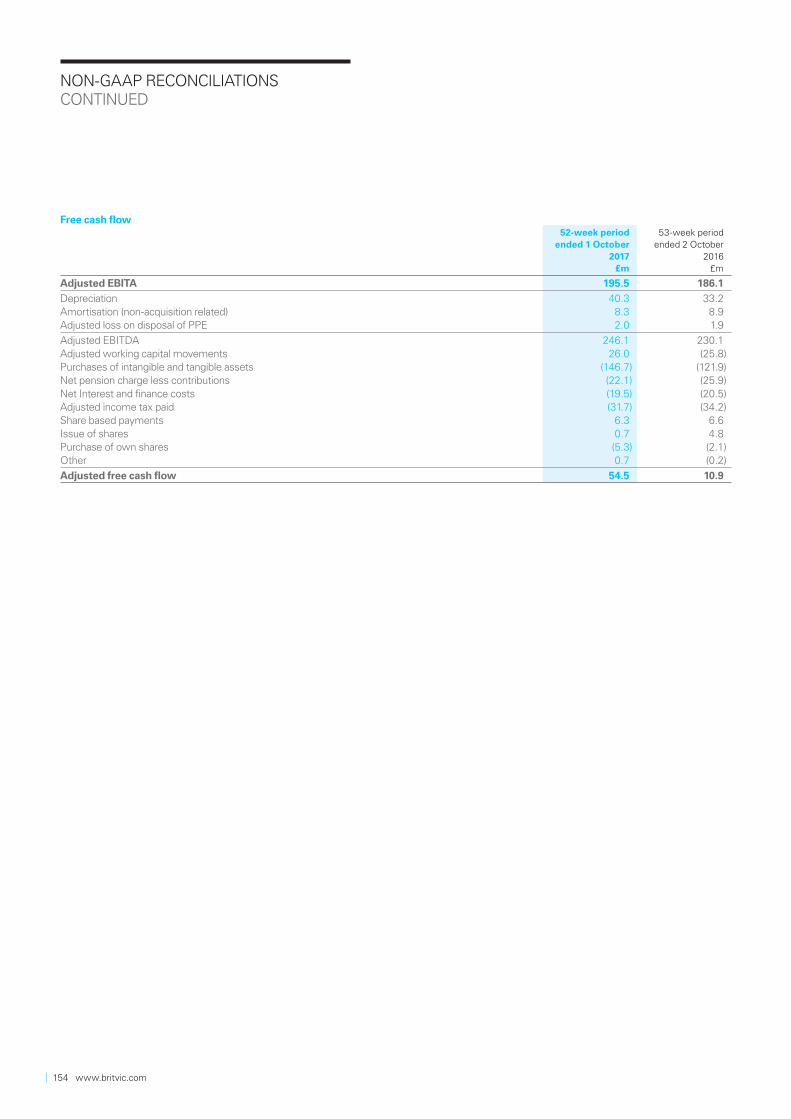
Free cash flow52-week period
ended 1 October 2017
£m
53-week period ended 2 October
2016£m
Adjusted EBITA 195.5 186.1
Depreciation 40.3 33.2Amortisation (non-acquisition related) 8.3 8.9Adjusted loss on disposal of PPE 2.0 1.9
Adjusted EBITDA 246.1 230.1Adjusted working capital movements 26.0 (25.8)Purchases of intangible and tangible assets (146.7) (121.9)Net pension charge less contributions (22.1) (25.9)Net Interest and finance costs (19.5) (20.5)Adjusted income tax paid (31.7) (34.2)Share based payments 6.3 6.6Issue of shares 0.7 4.8Purchase of own shares (5.3) (2.1)Other 0.7 (0.2)
Adjusted free cash flow 54.5 10.9
NON-GAAP RECONCILIATIONS CONTINUED
154 www.britvic.com

NOTES
Britvic plc Annual Report and Accounts 2017 155
Strate
gic re
port
Gove
rnan
ceFin
ancial state
ments
Ad
ditio
nal info
rmatio
n

NOTES CONTINUED
156 www.britvic.com


Britvic plc Breakspear Park Breakspear Way
Hemel Hempstead HP2 4TZ
Tel: +44 (0)121 711 1102www.britvic.com