delivering opportunity - ucsusa.org and busy roads, where they suffer disproportionally ... using...
TRANSCRIPT

Delivering OpportunityHow Electric Buses and Trucks Can Create Jobs and Improve Public Health in California
Concerned Scientists
Union of

Delivering Opportunity How Electric Buses and Trucks Can Create Jobs and Improve Public Health in California
Sara ChandlerJoel EspinoJimmy O’Dea
October 2016
Updated May 2017
Concerned Scientists
Union of

iv union of concerned scientists | the greenlining institute
© 2016, 2017 Union of Concerned Scien-tists and The Greenlining Institute
All rights reserved
Sara Chandler was the 2015-16 legal fellow in The Greenlining Institute’s environmental equity program.
Joel Espino is legal counsel in The Greenlining Institute’s environmental equity program.
Jimmy O’Dea is a vehicles analyst in theClean Vehicles Program at the Union of Concerned Scientists.
The Union of Concerned Scientists putsrigorous, independent science to work tosolve our planet’s most pressing problems.Joining with citizens across the country,we combine technical analysis andeffective advocacy to create innovative,practical solutions for a healthy, safe,and sustainable future.
Founded in 1993, The Greenlining Institute envisions a nation where communities of color thrive and race is never a barrier to economic opportunity. Because people of color will be the majority of our population by 2044, America will prosper only if communities of color prosper. Greenlining advances economic opportunity and empowerment for people of color through advocacy, community and coalition building, research, and leadership development.
More information about the Union of Con-cerned Scientsts (www.ucsusa.org) and The Greenlining Institute (www.greenlining.org) can be found online.
This report is available online (in PDF format) at www.ucsusa.org/ ElectricTrucks and www.greenlining.org/issues/2016/delivering-opportunity- electric-trucks.
Layout:Rob Catalano, Catalano Design
Cover photo: © BYDPrinted on recycled paper

vDelivering Opportunity
vii Figures, Tables, and Boxes
ix Acknowledgments
ix A Note on the May 2017 Updated Version
1 executive summary
6 introduction
chapter 1
7 Health Assessment: The Case for Clean Trucks and Buses
8 The Role of Trucks and Buses in California
8 Health Impacts of Pollution from Trucks and Buses
10 Truck and Bus Pollution Harms Us All but Some Communities More than Others
11 Electric Heavy-Duty Vehicles Will Play a Major Role in Meeting Clean Air Standards
12 We Have Solutions to Dirty Air
chapter 2
13 Electrification of Trucks and Buses: Assessing Emissions and Technology
13 Sector-Wide and Vehicle-Level Emissions from Trucks and Buses
18 The Technology and Business Case for Electric Trucks and Buses
19 A Survey of Trucks and Buses in California
23 Performance Metrics: Transit Buses Show That Electric Vehicles Fit the Bill
28 Recommendations for Action
chapter 3
30 Assessing Electric Vehicle Jobs and Workforce Training in California
31 Growth Potential in Truck and Bus Electrification and Related Jobs
32 Methodology
[ contents ]

vi union of concerned scientists | the greenlining institute
32 Goals of the Assessment
32 Manufacturing Occupations
37 Electric Vehicle Charging Infrastructure Occupations
40 Electric Vehicle Maintenance Occupations
42 Heavy-Duty Electric Vehicle Workforce Development and Job-Training Resources
44 Recommendations for Action
46 References
52 Appendices
viiDelivering Opportunity
[ figures, tables, and boxes ]
figures
2 Figure ES-1. Heavy-Duty Vehicles Are Significant Contributors to California’s Air Pollution and Global Warming Emissions
3 Figure ES-2. Reducing Global Warming Emissions by Switching to Electric Buses
3 Figure ES-3. Reducing Particulate Matter and Nitrogen Oxide Emissions by Switching to Electric Buses
4 Figure ES-4. Electric Bus Ranges Are Increasing While Charging and Refueling Times Are Decreasing
8 Figure 1. Most Freight in California Moves by Truck
10 Figure 2. Both Income and Race Are Indicators of Exposure to Air Pollution
11 Figure 3. People of Color Take Public Transportation to Work More than Whites
14 Figure 4. Heavy-Duty Vehicles Are Significant Contributors to California’s Air Pollution and Global Warming Emissions
16 Figure 5. Reducing Global Warming Emissions by Switching to Electric Buses
17 Figure 6. Buses Powered by Low-Carbon Fuel Blends Produce Fewer Global Warming Emissions
18 Figure 7. Reducing Particulate Matter and Nitrogen Oxide Emissions by Switching to Electric Buses
19 Figure 8. The Range of Heavy-Duty Electric Vehicles Meets Many of Today’s Operating Needs in California
20 Figure 9. Low Efficiencies Are Common to Today’s Heavy-Duty Diesel and Natural Gas Vehicles
21 Figure 10. Transit Buses in California Are an Exception to the Prevalence of Diesel-Powered Heavy-Duty Vehicles
22 Figure 11. California’s Heavy-Duty EV Market Is Large and Growing
25 Figure 12. Electric Buses Perform Better than Other Buses on Many Key Metrics
26 Figure 13. Electric Bus Ranges Are Increasing While Charging and Refueling Times Are Decreasing
27 Figure 14. Electricity Prices Have Avoided Large Price Swings
28 Figure 15. Demand Charges Can Add Significantly to the Cost of an Electric Transit Bus

viii union of concerned scientists | the greenlining institute
tables
35 Table 1. Occupations Associated with Electric Truck and Bus Manufacturing
36 Table 2. Wages, Education Requirements, and O*NET Job Zones for Manufacturing Occupations
39 Table 3. Occupations Related to Electric Vehicle Charging Infrastructure
39 Table 4. Wages and Education Requirements in Electric Vehicle Charging Infrastructure
41 Table 5. Projected Growth in Jobs Related to Electric Vehicle Charging Infrastructure
41 Table 6. Occupations in Automotive Maintenance and Repair
42 Table 7. Wages and Education Requirements in Automotive Maintenance and Repair
42 Table 8. Projected Growth in Auto Service Technicians and Mechanics
boxes
9 Box 1. Ozone, Nitrogen Oxides, and Particulate Matter
10 Box 2. At a Glance: Heart Disease
18 Box 3. At a Glance: Batteries and Fuel Cells, Not Batteries versus Fuel Cells
20 Box 4. At a Glance: What Is a Drayage Truck?
24 Box 5. At a Glance: 100 Percent Electric Transit
33 Box 6. At a Glance: Electric Truck and Bus Manufacturing Jobs
33 Box 7. Distinguishing General and Heavy-Duty Electric Vehicle Assembly
38 Box 8. At a Glance: Jobs Related to Electric Vehicle Charging Infrastructure
40 Box 9. Installing an Electric Vehicle Charging Station
40 Box 10. At a Glance: Automotive Maintenance Jobs

ixDelivering Opportunity
This report was made possible by the generous support of the William and Flora Hewlett Foundation, members of the Union of Concerned Scientists, and partners of The Greenlining Institute.
The authors thank the following people for their help in providing information or reviewing this report: Edward Avol, Will Barrett, Elliott Carson, Bryan Cope, Rosa Dominguez-Faus, Joel Ervice, Joshua Goldman, Zach Kahn, Kent Leacock, Micah Mitrosky, Colin Murphy, Erika Patterson, Ryan Schuchard, Andy Swanton, Ryne Shetterly, Vincent Verna, Jue Wang, and other individuals who wish to remain anonymous.
The authors also thank their colleagues at the Union of Concerned Scientists and The Greenlining Institute for their thoughtful input and advice, especially Don Anair, Emily Heffling, Bruce Mirken, and Alvaro Sanchez. Special thanks go to Bryan Wadsworth, Cynthia DeRocco, Rob Catalano, and Marc Miller for their roles in the report’s editing and production.
The opinions expressed herein do not necessarily reflect those of the organization that funded the work or the individuals who reviewed it. The Union of Concerned Scientists and The Greenlining Institute bear sole responsibility for the report’s contents.
A NoTE oN THE updATEd mAy 2017 VErsioN
This report was updated in May 2017 to incorporate vehicle charging efficiency in the life cycle emissions analysis of electric buses. A charging efficiency of 90 per-cent was chosen based on data from The Altoona Bus Research and Testing Center. This represents a conservative value compared to the 95 percent efficiency cited in the California Air Resources Board’s Technology Assessment: Medium- and Heavy-Duty Battery Electric Trucks and Buses and conversations with industry representa-tives. The life cycle emissions from battery electric buses changed only slightly with this update. All conclusions regarding the emissions of battery electric buses compared to other buses remained unchanged.
[ acknowledgments ]


1Delivering Opportunity
carcinogen. Heavy-duty vehicles emit nearly 40 percent of this dangerous type of particulate matter in California. These large contributions to air pollution come despite the fact that heavy- duty vehicles make up just 7 percent of all vehicles in California.
Pollutants from heavy-duty vehicles pose health risks at all stages of life, from premature births to premature deaths. Studies have associated air pollution with adverse effects on nearly every organ system in the body. While air pollution affects us all, low-income communities and communities of color are more likely to be located near ports, rail yards, ware-houses, and busy roads, where they suffer disproportionally from the consequences of dirty air. These localized inequities are particularly important because mitigation strategies to reduce regional air pollution may not address disproportion-ate exposure to pollutants at the local level.
While clean air and climate policies across the country have sparked sales of passenger electric vehicles, deploy- ment of similar technologies for heavy-duty trucks and buses has been slower. California is shifting this balance, with policies and investments to bring electric trucks and buses to market.
This report examines the state of technology for electric trucks and buses, their life cycle emissions, and job opportunities presented by an expanding market for electric heavy-duty vehicles. With recent innovation, these vehicles can meet the requirements of many demanding applications. And with the right job-training and equitable hiring policies and programs, California’s emerging electric truck and bus sector can provide opportunities to increase employment in underserved communities.
Public Health Assessment
Heavy-duty vehicles are a significant source of the state’s global warming emissions, accounting for 7 percent of the total—a proportion estimated to increase over the next 30 years, ac-cording to the California Air Resources Board (CARB). They are the single largest source of nitrogen oxides (NOx) in Califor-nia (emitting 33 percent of the state’s total) and produce more particulate matter (PM) than all of the state’s power plants combined (23 tons per day versus 7 tons per day, respectively) (Figure ES-1, p. 2). Particulate matter from the combustion of diesel fuel is an especially toxic type of particulate matter and has been identified by the World Health Organization as a
Heavy-duty vehicles are a significant source of local air pollution and global warming emissions in California. These emissions endanger public health, especially in low-income communities and communities of color, which are more likely to be located near busy roads and other sources of pollution.
[ executive summary ]
© Proterra
While air pollution affects us all, low- income communities and communities of color suffer disproportionally from the consequences of dirty air.

2 union of concerned scientists | the greenlining institute
Emissions Assessment
Adapting models from Argonne National Laboratory and CARB, Union of Concerned Scientists (UCS) and Life Cycle Associates analyzed the emissions from heavy-duty vehicles. This analysis used transit buses as a case study and consid-ered both tailpipe emissions and emissions from producing the fuel. This “life cycle analysis,” which covered global warming emissions, particulate matter, and NOx emissions for different fuel types, found the following:
• Batteryelectricbuseshavenotailpipeemissionsandfuelcell electric buses produce only water vapor, eliminating hazardous exhausts where these vehicles operate. Their emissions depend solely on how the electricity and hydro-gen fuel are produced. Using 100 percent renewable energy
for electricity and hydrogen production would eliminate entirely the emissions from operating these vehicles.
• Lifecycleglobalwarmingemissionsfromfuelcellelec-tric buses are more than 50 percent lower than both com-pressed natural gas (CNG) or diesel buses (Figure ES-2). Life cycle global warming emissions from battery electric buses are more than 70 percent lower than both CNG and diesel buses.
• BatteryandfuelcellelectricbuseshavelowerlifecycleNOx emissions than diesel and CNG buses (Figure ES-3). This includes CNG buses with soon to be released en-gines certified to meet California’s voluntary low-NOx standards (0.02 g NOx/brake horsepower-hour).
• Batteryandfuelcellelectricbuseshavelowerlifecycleparticulate matter emissions than diesel buses. Electric buses powered by electricity from sources representative of California’s current power mix (e.g., natural gas, solar, wind, hydroelectric) show less dramatic reductions in particulate matter due to electricity generation from coal and biomass power plants. These emissions will decrease further as California’s sources of power become cleaner as required by state law (including no new contracts for electricity generated out of state with coal).
Technology Assessment
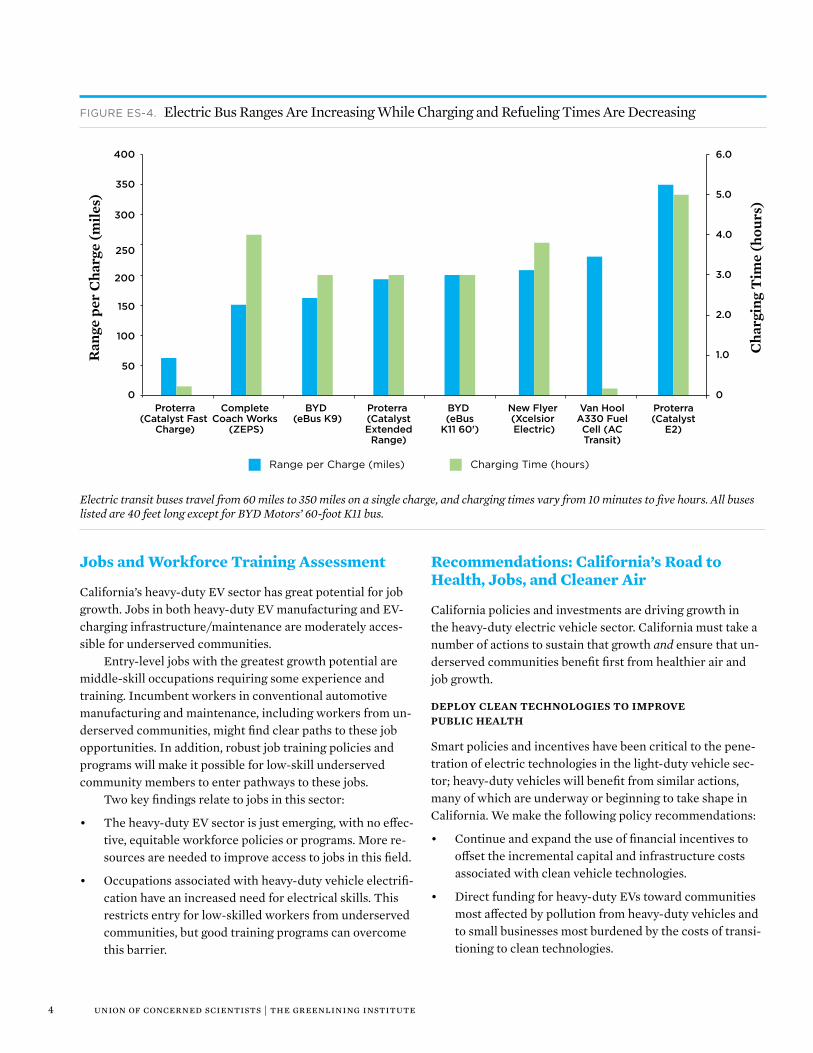
Battery electric and fuel cell electric heavy-duty vehicles meet the specifications of many transit bus and urban truck operations. Today’s electric vehicle (EV) technology includes vehicles with ranges of more than 100 miles per charge and charging and refueling times under 15 minutes (Figure ES-4, p. 4). Heavy-duty EVs are also up to four times more efficient than diesel and natural gas engines, while being quieter and boasting similar if not better acceleration times and ability to climb hills. Hundreds of electric trucks and buses have already been deployed in California, including more than 400 battery electric delivery trucks and nearly 100 battery and fuel cell electric transit buses. Nearly 40 electric drayage trucks (semi-trucks that move cargo to and from ports and rail yards) are also planned for demonstration projects in California.
Figure eS-1. Heavy-Duty Vehicles Are Significant Contributors to California’s Air Pollution and Global Warming Emissions
Global WarmingEmissions
NOxPM2.50%
10%
20%
30%
40%
50%
60%
70%
80%
90%
100%
Em
issi
ons
Con
trib
utio
n
Heavy-Duty Vehicles
Light-Duty Vehicles
Ships, Aircraft, Trains
Other Mobile Sources
All Other Sources
Emissions from mobile sources in California include small particulate matter (PM2.5), global warming emissions, and nitrogen oxides (NOx). Notes: Particulate matter emissions do not include emissions from wildfires, which are roughly equal to all non-wildfire sources combined. PM2.5—particles with diameters 2.5 micrometers and smaller—are considered particularly dangerous. “Other mobile sources” include off-road equipment, recreational vehicles, and farm equipment.
SourceS: cArB 2013; cArB 2016A.
Heavy-duty EVs are up to four times more efficient than diesel and natural gas engines.

3Delivering Opportunity
Figure eS-2. Reducing Global Warming Emissions by Switching to Electric Buses
Life cycle global warming emissions from diesel and compressed natural gas (CNG) buses are far higher than those from fuel cell electric buses ( fueled by hydrogen, H2 ) or battery electric buses.Notes: Comparison based on emissions from 40-foot transit buses. CO2e stands for carbon dioxide equivalent.
Tailpipe
Fuel Production
0
500
1,000
1,500
2,000
2,500
3,000
CNGDiesel Fuel CellElectric
(hydrogen, 33% renewables)
Battery Electric(2016 CA
electricity mix)
Battery Electric(50% renewables/50% natural gas)
CO
2e
(g/m
i)
Battery Electric(50% renewables/50% natural gas)
Battery Electric(2016 CA electricity mix)
Fuel Cell Electric(hydrogen, 33% renewables)
Low-NOx CNG
CNG
PM2.5
NOX
0-10%-20%-30%-40%-50%-60%-70%-80%-90%-100%
Emissions Decrease
Figure eS-3. Reducing Particulate Matter and Nitrogen Oxide Emissions by Switching to Electric Buses
Life cycle emissions of particulate matter (PM) and nitrogen oxides (NOx ) for battery electric, fuel cell electric, and compressed natural gas transit buses are low relative to a diesel bus.Notes: PM2.5 emissions refer to particles with diameters 2.5 micrometers and smaller. Comparison based on emissions from 40-foot transit buses.
4 union of concerned scientists | the greenlining institute
Recommendations: California’s Road to Health, Jobs, and Cleaner Air
California policies and investments are driving growth in the heavy-duty electric vehicle sector. California must take a number of actions to sustain that growth and ensure that un-derserved communities benefit first from healthier air and job growth.
dEploy ClEAN TECHNologiEs To improVE puBliC HEAlTH
Smart policies and incentives have been critical to the pene-tration of electric technologies in the light-duty vehicle sec-tor; heavy-duty vehicles will benefit from similar actions, many of which are underway or beginning to take shape in California. We make the following policy recommendations:
• Continueandexpandtheuseoffinancialincentivestooffset the incremental capital and infrastructure costs associated with clean vehicle technologies.
• Directfundingforheavy-dutyEVstowardcommunitiesmost affected by pollution from heavy-duty vehicles and to small businesses most burdened by the costs of transi-tioning to clean technologies.
Jobs and Workforce Training Assessment
California’s heavy-duty EV sector has great potential for job growth. Jobs in both heavy-duty EV manufacturing and EV-charging infrastructure/maintenance are moderately acces-sible for underserved communities.
Entry-level jobs with the greatest growth potential are middle-skill occupations requiring some experience and training. Incumbent workers in conventional automotive manufacturing and maintenance, including workers from un-derserved communities, might find clear paths to these job opportunities. In addition, robust job training policies and programs will make it possible for low-skill underserved community members to enter pathways to these jobs.
Two key findings relate to jobs in this sector:
• Theheavy-dutyEVsectorisjustemerging,withnoeffec-tive, equitable workforce policies or programs. More re-sources are needed to improve access to jobs in this field.
• Occupationsassociatedwithheavy-dutyvehicleelectrifi-cation have an increased need for electrical skills. This restricts entry for low-skilled workers from underserved communities, but good training programs can overcome this barrier.
Figure eS-4. Electric Bus Ranges Are Increasing While Charging and Refueling Times Are Decreasing
Electric transit buses travel from 60 miles to 350 miles on a single charge, and charging times vary from 10 minutes to five hours. All buses listed are 40 feet long except for BYD Motors’ 60-foot K11 bus.
Range per Charge (miles) Charging Time (hours)
)selim( egrah
C rep egnaR
)sruoh( emi
T gnigrahC
0
50
100
250
200
150
300
350
400
0
1.0
2.0
3.0
4.0
5.0
6.0
New Flyer (Xcelsior Electric)
Proterra(Catalyst Fast
Charge)
Complete Coach Works
(ZEPS)
BYD (eBus K9)
Proterra (CatalystExtendedRange)
BYD (eBus
K11 60')
Van HoolA330 FuelCell (ACTransit)
Proterra(Catalyst
E2)

5Delivering Opportunity
Manufacturers can partner with workforce training organizations, workforce development boards, and com-munity colleges to establish pathways for training and certifying workers from these communities and place them in quality jobs.
• California’s government agencies should invest in skill-development programs aimed at training jobseekers in underserved communities to fill the emerging employ-ment needs in the heavy-duty EV industry and related transportation electrification fields.
• Job training organizations should evaluate the heavy-duty EV sector—and the larger transportation electrifica-tion sector—for the potential to establish formal job-training programs, especially if investments supporting this sector continue to grow.
California’s emerging electric truck and bus sector provides a significant opportunity to improve public health in areas most affected by traffic-related pollution, while bringing jobs to com-munities that need them most. With the right private- and pub-lic-sector policies and investments, electric trucks and buses can deliver cleaner air, reduce global warming emissions, and create a more equitable economy in California.
• Designelectricityratesandmakeinvestmentsincharg-ing infrastructure that facilitate a transition to electric trucks and buses.
• Implementregulatorymeasurestoincreasesalesvol-umes and reduce technology costs so that heavy-duty EVs become the norm and not the exception.
• Providetechnicalassistancetosmallbusinessesandfleetmanagers to facilitate their adoption of EVs, which come with different operating considerations than do tradi-tional vehicles.
Assess Jobs and Workforce Training
The following recommendations highlight actions and con-siderations for government, heavy-duty EV companies, and job-training programs to ensure that workers from under-served communities gain access to the growing job opportu-nities in the heavy-duty EV sector.
• California’s electric truck and bus manufacturers should support the development of formal training pathways for new workers from underserved communi-ties so they can access employment in this emerging field.

6 union of concerned scientists | the greenlining institute
The transportation sector is California’s largest source of global warming pollution, creating nearly 50 percent of emis-sions when accounting for the production, refining, and use of petroleum (CARB 2015a).
That makes electrifying our cars, trucks, and buses critical to fighting climate change and cleaning our air. And California is blazing the trail to a clean transportation future, having set several ambitious goals:
• Deploy1.5millionzero-emissionvehiclesby2025(Brown 2012).
• Deploymorethan100,000zero-emissionfreightvehiclesand equipment by 2030 (CSFAP 2016).1
• CutCalifornia’sglobal-warmingemissionsto40percentbelow 1990 levels by 2030 and 80 percent below 1990 levels by 2050 (Brown 2015a).
California’s Clean Energy and Pollution Reduction Act of 2015 further bolsters the move to clean transportation. The act aligns with California’s goals to reduce global warming emissions and directs electrical utilities to promote transpor-tation electrification by increasing “access to the use of elec-tricity as a transportation fuel.” The act also commits California to using 50 percent renewable energy by 2030, en-suring that the electricity Californians use to charge their electric vehicles is increasingly clean.2
Despite this strong climate leadership, many California communities still face immediate and long-term health con-sequences from exposure to truck and bus pollution. In par-ticular, vulnerable populations, including low-income communities and communities of color, are hit hardest by transportation-related pollution (Frosch et al. 2009). Greater exposure to dirty air is tied to race even more than to income: nearly 90 percent of residents in the most polluted regions of California are people of color, although they make up only about 60 percent of the state’s population (CalEPA 2016). Low-income communities of color are often located near busy roads, freeways, ports, rail yards, distribution centers, and
warehouses, all of which are sources of dangerous levels of contamination (CCFC 2016). Until California’s underserved communities become a high priority for investments in the deployment of clean transportation, they will continue to feel the worst impacts of the transportation sector.
The good news is that California’s burgeoning heavy-duty electric vehicle sector presents a unique opportunity to combat poverty, pollution, and climate change. For example, California has proposed the Advanced Clean Transit rule (CARB 2016b) and Sustainable Freight Action Plan (CSFAP 2016), and it pro-vides funding for heavy-duty EV technology demonstration projects through the California Energy Commission’s Alterna-tive and Renewable Fuel and Vehicle Technology Program (CEC 2016a). These policies and complementary efforts put California at the forefront of the development and deployment of heavy-duty electric trucks and buses.
As these vehicles are deployed, low-income communities of color must benefit first from not only the air-quality bene-fits but also from the economic opportunities created. In Southern California and in the Bay Area, several companies have created manufacturing facilities to produce clean buses, trucks, and components (Schuchard et al. 2016). The pres-ence and continued growth of these employers means job growth and opportunities to connect underserved community workers to those jobs.
[ introduction ]
California’s burgeoning heavy-duty electric vehicle sector presents a unique opportunity to combat poverty, pollution, and climate change.

7Delivering Opportunity
Heavy-duty vehicles, including trucks and buses, are one of the largest sources of harmful air pollution in California.3 The single largest source of nitrogen oxide pollution in the state, they also produce more particulate matter pollution than all of California’s power plants combined (CARB 2013).
Facts like these matter because air pollution shortens lives and increases diseases that compromise the quality of life (Leliveld et al. 2015). Studies have linked air pollution to adverse effects on almost every organ system in the body. These effects include increased risks of cancer (Wong et al. 2016), neurological (Power et al. 2011) and metabolic diseases (Dubowsky et al. 2006), respiratory (Dockery and Pope 1994) and cardiovascular damage (Brook et al. 2010), stunted lung development in children (Gauderman et al. 2004), and com-promised reproductive health in adults (Dadvand et al. 2013).
Heavy-duty vehicles also produce 7 percent of Califor-nia’s global warming emissions (CARB 2016a). For compari-son, this is roughly the same fraction that California contributes to global warming emissions in the United States (EPA 2015; EIA 2015). Global warming emissions from heavy-duty vehicles in California are also expected to rise over the next 30 years as demand for freight movement increases (CARB 2015b).
Studies have linked air pollution to adverse effects on almost every organ system in the body.
Pollution from heavy-duty vehicles—often in conjunction with other sources of emissions—creates localized hot spots of poor air quality, especially near roads carrying high vol-umes of traffic (CalEPA 2016). Due to proximity, low-income communities and communities of color are more likely to feel the negative effects of air pollution.
Climate change also disproportionately affects these communities through increased risk-factors, such as heat exposure and a lack of financial resources to cope with severe weather events (Frosch et al. 2009). For example, access to air
Health Assessment: The Case for Clean Trucks and Buses
[ chapter 1 ]
Heavy-duty vehicles are responsible for both global warming emissions and air pollution that causes disease. Communities located along major roadways bear the brunt of this local air pollution.
© Pam
elaJoeMcFarlane/iStock

8 union of concerned scientists | the greenlining institute
population of heavy-duty trucks in California is estimated to increase by 90 percent. (CARB 2015b).
While buses move different “goods” than trucks, they too play an important role in the economy, getting people to work and beyond in California. More than 600,000 Californians commute to work on the state’s roughly 10,000 transit buses (USCB n.d.; CARB 2016c). Buses resemble other heavy-duty vehicles in many ways, including weight, size, emissions, ur-ban routes, and central vehicle depots.
Health Impacts of Pollution from Trucks and Buses
Given the large role of heavy-duty vehicles in the California economy, it is not surprising that they also contribute greatly
conditioning is critical in heat waves, yet people of color are less likely than whites to have access to it (CDPH 2007). Flood, wildfire, and other weather-related insurance are also less likely to be affordable for low-income households, expos-ing them more to the financial costs of extreme weather events caused by climate change (Frosch et al. 2009).
The Role of Trucks and Buses in California
Trucks move more than 70 percent of goods within, to, and from California (ORNL 2016).4 The scale of freight moved by trucks in California, a centerpiece of the US freight system, reinforces the need for policies and technologies that safeguard Californians’ health. With three of the nation’s 10 largest seaports (the ports of Los Angeles, Long Beach, and Oakland), nearly 40 percent of cargo containers entering and leaving the United States pass through Califor-nia (US MARAD 2015). Ports in Stockton and Port Hueneme also contribute to the volume of freight in California.
As expansive as freight operations are in California today, they are expected to grow. Between 2015 and 2045, the weight of goods shipped by trucks in California is expected to increase by 60 percent (Figure 1) (ORNL 2016). By 2050, the
© iStockphoto.com
/RuslanD
ashinsky
Air pollution produced by heavy-duty vehicles can lead to a variety of health affects, including asthma and the stunting of lung development in children. Because neighborhoods of color are more likely to be located near major freight hubs and busy roads, they are disproportionately affected by air pollution.
20452015500
1,000
1,500
2,000
2,500
3,000
Wei
ght (
mill
ions
of t
ons)
Truck
Pipeline
Train
Ship
Other
Figure 1. Most Freight in California Moves by Truck
Freight activity (measured by weight shipped) of domestic goods to, from, and within California is projected to increase by 60 percent over the next 30 years. Most of the additional volume will be moved by trucks. “Other” includes aircraft, multiple modes, mail, and im-ports without any domestic shipment.Source: orNL 2016.
Nearly 40 percent of cargo containers entering and leaving the United States pass through California.
9Delivering Opportunity
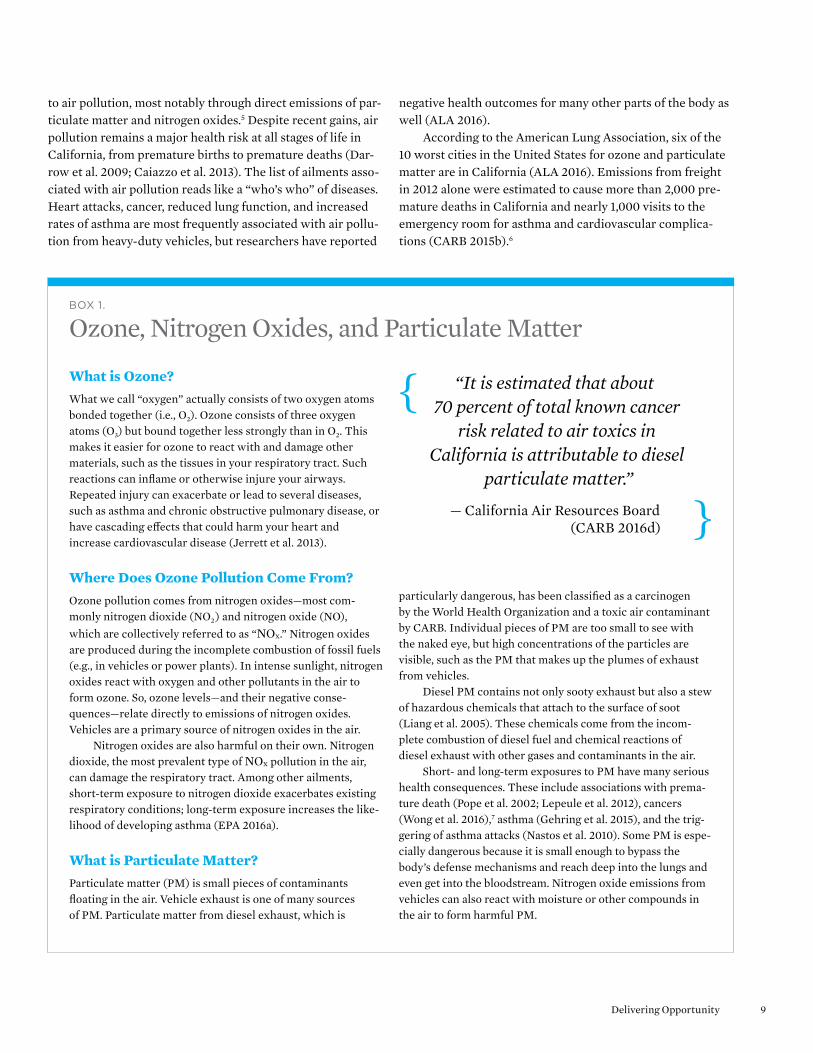
to air pollution, most notably through direct emissions of par-ticulate matter and nitrogen oxides.5 Despite recent gains, air pollution remains a major health risk at all stages of life in California, from premature births to premature deaths (Dar-row et al. 2009; Caiazzo et al. 2013). The list of ailments asso-ciated with air pollution reads like a “who’s who” of diseases. Heart attacks, cancer, reduced lung function, and increased rates of asthma are most frequently associated with air pollu-tion from heavy-duty vehicles, but researchers have reported
negative health outcomes for many other parts of the body as well (ALA 2016).
According to the American Lung Association, six of the 10 worst cities in the United States for ozone and particulate matter are in California (ALA 2016). Emissions from freight in 2012 alone were estimated to cause more than 2,000 pre-mature deaths in California and nearly 1,000 visits to the emergency room for asthma and cardiovascular complica-tions (CARB 2015b).6
Box 1.
Ozone, Nitrogen Oxides, and Particulate Matter
What is Ozone?What we call “oxygen” actually consists of two oxygen atoms bonded together (i.e., O2). Ozone consists of three oxygen atoms (O3) but bound together less strongly than in O2. This makes it easier for ozone to react with and damage other materials, such as the tissues in your respiratory tract. Such reactions can inflame or otherwise injure your airways. Repeated injury can exacerbate or lead to several diseases, such as asthma and chronic obstructive pulmonary disease, or have cascading effects that could harm your heart and increase cardiovascular disease (Jerrett et al. 2013).
Where Does Ozone Pollution Come From?Ozone pollution comes from nitrogen oxides—most com- monly nitrogen dioxide (NO2) and nitrogen oxide (NO), which are collectively referred to as “NOx.” Nitrogen oxides are produced during the incomplete combustion of fossil fuels (e.g., in vehicles or power plants). In intense sunlight, nitrogen oxides react with oxygen and other pollutants in the air to form ozone. So, ozone levels—and their negative conse-quences—relate directly to emissions of nitrogen oxides. Vehicles are a primary source of nitrogen oxides in the air.
Nitrogen oxides are also harmful on their own. Nitrogen dioxide, the most prevalent type of NOx pollution in the air, can damage the respiratory tract. Among other ailments, short-term exposure to nitrogen dioxide exacerbates existing respiratory conditions; long-term exposure increases the like-lihood of developing asthma (EPA 2016a).
What is Particulate Matter?Particulate matter (PM) is small pieces of contaminants floating in the air. Vehicle exhaust is one of many sources of PM. Particulate matter from diesel exhaust, which is
particularly dangerous, has been classified as a carcinogen by the World Health Organization and a toxic air contaminant by CARB. Individual pieces of PM are too small to see with the naked eye, but high concentrations of the particles are visible, such as the PM that makes up the plumes of exhaust from vehicles.
Diesel PM contains not only sooty exhaust but also a stew of hazardous chemicals that attach to the surface of soot (Liang et al. 2005). These chemicals come from the incom-plete combustion of diesel fuel and chemical reactions of diesel exhaust with other gases and contaminants in the air.
Short- and long-term exposures to PM have many serious health consequences. These include associations with prema-ture death (Pope et al. 2002; Lepeule et al. 2012), cancers (Wong et al. 2016),7 asthma (Gehring et al. 2015), and the trig-gering of asthma attacks (Nastos et al. 2010). Some PM is espe-cially dangerous because it is small enough to bypass the body’s defense mechanisms and reach deep into the lungs and even get into the bloodstream. Nitrogen oxide emissions from vehicles can also react with moisture or other compounds in the air to form harmful PM.
“It is estimated that about 70 percent of total known cancer
risk related to air toxics in California is attributable to diesel
particulate matter.”
— California Air Resources Board (CARB 2016d)
{
}

10 union of concerned scientists | the greenlining institute
Truck and Bus Pollution Harms Us All but Some Communities More than Others
Dirty air is a major problem in California, and it is especially serious for Californians of color. Nearly 90 percent of resi-dents in the state’s most polluted regions are people of color, despite making up 60 percent of the state’s population (CalEPA 2016).
Residents of low-income communities and communities of color are more likely to live near busy roads and freight hubs, where exposure to pollution from heavy-duty vehicles and freight is greater (Hricko et al. 2014; Houston, Li, and Wu 2014). These localized inequities are particularly impor-tant because strategies to reduce regional air pollution may not address disproportionate exposure to pollutants at the local level.
The health effects of air pollution increase with proxim-ity to roads and traffic (EPA 2014). So do racial and economic disparities: 19 percent of Americans live near a busy road,8 a figure that increases to 27 percent for people of color. The median household income near these busy roads is also roughly 10 percent below the local average.9 Nearly two-thirds of those living near the busiest roads—those carrying more than 200,000 vehicles on an average day—are people of color; median household income in these areas is roughly 20 percent below the county average (Rowangould 2013).
Figure 2. Both Income and Race Are Indicators of Exposure to Air Pollution
Maps of the Los Angeles area suggest the correlation of air pollution (diesel particulate matter in this example) to income and race. Notes: “Minority population” refers to the fraction of California’s population that is all but non-Hispanic white. “Diesel particulate matter” represents the amount of this pollution in a given area relative to other areas in California. “Low income population” refers to the percent of Californians whose household income was less than two times the poverty level in the past 12 months. Percentiles are as follows: yellow: 80–90 percent; orange: 90–95 percent; red: 95–100 percent. Percentiles are relative to California’s population.
Source: ePA 2016B.
Box 2.
At a Glance: Heart DiseaseWhile it may be obvious that dirty air is bad for your lungs, it is also bad for your heart. A recent study involving thou-sands of people in several regions across the United States found that particle pollution and nitrogen oxides accelerate the formation of calcium deposits in participants’ coronary arteries (Kaufman et al. 2016). Hardening of these arteries, which deliver oxygen-rich blood to your heart, is the most common cause of heart attacks (NHLBI 2015).
Nearly 90 percent of residents in the state’s most polluted regions are people of color.
Diesel Particulate MatterMinority PopulationLow Income Population

11Delivering Opportunity
Joaquin Valley), which together contain roughly half of the state’s population.
To meet clean air standards, the Los Angeles region must reduce emissions of nitrogen oxides by more than 70 percent by 2023 and by more than 80 percent by 2031, compared with 2012 levels (SCAQMD 2016). However, today’s emission- control programs and regulations will result in nitrogen oxide levels in the Los Angeles metropolitan area that are more than twice the goal for 2031 (CARB 2015c). Additional reduc-tions will be needed by 2037 to meet the latest standard for ozone, which was recently strengthened from 75 to 70 parts per billion to better reflect the health risks posed by ozone. If California does not clean up the air, the federal government could impose large fines and take control of managing air quality in noncompliant areas.
Income is a significant indicator of exposure to air pollu-tion, yet disparities persist across racial groups when control-ling for income. In other words, a white person is more likely to live in an area with cleaner air than a person of color with the same income (Figure 2) (Clark, Millet, and Marshall 2014).
Living near a busy road is not the only means of expo-sure. Time spent in busy traffic while commuting to and from work is another significant source of exposure (CARB 2016d). Emissions from buses affect bus drivers, bus riders, and people who live along bus routes. People of color commute to work on public tran sit 33 percent more than whites, indicat-ing that emissions from transit buses place people of color at higher risk (Figure 3) (USCB n.d.).
Electric Heavy-Duty Vehicles Will Play a Major Role in Meeting Clean Air Standards
While tailpipe emissions from new diesel and natural gas ve-hicles are lower than those from older vehicles, the slow turn-over of existing vehicles and the steady growth of the heavy-duty vehicle population as a whole will counteract those reductions (CARB 2015b). Taken by themselves, reduc-tions in emissions from new diesel and natural gas vehicles will not be enough to achieve clean air standards in California communities, including the South Coast air basin (the greater Los Angeles region) and across the Central Valley (the San
Perc
ent T
akin
g P
ublic
T
rans
port
atio
n to
Wor
k
0%
1%
2%
3%
4%
5%
6%
7%
8%
9%
10%
OtherRace
Black or African
American
Asian Hispanicor Latino
NativeHawaiian or
PacificIslander
AmericanIndian orAlaskaNative
Two orMore Races
White
Figure 3. People of Color Take Public Transportation to Work More than Whites
Bus ridership accounts for more than 70 percent of commutes to work by public transit in California. People of color are more likely than whites to use public transit and thus are more exposed to pollution from buses.Source: uScB N.d.
Reductions in emissions from new diesel and natural gas vehicles will not be enough to achieve clean air standards in California communities.

12 union of concerned scientists | the greenlining institute
We Have Solutions to Dirty Air
The good news is that the cleaner the air, the healthier our communities (Gauderman et al. 2015; Berhane et al. 2016). And cleaning up the air we breathe has immediate benefits. For example, pregnant women in Beijing experienced a 47-day reprieve from air pollution during the 2008 Olympics and Paralympics and babies born soon after had higher birth weights, a factor that is known to be affected by air pollution (Rich et al. 2015). Imagine a California with clean air from our doorsteps to work and beyond.
Fortunately, with zero-emission electric trucks and buses, we can stop much of the pollution and lessen the health consequences associated with the widespread use of combustion-based heavy-duty vehicles. Emissions from the electricity and hydrogen used to power electric vehicles are already lower than from combustion technologies and will only get lower as the electric grid uses more renewable en-ergy. In short, electric trucks and buses can improve air quality while simultaneously reducing global warming emis-sions better than any other heavy-duty vehicle technology available today.

13Delivering Opportunity
Our analysis examined the life cycle emissions of heavy-duty vehicles across engine and fuel types. It used transit buses as a case study and considered not only tailpipe emissions but also emissions from producing the fuel. We found large differ-ences in emissions from different engine and fuel types, with battery and fuel cell electric buses powered by clean energy having the lowest all-around emissions. We also assessed the state of heavy-duty EV technologies, finding that electric drivetrains are no longer an option just for passenger vehi-cles. Transit buses, drayage trucks (semi-trucks that move cargo to and from ports and rail yards), and delivery trucks are all particularly well-suited for electrification.
Sector-Wide and Vehicle-Level Emissions from Trucks and Buses
Minimizing pollution from heavy-duty vehicles, which are significant contributors to air pollution and global warming emissions, represents a substantial opportunity to improve air quality across California, especially in the underserved commu-nities hit hardest by air pollution. In 2012, the most recent year for which data are available, heavy-duty trucks and buses con-tributed 7 percent of global warming emissions in California, 6 percent of anthropogenic particulate matter 2.5 micrometers and smaller in size (PM2.5), and more than 30 percent of
Electrification of Trucks and Buses: Assessing Emissions and Technology
[ chapter 2 ]
© BY
D
Unlike diesel and natural gas vehicles, electric trucks and buses, like the BYD articulated bus pictured here, produce no hazardous exhaust emissions.

14 union of concerned scientists | the greenlining institute
emissions from all sectors in a number of individual states (EIA 2015). In addition, on-road diesel engines contribute to black carbon emissions (a.k.a. soot) in California (18 percent of anthropogenic emissions). Black carbon is a potent, short-lived global warming pollutant that the state currently does not count in its inventory of global warming emissions, thereby un-derestimating the impacts from these vehicles (CARB 2015d).
FiNdiNgs
• Batteryelectricbuseshavenotailpipeemissionsandfuelcell electric buses produce only water vapor, eliminating hazardous exhausts where these vehicles operate. Their emissions depend solely on how the electricity and hy-drogen fuel are produced. These “upstream emissions” will decrease even further as California’s electric grid becomes cleaner as required by law. Using 100 percent renewable energy for electricity and hydrogen produc-tion would eliminate entirely the emissions from operat-ing these vehicles.
• Lifecycleglobalwarmingemissionsfromfuelcellelectricbuses are more than 50 percent lower than those from ei-ther compressed natural gas (CNG) or diesel buses.
• Lifecycleglobalwarmingemissionsfrombatteryelectricbuses are more than 70 percent lower than those from either CNG or diesel buses.
• Abatteryelectricbususingelectricityfromanatural-gaspower plant has lower global warming emissions than a CNG bus that uses natural gas directly. In applications where both electric and natural-gas vehicles are avail-able, using resource-constrained sources of biomethane (e.g., landfill gas) to generate electricity is the lowest car-bon use of these fuels. For the same amount of fuel, a ve-hicle powered by electricity from a natural-gas power plant will travel twice as far as a CNG vehicle powered directly by natural gas.
• BatteryandfuelcellelectricbuseshavelowerlifecycleNOx emissions than do diesel and CNG buses. This includes CNG buses with engines certified to meet California’s vol-untary low-NOx standards (0.02 g NOx/brake horsepow-er-hour), which are expected for release in 2016.
nitrogen oxides (NOx) (Figure 4). Considering only diesel par-ticulate matter, identified by health organizations as carcino-genic and an especially harmful type of PM, heavy-duty vehicles made up nearly 40 percent of pollution in 2012 (CARB 2013).
Transportation as a whole is the single largest source of climate-related pollution, with tailpipe emissions making up 36 percent of California’s global warming emissions (CARB 2016a). When accounting for the production and refining of petroleum, the transportation sector accounts for nearly 50 per- cent of global warming emissions in the state (CARB 2015a).
While light-duty passenger vehicles contribute the largest fraction of transportation emissions (25 percent of the state’s global warming emissions) (CARB 2016a), heavy-duty vehicles in California actually emit more carbon dioxide than the total
Transportation as a whole is the single largest source of climate-related pollution in California.
Figure 4. Heavy-Duty Vehicles Are Significant Contributors to California’s Air Pollution and Global Warming Emissions
Global WarmingEmissions
NOxPM2.50%
10%
20%
30%
40%
50%
60%
70%
80%
90%
100%
Em
issi
ons
Con
trib
utio
n
Heavy-Duty Vehicles
Light-Duty Vehicles
Ships, Aircraft, Trains
Other Mobile Sources
All Other Sources
Emissions from mobile sources in California include small particu-late matter (PM2.5), global warming emissions, and nitrogen oxides (NOx). Notes: Particulate matter emissions do not include emissions from wildfires, which are roughly equal to all non-wildfire sources combined. PM2.5—particles with diameters 2.5 micrometers and smaller—are considered particularly dangerous. “Other mobile sources” include off-road equipment, recreational vehicles, and farm equipment.
SourceS: cArB 2013; cArB 2016A.
15Delivering Opportunity
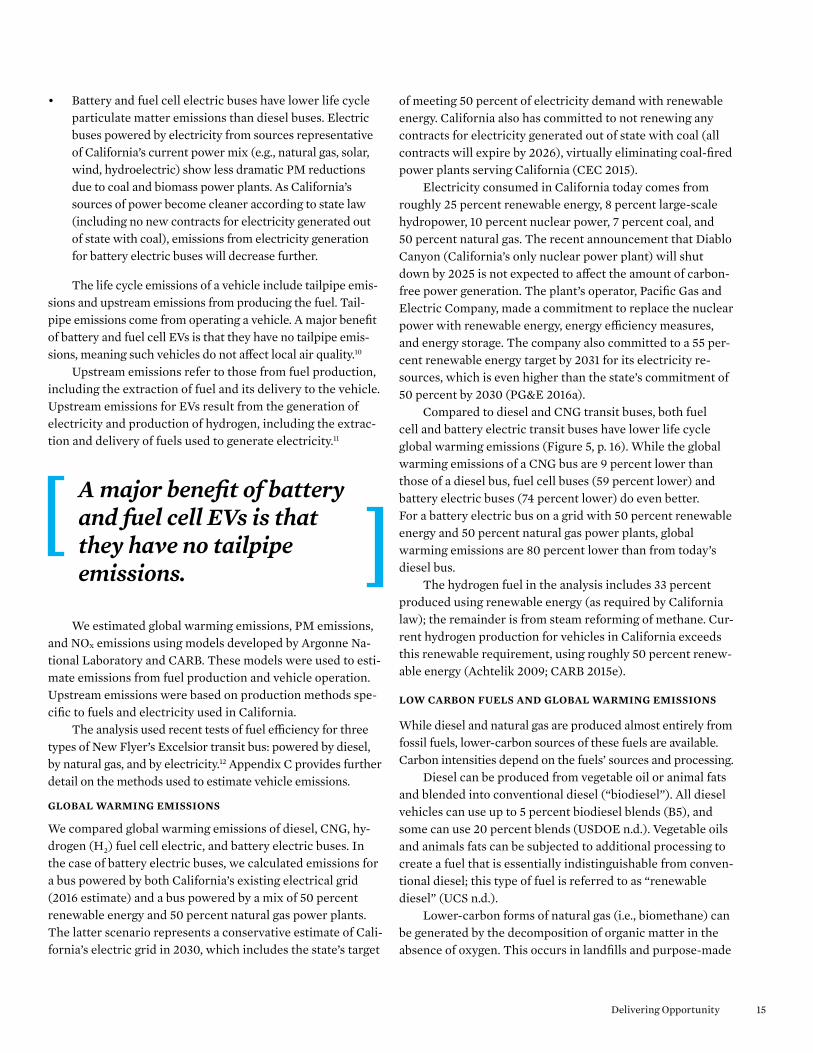
• Batteryandfuelcellelectricbuseshavelowerlifecycleparticulate matter emissions than diesel buses. Electric buses powered by electricity from sources representative of California’s current power mix (e.g., natural gas, solar, wind, hydroelectric) show less dramatic PM reductions due to coal and biomass power plants. As California’s sources of power become cleaner according to state law (including no new contracts for electricity generated out of state with coal), emissions from electricity generation for battery electric buses will decrease further.
The life cycle emissions of a vehicle include tailpipe emis-sions and upstream emissions from producing the fuel. Tail-pipe emissions come from operating a vehicle. A major benefit of battery and fuel cell EVs is that they have no tailpipe emis-sions, meaning such vehicles do not affect local air quality.10
Upstream emissions refer to those from fuel production, including the extraction of fuel and its delivery to the vehicle. Upstream emissions for EVs result from the generation of electricity and production of hydrogen, including the extrac-tion and delivery of fuels used to generate electricity.11
We estimated global warming emissions, PM emissions, and NOx emissions using models developed by Argonne Na-tional Laboratory and CARB. These models were used to esti-mate emissions from fuel production and vehicle operation. Upstream emissions were based on production methods spe-cific to fuels and electricity used in California.
The analysis used recent tests of fuel efficiency for three types of New Flyer’s Excelsior transit bus: powered by diesel, by natural gas, and by electricity.12 Appendix C provides further detail on the methods used to estimate vehicle emissions.
gloBAl WArmiNg EmissioNs
We compared global warming emissions of diesel, CNG, hy-drogen (H2) fuel cell electric, and battery electric buses. In the case of battery electric buses, we calculated emissions for a bus powered by both California’s existing electrical grid (2016 estimate) and a bus powered by a mix of 50 percent renewable energy and 50 percent natural gas power plants. The latter scenario represents a conservative estimate of Cali-fornia’s electric grid in 2030, which includes the state’s target
of meeting 50 percent of electricity demand with renewable energy. California also has committed to not renewing any contracts for electricity generated out of state with coal (all contracts will expire by 2026), virtually eliminating coal-fired power plants serving California (CEC 2015).
Electricity consumed in California today comes from roughly 25 percent renewable energy, 8 percent large-scale hydropower, 10 percent nuclear power, 7 percent coal, and 50 percent natural gas. The recent announcement that Diablo Canyon (California’s only nuclear power plant) will shut down by 2025 is not expected to affect the amount of carbon- free power generation. The plant’s operator, Pacific Gas and Electric Company, made a commitment to replace the nuclear power with renewable energy, energy efficiency measures, and energy storage. The company also committed to a 55 per-cent renewable energy target by 2031 for its electricity re-sources, which is even higher than the state’s commitment of 50 percent by 2030 (PG&E 2016a).
Compared to diesel and CNG transit buses, both fuel cell and battery electric transit buses have lower life cycle global warming emissions (Figure 5, p. 16). While the global warming emissions of a CNG bus are 9 percent lower than those of a diesel bus, fuel cell buses (59 percent lower) and battery electric buses (74 percent lower) do even better. For a battery electric bus on a grid with 50 percent renewable energy and 50 percent natural gas power plants, global warming emissions are 80 percent lower than from today’s diesel bus.
The hydrogen fuel in the analysis includes 33 percent produced using renewable energy (as required by California law); the remainder is from steam reforming of methane. Cur-rent hydrogen production for vehicles in California exceeds this renewable requirement, using roughly 50 percent renew-able energy (Achtelik 2009; CARB 2015e).
loW CArBoN FuEls ANd gloBAl WArmiNg EmissioNs
While diesel and natural gas are produced almost entirely from fossil fuels, lower-carbon sources of these fuels are available. Carbon intensities depend on the fuels’ sources and processing.
Diesel can be produced from vegetable oil or animal fats and blended into conventional diesel (“biodiesel”). All diesel vehicles can use up to 5 percent biodiesel blends (B5), and some can use 20 percent blends (USDOE n.d.). Vegetable oils and animals fats can be subjected to additional processing to create a fuel that is essentially indistinguishable from conven-tional diesel; this type of fuel is referred to as “renewable diesel” (UCS n.d.).
Lower-carbon forms of natural gas (i.e., biomethane) can be generated by the decomposition of organic matter in the absence of oxygen. This occurs in landfills and purpose-made
A major benefit of battery and fuel cell EVs is that they have no tailpipe emissions.

16 union of concerned scientists | the greenlining institute
power plant (51 percent), losses in the transmission and distribution of electricity (6.5 percent), and vehicle efficien-cies (18.3 miles per gallon diesel equivalent [mpgde ] for a bat-tery electric bus and 4.5 mpgde for a CNG bus).
Just as there are lower-carbon forms of diesel and natu-ral gas, there are lower-carbon ways to generate electricity and hydrogen for battery and fuel cell buses. Many intermedi-ate scenarios could be used to compare technologies, but even in the best-case scenario (100 percent renewable diesel, 100 percent biomethane, or 100 percent renewable electric-ity), the pattern remains the same: battery and fuel cell elec-tric vehicles have lower emissions than diesel and natural gas vehicles. While lower-carbon diesel and natural gas fuels can lower life cycle emissions, their use in combustion-based en-gines will always generate some tailpipe emissions.
Battery and fuel cell electric vehicles are more efficient and have lower emissions than diesel and natural gas vehicles.
vessels (“anaerobic digesters”), both of which process organic material from sources such as wastewater and manure. Biomethane can be processed so it is interchangeable with fossil- based natural gas.
Life cycle global warming emissions from transit buses powered by low-carbon fuel blends are lower than those from vehicles powered by conventional (fossil-fuel-based) diesel and natural gas (Figure 6). The reductions in global warming emissions using lower-carbon fuels result from lower up-stream emissions.
A low-carbon diesel blend of 5 percent biodiesel and 20 percent renewable diesel results in a 14 percent reduction in global warming emissions compared with conventional diesel. A CNG bus using 25 percent landfill natural gas has emissions 21 percent lower than the diesel baseline.
A more efficient way of using landfill gas, however, is to use it in a power plant to generate electricity to power an electric bus. Using electricity from a power plant fueled by 25 percent landfill gas and 75 percent conventional natural gas (by energy content) results in life cycle global warming emissions of the bus that are nearly 70 percent lower than the diesel baseline.
A battery electric bus powered by electricity from a natural-gas power plant will also travel farther than a CNG bus on the same amount of natural gas. In fact, it will travel twice as far, accounting for the efficiency of a natural gas
Figure 5. Reducing Global Warming Emissions by Switching to Electric Buses
Life cycle global warming emissions from diesel and compressed natural gas (CNG) buses are far higher than those from fuel cell electric buses ( fueled by hydrogen, H2 ) or battery electric buses.Notes: Comparison based on emissions from 40-foot transit buses. CO2e stands for carbon dioxide equivalent.
Tailpipe
Fuel Production
0
500
1,000
1,500
2,000
2,500
3,000
CNGDiesel Fuel CellElectric
(hydrogen, 33% renewables)
Battery Electric(2016 CA
electricity mix)
Battery Electric(50% renewables/50% natural gas)
CO
2e
(g/m
i)

17Delivering Opportunity
resources have more than 80 percent reductions in NOx and PM compared with diesel buses.
While our analysis focused on nitrogen oxides and par-ticulate matter, other vehicle pollutants are also dangerous to breathe. For example, heavy-duty vehicles emit many types of volatile organic compounds (VOCs), which contribute to the distinct odors of a vehicle’s exhaust. VOCs are short-lived pol-lutants, making them difficult to measure but no less harmful to anyone breathing a vehicle’s exhaust. While ozone and par-ticulate matter can affect the air quality near and far from the tailpipe of a vehicle, the short-lived nature of VOCs concen-trates their effects on a more local level.
pArTiCulATE mATTEr ANd NiTrogEN oxidE EmissioNs
Both battery and fuel cell electric buses in California today emit less NOx and particulate matter than do diesel buses (Figure 7, p. 18). These emissions will decrease even further as the grid becomes cleaner. Almost all PM emissions from to-day’s electrical grid come from biomass and coal-fired power plants, even though these sources make up just 3 percent and 7 percent of California’s electricity supply, respectively. Power from coal comes almost entirely from out-of-state power plants and will be phased out of California’s electricity supply by 2026 (CEC 2016b).
CNG engines that emit fewer nitrogen oxides are ex-pected for release in 2016. Based on certification data for these “low-NOx” engines, the NOx emissions from CNG buses decrease from 36 percent to 51 percent below a diesel base-line. While one low-NOx engine has been certified to reduce PM emissions, tailpipe emissions account for just 4 percent of the life cycle PM emissions from traditional CNG transit buses. Because of this small contribution and the little data available, PM emissions from low-NOx engines were taken as equivalent to traditional CNG engines.
Fuel cell electric buses have more than 50 percent reduc-tions in NOx and PM compared to diesel buses. Battery elec-tric buses powered by 50 percent non-emitting renewable
Battery electric buses can have more than 80 percent reductions in NOx and PM compared with diesel buses, depending on the electricity mix used.
Figure 6. Buses Powered by Low-Carbon Fuel Blends Produce Fewer Global Warming Emissions
Global warming emissions from transit buses powered by low-carbon fuel blends are lower than those from vehicles powered by conventional fossil fuel–based diesel and natural gas.Note: CO2e stands for carbon dioxide equivalent.
CO
2e (g
/mi)
0
500
1,000
1,500
2,000
2,500
3,000
3,500
Diesel (5% biodiesel
20% renewable diesel)
Diesel
Diesel
Compressed Natural Gas
Compressed Natural Gas
CompressedNatural Gas
(25% landfill gas)
Electricity (2016 CA
electricity mix)
Electricity
Electricity(25% landfill gas/
75% natural gas)
Standard Tailpipe
Standard Fuel Production
Low-Carbon Tailpipe
Low-Carbon Fuel Production

18 union of concerned scientists | the greenlining institute
The high on-road time of fleet vehicles compared with passenger vehicles also means that the fuel and maintenance savings of electrification accrue much faster. Over the life of a vehicle, these savings can offset higher upfront costs and make an electric vehicle cheaper than a traditional diesel or natural
The Technology and Business Case for Electric Trucks and Buses
Electric drivetrains are no longer an option just for passenger vehicles. All-electric battery and fuel cell technologies can already be found in several types of trucks, buses, and off-road vehicles (e.g., forklifts and airport ground equipment).
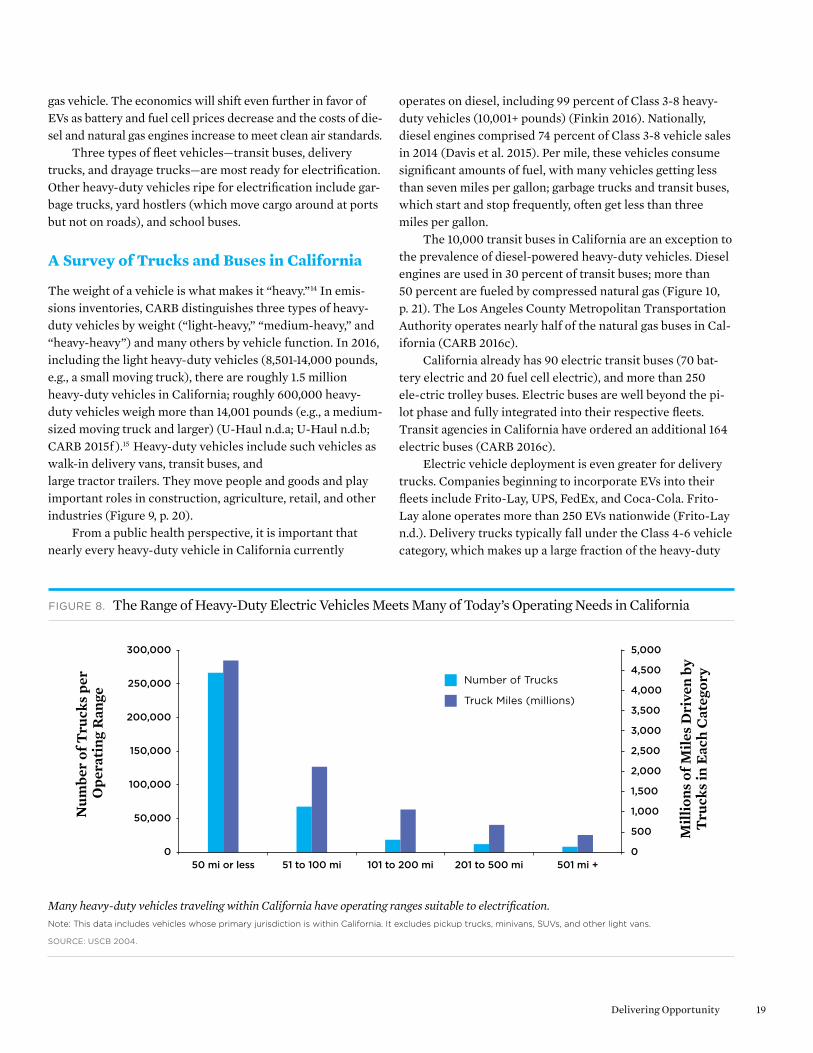
It has long been known that many heavy-duty vehicles drive short urban routes with frequent stopping (USCB 2004).13 These vehicles are well suited to electrification. In California, more than two-thirds of all heavy-duty trucks op-erating in the state have a range (maximum trip distance) of less than 100 miles; more than half have an operating range of less than 50 miles (Figure 8). These distances are well within the range of existing heavy-duty electric vehicles on a single charge or tank of hydrogen. Depending on how a vehicle’s daily driving distance matches with the range of the battery, the EV may need to be charged throughout the day.
Especially well-suited for EVs are fleet vehicles oper- ating on defined routes with predictable stops and housed at central depot locations where vehicles can be recharged. Compared with passenger cars, charging and refueling infrastructure in EV fleets can be concentrated at depots or at strategic on-road locations.
Figure 7. Reducing Particulate Matter and Nitrogen Oxide Emissions by Switching to Electric Buses
Life cycle emissions of particulate matter (PM) and nitrogen oxides (NOx ) for battery electric, fuel cell electric, and compressed natural gas transit buses are low relative to a diesel bus. Notes: PM2.5 emissions refer to particles with diameters 2.5 micrometers and smaller. Comparison based on emissions from 40-foot transit buses.
Battery Electric(50% renewables/50% natural gas)
Battery Electric(2016 CA electricity mix)
Fuel Cell Electric(hydrogen, 33% renewables)
Low-NOx CNG
CNG
PM2.5
NOX
0-10%-20%-30%-40%-50%-60%-70%-80%-90%-100%
Emissions Decrease
Box 3.
At a Glance: Batteries and Fuel Cells, Not Batteries versus Fuel CellsBoth batteries and fuel cells can power electric trucks and buses. Batteries use compounds of lithium and/or graphite to produce electricity, while fuel cells use hydrogen and oxygen gases. Both types of EV have zero tailpipe emissions and are more energy efficient than diesel or natural gas heavy-duty vehicles. Fuel cell electric trucks and buses offer longer ranges and shorter fueling times than do battery EVs. Heavy-duty fuel cell vehicles have been deployed primarily in urban bus applications, but vehicle demonstrations have used fuel cells to extend the range of battery electric trucks.
19Delivering Opportunity
operates on diesel, including 99 percent of Class 3-8 heavy- duty vehicles (10,001+ pounds) (Finkin 2016). Nationally, diesel engines comprised 74 percent of Class 3-8 vehicle sales in 2014 (Davis et al. 2015). Per mile, these vehicles consume significant amounts of fuel, with many vehicles getting less than seven miles per gallon; garbage trucks and transit buses, which start and stop frequently, often get less than three miles per gallon.
The 10,000 transit buses in California are an exception to the prevalence of diesel-powered heavy-duty vehicles. Diesel engines are used in 30 percent of transit buses; more than 50 percent are fueled by compressed natural gas (Figure 10, p. 21). The Los Angeles County Metropolitan Transportation Authority operates nearly half of the natural gas buses in Cal-ifornia (CARB 2016c).
California already has 90 electric transit buses (70 bat-tery electric and 20 fuel cell electric), and more than 250 ele-ctric trolley buses. Electric buses are well beyond the pi-lot phase and fully integrated into their respective fleets. Transit agencies in California have ordered an additional 164 electric buses (CARB 2016c).
Electric vehicle deployment is even greater for delivery trucks. Companies beginning to incorporate EVs into their fleets include Frito-Lay, UPS, FedEx, and Coca-Cola. Frito- Lay alone operates more than 250 EVs nationwide (Frito-Lay n.d.). Delivery trucks typically fall under the Class 4-6 vehicle category, which makes up a large fraction of the heavy-duty
gas vehicle. The economics will shift even further in favor of EVs as battery and fuel cell prices decrease and the costs of die-sel and natural gas engines increase to meet clean air standards.
Three types of fleet vehicles—transit buses, delivery trucks, and drayage trucks—are most ready for electrification. Other heavy-duty vehicles ripe for electrification include gar-bage trucks, yard hostlers (which move cargo around at ports but not on roads), and school buses.
A Survey of Trucks and Buses in California
The weight of a vehicle is what makes it “heavy.”14 In emis-sions inventories, CARB distinguishes three types of heavy-duty vehicles by weight (“light-heavy,” “medium-heavy,” and “heavy-heavy”) and many others by vehicle function. In 2016, including the light heavy-duty vehicles (8,501-14,000 pounds, e.g., a small moving truck), there are roughly 1.5 million heavy-duty vehicles in California; roughly 600,000 heavy-duty vehicles weigh more than 14,001 pounds (e.g., a medium-sized moving truck and larger) (U-Haul n.d.a; U-Haul n.d.b; CARB 2015f ).15 Heavy-duty vehicles include such vehicles as walk-in delivery vans, transit buses, and large tractor trailers. They move people and goods and play important roles in construction, agriculture, retail, and other industries (Figure 9, p. 20).
From a public health perspective, it is important that nearly every heavy-duty vehicle in California currently
Figure 8. The Range of Heavy-Duty Electric Vehicles Meets Many of Today’s Operating Needs in California
Many heavy-duty vehicles traveling within California have operating ranges suitable to electrification.Note: This data includes vehicles whose primary jurisdiction is within California. It excludes pickup trucks, minivans, SUVs, and other light vans.
Source: uScB 2004.
Number of Trucks
Truck Miles (millions)
Num
ber
of T
ruck
s pe
r O
pera
ting
Ran
ge
Mill
ions
of M
iles
Dri
ven
byT
ruck
s in
Eac
h C
ateg
ory
0
50,000
100,000
150,000
200,000
250,000
0
500
1,000
1,500
2,000
2,500
3,000
3,500
4,000
4,500
5,000300,000
51 to 100 mi50 mi or less 101 to 200 mi 201 to 500 mi 501 mi +

20 union of concerned scientists | the greenlining institute
federal American Reinvestment and Recovery Act; the others have benefitted from California’s ongoing Hybrid and Zero- Emission Truck and Bus Voucher Incentive Project (HVIP). Businesses with delivery trucks have also shown the greatest
vehicles in California, with more than 150,000 vehicles. Since 2010, more than eight companies in California have deployed more than 400 electric delivery trucks. About half of these truck purchases benefitted from incentive funding from the
Drayage trucks take cargo containers to and from ports or rail-roads. If you’ve ever been on a freeway in Los Angeles or Oakland, you’ve probably seen a drayage truck but not noticed it. They look a lot like other 18-wheeled big rigs except for the cargo container they carry. Containers transported by drayage trucks have noticeable ribs on the sides; trailers on long-haul semi-trucks have smooth sides. The corrugated steel increases the container’s strength, which is good for stacking them on ships and trains, but it increases the drag, which is one reason long-haul trucks do not use these containers. Another reason is that the standard size of containers on trains and ships is 20 feet and 40 feet, which is shorter than the standard 53-foot trailers allowed for use by long-haul trucks.
Box 4.
At a Glance: What Is a Drayage Truck?
Drayage trucks haul cargo containers made of corrugated steel to and from ports and railroads.
Figure 9. Low Efficiencies Are Common to Today’s Heavy-Duty Diesel and Natural Gas Vehicles
There are more than 600,000 heavy-duty vehicles in California weighing 14,001 pounds or more. With low fuel efficiencies, these vehicles greatly contribute to fossil fuel consumption and emissions. Class 8 vehicles include semi-trucks and dump trucks; Class 4-6 vehicles include single-unit trucks and walk-in vans. Weights listed are in gross vehicle weight rating, the maximum weight at which the fully loaded vehicle is rated to operate.Source: cArB 2015F.
Vehicle Population
Vehicle Fuel E�ciency
Veh
icle
Pop
ulat
ion
Veh
icle
E�
cien
cy (m
pg)
0
20,000
40,000
60,000
80,000
100,000
120,000
140,000
160,000
0
5
10
15
20
25
30180,000
Class 4-6(14,001–
26,000 lbs)
Class 8(33,000 lbs+)
Buses(transit, school,other)
Class 7(26,001–
33,000 lbs)
Construction Publicand utility
Drayage Agricultural Trash
Joseph Madde/C
reative Com
mons (W
ikimedia C
omm
ons)

21Delivering Opportunity
(AAPA 2015). The roughly 20,000 drayage trucks in Califor-nia are a significant source of emissions, especially in commu-nities surrounding these ports. In 2016, CARB announced funding for the demonstration of nearly 40 battery electric drayage trucks in California ports. This project follows a demonstration project by South Coast Air Quality Manage-ment District of six battery electric drayage trucks at the ports of Los Angeles and Long Beach.
Unlike other types of heavy-duty vehicles, which are predominantly powered by diesel, compressed natural gas powers a majority of transit buses in California.Source: cArB 2016c.
Figure 10. Transit Buses in California Are an Exception to the Prevalence of Diesel-Powered Heavy-Duty Vehicles
CNG (all other)
CNG (LA Metro)
Diesel
Diesel or Gasoline Hybrid Electric
LNG or Propane
Electric Trolley
Battery or Fuel Cell Electric
3%
8%
30%
26%
30%
1%3%
interest in these investment opportunities. Top recipients of HVIP funding are the buyers of zero-emission and hybrid trucks for delivering parcels, beverages, linen, and food (CARB 2016e; Murano 2016).
Drayage trucks are a third category of heavy-duty vehicle well-suited for electrification. These trucks operate primarily near the ports of Los Angeles, Long Beach, and Oakland, the nation’s first, second, and ninth busiest cargo ports in 2015
© M
otiv
Companies with delivery trucks have shown great interest in electric heavy-duty vehicles to lower fuel and maintenance costs.

22 union of concerned scientists | the greenlining institute
(Left) The map and table show the locations of transit agencies operating zero-emission battery and fuel cell electric buses. The number of buses listed includes buses on order. (Right) The map shows the locations of electric truck and bus manufacturers in California. Several man-ufactures operate at more than one location.SourceS: cArB 2016c; cALSTArT 2015.
Figure 11. California’s Heavy-Duty EV Market Is Large and Growing
Transit Agencies Manufacturers
Transit Agency Number of Buses
1 County Connection 4 Battery
2 San Joaquin RTD 17 Battery
3 Porterville Transit 2 Battery
4 Antelope Valley Transit 85 Battery
5 Foothill Transit 31 Battery
6 SunLine Transit 6 Battery, 11 Fuel Cell
7Anaheim Resort Transportation
4 Battery
8Orange County Transportation Authority
1 Fuel Cell
9 Anteater Express (UC Irvine) 1 Fuel Cell
10 Long Beach Transit 10 Battery
11 Gtrans (City of Gardena) 6 Battery
12 Los Angeles County MTA 10 Battery
13 Santa Barbara MTD 20 Battery
14 Monterey-Salinas Transit 2 Battery
15 Stanford University 23 Battery
16Alameda-Contra Costa Transit District
5 Battery, 14 Fuel Cell
17 SolTrans 2 Battery
Manufacturer Product
1 Wrightspeed Electric powertrains
2 First Priority GreenFleetElectric trucks and vans
3 Efficient Drivetrains Inc. Electric powertrains
4 eBus Electric transit buses
5 BYDElectric trucks and buses
6 Phoenix Motorcars Electric shuttle buses
7 ElDorado National-CaliforniaFuel cell electric transit buses
8 Complete Coach Works Electric transit buses
9 TranspowerElectric trucks and buses
10 Zerotruck Electric trucks
11 US Hybrid Electric powertrains
12 Artisan Vehicle Systems Electric powertrains
13 Motiv Power Systems Electric powertrains
14 Proterra Electric transit buses

23Delivering Opportunity
not include companies in the supply-chain of EV manufactur-ing, such as Molded Fiber Glass in Adelanto, California, which makes lightweight fiberglass bodies for electric transit buses.
Performance Metrics: Transit Buses Show That Electric Vehicles Fit the Bill
Much of what we know about the performance of heavy-duty electric vehicles comes from experience with transit buses. These vehicles have reached full commercialization largely because transit agencies were early participants in EV pilot projects. In fact, two California transit agencies have commit-ted to fully electrifying their fleets (see Box 5, p. 24).
To compare electric, natural gas, and diesel buses, we examined one model of a bus that has been made with differ-ent propulsion systems. New Flyer’s Excelsior 40-foot bus provided the opportunity for this case study (Figure 12, p. 25).
Metrics for evaluating any vehicle include on-road per-formance, efficiency, range, charging time, and cost, including the costs of fuel, infrastructure, and maintenance. The perfor-mance of the different versions of the Excelsior bus was mea-sured at the Federal Transit Administration’s Bus Testing Program at the Altoona Bus Research and Testing Center. This facility provides consistent conditions and test protocols for transit operators to compare the performance of buses.
Electric drayage trucks are at an earlier stage of develop-ment than are transit buses and delivery trucks, but advances in battery technology and vehicle range have made EVs in-creasingly suited for drayage applications. Already, electric drayage trucks have exceeded the expectations drivers have for torque (1,200-1,800 foot-pounds) and horsepower (400 hp).16
In a recent survey, drayage truck operators in Southern California reported that nearly 75 percent of typical trips are 60 miles or shorter, well within the range of current battery electric drayage trucks. However, the same survey found that most operators expect to have a vehicle capable of serving much longer routes and traveling more than 200 miles be-tween refueling. Even if it is not common to drive long routes, operators expect to have vehicles capable of doing so because they have little say over which routes they drive (Papson and Ippoliti 2013). These cases are well-suited for battery-fuel cell hybrid electric trucks, which are capable of 200-mile ranges (Impullitti 2015). Larger fleets that own their trucks could manage routes, duty cycles, and charging needs more easily than independent owner/operators.
mANuFACTuriNg ElECTriC VEHiClEs iN CAliForNiA
Facilitating the growth of electric heavy-duty vehicles is the growing number of EV manufacturers. California is home to nearly 15 electric bus and truck manufacturers, located in both Northern and Southern California, making the state an early leader in the production and adoption of these technol-ogies (Figure 11). These businesses make both electric drive-trains (a vehicle’s propulsion system) and fully assembled EVs, including delivery trucks, semi-trucks, and transit buses. The manufacturers range from established companies that are entering the EV market to startups focusing solely on EV technologies.
The recent announcement that Tesla Motors intends to sell electric semi-trucks and electric buses adds another California-based company to the list of zero-emission truck and bus makers (Musk 2016). It is also a company with sig-nificant expertise in EVs, being one of the top sellers of elec-tric passenger vehicles. The list of manufacturers here does
Advances in battery technology and vehicle range have made EVs increasingly suited for drayage applications.
© BY
D
In addition to being better for our health and environment, electric buses are also far more efficient and quieter than diesel and natural gas buses. With electricity prices being more stable than diesel, they stand to be cheaper to run as well.

24 union of concerned scientists | the greenlining institute
vehicle or ride in one. Vehicle noise is not just a nuisance; evidence suggests that it is associated with increased risks of heart disease (Sørensen et al. 2012), depression (Orban et al. 2016), and type 2 diabetes (Sørensen 2013), thought to be from increased stress hormones generated by loud sounds. Like pollution, noise from heavy-duty vehicles disproportion-ately affects workers and communities where heavy-duty vehicles operate.
ACCElErATioN, grAdEABiliTy, ANd TorquE
Electric buses are comparable to if not better than combus-tion technologies in three important measures of on-road performance: acceleration times, gradeability, and torque.
Gradeability refers to the maximum grade a vehicle can climb at a given speed. As with acceleration, different routes necessitate different amounts of gradeability. Gradeability is particularly important for Southern California drayage trucks, which traverse 6.5 percent graded inclines going over bridges near the ports of Long Beach and Los Angeles.
Another important on-road metric for drayage trucks is torque, which is a measure of a vehicle’s ability to move from a standstill. Electric drayage trucks have torques of more than 2,000 foot-pounds, which is higher than the 1,200 to 1,800 foot- pounds of traditional diesel engines (Papson and Ippoliti 2013; BYD n.d.).
rANgE ANd CHArgiNg TimEs
The range of electric vehicles increases with nearly every model introduced. Battery electric buses recently achieved ranges of 350 miles per charge (Proterra 2016), while fuel cell buses have long exceeded 200 miles (Eudy, Post, and Gi-kakis 2015).
A vehicle is not limited to a single charge, however. On-route charging can significantly increase the miles driven by an electric vehicle and transit agencies use it to meet the mileage demands of their routes with electric vehicles, in-cluding in cold temperatures, which reduce the range of EVs due largely to the energy needed to heat the inside of the ve-hicle (Reichmuth 2016). By incorporating on-route charging, an electric bus operating in cold temperatures in Winnipeg, Canada, provided service for more than 125 miles during
FuEl ECoNomy
Fuel economy describes how far a bus can travel on a given amount of energy. Electric vehicles are significantly more efficient than natural gas and diesel vehicles—four times as efficient in the case of New Flyer’s Excelsior bus. Other elec-tric buses have similarly high efficiencies, and other diesel and natural vehicles have similarly low efficiencies.
Of all the categories for comparing vehicles, efficiency shows the most substantial differences between electric and traditional vehicles. This is due to the laws of thermodynam-ics: natural gas and diesel engines generate heat during com-bustion, and heat represents wasted energy that is not converted into mechanical energy to propel the vehicle.
NoisE
Electric transit buses are much quieter than diesel or natural gas vehicles. This is obvious if you stand next to an electric
Box 5.
At a Glance: 100 Percent Electric TransitTwo California transit agencies have committed to completely electric fleets, evidence that communities both large and small can deploy electric buses.
East of the San Gabriel Mountains in the Mojave Desert, the Antelope Valley Transit Agency (AVTA) has committed to having its 85-bus fleet all-electric by the end of 2018. This would make AVTA the first entirely electric transit authority in the United States.
AVTA will deploy 17 wireless charging stations along bus routes, enabling its electric buses to remain in service as long as its current diesel buses. With wireless chargers, electric buses drive under overhead charging units or over charging pads embedded in the ground. AVTA will even use electric buses for long-range commuter routes to downtown Los Angeles, 75 miles away. As a high-desert area, Antelope Valley experiences temperatures near freezing in the winter and more than 100 degrees Fahrenheit in the summer, demonstrating the diverse conditions in which EVs can operate (AVTA n.d.).
Foothill Transit, serving the greater Los Angeles area in the San Gabriel and Pomona valleys, has 17 electric buses in service and has committed to being 100 percent electric by 2030 (Foothill n.d.a). Foothill annually provides 14 million rides on 39 routes. With more than 300 buses, it is California’s eighth largest transit agency (Foothill n.d.b).
Electric vehicles are significantly more efficient than natural gas and diesel vehicles.
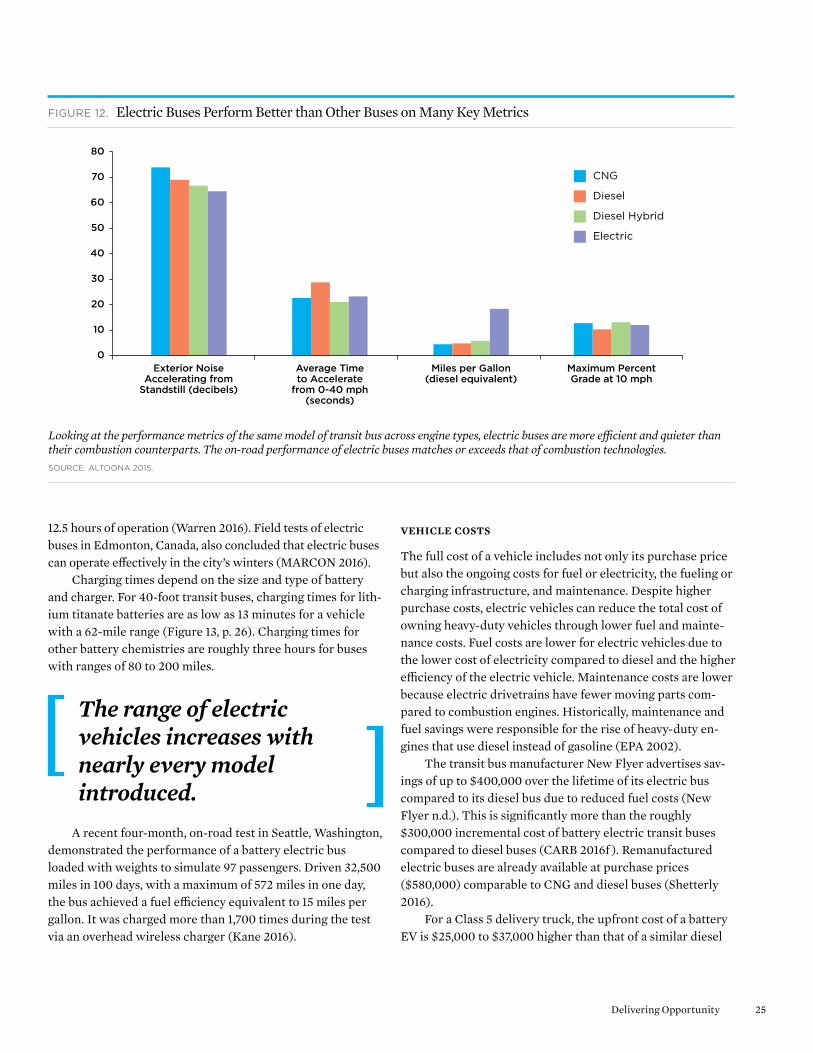
25Delivering Opportunity
12.5 hours of operation (Warren 2016). Field tests of electric buses in Edmonton, Canada, also concluded that electric buses can operate effectively in the city’s winters (MARCON 2016).
Charging times depend on the size and type of battery and charger. For 40-foot transit buses, charging times for lith-ium titanate batteries are as low as 13 minutes for a vehicle with a 62-mile range (Figure 13, p. 26). Charging times for other battery chemistries are roughly three hours for buses with ranges of 80 to 200 miles.
A recent four-month, on-road test in Seattle, Washington, demonstrated the performance of a battery electric bus loaded with weights to simulate 97 passengers. Driven 32,500 miles in 100 days, with a maximum of 572 miles in one day, the bus achieved a fuel efficiency equivalent to 15 miles per gallon. It was charged more than 1,700 times during the test via an overhead wireless charger (Kane 2016).
VEHiClE CosTs
The full cost of a vehicle includes not only its purchase price but also the ongoing costs for fuel or electricity, the fueling or charging infrastructure, and maintenance. Despite higher purchase costs, electric vehicles can reduce the total cost of owning heavy-duty vehicles through lower fuel and mainte-nance costs. Fuel costs are lower for electric vehicles due to the lower cost of electricity compared to diesel and the higher efficiency of the electric vehicle. Maintenance costs are lower because electric drivetrains have fewer moving parts com-pared to combustion engines. Historically, maintenance and fuel savings were responsible for the rise of heavy-duty en-gines that use diesel instead of gasoline (EPA 2002).
The transit bus manufacturer New Flyer advertises sav-ings of up to $400,000 over the lifetime of its electric bus compared to its diesel bus due to reduced fuel costs (New Flyer n.d.). This is significantly more than the roughly $300,000 incremental cost of battery electric transit buses compared to diesel buses (CARB 2016f ). Remanufactured electric buses are already available at purchase prices ($580,000) comparable to CNG and diesel buses (Shetterly 2016).
For a Class 5 delivery truck, the upfront cost of a battery EV is $25,000 to $37,000 higher than that of a similar diesel
Figure 12. Electric Buses Perform Better than Other Buses on Many Key Metrics
Looking at the performance metrics of the same model of transit bus across engine types, electric buses are more efficient and quieter than their combustion counterparts. The on-road performance of electric buses matches or exceeds that of combustion technologies.Source: ALTooNA 2015.
0
10
20
30
40
50
60
70
80
Exterior NoiseAccelerating from
Standstill (decibels)
Average Timeto Accelerate
from 0-40 mph(seconds)
Miles per Gallon(diesel equivalent)
Maximum PercentGrade at 10 mph
CNG
Diesel
Diesel Hybrid
Electric
The range of electric vehicles increases with nearly every model introduced.

26 union of concerned scientists | the greenlining institute
The battery and fuel cell represent a large part of an EV’s upfront cost, and replacing them can be expensive. In re-sponse, several vehicle manufacturers offer lengthy warran-ties that cover the batteries. Also, fuel cell electric buses used in the Oakland area have far exceeded the expected vehicle durability (Eudy, Post, and Gikakis 2015).
ElECTriCiTy CosTs
Stable electricity rates contribute to consistent operating costs for electric truck and bus operators (Figure 14). Over the last 15 years, electricity prices have avoided the large swings that have characterized the price of petroleum fuels.
A challenge facing the operators of battery electric trucks and buses is the “demand charge” included in commercial
truck ($60,000 new). Comparatively, the upfront costs of vehi-cles with low-NOx CNG engines are estimated to be $15,000 to $20,000 higher than a comparable diesel truck. In all, the total cost of owning an electric delivery truck is estimated to be roughly 20 percent less than the cost of owning a diesel de-livery truck (with variations depending on such factors as whether routes are in a city or the suburbs). Maintenance sav-ings alone for electric delivery trucks have been estimated at $17,000 to $25,000 (Lee, Thomas, and Brown 2013).
As stronger emissions requirements push up the prices for diesel and natural gas vehicles, EV prices are dropping as batteries become cheaper and production volumes increase (Randall 2016). Over the last four years, one bus manufac-turer has increased the storage capacity of its batteries by more than 40 percent (from 200 amp/hour cells to 290 amp/hour cells), while the price of its buses has decreased more than20 percent ($980,000 to $770,000) (Kahn 2016).
Recognizing the lifetime savings of electric buses, some manufacturers sell electric buses at prices comparable to those of diesel and CNG, then offer lease programs for the batteries. This means transit agencies can make lease payments directly from fuel and maintenance savings (Kahn 2016).
Figure 13. Electric Bus Ranges Are Increasing While Charging and Refueling Times Are Decreasing
Electric transit buses travel from 60 miles to 350 miles on a single charge, and charging times vary from 10 minutes to five hours. All buses listed are 40 feet long except for BYD Motors’ 60-foot K11 bus.
Range per Charge (miles) Charging Time (hours)
)selim( egrah
C rep egnaR
)sruoh( emi
T gnigrahC
0
50
100
250
200
150
300
350
400
0
1.0
2.0
3.0
4.0
5.0
6.0
New Flyer (Xcelsior Electric)
Proterra(Catalyst Fast
Charge)
Complete Coach Works
(ZEPS)
BYD (eBus K9)
Proterra (CatalystExtendedRange)
BYD (eBus
K11 60')
Van HoolA330 FuelCell (ACTransit)
Proterra(Catalyst
E2)
EV prices are dropping as batteries become cheaper and production volumes increase.

27Delivering Opportunity
In 2016, CARB released a tool that transit bus operators can use to calculate the full cost to charge electric buses un-der various scenarios that include demand charges and time-of-use charges (CARB 2016g). For both on-road charging using fast-chargers and depot charging using slow-chargers, this calculator shows that electricity costs are between diesel prices and natural gas prices under a variety of charging scenarios.
In California, electric truck and bus fleets can lower fuel costs further by taking advantage of credits under the Low Carbon Fuel Standard (LCFS). Truck and bus fleets that use fuels with lower global warming emissions than diesel can earn credits and sell them to companies producing fuels with high global warming emissions. At LCFS credit prices of $100 per ton of carbon dioxide equivalent, a typical transit bus traveling 40,000 miles per year can earn more than $9,000 in credits (Yuan 2016).
CHArgiNg iNFrAsTruCTurE
As with batteries, the price of charging equipment is decreas-ing but remains a factor in the total cost of a battery electric vehicle. For example, four years ago, a 50-kilowatt wireless
electricity rates. For residential customers, electricity rates are based primarily on the total amount of electricity used over a month. For commercial facilities, electricity rates often include an additional “demand charge” related to the maxi-mum power consumed during a 15-minute interval for the month. This means that spikes in electricity demand can add significantly to the cost of vehicle charging and erode the sav-ings of electricity compared to other fuels.
The impact of demand charges can be most acute when fleets have a small number of electric vehicles and charging causes large, relative spikes in electricity demand (Figure 15, p. 28). With a larger number of vehicles, fleet owners can space out charging over a period of time, minimizing the spikes. Providing flexibility in utility rate structures for elec-tric truck and bus fleets could ease the impact of demand charges, especially for those just introducing EVs into their fleets (CALSTART 2015).
Commercial electricity users also pay different rates de-pending on the time of day, with lower rates during off-peak hours (e.g., after 6:00 p.m. for small and medium businesses) (PG&E 2016b). So-called “time-of-use” rates can also lower or raise the costs associated with heavy-duty electric vehicles.
Figure 14. Electricity Prices Have Avoided Large Price Swings
The costs to fuel transit buses are normalized to the cost per gallon of diesel for diesel, natural gas, and battery electric buses. Prices are based on California fuel and electricity prices and the efficiency of New Flyer’s diesel, natural gas, and electric buses.SourceS: eiA 2016A; eiA 2016B; eiA 2016c.
Dol
lars
per
Die
sel
Gal
lon
Equ
ival
ent
0.00
0.50
1.00
1.50
2.00
2.50
3.00
3.50
4.00
4.50
2001 2003 2005 2007 2009 2011 2013 2015
Diesel
Electricity
Natural Gas

28 union of concerned scientists | the greenlining institute
Recommendations for Action
Equitable clean air policies are a necessary and effective means for making California a healthy place to live. While much remains to be done, California’s air would be even dirt-ier without existing regulations, which have significantly re-duced nitrogen oxide and particulate matter emissions from combustion-based vehicles. The majority of reductions are due to regulatory standards, not voluntary measures, and they indicate that strong regulatory actions fuel market movement to clean vehicle technologies.
Electrification of heavy-duty trucks and buses can im-prove public health, especially in communities that bear the brunt of pollution, and it can slow the growth of global warm-ing emissions from goods movement. Achieving these benefits will require key policies to overcome barriers to deploying electric trucks and buses:
• Financialincentivescanhelpoffsettheincremental upfront capital and infrastructure costs associated with clean vehicle technologies, especially for small businesses.
• Smartutilitypoliciesandelectricity-rateoptionscanrec-ognize and promote the benefits of transportation elec-trification in managing a clean, reliable, renewable electricity grid and facilitate the transition to electric trucks and buses.
charger cost $350,000 ($7 per watt) or more. Today, 200-kilowatt chargers are available from multiple vendors for $400,000 ($2 per watt). In comparing the costs of differ-ent buses, some manufacturers include the cost of a charger (Kahn 2016). For battery EVs, fast-charging equipment is more expen sive than equipment for slow-charging.
In the future, operators and utilities may share electric truck and bus infrastructure costs. California’s privately owned utilities are in the process of implementing pilot pro-grams designed to promote the installation of charging infra-structure for light-duty EVs. These utility programs will result in thousands of additional charging units in various targeted locations, including multifamily housing where in-stallation has been more challenging. Similar programs for electric truck and bus charging infrastructure could help fa-cilitate the deployment of these vehicles.
Figure 15. Demand Charges Can Add Significantly to the Cost of an Electric Transit Bus
Total electricity costs per mile, including demand charges, decrease with the number of vehicles being charged and when demand charges are low at night.Source: cALSTArT 2015.
Usage Charges
Base Rate
0
0.2
0.4
0.6
0.8
1.0
1.2
CNGDiesel
$1.00
$0.57
$0.90
$0.42 $0.33 $0.29 $0.24
$0.25 $0.25 $0.25 $0.25 $0.25
Electric On-Route
(1 bus)
ElectricOn-Route
(4 bus)
ElectricOn-Route
(6 bus)
ElectricOn-Route
(8 bus)
ElectricOvernight
Fuel
Cos
t (do
llars
per
mile
)
Electrification of trucks and buses can im prove public health, especially in communities that bear the brunt of pollution.

29Delivering Opportunity
track record of effectively reducing transportation emis-sions through a combination of regulatory and incentive measures. A successful, equitable transition to zero- emission technologies in the heavy-duty truck and bus sector will require a similar approach, while placing a high priority on deploying these technologies in commu-nities most affected by poverty and pollution. Incentives provide important support for motivated fleets and man-ufacturers, but regulations are necessary to increase sales volumes and lower costs to accelerate the deployment of clean vehicles across the sector.
• Thestateshoulddevelopclean-vehiclestandardsforap-plications where zero-emission technologies are feasible, including transit buses, delivery trucks, and drayage trucks. The California Sustainable Freight Action Plan contains commitments by the Air Resources Board to move forward with regulatory measures on last-mile de-livery trucks but fails to commit to similar measures for drayage trucks. Given the impact of drayage trucks on communities and the recent investment of incentive dol-lars in demonstrating advanced technology drivetrains in heavy-duty, short-haul operations, California should move forward in developing regulations for zero-emission drayage trucks as well.
ElECTriCiTy rATEs
• Electricutilitypoliciesshouldcomplementzero- emission truck and bus deployment goals. The California Public Utilities Commission recently decided to support pilot projects by privately owned utilities; it should also compel utilities to invest in charging infrastructure for heavy-duty vehicles, especially in communities most af-fected by pollution from heavy-duty vehicles. Large-scale deployment and demonstration programs should proceed to show the economic benefits that EV deployment can have on fleets, ratepayers, and communities.
• Electricityratesshouldprovideflexibilityfordifferenttypes of fleets to facilitate the adoption of electric trucks and buses. Flexible rate structures that recognize unique fleet operating characteristics in addition to promoting grid-friendly charging behavior can facilitate the deploy-ment of battery electric technologies. However, current rate structures, with time-of-use and demand charges, can significantly increase the costs of owning electric trucks and buses, particularly as fleets initially have small numbers of vehicles over which to spread the costs.
• Electricityratesandinfrastructureinvestmentsshouldreflect the benefits that a high penetration of EVs brings to all ratepayers and the stability of the grid.
• Regulatorymeasurescandriveinvestments,increasevol-umes, reduce technology costs, and overcome business- as-usual practices so that clean heavy-duty vehicles be-come the norm, particularly in California’s most polluted communities.
• Resourcesforsmallbusinessesandfleetmanagerscanfacilitate the adoption of new vehicle technologies.
FiNANCiAl iNCENTiVEs
• Heavy-dutyvehiclesshouldbeahighpriorityforair-quality funding, with further priority for directing such funding at communities most affected by heavy- duty vehicles—including those near ports, rail yards, and warehouses. A recent California law (AB 1550) requiring 25 percent of funding from the Greenhouse Gas Reduc-tion Fund to be spent on projects within and benefitting disadvantaged communities is a step in this direction.
• Financialincentivesshouldbescaledbasedonseveralfactors, including the level of emission reductions achiev-able per vehicle, the long-term potential for widespread deployment within a specific heavy-duty application, and whether the vehicle will predominately operate in com-munities most affected by poverty and pollution.
• Consistent,long-termfundingisimportantformaximiz-ing private-sector investments and making steady prog-ress toward full commercialization of EV technologies. In a negative example, the California legislature severely underfunded heavy-duty vehicle investments in 2015, hindering the demonstration and deployments of clean freight technologies.17
• Cost-benefitanalysesforvehiclepurchasesshouldac-count for the total cost of vehicle ownership rather than just the upfront costs.
• State-fundedtransportationprojectsshouldpromotetruck and bus electrification and facilitate the deploy-ment of zero-emission trucks and buses—for example, by giving zero-emission vehicles access to priority lanes.
• CaliforniashouldextenditsLowCarbonFuelStandardto 2030. The extended standard should continue to drive investment in clean fuels—including electricity—and sup-port the Governor’s goal of cutting the state’s oil use in half by 2030.
rEgulATory mEAsurEs
• Regulationsshouldcomplementthestate’sfinancialin-vestments in clean vehicle technology. California has a
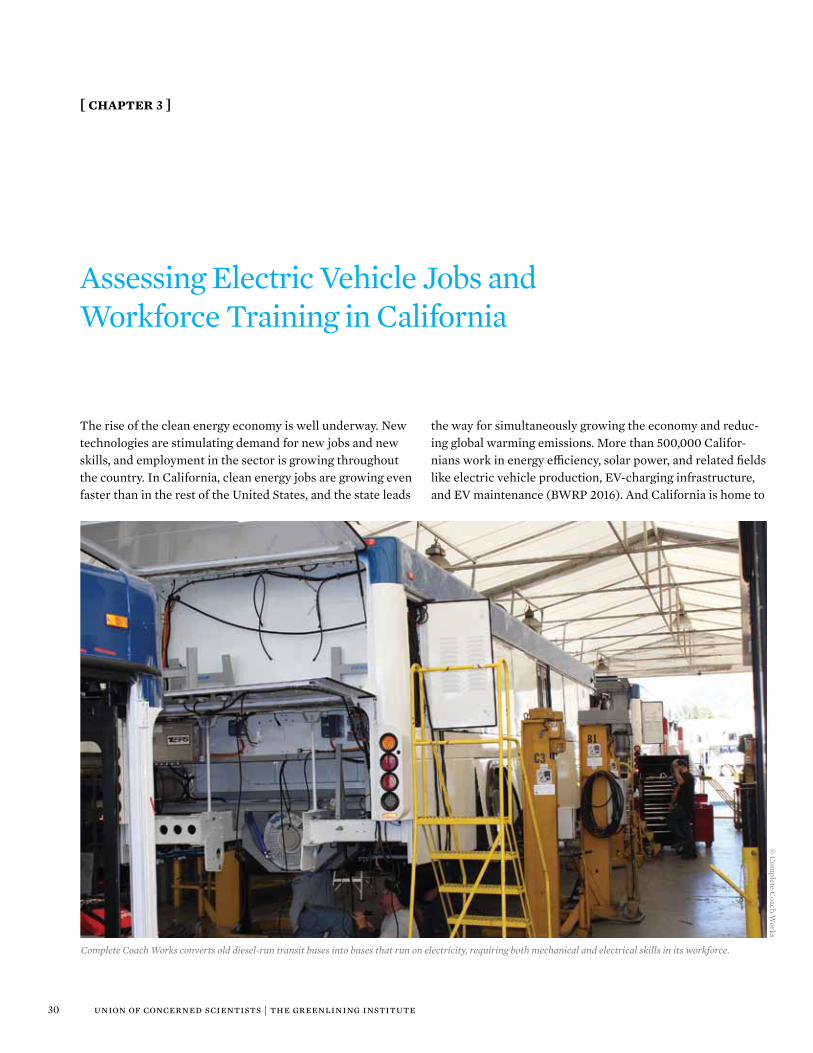
30 union of concerned scientists | the greenlining institute
The rise of the clean energy economy is well underway. New technologies are stimulating demand for new jobs and new skills, and employment in the sector is growing throughout the country. In California, clean energy jobs are growing even faster than in the rest of the United States, and the state leads
the way for simultaneously growing the economy and reduc-ing global warming emissions. More than 500,000 Califor-nians work in energy efficiency, solar power, and related fields like electric vehicle production, EV-charging infrastructure, and EV maintenance (BWRP 2016). And California is home to
Assessing Electric Vehicle Jobs and Workforce Training in California
[ chapter 3 ]
© C
omplete C
oach Works
Complete Coach Works converts old diesel-run transit buses into buses that run on electricity, requiring both mechanical and electrical skills in its workforce.

31Delivering Opportunity
• In2014,CaliforniaSenateBill1204createdtheCaliforniaClean Truck, Bus, and Off-Road Vehicle and Equipment Technology Program to fund zero-emission and near-zero- emission truck, bus, and off-road vehicle and equipment technologies and related projects.
• In2015,GovernorBrown’sExecutiveOrderB-32-15di-rected California to develop an integrated freight action plan by July 2016 (Brown 2015b). In spring 2016, the Sus-tainable Freight Action Plan, a multiagency effort result-ing from that order, committed the state to deploying 100,000 freight vehicles and equipment capable of zero- emission operation by 2030 (CSFAP 2016).
• TheCleanEnergyandPollutionReductionActof2015made it a principal goal of electric utilities in California to “improve the environment and to encourage the diver-sity of energy resources through improvements in energy efficiency, development of renewable energy resources, and widespread transportation electrification” (emphasis added) (Senate Bill 350).
• In2015,threeCaliforniatransitagenciesreceivedmorethan $7 million from the Federal Transit Administration’s Low and No-Emission Vehicle Deployment Program. The Los Angeles County Metropolitan Transit Agency received $4.28 million, Foothill Transit received $1.31 mil- lion, and the Alameda-Contra Costa Transit District re-ceived about $1.55 million (USDOT/FTA 2016).
• In2016,CARBisrefreshingtheAdvancedCleanTransitRule (a fleet rule for transit agencies), with the goal of transforming the statewide fleet of transit buses by 2040 by requiring renewable fuels and the cleanest available engines and phasing in purchases of zero-emission buses (CARB 2016b).
• Inspring2016,CARBannouncedthesinglelargestawardto deploy the largest number of zero-emission trucks servicing ports in the nation’s history—$23.6 million for 43 trucks, with a total investment of $40 million in the project (CALSTART 2016).
• TheCaliforniaEnergyCommission’s2016–2017Invest-ment Plan Update for the Alternative and Renewable Fuel and Vehicle Technology Program allocates $23 million to medium- and heavy-duty vehicle technology demonstra-tion projects to scale up deployment (CEC 2016a).
These policies and investments are expected to increase the number of transportation electrification jobs in heavy- duty EV manufacturing, the EV-charging infrastructure, and EV maintenance and repair (Hamilton 2011). With the right job-training and hiring efforts, truck and bus electrification
15 manufacturers of electric trucks and buses, including es-tablished companies and start-ups, and that number is grow-ing swiftly. All this gives the state an opportunity to build workforce pipelines that address racial and socioeconomic barriers by training and hiring the residents of underserved communities for jobs in the heavy-duty EV sector.
Based on interviews with heavy-duty EV industry repre-sentatives and Occupational Information Network (O*NET) data from the US Bureau of Labor Statistics, we identified as-semblers, electricians, and EV-service technicians as impor-tant occupations for opening up job opportunities in underserved communities. These emerging and new occupa-tions have great potential to grow, and they also can provide pathways to higher-paying, high-quality jobs.
However, our analysis shows that most occupations in heavy-duty EV fields are only moderately accessible to under-served communities because of the level of experience and preparation they require. Indeed, when we assessed jobs that pay workers above minimum wage, we consistently found an increasing need for workers with electrical skills and electrical-safety training throughout most occupations re-lated to the electrification of trucks and buses. This makes access to training crucial.
The transition to a clean energy economy from one based on fossil fuels inevitably means that some jobs will disappear and others will be created. The transition must be just and fair. Workers from underserved communities must have ac-cess to and training for new and emerging occupations, with career pathways out of poverty. This will require robust, tar-geted efforts to train, certify, and place underserved commu-nity workers in quality jobs in the clean energy economy.
Growth Potential in Truck and Bus Electrification and Related Jobs
In California’s clean energy economy, jobs connected with transportation electrification have great growth potential. In particular, occupations related to truck and bus electrification present a significant opportunity, and California has taken actions that signal a strong desire to expand the use of clean, heavy-duty EV technologies like trucks and transit buses:
The transition to a clean energy economy must be just and fair.

32 union of concerned scientists | the greenlining institute
findings, job types, wages and accessibility, projected growth, and job profiles (see Appendix A: Job Profiles at www.ucsusa.org/ElectricTrucks for more information).
The assessment has several limitations. First, it includes only lower-skilled occupations relevant to truck and bus elec-trification and does not assess more-skilled occupations, such as engineers and executives. Second, the interviewees from California-based electric truck and bus manufacturers pro-vided varying amounts of information for the manufacturing jobs assessment. Lastly, job projections are based on Bureau of Labor Statistics data, which look at occupation categories as a whole and not at specific sectors like EVs. The projections do not account for California policies, regulations, or investments intended to grow the electric truck and bus sector.
Goals of the Assessment
To create a diverse and equitable heavy-duty EV industry, we identified and assessed key occupations and skills needed to participate in this emerging sector. By identifying “bright outlook” jobs and skills and surveying current training efforts, stakeholders can create programs and policies that prepare members of underserved communities to meet the growing demand for skills related to transportation electrification.18
Toward that end, we had three goals:
• AssessjobsinEVmanufacturing,theEV-charginginfra-structure, and EV maintenance relevant to increased in-vestments in and demand for electric trucks and buses.
• Providerecommendationsforconnectingunderservedcommunities with career pathways related to truck and bus electrification.
• Identifyandhighlightworkforcetrainingresourcesthatcan help fill demand created by heavy-duty EVs.
Manufacturing Occupations 19
California heavy-duty EV manufacturing jobs are typically not unionized. No major electric truck and bus manufacturer in California has a unionized workforce. This stands in con-trast to much of conventional automotive manufacturing in the United States. For example, the United Automobile Work-ers represents autoworkers at the nation’s Big Three car man-ufacturers (Ford, General Motors, and Fiat Chrysler America) (Cutcher-Gershenfeld, Brooks, and Mulloy 2016). Nevertheless, a small sample of reports from California manufacturers in-dicates that these jobs pay decently; however, further re-search is needed.
can be a catalyst for boosting economic opportunity in under-served communities and helping overcome racial inequities in wealth and employment.
Methodology
We assessed three job categories, using information from the US Bureau of Labor Statistics and from interviews and ques-tionnaires with representatives of heavy-duty EV companies.
• The Manufacturing Jobs Assessment uses occupation and industry data from the O*NET database. O*NET de-scribes occupations through individual attributes that capture work organization, work environment, typical tasks and worker attributes, and the knowledge and skills required for a particular occupation. Because O*NET does not provide sector specific data (e.g., automotive manufacturing), we focused on occupations that would be relevant to manufacturing electric trucks and buses. To supplement these data and get a better sense of occu-pations in heavy-duty EV companies, we interviewed in-dustry representatives from Build Your Dreams Motors, Inc., Complete Coachworks, Gillig, Proterra, and Transpower.
• The EV-Charging Infrastructure and EV Maintenance Assessments relies primarily on O*NET data to assess wages and credentials of jobs related to the EV-charging infrastructure and EV maintenance and repair. We used available literature to identify the most relevant jobs.
• The Job-Training Resources Related to Transporta-tion Electrification uses available literature on job-training related to transportation electrification for information about programs and skills. We followed leads from state agencies, workforce development groups, and heavy-duty EV companies.
The assessments highlight occupations that have the most growth potential and can serve as steps on a pathway to higher-paying jobs and careers. Each assessment includes
Truck and bus electrification can be a catalyst for boosting economic opportunity in underserved communities.

33Delivering Opportunity
Box 6.
At a Glance: Electric Truck and Bus Manufacturing Jobs• Moderately accessible: Typically require a high school
diploma and may require some vocational training or work-related experience; an associate’s degree may be needed
• Non-union: Generally not unionized
Few job-training pipelines target underserved communi-ties. To ensure that the heavy-duty EV sector in California develops in a diverse, equitable way—and sooner rather than later—targeted job-training programs aimed at overcoming electrical-skill gaps in underserved communities must be cre-ated. Pipelines are necessary for sectors like heavy-duty EV manufacturing based on the need for trained and experienced workers to fill the growing workforce.
While our research uncovered few apprenticeship pro-grams that lead directly to heavy-duty EV manufacturing ca-reers, we found community colleges and other job-training organizations with established vocational programs in trans-portation electrification; these programs can provide path-ways to heavy-duty EV careers. Community colleges play a major role in training jobseekers to fill the skill needs of the heavy-duty EV sector and will continue to be important part-ners for heavy-duty manufacturers. Training programs can
Similar to conventional automotive manufacturing, many occupations in heavy-duty EV manufacturing have an in-creased need for electrical skills, depending on the compo-nents and technology being assembled, prompting a shift away from mechanical skills and toward electrical skills and safety. One interviewee noted a trend in heavy-duty EV man-ufacturing toward electrifying all components of trucks and buses because of the savings associated with maintaining electric components. For example, air brakes on buses require more maintenance than do electric brakes. As a result, conventional brake assemblers will need to acquire wire-harnessing skills and electrical-safety training if they become responsible for assembling electrical parts and com-ponents. This raises the barrier to entry for low-skilled work-ers without electrical skills, indicating a need for robust, targeted job training to ensure that workers from under-served communities are not left behind.
Industry representatives unanimously reported that “assembler” is the occupation likely to grow the most with increased investment in and adoption of electric trucks and buses. This growth potential, coupled with potential pathways into higher-paid, higher-skilled occupations, means that assembler jobs can play an important role in fostering economic opportunity in underserved communities.
Box 7.
Distinguishing General and Heavy-Duty Electric Vehicle AssemblyGeneral Assemblers
• Assemblebothfinishedproductsandthepartsthatgointo them, using tools, machines, and their hands to make engines, generators, and other parts
• Conductquality-controlchecks• Requirelittletonotraining;typicallyrequireahigh
school diploma• Donotrequirecertificationbutmustdemonstrate
professionalism• MedianpayinCalifornia:$12.60–$14.37perhour
Heavy-Duty EV Assemblers
• Sometimescalledmechanicalorelectricalassociates(Proterra n.d.)
• Mustbeabletoworkwithnewtechnologies;sometimesmust be able to build electrical wire harnesses and solve wiring problems (Proterra n.d.)
• Dependingonthestageofassembly,mustbeabletosafely handle high-voltage electrical components
• Onetothreeyearsofrelatedexperiencemaybepreferred• Mayrequireelectriciancertificationformoreadvanced
assembly and testing • Payof$13–$20perhourreportedbytwoemployers
Many occupations in heavy-duty EV manufacturing have an increased need for electrical skills.

34 union of concerned scientists | the greenlining institute
The stages of production—and the jobs involved—can vary. For example, Complete Coach Works in Riverside, California, remanufactures old transit buses and converts them to cleaner fuels like electricity (CCW n.d.). The reman-ufacturing process begins by stripping down the old bus to its frame before rebuilding it with clean fuel technology. Because this process includes stripping down conventional buses and converting them, Complete Coach Works values production workers who have both mechanical and electrical skills.
Overall, heavy-duty EV manufacturing jobs in California require higher skills than do general manufacturing jobs
expose young adults from underserved communities to career opportunities in EV manufacturing, engineering, and other careers in clean energy technology.
TypEs oF JoBs
Occupations associated with heavy-duty EV manufacturing include helpers, assemblers, testers, and welders.
There are many stages to building a heavy-duty electric vehicle. For example, Build Your Dream Motors, Inc. (BYD), an electric truck and bus company with facilities in Lancaster, California, custom-builds transit buses from the ground up (Field 2015). Starting with a few base models, customers choose among options in such areas as passenger capacity, electric range, and color. Typically, BYD begins its production process by welding a steel frame, then attaching aluminum sides and framing it all with fiberglass and windows. After this, the bus is wired and fitted with interior panels and insu-lation and then it goes to the paint booth. (Some companies surveyed do painting in house; others outsource it.) At this stage, BYD buses go on an assembly line for adding the batter-ies and drive components. The buses are tested after they are fully assembled.
© BY
D
Employment opportunities in electric bus and truck manufacturing cover a variety of skills and tasks.
Occupations associated with heavy-duty EV manufacturing include helpers, assemblers, testers, and welders.

35Delivering Opportunity
There are indications that heavy-duty EV manufacturing jobs tend to pay decent wages. The lowest-skilled jobs in man-ufacturing, based on O*NET data and interviews with industry representatives, are helpers, painters, assemblers, and testers.
because of the increased needs in areas like electrical wiring and electrical safety. However, conventional automotive man-ufacturing also requires mid-level skills and has become in-creasingly high-tech in recent years.
TABLe 1. Occupations Associated with Electric Truck and Bus Manufacturing
Occupation Job Description
Electrical and Electronic Equipment Assemblers
Assemble or modify electrical or electronic equipment, such as computers, test equipment telemetering systems, electric motors, and batteries
Team Assemblers Work as part of a team that is responsible for assembling an entire product or component of a product
Should be able to perform all tasks conducted by the team in the assembly process and rotate through all or most of them rather than being assigned to a specific task on a permanent basis
May participate in making management decisions affecting the work
Includes team leaders who work as part of the team
When there are more electrical components, more likely to require wire harnessing skills like assembly of electrical wires, connectors, and other parts
Electromechanical Equipment Assemblers
Assemble or modify electromechanical equipment or devices, such as servomechanisms, gyros, dynamometers, magnetic drums, tape drives, brakes, control linkage, actuators, and appliances
Inspectors, Testers, Sorters, Samplers, and Weighers
Inspect, test, sort, sample, or weigh raw materials or processed, machined, fabricated, or assembled parts or products for defects, wear, and deviations from specifications
May use precision measuring instruments and complex test equipment
For heavy-duty EVs, may require electrical skills to commission the electric truck or bus and verify its functionality
Helpers/Production Workers
Help production workers by performing duties requiring less skill
Supply or hold materials or tools, clean work area and equipment, and similar tasks
Welders, Fabricators, Cutters, and Welder Fitters
Use hand-welding or flame-cutting equipment to weld or join metal components or to fill holes, indentations, or seams of fabricated metal products
Machinists Set up and operate a variety of machine tools to produce precision parts and instruments
Includes precision instrument makers who fabricate, modify, or repair mechanical instruments
May also fabricate and modify parts to make or repair machine tools or maintain industrial machines, applying knowledge of mechanics, mathematics, metal properties, layout, and machining procedures
Computer-Controlled Machine Tool Operators, Metal and Plastic
Operate computer-controlled machines or robots to perform one or more machine functions on metal or plastic work pieces
Manufacturing Production Technicians
Set up, test, and adjust manufacturing machinery or equipment, using any combination of electrical, electronic, mechanical, hydraulic, pneumatic, or computer technologies
Painters Operate or tend painting machines to paint surfaces of transportation equipment, such as automobiles, buses, trucks, trains, boats, and airplanes
Includes painters in auto-body repair facilities
SourceS: uSdoL/eTA 2016A-i; uSdoL/eTA 2016N.

36 union of concerned scientists | the greenlining institute
Table 1 (p. 35) lists a sample of manufacturing occupations rel-evant to heavy-duty EV production and their job descriptions.
WAgEs ANd ACCEssiBiliTy
Entry-level manufacturing jobs in California pay more than the state’s minimum wage, $10 per hour. For example, median hourly wages for lower-skilled jobs (e.g., helpers, assemblers, painters, testers/inspectors) range from $10.96 per hour to $17.64 per hour (USDOL/ETA 2016a-f ). Some higher-skilled manufacturing jobs have even higher average hourly wages—for example, $17.70 for computer-controlled machine tool op-erators, $18.44 for welders, and $18.77 for machinists (USDOL/ETA 2016g-i).
Two interviewees from heavy-duty EV companies re-ported offering relatively high hourly wages for new assem-blers, with starting wages ranging from $13 to $20 per hour.
One interviewee reported that their assemblers also receive benefits, stock options, and a 401(k) with company match. This indicates that wage standards in the California heavy-duty EV sector might be higher than for manufacturing in general. The benefits and stock options offered by one of the companies is a promising finding. More data are required on the starting wages and benefits of other occupations at Cali-fornia’s heavy-duty EV companies.
To determine the accessibility of heavy-duty EV manu-facturing jobs, we used information from the interviews with industry representatives and O*NET Job Zone classifications to determine the amount of education and training required to perform each occupation (Table 2).
Heavy-duty EV manufacturing jobs are middle-skill: they require more than a high school diploma but less than a bachelor’s degree. In part, this is due to the increasing need
TABLe 2. Wages, Education Requirements, and O*NET Job Zones for Manufacturing Occupations
O*NET Occupation
California Hourly
Median Wage (2014) Education Requirements
O*NET Job Zone 2 Occupations require a few months to one year of working with experienced employees and may be associated with a recognized apprenticeship program.
Electrical and Electronic Equipment Assemblers
$14.37 Usually requires a high school diploma
Team Assemblers $12.60 Usually requires a high school diploma
Electromechanical Equipment Assemblers
$13.92 Usually requires a high school diploma
Inspectors, Testers, Sorters, Samplers, and Weighers
$17.64 Usually requires a high school diploma
Helpers-Production Workers
$10.96 Usually requires a high school diploma
O*Net Job Zone 3 Occupations require one or two years of training involving both on-the-job experience and informal training with experienced workers and may be associated with a recognized apprenticeship program
Welders, Cutters, and Welder Fitters
$18.44Usually requires training in vocational schools, related on-the-job experience, or an associate’s degree
Machinist$18.77
Usually requires training in vocational schools, related on-the-job experience, or an associate’s degree
Computer-controlled Machine Tool Operator
$17.70Usually requires training in vocational schools, related on-the-job experience, or an associate’s degree
Manufacturing Production Technicians
$32.24Usually requires training in vocational schools, related on-the-job experience, or an associate’s degree
SourceS: uSdoL/eTA 2016A-i; uSdoL/eTA 2016N.

37Delivering Opportunity
for electrical skills at all stages of production. Unlike conven-tional manufacturing, heavy-duty EV production increasingly uses high-voltage electricity, requiring electrical safety and hazard training to prevent injury. General manufacturing jobs require anywhere from a few months (e.g., assemblers and testers) to two years of training (e.g., welders and machinists).
Industry representatives reported that entry-level manu-facturing workers may need higher levels of education and experience depending on the level of electrical work re-quired. For example, they reported that a high school educa-tion is necessary for assembler positions, although the qualifications vary among manufacturers and depend on whether more advanced assembly work is necessary. One manufacturer requires as much as three years of experience for assemblers. As a result, many EV manufacturing workers previously worked in general or conventional automotive manufacturing (Hamilton 2011).
In short, for individuals with no training or work experi-ence, entry-level jobs in general manufacturing are more ac-cessible than jobs in electric truck and bus manufacturing.
proJECTEd groWTH iN oCCupATioNs rElATEd To
mANuFACTuriNg
The US Department of Labor collects data on state-by-state employment trends for manufacturing occupations overall; it does not disaggregate conventional automotive manufactur-ing data or EV manufacturing data from manufacturing in general. The projected job growth in manufacturing in Cali-fornia ranges from 1 percent to 16 percent growth through 2022. The highest projected job growth is for machinists (15 percent) and computer-controlled machine tool operators (16 percent). The outlook is worse for assembler positions (7 percent decline to 4 percent growth). Overall, assembler occupations in California are expected to grow slowly.
However, quantifying job growth is a complex process, and it is especially difficult in emerging sectors like the heavy-duty EV industry. The job projections noted here do not account for changes in policies, regulations, or investments related to elec-tric truck and bus technology and deployment.
We asked representatives of heavy-duty EV companies what position they considered likely to grow the most if in-vestments in heavy-duty EVs continue and demand increases. Everyone gave the same answer: assembler positions. In other words, increased investment in this technology seems likely to spur significant job growth in this sector.
HEAVy-duTy EV AssEmBlErs: A CriTiCAl oCCupATioN
For uNdErsErVEd CommuNiTiEs?
Heavy-duty EV assembly may be a step on a pathway to higher-wage, higher-skilled occupations. Assemblers who gain experience on the job and add skills via training have opportunities to transition to occupations that may require more training or certification. For example, the job of tester/quality technician, with a median hourly wage of $17.64, re-quires a baseline level of experience in vehicle assembly and typically requires a few months of related on-the-job training (Glassdoor n.d.; USDOL/ETA 2016f ).
Our research also found that assembler occupations in heavy-duty EV manufacturing have the greatest growth po-tential among all manufacturing occupations.
Many occupations involved in manufacturing EVs are involved as well in manufacturing EV charging stations, which are necessary for most EVs (Hamilton 2011). This broadens the job opportunities for a heavy-duty EV assembler.
Electric Vehicle Charging Infrastructure Occupations
FiNdiNgs
• ElectricalskillsarecriticalforopeningupEV-charginginfrastructure job opportunities to members of under-served communities. Basic electrical skills are required for installing, maintaining, and repairing EV charging stations. They also provide a pathway to other growing occupations in the clean energy economy (e.g., solar panel installer, wind turbine installer).
• InCalifornia,manyelectricianstrainthroughtheInter-national Brotherhood of Electrical Workers. The union gives access to training and certification for work in the EV-charging infrastructure.
TypEs oF JoBs
The installation of EV-charging infrastructure has several stages combining civil work and electrical work. General contractors start with design and permitting, which includes drawing the electrical panel and submitting the design to the permitting authority. Once a project is permitted, civil
Two interviewees from heavy-duty EV companies reported starting wages ranging from $13 to $20 per hour.
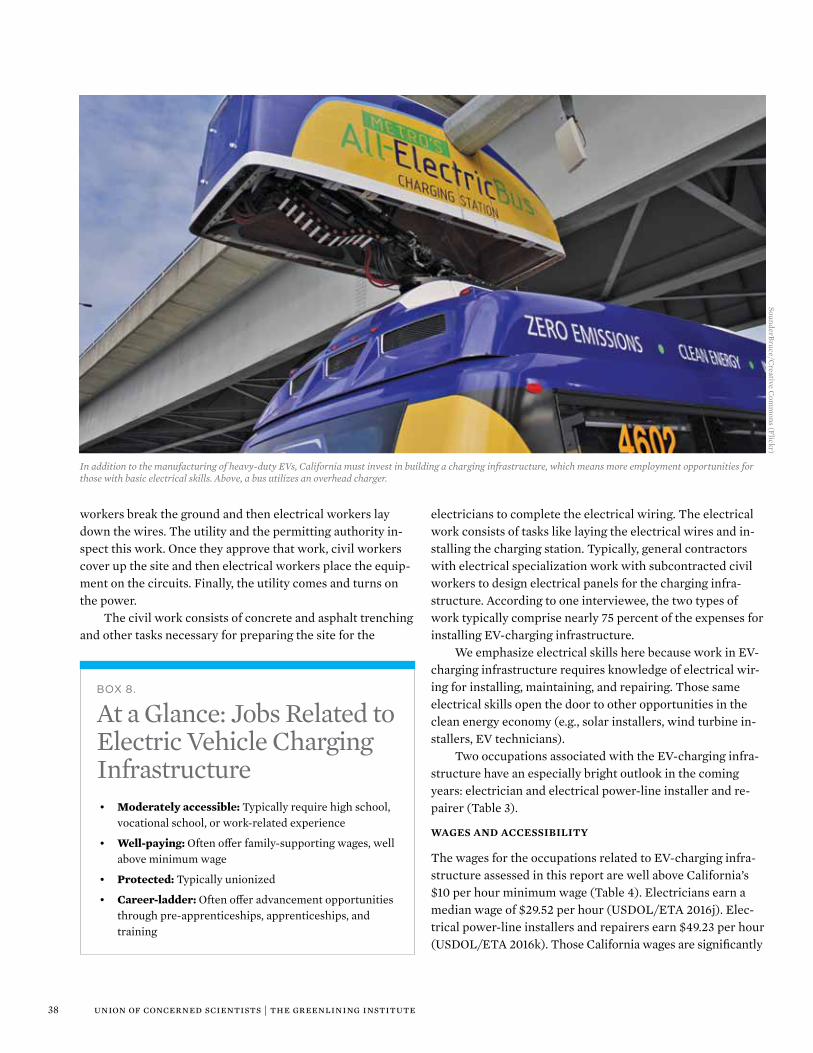
38 union of concerned scientists | the greenlining institute
electricians to complete the electrical wiring. The electrical work consists of tasks like laying the electrical wires and in-stalling the charging station. Typically, general contractors with electrical specialization work with subcontracted civil workers to design electrical panels for the charging infra-structure. According to one interviewee, the two types of work typically comprise nearly 75 percent of the expenses for installing EV-charging infrastructure.
We emphasize electrical skills here because work in EV-charging infrastructure requires knowledge of electrical wir-ing for installing, maintaining, and repairing. Those same electrical skills open the door to other opportunities in the clean energy economy (e.g., solar installers, wind turbine in-stallers, EV technicians).
Two occupations associated with the EV-charging infra-structure have an especially bright outlook in the coming years: electrician and electrical power-line installer and re-pairer (Table 3).
WAgEs ANd ACCEssiBiliTy
The wages for the occupations related to EV-charging infra-structure assessed in this report are well above California’s $10 per hour minimum wage (Table 4). Electricians earn a median wage of $29.52 per hour (USDOL/ETA 2016j). Elec-trical power-line installers and repairers earn $49.23 per hour (USDOL/ETA 2016k). Those California wages are significantly
workers break the ground and then electrical workers lay down the wires. The utility and the permitting authority in-spect this work. Once they approve that work, civil workers cover up the site and then electrical workers place the equip-ment on the circuits. Finally, the utility comes and turns on the power.
The civil work consists of concrete and asphalt trenching and other tasks necessary for preparing the site for the
SounderBruce/Creative C
omm
ons (Flickr)
In addition to the manufacturing of heavy-duty EVs, California must invest in building a charging infrastructure, which means more employment opportunities for those with basic electrical skills. Above, a bus utilizes an overhead charger.
Box 8.
At a Glance: Jobs Related to Electric Vehicle Charging Infrastructure• Moderately accessible: Typically require high school,
vocational school, or work-related experience
• Well-paying: Often offer family-supporting wages, well above minimum wage
• Protected: Typically unionized
• Career-ladder: Often offer advancement opportunities through pre-apprenticeships, apprenticeships, and training

39Delivering Opportunity
Generally, electricians need a high school diploma or equivalent and must participate in an apprenticeship that lasts at least three years (see Appendix A: Job Profiles at www.ucsusa.org/ElectricTrucks for more information.) (Ham-ilton 2011). This includes both formal classroom training and on-the-job training as the apprentice gains the skills neces-sary to work independently. In addition, California, like most states and localities, requires electricians to be licensed. Usu-ally, licensure involves passing an examination that covers building codes, the National Electric Code, and electrical the-ory. In addition, electricians must complete specialized train-ing by a charging-station manufacturer before being certified to install a particular type of charging station.
An example of a path to electrician certification is California’s Electric Vehicle Infrastructure Training Program
higher than US median hourly wages for electricians ($24.57) and electrical power-line installers and repairers ($31.70) (USDOL/ETA 2016j-k).
O*NET considers electricians and electrical power-line installers and repairers to be middle-skill jobs because they require some form of training, certification, and related on-the-job experience.
Typically, electrical power-line installers and repairers must have a high school diploma or equivalent as well as basic math and reading skills (Hamilton 2011). Generally, they re-ceive one to five years of on-the-job training. Training regu-larly emphasizes safety because of the danger involved in working with high-voltage electricity. To become an installer and repairer, technical knowledge of electricity is helpful but not required.
TABLe 3. Occupations Related to Electric Vehicle Charging Infrastructure
Occupation Job Description
Electricians Install, maintain, and repair electrical wiring, equipment, and fixtures
Ensure that work is in accordance with relevant codes
May install or service streetlights, intercom systems, or electrical control systems
Connect charging stations to power lines and ensure that the chargers are working properly (Hamilton 2011)
Make necessary repairs (Hamilton 2011)
Electrical Power-Line Installers and Repairers
Install or repair cables or wires used in electrical power or distribution systems
May erect poles and light- or heavy-duty transmission towers
Install new lines capable of handling the increased load that may be required for EV charging stations (Hamilton 2011)
Place new lines and connect them to the grid in cities that require new power lines when adding public EV-charging stations (Hamilton 2011)
SourceS: uSdoL/eTA 2016J-K.
TABLe 4. Wages and Education Requirements in Electric Vehicle Charging Infrastructure
O*NET Occupation
California Hourly Median Wage
(2014) Education Requirements
Electricians $29.52Usually requires training in vocational schools, related on-the-job experience, or an associate’s degree
Electrical Power-Line Installers and Repairers
$49.23Usually requires training in vocational schools, related on-the-job experience, or an associate’s degree
SourceS: uSdoL/eTA 2016J-K.

40 union of concerned scientists | the greenlining institute
(EVITP). EVITP provides training and certification for electricians and wirers installing commercial, fleet, and utility-company equipment for EV infrastructure. It acts as an EV-industry collaborative, partnering with organizations to develop curricula to train and certify electricians on installation, commissioning, and maintenance (EVITP n.d.). Community colleges and Joint Apprenticeship Training Committee locations offer the EVITP courses, each of which takes 24 hours to complete.
Occupations associated with EV-charging infrastructure pay well and have great growth potential. This suggests plac-ing a high priority on exploring efforts to connect underserved community workers to EV-charging-station certifications and trainings.
Box 9.
Installing an Electric Vehicle Charging StationThis profile is adapted from an interview with Phil Haupt, who now installs EV-supply equipment after working as an oil-refinery electrician.
Background: After about 20 years as an oil-refinery electrician, Haupt started a business in solar-installation services in 2005. In 2010, he and his company switched to focus on EV services.
Skills needed: “It requires the broad skill set of elec-trical contracting, as well as knowledge of each specific electric vehicle—where their charge ports are located and their own individual power requirements. Additional knowledge about American[s] [With] Disabilit[ies] Act accessibility laws, parking space requirements, electric vehicle supply equipment brands and capabilities and permitting is required.”
Career pathway: “The career path to installing elec-tric vehicle supply equipment begins with a solid profi-ciency in electrical work. The specialties involved come with working in the field and understanding the vehicles and the various electric vehicle supply equipment brands.”
Best part of the job: “I enjoy watching the paradigm shift from internal combustion engines to electrically powered vehicles. Once a person experiences the difference, there is no going back. I also love the fact that I am providing a ‘green’ opportunity.”
Advice: “Start an electrical apprenticeship. The growth rate of electric vehicles is vertical, so the jobs will be there.”
Source: LANTero 2014.
proJECTEd groWTH iN JoBs rElATEd To EV-CHArgiNg iNFrAsTruCTurE
Overall, electrician jobs in California are expected to grow by 22 percent through 2022 (Table 5). This growth cannot be attributed strictly to increased demand for EV-charging infra-structure due to increased adoption of electric trucks and buses in California. Nonetheless, increased investments in heavy-duty EVs, and EVs in general, will increase the need for jobs necessary to deploy EV-charging infrastructure.
Electric Vehicle Maintenance Occupations
FiNdiNgs
• EVmaintenanceandrepairjobsdifferconsiderablyfromconventional automotive maintenance and repair jobs. They require knowledge of electrical safety when repair-ing high-voltage components like EV batteries. As a re-sult, incumbent auto mechanics will require training to update their skills.
• Electrificationofvehicleswillresultinincreaseddemandfor EV maintenance.
TypEs oF JoBs
Electric vehicles, like any vehicle, need occasional mainte-nance and repair. For example, batteries can degrade and need replacing every few years, with the interval depending on usage and the type of battery. Normal repair workers can do routine maintenance and repair work, like rotating tires, but fixing or tuning electrical systems and drivetrains will often need skilled workers familiar with EVs (Hamilton 2011).
O*NET data lack specific information about EV mainte-nance and repair occupations. To assess EV maintenance and repair jobs, we compared them with conventional automotive maintenance and repair jobs, assessing two occupations asso-ciated with automotive maintenance: master mechanics and
Box 10.
At a Glance: Automotive Maintenance Jobs• Moderately accessible: Typically require high school,
vocational school, or work-related experience
• Well-paying: Typically offer family-supporting wages, well above minimum wage

41Delivering Opportunity
(Hamilton 2011). For employment at larger repair shops and auto dealerships, auto service workers must be certified by the National Institute for Automotive Service Excellence (ASE). Typically, it takes two to five years of experience to become a fully qualified automotive service technician through ASE. Ad-ditionally, programs like the National Alternative Fuels Train-ing Consortium train workers on a variety of skills needed to work on electric or alternative fuel vehicles.
In short, low-skill workers from underserved communi-ties cannot access these jobs without targeted and robust training programs. To grow the heavy-duty EV sector equita-bly, incumbent automotive maintenance workers from under-served communities must receive training to upgrade their skills to the rapidly evolving automotive technology.
specialty technicians. We then reviewed training programs for EV maintenance to find distinguishing skills and duties (Table 6).
WAgEs ANd ACCEssiBiliTy
The wages of automotive maintenance occupations we as-sessed are well above California’s $10 per hour minimum wage. For example, the median hourly wage for master me-chanics in California is $19.46, higher than the US median hourly wage of $17.84 (Table 7, p. 42) (USDOL/ETA 2016l).
Automotive maintenance jobs are middle-skill and in-creasingly require formal training. Workers usually need a few weeks to two years of training involving both on-the-job experience and less formal training with experienced workers
TABLe 5. Projected Growth in Jobs Related to Electric Vehicle Charging Infrastructure
O*NET OccupationEmployment in California Projected Change,
2012–2022Projected Annual Job Openings
in California, 2012–2022*2012 2022
Electricians 48,700 59,500 22% 2,000
Electrical Power-Line Installers and Repairers
7,100 8,200 16% 360
*Refers to the average annual job openings due to growth and net replacement.
SourceS: uSdoL/eTA 2016J-K.
TABLe 6. Occupations in Automotive Maintenance and Repair
O*NET Occupation Job Description
Automotive Master Mechanics
Repair automobiles, trucks, buses, and other vehicles
Repair virtually any part on the vehicle or specialize in the transmission system
Automotive Specialty Technicians
Repair only one system or component on a vehicle, such as brakes, suspension, or radiator
EV Technicians Has evolved from doing simple mechanical repairs to high-level, technology-related work, such as work with integrated electronic systems.
Distinguishing skills and duties (see Appendix A: Job Profiles at www.ucsusa.org/ElectricTrucks for more information) (Hamilton 2011):
• Use computerized shop equipment and work with electronic components as well as traditional hand tools
• Work with electrical systems and drivetrains, which often requires skills specific to electric vehicles
• Repair or install EV batteries, a job requiring training to work with specific types of batteries
• Replace batteries every few years, with the timing depending on usage and type of battery
SourceS: uSdoL/eTA 2016L; HAMiLToN 2011.

42 union of concerned scientists | the greenlining institute
Heavy-Duty Electric Vehicle Workforce Development and Job-Training Resources
FiNdiNgs
• California’selectrictruckandbusindustryreliesoncom-munity colleges to train workers.
• Transitagencies,unions,andotherorganizationshavebegun assessing workforce development and training needs for electrifying the truck and bus industry.
• Thereisanincreasingneedtobuildcareerpathwaysthathelp residents of underserved communities access elec-trical training and careers in heavy-duty EVs.
Widespread transportation electrification is rapidly changing workforce needs. To meet these changing demands, community colleges, training organizations, and government agencies have begun developing programs and partnerships to create a sustainable workforce for manufacturing and
proJECTEd groWTH iN JoBs rElATEd To mAiNTENANCE
Electric trucks and buses require less maintenance and repair than do conventional vehicles. For example, heavy-duty, pure-battery EVs need no oil changes or spark-plug replace-ments. However, as noted, the periodic maintenance and re-pair of heavy-duty EVs will require specialized skills.
California’s action plans, policies, and investments aim to increase the number of EVs on the road, and the state’s Sus-tainable Freight Action Plan has set the goal of deploying 100,000 freight vehicles and equipment capable of zero- emission operation by 2030 (CSFAP 2106). Automotive main-tenance and repair jobs are expected to grow 15 percent in California through 2022, significantly higher than the pro-jected 5 percent growth for these jobs nationwide (Table 8) (USDOL/ETA 2016l). This growth cannot be attributed strict -ly to increased deployment of EVs in California. Nonetheless, EV policies and investments mean the demand for EV mainte-nance and repair jobs in California will continue to grow.
TABLe 7. Wages and Education Requirements in Automotive Maintenance and Repair
O*NET Occupation
California Hourly Median Wage
(2014)* Education Requirements
Automotive Master Mechanics
$19.46Usually requires training in vocational schools, related on-the-job experience, or an associate’s degree
Automotive Specialty Technicians
$19.46 Certificate; associate’s degree
*Salary information comes from the US Bureau of Labor Statistics, Occupational Employment Statistics Program, a semiannual survey providing wage and employment statistics for the nation, each state, and substate regions. O*NET combines salary information for automotive master mechanics and automotive specialty technicians into one category.
Source: o*NeT BureAu oF LABor STATiSTicS dATA.
TABLe 8. Projected Growth in Auto Service Technicians and Mechanics
O*NET Occupation
Employment in CaliforniaProjected Change,
2012–2022Projected Annual Job Openings
in California, 2012–20222012 2022
Auto Service Technicians and Mechanics
64,200 73,800 15% 2,590
Note: O*NET combines employment trends for automotive master mechanics and automotive specialty technicians into one category.
Source: o*NeT BureAu oF LABor STATiSTicS dATA.

43Delivering Opportunity
goVErNmENT-spoNsorEd TrAiNiNg
Federal and state governments can help connect underserved workers with high-quality jobs by sponsoring in-house train-ing for manufacturers as well as by investing in community college programming. As transportation electrification grows, a variety of existing programs provide useful models for cities and counties that seek to prepare the workforce for transpor-tation electrification jobs.
For example, California’s Employment Training Panel (ETP), is a government-sponsored training program that ad-dresses skills gaps by providing funding for in-house training. ETP can enable early-stage manufacturers to provide unique training to new hires while at work, and it can jumpstart the training programs needed to employ incumbent workers who may not have the skills or extended experience necessary for their new roles.
TrAiNiNg spoNsorEd By CommuNiTy CollEgEs ANd VoCATioNAl/TECHNiCAl iNsTiTuTioNs
Community colleges are a major resource for clean transpor-tation employers, including electric truck and bus manufac-turers. In particular, their vocational and technical programs provide advanced transportation curricula and training, as well as workforce development services in general. All inter-viewees mentioned some level of collaboration with commu-nity colleges as part of their workforce efforts. These partnerships are especially important for manufacturers: community colleges have responded to workforce needs by creating EV-specific certifications and degree programs. One heavy-duty EV company representative noted the importance of community colleges for hiring locally and extending the firm’s recruitment network.
The Alternative Transportation and Renewable Energy Program (ATRE), established by California Community Col-lege’s Economic and Workforce Development Program, illus-trates the effectiveness of partnerships of industry with community colleges. Throughout California, ATRE provides training and work experience for clean transportation and energy technology, as well as related technical education, as-sistance, and outreach programs. Its ability to offer up-to-date curricula, based on the participation of employers, leads to training for students and teachers.
JoB TrAiNiNg ANd EduCATioN AT NoNproFiT orgANizATioNs or mANAgEd By iNdusTry
Nonprofit and industry-managed job training and education programs are key to creating pipelines for jobseekers from underserved communities to enter careers in transportation electrification. These programs often include member organi-zations with direct access to the community and the capacity
maintaining electric trucks and buses and installing EV-charging infrastructure.
Providing underserved communities with access to transportation electrification occupations will require strong partnerships among manufacturers, educational institutions, government, and job-training programs, with a high priority on developing soft and technical skills for those with barriers to employment. Nontraditional partnerships will be neces-sary. For example, community-based, environmental justice, and economic justice organizations will be crucial partners for identifying and understanding barriers that may prevent people in underserved communities from entering particular training programs or applying for certain jobs. In addition, labor unions can play a critical role in helping design curric-ula for jobs in EV-charging infrastructure and in connecting qualified graduates of electrician-training programs with opportunities in union apprenticeships and union-track, EV-charging infrastructure careers.
The most successful programs will provide participants with stipends or other forms of support during training. In addition, they will connect participants to union-apprenticeship programs or well-paying employers, while providing “wrapa-round” support services like case management, soft skills, job-readiness training, and literacy and basic-skills training (Kim, Kirsch, and Reyes 2010). Some programs will combine on-the-job training with education around safety and clean energy so that those who secure emerging jobs will under-stand the importance of their work in supporting the sustain-able, clean-energy economy.
Four types of programs can help prepare people for jobs in transportation electrification (see Appendix B: Training Programs, at www.ucsusa.org/ElectricTrucks):
• government-sponsoredtrainingprograms
• communitycollegeandundergraduategeneraleduca-tion, advanced undergraduate education, general Mas-ter’s education, focused graduate education, and research programs related to transportation electrification
• private-sectorandnonprofittrainingprograms
• apprenticeshipprograms
Labor unions can play a critical role in helping design curricula for jobs in EV-charging infrastructure.

44 union of concerned scientists | the greenlining institute
(science, technology, engineering, and mathematics) high schools serving residents of underserved communities.
• Supportthedevelopmentofformalpathwaystotrainincumbent workers or new workers from underserved communities so that they can access employment in this emerging field. Manufacturers can work with workforce training organizations or workforce development boards to establish pathways that train, certify, and place work-ers from these communities in high-quality jobs.
• Generateopportunitiesforlocalworkersandunder-served communities by procuring products and services from minority-owned businesses.
rECommENdATioNs For CAliForNiA goVErNmENT AgENCiEs
• Supportthedevelopmentofandplaceahighpriorityonprojects that have robust recruiting and hiring policies targeting underserved communities, provide high-quality jobs, have robust minority-owned business procurement goals (i.e., supplier diversity), and partner with or pro-vide support to workforce development programs aimed at underserved communities.
• Investinskills-developmentprogramsaimedattrainingmembers of underserved communities (particularly those with barriers to employment) to fill emerging em-ployment needs in the heavy-duty EV industry and re-lated transportation-electrification fields.
• Trackandreportindividualleveldataontheprogressofefforts to train and employ members of underserved communities.
• ReferenceandusetheUSEmploymentPlantoevaluateand score proposals with the aim of encouraging com-mitments to creating good jobs and improving access for people historically excluded from manufacturing jobs.20
rECommENdATioNs For JoB-TrAiNiNg orgANizATioNs
• Evaluatetheheavy-dutyEVsectorandthelarger transportation-electrification sector for their potential to establish formal job-training programs, especially if investments supporting these sectors continue to grow.
• Leverageexistinggreeneconomyjob-trainingprogramsand look for opportunities to incorporate skill develop-ment relevant to heavy-duty vehicle electrification.
• Engageandparticipateintransportationelectrificationpolicy making and investment decision at state agencies.
and experience to work hand in hand with local unions or industry.
For example, the Oakland Green Jobs Corps prioritizes connecting underserved communities with clean energy jobs as a pathway out of poverty. The program is operated by the nonprofit Cypress Mandela Training Center, which partners with Laney College to offer courses in electrician training, job safety, and other areas.
ApprENTiCEsHip progrAms
Apprenticeships are critical for developing technical skills for the growing number of middle-skill jobs in transportation electrification. Apprentices receive pay while they learn skills in the classroom and on the job working alongside experi-enced teachers. Labor unions, large companies (like electric utilities), and local colleges typically operate apprenticeship programs.
For example, American River College runs a number of pre-apprenticeship and apprenticeship programs. The college develops skills relevant to the clean energy economy through apprenticeship, certificate, and degree offerings. It offers a pre-apprenticeship certificate in green technology, certifi-cates in alternative fuels and green vehicles, and an electrical apprenticeship, among other opportunities.
Recommendations for Action
California’s heavy-duty EV sector is an emerging job market, driven by the state’s action plans, policies, and investments. To ensure that those who live in low-income communities and communities of color can enjoy the benefits of this rising sector, it must grow equitably, especially in its early stages. The following recommendations provide actions and consid-erations to better align efforts, investments, and employment opportunities in the heavy-duty EV industry with the eco-nomic needs of underserved communities.
rECommENdATioN For CAliForNiA ElECTriC TruCk ANd Bus mANuFACTurErs
• Developrecruitmentandoutreachstrategiesthattargetindividuals from underserved communities. To do so, manufacturers should partner with community-based organizations, community colleges, and STEM-focused
California’s heavy-duty EV sector is an emerging job market.

45Delivering Opportunity
10 Fuel cell vehicles emit a small amount of water vapor at their tailpipes, but water is non-toxic, making fuel cell vehicles also “zero emission.”
11 Life cycle emissions in this report do not include emissions from manufactur-ing either the vehicle or any other component needed for the production of a fuel, such as natural gas pipelines. Previous UCS analysis has shown that the emissions associated with manufacturing an electric light-duty vehicle are small compared to the tailpipe emissions from combustion engines (UCS 2015).
12 New Flyer’s Excelsior buses have the following efficiencies: diesel (4.8 miles per gallon), natural gas (4.5 miles per gallon diesel equivalent [mpgde ] ), and battery electric (20.5 mpgde ) (Altoona 2015). For hydrogen fuel cell buses, a fuel efficiency of 9.2 mpgde was used based on the energy efficiency ratio (1.9) of fuel cells compared with diesel as reported by CARB (CARB 2009), which is consistent with on-road data from transit agencies operating fuel cell buses (Eudy, Post, and Gikakis 2015). The unit mpgde measures how far a vehicle can travel on the amount of energy in one gallon of diesel fuel.
13 These data exclude pickup trucks, minivans, SUVs, and other light vans.14 All weights in this report refer to “gross vehicle weight rating” (GVWR),
which is the maximum weight at which a vehicle can operate, including all cargo, passengers, and fuel. GVWR differs from “curb weight,” which refers to the empty vehicle’s weight, without passengers, cargo, or fuel.
15 For comparison, a typical passenger car weighs 2,000 to 4,000 pounds; a typical SUV, pickup truck, or minivan weighs 4,000 to 6,000 pounds.
16 BYD’s electric drayage truck has a maximum torque of 2,212 foot-pounds and 483 horsepower (BYD n.d.).
17 Only $5 million of the $148 million investments identified in the Fiscal Year 2015-2016 Funding Plan for the Air Quality Improvement Program and Low Carbon Transportation and Fuels Greenhouse Gas Reduction Fund Invest-ments were allocated for heavy-duty vehicles.
18 “Bright Outlook occupations are expected to grow rapidly in the next several years, will have large numbers of job openings, or are new and emerging occupations” (USDOL/ETA 2016m).
19 This report compares aggregated manufacturing occupation data from the US Bureau of Labor Statistics with limited responses from manufacturers of electric truck and bus. It does not look at job-quality data from conventional automotive manufacturing, specifically. Further research is required to un-derstand how heavy-duty EV manufacturing jobs compare with conven-tional automotive manufacturing jobs, which are typically unionized, good-quality jobs. Some national data show that production and nonsupervi-sory jobs in conventional automotive manufacturing paid $27.65 per hour, on average, in 2015 (USDOL/BLS 2016).
20 The US Employment Plan was developed by a team of experts from LAANE, the Brookings Institution, the University of Southern California’s Program for Environmental and Regional Equity, and the University of Massachusetts at Amherst’s Political Economy Research Institute (JMA n.d.). For more information, visit http://jobstomoveamerica.org/resources/u-s-employment- plan-resources-2.
rECommENdATioNs For FurTHEr rEsEArCH
As technology develops and investments grow in this indus-try, research must increase the emphasis on targeting low- income workers to ensure they are not left behind. Further research, conducted in collaboration with government, academia, nongovernmental organizations, and industry play-ers, is needed to:
• developstrategiesthatopenjobopportunitiestolow- income individuals in truck and bus electrification;
• identifytransportationelectrificationjobopportunitiesrelated to heavy-duty EV skill requirements and training strategies aimed at increasing employment opportunities for low-income individuals; and
• determinehowjobsinheavy-dutyEVmanufacturingcompare to conventional automotive manufacturing jobs.
EnDnoTEs1 The California Cleaner Freight Coalition, in public comment, is asking this to
be increased to 500,000.2 For the history and text of the act, see: https://leginfo.legislature.ca.gov/
faces/billNavClient.xhtml?bill_id=201520160SB350.3 Here, heavy-duty refers to vehicles with gross vehicle weight ratings
(GVWR) of 8,501 pounds and heavier.4 These data are by weight. By value, trucks moved 66 percent of freight in
California in 2015.5 This also leads to both increased ozone and higher particle levels in the air
via a series of atmospheric chemical reactions.6 For comparison, roughly 3,000 people die each year from car crashes in Cali-
fornia (COTS 2014).7 Particulate matter causes not only lung cancer but also cancers of the breast
and upper-digestive tract. The link between particulate matter and cancer may be from decreasing the body’s ability to repair DNA, changing the body’s immune response, or increasing the rate at which tumors can spread through inflammation.
8 Defined as an average annual daily traffic volume of 25,000 vehicles per day. Forty percent of Californians live near a road with this volume.
9 Local refers to the county for a neighborhood near a busy road.

46 union of concerned scientists | the greenlining institute
Achtelik, G. 2009. California regulations on renewable hydrogen and low carbon technologies. Online at http://energy.gov/sites/prod/files/2014/03/f12/renewable_hydrogen_workshop_nov16_achtelik.pdf, accessed September 17, 2016.
Altoona Bus Research and Testing Center. 2015. Federal transit bus test. Online at http://altoonabustest.psu.edu/buses, accessed Sep-tember 17, 2016.
American Lung Association (ALA). 2016. State of the air. Online at www.lung.org/assets/documents/healthy-air/state-of-the-air/sota-2016-full.pdf, accessed September 17, 2016.
American Association of Port Authorities (AAPA). 2015. 2015 port ranking by TEUs. Online at http://aapa.files.cms-plus.com/ Statistics/NAFTA%20CONTAINER%20PORT%20RANKING% 202015%20revised.pdf, accessed September 17, 2016.
Antelope Valley Transit Authority (AVTA). No date. Electric bus fleet conversion. Online at www.avta.com/index.aspx?page=482, accessed September 17, 2016.
Berhane K., C. Chang, R. McConnell, W.J. Gauderman, E. Avol, E. Rapapport, R. Urman, F. Lurmann, and F. Gilliland. 2016. Associ-ation of changes in air quality with bronchitic symptoms in chil-dreninCalifornia,1993–2012. Journal of the American Medical Association 315(14):1491–1501.doi:10.1001/jama.2016.3444.
Brook, R.D., S. Rajagopalan, C.A. Pope, J.R. Brook, A. Bhatnagar, A.V. Diez-Roux, F. Holguin, Y. Hong, R.V. Luepker, M.A. Mittleman, A. Peters, D. Siscovick, S.C. Smith, L. Whitsel, and J.D. Kaufman. 2010. Particulate matter air pollution and cardiovascular disease: An update to the scientific statement from the American Heart Association. Circulation121(21):2331–2378.doi:10.1161/CIR.0b013e3181dbece1.
Brown, E.G. 2015a. Executive Order B-30-15, issued April 29. Sacramento, CA: Office of the Governor. Online at www.gov.ca.gov/news.php?id=18938, accessed September 11, 2016.
Brown, E.G. 2015b. Executive Order B-32-15, issued July 17. Sacramento, CA: Office of the Governor. Online at www.gov.ca.gov/news.php?id=19046, accessed August 21, 2016.
Brown, E.G. 2012. Executive Order B-16-2012, issued March 23. Sac-ramento, CA: Office of the Governor. Online at www.gov.ca.gov/news.php?id=17472, accessed September 9, 2016.
BW Research Partnership (BWRP). 2016. Advanced energy jobs in California: Results of the 2016 California advanced energy employ-ment survey. San Francisco, CA: Advanced Energy Economic Institute. Online at http://info.aee.net/advanced-energy-jobs-in-california-2016, accessed August 21, 2016.
BYD Motors (BYD). No date. Class 8 truck brochure. Online at www.byd.com/usa/wp-content/uploads/2016/08/T9-final.pdf, accessed September 16, 2016.
Caiazzo, F., A. Ashok, I.A. Waitz, S.H.L. Yim, and S.R.H. Barrett. 2013. Air pollution and early deaths in the United States. Part I: Quan-tifying the impact of major sectors in 2005, Atmospheric Environ-ment79:198–208.doi:10.1016/j.atmosenv.2013.05.081.
California Air Resources Board (CARB). 2016a. Greenhouse gas emission inventory - query tool for years 2000 to 2014 (9th Edi-tion). Sacramento, CA. Online at www.arb.ca.gov/app/ghg/ 2000_2014/ghg_sector.php, accessed September 16, 2016.
California Air Resources Board (CARB). 2016b. Advanced Clean Transit. Online at www.arb.ca.gov/msprog/bus/bus.htm, accessed August 21, 2016.
California Air Resources Board (CARB). 2016c. Transit fleet report-ing database. Unpublished document.
California Air Resources Board (CARB). 2016d. Diesel exhaust and health. Online at www.arb.ca.gov/research/diesel/diesel-health.htm, accessed September 16, 2016.
California Air Resources Board (CARB). 2016e. Proposed fiscal year 2016–17 funding plan for low carbon transportation and fuels investments and the air quality improvement program. Sacra-mento, CA. Online at www.arb.ca.gov/msprog/aqip/fundplan/ proposed_fy16-17_fundingplan_full.pdf, accessed September 16, 2016.
California Air Resources Board (CARB). 2016f. Economic analysis of the Mobile Source Strategy. Online at www.arb.ca.gov/planning/sip/2016sip/2016mobsrc_appA.pdf, accessed September 16, 2016.
California Air Resources Board (CARB). 2016g. Battery electric bus charging calculator. Online at www.arb.ca.gov/msprog/bus/ rate_calc.xlsm, accessed September 16, 2016.
California Air Resources Board (CARB). 2015a. California’s 2030 climate commitments: Cutting petroleum use in half by 2030. Sacramento, CA. Online at www.arb.ca.gov/newsrel/ petroleum_reductions.pdf, accessed September 9, 2016.
California Air Resources Board (CARB). 2015b. Sustainable freight: Pathways to zero and near-zero emissions (discussion docu-ment). Sacramento, CA. Online at www.arb.ca.gov/gmp/sfti/ sustainable-freight-pathways-to-zero-and-near-zero-emissions- discussion-document.pdf, accessed September 16, 2016.
California Air Resources Board (CARB). 2015c. Workshop on Mobile Source Strategy Discussion Draft. Online at www.arb.ca.gov/ planning/sip/2016sip/wkshp_presentation.pdf, accessed Septem-ber 16, 2016.
California Air Resources Board (CARB). 2015d. California short-lived climate pollutant emissions. Online at www.arb.ca.gov/cc/short-lived/2015appendixa.pdf, accessed September 16, 2016.
[ references ]

47Delivering Opportunity
California Legislature (Senate Bill 350). 2015. Clean Energy and Pollution Reduction Act of 2015.
California Office of Traffic Safety (COTS). 2014. Traffic safety quick stats. Online at www.ots.ca.gov/OTS_and_Traffic_Safety/Score_Card.asp, accessed September 16, 2016.
CALSTART. 2016. California takes major step forward by funding 43 zeroemissiontruckhaulingcontainersfromports–largestna-tional investment in zero emission goods movement sector. Press release, May 4. Online at www.calstart.org/News_and_ Publications/CALSTART-in-the-news/CALSTART-Press-Releases/ California-Provides-Funding-for-43-Zero-Emission.aspx, accessed September 11, 2016.
CALSTART. 2015. Electric truck and bus grid integration: Opportu-nities, challenges and recommendations. Online at www.calstart.org/Libraries/Publications/Electric_Truck_Bus_Grid_Integration_Opportunities_Challenges_Recommendations.sflb.ashx, accessed September 16, 2016.
Clark, L.P., D.B. Millet, and J.D. Marshall. 2014. National patterns in environmental injustice and inequality: Outdoor NO2 air pollu-tion in the United States. PLoS ONE 9(4). doi:10.1371/journal.pone.0094431.
Complete Coach Works (CCW). No date. Transit bus remanufactur-ing. Online at http://completecoach.com/services/bus- remanufacturing, accessed August 22, 2016.
Cutcher-Gershenfeld, J., D. Brooks, and M. Mulloy. 2016. The decline and resurgence of the U.S. auto industry. Washington, DC: Eco-nomic Policy Institute. Online at www.epi.org/files/2015/the- decline-and-resurgence-of-the-us-auto-industry.pdf, accessed September 11, 2016.
Dadvand, P., J. Parker, M.L. Bell, M. Bonzini, M. Brauer, L.A. Darrow, U. Gehring, S.V. Glinianaia, N. Gouveia, E. Ha, J.H. Leem, E.H. van den Hooven, B. Jalaludin, B.M. Jesdale, J. Lepeule, R. Morel-lo-Frosch, G.G. Morgan, A.C. Pesatori, F.H. Pierik, T. Pless-Mul-loli, D.Q. Rich, S. Sathyanarayana, J. Seo, R. Slama, M. Strickland, L. Tamburic, D. Wartenberg, M.J. Nieuwenhuijsen, and T.J. Woodruff. 2013. Maternal exposure to particulate air pollution and term birth weight: A multi-country evaluation of effect and heterogeneity. Environmental Health Perspectives121(3):267–373.doi:10.1289/ehp.1205575.
Darrow, L.A., M. Klein, W.D. Flanders, L.A. Waller, A. Correa, M. Marcus, J.A. Mulholland, A.G. Russell, and P.E. Tolbert. 2009. Ambient air pollution and preterm birth: A time-series analysis. Epidemiology20(5):689–698.doi:10.1097/EDE.0b013e3181a7128f.
Dockery, D.W., and C. A. Pope. 1994. Acute respiratory effects of par-ticulate air pollution. Annual Review of Public Health15:107–132.doi:10.1146/annurev.pu.15.050194.000543.
Davis, S.C., S.E. Williams, R.G. Boundy, and S. Moore. 2015. 2015 Vehi-cle Technologies Market Report. ORNL/TM-2016/124. Oak Ridge, TN: Oak Ridge National Laboratory. Online at http://cta.ornl.gov/vtmarketreport/pdf/chapter3_heavy_trucks.pdf, accessed Septem-ber 16, 2016.
California Air Resources Board (CARB). 2015e. 2015 annual evalua-tion of fuel cell electric vehicle deployment and hydrogen fuel station network development. Online at www.arb.ca.gov/msprog/zevprog/ab8/ab8_report_2015.pdf, accessed September 16, 2016.
California Air Resources Board (CARB). 2015f. Emissions Factors (EMFAC) model v1.0.7. Online at www.arb.ca.gov/emfac/2014, accessed September 16, 2016.
California Air Resources Board (CARB). 2013. Almanac Emission Projection Data: 2012. Sacramento, CA. Online at www.arb.ca.gov/app/emsinv/2013/emssumcat_query.php?F_YR=2012&F_DIV-=0&F_SEASON=A&SP=2013&F_AREA=CA, accessed September 16, 2016.
California Air Resources Board (CARB). 2009. Staff report: Initial statement of reasons- proposed regulation to implement the Low Carbon Fuel Standard, Volume I. Sacramento, CA. Online at www.arb.ca.gov/regact/2009/lcfs09/lcfsisor1.pdf, accessed September 16, 2016.
California Cleaner Freight Coalition (CCFC). 2016. California cleaner freight coalition: Vision for a sustainable freight system in Califor-nia. Online at www.ccair.org/wp-content/uploads/2016/01/ CCFC-Vision-for-a-Sustainable-Freight-System-in-California.pdf, accessed September 11, 2016.
California Department of Public Health (CDPH). 2007. Public health impacts of climate change in California: Community vulnerabil-ity assessments and adaptation strategies. Richmond, CA. Online at http://ehib.org/cehtp/cehtp.org/papers/Heat_Vulnerability_ 2007.pdf, accessed September 16, 2016.
California Department of Transportation, California Air Resources Board, California Energy Commission, and the Governor’s Office of Business and Economic Development (CSFAP). 2016. California Sustainable Freight Action Plan. Sacramento, CA. Online at www.casustainablefreight.org/files/managed/ Document/289/CSFAP_FINAL_07272016.pdf, accessed August 21, 2016.
California Energy Commission (CEC). 2016a. Commission report: 2016-2017 investment plan update for the alternative and renew-able fuel and vehicle technology program. CEC-600-2015-014-CMF. Sacramento, CA. Online at www.energy.ca.gov/ 2015publications/CEC-600-2015-014/CEC-600-2015-014-CMF.pdf, accessed September 11, 2016.
California Energy Commission (CEC). 2016b. Total electricity system power. Online at http://energyalmanac.ca.gov/electricity/total_system_power.html, accessed September 16, 2016.
California Energy Commission (CEC). 2015. Actual and expected en-ergy from coal for California−overview. Sacramento, CA. Online at www.energy.ca.gov/renewables/tracking_progress/documents/current_expected_energy_from_coal.pdf, accessed September 16, 2016.
California Environmental Protection Agency (CalEPA). 2016. Envi-ronmental Justice Program Update 2013– 2015. Sacramento, CA. Online at www.calepa.ca.gov/EnvJustice/Documents/2016/ EJReport.pdf, accessed, September 11, 2016.

48 union of concerned scientists | the greenlining institute
Finkin, E. 2016. Benefits of clean diesel technology in California. Presented at the Center for Energy Efficiency and Renewable Technologies’ Meeting to Discuss Diesel and the Mobile Source Strategy, Webinar, April 27.
Foothill Transit. No date a. Electric program. Online at http:// foothilltransit.org/news/sustainability/electric-program, accessed September 16, 2016.
Foothill Transit. No date b. Fast facts. Online at http://foothilltransit.org/about/fast-facts, accessed September 16, 2016.
Frito-Lay. No date. Fleet sustainability. Online at www.fritolay.com/purpose/fleet-sustainability, accessed September 16, 2016.
Frosch, R.M., M. Pastor, J. Sadd, and S. Shonkoff. 2009. The climate gap: Inequalities in how climate change hurts Americans & how to close the gap. Los Angeles, CA: University of Southern California, Program for Environmental and Regional Equity. Online at https://dornsife.usc.edu/pere/climategap, accessed September 11, 2016.
Gauderman, W.J., E. Avol, F. Gilliland, H. Vora, D. Thomas, K. Ber-hane, R. McConnell, N. Kuenzli, F. Lurmann, E. Rappaport, H. Margolis, D. Bates, and J. Peters. 2004. The effect of air pollution on lung development from 10 to 18 years of age. New England Journal of Medicine351:1057–1067.doi:10.1056/NEJMoa040610.
Gauderman, W.J., R. Urman, E. Avol, K. Berhane, R. McConnell, E. Rappaport, R. Chang, F. Lurmann, and F. Gilliland. 2015. Associa-tion of improved air quality with lung development in chil-dren. New England Journal of Medicine 372(10):905–913.doi:10.1056/NEJMoa1414123.
Gehring, U., A.H. Wijga, G. Hoek, T. Bellander, D. Berdel, I. Brüske, E. Fuertes, O. Gruzieva, J. Heinrich, B. Hoffmann, J.C. de Jongste, C. Klümper, G.H. Koppelman, M. Korek, U. Krämer, D. Maier, E. Melén, G. Pershagen, D.S. Postma, M. Standl, A. von Berg, J.M. Anto, J. Bousquet, T. Keil, H.A. Smit, and B. Brunekreef . 2015. Exposure to air pollution and development of asthma and rhi-noconjunctivitis throughout childhood and adolescence: A popu-lation-basedbirthcohortstudy. The Lancet Respiratory Medicine 3(12):933–42.doi:10.1016/S2213-2600(15)00426-9.
Glassdoor. No date. Proterra, quality technician. “Minimum of 2-4 years of experience in vehicle assembly environment.” Online at www.glassdoor.com/job-listing/quality-technician-proterra-JV_IC1155193_KO0,18_KE19,27.htm?jl=1864302728, accessed June 14, 2016.
Hamilton, J. 2011. Careers in electric vehicles. Washington, DC: US Bureau of Labor Statistics, Office of Occupational Statistics and Employment Projects. Online at www.bls.gov/green/electric_ vehicles, accessed August 21, 2016.
Houston, D., W. Li, and J. Wu. 2014. Disparities in exposure to auto-mobile and truck traffic and vehicle emissions near the Los Ange-les—LongBeachPortComplex. American Journal of Public Health 104(1):156–164.doi:10.2105/AJPH.2012.301120.
Dubowsky, S.D., H. Suh, J. Schwartz, B.A. Coull, and D.R. Gold. 2006. Diabetes, obesity, and hypertension may enhance associations between air pollution and markers of systemic inflammation. Enviroratory.
Energy Information Administration (EIA). 2016a. Weekly California No. 2 diesel retail prices. Online at www.eia.gov/dnav/pet/hist/LeafHandler.ashx?n=PET&s=EMD_EPD2D_PTE_SCA_DPG&f=W, accessed September 16, 2016.
Energy Information Administration (EIA). 2016b. California price of natural gas sold to commercial consumers. Online at www.eia.gov/dnav/ng/hist/n3020ca3a.htm, accessed September 16, 2016.
Energy Information Administration (EIA). 2016c. Average retail price of electricity (California: commercial: annual). Online at www.eia.gov/electricity/data/browser/#/topic/7?agg=0,1&geo= vvvvvvvvvvvvo&endsec=vg&linechart=ELEC.PRICE.US-ALL.A~ELEC.PRICE.CA-COM.A&columnchart=ELEC.PRICE.US- ALL.A&map=ELEC.PRICE.US-ALL.A&freq=A&start=2001& end=2015&ctype=linechart<ype=pin&rtype=s&pin=ELEC.PRICE.CA-COM.A&rse=0&maptype=0, accessed September 16, 2016.
Energy Information Administration (EIA). 2015. State energy-related carbondioxideemissionsbyyear(2000–2013).Onlineatwww.eia.gov/environment/emissions/state/analysis/pdf/table1.pdf, accessed September 16, 2016.
Electric Vehicle Infrastructure Training Program (EVITP). No date. About. Online at www.evitp.org/about, accessed August 22, 2016.
Environmental Protection Agency (EPA). 2016a. Integrated science assessment for oxides of nitrogen: Health criteria (2016 final report). Online at https://cfpub.epa.gov/ncea/isa/recordisplay.cfm?deid=310879, accessed September 16, 2016.
Environmental Protection Agency (EPA). 2016b. EJSCREEN: EPA’s environmental justice screening and mapping tool (Version 2016). Online at https://ejscreen.epa.gov/mapper/, accessed September 16, 2016.
Environmental Protection Agency (EPA). 2015. Greenhouse gas inventory data explorer. Online at www3.epa.gov/climatechange/ghgemissions/inventoryexplorer/#allsectors/allgas/econsect/all, accessed September 16, 2016.
Environmental Protection Agency (EPA). 2014. Near roadway air pollution and health. Online at www3.epa.gov/otaq/nearroadway.htm, accessed September 16, 2016.
Environmental Protection Agency (EPA). 2002. Health assessment document for diesel engine exhaust. EPA/600/8-90/057F. Washing-ton, DC. Online at https://hero.epa.gov/hero/index.cfm/reference/ download/reference_id/42866, accessed September 16, 2016.
Eudy, L., M. Post, C. Gikakis. 2015. Fuel cell buses in U.S. transit fleets: Current status 2015. NREL/TP-5400-64974. Golden, CO: Na-tional Renewable Energy Laboratory.
Field, K. 2015. A look under the hood at the BYD electric bus fac-tory. CleanTechnica, October 21. Online at http://cleantechnica.com/2015/10/21/look-hood-byd-electric-bus-factory, accessed August 21, 2016.

49Delivering Opportunity
Lepeule, J., F. Laden, D. Dockery, and J. Schwartz. 2012. Chronic exposure to fine particles and mortality: An extended follow- up of the Harvard Six Cities Study from 1974 to 2009. Environ-mental Health Perspectives120(7):965–970.doi:10.1289/ehp.1104660.
Liang, F., M. Lu, T.C. Keener, Z. Liu, and S.J. Khang. 2005. The or-ganic composition of diesel particulate matter, diesel fuel and engine oil of a non-road diesel generator. Journal of Environmen-tal Monitoring7(10):983–988.doi:10.1039/B504728E.
MARCON. 2016. Electric bus feasibility study for the City of Edmon-ton. Online at www.edmonton.ca/documents/transit/Electric%20Bus%20Feasibility%20Study.pdf, accessed September 16, 2016.
Murano, R. 2016. E-mail message to author, August 9.
Musk, E. 2016. Master plan, part deux. Tesla. Blog, July 20. Online at www.tesla.com/blog/master-plan-part-deux, accessed September 16, 2016.
Nastos, P.T., A.G. Paliatsos, M.B. Anthracopoulos, E.S. Roma, and K.N. Priftis. 2010. Outdoor particulate matter and childhood asthma admissions in Athens, Greece: A time-series study. Environmental Health 9(45):1–9.doi:10.1186/1476-069X-9-45.
National Heart, Lung, and Blood Institute (NHLBI). 2015. What is a heart attack? Online at www.nhlbi.nih.gov/health/health-topics/topics/heartattack, accessed September 16, 2016.
New Flyer. No date. Xcelsior Electric. Online at www.newflyer.com/js/pdfjs/web/viewer.html?file=../../../images/downloads/buses/xcelsior- electric-brochure-web.pdf, accessed September 16, 2016.
Oak Ridge National Laboratory (ORNL). 2016. Freight analysis framework version 4.1. Online at http://faf.ornl.gov/fafweb/FUT.aspx, accessed September 16, 2016.
Orban, E., K. McDonald, R. Sutcliffe, B. Hoffmann, K.B. Fuks, N. Dragano, A. Viehmann, R. Erbel, K.H. Jöckel, N. Pundt, and S. Moebus. 2016. Residential road traffic noise and high depressive symptoms after five years of follow-up: Results from the Heinz Nixdorf Recall Study. Environmental Health Perspectives 124(5):578–585.doi:10.1289/ehp.1409400.
Pacific Gas and Electric Company (PG&E) 2016a. In step with Cali-fornia’s evolving energy policy, PG&E, labor and environmental groups announce proposal to increase energy efficiency, renew-ables and storage while phasing out nuclear power over the next decade. Online at www.pge.com/en/about/newsroom/newsdetails/index.page?title=20160621_in_step_with_californias_evolving_ energy_policy_pge_labor_and_environmental_groups_announce_proposal_to_increase_energy_efficiency_renewables_and_storage_while_phasing_out_nuclear_power_over_the_next_decade, accessed September 16, 2016.
Pacific Gas and Electric Company (PG&E). 2016b. Time-of-use sum-mer rates. Online at www.pge.com/en_US/business/rate-plans/rate-plans/time-of-use/time-of-use.page?WT.mc_id=Vanity_TOU, accessed September 16, 2016.
Hricko, A., G. Rowland, S. Eckel, A. Logan, M. Taher, and J. Wilson. 2014. Global trade, local impacts: Lessons from California on health impacts and environmental justice concerns for residents living near freight rail yards. International Journal of Environ-mental Research and Public Health11(2):1914–1941.doi:10.3390/ijerph110201914.
Impullitti, J. 2015. Zero emission cargo transport II: San Pedro Bay ports hybrid and fuel cell electric vehicle project. Presented at the US Department of Energy Vehicle Technologies Office Merit Review, Washington, DC, June 11. Online at http://energy.gov/sites/prod/files/2015/07/f24/vss158_cole_2015_o.pdf, accessed September 16, 2016.
Jerrett, M., R.T. Burnett, B.S. Beckerman, M.C. Turner, D. Krewski, G. Thurston, R.V. Martin, A. van Donkelaar, E. Hughes, Y. Shi, S.M. Gapstur, M.J. Thun, and C.A.Pope III. 2013. Spatial analysis of air pollution and mortality in California. American Journal of Respi-ratory and Critical Care Medicine188(5):593–99.doi:10.1164/rccm.201303-0609OC.
Jobs to Move America (JMA). No date. U.S. employment plan resources. Online at http://jobstomoveamerica.org/resources/ u-s-employment-plan-resources-2, accessed September 12, 2016.
Kahn, Z. 2016. E-mail message to author, June 14.
Kane, M. 2016. Proterra Catalyst electric bus completes reliability test by King County Metro. Inside EVs. Online at http://insideevs.com/proterra-catalyst-electric-bus-completes-reliability- test-by-king-county-metro, accessed September 16, 2016.
Kaufman, J.D., S.D. Adar, R.G. Barr, M. Budoff, G.L. Burke, C.L. Curl, M.L. Daviglus, A.V. Diez Roux, A.J. Gassett, D.R. Jacobs, Jr., R. Kronmal, T.V. Larson, A. Navas-Acien, C. Olives, P.D. Sampson, L. Sheppard, D.S. Siscovick, J.H. Stein, A.A. Szpiro, and K.E. Wat-son. 2016. Association between air pollution and coronary artery calcification within six metropolitan areas in the USA (the Multi-Ethnic Study of Atherosclerosis and Air Pollution): A longitudi-nalcohortstudy. The Lancet 388(10045):696–704.doi:10.1016/S0140-6736(16)00378-0.
Kim,I.,E.Kirsch,andC.Reyes.2010. Making green work: Best prac-tices in green-collar job training. Oakland, CA: Ella Baker Center for Human Rights, Green-Collar Jobs Campaign. Online at http://ellabakercenter.org/sites/default/files/downloads/making-green-work.pdf, accessed August 21, 2016.
Lantero, A. 2014. Energy jobs: Electric vehicle charging station in-staller. Washington, DC: US Department of Energy. Online at www.energy.gov/articles/energy-jobs-electric-vehicle-charging- station-installer, accessed October 17, 2016.
Lee, D.Y., V.M. Thomas, and M.A. Brown. 2013. Electric urban deliv-ery trucks: Energy use, greenhouse gas emissions, and cost-effec-tiveness. Environmental Science & Technology47(14):8022–8030.doi:10.1021/es400179.
Lelieveld, J., J.S. Evans, M. Fnais, D. Giannadaki, and A. Pozzer. 2015. The contribution of outdoor air pollution sources to premature mortality on a global scale. Nature525(7569):367–371.doi:10.1038/nature15371.
50 union of concerned scientists | the greenlining institute
Sørensen, M., Z.J. Andersen, R.B. Nordsborg, S.S. Jensen, K.G. Lille-lund, R. Beelen, E.B. Schmidt, A. Tjønneland, K. Overvad, and O. Raaschou-Nielsen. 2012. Road traffic noise and incident myocar-dial infarction: A prospective cohort study. PLoS ONE 7(6):e39283. doi:10.1371/journal.pone.0039283.
Sørensen, M., Z.J. Andersen, R.B. Nordsborg, T. Becker, A. Tjønne-land, K. Overvad, and O. Raaschou-Nielsen. 2013. Long-term ex-posure to road traffic noise and incident diabetes: A cohort study. Environmental Health Perspectives121(2):217–222.doi:10.1289/ehp.1205503.
South Coast Air Quality Management District (SCAQMD). 2016. Draft 2016 air quality management plan, Chapter 4. Online at www.aqmd.gov/home/library/clean-air-plans/air-quality- mgt-plan/Draft2016AQMP, accessed September 16, 2016.
U-Haul. No date a. 10ft moving truck rental. Online at www.uhaul.com/Trucks/10ft-Moving-Truck-Rental/TM, accessed September 16, 2016.
U-Haul. No date b. 17ft moving truck rental. Online at www.uhaul.com/Trucks/17ft-Moving-Truck-Rental/EL, accessed September 16, 2016.
Union of Concerned Scientists (UCS). 2015. Cleaner cars from cradle to grave. Online at www.ucsusa.org/sites/default/files/ attach/2015/11/Cleaner-Cars-from-Cradle-to-Grave-full-report.pdf, accessed September 16, 2016.
Union of Concerned Scientists (UCS). No date. Biodiesel basics. Online at www.ucsusa.org/clean-vehicles/clean-fuels/biodiesel- basics, accessed September 16, 2016.
US Census Bureau (USCB). 2004. California 2002 economic census: Vehicle inventory and use survey. EC02TV-CA. Washington, DC. Online at www.census.gov/prod/ec02/ec02tv-ca.pdf, accessed Sep-tember 16, 2016.
US Census Bureau (USCB). No date. 2010-2014 American Commu-nity Survey 5-year estimates. Online at http://factfinder.census.gov/bkmk/table/1.0/en/ACS/14_5YR/B08006/0400000US06, accessed September 16, 2016.
US Department of Energy (USDOE). No date. Biodiesel. Online at www.fueleconomy.gov/feg/biodiesel.shtml, accessed September 16, 2016.
US Department of Labor, Bureau of Labor Statistics (USDOL/BLS). 2016. Automotive industry: Employment, earnings, and hours. Online at www.bls.gov/iag/tgs/iagauto.htm, accessed September 12, 2016.
US Department of Labor, Employment and Training Administration (USDOL/ETA). 2016a. The occupational information network (O*NET): Summary report for: 51-2092.00— team assemblers. Online at www.onetonline.org/link/summary/51-2092.00, accessed August 21, 2016.
Papson, A., and M. Ippoliti. 2013. Key performance parameters for dray-age trucks operating at the ports of Los Angeles and Long Beach. Pasadena, CA: CALSTART. Online at www.calstart.org/Libraries/I-710_Project/Key_Performance_Parameters_for_ Drayage_Trucks_Operating_at_the_Ports_of_Los_Angeles_and_Long_Beach.sflb.ashx, accessed September 16, 2016.
Pope C.A., R.T. Burnett, M.J. Thun, E.E. Calle, D. Krewski, K. Ito, and G.D. Thurston. 2002. Lung cancer, cardiopulmonary mortality, and long-term exposure to fine particulate air pollution. Journal of the American Medical Association287(9):1132–1141.doi:10.1001/jama.287.9.1132.
Power, M.C., M.G. Weisskopf, A.E. Stacey, B.A. Coull, A. Spiro, and J. Schwartz. 2011. Traffic-related air pollution and cognitive func-tion in a cohort of older men. Environmental Health Perspectives 119(5):682–687.doi:10.1289/ehp.1002767.
Proterra. 2016. Proterra Catalyst E2 series sets new industry prece-dent with a nominal range of up to 350 miles. Online at www.proterra.com/press-release/proterra-catalyst-e2-series-sets-new-industry-precedent-with-a-nominal-range-of-up-to-350-miles, accessed September 16, 2016.
Proterra. No date. Manufacturing: Electrical associate I. Online at www.appone.com/MainInfoReq.asp?R_ID=1328672&B_ID=83&fi-d=1&Adid=&ssbgcolor=273A5B&SearchScreenID=1755&Count-ryID=3&LanguageID=2&InternalJobCode=112734, accessed, September 12, 2016.
Randall, T. 2016. Here’s how electric cars will cause the next oil crisis. Bloomberg, February 25. Online at www.bloomberg.com/ features/2016-ev-oil-crisis, accessed September 16, 2016.
Reichmuth, D. 2016. Do electric cars work in cold weather? Get the facts. The Equation. Cambridge, MA: Union of Concerned Scientists. Blog, February 16. Online at http://blog.ucsusa.org/ dave-reichmuth/electric-cars-cold-weather-temperatures, accessed September 16, 2016.
Rich, D.Q., K. Liu, J. Zhang, S.W. Thurston, T.P. Stevens, Y. Pan, C. Kane, B. Weinberger, P. Ohman-Strickland, T.J. Woodruff, X. Duan, V. Assibey-Mensah, and J. Zhang. 2015. Differences in birth weight associated with the 2008 Beijing Olympic air pollution reduction: Results from a natural experiment. Environmental Health Perspectives123(9)880–887.doi:10.1289/ehp.1408795.
Rowangould, G.M. 2013. A census of the U.S. near-roadway popula-tion: Public health and environmental justice considerations. Transportation Research Part D: Transport and Environment 25:59–67.doi:10.1016/j.trd.2013.08.003.
Schuchard, R., J. Boesel, B. Van Amburg, C. LeCroy, and M. Miller. 2016. California’s clean transportation technology: Time to shift into high gear. Pasadena, CA: CALSTART. Online at www.calstart.org/Libraries/Policy_Documents/California_s_Clean_ Transportation_Technology_Industry_-_2016.sflb.ashx, accessed August 21, 2016.
Shetterly, R. 2016. E-mail message to author, August 5.

51Delivering Opportunity
US Department of Labor, Employment and Training Administration (USDOL/ETA). 2016j. The occupational information network (O*NET): Summary report for: 47-2111.00—electricians. Online at www.onetonline.org/link/summary/47-2111.00, accessed August 21, 2016.
US Department of Labor, Employment and Training Administration (USDOL/ETA). 2016k. The occupational information network (O*NET): Summary report for: 49-9051.00—electrical power-line installers and repairers. Online at www.onetonline.org/link/ summary/49-9051.00, accessed August 21, 2016.
US Department of Labor, Employment and Training Administration (USDOL/ETA). 2016l. The occupational information network (O*NET): Summary report for: 49-3023.02—automotive specialty technicians. Online at www.onetonline.org/link/summary/ 49-3023.02, accessed August 21, 2016.
US Department of Labor, Employment and Training Administration (USDOL/ETA). 2016m. The occupational information network (O*NET): Browse Bright Outlook occupations. Online at www.onetonline.org/find/bright, accessed September 12, 2016.
US Department of Labor, Employment and Training Administration (USDOL/ETA). 2016n. The occupational information network (O*NET): Summary report for: 17-3029.09—manufacturing production technicians. Online at www.onetonline.org/link/ summary/17-3029.09, accessed September 12, 2016.
US Department of Transportation, Federal Transit Administration (USDOT/FTA). 2016. Fiscal year 2015 low and no-emission vehi-cle deployment program projects. Online at www.transit.dot.gov/funding/grants/fiscal-year-2015-low-and-no-emission-vehicle- deployment-program-projects, accessed August 21, 2016.
US Maritime Administration (US MARAD). 2015. U.S. waterborne foreigncontainertradebyU.S.customsports(2000–2015). Online at www.marad.dot.gov/resources/data-statistics/ #Trade%20Statistics, accessed September 12, 2016.
Warren, D. 2016. No title. Presented at the Advanced Clean Transit Technology Symposium, Sacramento, February 8. Online at www.arb.ca.gov/msprog/bus/meet/tspresent/s2_warren.pdf, accessed September 16, 2016.
Wong, C.M., H. Tsang, H.K. Lai, G. N. Thomas, K.B. Lam, K.P. Chan, Q. Zheng, J.G. Ayres, S.Y. Lee, T.H. Lam, and T.Q. Thach. 2016. Cancer mortality risks from long-term exposure to ambient fine particle. Cancer Epidemiology, Biomarkers and Prevention 25(5): 1–7.doi:10.1158/1055-9965.EPI-15-0626.
Yuan, J. 2016. Low Carbon Fuel Standard. Presented at the California Air Resources Board Low Carbon Fuel Standard Overview, Sacra-mento, April 7. Online at www.arb.ca.gov/msprog/bus/04072016.pdf, accessed September 16, 2016.
US Department of Labor, Employment and Training Administration (USDOL/ETA). 2016b. The occupational information network (O*NET): Summary report for: 51-2023.00—electromechanical equipment assemblers. Online at www.onetonline.org/link/ summary/51-2023.00, accessed August 21, 2016.
US Department of Labor, Employment and Training Administration (USDOL/ETA). 2016c. The occupational information network (O*NET): Summary report for: 51-2022.00—electrical and elec-tronic equipment assemblers. Online at www.onetonline.org/link/summary/51-2022.00, accessed August 21, 2016.
US Department of Labor, Employment and Training Administration (USDOL/ETA). 2016d. The occupational information network (O*NET): Summary report for: 51-9122.00—painters, transporta-tion equipment. Online at www.onetonline.org/link/summary/ 51-9122.00, accessed August 22, 2016.
US Department of Labor, Employment and Training Administration (USDOL/ETA). 2016e. The occupational information network (O*NET): Summary report for: 51-9198.00—helpers--production workers. Online at www.onetonline.org/link/summary/51-9198.00, accessed August 22, 2016.
US Department of Labor, Employment and Training Administration (USDOL/ETA). 2016f. The occupational information network (O*NET): Summary report for: 51-9061.00—inspectors, testers, sorters, samplers, and weighers. Online at www.onetonline.org/link/summary/51-9061.00, accessed August 21, 2016.
US Department of Labor, Employment and Training Administration (USDOL/ETA). 2016g. The occupational information network (O*NET): Summary report for: 51-4011.00—computer-controlled machine tool operators, metal and plastic. Online at www. onetonline.org/link/summary/51-4011.00, accessed August 22, 2016.
US Department of Labor, Employment and Training Administration (USDOL/ETA). 2016h. The occupational information network (O*NET): Summary report for: 51-4121.06—welders, cutters, and welder fitters. Online at www.onetonline.org/link/summary/ 51-4121.06, accessed August 22, 2016.
US Department of Labor, Employment and Training Administration (USDOL/ETA). 2016i. The occupational information network (O*NET): Summary report for: 51-4041.00—machinists. Online at www.onetonline.org/link/summary/51-4041.00, accessed August 22, 2016.

52 union of concerned scientists | the greenlining institute
[ appendices ]
THE FolloWiNg AppENdiCEs CAN BE FouNd oNliNE AT
WWW.UCSUSA.ORg/ELECTRiCTRUCkS.
Appendix A: Job Profiles
Appendix B: Training Programs
Appendix C: Methodology for Heavy-Duty Vehicle Emissions Analysis


In California, transportation is the largest source of air pollution and global warming emissions. While significant progress has been made to electrify passenger vehicles, action must be taken to bring the same technology and policies to heavy-duty trucks and buses. These vehicles produce not only the heat-trapping emissions that lead to climate change, but also produce significant amounts of
particulate matter and smog that endangers public health, espe-cially in communities of color and low-income communities that are located near busy roads. With policies, investments in clean technology, and equitable job training, electric trucks and buses can deliver clean air, reduce global warming emissions, and create job opportunities.
Delivering OpportunityHow Electric Buses and Trucks Can Create Jobs and Improve Public Health in California
California’s emerging electric truck and bus sector can increase employ ment in underserved communities, as well as reduce air pollution and global warming emissions.
Founded in 1993, The Greenlining Institute envisions a nation where communities of color thrive and race is never a barrier to economic opportunity. Because people of color will be the majority of our population by 2044, America will prosper only if communities of color prosper. Greenlining advances economic opportunity and empowerment for people of color through advocacy, community and coalition building, research, and leadership development.
nATIonAL HEADquArTErs Two Brattle SquareCambridge, MA 02138-3780
Phone: (617) 547-5552Fax: (617) 864-9405
printed on recycled paper using vegetable-based inks © OCTOBER 2016 (UPDATED MAY 2017) union of concerned scientists and the greenlining institute
1918 University Avenue, Suite 2BBerkeley, CA 94704
Phone: (510) 926-4001Fax: (510) 926-4010
The Union of Concerned Scientists puts rigorous, independent science to work to solve our planet’s most pressing problems. Joining with citizens across the country, we combine technical analysis and effective advocacy to create innovative, practical solutions for a healthy, safe, and sustainable future.
Concerned Scientists
Union of
Find THIS DOCUMENT online: www.ucsusa.org/ElectricTrucksand at: www.greenlining.org/issues/2016/
delivering-opportunity-electric-trucks