delivering on the promise of the affordable care act
TRANSCRIPT

Delivering on the Promise of the Affordable Care Act
ENROLL AMERICA 2015 NATIONAL CONFERENCE State of Enrollment: Getting America Covered
JUNE 11, 2015
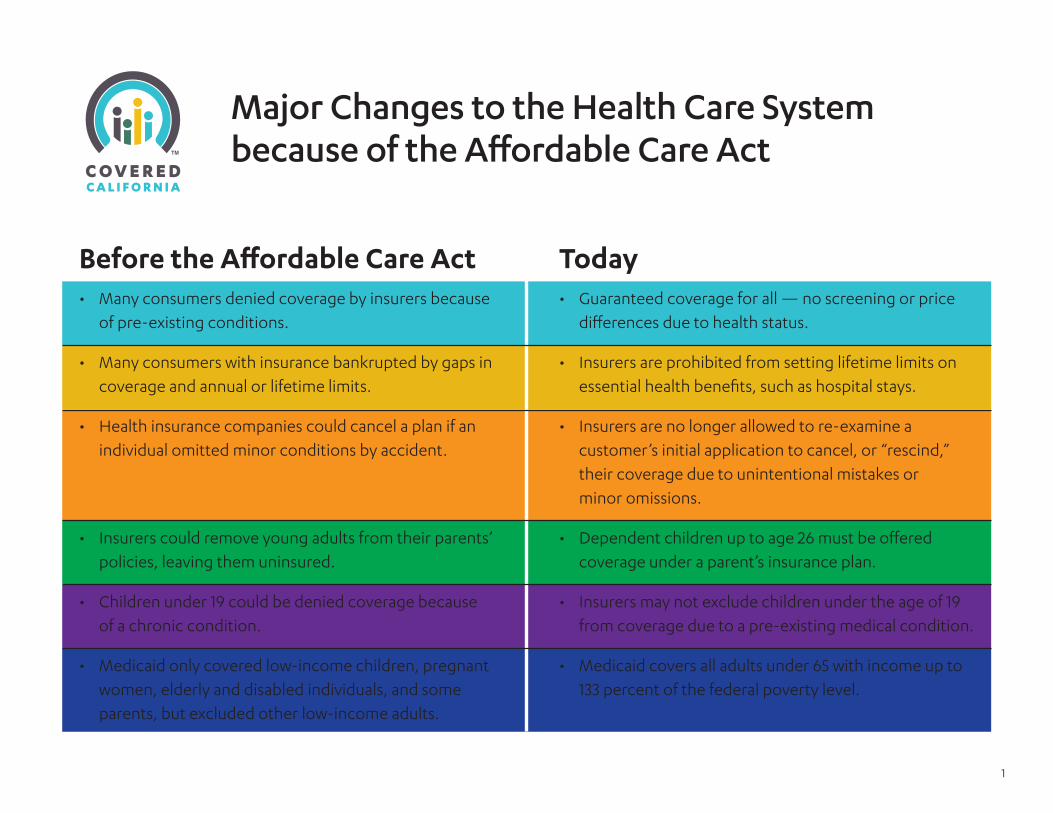
Major Changes to the Health Care Systembecause of the Affordable Care Act
Today• Guaranteed coverage for all — no screening or price
differences due to health status.
• Insurers are prohibited from setting lifetime limits on essential health benefits, such as hospital stays.
• Insurers are no longer allowed to re-examine a customer’s initial application to cancel, or “rescind,” their coverage due to unintentional mistakes or minor omissions.
• Dependent children up to age 26 must be offered coverage under a parent’s insurance plan.
• Insurers may not exclude children under the age of 19 from coverage due to a pre-existing medical condition.
• Medicaid covers all adults under 65 with income up to 133 percent of the federal poverty level.
Before the Affordable Care Act• Many consumers denied coverage by insurers because
of pre-existing conditions.
• Many consumers with insurance bankrupted by gaps in coverage and annual or lifetime limits.
• Health insurance companies could cancel a plan if an individual omitted minor conditions by accident.
• Insurers could remove young adults from their parents’ policies, leaving them uninsured.
• Children under 19 could be denied coverage because of a chronic condition.
• Medicaid only covered low-income children, pregnant women, elderly and disabled individuals, and some parents, but excluded other low-income adults.
1

Changing Health Care in CaliforniaThe Affordable Care Act has dramatically changed the health insurance landscape inCalifornia with the expansion of Medicaid, Covered California and new protections forall Californians.
Source: The bar chart data are from California Health Benefits Review Program, Estimates of Sources of Health Insurance in California for 2013 and 2015. Other data are from Covered California as of May. Notes: The Medi-Cal category in the bar chart does not include the Healthy Families program or those simultaneously eligible for Medicare and Medi-Cal. Medicare recipients and other publicly funded insured are not included in the graph.
1 http://www.commonwealthfund.org/publications/press-releases/2014/jul/after-first-aca-enrollment-period
Cal
iforn
ians
, in
mill
ions
2013
UNINSURED
EMPLOYERSPONSORED
MEDI-CAL
INDIVIDUAL MARKETunsubsidized
5.1
2.8
17.8
8.3
2.2
18.8
5.3
0
5
10
15
20
25
30
35
2015
As of March 2015, Covered California has approximately 1.3 million members who have active health insurance. California has also enrolled nearly 3 million more into Medi-Cal of whom over 2 million are newly eligible.
COVERED CALIFORNIAsubsidized, unsubsidizedand new Medi-Cal
EMPLOYER
1.3
All Californians now benefit from insurance policy changes.
UNINSURED
From 2013 to 2015, the number of uninsured Californians has been reduced by almost half.1
2.1
2
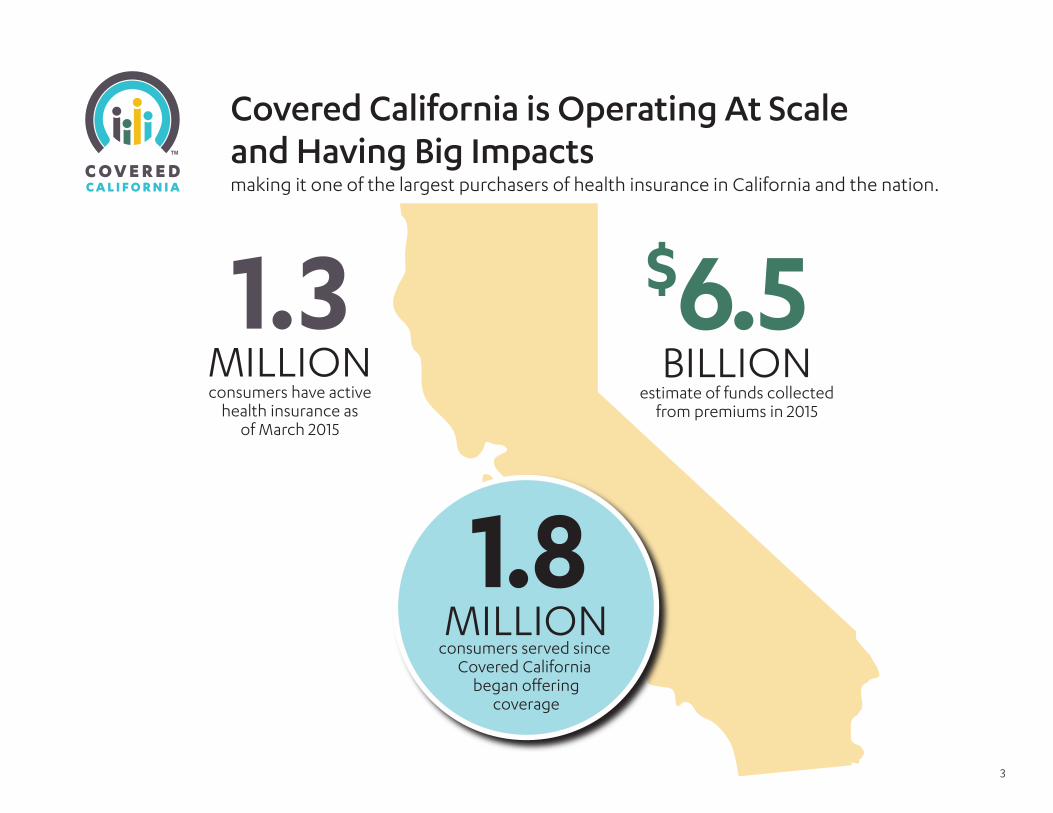
Covered California is Operating At Scale and Having Big Impactsmaking it one of the largest purchasers of health insurance in California and the nation.
1.8MILLION
consumers served since Covered California
began offeringcoverage
1.3MILLIONconsumers have active
health insurance asof March 2015
$6.5BILLION
estimate of funds collectedfrom premiums in 2015
3

Covered California’s Strong Balance Sheet and Financial Management Assures Long-Term Viability
Do
llars
, in
mill
ions
Fiscal Year
0
100
200
300
400
500
600
700
2013-14 2014-15 2015-16 2016-17 2017-18 2018-19
FEDERAL GRANT PLUS PLAN ASSESSMENTS PLAN ASSESSMENTS ONLY
YEAR-END RESERVES
EXPENDITURES
GRANT ENDS DEC. 2015BEGIN COLLECTING ASSESSMENTS JAN. 2014
4

Covered California is Enrolling All Communities Across Our StateEnrollment data proves that our efforts to reach California’s diverse population is working
Black/African-American 4%
Mixed Race 3%
Native Hawaiianand other Paci�c Islander <1%
American Indianand Alaska Native <1%
Other 3%White34%
Asian18%
Latino37%
Second Open Enrollment Nov. 1, 2014 - Feb. 15, 2015
An independent study conducted by the Kaiser Family Foundation2 confirmed that:
• Covered California enrollees are more racially diverse than the group of Californians with private coverage. 60 percent identify as a race/ethnicity other than white. Latinos make up 37 percent of the total.
Estimated subsidy-eligible population of the state developed by the University of California’s statistical model 1:
1 CalSIM version 1.91 Statewide Data Book 2015-2019http://bit.ly/1Que1NV
2 Henry J. Kaiser Family Foundation. 2015. “Coverage Expansions and the Remaining Uninsured: A Look at California During Year One of ACA Implementation”. Menlo Park, CA.
38%
LATINO34%
WHITE21%
ASIAN/PACIFICISLANDER
5%
AFRICAN-AMERICAN
5

Comparing Covered California Subsidy-Eligible Enrollment to Other States
1 2015 data: Kaiser Family Foundation’s “Marketplace Enrollees Eligible for Financial Assistance as a Share of Subsidy-Eligible Population” (http://bit.ly/1drsT2L). 2014 data: Kaiser Family Foundation’s “Marketplace Enrollees by Financial Assistance Status, April 2014” (http://bit.ly/1Iznep5) and (http://bit.ly/1MCWJOe).
Using Kaiser Family Foundation1 data, by the end of the second open enrollment period Covered California enrolled 68 percent of subsidy-eligible individuals, which is among the top 10 states and 11 percentage points higher than the national average.
Subsidy-Eligible Plan Selections as a Percent of Total Potential Subsidy-Eligible for All States
6

Independent Study Shows Improvement in Health Care Access for Covered California Enrollees
A Kaiser Family Foundation study from May 2015 shows the following trends:
· 91 percent of Covered California enrollees reported it was “very” or “somewhat easy” to travel to their usual source of care, which matches the Other Private markets (Figure 19).
· 59 percent of Covered California enrollees had a check-up or preventive care visit by the Fall of 2014, which is nearly twice the rate for preventive visits amongst the uninsured (Figure 20). This is not significantly statistically different from other private market, and if extrapolated over time, this means more than 800,000 preventive visits have been provided through Covered California since Jan. 2014.
Figure 19Figure 19
82% 85% 89%*82% 83%
91%* 91%*
Uninsured Newly Insured PreviouslyInsured
Uninsured Medi-Cal CoveredCalifornia
Other Private
NOTES: Includes adults ages 19-64. “Previously Insured” includes people who were insured as of interview date and have been insured since before January 2014; some of these people may have switched coverage type. “Newly Insured” include people who were insured as of int erview date and gained coverage since January 2014. “Uninsured” includes people who lacked coverage as of the interview date. “Usual Source o f Care” does not include care received at an emergency department. *Significantly different from Uninsured at the p<0.05 level.SOURCE: 2014 Kaiser Survey of Low-Income Americans and the ACA.
Ease of Travel to Usual Source of Care Among Nonelderly Adults in California, by Insurance Coverage and Type in Fall 2014Share reporting it was “very” or “somewhat easy” to travel to their usual source of care:
Figure 20Figure 20
45%
58%*
80%*
45%
77%*71%*
78%*
31%
47%*
66%*
31%
58%* 59%*65%*
Uninsured Newly Insured PreviouslyInsured
Uninsured Medi-Cal CoveredCalifornia
Other Private
Used any medical services Had check-up or preventive care visit
Use of Medical Services Among Nonelderly Adults in California, by Insurance Coverage and Type in Fall 2014
NOTES: Includes adults ages 19-64. “Previously Insured” includes people who were insured as of interview date and have been insured since before January 2014; some of these people may have switched coverage type. “Newly Insured” include people who were insuredas of interview date and gained coverage since January 2014. “Uninsured” includes people who lacked coverage as of the interviewdate. *Significantly different from Uninsured at the p<0.05 level. SOURCE: 2014 Kaiser Survey of Low-Income Americans and the ACA.
Source: Henry J. Kaiser Family Foundation. 2015. “Coverage Expansions and the Remaining Uninsured: A Look at California During Year One of ACA Implementation”. Menlo Park, CA. 7

2015 STANDARD BENEFIT DESIGN BY METAL TIER
Coverage Category Minimum Coverage Bronze Enhanced Silver 94 Enhanced Silver 87 Enhanced Silver 73 Silver Gold Platinum
Percent of cost coverage changes
Covers 0% until out-of-pocket
maximum is met
Covers 60% average annual cost
Covers 94% average annual cost
Covers 87% average annual cost
Covers 73% average annual cost
Covers 70% average annual cost
Covers 80% average annual cost
Covers 90% average annual cost
Cost-sharing Reduction Single Income Range N/A N/A up to $17,235
(100% to ≤150% FPL)$17,236 to $22,980
(>150% to ≤200% FPL)$22,981 to $28,725
(>200% to ≤250% FPL) N/A N/A N/A
Annual Wellness Exam $0 $0 $0 $0 $0 $0 $0 $0
Primary Care Vist
after first 3 non-preventive visits, pay negotiated carrier rate per instance until out-of-pocket
maximum is met
$60 for first 3 non-preventive
visits$3 $15 $40 $45 $30 $20
Specialist Visit
pay negotiated carrier rate per
service until out-of-pocket
maximum is met
$70 after deductible is met
$5 $20 $50 $65 $50 $40
Laboratory Tests30% after
deductible is met$3 $15 $40 $45 $30 $20
X-Rays and Diagnostics30% after
deductible is met$5 $20 $50 $65 $50 $40
Generic Drugs$15 or less after deductible is met
$3 $5 $15 or less $15 or less $15 or less $5 or less
Preferred Drugs$50 after
deductible is met$5 $15 $35 $50 $50 $15
Emergency Room$300 after
deductible is met$25 $75 $250 $250 $250 $150
Imaging30% after
deductible is met10% 15% 20% 20% 20% 10%
Deductible N/A $5,000 $0$500 medical
$50 brand drugs$1,600 medical
$250 brand drugs$2,000 medical
$250 brand drugs$0 $0
Annual Out-of-Pocket Maximum
Individual and Family
$6,600 individual only
$6,250 individual $12,500 family
$2,250 individual $4,500 family
$2,250 individual $4,500 family
$5,200 individual $10,400 family
$6,250 individual $12,500 family
$6,250 individual $12,500 family
$4,000 individual $8,000 family
2015 Health Insurance Benefits and Rates
8
Covered California 2015 Standard Benefit DesignsIn California, standard benefits seek to encourage utilization of the right care at the right time because many services are not subject to a deductible Benefits below shown in blue are not subject to any deductible.

Covered California Consumers Are Getting Real Value
ENHANCED
Silver73 11%
128,000
Silver 11%
128,000
Bronze 24%
280,000
Platinum 3%
40,000
Gold 4%
52,000
ENHANCED
Silver87 30%
357,000ENHANCED
Silver94 17%
199,000
58 percent of Covered California’s subsidy-eligible population enrolled in an Enhanced Silver plan, which means lower costs when accessing services.
77 percent pay less than $150 per individual.
25 percent of enrollees in an Enhanced Silver94 plan pay less than $25 per individual, while more than half pay less than $50. In addition, these individuals pay only $3 for doctor visits.
Covered California’s Standard Benefit Design:
• Bronze — three office visits and lab work, not subject to deductible.
• Silver, Gold, Platinum — no deductibles on any outpatient services.
More than 120,000 enrollees pay less than $10 per individual.
2015 Subsidized Enrollmentby Metal Tier
Source: Covered California enrollment data as of April 2015, including only subsidized enrollees who have paid for coverage.
A few notes on monthly premium costs:
9

Covered California Standard Benefit Design:A Tale of Three Cities
Los Angeles
7Silver products
available
Denver
35Silver products
available
Miami
35Silver products
available
The number of health insurance products available at the Silver tier:
10

Covered California compared plans in three different states for a family of four with 35 year-old adults who earn $70,000 per year seeking a Silver plan.
Los Angeles – 7 Silver products available
Premium: $457 - $649Benefits not subject to deductible
Preventative care copay no cost Primary care visit copay $3 - $45 Specialty care visit copay $5 - $65 Generic medication copay $3 -$15 Lab testing copay $3 -$45 X-Ray copay $5 -$65 Emergency room copay $25 - $250
Preferred brand copay after $5 - $50drug deductible (if any)
Deductible $0 - $4,000brand drug deductible $0 - $500
High cost and infrequent 10-20% of your services plan’s negotiated rate
Maximum out-of-pocket $12,500
Denver – 35 Silver products available
Premium: $602 - $1,362
Benefits — For some plans, regular outpatient care is subject to deductible
Deductible combined medical & drug ranges between: $0 to $10,000
additional details vary widely by plan
Maximum Out-of-Pocket Ranges from $7,300 to $13,200
Miami – 35 Silver products available
Premium: $539 - $1,267
Benefits — For some plans, regular outpatient care is subject to deductible
Deductible combined medical & drug ranges between: $0 to $11,500
additional details vary widely by plan
Maximum Out-of-Pocket Ranges from $7,000 to $13,200
Bronze 42%
Platinum <1%
Gold 10%
California 2015 Enrollment Colorado 2015 Enrollment Florida 2015 Enrollment
Silver 47%
Bronze 25%
Platinum 5%
Gold 5%
Silver 65% Bronze 15%
Platinum 4%
Gold 3%
Silver 76%
Covered California Standard Benefit Design:A Tale of Three Cities
11
Covered California is Building the Platform To Improve the Delivery of Care
For Covered California, being an “active purchaser” is about far more than just selecting plans and negotiating for the best possible rates. The negotiations and contract requirements are specifically designed to promote the triple aim at the delivery of care: better quality, promoting health and wellness and lowering costs.
Covered California recognizes that promoting better care delivery and reducing disparities requires coordinated action across large public and private purchasers and the plans they contract with.
The following link shows the contract terms all Covered California plans must agree to. Specifically, Attachment 7 addresses quality, network management and delivery system standards: http://hbex.coveredca.com/solicitations/QHP/library/QHPModelContractAttachments-Final.pdf.
Based on these, plans have requirements to:
• Participate in payment reform and quality collaboratives
• Develop programs that chart progress in reducing health disparities in meaningful and measurable ways.
• Have a process that determines, monitors and records the health status of consumers over the age of 18 and use the information to promote better health among consumers.
• Encourage consumers to use their insurance and seek health and wellness services.
• Help consumers select a primary care physician, find a federally-qualified clinic or team-based center (medical home) to coordinate all health and wellness needs.
• Actively help consumers with chronic conditions manage their illness through providers specializing in coordinated care. Conditions could include hypertension, diabetes, asthma and heart disease.
• Provide and update information showing total costs and out-of-pocket costs for the most-used services and highest-cost services.
Covered California is assessing health plans efforts in these areas and will be “raising the bar” in coming years.
12