deliverable d6 - archive.aquaexcel.eu filethe collected information was used also for a swot...
TRANSCRIPT

AQUAEXCEL 262336– Deliverable D6.6
Page 1 of 29
AQUAEXCEL
Aquaculture Infrastructures for Excellence in European Fish Research
Project number: 262336
Combination of CP & CSA
Seventh Framework Programme
Capacities
Deliverable D6.6
Title: Effect of the e-Infrastructure
Due date of deliverable: M48
Actual submission date: M47
Start date of the project: March 1st, 2011 Duration: 48 months
Organisation name of lead contractor: HCMR
Revision: V1.0
Project co-funded by the European Commission within the Seventh Framework Programme
(2007-2013)
Dissemination Level
PU Public X
PP Restricted to other programme participants (including the Commission Services)
RE Restricted to a group specified by the consortium (including the Commission Services)
CO Confidential, only for members of the consortium (including the Commission Services)

AQUAEXCEL 262336– Deliverable D6.6
Page 2 of 29
Table of contents
Table of contents..................................................................................... 2
Glossary .................................................................................................. 3
Definitions ............................................................................................... 4
1. Introduction ..................................................................................... 6
1.1. Main aims ..................................................................................................... 6
2. Methodology ................................................................................... 6
2.1. Questionnaire .............................................................................................. 7
2.2. Assumptions ................................................................................................ 8
3. Results.......................................................................................... 11
3.1 Effects on the design ................................................................................ 11
3.2 Effects on the outcome ............................................................................. 12 3.3 Effects on the cost .................................................................................... 12
3.4 Effects on collaboration ............................................................................ 13 3.5 SWOT analysis ........................................................................................ 13
4 Conclusions ................................................................................................ 14
References ............................................................................................ 14
Annex 1 ................................................................................................. 16

AQUAEXCEL 262336– Deliverable D6.6
Page 3 of 29
Glossary
AQUAEXCEL: Aquaculture Infrastructures for Excellence in European Fish Research

AQUAEXCEL 262336– Deliverable D6.6
Page 4 of 29
Definitions
e-infrastructure: An electronic infrastructure to facilitate interchange of data and remote operation between research facilities over the internet.

AQUAEXCEL 262336– Deliverable D6.6
Page 5 of 29
Summary
Objectives
The main objective of AQUAEXCEL WP6 was to develop, implement and evaluate an e-Infrastructure for aquaculture research facilities. The specific objectives of Task 6.4, which resulted in the present deliverable, are to evaluate how the e-Infrastructure will contribute to future aquaculture research, focusing on the experimental design, the logistics of the experimentation, the cost, the potential outcome and the “new” collaboration scheme.
Rationale:
Although an experimental investigation of the impact of the e-Infrastructure would require comparative studies this was not considered feasible within the scope of this workpackage. Instead, a three steps approach was applied. (a) The already performed trials within AQUAEXCEL were re-designed applying both the standard approach and using the (or a potential) e-infrastructure. (b) The partners proceeded with a “virtual” implementation of the experiments following both approaches, concluding with a description of the procedures, logistics and the costs. (c) The last step was the analysis performed considering the potential results and the differences between the two approaches.
For this, a questionnaire on the use of e-infrastructure was designed and the WP6 partners participated in a survey. The collected information was used also for a SWOT analysis. The main results showed that e-infrastructure results in the collection of more and better quality data, facilitate the data access between partners and make easier the sampling procedure reducing the possibility of experimental failure in a more economic manner. On the other hand e-infrastructure increases the cost of the investment and may increase the cost of data analysis while the requirement for skilled personnel is increased. The lack of direct communication between partners, as a result of the reduced travelling to the experimental sites, may require the development of new schemes of collaboration.
Teams involved:
HCMR
SINTEF
NTNU
NOFIMA
WU
IMARES
Geographical areas covered:
AQUAEXCEL implementation area (particularly Greece, Norway, The Netherlands)

AQUAEXCEL 262336– Deliverable D6.6
Page 6 of 29
1. Introduction
Main aims
AQUAEXCEL WP6 aims to develop, implement and evaluate technical solutions (e-Infrastructure) for providing remote access to highly specialized aquaculture research facilities, and facilitate cooperation within the consortium.
In Task 6.4 the objective is to evaluate how the e-Infrastructure will contribute to future aquaculture research. In particular the evaluation is focusing on
(i) the experimental design,
(ii) the logistics of the experimentation,
(iii) the cost
(iv) the potential outcome and
(v) the “new” collaboration scheme.
For the purpose of the present analysis an “electronic infrastructure” is considered to facilitate interchange of data and remote operation between research facilities over the internet. In particular it is expected to allow the online access to information regarding monitoring of various sensors (e.g. T, DO, pH, etc), videos, alarms, the proper operation of pumps, engines etc. It is also expected to allow control on equipment such as valves, feeders, etc…, and finally the access to data sets.
2. Methodology
The e-Infrastructure is expected to be an enabling technology for cooperation within the consortium. An experimental investigation of the impact of the e-Infrastructure would require comparative studies and detailed analysis of the implementation procedures and the results obtained. This, however, is not considered feasible (due to the required time and money) within the scope of this workpackage. Instead, a three steps approach was proposed and has been applied as described below.
(a) The partners considered the facilities involved in the implementation of WP8. The already performed trials were re-designed applying both the standard approach and using the (or a potential) e-infrastructure.
(b) The partners then proceeded with a “virtual” implementation of the experiments following both approaches. This was concluded with a description, at maximum possible detail, of the procedures, logistics and the costs.
(c) The last step of the evaluation was the analysis that was performed considering also the potential results and the differences between the two approaches.

AQUAEXCEL 262336– Deliverable D6.6
Page 7 of 29
In order to facilitate the work a questionnaire on the use of e-infrastructure was designed and the partners involved in WP6 participated in a survey.
Furthermore, the possibility of experiments that couldn’t be easily realized without the e-infrastructure were also considered. Finally, an analysis based on benefits and costs of the use of the e-infrastructure was also considered.
2.1 Questionnaire
For the development of the questionnaire, a template was used describing the procedures for
the implementation of an aquaculture experiment. A three steps approach was adopted and
subsequently analyzed: (a) the design of the experiment, (b) the implementation and (c) the
analysis of results. In the following the template is presented.

AQUAEXCEL 262336– Deliverable D6.6
Page 8 of 29
A. Design
Definition of objectives
Experimental organism Requirements analysis, decision on species, size and number.
Decision on infrastructures
Replicates Type of infrastructure (tank, cages) and scale of trial
Analysis of existing instrumentation Check available instruments and resources
Duration Period to meet the objective
Sampling
Type of data Environment, biological performance, behavioral
Frequency Continues, daily, weekly, etc depending on type of data
Analysis
Analysis of existing data sets Check available information and existing datasets
B. Implementation
Experimental organism
Availability Transfer of organisms in place
Husbandry (rearing - culture) Start the trial (following adaptation if required)
Monitoring
Start up phase Ensure proper performance
Environment
Frequency Continues, daily collection of data
Corrections Actions to correct deviations from the protocol (e.g. adapt T, DO,)
Animals
Behavior Collection of data (video, direct observation)
Survival Estimates (direct or indirect measurements)
Actions in case of crisis (mortalities, pathologies etc)
Sampling
During the experiment Samples collection / perform measurements
Final Samples collection / perform measurements
C. Analysis
Data processing
- data collection
- data analysis
Bibliography review
Reporting

AQUAEXCEL 262336– Deliverable D6.6
Page 9 of 29
The design part includes information on the experimental organism, the type of infrastructure
to be used, the replicates required, the duration of the trial, the type of data to be collected,
instruments to be used, the sampling frequency and also considerations on the analysis
requirements.
The part of the implementation includes the availability of the required organisms and the
potential requirement for adaptation, the monitoring of the implementation and in particular
the starting phase of the trial that usually requires more attention in order to ensure proper
subsequent performance, the data collection and also actions of adaptation in case of
deviations or in case of critical periods such as when mortalities or pathologies appear. It is
also important to ensure that technical equipment is functioning properly, and that the
instrumentation is delivering data as expected.
For the analysis the data processing and the bibliographical review together with the
reporting are considered.
2.2 Assumptions
For the proper completion of the survey the following assumptions were made.
The experiment is organized and performed by researchers not affiliated with the facility, while local personnel assist as necessary following a standard approach similar to a Trans National Access project.
Furthermore, when the experiment is implemented using the standard approach, the responsible scientists is visiting the facility for planning, monitoring and collecting data. When however, the experiment is implemented using e-Infrastructure solutions, then scientists can monitor and collect data remotely and ideally with remote control. For the remote data collection, not specific technical solutions but generic ones are considered.
Also, any instrumentation for local monitoring and electronic storage of data is not necessarily part of the e-Infrastructure. The e-Infrastructure will only make these instruments/data available online for external users. In this sense, the amount of data and the analysis work would be the same in both cases. On the other hand, if a facility only has stand-alone instruments, the implementation of e-Infrastructure solutions will require that these instruments are connected to local networks first. This will increase in principle the initial installation cost of infrastructure, but it will also make data more accessible and reduce the amount of work for subsequent analysis.
Based on the previous work in WP6, generic technical solutions are described as a basis for evaluating the effects of using e-Infrastructure solutions (see for details AQUAEXCEL Deliverable 6.1 and 6.2):
A generic facility without e-Infrastructure
A generic facility with e-Infrastructure

AQUAEXCEL 262336– Deliverable D6.6
Page 10 of 29
a. Generic technical solutions for comparisons
The main difference between the alternatives is the possibility for remote access.
Figure 2.2.1: No e-Infrastructure solution
Figure 2.2.1 shows the alternative without e-Infrastructure, where an external user has no online access to the facility. This means that all planning, monitoring and data acquisition must be done through contact with facility personnel or by visits to the facility. Data from experiments must be assembled by facility personnel and sent by e-mail.
Figure 2.2.2: e-Infrastructure in place
Figure 2.2.2 shows the alternative with e-Infrastructure solutions in place. The external user can log on to the facility network and access local computers and databases. Occasional contact with facility personnel and visits to the facility might still be necessary, but there is no need for assistance in monitoring the experiment and retrieving data from the experiment (both during the experiment and after the experiment is finished). Depending on the type of

AQUAEXCEL 262336– Deliverable D6.6
Page 11 of 29
equipment and experimental setup, the external user might also be allowed to change experimental parameters (for example fish feeding rates) by remote access.
2.3 Testing “sites”
As “testing sites” the following facilities were considered for a specific trial.
i. NOFIMA, trial: “Determine the performance of Atlantic salmon in three different tank sizes”
ii. SINTEF/ACE, trial: “Growth, survival and feed utilisation of Atlantic salmon in cages”
iii. HCMR, trial: “Performance of sea bass larvae and juveniles in exp. units of varying scale”
iv. HCMR, trial: “Performance of sea bass in cages of three different volumes”
v. IMARES, trial: “Effects of scaling on kinetics in moving bed bioreactors / TNA project”
vi. IMARES, trial: “Performance of Seriola rivoliana at different temperatures in pilot scale RAS”
vii. WU, trial: “Impact of dietary cation anion difference and water oxygen level on voluntary feed intake, energy partitioning and stress responsiveness in rainbow trout (Oncorhynchus mykiss)”
For the analysis of the results, issues related to network requirements and the accessibility security, the user interface and the level of automation, the data format and the type of data – control (video – documents, access to data – control) were also considered. Also the easy expansion or replication of the required infrastructure to a new facility together with the cost of implementation were part of the analysis.
3 Results
The experiments serving in the analysis were diverse covering different experimental animals (fish species and bacteria), different infrastructures (hatchery, cages, on-growing tanks, biofilter reactors) and duration (from 4 weeks to 1 year). The completed questionnaires per research infrastructure are presented in Annex 1.
3.1 Effects on the design
For the design phase of the experiments the e-infrastructure will have either no or positive effect on the definition of objectives as it will give the opportunity to analyze available data and to share information regarding the experimental protocol using a common data base.

AQUAEXCEL 262336– Deliverable D6.6
Page 12 of 29
Regarding the decision on the required infrastructures in most of the cases the e-infrastructure will have no effect but there are cases in which the existence of e-infrastructure will allow the proper set up of parameters without requiring site visits. The availability of e-infrastructure is expected to increase flexibility in some cases on the sampling procedures and will substantially increase the amount of available data. It is not expected to have any considerable effect on the analysis of data.
3.2 Effects on the outcome
During the implementation of the experiment, e-infrastructure is expected to have a positive role on the data collection and the transfer of data to the users, reducing possible errors. It is also expected to reduce the requirements for on-site presence of the PI while allowing the improvement of the sampling procedures due to on-site monitoring. Improved data quality can be expected, as faulty instruments and needs for re-calibration can be detected earlier when data are available online. Furthermore in case of need for specialized equipment for data collection during a trial the PI could install the equipment on site and then manage (the PI or technicians) the operation remotely. Finally during the analysis of the results, as already mentioned, e-infrastructure will increase the available data and also the security. The direct collection and sharing of data may also allow a better analysis, even on-line, either on site or remotely reducing thus the required time. Standardized data formats may also decrease the labor cost for data processing and improve the quality of the derived conclusions.
A case of particular interest represent the experiment carried out by NOFIMA, “Determine the performance of Atlantic salmon in three different tank sizes”. In this particular study the performance of salmon in tanks of different size was compared having also as reference a group of fish reared in cages. A major issue of the trial was to maintain the temperature in the tanks at exactly similar levels as in cages. This was achieved by an on-line data sharing tool between the facilities that allowed the immediate adaptation of the actual sea temperature at the cages also in the tanks.
This potential of on line data sharing represents the core of the e-infrastructure concept. Although potential implementation schemes of the trial with the absence of this tool could be considered (e.g. implementation with a time lag), it is obvious that the realization of such studies is very difficult, if not impossible, without an e-infrastructure approach.
3.3 Effects on the cost
Of particular interest is the effect of the e-infrastructure on the cost of the experiments. There is an increase in cost because of the additional infrastructure required. This cost is highly dependent on the complexity of the selected infrastructure to be installed and the mode of data transfer that will apply. As the presence of the e-infrastructure will give the possibility for collecting a considerably higher amount of data there will be changes in the cost for the analysis of these datasets. On the one hand the on-line collection of data will reduce part of the analysis cost, but on the other hand there may be an additional costs either as person power or for additional tools (e.g. software to analyze video captures) that may be needed to purchase or develop.
The presence of the e-infrastructure may also result in cost reduction mostly due to the decrease of required on-site visits during the implementation of an experiment. Also as data collection is expected to be automatic, significantly reduced personnel time may be required,

AQUAEXCEL 262336– Deliverable D6.6
Page 13 of 29
thus reducing the corresponding labor cost. Unexpected technical and/ or other problems during the implementation can be detected earlier. The implementation of corrective actions will be then possible. In some cases this actions (e.g. shortage in dissolved oxygen in a tank failure of a pump, etc.) are vital for the implementation of any trial thus reducing the need for costly re-implementation of experiments, and in worst cases cancelled experiments.
3.4 Effects on collaboration
In all cases analysed the presence of e-infrastructure was considered to increase the availability of data and protocols between partners through the shared points introduced. Also in all cases a major outcome was a significant reduction of visit/travel to the implementation site. These procedures have a negative effect on the direct face to face communication between the partners, both the PI’s and the technicians and between PI’s. This reduced communication may have also effects on the level of collaboration as experience accumulated by the technicians may not be communicated most effectively to researchers and vice versa.
3.5 SWOT analysis
For a better understanding of the potential effect of the e-Infrastructure on the design, the outcome and the cost on the implementation of experiments and also the potential of the new scheme of collaboration, the results of a SWOT (Strengths, Weakness, Opportunities and Threats) analysis are presented below. The method applied was to compare the use or not of an e-infrastructure in the implementation of aquaculture experiments.
STRENGTHS
Large amount of data
Better quality of data
Easy access to the data among partners
Increased flexibility of sampling procedures
Reduced cost due to the automatic procedures
Reduced cost for data analysis due to electronic transfer and the possibility to standardize data formats
Reduced number of visits
WEAKNESS
Increased cost for infrastructure investments

AQUAEXCEL 262336– Deliverable D6.6
Page 14 of 29
Increased need for skilled personnel for managing the e-Infrastructure
Possible increased costs for data analysis
OPPORTUNITIES
Access to higher amounts of data
Increase the accuracy and the quality of the experimental results
Reduced possibilities of experiment-failure due to alarm systems
New collaborations among partners
New types of multi-site experiment
THREATS
Reduce communication between partners
Reduced quality of data in “regular” monitoring procedures if roles are not properly defined
4 Conclusions
An analysis was performed using re-interpretation of specific trials for evaluating possible effects of an e-infrastructure on the design, the implementation and the logistics of the experiments. The trials used cover a wide range of parameters, infrastructures and organisms so that conclusions may be considered to have a wider applicability. The major conclusions can be summarized as follows:
E-infrastructures are expected to have a positive role in the quantity and quality of the collected data. They will increase the flexibility of the experimental procedures and also reduce the possible failures. They provide a safer environment of data storage and data sharing.
E-infrastructures will increase the experimental cost, at least initially, due to the required equipment. The large amounts of data collected may require additional labor for the analysis and in some case specific tools.
E-infrastructure will reduce the required travelling and the relevant cost of the investigators to the experimental sites. This lack of direct communication between partners may require the development of new schemes of collaboration.
References
Deliverable 6.1 of AQUAEXCEL

AQUAEXCEL 262336– Deliverable D6.6
Page 15 of 29
Deliverable 6.2 of AQUAEXCEL

AQUAEXCEL 262336– Deliverable D6.6
Page 16 of 29
Annex 1
Completed Questionnaires
A. Trial: Performance of sea bass larvae and juveniles in exp. units of varying scale (HCMR)
A. Design
(*)
Definition of objectives
Procedures Logistics Cost
Experimental organism
Requirements analysis, decision on species, size and number. Pilot scale trial of seabass larval rearing in intensive conditions.
None None None
Decision on infrastructures
Replicates Scale of trial. Type of infrastructure (tank, cages)
Triplicate tanks of variable volume (40, 500, 2000). Close water system, similar environmental conditions.
None None None
Analysis of existing instrumentation
Check available instruments and resources Type of tanks, monitoring instruments
Proper implementation
Duration Period to meet the objective
60 days trial + the period required to assess the quality of the fry. Total 120 days.
None None None
Sampling
Type of data Environment, biological performance, behavioral All
None None None
Frequency Continues, daily, weekly, etc depending on data type
Daily, T, DO, pH, TL, food concentration; Twice per week WW; Specific stages Cortisol; water currents
Continuous T, DO, pH More data None
Analysis
Analysis of existing
data sets
Look available information and existing datasets
Standard biological performance + Modelling (DEB)
None None None
Previous trials, period of implementation
Parameters properly set
(*) considering: e-access to the feeding system and also to a data base with continues environmental monitoring, with additional notes regarding the rearing

AQUAEXCEL 262336– Deliverable D6.6
Page 17 of 29
B. Implementation Experimental organism
Procedures Logistics Cost
Availability Transfer of organisms … Transfer of eggs
None None None
Husbandry (rearing - culture) Start the trial …
Start rearing for 60 days; transfer groups at pre-growing tanks
None None None
Monitoring
Start up phase Ensure proper performance
As planned (intense monitoring at the beginning – presence of PI)
Not needed on Site presence
Environment As planned
Frequency Continues, daily collection. Manually
Automatic Reduced labor Labor VS investment
Corrections Actions to correct deviations from the protocol Temperature adaptations at 40 lt tanks
Automatic
Accurate implementation
No repetition/ save of money and time
Animals
Behavior Collection of data … Direct observation
Automatic video
Better / more data
Labor intensive - high cost SW
Survival Estimates …. Direct measurements of biomass at the end of each step
None None None
Actions in case of crisis None
None None None
Sampling
During the experiment
Samples collection / perform measurements As planned by local technicians
Direct on site monitoring
Improved sampling No presence of PI
Final Samples collection / perform measurements As planned by local technicians / travel of PI
-”- -”- -”-
C. Analysis Data processing
Procedures Logistics Cost
- data collection XL sheet; automatic feeding system
Availability of all data
- data analysis XL, SigmaPlot, MatLab
None None
Bibliography review
Standard
None None None
Reporting
Standard
None None None

AQUAEXCEL 262336– Deliverable D6.6
Page 18 of 29
B. Performance of sea bass in cages of three different volumes (HCMR)
A. Design
(*)
Definition of objectives
Procedures Logistics Cost
Experimental organism
Requirements analysis, decision on species, size and number. Pilot scale trial of seabass larval rearing in intensive conditions.
None None None
Decision on infrastructures
Replicates Scale of trial. Type of infrastructure (tank, cages)
Triplicate tanks of variable volume (40, 500, 2,000). Close water system, similar environmental conditions.
None None None
Analysis of existing instrumentation
Check available instruments and resources Type of cages, monitoring instruments
Proper implementation
Duration Period to meet the objective
60 days trial + the period required to assess the quality of the fry. Total 120 days.
None None None
Sampling
Type of data Environment, biological performance, behavioral All
None None None
Frequency
Continues, daily, weekly, etc depending on data type
Daily, T, DO, pH, TL, food concentration; Twice per week WW; Specific stages Cortisol; water currents
Continuous T, DO, pH More data None
Analysis
Analysis of existing data sets
Standard biological performance + Modelling (DEB) Check available information and existing datasets
None
None Parameters properly set None
(*) considering: e-access to an automatic feeding system and also to a data base with continues environmental monitoring, with additional notes regarding the rearing and an on-line monitoring system of the behavior with cameras

AQUAEXCEL 262336– Deliverable D6.6
Page 19 of 29
B. Implementation Experimental organism
Procedures Logistics Cost
Availability Transfer of organisms … Transfer of eggs
None None None
Husbandry (rearing - culture) Start the trial …
Start rearing for 60 days; transfer groups at pre-growing tanks
None None None
Monitoring
Start up phase
Ensure proper performance
Not needed on site presence
Environment As planned
Frequency Continues, daily collection. Manually
Automatic Reduced labor Labor VS investment
Corrections Actions to correct deviations from the protocol … Temperature adaptations at 40 lt tanks
Automatic
Accurate implementation
No repetition/ save of money and time
Animals
Behavior Collection of data … Direct observation
Automatic video Better / more data
Labor intensive - high cost SW
Survival Estimates …. Direct measurements of biomass at the end of each step
None None None
Actions in case of crisis None
None None None
Sampling
During the experiment
Samples collection / perform measurements As planned by local technicians
Direct on site monitoring
Improved sampling No presence of PI
Final Samples collection / perform measurements As planned by local technicians / travel of PI
-”- -”- -”-
C. Analysis Data processing
Procedures Logistics Cost
- data collection XL sheet; automatic feeding system
- data analysis XL, SigmaPlot, MatLab
None Availability of all data None
Bibliography review
Standard
None None None
Reporting
Standard
None None None

AQUAEXCEL 262336– Deliverable D6.6
Page 20 of 29
C. Growth, survival and feed utilisation of Atlantic salmon in cages (SINTEF)
A. Design
(*)
Definition of objectives Procedures Logistics Cost
Experimental organism
Requirements analysis, decision on smolt delivery coordination Industry scale trial of salmon rearing None
Video feeds and sensor data available from site during planning
Reduced number of visits/travel
Decision on infrastructures
Replicates
Type of infrastructure (tank, cages) and scale of trial
Triplicate cages of 120 meter circumference, 200 000 fish in each cage from same stock. Comparative experiments in tanks with similar environmental conditions None None None
Analysis of existing instrumentation
Check available instruments and resources None
Ensure all parameters are properly set without being onsite
Reduced number of visits/travel
Duration Period to meet the objective 6 months trial (until 0,75 kg/ind.) None None None
Sampling
Type of data Environment, feeding, growth, survival All None None None
Frequency Depending on type of data
Near continuous: O2, temp, salinity current speed/direction Daily: Feed, feed type, growth estimates, dead count Monthly: Weight sampling
Increased flexibility, possible to change frequency during the experiment based on online access
Automated transfer of data
Reduced need for discussions with local personnel, and reduced work for local personnel
Analysis
standard biological performance None None None
Analysis of existing data sets
Check available information and existing datasets
Analysis of weight samples to determine end of trial (0.75 kg/ ind.)
Existing datasets available online as support for experimental design
Ensure all parameters are properly set without being onsite
Reduced need for discussions with local personnel
(*)Considering: e-access to automatic feeding system with recording to database, continuous environmental monitoring with storage in database and live video with the possibility for online data analysis

AQUAEXCEL 262336– Deliverable D6.6
Page 21 of 29
B. Implementation
Experimental organism Procedures Logistics Cost
Availability Transfer of organisms in place Transfer of smolt None None None
Husbandry (rearing - culture) Start the trial (following adaptation if required)
According to regulations and industry standard by local operators None None None
Monitoring
Start up phase Ensure proper performance Not needed on-site presence
environment
Semi-automatic, local storage
Frequency Daily collection of data
Coordination with tank experiments with same smolt stock, temperature and feed type
Automated data transfer
Reduced delays in data transfer, reduced labor
Reduced manual labor for data transfer
Corrections
Actions to adjust parallel tank experiments according to temperature and feeding
Automated data transfer Reduced risk of errors
Reduced manual labor for data transfer
Animals Behavior
Collection of data (video, direct observation) Direct observation Live video
Remote observation possible
Reduced number of visits/travel
Survival estimates (direct or indirect measurements) Manual count (daily) None None None
Actions in case of crisis (mortalities, pathologies etc) None None None None
Sampling
During the experiment
Samples collection / perform measurements As planned by local technicians None
Direct on site monitoring can improve sampling without presence of PI
Reduced number of visits/travel
Final Samples collection / perform measurements
As planned by local technicians / travel of PI None
Direct on site monitoring can improve sampling without presence of PI
Reduced number of visits/travel
C. Analysis
Data processing Procedures Logistics Cost
data collection Database queries Availability and security, redundancy of data
data analysis XL, MatLab None None
Bibliography review
standard None None None
Reporting
standard None None None

AQUAEXCEL 262336– Deliverable D6.6
Page 22 of 29
D. Seriola rivoliana experiment in 5 RAS (IMARES)
A. Design
Definition of objectives Procedures Logistics Cost
Experimental organism
Requirements analysis, decision on species, size and number.
Performance of Seriola rivoliana at different temperatures in pilot scale RAS
One protocol with all information, as well as databases where all information can be uploaded and shared Commercial
software
Time of IT service to create share point, safety of IT environment because of the ability to share digital information between institutes
Decision on infrastructures
Pseudo-replicates
Scale of trial. Type of infrastructure (tank, cages) and scale of trial
5 independent RAS, with three tanks each, testing 5 temperatures see above see above see above
Analysis of existing instrumentation
Check available instruments and resources
Preparation of the systems (biofilter, stability) see above see above see above
Duration Period to meet the objective
4 weeks trial, plus two weeks to prepare the systems, plus two weeks to acclimatize the fish see above see above see above
Sampling
Type of data
Growth performance and some physiological parameters of the fish, behavior, system performance
Water quality, BW, SGR, FCR, feed intake, mortality, physiology see above see above see above
Frequency Continues, daily, weekly, etc depending on data type of data
daily monitoring for fish performance, final measurement of SGR, FCR, BW, physiology see above see above see above
Analysis
Analysis of existing data sets
Look available information and existing datasets
Comparison with previous similar trials with other (related) species) see above see above see above

AQUAEXCEL 262336– Deliverable D6.6
Page 23 of 29
B. Implementation Experimental organism Procedures Logistics Cost
Availability transfer of fish Acclimatization of fish to the conditions Transfer of fish
Automatic registration of water quality during acclimatization
Installation of sensors, maintenance and calibration of sensors and equipment, IT costs, uploading and checking of data
husbandry (rearing - culture) start the trial
Start growth experiment for four weeks Start of trial
see above
see above
Monitoring
Environment Frequency
Continues, daily collection of data of water quality and feed intake
As planned Manually (feed intake, water quality)
Automatic and according to protocol
Reduced labor, more data see above
Corrections Actions to correct deviations from the protocol (e.g. T, NO2) Water flows, temperature adjustment see above Alarm system
see above
Animals (fish)
Daily measurement of feed intake, monitoring behavior
Manually, as planned see above
Performance data on SP and visible see above
Sampling
During the experiment
Behaviour monitoring, feed intake, water quality Manually as planned see above Data on DB
Uploading data on DB, such as growth performance, this does not go automatically
Final Samples collection / perform measurements
Manually as planned, blood, growth performance, feed intake see above Data on DB
see above
C. Analysis Data processing Procedures Logistics Cost
data collection Data on DB and available for the team
data analysis None None
Bibliography review
standard None None None
Reporting
standard None None None
* security of data

AQUAEXCEL 262336– Deliverable D6.6
Page 24 of 29
E. Rearing of post-smolt Atlantic salmon in different tank volumes (NOFIMA)
Standard Approach
Effects of e-Infrastructure
A. Design Definition of objectives Procedures Logistics Cost
Experimental organism
Requirements analysis, decision on species, size and number.
Rearing of post-smolt Atlantic salmon in different tank volumes None
Improved design/ objectives due to extensive info to tank site, from feed producer and cage site on feed lots, using e-infra None
Decision on infrastructures
Replicates
Scale of trial. Type of infrastructure (tank, cages) and scale of trial
Triplicate, to quadruplicate tank replicates in controlled systems, triplicate cage reference
None None
None
Analysis of existing instrumentation
Check available instruments and resources Manually analyses and monitoring None None None
Duration Period to meet the objective 7 months None None None
Sampling
Type of data Environment, biological performance, behavioral All None None None
Frequency
Continues, daily, weekly, etc depending on data type of data
Daily T, O2, pH, Bi-monthly: weight, physiological variables, feed intake, behavoiur, standard biological performance, physiology, video
Much improved, continuous (5 min): T, O2, feeding Considerably more data Reduced labour per data set
Analysis
Analysis of existing data sets
Look available information and existing datasets Previous trials, period of implementation None None None

AQUAEXCEL 262336– Deliverable D6.6
Page 25 of 29
B. Implementation Experimental organism
Availability Transfer of organisms in place Transfer of smolt None None None
Husbandry (rearing - culture)
Start the trial (following adaptation if required)
Phase I: Transport; phase II: scale history; phase III: scale effects None None None
Monitoring
Start up phase Ensure proper performance Acclimatization 1 month (phase I)
On-site presence not needed, except in case of sensor malfunction (seldom)
Environment Frequency Continues, daily collection As planned, manually Automatic Reduced labor Labor VS sensor investment
Corrections
actions to correct deviations from the protocol (e.g T adaptation, DO, etc)
T, feeds, feeding as in ref cages Automatic Accurate implementation
Increased costs if transfer of data over telephone
Animals Behavior
Collection of data (video, direct observation)
Video and direct observation
Semi + automatic video
More data that may result in fast identification of problem
Expensive software vs labor costs for analyzing video
Survival Estimates (direct or indirect measurements)
Direct measurements of biomass at the end of each trial step; estimation of biomass
Biomass frames in cages None
Biomass frames may have reduced costs per sampling (manual vs biomass frames)
Actions in case of crisis (mortalities, pathologies etc) Alarm from technician on duty
Sophisticated twice-redundant alarm systems
Sophisticated twice-redundant alarm systems
Can save experiment; impact on ethics and costs
Sampling
During the experiment
Samples collection / perform measurements
As planned by local scientists and technicians None
Direct on site monitoring, improved sampling without presence of PI
Biomass frames strengthen weight estimates
Final Samples collection / perform measurements
As planned by local scientists and technicians / travel of PI None
Direct on site monitoring, improved sampling without presence of PI
Biomass frames strengthen weight estimates
C. Analysis Data processing
data collection XL sheet; automatic feeding system
data analysis XL, ScienceDirect, SAS More robust data, higher amount of data/increased N None
Increased labor cost on data processing. Quality much improved
Bibliography review
standard None None None
Reporting
standard More robust data, higher amount of data/increased N None
Increased labor cost on data visualization. Quality much improved
AQUAEXCEL 262336– Deliverable D6.6
Page 26 of 29
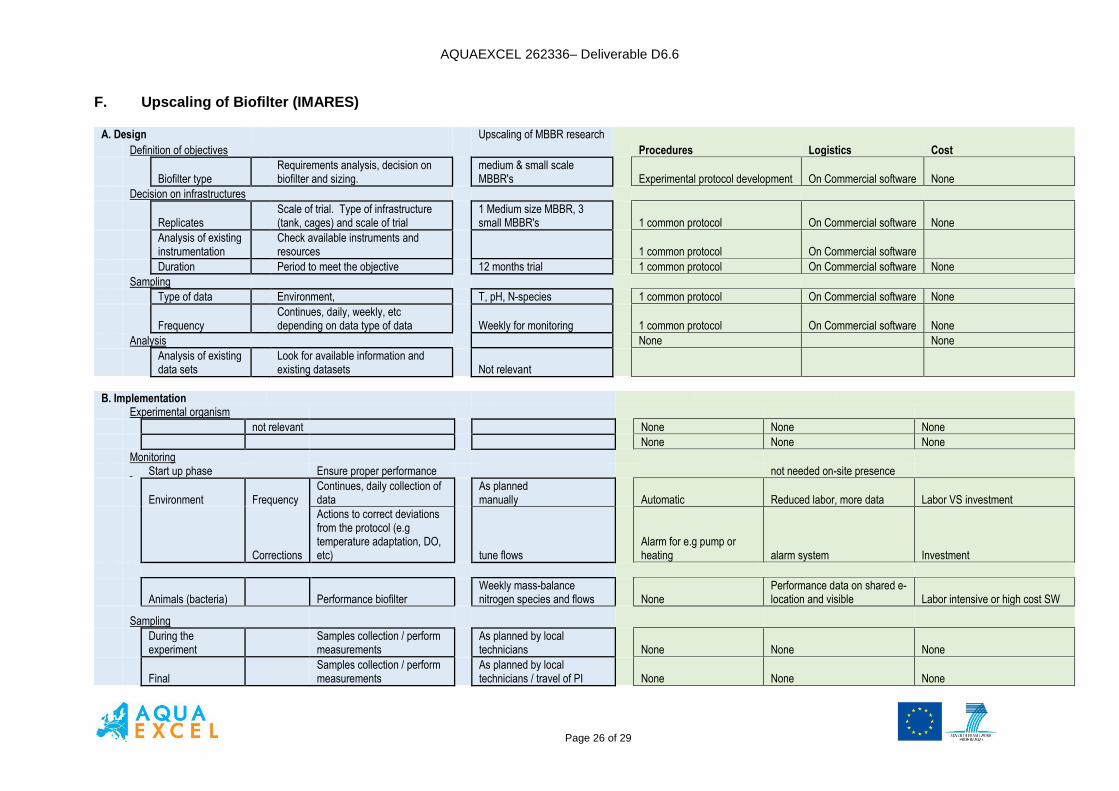
F. Upscaling of Biofilter (IMARES)
A. Design Upscaling of MBBR research
Definition of objectives Procedures Logistics Cost
Biofilter type Requirements analysis, decision on biofilter and sizing.
medium & small scale MBBR's Experimental protocol development On Commercial software None
Decision on infrastructures
Replicates Scale of trial. Type of infrastructure (tank, cages) and scale of trial
1 Medium size MBBR, 3 small MBBR's 1 common protocol On Commercial software None
Analysis of existing instrumentation
Check available instruments and resources 1 common protocol On Commercial software
Duration Period to meet the objective 12 months trial 1 common protocol On Commercial software None
Sampling
Type of data Environment, T, pH, N-species 1 common protocol On Commercial software None
Frequency Continues, daily, weekly, etc depending on data type of data Weekly for monitoring 1 common protocol On Commercial software None
Analysis None None
Analysis of existing data sets
Look for available information and existing datasets Not relevant
B. Implementation Experimental organism
not relevant None None None
None None None
Monitoring Start up phase Ensure proper performance not needed on-site presence
Environment Frequency Continues, daily collection of data
As planned manually Automatic Reduced labor, more data Labor VS investment
Corrections
Actions to correct deviations from the protocol (e.g temperature adaptation, DO, etc) tune flows
Alarm for e.g pump or heating alarm system Investment
Animals (bacteria) Performance biofilter Weekly mass-balance nitrogen species and flows
None
Performance data on shared e-location and visible Labor intensive or high cost SW
Sampling
During the experiment
Samples collection / perform measurements
As planned by local technicians None None None
Final Samples collection / perform measurements
As planned by local technicians / travel of PI None None None
AQUAEXCEL 262336– Deliverable D6.6
Page 27 of 29
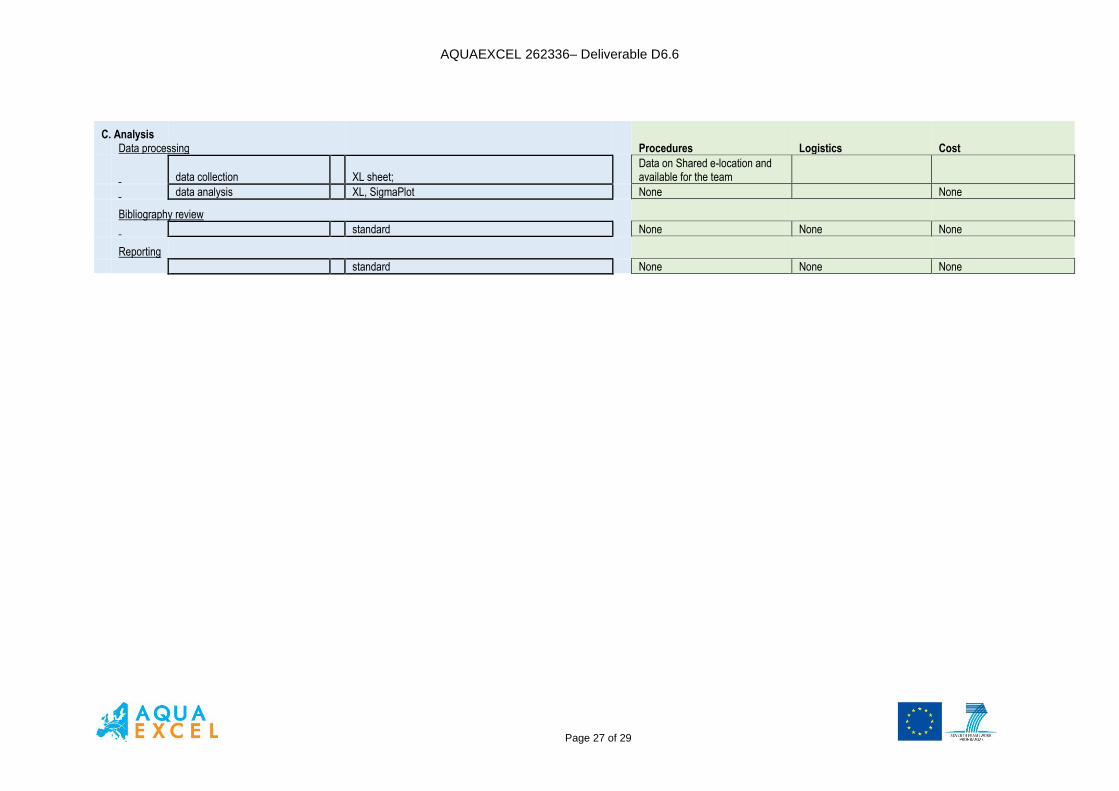
C. Analysis
Data processing Procedures Logistics Cost
data collection
XL sheet; Data on Shared e-location and available for the team
data analysis XL, SigmaPlot None None
Bibliography review
standard None None None
Reporting
standard None None None

AQUAEXCEL 262336– Deliverable D6.6
Page 28 of 29
G. Impact of dietary cation anion difference and water oxygen level on voluntary feed intake, energy partitioning and stress responsiveness in rainbow trout (Oncorhynchus mykiss)). (WU)
A. Design
Effect of e-infrastructure:
Definition of objectives Procedures Logistics Cost
Experimental organism
Requirements analysis, decision on species, size and number.
370 rainbow trout (Oncorhynchus mykiss) of 100 g in the experiment. Origin, INRA, France. Isogenic trout lines.
An exp. protocol (EP) approved by the experimental committee of WU and a work-protocol (WP) describing experimental procedures (who is doing what, where, when and how) available on a shared e-location
Commercial software
Time and annual costs to give access to specific software (= access host PC WU-MRU) and time to give access to the software.
Decision on infrastructures
Replicates
Scale of trial. Type of infrastructure (tank, cages) and scale of trial
12 metabolic chambers of 200 L each (WU-MRU) connected to one RAS. 2 x 2 factorial design with oxygen (DO) and diet as factors each factor replicated 3 times (DO ~4 and ~8mg/L).
EP & WP
None
None
Analysis of existing instrumentation
Check available instruments and resources
Calibration of DO, pH and water flow meters. Set T, photoperiod. Check recirculation system performance WU-MRU is connected to.
EP & WP
Check without being onsite. Adjustment
Smartphone
Duration
Period to meet the objective
9 weeks trial (2 wks adaptation, 6 wks to test the effect diet x DO, 1wk for sampling and final stress test).
EP & WP
None
None
Sampling
Type of data
Environmental, biological, performance, behavioral
Feed intake, growth performance, cortisol, chyme, gene expression fore brain, pituitary, interrenal, gill tissue...
EP & WP
Fast control & adjustment of DO and flow
Smartphone
Frequency Continues, daily, weekly, etc depending type of data
Daily (influent): pH, T, DO, conductivity. Online: (blocks of 4 chambers): DO, pH, conductivity, T, flow ; Autonalyzer (week 5 ) 2 x 6 chambers 48hrs , TAN, NO2-N, NO3-N, urea, CO2, PO4-P EP &WP
Freq. sensor measurements per metabolic chamber adjustable. None
Analysis
Analysis of existing data sets
Look available information and existing datasets
Ref. to previous publications
Ref. of publications & posters WU-MRU on wikidot-site
None
None

AQUAEXCEL 262336– Deliverable D6.6
Page 29 of 29
B. Implementation Effect of e-infrastructure: Experimental organism Procedures Logistics Cost
Availability
Transfer of fish
Transport of fingerlings from France to quarantine exp. facility
None
None None
Husbandry (rearing culture)
Start the trial
Adaptation to WU-MRU and adjustment WU-MRU to experimental conditions, random assignment of treatments and fish to metabolic chambers
Start of trial, adjustment WU-MRU exp. conditions (Work protocol (WP))
None
None
Monitoring
Environment Frequency
Continues, daily collection of data of water quality and feed intake
pH, T, conductivity, flow (per block of 4 chambers), max. feed intake twice/day, auto analyzer wk 5
Automatic, schedule according to WP
Reduced labor
Replacement and maintenance sensors, checking data.
Corrections
Actions to correct deviations from the protocol
Water flows & DO adjustments FI manually
According to description WP
Direct correction for deviation from preset values WP(DO and flow)
Smartphone, saves time to correct deviations from WP.
Animals (fish)
daily measurement of feed intake (FI), monitoring behaviour
Alarm on pump and T (Camera per chamber available)
Call to network Biotechnicians Alarm system pump, T.
Can save experiment, important ethical issue
Sampling
During the experiment
Behavior monitoring, feed intake, water quality
Direct observation per chamber (video ) According to time schedule and planning EP
Experimental protocol and work protocol on shared e-location
Shared e-location (EP, WP)
None
Final Samples collection / perform measurements
According to EP, blood, growth performance, feed intake,…… None
Shared e-location (EP & WP)
None
C. Analysis Data processing
Data collection
XL-sheet
Diurnal variation metabolite production and DO consumption analysis
Availability of all sensor data
Higher quality collected Data analysis
SAS or SPSS
Bibliography review
Standard None None None
Reporting
Standard Existing publ ref. WU-MRU online None Higher quality data