delay sensitive routing for high speed packet-switching networks student: huang, yu-sheng advisor:...
Post on 22-Dec-2015
228 views
TRANSCRIPT

Delay Sensitive Routing for
High Speed Packet-switching Networks
Student: Huang, Yu-Sheng Advisor: Lien, Yao-Nan
Lab. of Mobile Communication, Dept. of Computer Science, National Chengchi Univ.
June, 2003
Outline 1. Introduction 2. Background and Related Works 3. Routing with Node Delay 4. Performance Evaluation 5. Conclusion and Future work

Chapter 1. Introduction Network convergence and ALL-IP network
All-IP networks: use packet-switching network to carry all services traditionally supported by circuit-switching and packet-switching networks.
To carry time sensitive services, delay time must be controlled.
time sensitive services: VoIP, Video Conference, on-line games, and etc
Delay sensitive routing is important.

Chapter 1. Introduction (2) Delay time is not a major concern in
traditional routing algorithms. Some time sensitive routing
algorithms were developed recently Node delay is not considered, yet. In high speed packet-switching
networks, links and nodes delay are equally important.
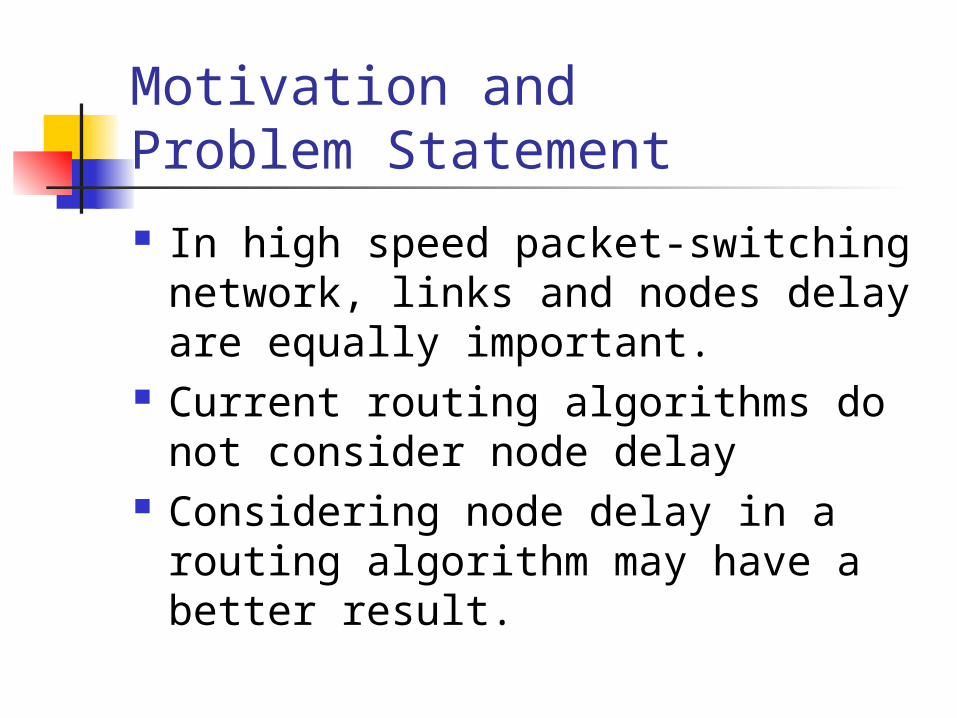
Motivation and Problem Statement
In high speed packet-switching network, links and nodes delay are equally important.
Current routing algorithms do not consider node delay
Considering node delay in a routing algorithm may have a better result.

Solution Approach Model as flow-based routing
problem with links and nodes delay dependent on flows.
Iterative approach is used to solve the variable links and nodes delay time, and and node delay to link delay conversion is used to reuse existing shortest path algorithm.
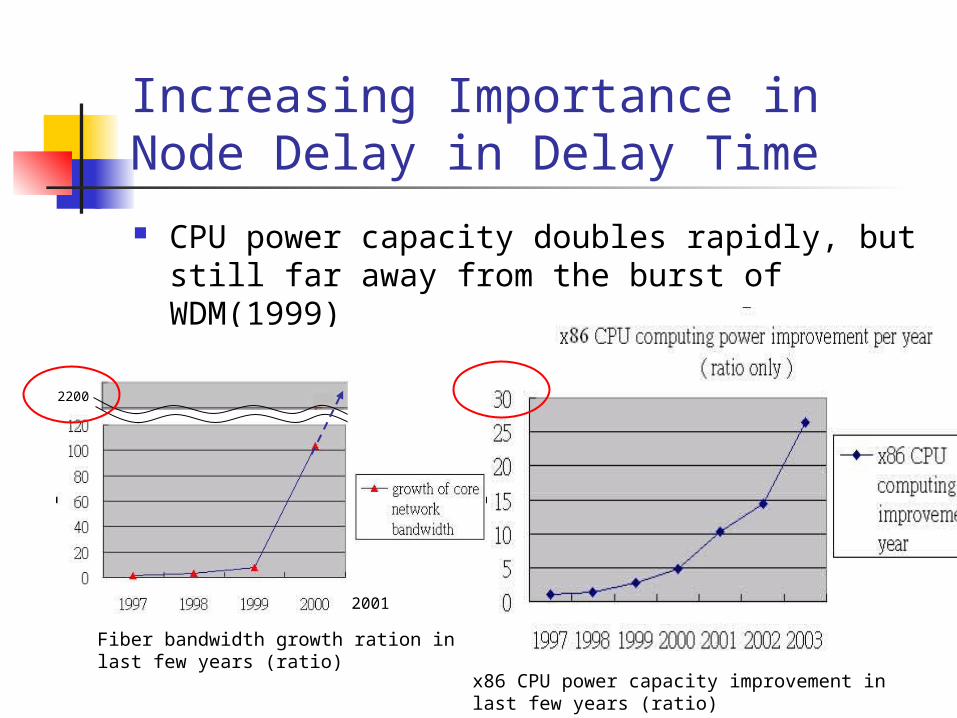
Increasing Importance in Node Delay in Delay Time
CPU power capacity doubles rapidly, but still far away from the burst of WDM(1999)
x86 CPU power capacity improvement in last few years (ratio)
2200
2001
Fiber bandwidth growth ration in last few years (ratio)

Delay Time Analysis One Trip Delay
Router #1
Router #2
In low speed packet switching network
In high speed packet switching network
In low speed packet switching network
time
end device delay
link delay
one-trip delay
node delay

Delay Time Analysis (2)
Packtizing delay
Transmission delay
Propagation delay
Queuing delay
Processing delay
Encapsulating packets
Transmitting data, limited by bandwidth
Packets transfer alone a link
Waiting before being processed or transmitted
Deciding routing path and filtering
Parameter changing/ high end host processor
Increase in bandwidth
Faster transmission media or alternative path
Better queuing policy and congestion control
More powerful routers or good routing algorithm
It happens at?
End Device
Link
Link
Link and Node
Node
Why? How to improve it?
Parameter changing/ high end host processor
good routing algorithms!
and others that
are not listed…
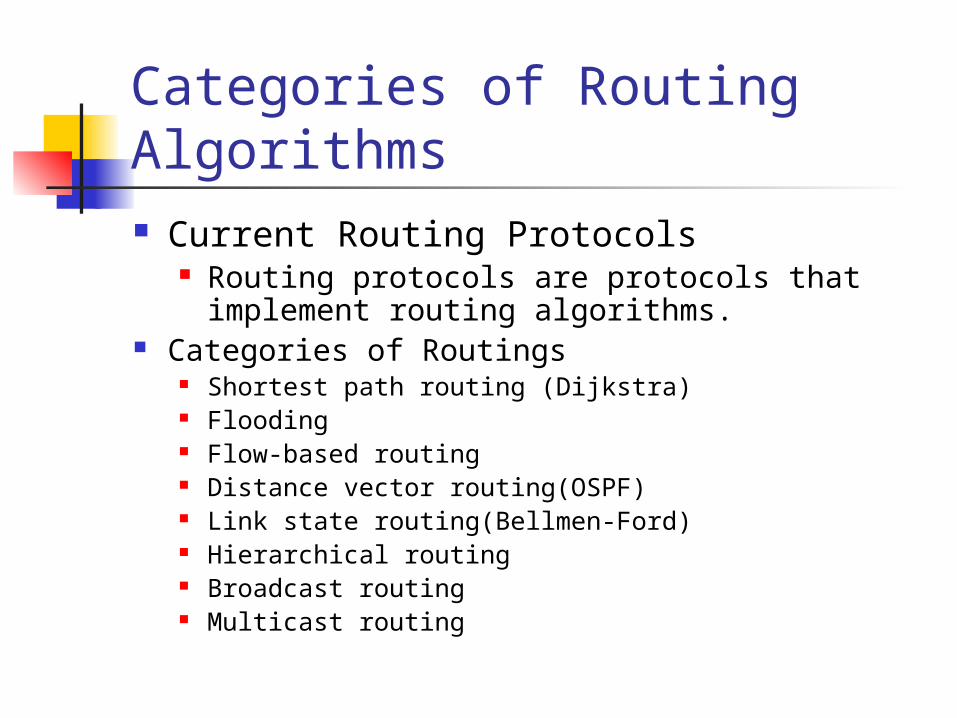
Categories of Routing Algorithms Current Routing Protocols
Routing protocols are protocols that implement routing algorithms.
Categories of Routings Shortest path routing (Dijkstra) Flooding Flow-based routing Distance vector routing(OSPF) Link state routing(Bellmen-Ford) Hierarchical routing Broadcast routing Multicast routing
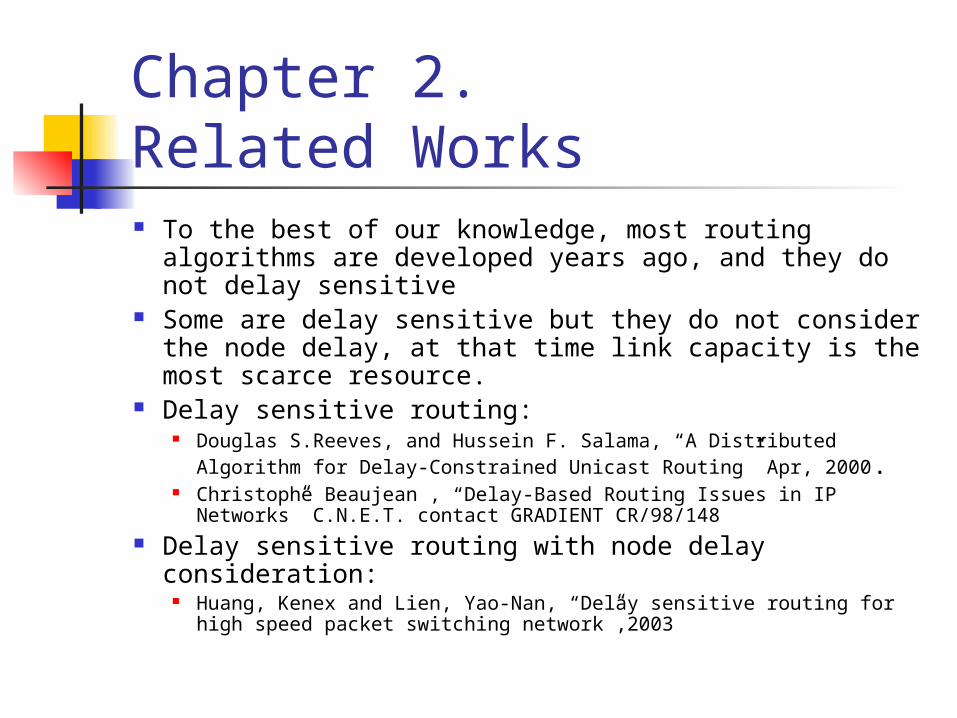
Chapter 2.Related Works To the best of our knowledge, most routing algorithms
are developed years ago, and they do not delay sensitive
Some are delay sensitive but they do not consider the node delay, at that time link capacity is the most scarce resource.
Delay sensitive routing: Douglas S.Reeves, and Hussein F. Salama, “A Distributed Algorithm
for Delay-Constrained Unicast Routing” Apr, 2000. Christophe Beaujean , “Delay-Based Routing Issues in IP Networks”
C.N.E.T. contact GRADIENT CR/98/148 Delay sensitive routing with node delay consideration:
Huang, Kenex and Lien, Yao-Nan, “Delay sensitive routing for high speed packet switching network”,2003
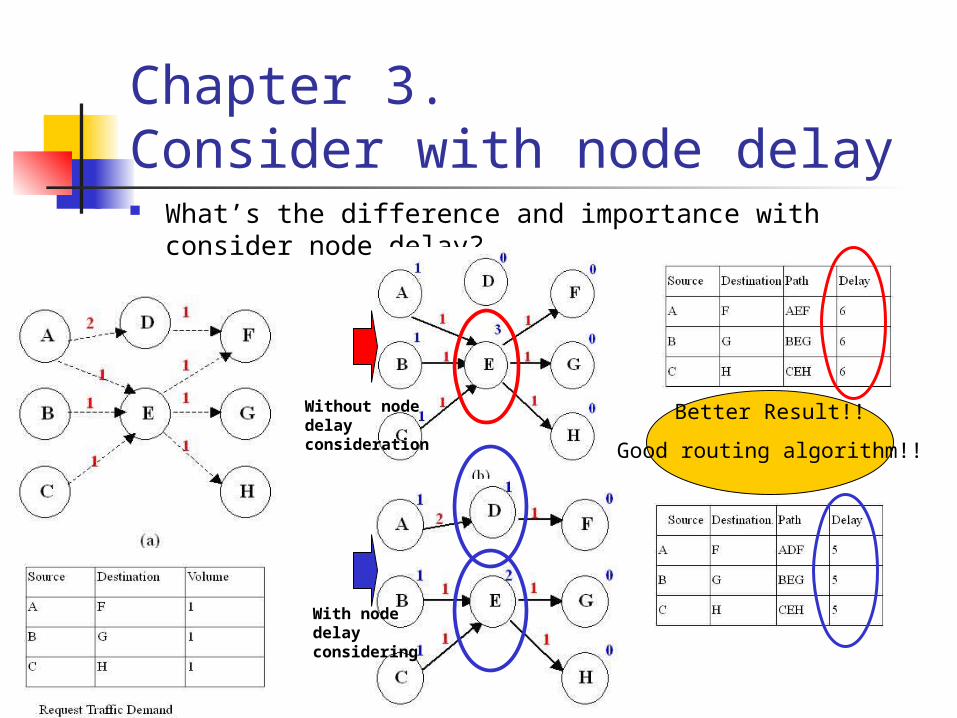
Chapter 3.Consider with node delay What’s the difference and importance with consider
node delay?
Better Result!!
Good routing algorithm!!
Without node delay consideration
With node delay considering

Chapter 3. Routing with Node Delay
Routing Problem ModelA network topology example
Traffic requests
0
2
9
14
18
17
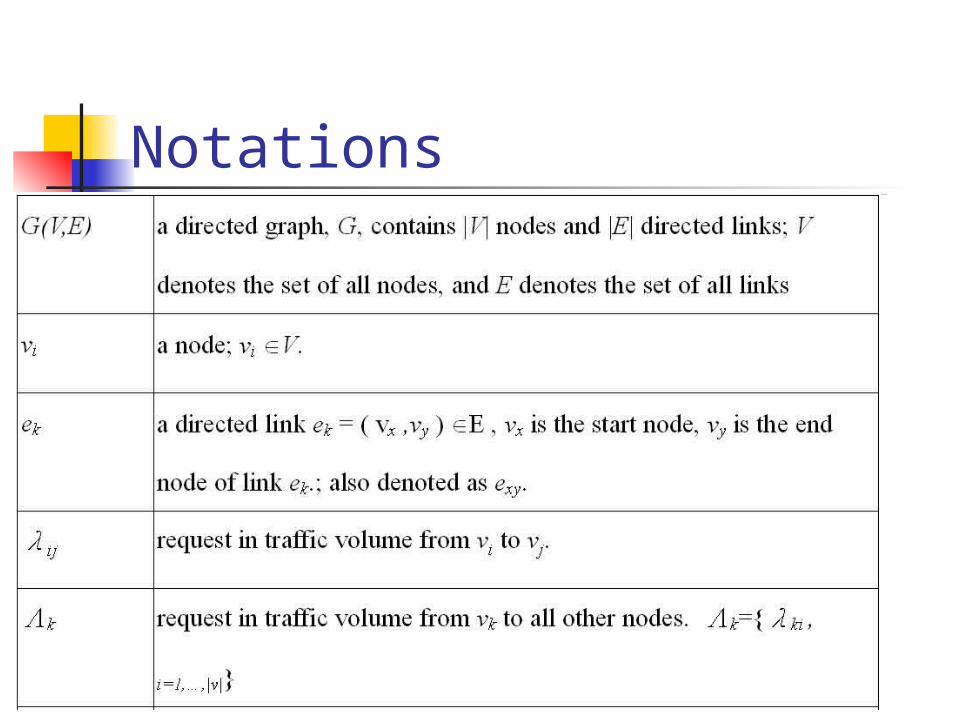
Notations

Notations (cont’d)

A path, фij , the path for request from vi to ej, selected by algorithm; фij=vi,eii+1,vi+1,ei+1 I+2,…,ej-1j,vj.
Then, the path delay time is
Corresponding equations

The Optimization Model D is the delay bound of each path We want to minimize the total delay time,
and keep each one-trip time < D Therefore:
D could be different for each request flow, but we use a common D for convenient.
Challenges Links and nodes delay time
depends on flows, we cannot estimate the delay time unless we know the volume. Traditional routing algorithms cannot
deal with node delay. Traditional routing algorithms cannot
deal with variable weight, either.

Solution Approach Iterative approach to solve
variable links and nodes delay Node delay to link delay
conversion to reuse existing routing algorithms

Traffic volume calculation and delay time estimation
link eh and a node vk, respectively:
And the transmission time of link eh will be,
Internet Telephony and Modem Delay, Bill Goodman, IEEE Network, 1999. May/Jun
The node delay time includes the transmission delay and the propagation delay time, it is
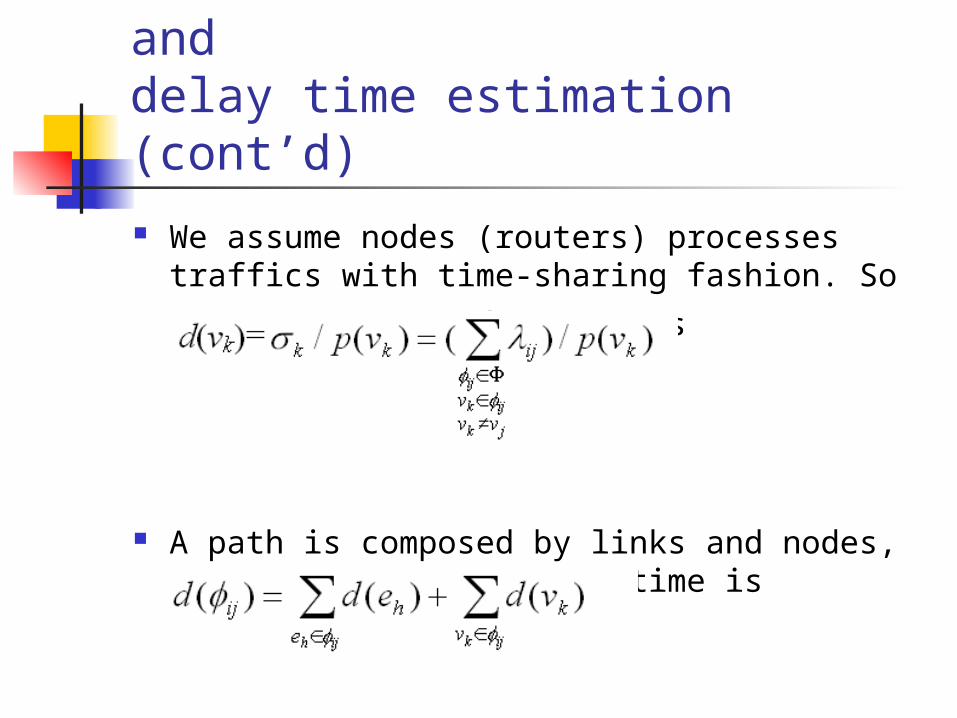
We assume nodes (routers) processes traffics with time-sharing fashion. So the delay time of
a node is
A path is composed by links and nodes, and then the path delay time is
Traffic volume calculation and delay time estimation (cont’d)
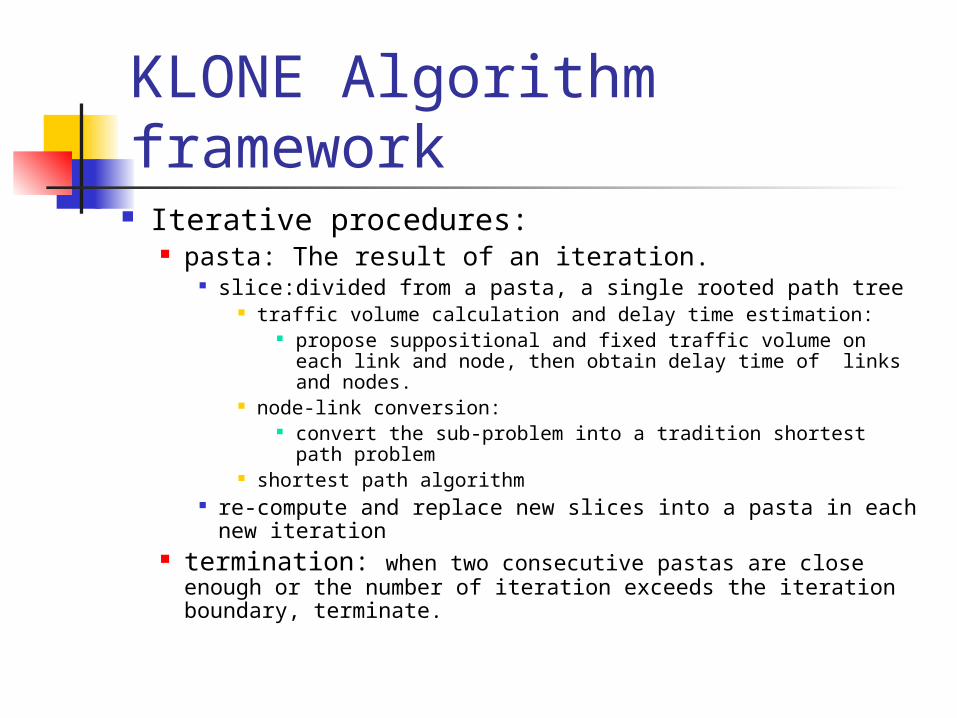
KLONE Algorithm framework
Iterative procedures: pasta: The result of an iteration.
slice:divided from a pasta, a single rooted path tree traffic volume calculation and delay time estimation:
propose suppositional and fixed traffic volume on each link and node, then obtain delay time of links and nodes.
node-link conversion: convert the sub-problem into a tradition shortest path problem
shortest path algorithm re-compute and replace new slices into a pasta in each new
iteration termination: when two consecutive pastas are close enough or
the number of iteration exceeds the iteration boundary, terminate.

Iterative procedures Pasta
a result in each iteration links and nodes delay are computed and
fixed for next pasta computation. Slice
a single root flow tree; in each sub-iteration
extract a slice, re-compute and superimpose back to a pasta

A
C
B
D E
A
C
B
D E
A
C
B
D E
C
D E
Pasta and Slices (2)Slice A
Slice B
Slice C
Slice D
Slice E

Re-compute a slice Two approaches to solve a single-
root flow tree: new algorithm? (for Ph.d) reuse existing algorithm
Need to convert a node delay into links delays
Shortest path algorithm
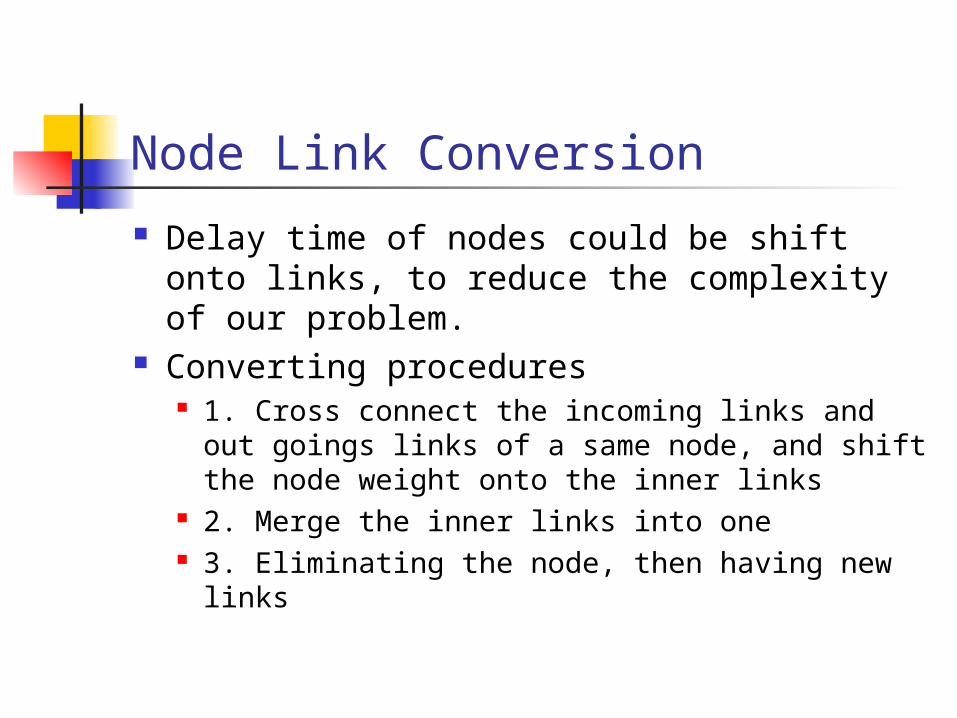
Node Link Conversion
Delay time of nodes could be shift onto links, to reduce the complexity of our problem.
Converting procedures 1. Cross connect the incoming links and out
goings links of a same node, and shift the node weight onto the inner links
2. Merge the inner links into one 3. Eliminating the node, then having new
links

Node Link Conversion
(a)a node in original graph
m
w4
w1
w3
w2
(b)have new links from cross connecting the incoming and outgoing links
w4
m
w3
m
w1
w2
m
m
(d)shift m to the each of the incoming links
w4
w1+mw3
w2+m
a node without weight
w4
w1
w3
m
w2
(c)use a single link to present, since any path suffer the same m
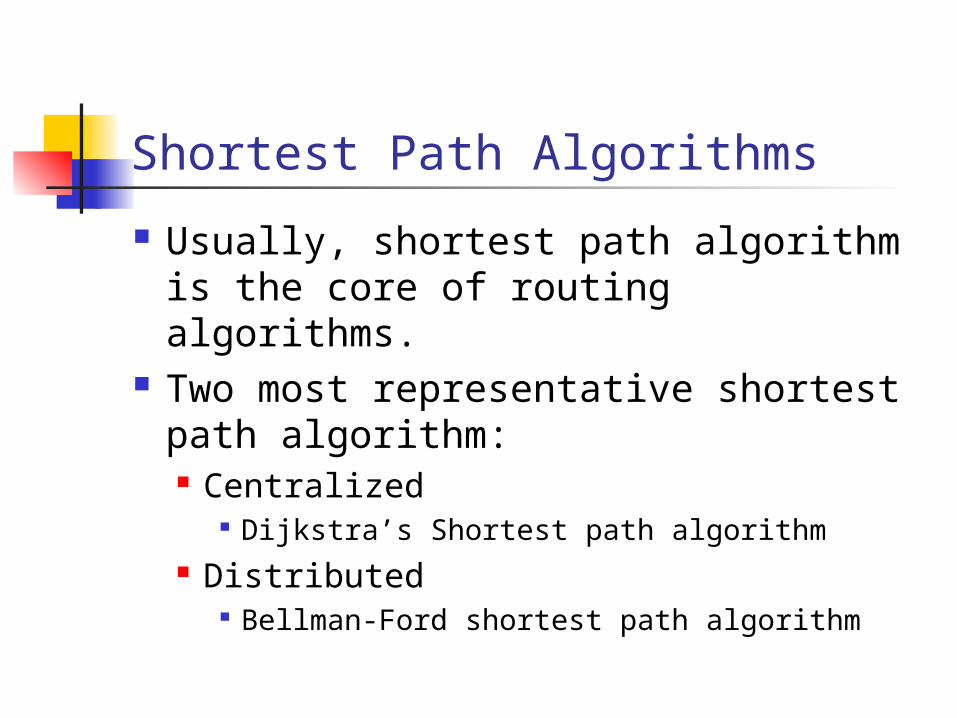
Shortest Path Algorithms
Usually, shortest path algorithm is the core of routing algorithms.
Two most representative shortest path algorithm: Centralized
Dijkstra’s Shortest path algorithm Distributed
Bellman-Ford shortest path algorithm

Derived notations

Derived notations (2)

Chapter 4. Performance Evaluation 4.1 Objectives
Show that a delay sensitive routing algorithm that considers with node delay in high speed packet-switching network may have a better result.
4.2 Performance Metrics Convergence speed Average path delay time Goodput ratio

Experiments and Objectives Exp-1: Convergence Test
Observing the speed of convergence Studying the behaviors within the iteration
process Exp-2~4: Sensitivity to
connectivity BP ratio (Bandwidth/CPU) number of nodes
Observing the performance using the two metrics average path delay time and goodput ratio. (portion of traffic requests satisfied in D)

Parameters and Test InstancesParameters and Ranges for Test Instances
Parameters Range of values
number of nodes 10,20, … , 100
link bandwidth 0~400 Gbps
node connectivity 0+%, 20%, 40%, 60%, 80%, 100%
link propagation delay time 1~20 ms
node processing capacity 0~400 Gbps
traffic requests 0~1000 Mbps
delay bound (D) 100~2000 ms

Result of Exp-1: Convergence Test
Parameters Setup: number of nodes: 10, 20, 30, … , 100 BP ratio: 1/100, 1/90, … , 1/10, 1/5 connectivity: 0+%, 10%, 20%, … , 100%
Objective: Speed of convergence
K1: K1-th iteration that convergence happens K2: K1-th slice that convergence happens N: number of nodes
Behaviors within the iteration process goodput ratio average path delay time epison value and terminate
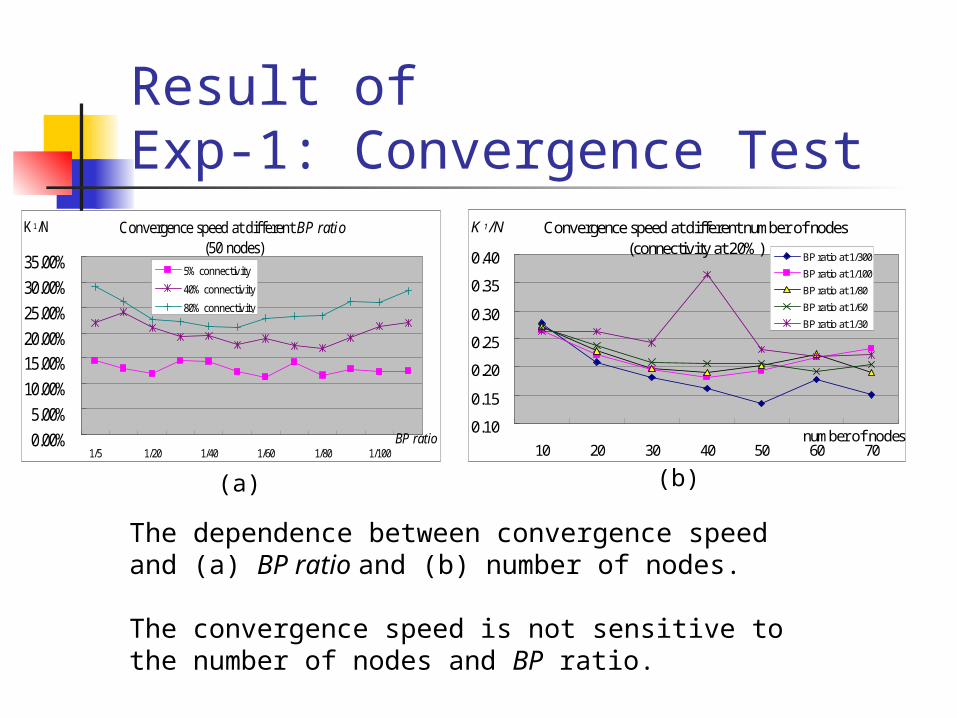
Result of Exp-1: Convergence Test
Convergence speed at different BP ratio(50 nodes)
0.00%5.00%
10.00%15.00%20.00%25.00%30.00%35.00%
1/5 1/20 1/40 1/60 1/80 1/100BP ratio
K1/N
5% connectivity
40% connectivity
80% connectivity
Convergence speed at different number of nodes(connectivity at 20%)
0.10
0.15
0.20
0.25
0.30
0.35
0.40
10 20 30 40 50 60 70number of nodes
K 1 /N
BP ratio at 1/300
BP ratio at 1/100
BP ratio at 1/80
BP ratio at 1/60
BP ratio at 1/30
The dependence between convergence speed and (a) BP ratio and (b) number of nodes.
(a) (b)
The convergence speed is not sensitive to the number of nodes and BP ratio.

Result of Exp-1: Convergence Test (2)
Convergence speed at different connecrtivity(50 nodes)
0.00
0.05
0.10
0.15
0.20
0.25
0.30
0.35
0+% 5% 10% 20% 40% 60% 80% 90% 100%
connectivity
K 1/N
BP ratio at 1/5
BP ratio at 1/30
BP ratio at 1/60
BP ratio at 1/90
BP ratio at 1/100
BP ratio at 1/300
Converge speed at different epislon(50 nodes, BP ratio at 1/20)
0
0.05
0.1
0.15
0.2
0.25
0.3
0.35
0.00
%
0.02
%
0.04
%
0.06
%
0.08
%
0.10
%
0.12
%
3.99
%
5.86
%
Epislon
K 1 /N
0+% connectivity
20% connectivity
40% connectivity
60% connectivity
80% connectivity
100% connectivity
The dependence between convergence speed and (c) connectivity and (d) epison value.
The convergence speed is sensitive to the connectivity and the epison value.
(c) (d)
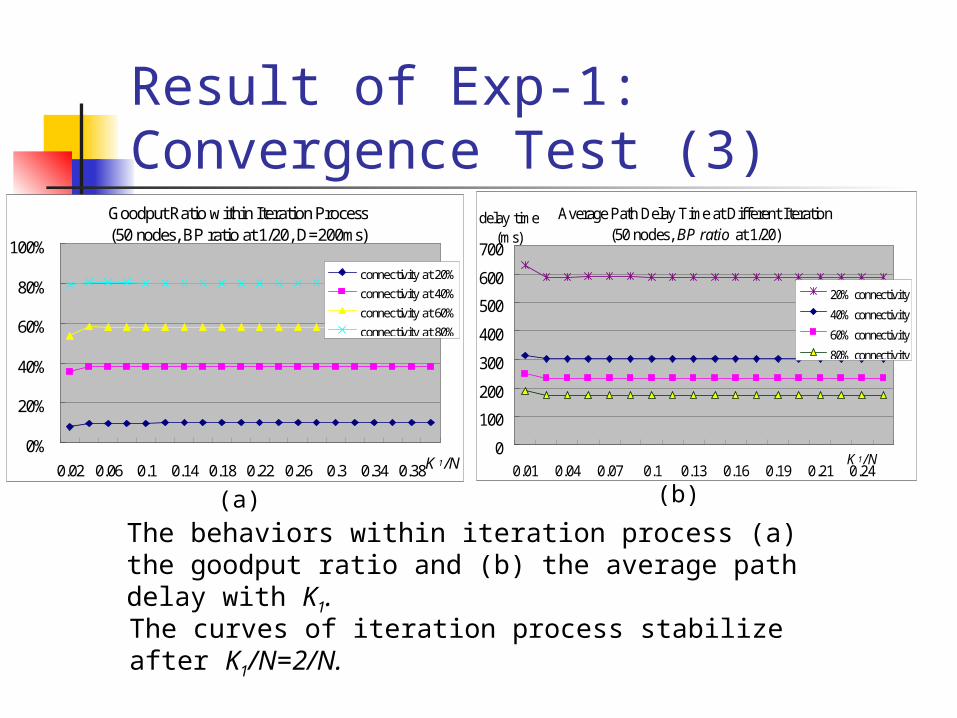
Result of Exp-1: Convergence Test (3)
Goodput Ratio within Iteration Process(50 nodes, BP ratio at 1/20, D=200ms)
0%
20%
40%
60%
80%
100%
0.02 0.06 0.1 0.14 0.18 0.22 0.26 0.3 0.34 0.38K 1 /N
connectivity at 20%
connectivity at 40%
connectivity at 60%
connectivity at 80%
Average Path Delay Time at Different Iteration(50 nodes, BP ratio at 1/20)
0
100
200
300
400
500
600
700
0.01 0.04 0.07 0.1 0.13 0.16 0.19 0.21 0.24K 1 /N
delay time(ms)
20% connectivity
40% connectivity
60% connectivity
80% connectivity
The behaviors within iteration process (a) the goodput ratio and (b) the average path delay with K1.
The curves of iteration process stabilize after K1/N=2/N.
(a) (b)
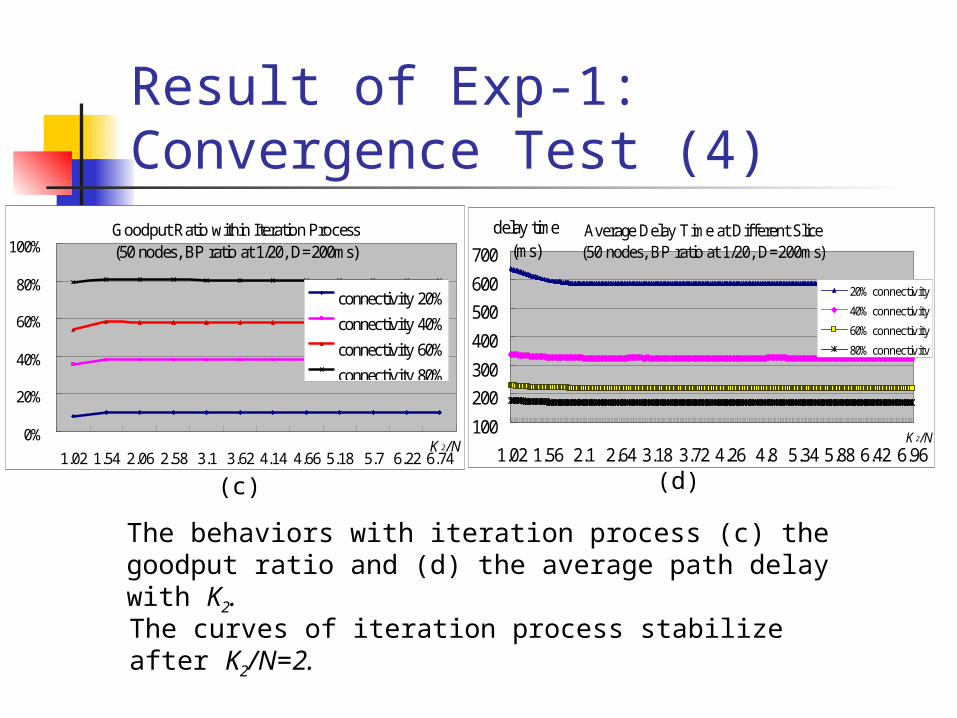
Result of Exp-1:Convergence Test (4)
Average Delay Time at Different Slice(50 nodes, BP ratio at 1/20, D=200ms)
100
200
300
400
500
600
700
1.02 1.56 2.1 2.64 3.18 3.72 4.26 4.8 5.34 5.88 6.42 6.96K 2/N
delay time(ms)
20% connectivity
40% connectivity
60% connectivity
80% connectivity
Goodput Ratio within Iteration Process(50 nodes, BP ratio at 1/20, D=200ms)
0%
20%
40%
60%
80%
100%
1.02 1.54 2.06 2.58 3.1 3.62 4.14 4.66 5.18 5.7 6.22 6.74K 2 /N
connectivity 20%
connectivity 40%
connectivity 60%
connectivity 80%
The behaviors with iteration process (c) the goodput ratio and (d) the average path delay with K2.
The curves of iteration process stabilize after K2/N=2.
(c) (d)

Result of Exp-2: Sensitivity to Connectivity
Parameters Setup: connectivity: 0+%, 10%, 20%, … , 100%
Objective: Observation of metrics:
goodput ratio average path delay time

Result of Exp-2: Sensitivity to Connectivity (2)Improvement in Average Path Delay Time at
Different Connectivity (50 nodes)
0%
5%
10%
15%
20%
25%
30%
35%
0+% 20% 40% 60% 80% 100%connectivity
BP ratio at 1/300
BP ratio at 1/100
BP ratio at 1/60
BP ratio at 1/30
BP ratio at 1/5
Improvement in Goodput Ratio atDifferent Connectivity
(50 nodes, BP ratio at 1/20)
-10%
0%
10%
20%
30%
40%
20% 40% 60% 80%connectivity
D=200ms
D=300ms
D=400ms
D=500ms
D=600ms
D=800ms
D=2000ms
Sensitivity to connectivity on (a) Average Path Delay time and (b) Goodput Ratio.
The improvement in average path delay time grows with the connectivity, however, goodput ratio raises at both ends of connectivity.
(a) (b)

Result of Exp-3: Sensitivity to BP Ratio
Parameters Setup: BP ratio: 1/100, 1/90, … 1/10, 1/5
Objective: Observation of metrics:
goodput ratio average path delay time

Result of Exp-3: Sensitivity to BP Ratio (2)
Improvement in Average Path Delay Time atDifferent BP ratio (50 nodes)
0%
5%
10%
15%
20%
25%
30%
35%
1/300 1/200 1/100 1/90 1/80 1/70 1/60 1/50 1/40 1/30 1/20 1/10 1/5 1/1
BP ratio
connectivity at 0+%
connectivity at 20%
connectivity at 40%
connectivity at 60%
connectivity at 80%
Inprovement in Goodput Ratio at Different BP ratio(50 nodes, connectivity at 80%)
-10%-5%
0%5%
10%15%
20%25%
30%
1/300 1/100 1/80 1/60 1/40 1/20 1/5
BP ratio
D=100ms
D=400ms
D=800ms
D=1000ms
D=1500ms
D=2000ms
(a) (b)
Sensitivity to BP ratio on (a) Average Path Delay time and (b) Goodput Ratio.
The improvement in average path delay time grows with the BP ratio, so is the improvement in goodput ratio.
Result of Exp-4: Sensitivity to number of nodes
Parameters Setup: Number of nodes: 10, 20, …, 100
Objective: Observation of metrics:
goodput ratio average path delay time
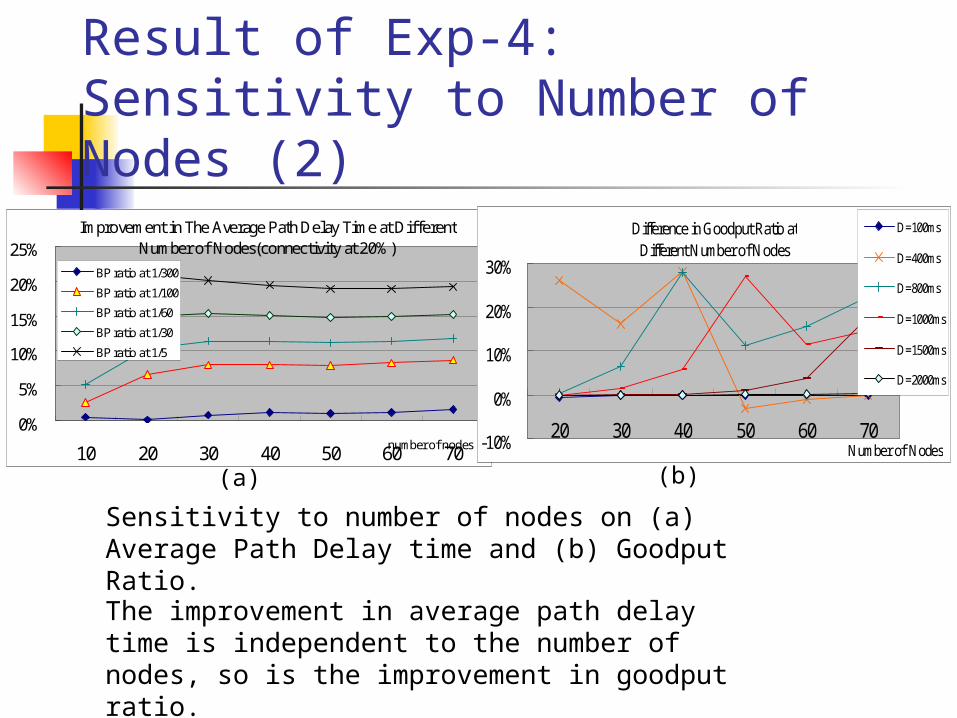
Result of Exp-4: Sensitivity to Number of Nodes (2)Improvement in The Average Path Delay Time at Different
Number of Nodes(connectivity at 20%)
0%
5%
10%
15%
20%
25%
10 20 30 40 50 60 70number of nodes
BP ratio at 1/300
BP ratio at 1/100
BP ratio at 1/60
BP ratio at 1/30
BP ratio at 1/5
Difference in Goodput Ratio atDifferent Number of Nodes
-10%
0%
10%
20%
30%
20 30 40 50 60 70Number of Nodes
D=100ms
D=400ms
D=800ms
D=1000ms
D=1500ms
D=2000ms
(a) (b)
Sensitivity to number of nodes on (a) Average Path Delay time and (b) Goodput Ratio.
The improvement in average path delay time is independent to the number of nodes, so is the improvement in goodput ratio.
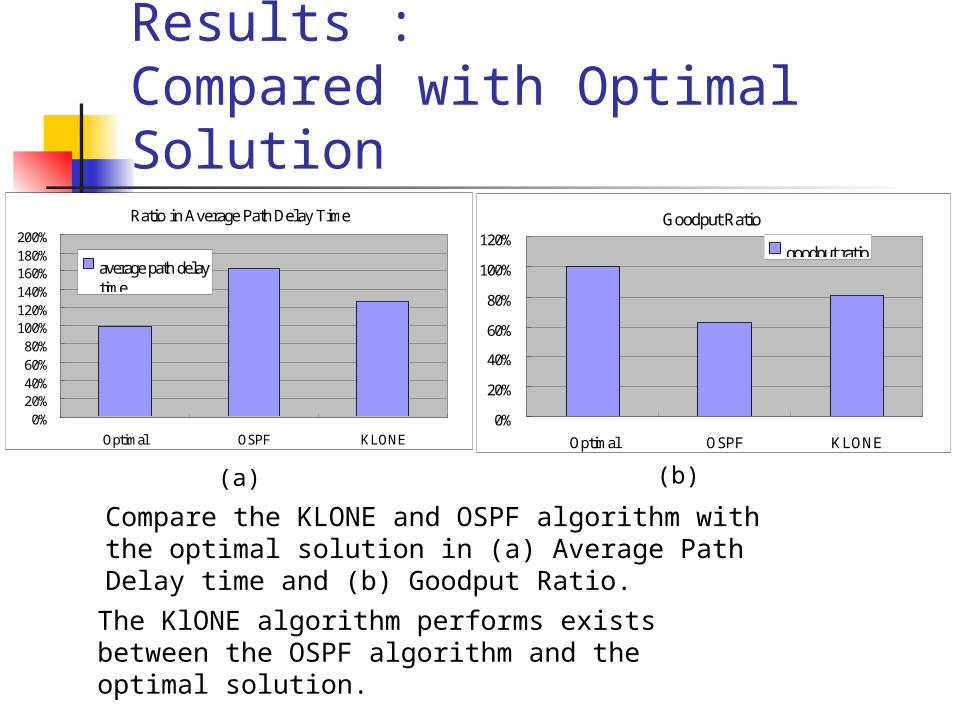
Results :Compared with Optimal SolutionRatio in Average Path Delay Time
0%20%40%60%80%
100%120%140%160%180%200%
Optimal OSPF KLONE
average path delaytime
Goodput Ratio
0%
20%
40%
60%
80%
100%
120%
Optimal OSPF KLONE
goodput ratio
(a) (b)
Compare the KLONE and OSPF algorithm with the optimal solution in (a) Average Path Delay time and (b) Goodput Ratio.
The KlONE algorithm performs exists between the OSPF algorithm and the optimal solution.

Results:Weak points
Goodput ratio for different delay bound D
0%
20%
40%
60%
80%
100%
100 300 500 800 1500delay bound, D
KLONE
OSPF
Goodput difference of the KLONE and OSPFalgorithm at different delay bound, D
-10%
-5%
0%
5%10%
15%
20%
25%
30%
100 300 500 800 1500delay bound, D
Difference
(a) (b)
The goodput ratio (a) curve (b) difference on different delay bound, D.
The KLONE algorithm has a defeat in low D, however, it takes the wins when D get higher, until both of them are 100% satisfied.

Summary The Exp-1, convergence test, shows us that
the KLONE algorithm gets advances from the iteration process.
The Exp-2, Exp-3, and Exp-4 shows us that the performance improvement is influenced by the two parameters,
connectivity and BP ratio.
And the comparison with the optimal solution shows that
the performance of the KLONE algorithm is between the optimal solution and the OSPF algorithm.
5. Conclusion and Future Work The KLONE algorithm
satisfies the objective function and shows us that only considering link delay time is not enough and
provides controlled delay to support QoS for an ALL-IP Network, a high speed packet-switching network.
Future work: Multi-path routing More precise estimation of nodes and links delay
time. Processing/transmitting behavior VBR traffic Different priority
Distributed version