delay assessment framework for automated question ... assessment.pdf · eurasia journal of...
TRANSCRIPT

OPEN ACCESS
EURASIA Journal of Mathematics Science and Technology Education ISSN: 1305 8223
2017 13(4):1145-1159 DOI 10.12973/eurasia.2017.00663a
© Authors. Terms and conditions of Creative Commons Attribution 4.0 International (CC BY 4.0) apply.
Correspondence: Muhammad Munwar Iqbal, Department of Computer Science & Engineering, University of
Engineering and Technology, Lahore, PAKISTAN
Delay Assessment Framework for Automated Question-Answering System: An Approach for eLearning Paradigm
Muhammad Munwar Iqbal
Department of Computer Science & Engineering, University of Engineering and Technology, Lahore, PAKISTAN
Yasir Saleem Department of Computer Science & Engineering, University of Engineering and Technology, Lahore, PAKISTAN
Received 31 May 2016 ▪ Revised 12 August 2016 ▪ Accepted 23 August 2016
ABSTRACT
Adoption of Electronic Learning (eLearning) for the dissemination of higher education is
rapidly increasing day by day. A large number of universities offering hundreds of course
and a large number of the students are taking advantage from this type of learning
paradigm. The purpose of this study is to investigate the delay factor in answering the
students’ questions. The tutoring of the students will be very effective if the student’s
queries are responded well in time. The student questions are replied by the instructors
using online Learning Management Systems (LMS). These queries are often delayed too
long that students have to wait, and their learning is also disturbed. The participants are
selected by random sampling method. Total queries are 3434, which are analyzed, and delay
is calculated by using a proposed algorithm. The clusters of the student’s questions and
patterns are recognized. The automated correction of the student questions by the help of
the vocabulary or dictionary APIs. The Application Programmable Interface (APIs) will speed
up the question answering of the student queries. The gap in the science educational
literature, the constructivist in the eLearning environment, students’ motivation, self-
efficacy and anxiety in science subject assessment effect the learning curve of the students
negatively or positively.
Keywords: eLearning, learning management system (LMS), delay assessment, question-
answering, data analysis
INTRODUCTION
Electronic Learning is an emerging field that attained popularity in the recent decade. eLearning is designed to facilitate the instructors, learning technologists, and people with a general interest in remote education. eLearning become a very speedy innovative paradigm that proved effective educational technique (Emelyanova & Voronina, 2014). Learners who want to deepen their knowledge use eLearning courses and training from international online universities. In contrast to traditional classroom learning, eLearning is defined as knowledge collaboration using electronic media and mathematical skills (Baykul, 2004; De Corte, 2004).

M. M. Iqbal & Y. Saleem
1146
To achieve the learning goals constructivism in learning environment is most important (Kwan & Wong, 2015). The motivation and constructivism in the learning environment are directly related to each other that enhance the student learning. Students self-efficacy also in eLearning environment increase the learning curve positively (Bergman et al., 2013). The student questions unanswered in the eLearning environment creates anxiety in students. It slows down the student learning, especially in an eLearning environment. In eLearning paradigm courses and programs are offered via internet based resources (Masud & Huang, 2012).
The evolution of eLearning results in the development of information and communication technologies (ICT) in education. ICT used to facilitate a large number of the student to learn and trained (Qteishat, Alshibly, & Al-Ma’aitah, 2013). The ICT minimized the gap between the education resources and the students. eLearning differs from the traditional learning as it can be used for both synchronous and asynchronous mode of communication. But eventually, at the same time increase the distance between the teacher and student. A lot of stuff is available on the internet for the online learners (Richter & McPherson, 2012). Massive Open Online Course (MOOCs) are also available for the student (McGreal, Kinutha, & Marshall, 2013). MOOCs are designed to teach the single topics content. MOOCs are very short time duration instead of the video lecture. The assessment of the delay is a need to be calculated for the improvement of the student (Ariffin, Alias, Rahman, & Sardi, 2014). This leads to minimizing the gap between the student-teacher interaction. The analysis of the question text will be a help to find the weak area while answering the student question.
Cloud computing virtualization of the resource technologies & innovation suitability for the participants is the key difficulties in adopting the recent learning advancement to respond the participants of the eLearning. Although LMS acceptance and adaptation is increasing rapidly, yet problem faced by the students, teacher and administrators from different perspectives: administrator faces the challenge to retain the students, students face problem in
State of the literature
The interactive information exploration area has the ability to locate the desired text and information. But
the content retrieved may be affected by the major factors which are: average delay time of the system,
relevance of the results which are extracted by the machines (Desmarais, Fu, & Pu, 2005).
The adaptation of the technology is essential as technologies are more affordance for the education and
assessment (Qteishat et al., 2013).
The addition of the new constraint always delayed the auto correction of student question and definitely
the question-answering module. The automated correction of the student questions by the help of the
vocabulary or dictionary APIs.
The gap in the science educational literature, the constructivist in the eLearning environment, students’
motivation, self-efficacy and anxiety in science subject assessment effect the learning curve of the students
negatively or positively.
Contribution of this paper to the literature
By the analysis of the real-time data of student annoying factor can be minimized.
This paper presents a methodology to calculate the delay of the student queries in learning paradigm.
Adjustment of the student-teacher ratio in each subject by the analysis of the delay that is useful for the
institutional administration.
EURASIA J Math Sci and Tech Ed
1147
understanding their concepts and delay in answer to their question (Emelyanova & Voronina, 2014).
The question answering is tightly associated with the student queries and their understanding by using the natural language processing. This coupling used for eliminating the ambiguities in student question that are posed in learning management system. In the structure and unstructured data, the delay in identifying the ambiguities leads to delay in answers to the student questions. The natural language processing is used for the recognition of the student question like the object of the verb “read” be either an author or title. Such types of ambiguities are identified and resolved for the timely answering. The robotic navigation ultimately requires specified directions. These calculated directions for the robot to move or turn and hierarchical planning with detailed decisions (e.g., how or exactly where to move) being delayed until a high-level plan have been achieved effectively. (Tate, Hendler, & Drummond, 1990).
The interactive information exploration area has the ability to locate the desired text and information. But the content retrieved may be affected by the major factors which are: average delay time in the system, the relevance of the results which are extracted by the machines, ability to identify the most relevant contents of the output of search results. Moreover, it may also dependent upon the user skill and presentation of the contents and formats (Desmarais, Fu, & Pu, 2005). The addition of the new constraint always delayed the auto correction of students question and definitely the question-answering module. The automated correction of the student questions by the help of the vocabulary or dictionary APIs. This will speed up the question answering of the student queries.
Actions can have side effects, which may be delayed and may affect the world at multiple points in time. They may, in turn, trigger other delayed or non-delayed side effects. (Van Harmelen, Lifschitz, & Porter, 2008). The use of the knowledge base is sometimes minimizing the delay in answering to a student question, but this technique is only suitable for some restricted domain and restricted question data set. The open-domain questions are not handled by this approach. The shared background knowledge is required for the tautologies for the query related clauses. The complex questions are compromises the delay and not answered by this fashion. Optimization can be done by the knowledge base partitioning, each portion deal only those clauses, which is specific to find the answers. This technique has drawbacks in the search for the new answers and question that are not the part of the knowledge base.
Knowledge base partitioning gives small time-slots for deduction and the possibilities for preprocessing of the input clauses are limited. While all proof tasks share the majority of clauses, the remaining differences would still require optimizations to be specific for any single result derivation. Tests for sub-assumption and tautologies are performed on both the shared background knowledge and the individual query-related clauses. However, more complex preprocessing steps have to compromise in order to minimize the delay. A straightforward optimization is to partition the knowledge base so that each derivation is started with those clauses only which might actually help in reaching the goal(Furbach, Glöckner, & Pelzer, 2010)
M. M. Iqbal & Y. Saleem
1148
MATERIAL AND METHODS
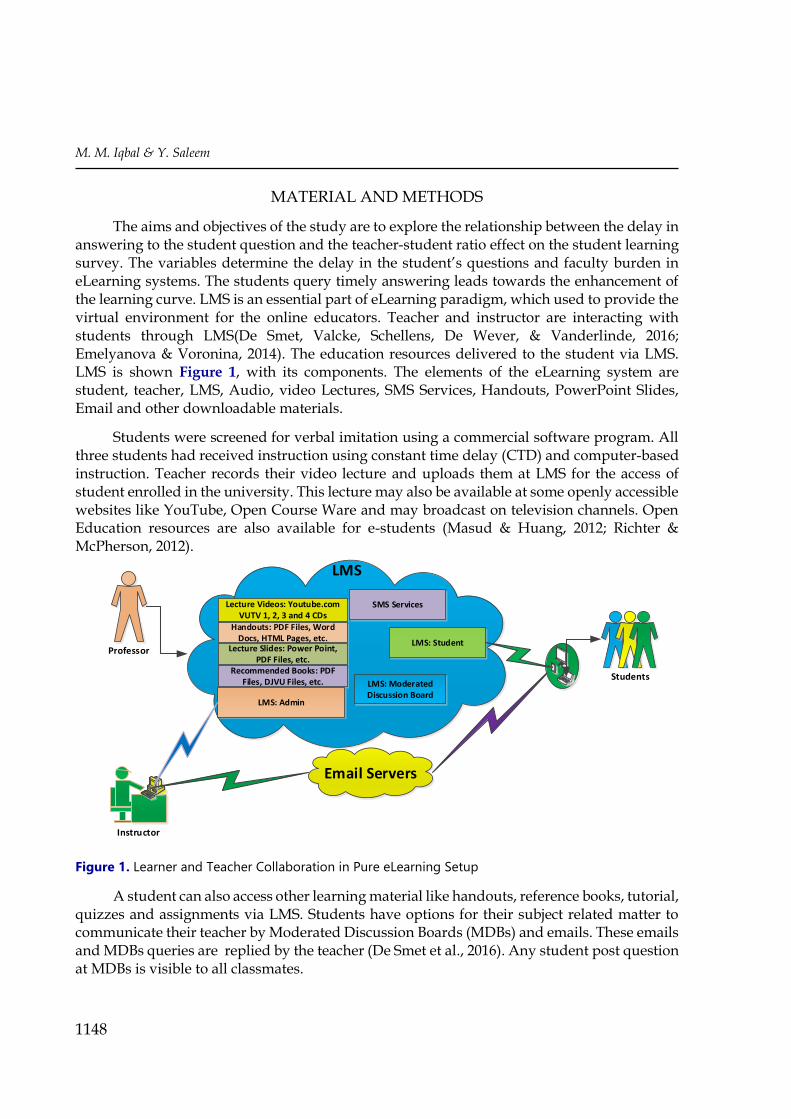
The aims and objectives of the study are to explore the relationship between the delay in answering to the student question and the teacher-student ratio effect on the student learning survey. The variables determine the delay in the student’s questions and faculty burden in eLearning systems. The students query timely answering leads towards the enhancement of the learning curve. LMS is an essential part of eLearning paradigm, which used to provide the virtual environment for the online educators. Teacher and instructor are interacting with students through LMS(De Smet, Valcke, Schellens, De Wever, & Vanderlinde, 2016; Emelyanova & Voronina, 2014). The education resources delivered to the student via LMS. LMS is shown Figure 1, with its components. The elements of the eLearning system are student, teacher, LMS, Audio, video Lectures, SMS Services, Handouts, PowerPoint Slides, Email and other downloadable materials.
Students were screened for verbal imitation using a commercial software program. All three students had received instruction using constant time delay (CTD) and computer-based instruction. Teacher records their video lecture and uploads them at LMS for the access of student enrolled in the university. This lecture may also be available at some openly accessible websites like YouTube, Open Course Ware and may broadcast on television channels. Open Education resources are also available for e-students (Masud & Huang, 2012; Richter & McPherson, 2012).
Professor
Instructor
LMS
Lecture Videos: Youtube.comVUTV 1, 2, 3 and 4 CDs
Handouts: PDF Files, Word Docs, HTML Pages, etc.
Lecture Slides: Power Point, PDF Files, etc.
Recommended Books: PDF Files, DJVU Files, etc.
LMS: Student
LMS: Moderated Discussion Board
LMS: Admin
`
Email Servers
Students
SMS Services
Figure 1. Learner and Teacher Collaboration in Pure eLearning Setup
A student can also access other learning material like handouts, reference books, tutorial, quizzes and assignments via LMS. Students have options for their subject related matter to communicate their teacher by Moderated Discussion Boards (MDBs) and emails. These emails and MDBs queries are replied by the teacher (De Smet et al., 2016). Any student post question at MDBs is visible to all classmates.

EURASIA J Math Sci and Tech Ed
1149
Experimental Design
The research is conducted at the high gauge with a large number of the students. These students were enrolled at the Virtual University of Pakistan. All the participants were taken admission in undergraduate and master level courses. The majority of the students belong to the bachelor of the computer Science. A minor percentage of the student from other disciplines like management science, mathematics, commerce and arts groups. These participants are enrolled in the subject “Introduction to Computing” in the fall semester 2015.
Figure 2. Participant’s Age Distribution
The Virtual University of Pakistan has 131 campuses over the country and more than 50,
000 students are registered in 12 disciplines. The overseas students are mostly home-based.
They learn through the electronic and multimedia content delivered over the internet. The
targeted population is consisting of the computer science students in the Virtual University of
Pakistan. The students are scattered over 20 countries over the world map. The Age of the
participants is shown in Figure 2. The age groups of the student belong to the different
categories like 17-23, b-27, 28-33, 34-40 and 41-50. The students have a different level of skills,
a significant portion of the participant are beginner level and medium level computer skills.
The minor part of the participants is a master level skill. The skills level is the use of MS office
tools, with programming language proficiency as shown in Table 1.
42%
35%
11%
6%6%
17-23
24-30
31-36
37-43
44-50

M. M. Iqbal & Y. Saleem
1150
Table 1. Distribution of participants by gender, qualifications, and employment status and computer
skills
Characteristics Participant
Percentage Category
Participant
Percentage Category
Participant
Percentage Category
Gender 54% Males 44% Females 2% did not
specify
Qualifications 63.6% F.Sc. 36.4% Bachelors 0.0% Masters
Employment
status 76.9% Full-time 18.9% Contract 5.2% Part-time
Computer skills
Level 59.2% Beginners 25.5% Intermediate 15.3% Advance
Student Mode 80% Campus
Based 20% Home Based 0.0%
did not
specify
Citizenship 81% Native 19 International 0.0% did not
specify
The total number of 1108 student take part in this study. These students belong to the all
over the world with a significant number of Pakistani students. The range of the students ages
16-65 years. The number of male student to female student ratio is 54 to 44, where 2% of the
participant does not specify their gender. These all the students are undergraduate level and
graduation level. The queries are monitored throughout the semester. The data acquisition is
made from the real time MDBs data. There are more than three-hundred-pages data is
extracted. Each page contains the student question and teacher replies. The data is
preprocessed for the analysis. The anomalies are removed from the collected data. The
algorithm 1 presents the step taken for data preprocessing and analysis.
Algorithm 1. Algorithm for the Delay Assessment Analysis
Input: Comma Separated Values data file (*.CSV) 1
Output: Clusters of the student query-answer delay 2
Start 3
Start Preprocessing 4
Remove punctuation marks from the text 5
Remove numbers 6
Convert the text to lowercase 7
Remove "stop words" 8
Remove common word endings* (e.g., "ing", "es") 9
Strip whitespace 10
End Preprocessing 11
Stage the data and remove anomalies 12
FOCUS - on just the required stuff 13

EURASIA J Math Sci and Tech Ed
1151
Start by removing sparse terms 1
Start Calculating Word Frequency 2
Initialize a two column matrix 3
Count each term and put in a matrix 4
Words appear and the bottom number reflects how many words appear that 5
frequently 6
Considering the threshold greatest frequencies 7
View a table of the terms after removing sparse terms, as above 8
The above matrix was created using a data transformation 9
Comment: An alternate view of term frequency: 10
Comment: This will identify all terms that appear frequently (in this case, 50 or more times) 11
Comment: Change "50" to whatever is most appropriate for your data 12
Plot Word Frequencies that appear as the threshold times 13
End Calculating Word Frequency 14
Start Finding Relationships 15
Find Term Correlations 16
If words always appear together, then correlation=1.0 17
Change "question" & "analysis" to terms that actually appear in your texts 18
Also, adjust the ‘corlimit’ to any value that is necessary 19
End Finding Relationships 20
Start Word Clouds 21
Comment: First load the package that makes word clouds in R 22
Perform Hierarchal Clustering by using term similarity and word frequencies 23
End Word Clouds 24
Start K-means Clustering 25
First calculate distance between words 26
Now group them by the number of clusters 27
Draw Dendrogram around the clusters 28
Perform K-means clustering 29
End K-means Clustering 30
End 31
The collected data is also unstructured and pages contain Hyper Text Markup Language
(HTML) tags. These HTML pages also include Cascading Style Sheets (CSS) code, which is
used for formatting these documents for the aesthetics look and feel of web documents. The
data includes the empty lines, symbols, extra characters and irrelevant text. This data is pre-
processed to eliminate the logged information, CSS, and page structure information as
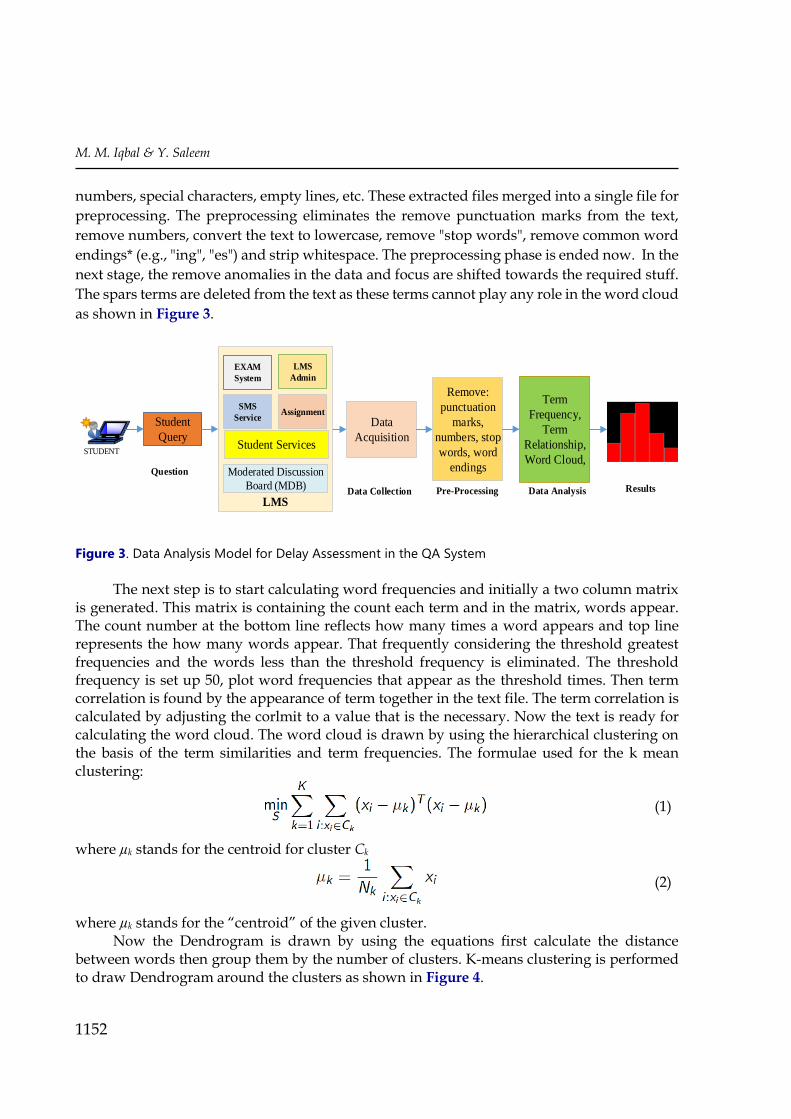
denoted in Algorithm 1. Figure 3 present the data analysis model for the delay in the QA
System eLearning paradigm. In the algorithms processing, the first is to input a “.CSV” file
finding the tendencies of the student queries. This file contains the student question data by
the 1108 students, which is collected by using the Learning Management System. This
student’s question data includes a large number of file with all types of symbols, tags, rational
M. M. Iqbal & Y. Saleem
1152
numbers, special characters, empty lines, etc. These extracted files merged into a single file for
preprocessing. The preprocessing eliminates the remove punctuation marks from the text,
remove numbers, convert the text to lowercase, remove "stop words", remove common word
endings* (e.g., "ing", "es") and strip whitespace. The preprocessing phase is ended now. In the
next stage, the remove anomalies in the data and focus are shifted towards the required stuff.
The spars terms are deleted from the text as these terms cannot play any role in the word cloud
as shown in Figure 3.
Student
Query STUDENT
Remove:
punctuation
marks,
numbers, stop
words, word
endings
Data
Acquisition
LMS
LMS
Admin
Assignment
EXAM
System
SMS
Service
Moderated Discussion
Board (MDB)
Term
Frequency,
Term
Relationship,
Word Cloud, Question
Data Collection Pre-Processing Data Analysis Results
Student Services
Figure 3. Data Analysis Model for Delay Assessment in the QA System
The next step is to start calculating word frequencies and initially a two column matrix is generated. This matrix is containing the count each term and in the matrix, words appear. The count number at the bottom line reflects how many times a word appears and top line represents the how many words appear. That frequently considering the threshold greatest frequencies and the words less than the threshold frequency is eliminated. The threshold frequency is set up 50, plot word frequencies that appear as the threshold times. Then term correlation is found by the appearance of term together in the text file. The term correlation is calculated by adjusting the corlmit to a value that is the necessary. Now the text is ready for calculating the word cloud. The word cloud is drawn by using the hierarchical clustering on the basis of the term similarities and term frequencies. The formulae used for the k mean clustering:
(1)
where µk stands for the centroid for cluster Ck
(2)
where µk stands for the “centroid” of the given cluster. Now the Dendrogram is drawn by using the equations first calculate the distance
between words then group them by the number of clusters. K-means clustering is performed to draw Dendrogram around the clusters as shown in Figure 4.

EURASIA J Math Sci and Tech Ed
1153
Figure 4. A subset of the terms included in the Question Answering
After the removal of the non-related data, the analysis is started. The R tool version 3.2.5 for Statistical Computing Platform 64-bit is used. Some of the results are also transformed using the Tableau Desktop Software (version 9.3). The results are discussed in detail in next section.
RESULTS AND DISCUSSIONS
The aim of this study is to analyze the student motivation towards posting questions and measures the responses delay by the teacher in eLearning paradigm. Student question analysis in perspective to the question text and delay measurements are extremely useful for the student engagement (Çalık, 2013; Murray, Giesbrecht, & Mosonyi, 2013).The responses are more motivated towards the learning and effectiveness of the online learning (Al-Abdullatif, 2012). This also leads the student to misconceptions in concepts learning (Gurel, Eryılmaz, & McDermott, 2015). The basic purposes to enhance the optimum usage of the resources (Delen, 2015). LMS is used in eLearning environments to facilitate the student and institute interactions. The student allowed an interface name MDB for the questioning. The teachers have obligatory to answer these questions. The data is collected about the different 45 lectures. The data acquisition is made from the real time MDBs data. There are more than three-hundred-pages data is extracted. Each page contains the student question and teacher replies. The data is preprocessed for the analysis. The collected data is unstructured and pages are transformed.

M. M. Iqbal & Y. Saleem
1154
The data includes the empty lines, symbols, extra characters and irrelevant text. Figure
5 presents the Tableau query for the data clustering used for the analysis. (restrict 1 (aggregate 2 (leftjoin 3 (table [TableauTemp].[data2modified3#csv]) 4 (restrict 5 (table [TableauTemp].[data2modified3#csv]) 6 ([StudentID]) 7 ) 8 (([Delay] [StudentID])) 9 ) 10 ( ([StudentID] [StudentID])) 11 ( ([sum:Delay:ok] 12 (sum [Delay]) 13 ) 14 ([sum:Number of Records:ok] 15 (sum 1) 16 ) 17 ) 18 ) 19 ([StudentID] [sum:Delay:ok] [sum:Number of Records:ok]20
Figure 5. Query for the data Clustering
The word cloud is formed based upon the frequency of the words phrases appeared in the student questions. The formation of the word cloud relies on the top number frequencies with which the words appear. Figure 6 represents the word cloud of the extracted text from the question. The words with same frequency are shown in same font size and color.
Figure 6. Word Cloud of Question Text after removing punctuations, symbols, numbers, word endings,
whitespaces, and stop words

EURASIA J Math Sci and Tech Ed
1155
Table 2 represents the summary of the collected data in the form of descriptive statistics. Total extracted data records are 3434 in the collected dataset. Each record represents the student question with postdate. The date on which the student put the question is called postdate. The teacher reply time and date is also included in the dataset. A total number of student posted question during the whole semester are 1108. The enrollment of the student in the course is about 10,000. Standard deviation is136.348 hours from the collected data sample.
Table 2. Descriptive Statistics of the Collected Data
Count
records
Distinct
students
Total delay
in Hours
Average
delay
Standard
Deviation
Max
delay
Min
delay Medians
3434 1108 93546 84.3898 136.348 1472 1 42
The maximum delay calculated is 1472 hours for a single student and a minimum delay count is usually 1 hour. The delay in minutes is negligible because the teacher always takes the time to read and understand student question. Few minutes also required to the teacher for compiling and posting the question reply. The average delay is measured for each student is 84.389, which is more than three days. It is a big number for the students to wait for an answer. Total delay is 93546 hours that is transformed into 3897days in answering all the questions. This delay is larger than the total days required to complete a semester for any single student. The clustering is performed to group the similar delays as shown in Figure 7.
Figure 7. Cluster of the Students Vs. Delay in Hours

M. M. Iqbal & Y. Saleem
1156
The size the bubble indicates the size of each cluster and number in it represents the value of delay. Total clusters are formed during analysis of the data are 102. In other words, the total number of the students is combined in the same cluster, which faced the same delay. The delay time is more in small size cluster, while less in big clusters. The minimum delay is 1 and maximum delay is 714 hours and median is 12.00. In some cluster the delay time to response the student queries are close to hundred hours’ delay. The average delay for clustered data is 33.67 hours. This delay leads the student to the annoying situation and stops the learning process or at least the hindrance in this process. The student feels helpless when more than 1-hour delay occurs to reply them as shown in Figure 8.
Figure 8. Number of Records vs. Sum of Delays
In Figure 8 presents the sum of the number of the records along the x-axis. While the some of the delays along the y-axis. The sum of the delays is the dependent variable, which shows the delay value from 0 to more than 1400 delays.

EURASIA J Math Sci and Tech Ed
1157
Figure 9. Delay against distinct student IDs
In Figure 9 apparently, indicates the delay against each distinct Student ID. For the whole semester, the cumulative delay of the student is represented on the bubbles in hours. These delays occur in answering the single student queries during one semester. This delay analysis is strong evidence for administration to show the student teacher question answering gap. Now it is clearly helpful to the administration of the institution to check the student teacher ratio in both current and future semesters. This research will also be useful to reduce the load on teachers and stress of students.
CONCLUSION
This research aims to measure and investigate the delay of the student queries. These questions are imperative for the student to continue the learning process if they are answered well on time. The learning curve is affected negatively and the delay is an annoying factor for the student. The learning curve of the online students commonly not cross the traditional education student due to striving for answers always. This thrust is never fulfilled. The conclusion of the study is that the administrator requires hiring the faculty for smooth answering the student questions. The educator and instructor should have the essential skill for answering the student. The information and communication technologies also play a major role in finding the correct and precise answer. The future directions are: to introduce techniques for the elimination of delay automatically and prioritize the questions. The machine learning approaches can also be used for the prediction of required student ratio in science education subjects. This may also be calculated for the optimal student-teacher requirement in the future enrollments. The future works for this research adopting automatic techniques for
M. M. Iqbal & Y. Saleem
1158
the extraction data from the student teacher interactive learning management systems. Then the extracted data is used for the finding better ways for the collaboration of the answering to the student questions.
ACKNOWLEDGEMENTS
I wish to acknowledge my colleagues at University of Engineering and Technology, Taxila, Pakistan, and especially for Mr. Muhammad Farhan, a Ph.D. scholar at UET, Lahore.
REFERENCES
Al-Abdullatif, A. M. (2012). An investigation into the perceptions of university students and instructors on the effectiveness of online education in a Saudi tertiary environment: Griffith University.
Ariffin, N. H. M., Alias, N. A., Rahman, H. A., & Sardi, J. (2014, 10-12 Dec. 2014). Assessment of the students' utilization of a Learning Management System in a Malaysian higher education. Paper presented at the e-Learning, e-Management and e-Services (IC3e), 2014 IEEE Conference on.
Bergman, E. M., Sieben, J. M., Smailbegovic, I., de Bruin, A. B., Scherpbier, A. J., & van der Vleuten, C. P. (2013). Constructive, collaborative, contextual, and self‐directed learning in surface anatomy education. Anatomical sciences education, 6(2), 114-124.
Çalık, M. (2013). Effect of technology-embedded scientific inquiry on senior science student teachers’ self-efficacy. Eurasia Journal of Mathematics, Science & Technology Education, 9(3), 223-232.
De Smet, C., Valcke, M., Schellens, T., De Wever, B., & Vanderlinde, R. (2016). A Qualitative Study on Learning and Teaching With Learning Paths in a Learning Management System. JSSE-Journal of Social Science Education, 15(1), 27-37.
Delen, E. (2015). Enhancing a Computer-Based Testing Environment with Optimum Item Response Time. Eurasia Journal of Mathematics, Science & Technology Education, 11(6), 1457-1472.
Emelyanova, N., & Voronina, E. (2014). Introducing a learning management system at a Russian university: Students' and teachers' perceptions. The International Review of Research in Open and Distributed Learning, 15(1).
Furbach, U., Glöckner, I., & Pelzer, B. (2010). An application of automated reasoning in natural language question answering. Ai Communications, 23(2-3), 241-265.
Gurel, D. K., Eryılmaz, A., & McDermott, L. C. (2015). A Review and Comparison of Diagnostic Instruments to Identify Students’ Misconceptions in Science. Eurasia Journal of Mathematics, Science & Technology Education, 11(5), 989-1008.
Kwan, Y. W., & Wong, A. F. (2015). Effects of the constructivist learning environment on students’ critical thinking ability: Cognitive and motivational variables as mediators. International Journal of Educational Research, 70, 68-79.
Masud, M. A. H., & Huang, X. (2012). An e-learning system architecture based on cloud computing. system, 10(11).
McGreal, R., Kinutha, W., & Marshall, S. (2013). Perspectives on Open and Distance Learning: Open Educational Resources: Innovation, Research and Practice.

EURASIA J Math Sci and Tech Ed
1159
Murray, J., Giesbrecht, N., & Mosonyi, S. (2013). 7. Enquiry, Engagement and eLearning: Three Perspectives on a Student-Centred, Online, Enquiry-Based Course. Collected Essays on Learning and Teaching, 6, 34-30.
Qteishat, M., Alshibly, H., & Al-Ma’aitah, M. (2013). Factors Influencing the Adoption of E-Learning in Jordan: an Extended TAM Model. European Journal of Business and Management, 5(18), 84-100.
Richter, T., & McPherson, M. (2012). Open educational resources: education for the world? Distance education, 33(2), 201-219.
Tate, A., Hendler, J., & Drummond, M. (1990). A review of {AI} planning techniques. Van Harmelen, F., Lifschitz, V., & Porter, B. (2008). Handbook of knowledge representation (Vol. 1):
Elsevier.
http://iserjournals.com/journals/eurasia