delaware information and analysis center
TRANSCRIPT
Delaware Information and Analysis Center

2019
DELAWARE
THERE WERE
730,095 LICENSED DRIVERS,
943,781 REGISTERED
MOTOR VEHICLES,
AND 10,390,000,000
VEHICLE MILES DRIVEN*.
THERE WERE
29,150 TRAFFIC CRASHES
RESULTING IN
133 PEOPLE KILLED &
8,510 PEOPLE INJURED
AND AN ECONOMIC LOSS** OF
OVER $1.2 BILLION DOLLARS.
* Vehicle Miles Driven estimated for the year 2019.
** Economic loss based on 2018 estimates from National Safety Council -- most recent available.
INTRODUCTION
occurring on public roadways which produced injuries and / or property damage
over $1500. Crashes investigated by all police agencies in Delaware are included
in the statistics unless otherwise noted.
Delaware's Annual Traffic Statistical Report for 2019 is available for viewing
and printing from the Delaware State Police website http://dsp.delaware.gov/reports
Current as well as past Reports are available from this site.
Publication date of report: June, 2020
i
This annual compilation of the 2019 crash statistics shows information for crashes

Table of Contents
Introduction i
General Traffic Statistics 1 - 9
Traffic Statistics in Brief 2
Population, Licensed Drivers, Registered 3
Motor Vehicles, & Vehicle Mileage
Number of Licensed Drivers 4 - 5
Vehicle Death Rates 6 - 7
Crash & Injury Data History 8
Traffic Deaths History 9
General Crash Statistics for 2019 10 - 26
Delaware Traffic Crash Facts 11
Statewide Fatal Crash Summary 12
Crash Comparison by County 13 - 14
Type of Crash 15
Contributing Circumstances 16
Contributing Circumstances in Intersection Related Crashes 17
Road, Light, & Weather Conditions 18
All Crashes by Day, Hour, & Month 19 - 24
Investigating Police Agencies 25 - 26
Vehicle / Driver Statistics 27 - 47
Type of Vehicle 28
Age of Driver 29
Gender & Residence of Driver 30
Motorcycle Crashes 31 - 34
Bicycle Crashes 35 - 37
Truck Crashes 38 - 41
School Bus Crashes 42 - 43
Pedestrian Crashes 44 - 47
Other Special Topics 48 - 56
Dangerous Times in Delaware 49 - 50
Seat Belt Data 51 - 56
Alcohol Related Crashes 57 - 75
Alcohol Involvement in Traffic Crashes 58 - 59
Alcohol Involvement in Traffic Injuries 60 - 61
Crash Fatalities by Age & Gender (All & Alcohol Related) 62 - 63
Crash Injuries by Age & Gender (All & Alcohol Related) 64 - 65
Drivers Killed by Age & Gender (All & Under the Influence) 66 - 67
Alcohol Related Crash Comparisons by County 68 - 69
Alcohol Related Crashes by Day, Hour, & Month 70 - 75
Delaware State Police Statistics 76 - 95
Crash Investigation 77 - 79
Traffic & Truck Enforcement 80 - 81
BAC Data for Drivers Arrested for DUI 82 - 84
Traffic Arrests Information by Troop (All, Speeding, 55 MPH, 85 - 95
65 MPH, DUI, Dangerous Moving, Child
Restraint, Seat Belt Assessments, Primary
Seat Belt Arrests, Aggressive Driving Related,
& Cell Phone Arrests)
Delaware Crash - Crime Clock 96

General
Traffic
Statistics
1

TRAFFIC STATISTICS IN BRIEF
2018 2019 % Change
Registered Vehicles 930,665 943,781 1%
Licensed Drivers 721,862 730,095 1%
Vehicle Miles Traveled** 10,188 10,390 2%
(in millions)
Population 966,919 972,332 1%
Fatal Crashes 104 123 18%
Personal Injury Crashes 5,216 5,492 5%
Property Damage Crashes 23,543 23,535 0%
Total Crashes 28,863 29,150 1%
Persons Killed 110 133 21%
Persons Injured 8,161 8,510 4%
Death Rate per 100 million 1.08 1.28 19%
Vehicle Miles Driven
Death Rate per 10,000 1.18 1.41 19%
Registered Vehicles
Death Rate per 100,000 11.38 13.68 20%
Population
** Vehicle Miles Traveled for Year 2016 is estimated.
2

POPULATION, LICENSED DRIVERS, REGISTERED
MOTOR VEHICLES, and MOTOR VEHICLE MILEAGE2003 - 2019
YEAR POPULATION LICENSED REGISTERED MOTOR VEHICLE
DRIVERS MOTOR VEHICLES MILEAGE **
** In Millions
2003 814,550 591,713 778,016 9,010
2004 826,280 604,124 803,942 9,263
2005 839,924 614,417 824,351 9,486
2006 853,006 620,433 841,620 9,407
2007 864,894 627,096 854,604 9,453
2008 876,194 634,358 850,138 8,959
2009 885,131 639,352 823,590 9,041
2010 900,429 648,125 819,898 8,948
2011 909,590 653,141 825,184 9,028
2012 917,700 658,395 831,496 9,147
2013 926,110 667,665 848,026 9,311
2014 935,883 674,869 867,438 9,570
2015 945,929 684,731 892,508 9,761
2016 955,754 697,535 909,609 10,151
2017 965,237 714,426 928,223 10,467
2018 966,919 721,862 930,665 10,188
2019 972,332 730,095 943,781 10,390
Source for population figures: Delaware Population Consortium
Source for licensed drivers and registered vehicles: DE DOT, Division of Motor Vehicles
Source for motor vehicle mileage: Department of Transportation
Mileage is estimated for the year 2019.
3

NUMBER & PERCENTAGE DISTRIBUTION
of
LICENSED DRIVERS
2019
AGE MALE FEMALE TOTAL
# %*
16 3,541 3,729 7,270 1%
17 4,446 4,708 9,154 1%
18 4,783 4,893 9,676 1%
19 5,283 5,141 10,424 1%
20 5,251 5,233 10,484 1%
21 - 24 22,035 21,663 43,698 6%
25 - 34 59,147 59,956 119,103 16%
35 - 44 53,560 56,036 109,596 15%
45 - 54 54,035 58,120 112,155 15%
55 - 64 61,187 67,786 128,973 18%
65 - 69 26,751 30,737 57,488 8%
70 & Older 52,533 59,541 112,074 15%
TOTAL: 352,552 377,543 730,095 100%
* Percentages may not add to 100% due to rounding.
Source for data: DEDOT, Division of Motor Vehicles
4

5
1618
2021 -
24
25 - 34
35 - 4445 - 54
55 - 64
65 - 69
70 & Older
MALES
16
18
20
21 -24
25 - 34
35 - 4445 - 54
55 - 64
65 - 69
70 & Older
FEMALES
16 17 18 19 20
21 - 24
25 - 34
35 - 44
45 - 54
55 - 64
65 - 69
70 & Older
DISTRIBUTION OF ALL LICENSED DRIVERS

VEHICLE DEATH RATES
YEAR MILEAGE REGISTRATION POPULATION
DEATH RATE DEATH RATE DEATH RATE
Delaware National Delaware National Delaware National
2003 1.64 1.55 1.90 1.89 18.17 15.40
2004 1.51 1.52 1.74 1.85 16.94 15.30
2005 1.40 1.52 1.61 1.83 15.83 15.30
2006 1.56 1.50 1.75 1.81 17.23 15.20
2007 1.25 1.45 1.38 1.73 13.64 14.60
2008 1.36 1.34 1.44 1.55 13.92 13.10
2009 1.31 1.22 1.43 1.42 13.33 11.80
2010 1.15 1.19 1.26 1.41 11.45 11.40
2011 1.14 1.20 1.25 1.39 11.34 11.30
2012 1.27 1.23 1.40 1.44 12.65 11.60
2013 1.08 1.18 1.19 1.38 10.91 11.20
2014 1.31 1.17 1.44 1.36 13.40 11.10
2015 1.34 1.22 1.49 1.43 14.06 11.80
2016 1.17 1.27 1.31 1.50 12.45 12.50
2017 1.16 1.25 1.30 1.48 12.54 12.40
2018 1.08 1.22 1.18 1.42 11.38 12.00
2019 1.28 1.41 13.68
Mileage Death Rate is the number of deaths per 100 million Vehicle Miles.
Registration Death Rate is the number of deaths per 10,000 Registrations.
Population Death Rate is the number of deaths per 100,000 Population.
Source for National figures: National Safety Council
National death rates for 2019 were not available at the time of publication.
6

7
0.00
0.20
0.40
0.60
0.80
1.00
1.20
1.40
1.60
1.80
2003 2004 2005 2006 2007 2008 2009 2010 2011 2012 2013 2014 2015 2016 2018 2019
Mileage Death Rate
Delaware National
0.000.200.400.600.801.001.201.401.601.802.00
2003 2004 2005 2006 2007 2008 2009 2010 2011 2012 2013 2014 2015 2016 2018 2019
Registration Death Rate
Delaware National
0.002.004.006.008.00
10.0012.0014.0016.0018.0020.00
2003 2004 2005 2006 2007 2008 2009 2010 2011 2012 2013 2014 2015 2016 2018 2019
Population Death Rate
Delaware National

STATEWIDE
CRASH AND INJURY DATA
2000 - 2019
YEAR ALL FATAL PERSONAL PROPERTY PERSONS PERSONS
CRASHES CRASHES INJURY DAMAGE KILLED INJURED
CRASHES CRASHES
2000 21,218 121 6,408 14,689 130 10,421
2001 20,406 119 6,019 14,268 139 9,965
2002 21,215 117 6,172 14,926 127 9,965
2003 21,020 138 5,644 15,238 148 8,898
2004 19,642 130 5,326 14,186 140 8,314
2005 18,682 118 5,349 13,215 133 8,366
2006 19,351 133 5,472 13,746 147 8,145
2007 20,017 106 5,254 14,657 118 7,568
2008 19,506 106 5,045 14,355 122 7,200
2009 18,927 102 5,025 13,800 118 7,239
2010 20,697 94 5,383 15,220 103 8,001
2011 20,867 97 5,215 15,555 103 7,700
2012 21,197 110 5,507 15,580 116 7,704
2013 21,378 96 4,994 16,288 101 7,789
2014 22,967 111 4,950 17,906 125 7,537
2015 24,066 129 5,253 18,684 133 8,058
2016 26,458 116 5,551 20,791 119 8,525
2017 28,080 114 5,427 22,539 121 8,332
2018 28,863 104 5,216 23,543 110 8,161
2019 29,150 123 5,492 23,535 133 8,510
8

Delaware Traffic Deaths1929 - 2019
'43
'44
'45
'46
'47
'48
'49
'50
'51
'52
'53
'54
'55
'56
'57
'58
9
'75
0
50
100
150
200
'29 '34 '39 '44 '49 '54 '59 '64 '69 '74 '79 '84 '89 '94 '99 '04 '09 '14 '19
Year
Actual Deaths 5 Year Average
67
108111
158
105
165
148153
6570
104
133
103
147

General
Crash Statistics
for
2019
10

DELAWARETraffic Crash Facts
There were 29,150 reportable traffic crashes of which 123 were fatal,
5,492 were personal injury, and 23,535 were property damage crashes.
A traffic crash was reported every 18 minutes.
In 123 fatal crashes, 133 persons were killed.
Fourteen (11%) of the persons killed in Delaware in 2019
were minors (less than 21 years old).
One person was killed every 66 hours as a result of traffic crashes.
There were 8,510 persons injured in Delaware crashes.
One person was injured every 62 minutes in traffic crashes.
For each person killed, there were 64 injured.
One out of every 20 licensed drivers in Delaware was a driver
in a traffic crash.
Alcohol was involved in 35% of the fatal crashes.
Of all the drivers killed in fatal crashes, nearly half (45%) of them were under
the influence of drugs and / or alcohol.
The number of pedestrians killed in traffic crashes in 2019
was 32, up from 24 in 2018.
For each pedestrian killed, there were 10 injured.
There were seven bicyclists killed in traffic crashes in 2019. There were
six bicycle fatalities in 2018.
There were 113 bicyclists injured in 2019.
Children under 15 years of age accounted for 16% of the bicyclists'
injuries.
There were 19 motorcyclists killed of which 11 were wearing a helmet.
Of the 16 motorcycle operators killed, 8 were under the influence of
alcohol and / or drugs.
Of the 74 occupants killed in traffic crashes in 2019,
46 were using occupant restraints.
Of the 689 occupants killed in traffic crashes in the last ten years,
only half (52%) were using occupant restraints.
11

2019STATEWIDE FATAL CRASH SUMMARY
1. Fatal Crashes and Fatalities
CRASHES DEATHS
New Castle 53 57
Kent 23 27
Sussex 47 49
TOTAL: 123 133
2. Alcohol Related Fatal Crashes and Fatalities
CRASHES DEATHS
New Castle 21 22
Kent 6 7
Sussex 16 18
TOTAL: 43 47
3. Status of Victims
A. CAR OCCUPANTS 74
Operators 61
Passengers 13
B. MOTORCYCLISTS 19
Operators 16
Passengers 3
C. PEDESTRIANS 32
D. BICYCLISTS 7
E. OTHER 1
TOTAL DEATHS: 133
12

CRASH COMPARISONby County
2018 2019 % CHANGE
NEW CASTLE COUNTYFatal Crashes 50 53 6%
Personal Injury Crashes 3089 3254 5%
Property Damage Crashes 14698 14412 -2%
Total Crashes 17837 17719 -1%
Fatalities 56 57 2%
Injuries 4827 5055 5%
KENT COUNTYFatal Crashes 24 23 -4%
Personal Injury Crashes 1021 985 -4%
Property Damage Crashes 3308 3527 7%
Total Crashes 4353 4535 4%
Fatalities 24 27 13%
Injuries 1579 1504 -5%
SUSSEX COUNTYFatal Crashes 30 47 57%
Personal Injury Crashes 1106 1253 13%
Property Damage Crashes 5537 5596 1%
Total Crashes 6673 6896 3%
Fatalities 30 49 63%
Injuries 1755 1951 11%
STATEWIDEFatal Crashes 104 123 18%
Personal Injury Crashes 5216 5492 5%
Property Damage Crashes 23543 23535 0%
Total Crashes 28863 29150 1%
Fatalities 110 133 21%
Injuries 8161 8510 4%
13

14
0
20
40
60
80
100
120
140
New Castle Kent Sussex Statewide
Fatal Crashes
2018 2019
+6%
-4%+57%
+18%
0
5000
10000
15000
20000
25000
30000
New Castle Kent Sussex Statewide
Total Crashes
2018 2019
-1%
+4%
+3%
+21%

Type of Crash
Type All Fatal Personal Property
of Crashes Crashes Injury Damage
Crash Crashes Crashes
Overturning 85 1 38 46
Other Non-Collision 315 0 41 274
Pedestrian 212 29 130 53
Pedalcyclist 68 5 44 19
Railway Train 7 0 2 5
Animal 1815 1 60 1754
Motor Vehicle in Transport 18881 52 3936 14893
Parked / Stopped Motor Vehicle 3541 5 537 2999
Other Non-fixed Object 250 1 17 232
Collision with Bridge, Ditch, 897 10 199 688
Curb, Embankment
Collision with Guardrail, 588 1 139 448
Median Barrier
Collision with Tree 307 12 90 205
Collision with Utility Pole, 477 4 75 398
Light Support, Mailbox
Other Fixed Object 807 2 130 675
Other 900 0 54 846
TOTALS: 29150 123 5492 23535
*2019 data - Based on first harmful event.
15

Contributing Circumstances
Contributing All Fatal Personal Property
Circumstances Crashes Crashes Injury Damage
Crashes Crashes
Speeding 191 9 54 128
Failed to yield r.o.w. 2651 9 833 1809
Passed stop sign 403 9 152 242
Disregard traffic signal 723 3 303 417
Wrong side or wrong way 114 1 45 68
Improper passing or lane 1643 5 179 1459
change
Followed too close 3554 0 626 2928
Made improper turn 474 2 101 371
Driving under influence 873 15 278 580
Driver inattention, 6887 19 1441 5427
distraction, or fatigue
Driving carelessly / recklessly 2358 8 520 1830
Driving aggressively 105 0 21 84
Other improper driving 819 3 82 734
Animal in roadway 1996 1 81 1914
Environmental - debris, 703 2 83 618
weather, glare, etc.
Pedestrian 164 27 101 36
Other / Unknown 5492 10 592 4890
TOTALS: 29150 123 5492 23535
r.o.w. = right of way *2019 data
16

Contributing Circumstancesfor
Intersection Related Crashes
Contributing All Fatal Personal Property
Circumstances Crashes Crashes Injury Damage
Crashes Crashes
Speeding 52 1 14 37
Failed to yield r.o.w. 1831 8 629 1194
Passed stop sign 370 9 144 217
Disregard traffic signal 667 3 280 384
Wrong side or wrong way 32 0 14 18
Improper passing or lane 383 1 50 332
change
Followed too close 1388 0 257 1131
Made improper turn 272 0 53 219
Driving under influence 235 1 86 148
Driver inattention, 2934 8 661 2265
distraction, or fatigue
Driving carelessly / recklessly 613 2 133 478
Driving aggressively 24 0 2 22
Other improper driving 164 1 19 144
Animal in roadway 46 0 3 43
Environmental - debris, 130 1 18 111
weather, glare, etc.
Pedestrian 50 4 36 10
Other / Unknown 1055 0 197 858
TOTALS: 10246 39 2596 7611
r.o.w. = right of way *2019 data
17
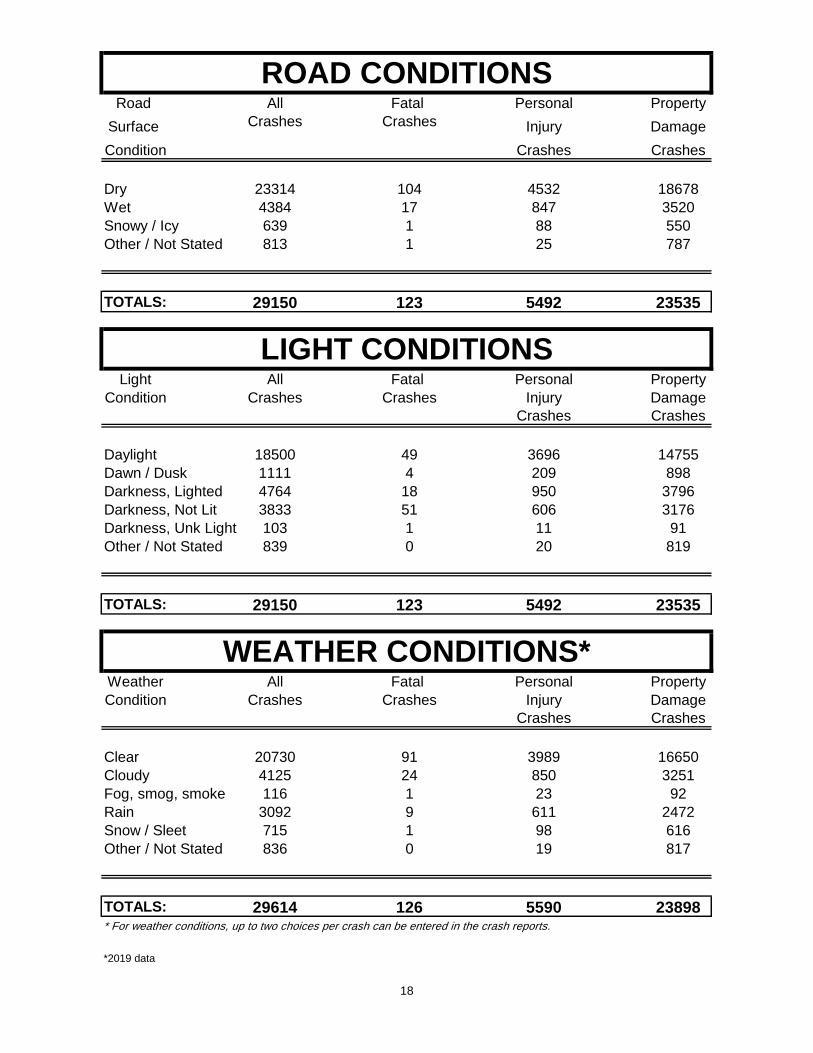
ROAD CONDITIONSRoad All Fatal Personal Property
Surface Crashes Crashes Injury Damage
Condition Crashes Crashes
Dry 23314 104 4532 18678
Wet 4384 17 847 3520
Snowy / Icy 639 1 88 550
Other / Not Stated 813 1 25 787
TOTALS: 29150 123 5492 23535
LIGHT CONDITIONSLight All Fatal Personal Property
Condition Crashes Crashes Injury Damage
Crashes Crashes
Daylight 18500 49 3696 14755
Dawn / Dusk 1111 4 209 898
Darkness, Lighted 4764 18 950 3796
Darkness, Not Lit 3833 51 606 3176
Darkness, Unk Light 103 1 11 91
Other / Not Stated 839 0 20 819
TOTALS: 29150 123 5492 23535
WEATHER CONDITIONS*Weather All Fatal Personal Property
Condition Crashes Crashes Injury Damage
Crashes Crashes
Clear 20730 91 3989 16650
Cloudy 4125 24 850 3251
Fog, smog, smoke 116 1 23 92
Rain 3092 9 611 2472
Snow / Sleet 715 1 98 616
Other / Not Stated 836 0 19 817
TOTALS: 29614 126 5590 23898* For weather conditions, up to two choices per crash can be entered in the crash reports.
*2019 data
18

DAY OF WEEK
All Crashes and Fatal Crashes
Day All Crashesof
Week 2018 2019 2018 2019
Monday 4116 4176 15 16
Tuesday 4169 4394 10 17
Wednesday 4279 4251 13 16
Thursday 4304 4272 8 19
Friday 4931 5048 28 17
Saturday 3875 3728 18 18
Sunday 3189 3281 12 20
TOTALS: 28863 29150 104 123
19
Fatal Crashes

20
0
1000
2000
3000
4000
5000
6000
Monday Tuesday Wednesday Thursday Friday Saturday Sunday
All Crashes by Day of Week
2018 2019
0
5
10
15
20
25
30
Monday Tuesday Wednesday Thursday Friday Saturday Sunday
Fatal Crashes by Day of Week
2018 2019

TIME OF DAY
All Crashes and Fatal Crashes
Time All Crashesof
Day 2018 2019 2018 2019
8 am - Noon 5289 5330 17 14
Noon - 4 pm 7302 7353 20 23
4 pm - 8 pm 7659 7916 16 26
8 pm - Midnight 3583 3679 26 35
Midnight - 4 am 1917 1769 14 17
4 am - 8 am 3113 3103 11 8
Not Stated 0 0 0 0
TOTALS: 28863 29150 104 123
21
Fatal Crashes

22
0
1000
2000
3000
4000
5000
6000
7000
8000
9000
8 a
m -
Noon
Noon -
4 p
m
4 p
m -
8 p
m
8 p
m -
Mid
nig
ht
Mid
nig
ht
- 4am
4 a
m -
8 a
m
All Crashes by Time of Day
2018 2019
0
5
10
15
20
25
30
35
40
8 a
m -
Noon
Noon -
4 p
m
4 p
m -
8 p
m
8 p
m -
Mid
nig
ht
Mid
nig
ht
- 4 a
m
4am
- 8
am
Fatal Crashes by Time of Day
2018 2019

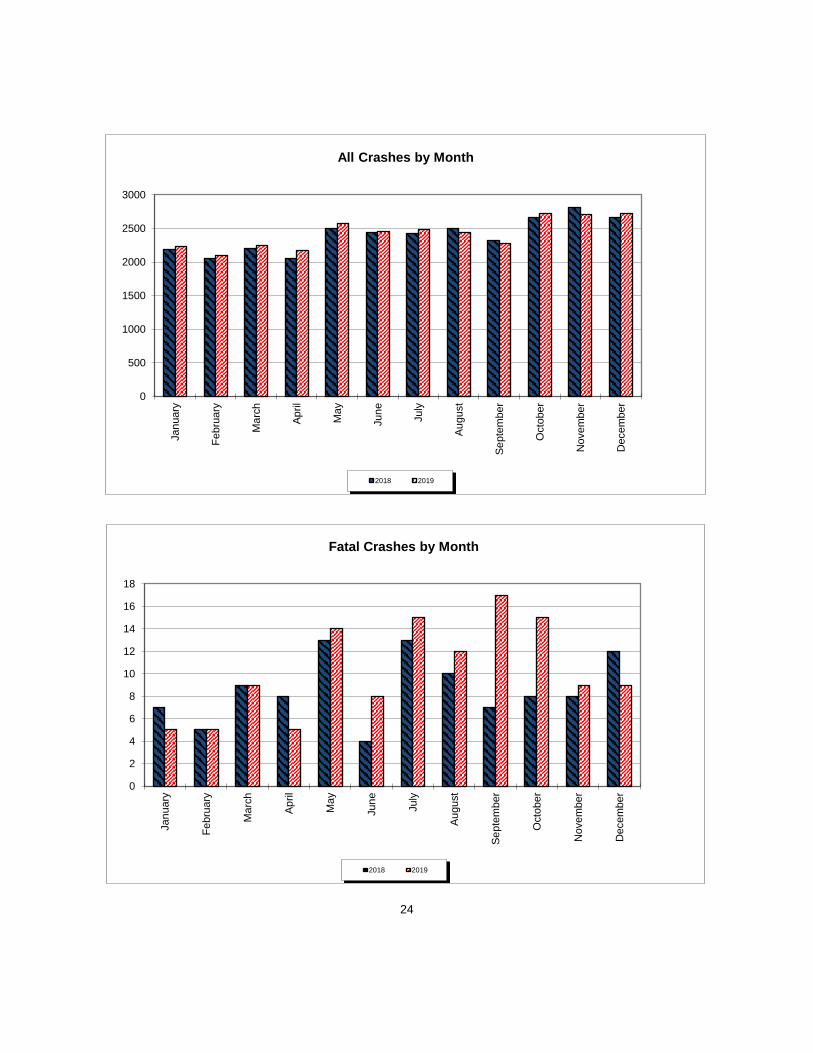
CRASHES BY MONTH
All Crashes and Fatal Crashes
All Crashes Fatal Crashes
Month 2018 2019 2018 2019
January 2192 2230 7 5
February 2060 2102 5 5
March 2209 2243 9 9
April 2062 2181 8 5
May 2508 2576 13 14
June 2435 2459 4 8
July 2425 2483 13 15
August 2500 2434 10 12
September 2315 2274 7 17
October 2668 2730 8 15
November 2816 2714 8 9
December 2673 2724 12 9
TOTALS: 28863 29150 104 123
23
24
0
500
1000
1500
2000
2500
3000
Jan
uary
Fe
bru
ary
Ma
rch
Ap
ril
Ma
y
Jun
e
July
Au
gust
Se
pte
mb
er
Octo
ber
Novem
ber
Decem
ber
All Crashes by Month
2018 2019
0
2
4
6
8
10
12
14
16
18
Jan
uary
Fe
bru
ary
Ma
rch
Ap
ril
Ma
y
Jun
e
July
Au
gust
Se
pte
mb
er
Octo
be
r
Novem
ber
Decem
ber
Fatal Crashes by Month
2018 2019

CONTRIBUTING POLICE AGENCIES
Police All Fatal Personal Property
Agency Crashes Crashes Injury Damage
Crashes Crashes
'18 '19 '18 '19 '18 '19 '18 '19
Delaware State 18896 18669 88 101 3158 3345 15650 15223
Police
Bethany Beach 36 60 0 0 5 9 31 51
Blades 10 5 0 0 1 0 9 5
Bridgeville 67 57 0 0 12 8 55 49
Camden 151 180 0 0 22 22 129 158
Clayton 8 44 0 0 4 7 4 37
Dagsboro 40 45 0 0 8 4 32 41
DE River & Bay 235 171 0 0 52 31 183 140
Authority
Delaware City 17 17 0 0 3 1 14 16
Delmar 42 38 1 0 5 9 36 29
Dewey Beach 32 29 0 0 2 4 30 25
Dover 1136 1375 6 5 369 353 761 1017
Elsmere 124 91 0 0 13 14 111 77
Felton 16 12 0 0 3 1 13 11
Fenwick 5 17 0 0 0 6 5 11
Frederica 6 1 0 0 1 0 5 1
Georgetown 482 484 0 1 72 65 410 418
Greenwood 19 20 0 1 0 3 19 16
Harrington 70 57 1 0 16 9 53 48
Laurel 110 88 0 0 30 16 80 72
25

CONTRIBUTING POLICE AGENCIES (cont.)
Police All Fatal Personal Property
Agency Crashes Crashes Injury Damage
Crashes Crashes
'18 '19 '18 '19 '18 '19 '18 '19
Lewes 47 50 0 0 6 4 41 46
Middletown 445 434 1 0 141 107 303 327
Milford 430 442 1 2 91 115 338 325
Millsboro 179 211 0 0 26 30 153 181
Milton 38 42 0 1 10 8 28 33
Newark 931 1037 1 2 238 266 692 769
New Castle City 129 161 0 0 31 43 98 118
New Castle Co. 1724 1728 1 2 279 303 1444 1423
Newport 89 101 0 0 15 19 74 82
Ocean View 44 54 1 0 7 13 36 41
Rehoboth Beach 66 85 0 0 8 12 58 73
Seaford 239 283 0 0 56 64 183 219
Selbyville 78 59 0 1 8 14 70 44
Smyrna 220 239 1 1 37 39 182 199
South Bethany 5 8 0 2 0 0 5 6
Wilmington 2604 2656 2 3 475 536 2127 2117
Wyoming 24 26 0 1 6 5 18 20
Other 69 74 0 0 6 7 63 67
TOTALS: 28863 29150 104 123 5216 5492 23543 23535
26
Vehicle /
Driver
Statistics
27

TYPE OF VEHICLE
Type All Fatal Personal Property
of Crashes Crashes Injury Damage
Vehicle Crashes Crashes
Passenger Car 27264 90 5644 21530
Pickup Truck 5481 20 1060 4401
Truck Tractor & Semi 780 7 143 630
Other Truck Combo, 1386 9 226 1151
or Commercial Van
Motorcycle 340 16 202 122
Bus 184 0 45 139
School Bus 214 1 35 178
Farm Tractor &/or 21 1 4 16
Farm Equipment
Sport Utility Vehicle 11951 41 2468 9442
Minivan / Passenger 2135 11 501 1623
Van
Other 156 2 26 128
Not Stated 4239 3 309 3927
TOTALS: 54151 201 10663 43287
* Shows number of vehicles, not number of crashes. * 2019 data
28

AGE OF DRIVER
Age All Fatal Personal Property
of Crashes Crashes Injury Damage
Driver Crashes Crashes
15 & Under 41 0 11 30
16 460 2 100 358
17 1042 3 217 822
18 1177 5 253 919
19 1100 3 242 855
20 1146 4 247 895
21 - 24 4529 25 963 3541
25 - 34 10335 30 2338 7967
35 - 44 7874 29 1751 6094
45 - 54 6738 28 1470 5240
55 - 64 6195 30 1359 4806
65 - 74 3525 21 778 2726
75 & Older 1908 18 485 1405
Not Stated 3611 2 169 3440
TOTALS: 49681 200 10383 39098
* Shows number of drivers, not number of crashes. * 2019 data
29

GENDER OF DRIVER
Gender All Fatal Personal Property
of Crashes Crashes Injury Damage
Driver Crashes Crashes
Male 26315 141 5509 20665
Female 20811 57 4784 15970
Not Stated 2555 2 90 2463
TOTALS: 49681 200 10383 39098
RESIDENCE OF DRIVER
Residence All Fatal Personal Property
Crashes Crashes Injury Damage
Crashes Crashes
Local Residence 36424 158 8006 28260
Non-Residence 9715 40 2208 7467
of Delaware
Not Stated 3542 2 169 3371
TOTALS: 49681 200 10383 39098
* Shows number of drivers, not number of crashes. * 2019 data
30
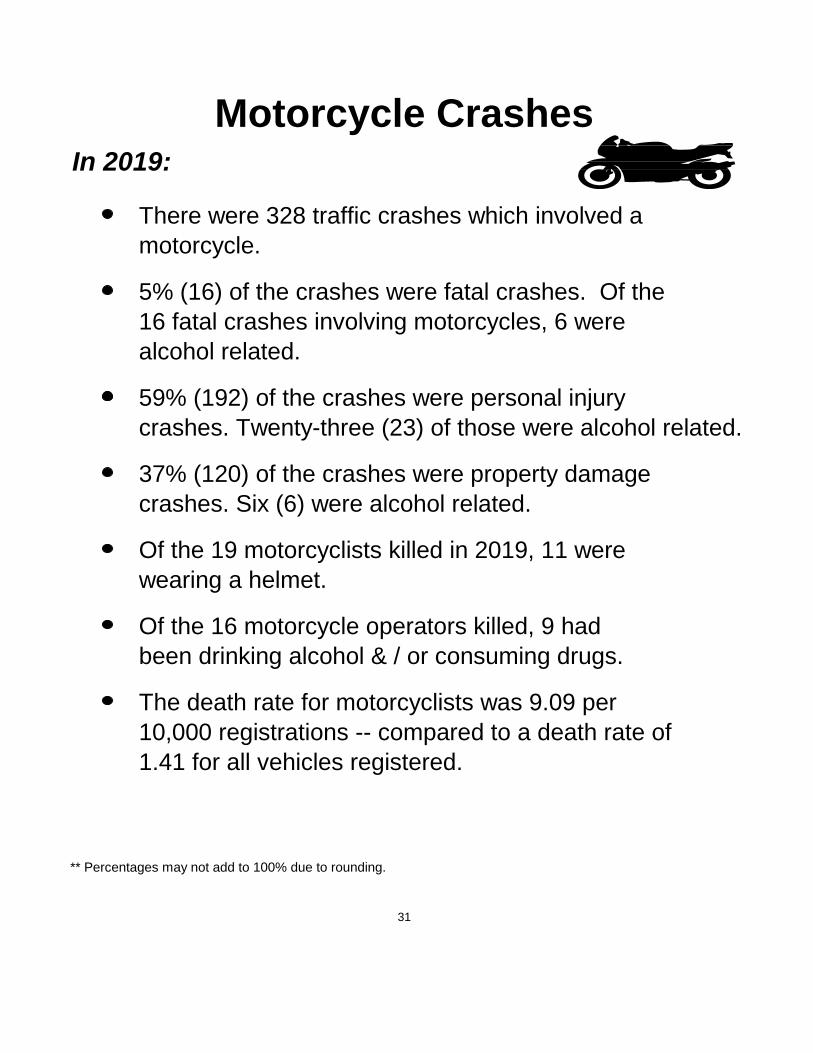
Motorcycle CrashesIn 2019:
There were 328 traffic crashes which involved a
motorcycle.
5% (16) of the crashes were fatal crashes. Of the
16 fatal crashes involving motorcycles, 6 were
alcohol related.
59% (192) of the crashes were personal injury
crashes. Twenty-three (23) of those were alcohol related.
37% (120) of the crashes were property damage
crashes. Six (6) were alcohol related.
Of the 19 motorcyclists killed in 2019, 11 were
wearing a helmet.
Of the 16 motorcycle operators killed, 9 had
been drinking alcohol & / or consuming drugs.
The death rate for motorcyclists was 9.09 per
10,000 registrations -- compared to a death rate of
1.41 for all vehicles registered.
** Percentages may not add to 100% due to rounding.
31

MOTORCYCLE CRASHES2003 - 2019
Year Reg. All Fatal Personal Motor- Number Motor- Number
Motor- Crashes Crashes Injury cyclists Killed Wearing cyclists Injured Wearing
cycles Crashes Killed Helmets Injured Helmets
2003 15,318 277 12 196 12 7 197 96
2004 17,238 214 10 139 10 5 167 83
2005 19,063 295 25 212 21 12 204 129
2006 21,246 348 14 274 12 4 254 158
2007 23,066 426 16 335 17 6 336 230
2008 24,660 368 16 273 16 7 286 178
2009 24,526 312 14 246 14 5 255 151
2010 24,498 358 9 282 9 6 305 192
2011 24,627 353 17 243 18 8 264 173
2012 24,332 353 17 247 17 12 257 169
2013 23,526 331 21 217 20 13 231 165
2014 22,816 377 13 266 15 8 287 163
2015 22,888 374 20 238 20 14 252 156
2016 22,425 327 14 201 14 10 229 159
2017* 22,115 354 11 230 10 5 249 154
2018 21,071 272 16 175 16 7 187 121
2019 20,903 328 16 192 19 11 213 127
* In 2017, one of the fatal crashes did not result in a motorcyclist's death. A pedestrian was killed in that crash.
32
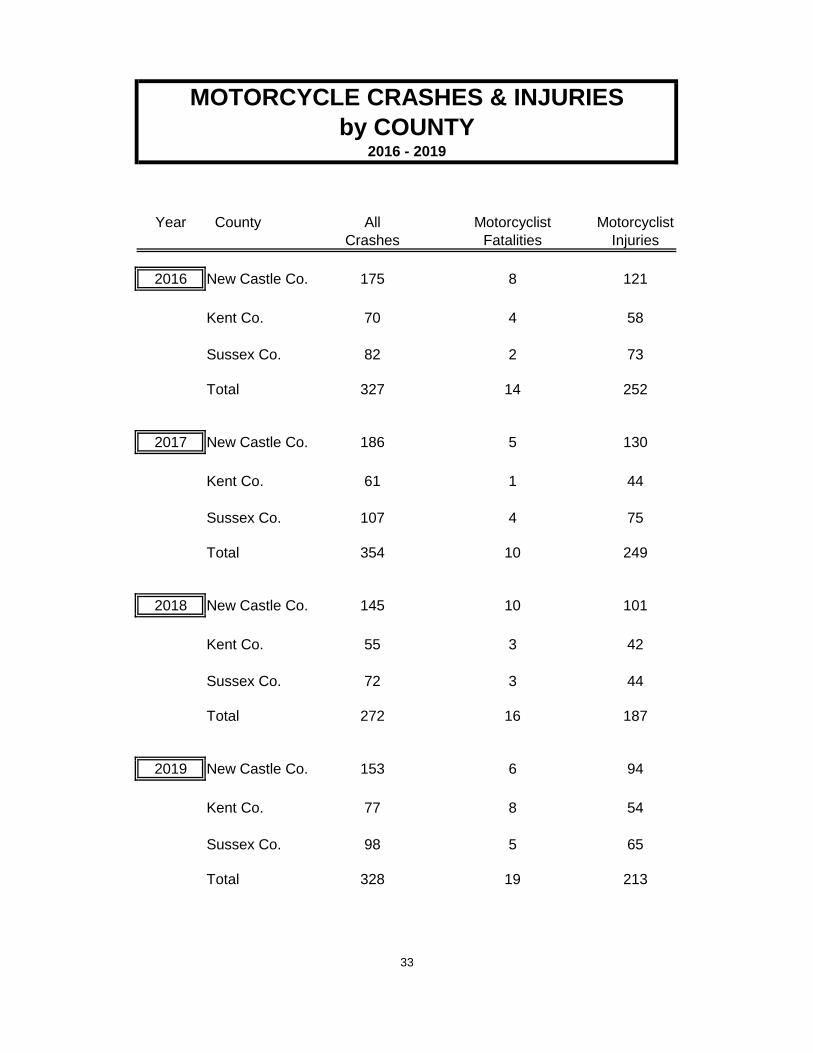
MOTORCYCLE CRASHES & INJURIES
by COUNTY2016 - 2019
Year County All Motorcyclist Motorcyclist
Crashes Fatalities Injuries
2016 New Castle Co. 175 8 121
Kent Co. 70 4 58
Sussex Co. 82 2 73
Total 327 14 252
2017 New Castle Co. 186 5 130
Kent Co. 61 1 44
Sussex Co. 107 4 75
Total 354 10 249
2018 New Castle Co. 145 10 101
Kent Co. 55 3 42
Sussex Co. 72 3 44
Total 272 16 187
2019 New Castle Co. 153 6 94
Kent Co. 77 8 54
Sussex Co. 98 5 65
Total 328 19 213
33

Motorcycle CrashesBAC Information of Motorcycle Operators
Of the 146 motorcycle operators* involved
in fatal crashes in the last 10 years:
*Motorcycle operators were not necessarily the fatality.
** Had been drinking, impairment level unknown. Data for years 2010 through 2019
34
14
6
11
17
7
10
0
81 No Alcohol or Drugs
BAC of .16 - .20
BAC Unknown**
BAC of .01 - .09
BAC of .10 - .15
BAC of .21 - .25
BAC of .26 or Greater
Drugs Only

Bicycle Crashes
In 2019:
There were 148 traffic crashes which involved at
least one bicyclist in the collision.
Seven of the bicycle involved crashes were fatal.
68% (101) of the crashes were personal injury.
27% (40) of the crashes were property damage
only crashes.
Half (49.6%) of the bicyclists injured were younger
than 25 years old. However, all of the bicyclists
killed were older than 25 years old.
The number of bicyclist crashes by county:
Total Crashes Fatal Crashes
New Castle County 70 2
Kent County 18 1
Sussex County 60 4
** Percentages may not add to 100% due to rounding.
35

BICYCLISTS KILLED & INJURED BICYCLISTS KILLED & INJURED
by AGE by COUNTY2017 - 2019
Age of 2017 2018 2019
Bicyclist Killed Injured Killed Injured Killed Injured
0 - 4 0 1 0 0 0 0
5 - 9 0 10 0 6 0 5
10 - 14 0 10 0 6 0 13
15 - 19 0 19 1 14 0 20
20 - 24 0 19 0 16 0 18
25 - 34 0 9 2 14 1 9
35 - 44 0 9 1 9 1 11
45 - 54 1 9 0 9 1 16
55 - 64 1 14 1 18 2 12
65 - 74 1 4 0 10 0 8
75 & Older 1 3 1 0 2 1
Not Stated 0 0 0 0 0 0
TOTALS: 4 107 6 102 7 113
* Includes all bicyclists injured regardless of classification of crash.
36

BICYCLISTS KILLED & INJURED
by COUNTY2019
Age of New Castle Co. Kent Co. Sussex Co.
Bicyclist Killed Injured Killed Injured Killed Injured
0 - 4 0 0 0 0 0 0
5 - 9 0 3 0 0 0 2
10 - 14 0 10 0 2 0 1
15 - 19 0 11 0 2 0 7
20 - 24 0 4 0 1 0 13
25 - 34 0 4 0 1 1 4
35 - 44 1 7 0 2 0 2
45 - 54 1 9 0 1 0 6
55 - 64 0 7 1 0 1 5
65 - 74 0 3 0 0 0 5
75 & Older 0 1 0 0 2 0
Not Stated 0 0 0 0 0 0
TOTALS: 2 59 1 9 4 45
* Includes all bicyclists injured regardless of classification of crash.
37

Truck Crashes
In 2019:
There were 2,083 traffic crashes which involved
a truck tractor and semi-trailer, other truck
combination, and / or commercially used van.
15 (<1%) of the crashes were fatal crashes.
354 (17%) of the crashes were personal
injury crashes.
1,714 (82%) of the crashes were property
damage crashes.
A total of 16 people were killed in traffic
crashes involving a truck in 2019 -- 12 were
killed in 2018.
In 2019, 539 persons were injured in truck
crashes -- 548 were injured in 2018.
Of the 2,060 truck drivers involved in these
crashes, 18 of them had consumed
alcohol and / or drugs.
38

CRASHES INVOLVING TRUCKS CRASHES INVOLVING TRUCKS
ALL CRASHES and FATAL CRASHES ALL CRASHES and FATAL CRASHES
by by
DAY OF WEEK TIME OF DAY
Day All Crashes Fatal Crashes
of
Week 2018 2019 2018 2019
Monday 316 397 4 3
Tuesday 399 378 1 5
Wednesday 359 339 1 0
Thursday 387 362 2 1
Friday 424 375 3 2
Saturday 143 139 1 2
Sunday 89 93 0 2
TOTALS: 2117 2083 12 15
NOTE: Truck crashes involve a truck tractor and semi-trailer, other truck combination,
and / or commercially used van.
39
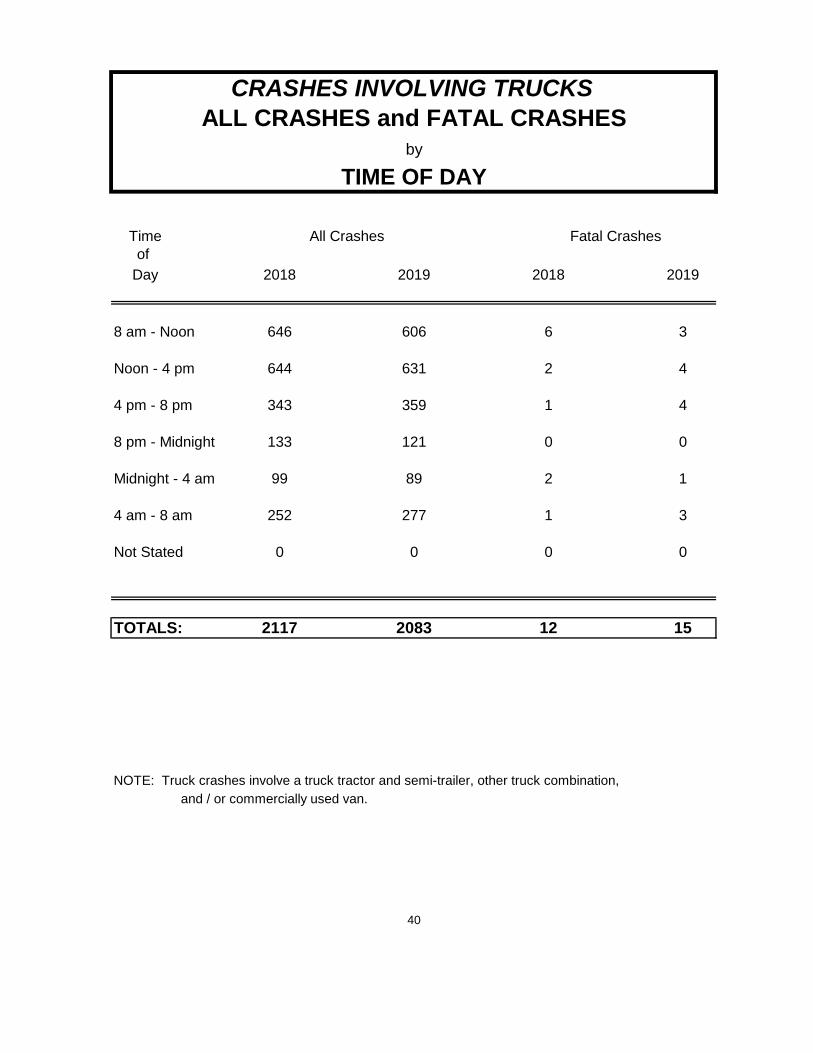
CRASHES INVOLVING TRUCKS TRUCK DRIVERS INVOLVED IN CRASHES
ALL CRASHES and FATAL CRASHES by
by AGE
TIME OF DAY
Time All Crashes Fatal Crashes
of
Day 2018 2019 2018 2019
8 am - Noon 646 606 6 3
Noon - 4 pm 644 631 2 4
4 pm - 8 pm 343 359 1 4
8 pm - Midnight 133 121 0 0
Midnight - 4 am 99 89 2 1
4 am - 8 am 252 277 1 3
Not Stated 0 0 0 0
TOTALS: 2117 2083 12 15
NOTE: Truck crashes involve a truck tractor and semi-trailer, other truck combination,
and / or commercially used van.
40

TRUCK DRIVERS INVOLVED IN CRASHESby
AGE
Age 2016 2017 2018 2019
15 & Under 0 0 1 0
16 - 20 27 24 25 28
21 - 25 120 147 134 167
26 - 30 180 219 207 218
31 - 35 185 209 223 207
36 - 45 380 467 428 427
46 - 55 490 484 515 473
56 - 65 319 344 385 371
66 - 75 78 74 84 71
76 & Older 21 13 15 18
Unknown Age / 74 68 83 80
Parked Vehicle
TOTALS: 1874 2049 2100 2060
NOTE: Truck crashes involve a truck tractor and semi-trailer, other truck combination,
and / or commercially used van.
Shows number of drivers, not number of crashes.
41

School Bus Crashes
In 2019:
There were 199 traffic crashes which involved
a school bus.
One of the school bus crashes was fatal.
17% (33) of the crashes were personal injury crashes.
83% (165) of the crashes were property damage only
crashes.
There were 55 persons injured in school bus
crashes. Of those, 32 of the persons injured were
occupants of the school bus.
In the one fatal school bus involved crash, an occupant
of the other vehicle was killed.
42

SCHOOL BUS CRASHES
by COUNTY2016-2019
Year County All Fatal Pers. Inj. Prop. Dam.
Crashes Crashes Crashes Crashes
2016 New Castle Co. 136 0 32 104
Kent Co. 25 0 5 20
Sussex Co. 27 0 8 19
Total 188 0 45 143
2017 New Castle Co. 146 1 26 119
Kent Co. 34 0 13 21
Sussex Co. 41 0 7 34
Total 221 1 46 174
2018 New Castle Co. 154 0 24 130
Kent Co. 25 0 7 18
Sussex Co. 30 1 3 26
Total 209 1 34 174
2019 New Castle Co. 137 1 21 115
Kent Co. 26 0 5 21
Sussex Co. 36 0 7 29
Total 199 1 33 165
43

Pedestrian Crashes
In 2019:
There were 387 traffic crashes which involved
at least one pedestrian.
6% (32) of the crashes were fatal crashes.
63% (243) of the crashes were personal injury crashes.
29% (112) of the crashes involving a pedestrian were
property damage only.
Of the 32 pedestrians killed in 2019, 20 were under
the influence of alcohol and / or drugs.
The number of pedestrian crashes by county:
Total Crashes Fatal Crashes
New Castle County 288 21
Kent County 44 5
Sussex County 55 6
** Percentages may not add to 100% due to rounding.
44

PEDESTRIANS KILLED & INJURED PEDESTRIANS KILLED & INJURED
by AGE by COUNTY2017 - 2019
Age of 2017 2018 2019
Pedestrian Killed Injured Killed Injured Killed Injured
0 - 4 0 8 2 7 1 13
5 - 9 0 21 0 20 0 14
10 - 14 0 25 0 18 0 20
15 - 19 0 21 0 44 0 29
20 - 24 2 39 3 41 2 45
25 - 34 6 54 6 44 8 63
35 - 44 3 37 6 36 3 46
45 - 54 14 41 1 27 7 32
55 - 64 5 24 3 35 7 26
65 - 74 3 15 1 11 2 18
75 & Older 2 5 2 4 2 3
Not Stated 0 0 0 1 0 1
TOTALS: 35 290 24 288 32 310
* Includes all pedestrians injured regardless of classification of crash.
45

PEDESTRIANS KILLED & INJURED
by COUNTY2019
Age of New Castle Co. Kent Co. Sussex Co.
Pedestrian Killed Injured Killed Injured Killed Injured
0 - 4 1 10 0 1 0 2
5 - 9 0 14 0 0 0 0
10 - 14 0 15 0 3 0 2
15 - 19 0 23 0 3 0 3
20 - 24 2 33 0 6 0 6
25 - 34 5 48 1 7 2 8
35 - 44 1 29 0 7 2 10
45 - 54 6 24 1 3 0 5
55 - 64 4 23 1 1 2 2
65 - 74 1 11 1 1 0 6
75 & Older 1 1 1 0 0 2
Not Stated 0 0 0 1 0 0
TOTALS: 21 231 5 33 6 46
* Includes all pedestrians injured regardless of classification of crash.
46

Pedestrian CrashesBAC Information of Pedestrians Killed
Of the 32 pedestrians
killed in 2019:
32
63% of the pedestrians killed
were under the influence
of drugs &/or alcohol.
47
3
1
2
3
1
6
4
12
No Drugs or Alcohol
BAC of .16 - .20
BAC of .26 and Higher
BAC .06 - .10
Drugs Only
BAC of .21 - .25
BAC of .11 - .15
BAC .01 - .05

Other
Special
Topics
48

WATCH OUT!!!Dangerous Times
To be on the Road
in Delaware
Most Dangerous Day: Most Dangerous Time:
Friday Midnight - 4 am
53% of the Fatal Crashes 82% of the Fatal Crashes
were ALCOHOL RELATED! were ALCOHOL RELATED!
Worst Day and Time to be on the Road:
Weekends
later evening to
early morning hours
(8 pm to 4 am)
73% of the Fatal Crashes
were ALCOHOL RELATED!
(Based on 2019 Data)
49

MAJOR HOLIDAY PERIODS
CRASH STATISTICS
2015-2019
Actual Number All Fatal Personal
Holiday of Crashes Crashes Injury Persons Persons
Hours Crashes Killed Injured
NEW YEARS
'15 - '16 Friday 96 210 0 47 0 77
'16 - '17 Sunday 48 98 0 22 0 36
'17 - '18 Monday 96 268 0 50 0 73
'18 - '19 Tuesday** 48 135 0 12 0 29
'19 - '20 Wednesday** 48 119 2 24 2 33
MEMORIAL DAY
2015 Monday 96 249 0 66 0 106
2016 Monday 96 305 2 58 2 97
2017 Monday 96 288 0 49 0 73
2018 Monday 96 324 2 48 2 81
2019 Monday 96 332 4 69 5 96
FOURTH OF JULY
2015 Saturday 72 154 1 37 1 83
2016 Monday 96 276 3 69 3 109
2017 Tuesday 120 427 3 71 3 106
2018 Wednesday** 48 149 1 29 1 38
2019 Thursday 120 385 3 64 3 97
LABOR DAY
2015 Monday 96 225 2 51 2 77
2016 Monday 96 244 3 47 3 75
2017 Monday 96 295 2 51 2 98
2018 Monday 96 295 0 40 0 62
2019 Monday 96 300 2 75 3 115
THANKSGIVING
2015 Thursday 120 319 2 55 2 92
2016 Thursday 120 309 1 67 1 98
2017 Thursday 120 367 1 62 1 90
2018 Thursday 120 383 1 74 1 123
2019 Thursday 120 369 1 62 1 98
CHRISTMAS
2015 Friday 96 276 1 52 1 71
2016 Sunday 96 231 1 28 1 44
2017 Monday 96 242 0 40 0 62
2018 Tuesday** 72 167 1 28 1 54
2019 Wednesday** 72 186 1 35 1 61
NOTE: The number of crashes and injuries is influenced by the length of the Holiday weekend.
** - This holiday period does not include the weekend.
50

SEAT BELT STUDY
Based on those persons who
were injured on Delaware Roads
Seat Belt Usage of Injured Persons*
County % of Persons who
used a Seat Belt
'17 '18 '19
New Castle - - - - - - - - - 86% 87% 87%
Kent County - - - - - - - - - 88% 92% 89%
Sussex County - - - - - - - - - 89% 88% 87%
Statewide - - - - - - - - - 87% 88% 87%
* Includes Fatalities
Severity of Injury in 2019
Of the persons who were not wearing their seat belts,
1 out of 4 (23.9%) received a serious injury.
Of the persons who were wearing their seat belts, only
1 out of 29 (3.5%) received a serious injury.
In 2019, the occurrence of a serious injury was reduced
by 22% when the person was wearing an occupant restraint.
A Serious Injury: An injury that results in death; or one that causes lacerations,
broken or distorted limbs, skull, chest or abdominal injuries.
51
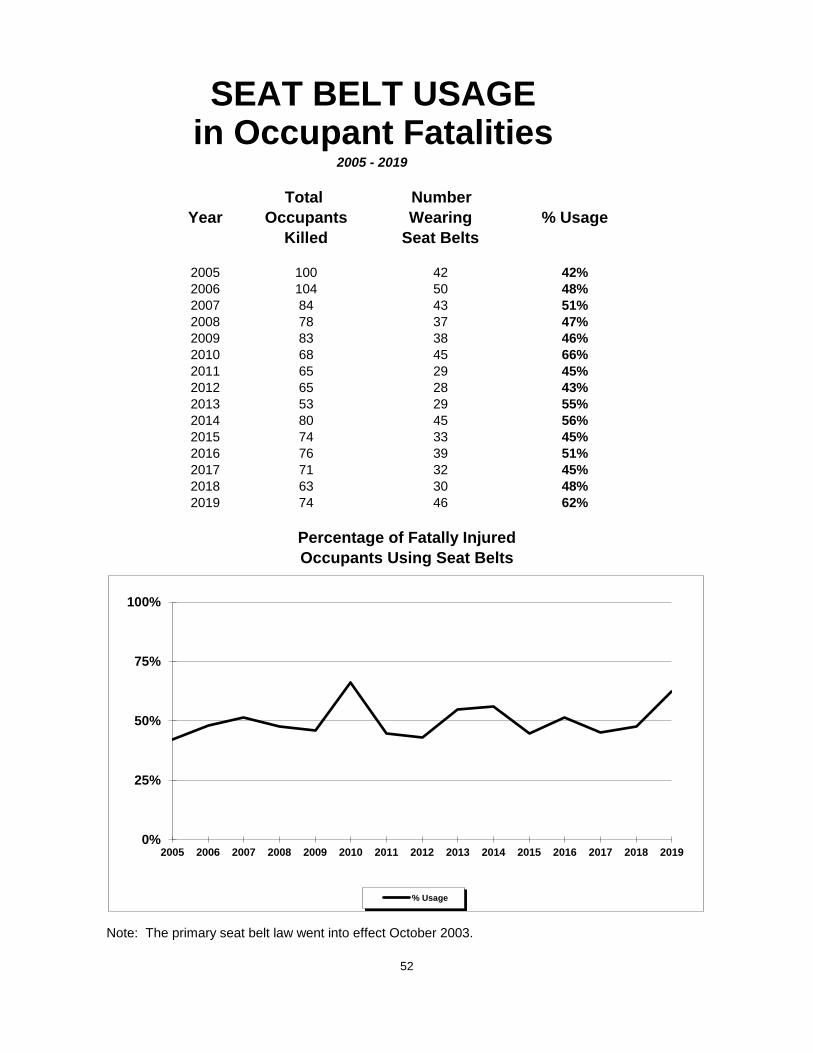
SEAT BELT USAGEin Occupant Fatalities
2005 - 2019
Total Number
Year Occupants Wearing % Usage
Killed Seat Belts
2005 100 42 42%
2006 104 50 48%
2007 84 43 51%
2008 78 37 47%
2009 83 38 46%
2010 68 45 66%
2011 65 29 45%
2012 65 28 43%
2013 53 29 55%
2014 80 45 56%
2015 74 33 45%
2016 76 39 51%
2017 71 32 45%
2018 63 30 48%
2019 74 46 62%
Percentage of Fatally Injured
Occupants Using Seat Belts
Note: The primary seat belt law went into effect October 2003.
52
0%
25%
50%
75%
100%
2005 2006 2007 2008 2009 2010 2011 2012 2013 2014 2015 2016 2017 2018 2019
% Usage

SEAT BELT USAGEin Occupant Injuries
2005 - 2019
Total Number
Year Occupants Wearing % Usage
Injured Seat Belts
2005 7817 6683 85%
2006 7449 6347 85%
2007 6779 5864 87%
2008 6450 5577 86%
2009 6525 5682 87%
2010 7127 6180 87%
2011 6856 6027 88%
2012 6888 5994 87%
2013 7065 6016 85%
2014 6754 5908 87%
2015 7339 6522 89%
2016 7800 6825 88%
2017 7657 6726 88%
2018 7555 6673 88%
2019 7833 6851 87%
Percentage of Injured
Occupants Using Seat Belts
Note: The primary seat belt law went into effect October 2003.
53
0%
25%
50%
75%
100%
2005 2006 2007 2008 2009 2010 2011 2012 2013 2014 2015 2016 2017 2018 2019
% Usage
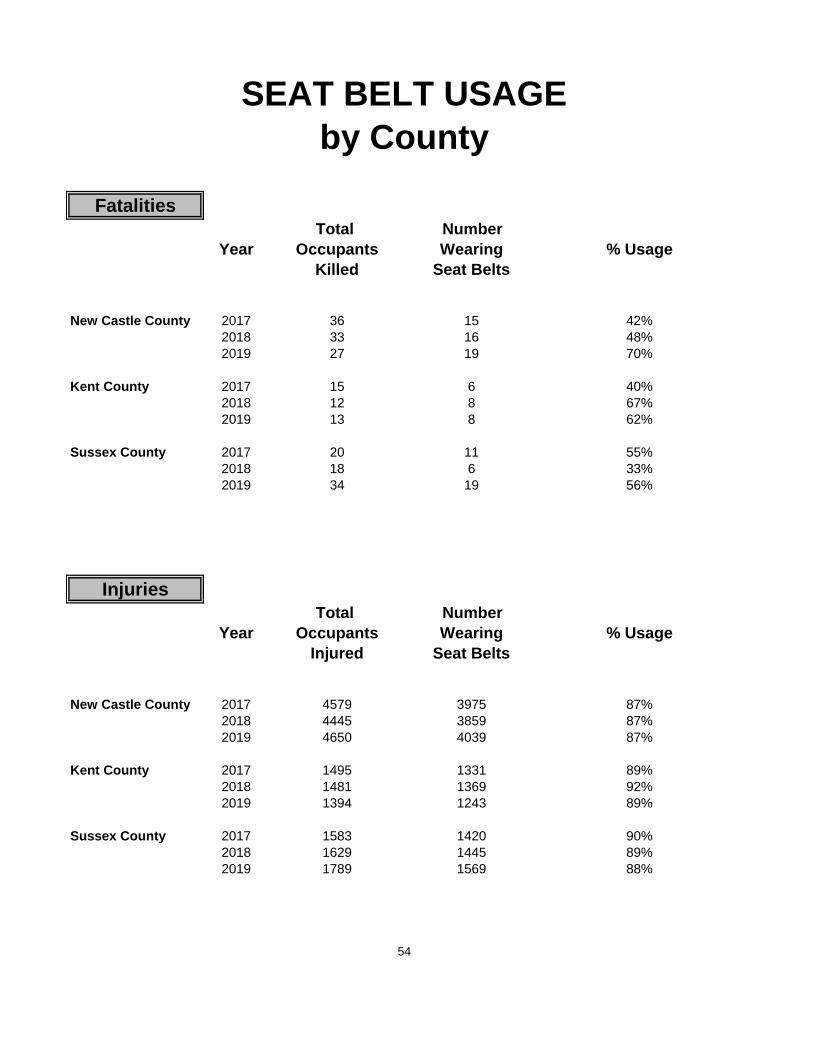
SEAT BELT USAGE
by County
Fatalities
Total Number
Year Occupants Wearing % Usage
Killed Seat Belts
New Castle County 2017 36 15 42%
2018 33 16 48%
2019 27 19 70%
Kent County 2017 15 6 40%
2018 12 8 67%
2019 13 8 62%
Sussex County 2017 20 11 55%
2018 18 6 33%
2019 34 19 56%
Injuries
Total Number
Year Occupants Wearing % Usage
Injured Seat Belts
New Castle County 2017 4579 3975 87%
2018 4445 3859 87%
2019 4650 4039 87%
Kent County 2017 1495 1331 89%
2018 1481 1369 92%
2019 1394 1243 89%
Sussex County 2017 1583 1420 90%
2018 1629 1445 89%
2019 1789 1569 88%
54

SEAT BELT USAGE SEAT BELT USAGEfor Occupant Fatalities for Occupant Injuries
by Age by Age
2018 2019
Total Number Number Number Total Number Number Number
Age of Occupants Using Not Using Unknown Occupants Using Not Using Unknown
Occupant Killed Restraint Restraint Restraint Killed Restraint Restraint Restraint
0 - 4 0 0 0 0 0 0 0 0
5 - 9 2 1 0 1 2 1 1 0
10 - 14 2 0 2 0 1 1 0 0
15 - 19 6 2 4 0 4 3 1 0
20 - 24 5 2 3 0 10 1 9 0
25 - 34 10 5 5 0 7 3 4 0
35 - 44 4 0 4 0 9 7 2 0
45 - 54 9 4 5 0 5 3 2 0
55 - 64 9 5 4 0 10 5 4 1
65 - 74 7 3 4 0 11 9 0 2
75 & Older 9 8 1 0 15 13 2 0
Not Stated 0 0 0 0 0 0 0 0
TOTALS: 63 30 32 1 74 46 25 3
Unknown restraint use includes those vehicles not equipped with restraints.
55

SEAT BELT USAGEfor Occupant Injuries
by Age
2018 2019
Total Number Number Number Total Number Number Number
Age of Occupants Using Not Using Unknown Occupants Using Not Using Unknown
Occupant Injured Restraint Restraint Restraint Injured Restraint Restraint Restraint
0 - 4 172 162 4 6 158 147 3 8
5 - 9 206 184 6 16 179 148 6 25
10 - 14 237 203 7 27 213 190 3 20
15 - 19 761 662 38 61 800 695 29 76
20 - 24 882 765 35 82 905 769 40 96
25 - 34 1564 1350 58 156 1560 1330 73 157
35 - 44 1087 952 26 109 1190 1029 28 133
45 - 54 957 847 30 80 982 884 16 82
55 - 64 852 775 13 64 928 821 15 92
65 - 74 502 471 4 27 550 506 9 35
75 & Older 330 301 5 24 367 331 9 27
Not Stated 5 1 0 4 1 1 0 0
TOTALS: 7555 6673 226 656 7833 6851 231 751
Unknown restraint use includes those vehicles not equipped with restraints.
56

Alcohol Involvement
in
Traffic Crashes
Definition:
A crash is considered alcohol related if at least one driver or non-motorist involved in the
crash has consumed alcohol -- regardless of the level of blood alcohol concentration.
57

ALCOHOL INVOLVEMENTin
TRAFFIC CRASHES
Total Alcohol % of
Crashes Related Total
Crashes
Fatals2015 129 60 47%
2016 116 46 40%
2017 114 42 37%
2018 104 37 36%
2019 123 43 35%
Personal Injury2015 5253 374 7%
2016 5551 349 6%
2017 5427 341 6%
2018 5216 313 6%
2019 5492 336 6%
Property Damage2015 18684 699 6%
2016 20791 689 6%
2017 22539 660 5%
2018 23543 706 5%
2019 23535 715 3%
All Crashes2015 24066 1133 5%
2016 26458 1084 4%
2017 28080 1043 4%
2018 28863 1056 4%
2019 29150 1094 4%
58

59
0%
25%
50%
75%
100%
2015 2016 2017 2018 2019
Percentage of Fatal Crashes that were Alcohol Related
0%
25%
50%
75%
100%
2015 2016 2017 2018 2019
Percentage of Total Crashes that were Alcohol Related
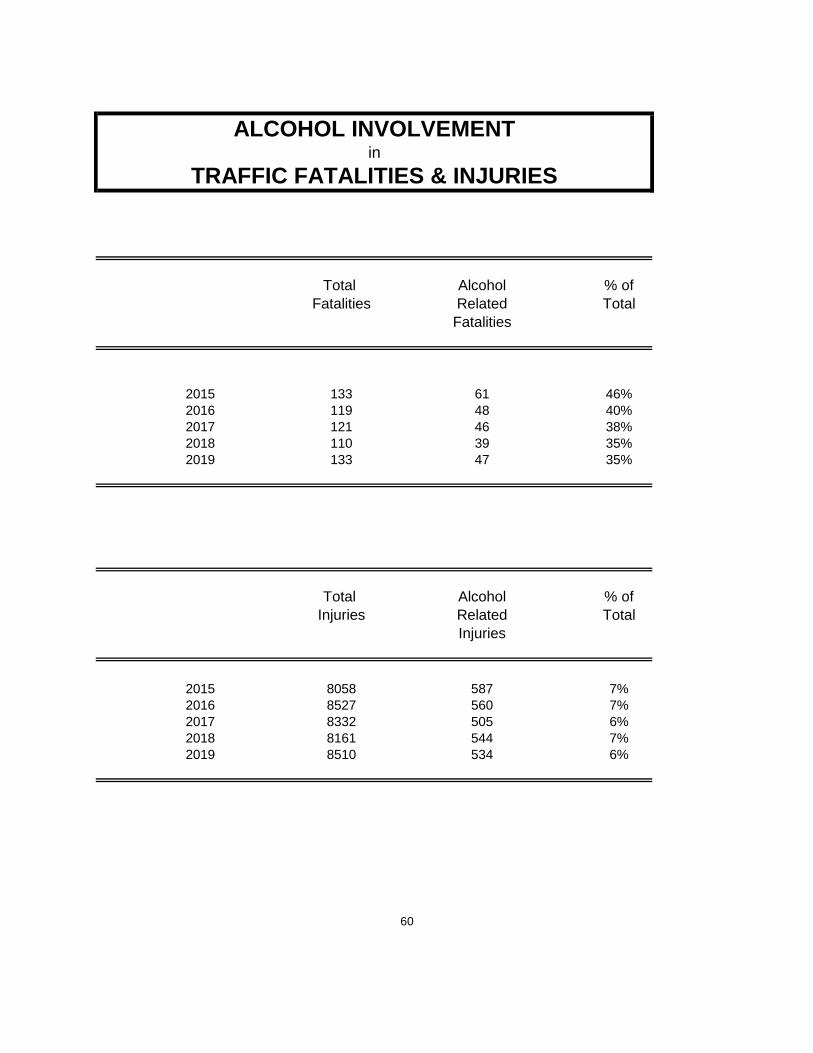
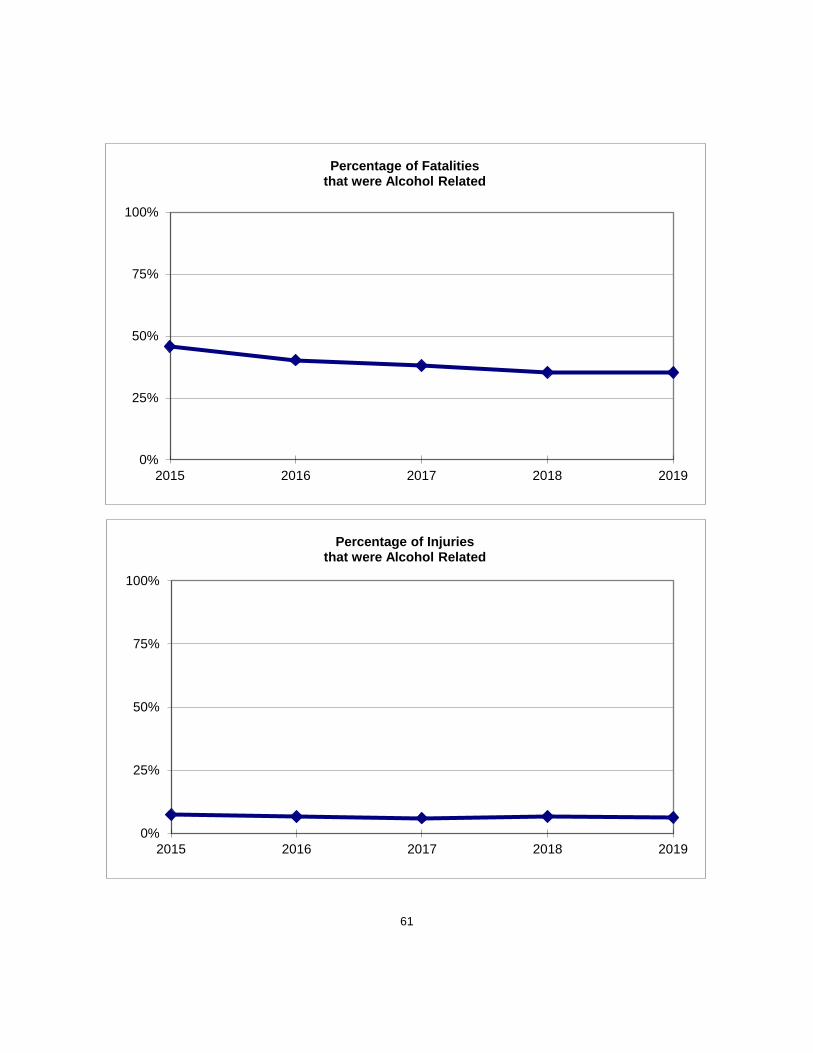
ALCOHOL INVOLVEMENTin
TRAFFIC FATALITIES & INJURIES
Total Alcohol % of
Fatalities Related Total
Fatalities
2015 133 61 46%
2016 119 48 40%
2017 121 46 38%
2018 110 39 35%
2019 133 47 35%
Total Alcohol % of
Injuries Related Total
Injuries
2015 8058 587 7%
2016 8527 560 7%
2017 8332 505 6%
2018 8161 544 7%
2019 8510 534 6%
60
61
0%
25%
50%
75%
100%
2015 2016 2017 2018 2019
Percentage of Fatalities that were Alcohol Related
0%
25%
50%
75%
100%
2015 2016 2017 2018 2019
Percentage of Injuries that were Alcohol Related
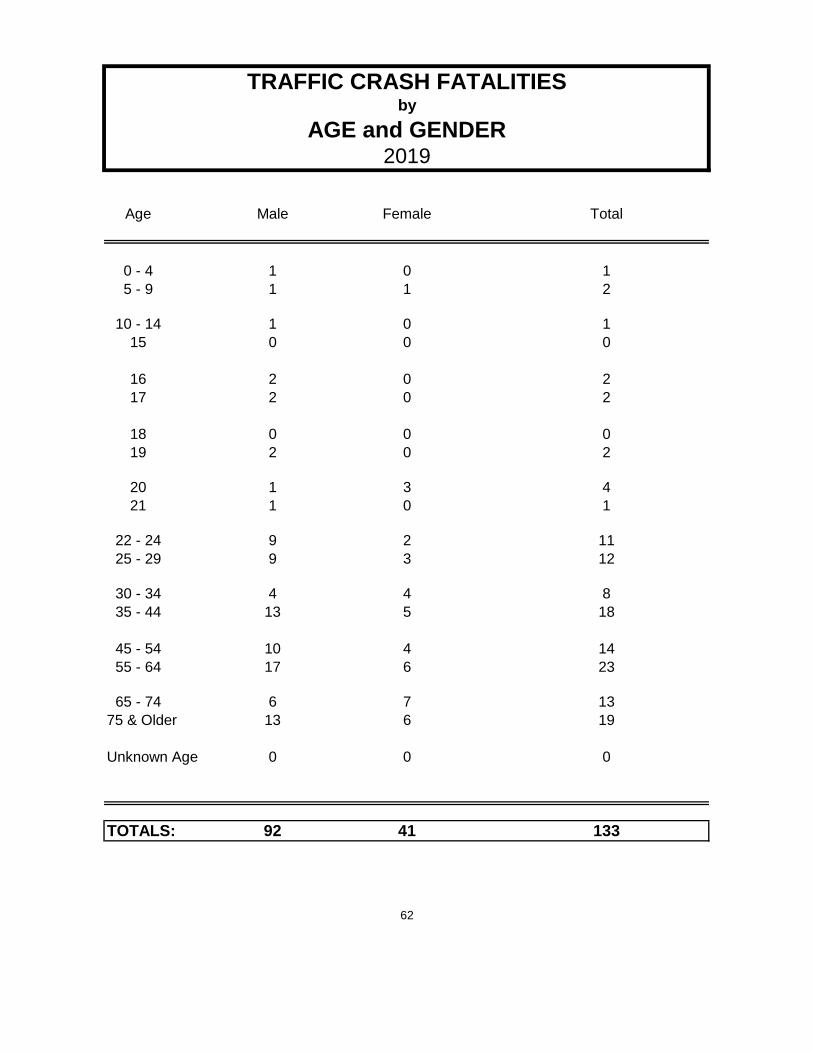
TRAFFIC CRASH FATALITIESby
AGE and GENDER2019
Age Male Female Total
0 - 4 1 0 1
5 - 9 1 1 2
10 - 14 1 0 1
15 0 0 0
16 2 0 2
17 2 0 2
18 0 0 0
19 2 0 2
20 1 3 4
21 1 0 1
22 - 24 9 2 11
25 - 29 9 3 12
30 - 34 4 4 8
35 - 44 13 5 18
45 - 54 10 4 14
55 - 64 17 6 23
65 - 74 6 7 13
75 & Older 13 6 19
Unknown Age 0 0 0
TOTALS: 92 41 133
62

ALCOHOL RELATED
TRAFFIC CRASH FATALITIESby
AGE and GENDER2019
Age Male Female Total
0 - 4 0 0 0
5 - 9 0 0 0
10 - 14 0 0 0
15 0 0 0
16 0 0 0
17 0 0 0
18 0 0 0
19 0 0 0
20 1 1 2
21 0 0 0
22 - 24 4 0 4
25 - 29 6 3 9
30 - 34 3 1 4
35 - 44 5 3 8
45 - 54 5 2 7
55 - 64 9 2 11
65 - 74 1 1 2
75 & Older 0 0 0
Unknown Age 0 0 0
TOTALS: 34 13 47
63

TRAFFIC CRASH INJURIESby
AGE and GENDER2019
Age Male Female Unk. Gender Total
0 - 4 80 90 1 171
5 - 9 101 101 0 202
10 - 14 95 152 0 247
15 35 44 0 79
16 46 84 0 130
17 83 128 0 211
18 105 128 0 233
19 89 129 0 218
20 95 106 0 201
21 96 113 0 209
22 - 24 238 348 0 586
25 - 29 382 545 0 927
30 - 34 336 417 0 753
35 - 44 579 707 2 1288
45 - 54 500 583 1 1084
55 - 64 463 542 0 1005
65 - 74 245 347 0 592
75 & Older 165 207 0 372
Unknown Age 2 0 0 2
TOTALS: 3735 4771 4 8510
64

ALCOHOL RELATED
TRAFFIC CRASH INJURIESby
AGE and GENDER2019
Age Male Female Unk. Sex Total
0 - 4 2 3 0 5
5 - 9 3 1 0 4
10 - 14 3 4 0 7
15 0 0 0 0
16 0 2 0 2
17 3 2 0 5
18 6 1 0 7
19 4 7 0 11
20 7 5 0 12
21 9 4 0 13
22 - 24 29 17 0 46
25 - 29 60 35 0 95
30 - 34 31 27 0 58
35 - 44 64 33 1 98
45 - 54 41 32 0 73
55 - 64 40 24 0 64
65 - 74 10 12 0 22
75 & Older 6 6 0 12
Unknown Age 0 0 0 0
TOTALS: 318 215 1 534
65

DRIVERS KILLED*by
AGE and GENDER2019
Age Male Female Total
15 & Under 0 0 0
16 0 0 0
17 1 0 1
18 0 0 0
19 2 0 2
20 1 2 3
21 1 0 1
22 - 24 7 1 8
25 - 29 3 1 4
30 - 34 2 2 4
35 - 44 10 3 13
45 - 54 5 1 6
55 - 64 11 2 13
65 - 74 5 5 10
75 & Older 9 4 13
Unknown Age 0 0 0
TOTALS: 57 21 78
*NOTE: Drivers include motorcycle and ATV operators.
66

DRIVERS UNDER THE INFLUENCE KILLEDby
AGE and GENDER2019
Age Male Female Total
15 & Under 0 0 0
16 0 0 0
17 0 0 0
18 0 0 0
19 1 0 1
20 1 1 2
21 0 0 0
22 - 24 4 1 5
25 - 29 2 1 3
30 - 34 1 2 3
35 - 44 5 2 7
45 - 54 3 0 3
55 - 64 5 2 7
65 - 74 2 1 3
75 & Older 0 1 1
Unknown Age 0 0 0
TOTALS: 24 11 35*NOTE: Drivers include motorcycle and ATV operators.
Includes drivers under the influence of alcohol and / or drugs.
67
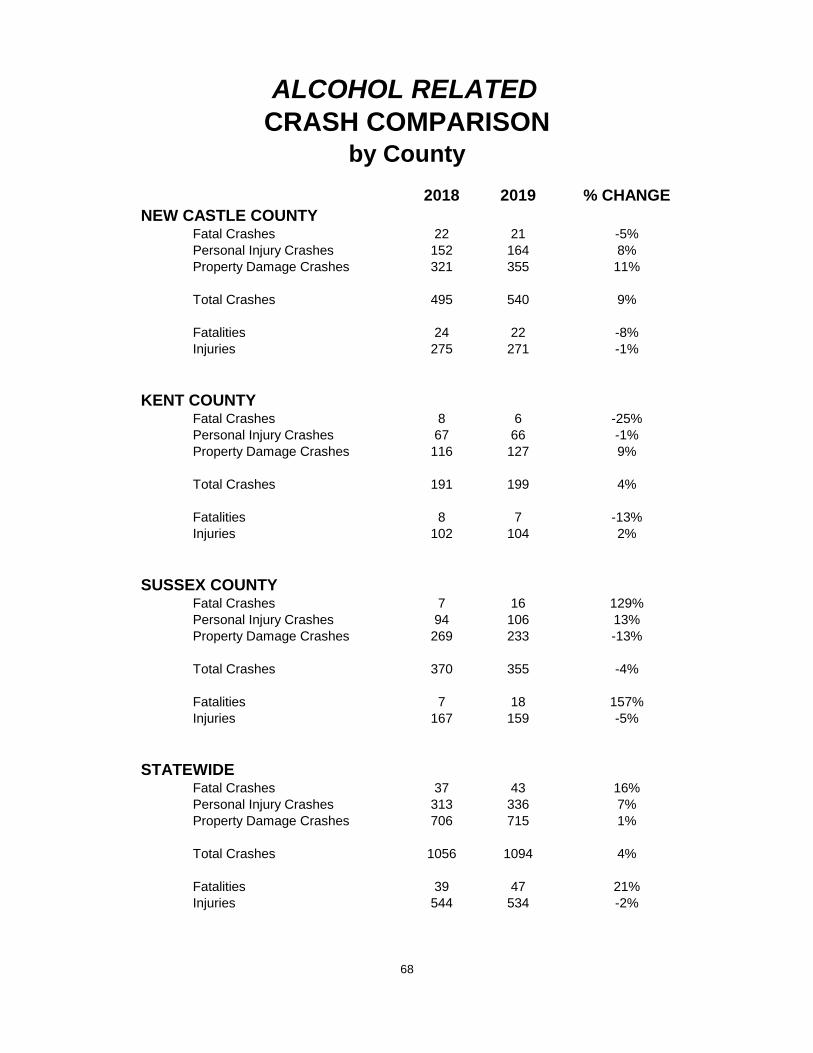
ALCOHOL RELATED
CRASH COMPARISONby County
2018 2019 % CHANGE
NEW CASTLE COUNTYFatal Crashes 22 21 -5%
Personal Injury Crashes 152 164 8%
Property Damage Crashes 321 355 11%
Total Crashes 495 540 9%
Fatalities 24 22 -8%
Injuries 275 271 -1%
KENT COUNTYFatal Crashes 8 6 -25%
Personal Injury Crashes 67 66 -1%
Property Damage Crashes 116 127 9%
Total Crashes 191 199 4%
Fatalities 8 7 -13%
Injuries 102 104 2%
SUSSEX COUNTYFatal Crashes 7 16 129%
Personal Injury Crashes 94 106 13%
Property Damage Crashes 269 233 -13%
Total Crashes 370 355 -4%
Fatalities 7 18 157%
Injuries 167 159 -5%
STATEWIDEFatal Crashes 37 43 16%
Personal Injury Crashes 313 336 7%
Property Damage Crashes 706 715 1%
Total Crashes 1056 1094 4%
Fatalities 39 47 21%
Injuries 544 534 -2%
68
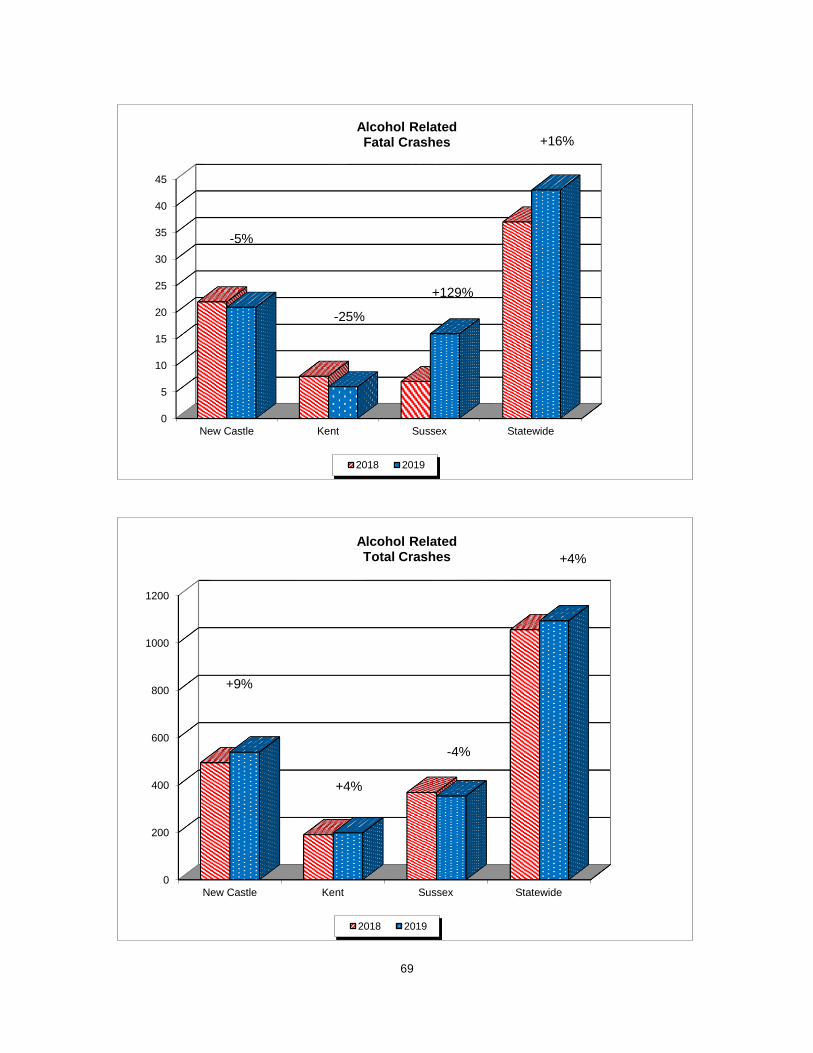
69
0
5
10
15
20
25
30
35
40
45
New Castle Kent Sussex Statewide
Alcohol Related Fatal Crashes
2018 2019
-5%
-25%
+129%
+16%
0
200
400
600
800
1000
1200
New Castle Kent Sussex Statewide
Alcohol Related Total Crashes
2018 2019
+9%
+4%
-4%
+4%

ALCOHOL RELATED
ALL CRASHES and FATAL CRASHESby
DAY OF WEEK
Day All Crashes Fatal Crashes
of
Week 2018 2019 2018 2019
Monday 103 113 4 3
Tuesday 99 97 3 3
Wednesday 96 107 4 3
Thursday 126 115 3 8
Friday 182 194 10 9
Saturday 212 239 10 8
Sunday 238 229 3 9
TOTALS: 1056 1094 37 43
70

ALCOHOL RELATED
All Crashes
by Day of Week
ALCOHOL RELATED
Fatal Crashes
by Day of Week
71
0
50
100
150
200
250
300
2018 2019
0
2
4
6
8
10
12
2018 2019
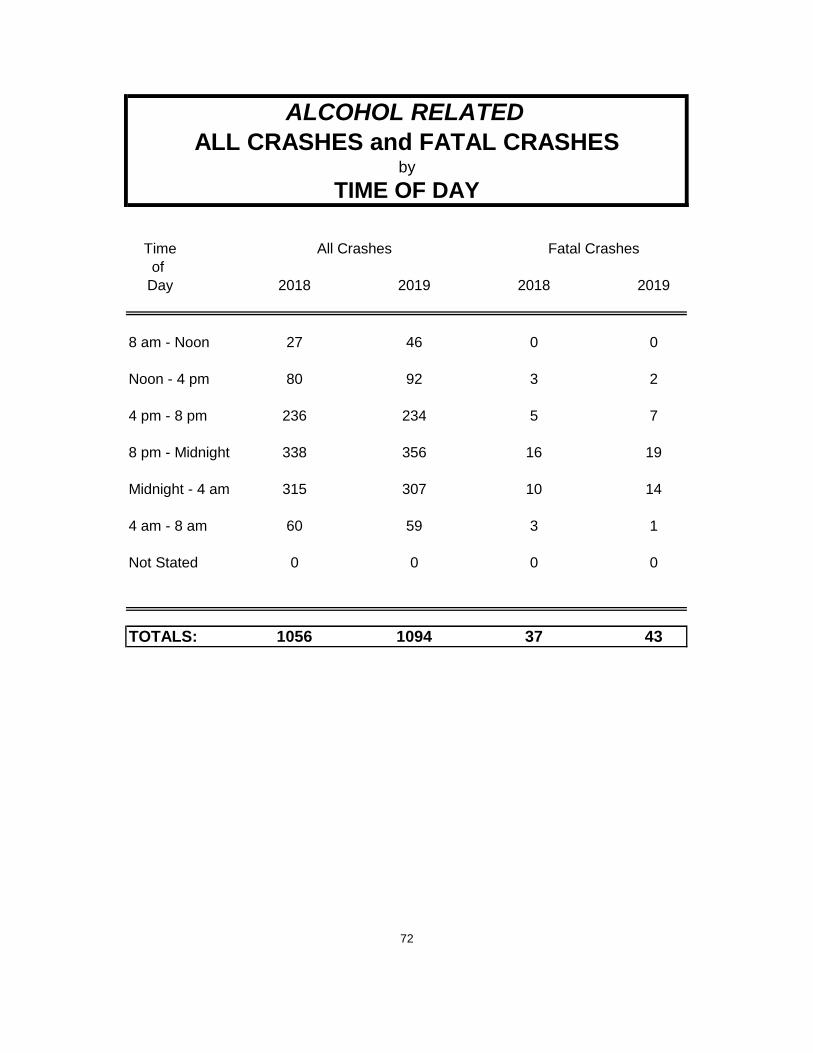
ALCOHOL RELATED
ALL CRASHES and FATAL CRASHESby
TIME OF DAY
Time All Crashes Fatal Crashes
of
Day 2018 2019 2018 2019
8 am - Noon 27 46 0 0
Noon - 4 pm 80 92 3 2
4 pm - 8 pm 236 234 5 7
8 pm - Midnight 338 356 16 19
Midnight - 4 am 315 307 10 14
4 am - 8 am 60 59 3 1
Not Stated 0 0 0 0
TOTALS: 1056 1094 37 43
72

ALCOHOL RELATED
All Crashes
by Time of Day
ALCOHOL RELATED
Fatal Crashes
by Time of Day
73
0
50
100
150
200
250
300
350
400
2018 2019
0
2
4
6
8
10
12
14
16
18
20
2018 2019
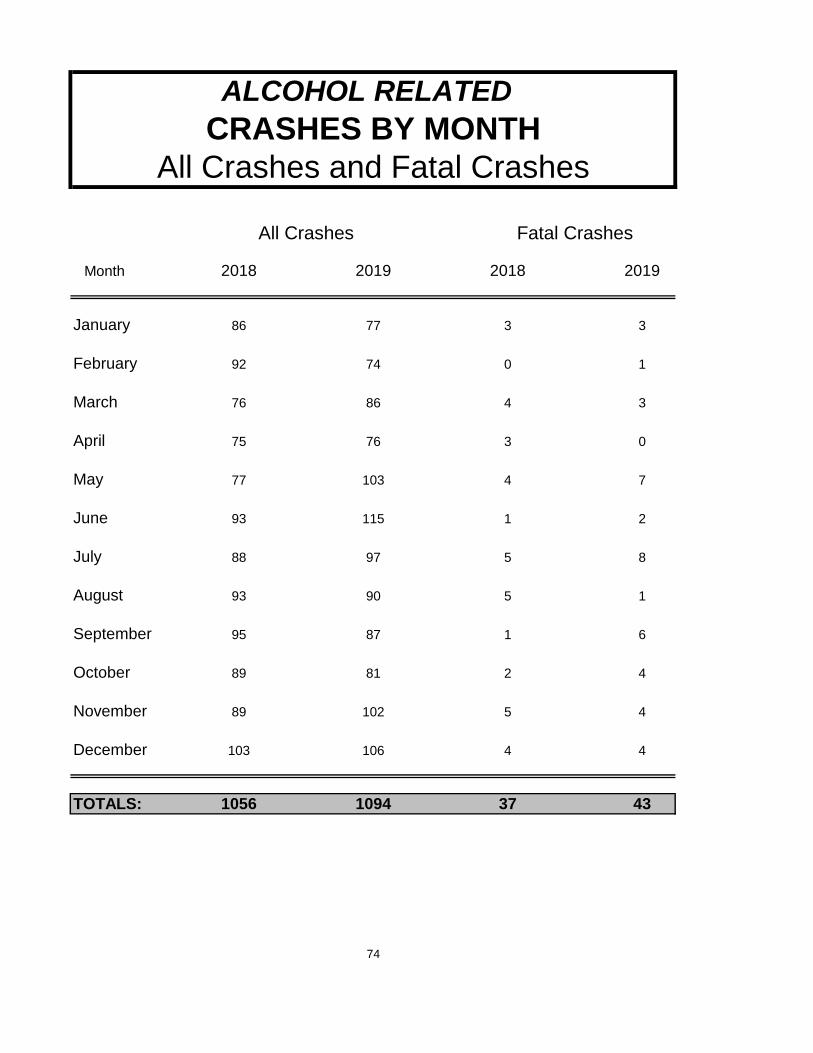
ALCOHOL RELATED
CRASHES BY MONTH
All Crashes and Fatal Crashes
All Crashes Fatal Crashes
Month 2018 2019 2018 2019
January 86 77 3 3
February 92 74 0 1
March 76 86 4 3
April 75 76 3 0
May 77 103 4 7
June 93 115 1 2
July 88 97 5 8
August 93 90 5 1
September 95 87 1 6
October 89 81 2 4
November 89 102 5 4
December 103 106 4 4
TOTALS: 1056 1094 37 43
74

75
0
20
40
60
80
100
120
140
Alcohol RelatedAll Crashes by Month
2018 2019
0
1
2
3
4
5
6
7
8
9
Alcohol RelatedFatal Crashes
by Month
2018 2019

76
2019
DELAWARE STATE POLICE
TRAFFIC ENFORCEMENT
Statistics in this section are based on Delaware State Police data only unless otherwise noted.

CRASH INVESTIGATIONby
DELAWARE STATE POLICE
All % Change
Crashes 2015 2016 2017 2018 2019 Over 2018
Total Crashes 15,961 17,457 18,242 18,896 18,669 -1%
Fatal 109 103 91 88 101 15%
Personal Injury 3,142 3,292 3,227 3,158 3,345 6%
Property Damage 12,710 14,062 14,924 15,650 15,223 -3%
Fatalities 113 104 96 94 109 16%
Injuries 4,851 5,098 4,915 4,912 5,228 6%
Alcohol % Change
Related 2015 2016 2017 2018 2019 Over 2018
Total Crashes 848 787 735 736 717 -3%
Fatal 50 42 32 32 35 9%
Personal Injury 283 250 256 216 219 1%
Property Damage 515 495 447 488 463 -5%
Fatalities 51 43 35 34 38 12%
Injuries 426 396 356 367 245 -33%
Insurance % Change
Requests 2015 2016 2017 2018 2019 Over 2018
Requests 14,492 16,360 16,560 17,040 17,108 0%
Processed
77

Delaware State Police Delaware State Police
Crash Investigation Alcohol Related Crash Investigation
by Troop & by County by Troop & by County
Troop All Fatal Personal Property
Crashes Crashes Injury Damage
Crashes Crashes
'18 '19 '18 '19 '18 '19 '18 '19
1 2809 2642 17 15 441 479 2351 2148
2 3421 3447 14 10 619 639 2788 2798
3 1824 1760 11 9 365 350 1448 1401
4 1661 1801 10 16 280 336 1371 1449
5 1471 1473 10 12 290 337 1171 1124
6 4179 4108 10 10 573 638 3596 3460
7 1830 1830 8 13 246 273 1576 1544
9 1701 1608 8 16 344 293 1349 1299
Totals: 18896 18669 88 101 3158 3345 15650 15223
County All Fatal Personal Property
Crashes Crashes Injury Damage
Crashes Crashes
'18 '19 '18 '19 '18 '19 '18 '19
New Castle 11537 11285 45 46 1851 1931 9641 9308
Kent 2397 2280 15 14 491 468 1891 1798
Sussex 4962 5104 28 41 816 946 4118 4117
Totals: 18896 18669 88 101 3158 3345 15650 15223
78

Delaware State Police
Alcohol Related Crash Investigation
by Troop & by County
Troop All Fatal Personal Property
Crashes Crashes Injury Damage
Crashes Crashes
'18 '19 '18 '19 '18 '19 '18 '19
1 84 102 5 8 24 27 55 67
2 100 89 10 5 29 34 61 50
3 94 80 2 2 29 29 63 49
4 110 91 1 5 30 26 79 60
5 82 73 3 5 20 32 59 36
6 110 107 6 1 37 31 67 75
7 98 109 2 3 26 26 70 80
9 58 66 3 6 21 14 34 46
Totals: 736 717 32 35 216 219 488 463
County All Fatal Personal Property
Crashes Crashes Injury Damage
Crashes Crashes
'18 '19 '18 '19 '18 '19 '18 '19
New Castle 324 339 22 19 101 100 201 220
Kent 122 105 4 3 39 35 79 67
Sussex 290 273 6 13 76 84 208 176
Totals: 736 717 32 35 216 219 488 463
79

TRAFFIC ENFORCEMENTby
DELAWARE STATE POLICE
Traffic % Change
Arrests 2015 2016 2017 2018 2019 2018
Total Arrests 132,295 126,913 118,394 112,999 117,311 4%
DUI Arrests 2,785 2,676 2,401 2,456 2,657 8%
Speed Arrests 47,573 44,261 40,200 35,698 33,932 -5%
55 MPH Speed Arrests 20,366 17,235 14,757 12,342 12,370 0%
65 MPH Speed Arrests 7,535 8,654 7,726 7,397 7,519 2%
D.M.V. Arrests* 81,960 79,956 72,797 67,522 66,512 -1%
Aggressive Driving 62,808 60,168 55,396 50,557 49,571 -2%
Related Arrests**
Primary Seatbelt Arrests 2,593 2,306 2,310 2,453 1,936 -21%
License & 39,996 36,803 35,725 35,129 39,509 12%
Registration
Arrests
* D. M.V. = Dangerous Moving Violations include speeding arrests and DUI arrests as well as other moving violations.
** Aggressive Driving Related Arrests include the following Sections of Delaware Law, Title 21: 4107a; 4117, 4120b; 4122-1; 4123;
4132; 4133; 4155; 4164; 4168; 4169; 4175a; and 4175A.
80
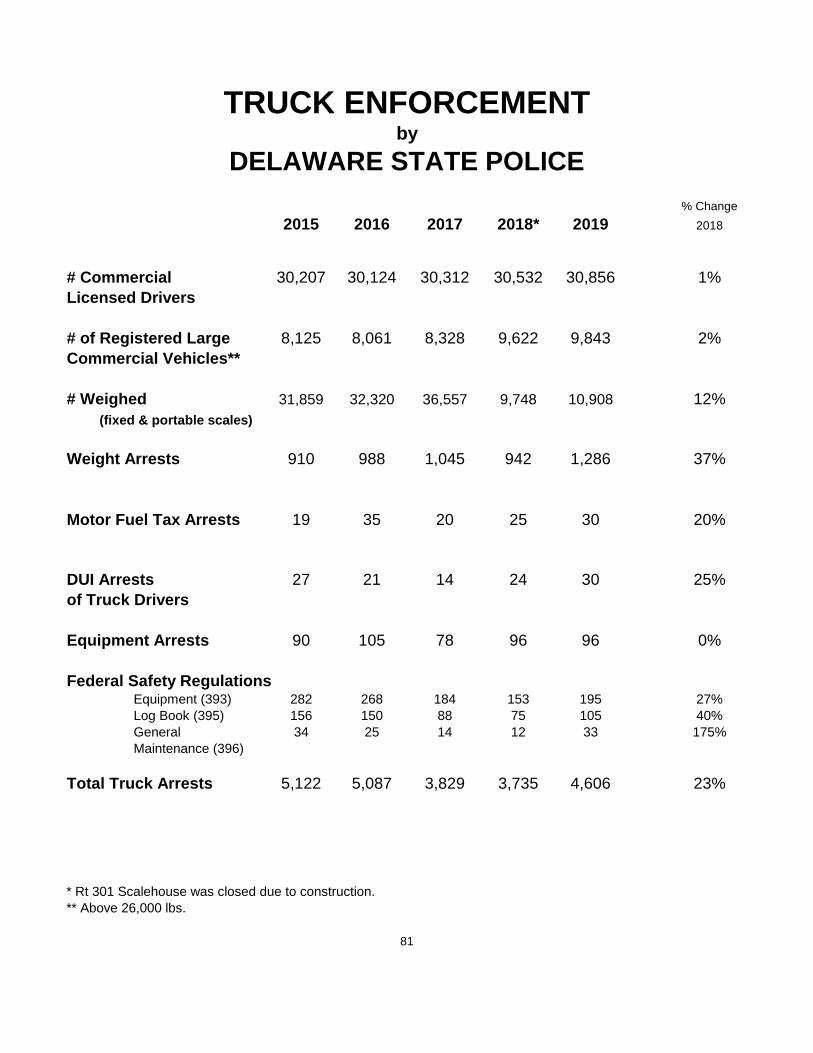
TRUCK ENFORCEMENTby
DELAWARE STATE POLICE
% Change
2015 2016 2017 2018* 2019 2018
# Commercial 30,207 30,124 30,312 30,532 30,856 1%
Licensed Drivers
# of Registered Large 8,125 8,061 8,328 9,622 9,843 2%
Commercial Vehicles**
# Weighed 31,859 32,320 36,557 9,748 10,908 12%
(fixed & portable scales)
Weight Arrests 910 988 1,045 942 1,286 37%
Motor Fuel Tax Arrests 19 35 20 25 30 20%
DUI Arrests 27 21 14 24 30 25%
of Truck Drivers
Equipment Arrests 90 105 78 96 96 0%
Federal Safety RegulationsEquipment (393) 282 268 184 153 195 27%
Log Book (395) 156 150 88 75 105 40%
General 34 25 14 12 33 175%
Maintenance (396)
Total Truck Arrests 5,122 5,087 3,829 3,735 4,606 23%
* Rt 301 Scalehouse was closed due to construction.
** Above 26,000 lbs.
81

Blood Alcohol Content Data
Drivers Arrested for DUI
2017 2018 2019
# of DUI Arrests 2401 2456 2657
Arrests with No BAC
applicable** 613 456 486
# of BAC's Obtained 1672 1851 1985
# of BAC's Not Obtained 9 19 19
Implied Consent 107 130 167
** Arrests for drugs only and arrests for consuming alcohol while driving
Drivers Arrested for DUI
by Age and Sex
Males Females Unknown Total
15 & Under 1 0 0 1
16 1 1 0 2
17 8 1 0 9
18 15 0 0 15
19 31 7 0 38
20 41 6 0 47
21 - 24 231 88 0 319
25 - 34 695 230 0 925
35 - 44 462 114 0 576
45 - 54 258 83 0 341
55 - 64 220 58 0 278
65 & Older 71 35 0 106
Unknown 0 0 0 0
Totals: 2034 623 0 2657
Based on 2019 data for Delaware State Police only.
82

Blood Alcohol Content DataDrivers Arrested for DUI
2019
Total DUI Arrests: Breakdown of the
2657 BAC's Obtained
* Samples taken but BAC results not reported.
Based on 2019 data for Delaware State Police only.
83
461
95
231
456
421
277
44 .01-.07
.10-.14
.15-.19
.20-.24
.25 & higher
Unknown*
.08-.09
1985
19
486
167BAC's
Obtained
BAC's Not
Obtained
Implied Consent Refusals
Arrests with BAC Not
Applicable

Persons Arrested for DUIby Age
14
15
16
17
18
19
20
21
22
23
24
25
26
27
28
29
Based on Year 2019 DSP arrests for which the age was known.
84
0
20
40
60
80
100
120
0 10 20 30 40 50 60 70 80 90 100
Nu
mb
er
of
Arr
ests
Age of Offender
Average Age:37.4 years old

All Traffic Arrests 55 MPH Speed Arrests
by Troops by Troops
Troop 2017 2018 2019 Troop
Troop 1 16,774 16,023 13,507 Troop 1
Troop 2 13,136 12,304 12,188 Troop 2
Troop 3 13,769 13,889 13,974 Troop 3
Troop 4 12,990 13,922 16,330 Troop 4
Troop 5 11,485 12,398 12,658 Troop 5
Troop 6 13,021 12,340 14,709 Troop 6
Troop 7 16,169 14,805 15,097 Troop 7
Troop 9 17,445 13,889 15,417 Troop 9
Special Units 3,605 3,429 3,431 Special Units
Totals: 118,394 112,999 117,311 Totals:
85
0
2,000
4,000
6,000
8,000
10,000
12,000
14,000
16,000
18,000
Troop 1 Troop 2 Troop 3 Troop 4 Troop 5 Troop 6 Troop 7 Troop 9 SpecialUnits
Troop
2017 2018 2019

Speed Arrests 65 MPH Speed Arrests
by Troops by Troops
Troop 2017 2018 2019 Troop
Troop 1 5,221 4,025 2,895 Troop 1
Troop 2 2,959 2,428 1,819 Troop 2
Troop 3 3,341 2,970 2,753 Troop 3
Troop 4 5,807 6,326 6,759 Troop 4
Troop 5 4,845 4,820 4,802 Troop 5
Troop 6 3,423 2,905 2,920 Troop 6
Troop 7 4,490 4,609 3,744 Troop 7
Troop 9 9,595 7,149 7,922 Troop 9
Special Units 519 466 318 Special Units
Totals: 40,200 35,698 33,932 Totals:
86
0
1,000
2,000
3,000
4,000
5,000
6,000
7,000
8,000
9,000
10,000
Troop 1 Troop 2 Troop 3 Troop 4 Troop 5 Troop 6 Troop 7 Troop 9 SpecialUnits
Troop
2017 2018 2019
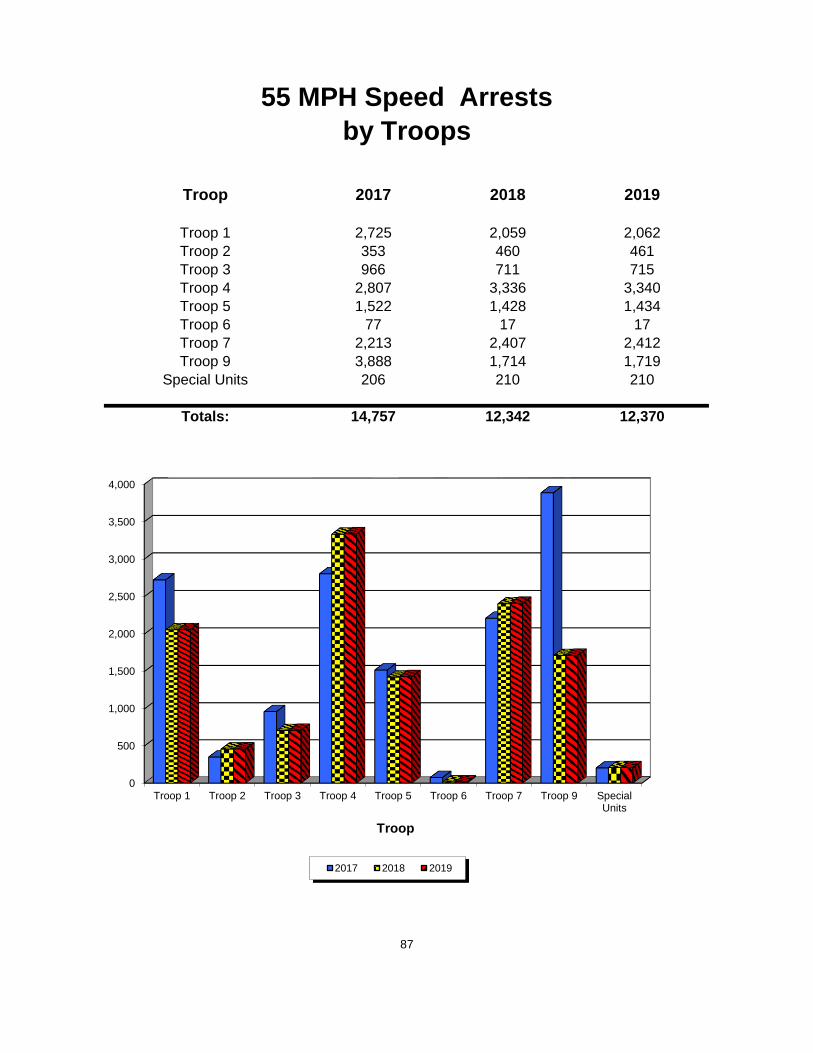
55 MPH Speed Arrests DUI Arrests
by Troops by Troops
Troop 2017 2018 2019 Troop
Troop 1 2,725 2,059 2,062 Troop 1
Troop 2 353 460 461 Troop 2
Troop 3 966 711 715 Troop 3
Troop 4 2,807 3,336 3,340 Troop 4
Troop 5 1,522 1,428 1,434 Troop 5
Troop 6 77 17 17 Troop 6
Troop 7 2,213 2,407 2,412 Troop 7
Troop 9 3,888 1,714 1,719 Troop 9
Special Units 206 210 210 Special Units
Totals: 14,757 12,342 12,370 Totals:
87
0
500
1,000
1,500
2,000
2,500
3,000
3,500
4,000
Troop 1 Troop 2 Troop 3 Troop 4 Troop 5 Troop 6 Troop 7 Troop 9 SpecialUnits
Troop
2017 2018 2019

65 MPH Speed Arrests Dangerous Moving Violation Arrests
by Troops by Troops
Troop 2017 2018 2019 Troop
Troop 1 1,214 937 820 Troop 1
Troop 2 612 918 595 Troop 2
Troop 3 290 341 230 Troop 3
Troop 4 0 0 0 Troop 4
Troop 5 0 0 0 Troop 5
Troop 6 1,711 1,292 1,183 Troop 6
Troop 7 0 0 0 Troop 7
Troop 9 3,707 3,742 4,550 Troop 9
Special Units 192 167 141 Special Units
Totals: 7,726 7,397 7,519 Totals:
88
0
500
1,000
1,500
2,000
2,500
3,000
3,500
4,000
4,500
5,000
Troop 1 Troop 2 Troop 3 Troop 4 Troop 5 Troop 6 Troop 7 Troop 9 SpecialUnits
Troop
2017 2018 2019
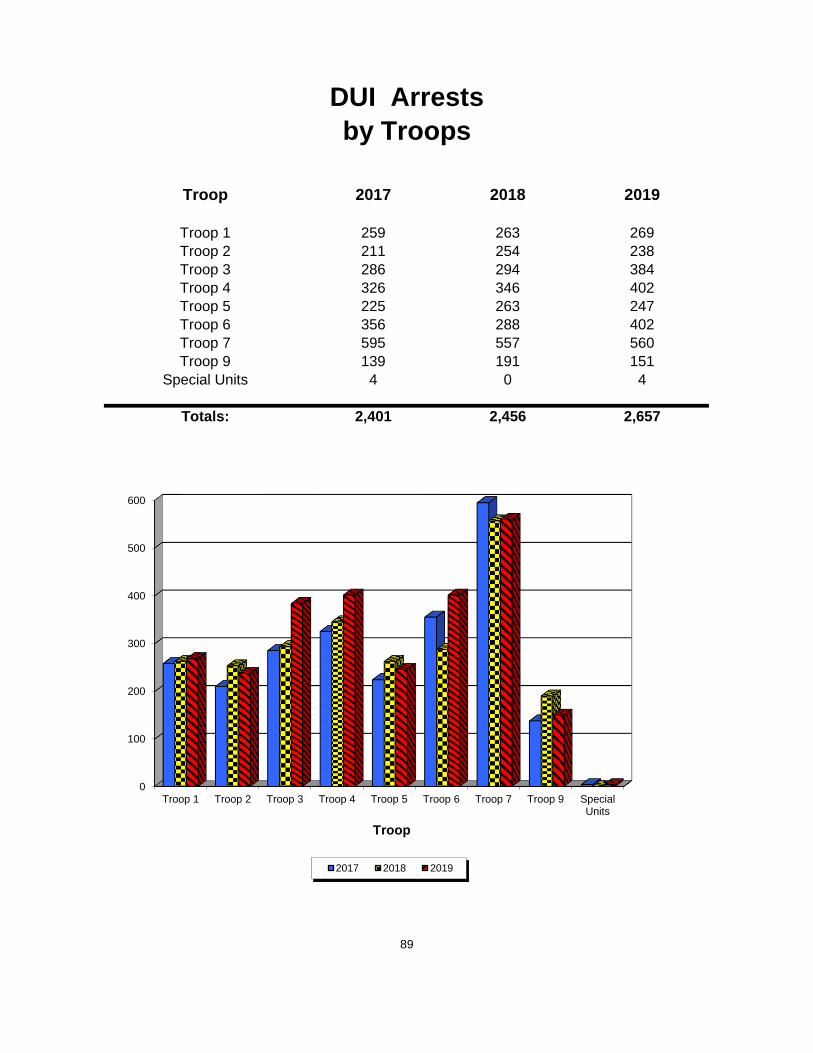
DUI Arrests Child Restraint Arrests
by Troops by Troops
Troop 2017 2018 2019 Troop
Troop 1 259 263 269 Troop 1
Troop 2 211 254 238 Troop 2
Troop 3 286 294 384 Troop 3
Troop 4 326 346 402 Troop 4
Troop 5 225 263 247 Troop 5
Troop 6 356 288 402 Troop 6
Troop 7 595 557 560 Troop 7
Troop 9 139 191 151 Troop 9
Special Units 4 0 4 Special Units
Totals: 2,401 2,456 2,657 Totals:
89
0
100
200
300
400
500
600
Troop 1 Troop 2 Troop 3 Troop 4 Troop 5 Troop 6 Troop 7 Troop 9 SpecialUnits
Troop
2017 2018 2019
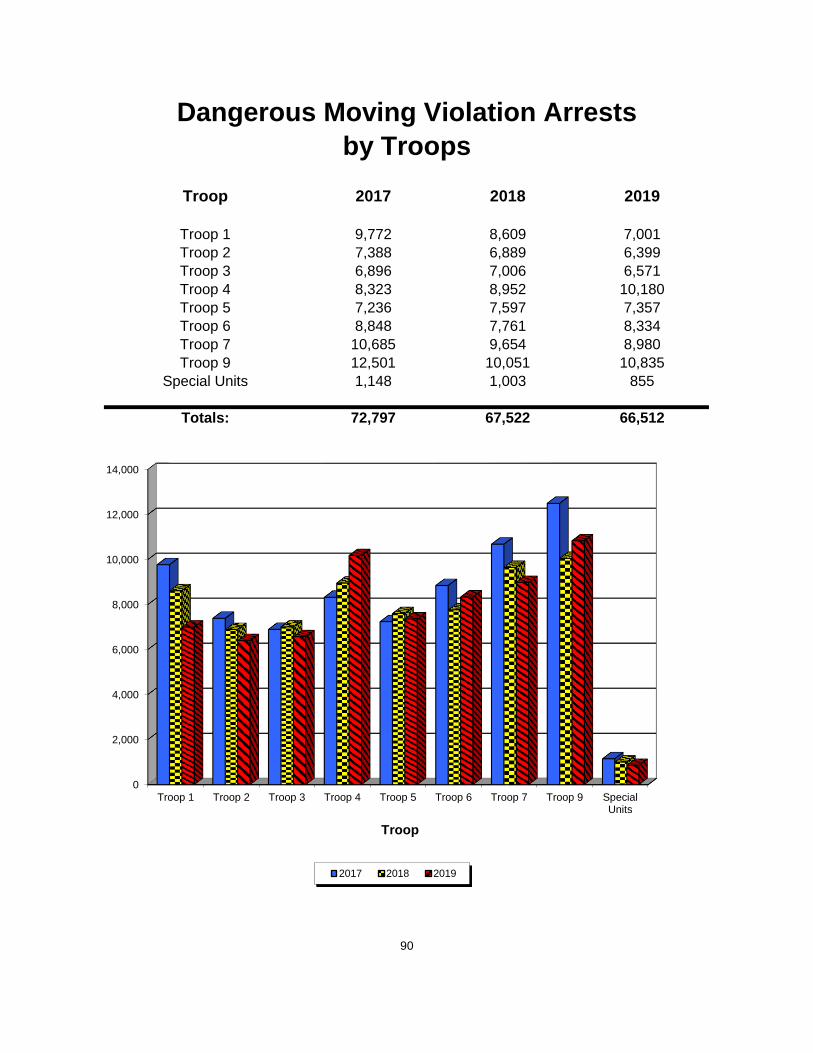
Dangerous Moving Violation Arrests Seat Belt Assessments*
by Troops by Troops
Troop 2017 2018 2019 Troop
Troop 1 9,772 8,609 7,001 Troop 1
Troop 2 7,388 6,889 6,399 Troop 2
Troop 3 6,896 7,006 6,571 Troop 3
Troop 4 8,323 8,952 10,180 Troop 4
Troop 5 7,236 7,597 7,357 Troop 5
Troop 6 8,848 7,761 8,334 Troop 6
Troop 7 10,685 9,654 8,980 Troop 7
Troop 9 12,501 10,051 10,835 Troop 9
Special Units 1,148 1,003 855 Special Units
Totals: 72,797 67,522 66,512 Totals:
90
0
2,000
4,000
6,000
8,000
10,000
12,000
14,000
Troop 1 Troop 2 Troop 3 Troop 4 Troop 5 Troop 6 Troop 7 Troop 9 SpecialUnits
Troop
2017 2018 2019
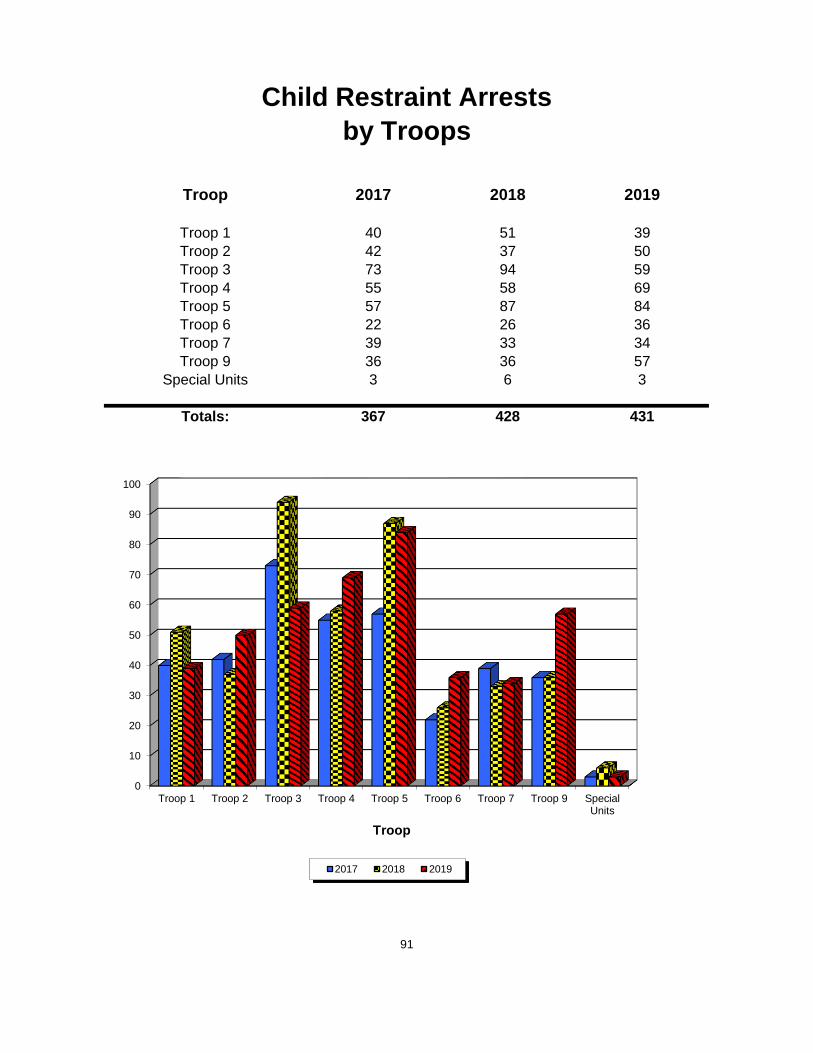
Child Restraint Arrests Primary Seatbelt Arrests*
by Troops by Troops
Troop 2017 2018 2019 Troop
Troop 1 40 51 39 Troop 1
Troop 2 42 37 50 Troop 2
Troop 3 73 94 59 Troop 3
Troop 4 55 58 69 Troop 4
Troop 5 57 87 84 Troop 5
Troop 6 22 26 36 Troop 6
Troop 7 39 33 34 Troop 7
Troop 9 36 36 57 Troop 9
Special Units 3 6 3 Special Units
Totals: 367 428 431 Totals:
91
0
10
20
30
40
50
60
70
80
90
100
Troop 1 Troop 2 Troop 3 Troop 4 Troop 5 Troop 6 Troop 7 Troop 9 SpecialUnits
Troop
2017 2018 2019

Seat Belt Assessments* Aggressive Driving Related Arrests
by Troops by Troops
Troop 2017 2018 2019 Troop
Troop 1 384 332 310 Troop 1
Troop 2 465 536 471 Troop 2
Troop 3 566 500 383 Troop 3
Troop 4 349 348 272 Troop 4
Troop 5 296 451 403 Troop 5
Troop 6 363 330 509 Troop 6
Troop 7 690 588 350 Troop 7
Troop 9 834 706 632 Troop 9
Special Units 173 264 279 Special Units
Totals: 4,120 4,055 3,609 Totals:
* Secondary Violation
92
0
100
200
300
400
500
600
700
800
900
Troop 1 Troop 2 Troop 3 Troop 4 Troop 5 Troop 6 Troop 7 Troop 9 SpecialUnits
Troop
2017 2018 2019

Primary Seatbelt Arrests* Cell Phone Arrests
by Troops by Troops
Troop 2017 2018 2019 Troop
Troop 1 119 163 167 Troop 1
Troop 2 287 362 239 Troop 2
Troop 3 288 212 139 Troop 3
Troop 4 155 141 94 Troop 4
Troop 5 172 268 235 Troop 5
Troop 6 155 183 328 Troop 6
Troop 7 563 487 250 Troop 7
Troop 9 474 429 266 Troop 9
Special Units 97 208 218 Special Units
Totals: 2,310 2,453 1,936 Totals:
* Initiated October 2003.
93
0
100
200
300
400
500
600
Troop 1 Troop 2 Troop 3 Troop 4 Troop 5 Troop 6 Troop 7 Troop 9 SpecialUnits
Troop
2017 2018 2019

Aggressive Driving Related Arrests
by Troops
Troop 2017 2018 2019
Troop 1 7,856 6,576 5,098
Troop 2 4,859 4,353 3,754
Troop 3 5,137 5,040 4,655
Troop 4 6,941 7,468 8,500
Troop 5 5,992 6,250 6,140
Troop 6 5,860 4,875 5,276
Troop 7 7,369 7,219 6,624
Troop 9 10,760 8,227 9,124
Special Units 622 549 400
Totals: 55,396 50,557 49,571
Aggressive Driving Related Arrests include the following Sections of Delaware Law, Title 21: 4107a; 4117; 4120b; 4122-1; 4123; 4132;
4133; 4155; 4164; 4168; 4169; 4175a; and 4175A.
94
0
2,000
4,000
6,000
8,000
10,000
12,000
Troop 1 Troop 2 Troop 3 Troop 4 Troop 5 Troop 6 Troop 7 Troop 9 SpecialUnits
Troop
2017 2018 2019
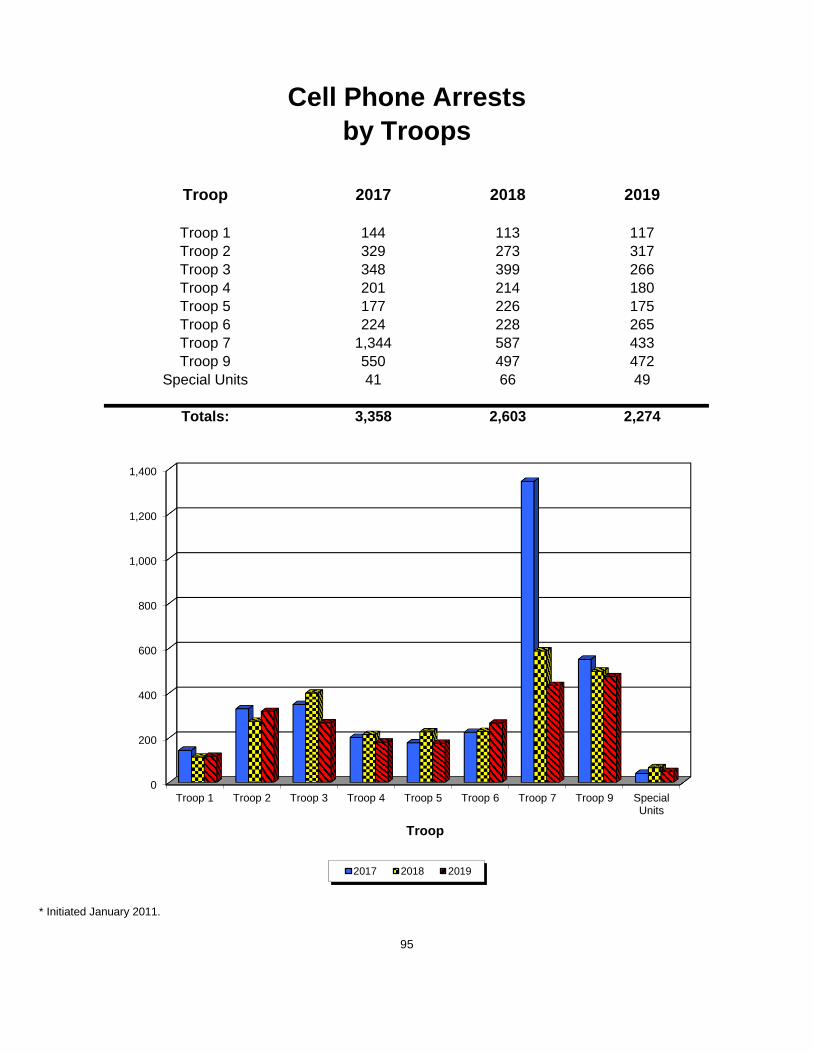
Cell Phone Arrests
by Troops
Troop 2017 2018 2019
Troop 1 144 113 117
Troop 2 329 273 317
Troop 3 348 399 266
Troop 4 201 214 180
Troop 5 177 226 175
Troop 6 224 228 265
Troop 7 1,344 587 433
Troop 9 550 497 472
Special Units 41 66 49
Totals: 3,358 2,603 2,274
* Initiated January 2011.
95
0
200
400
600
800
1,000
1,200
1,400
Troop 1 Troop 2 Troop 3 Troop 4 Troop 5 Troop 6 Troop 7 Troop 9 SpecialUnits
Troop
2017 2018 2019
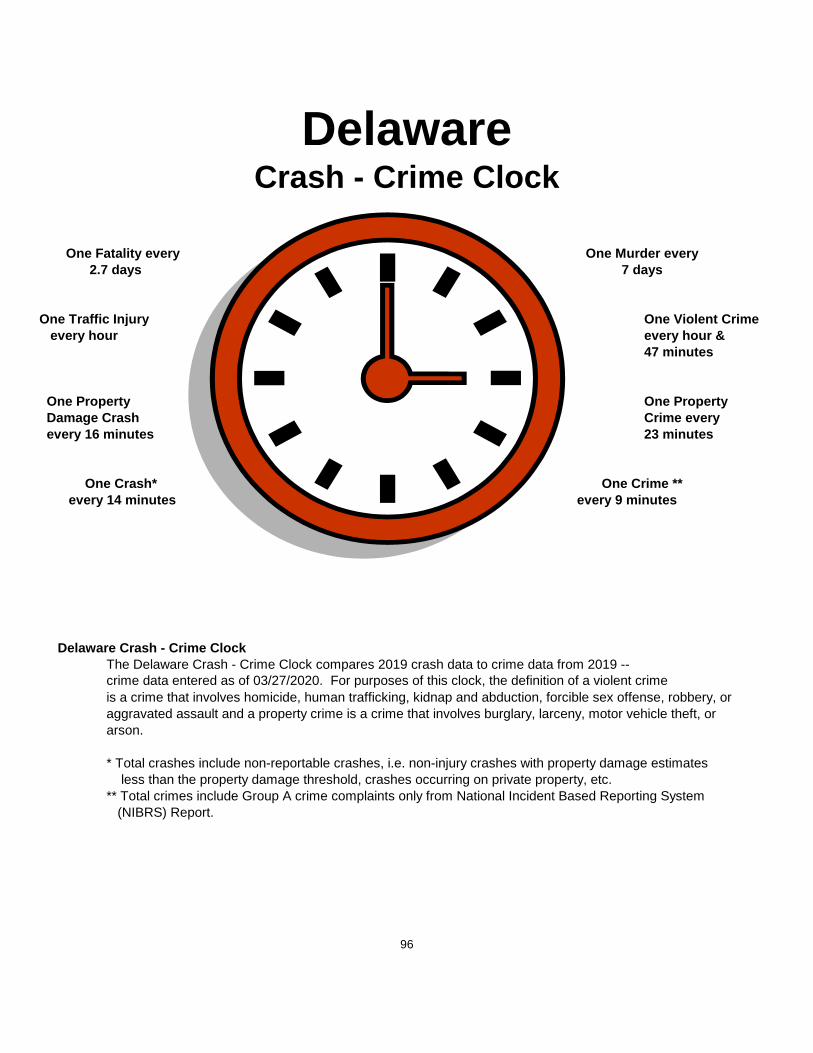
DelawareCrash - Crime Clock
One Fatality every One Murder every
2.7 days 7 days
One Traffic Injury One Violent Crime
every hour every hour &
47 minutes
One Property One Property
Damage Crash Crime every
every 16 minutes 23 minutes
One Crash* One Crime **
every 14 minutes every 9 minutes
Delaware Crash - Crime Clock
The Delaware Crash - Crime Clock compares 2019 crash data to crime data from 2019 --
crime data entered as of 03/27/2020. For purposes of this clock, the definition of a violent crime
is a crime that involves homicide, human trafficking, kidnap and abduction, forcible sex offense, robbery, or
aggravated assault and a property crime is a crime that involves burglary, larceny, motor vehicle theft, or
arson.
* Total crashes include non-reportable crashes, i.e. non-injury crashes with property damage estimates
less than the property damage threshold, crashes occurring on private property, etc.
** Total crimes include Group A crime complaints only from National Incident Based Reporting System
(NIBRS) Report.
96