degradation of tbcs · degradation of tbc systems in environments relevant to advanced gas turbines...
TRANSCRIPT

Degradation of TBC Systems in Environments Relevant to Advanced Gas Turbines
for IGCC Systems
Principal Investigators: Brian Gleeson, Frederick S. Pettit and Gerald H. Meier
Graduate Student: Nate Bohna Postdoc: Thomas Gheno
DOE PROGRAM: DE-FOA-0000459
Seth Lawson, Program Manager, DOE/NETL
Project Awarded 10/01/2011 (36 months duration)

Integrated Gasification Combined Cycle
2
Thermal Barrier Coatings used in hottest sections of turbines
TBCs subjected to deposits and multi-oxidant gas environments
O2+CO2+H2O+SO2 …
IGCC Process
Sources of Deposits: • Ambient air passing through turbine • Upstream components • Fuel source (coal)
Font et al., Fuel, 89 (2010) pp. 3250-3261

Comparison of Typical Deposits
• Engine deposits in combustion turbines contain oxides similar to CMAS
• Variability due to location and fuel source (coal, syngas, ng)
• Coal and IGCC ash also contain sulfates that will be liquid
Levi, Hutchinson, Vidal-Sétif, Johnson, MRS BULLETIN, 37 (2012). 3
SiO2 Al2O3 CaO Fe2O3 MgO MnO P2O5 TiO2 K2O Na2O SO3 C
Wt% 56 19 3.2 5 0.7 0.04 0.7 0.6 4.1 0.6 3.3 2.8
Typical IGCC Fly-Ash

4
SiO2 26.4 Al2O3 20.1 Fe2O3 6.1 CaO 33.4 MgO 8.0
Na2SO4 5.2 K2SO4 0.7
Composition (wt. %)
From Boral Material Technologies Source: Plant Scherer, GA (pulverized coal)
Class C Fly ash
Example of Commercial Fly Ash
SiO2 26.4 Al2O3 20.0 Fe2O3 6.1 CaO 33.4 MgO 8.0 SO3 3.4
Na2O 2.3 K2O 0.4
As reported:

Reactions of Fly Ash with YSZ
1300 °C, 100h
Complex Reaction Layer
Ash
Ash
Melted ash has severely degraded the YSZ
YSZ isothermal exposure to “class C” ash in dry air.
1200 °C, 24h
1100 °C, 100h
5
Some infiltration of ash constituents, partial melting
“Tm”
Composition (wt. %)
SiO2 26 Al2O3 20 Fe2O3 6 CaO 33 MgO 8
Na2SO4 5 K2SO4 1

Main Aims of Present Study
6
• Determine the effects of fly-ash deposits at temperatures below ash liquidus.
• Systematically assess the interplay between prototypical deposit chemistries (i.e., ash oxide and sulfate constituents) and environmental oxidants (i.e., O2, H2O and CO2) on the high-temperature degradation behavior of advanced TBC systems.
• Determine the combined effects of deposit-induced attack at relatively low temperatures on TBC performance.
• Establish reliable test procedures for assessing deposit-induced degradation of TBCs in different gas atmospheres.

Two TBC Systems Studied
Low Density (HP-LD) Dense Vertically Cracked (DVC) Provided by Praxair Surface Technologies, a collaborator on this project
Top Coat
Bond Coat Substrate
Oxide
Vertical Cracks
7
Density 85% T.D. Density 92% T.D.
Substrate: 2nd generation Ni-base single crystal superalloy (René N5 or PWA 1484)
Bond Coat: NiCoCrAlY (Ni-22Co-16Cr-13Al-0.5Y wt.%) applied by Ar-shrouded plasma spraying at PST
TBC: Standard YSZ composition – 7wt.%Y2O3 – deposited by APS at thickness of ~380 µm

Experimental Setup Thermal Cycling Experimental Setup
8
Isothermal Testing at 1100°C: Free-standing YSZ - Reactions between YSZ/deposit - Phase transformation in YSZ Cyclic Testing between 1100°C/160°C: DVF and HPLD TBCs - Early failure from fly-ash - Atmospheric Effects
Gas Atmospheres: • Dry Air • Air+steam

9
Testing of 7YSZ top coat High-CaO Ash • Reaction with YSZ • Additions of sulfate • Cyclic failure of TBCs High SiO2-Ash

YSZ Reaction with Synthetic Ash
Increasing CaO
Oxide Wt%
SiO2 50
Al2O3 25
Fe2O3 10
MgO 5
CaO 10
Oxide Wt%
SiO2 10
Al2O3 5
Fe2O3 2
MgO 1
CaO 82
Dry Air exposures at 1100°C, 72h
10% CaO 82% CaO
10
CaZrO3 CaZr4O9
Reaction product predominantly CaZrO3 Same reaction with pure CaO and high-CaO ash

Consequences of CaZrO3
Thermal Cycling in lab air with CaZrO3 layer
11
Cycling without reaction layer Cycling after pre-formed CaZrO3
• TBC reacted with CaO isothermally for 72h, then tested in cyclic furnace • Very little spallation of CaZrO3 layer at YSZ surface • No significant overall affect on TBC performance
200 Cycles: 45min hold at 1100°C, 10min cool to 45°C

12
Testing of 7YSZ top coat High-CaO Ash • Reaction with YSZ • Additions of sulfate • Cyclic failure of TBCs High SiO2-Ash

Synthetic Ash with/without Addition
• Found that it is mainly CaO from fly-ash that reacts directly with YSZ • Fly ash typically contains sulfates
13
Synthetic Ash
Ca
Reactions in dry air at 1100°C, 72h
SEM Images
X-Ray Maps
Ca
Synthetic Ash + 5%K2SO4
Addition of K2SO4 to synthetic ash causes infiltration of Ca into YSZ

Synthetic Ash + K2SO4 Addition
CaZrO3
Free-standing DVC YSZ, reacted for 72h, 1100°C in dry air
14
CaO SiO2 Al2O3 Fe2O3 MgO K2SO4
Wt% 63 16.2 8.1 1.8 0.9 10
Ash Composition
CaZrO3

Consequence of Infiltration
15
Thermal Cycling in Lab Air
High-CaO Deposit without K2SO4 High-CaO Deposit with K2SO4
Early failure of DVC TBC caused by infiltration of top coat
140 Cycles: 45min hold at 1100°C, 10min cool to 45°C

Reaction with CaO+K2SO4
Free-standing DVC YSZ reacted with CaO+50wt%K2SO4, 1100°C, in dry air
Ca K
• Short times: CaO and K2SO4 both infiltrate • Longer times: Loss of K2SO4, CaO reacts with YSZ
16
70h
1h
S
Ca K S

Reaction with CaO+K2SO4
17
70h Dry Air Exposures at 1100°C
0.5CaO-0.5K2SO4
• Very low solubility of CaO in liquid K2SO4
• Increased CaO in deposit correlates with increased CaZrO3 penetration
• Suggests CaO carried in suspension with liquid K2SO4
0.1CaO-0.90K2SO4
Ca

18
Testing of 7YSZ top coat High-CaO Ash • Reaction with YSZ • Additions of sulfate • Cyclic failure of TBCs High SiO2-Ash

TBC Failure after Cyclic Exposure
How does infiltration of CaZrO3 affect TBC performance?
19
YSZ
Substrate
Deposit
“High-CaO” Ash+.05K2SO4+.05FeS Wt% CaO 63 SiO2 16.2 Al2O3 8.1 Fe2O3 1.8 MgO .9 K2SO4 5 FeS 5
DVC TBC Failure with deposit DVC TBC Failure without deposit
Thermal Cycling in dry air: 45min at 1100°C/ 15min at 160°C

TBC Failure after Cyclic Exposure
Stress in TBC from CTE mismatch
Key parameters affecting stress in top coat: E, α, ΔT
Choi; Hutchinson; Evans, Mechanics of Materials 31 (1999), 431-447.
E (Gpa) α (x10-6 C-1ppm)
YSZ 30-50 11-13
Metal 200 17.1
20
Typical Values
Free-standing YSZ heat treated 72h: 3-Pt Bend Test
No Deposit With Deposit
E = 30 ±3 GPa E = 132 ±19 GPa
Significant increase in elastic modulus Contributes to overall increased stress

TBC Failure after Cyclic Exposure
TBC Degradation in HPLD Top Coat
CaZrO3 Infiltration
Very Little CaZrO3
21
Failure Without Deposit
Failure With Deposit
Thermal Cycling in dry air: 45min at 1100°C/ 15min at 160°C

22
Testing of 7YSZ top coat High-CaO Ash • Reaction with YSZ • Additions of sulfate • Cyclic failure of TBCs High SiO2-Ash

High-SiO2 Ash Exposed to YSZ
Si, K
• Effects of lower-CaO ash that should not form CaZrO3? • Infiltrated cracks at YSZ surface contain ash constituents • Some liquid infiltration likely
72h Exposure in Dry Air, 1100°C
Synthetic Ash+.1K2SO4 Wt% SiO2 45 Al2O3 22.5 CaO 9 Fe2O3 9 MgO 4.5 K2SO4 10
23

Cyclic TBC Exposure to High-SiO2 Ash
“High-SiO2” Ash+.1K2SO4 Wt% SiO2 45 Al2O3 22.5 CaO 9 Fe2O3 9 MgO 4.5 K2SO4 10
24
Early Failure of HPLD TBCs with “high-SiO2” ash with K2SO4
Thermal Cycling in dry air: 45min at 1100°C/ 15min at 160°C
Failure Without Deposit
With Deposit
Infiltration
No Infiltration

Summary of Top Coat Results
• Infiltration into YSZ when K2SO4 is present
• TBC degradation at temperatures below overall ash melting temperature
• Different modes of failure for DVC and HPLD top coats
25
YSZ
Substrate
Deposit High CaO
High SiO2
CaZrO3 Formation
No reaction with YSZ
No K2SO4
K2SO4
K2SO4
No K2SO4 No Reaction
Infiltration
No Infiltration
Infiltration
Different mechanism of infiltration Similar overall effect on TBC lifetime
Early Failure
26
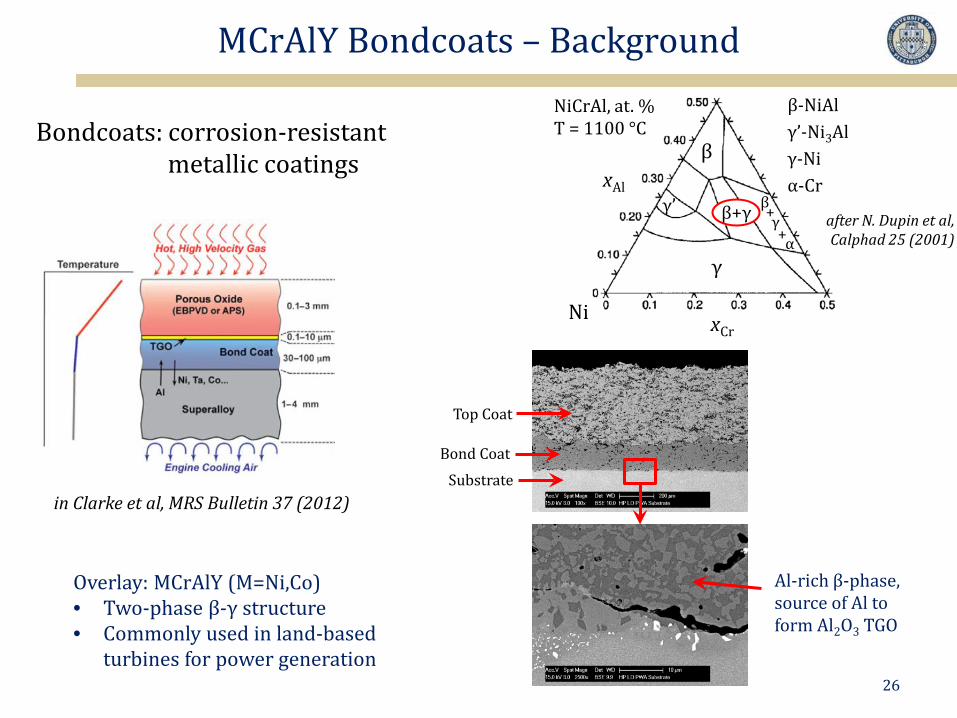
MCrAlY Bondcoats – Background
in Clarke et al, MRS Bulletin 37 (2012)
Bondcoats: corrosion-resistant metallic coatings
Overlay: MCrAlY (M=Ni,Co) • Two-phase β-γ structure • Commonly used in land-based
turbines for power generation
Al-rich β-phase, source of Al to form Al2O3 TGO
Top Coat
Bond Coat Substrate
NiCrAl, at. % T = 1100 °C
Ni
γ
β+γ after N. Dupin et al, Calphad 25 (2001)
β
γ’
β-NiAl γ’-Ni3Al γ-Ni α-Cr
α
β + +
γ
xCr
xAl

27
MCrAlY Bondcoats – Background
in Clarke et al, MRS Bulletin 37 (2012)
Bondcoats: corrosion resistant metal coatings
Top Coat
Bond Coat Substrate
NiCrAl, at. % T = 1100 °C
Ni
γ
β+γ after N. Dupin et al, Calphad 25 (2001)
β
γ’
β-NiAl γ’-Ni3Al γ-Ni α-Cr
α
β + +
γ
xCr
xAl
Identified modes of degradation: - air oxidation; thermal cycling - sulfate-induced accelerated attack: type I and type II hot corrosion
Fly ash-induced corrosion ?

28
Fly ash oxide-sulfate mixtures found to cause degradation of NiCoCrAlY alloys at intermediate temperatures (900-1100 °C)
Fly Ash Corrosion
T (°C)
600
800
1000
1200
1400
hot corrosion
CMAS
fly ash corrosion
sulfates
silicates
Ni-30Co-30Cr-12Al-0.1Y, 50 h at 1100 °C CO2-20H2O
SiO2 26 Al2O3 20
CaO 33 Fe2O3 6 MgO 8
Na2SO4 5 K2SO4 1
Class C ash (wt. %)
α-Al2O3
Cr2O3 (Ni,Co)O
mixed oxide

29
Factors Considered in the “Bondcoat” Study
Alloy • phase compositions • γ-β fractions • Y content
Environment • temperature • gas
(air vs CO2-H2O) • 𝑝𝑝O2 , 𝑝𝑝SO3
Deposit • sulfates • oxides
Factors affecting fly-ash corrosion
1. Experimental protocol 2. Reactivity of class C ash, effect
of alloy composition 3. Reactivity of individual oxides:
CaO in this presentaion 4. Interactions between oxide and
sulfate constituents, and gas 𝑝𝑝SO3 and temperature

30
Acidic oxide + Basic oxide + Sulfate Al2O3 CaO Na2SO4
SiO2 MgO
Deposits: - Class C fly ash - Individual oxides, sulfates - Synthetic mixtures:
Experimental conditions:
• Cast NiCoCrAlY alloys used in place of thermally sprayed coatings • 50 h exposures at 900 °C and 1100 °C
Experimental Protocol
Gas mixtures: - dry air - CO2-20H2O - CO2-20H2O-1.6O2
- O2-0.1SO2

31
Class C ash CO2-20%H2O
Mode of Reaction with Class C Ash
1 h
50 h
1100 °C Ni-30Co-27Cr-12Al-0.1Y
new α-Al2O3 (repassivation)
Cr2O3 Al-free metal
mixed oxide
new α-Al2O3 (repassivation)
Cr2O3
Al2O3 protrusions
original Al2O3
α-Al2O3
CO2-20%H2O, no deposit, 50 h
With no deposit, all alloys studied formed external Al2O3 scales in all atmospheres

32 Extent of degradation decreases with increasing β fraction.
γ Al2O3
Ni-30Co-30Cr-12Al-0.1Y (γ-16β)
mixed oxide
Effect of Alloy Composition
Ni-30Co-27Cr-16Al-0.1Y (γ-34β)
γ Al2O3
β
ash
β
γ
Al2O3 ash
mixed oxide
Ni-19Co-15Cr-24Al-0.1Y (γ-65β)
1100 °C, 50 h CO2-20%H2O
NiCoCrAl Pseudo-ternary diagram xCo = 0.3 T = 1100 °C
Ni xCr
xAl
γ
β
16 % β 34 % β
65 % β
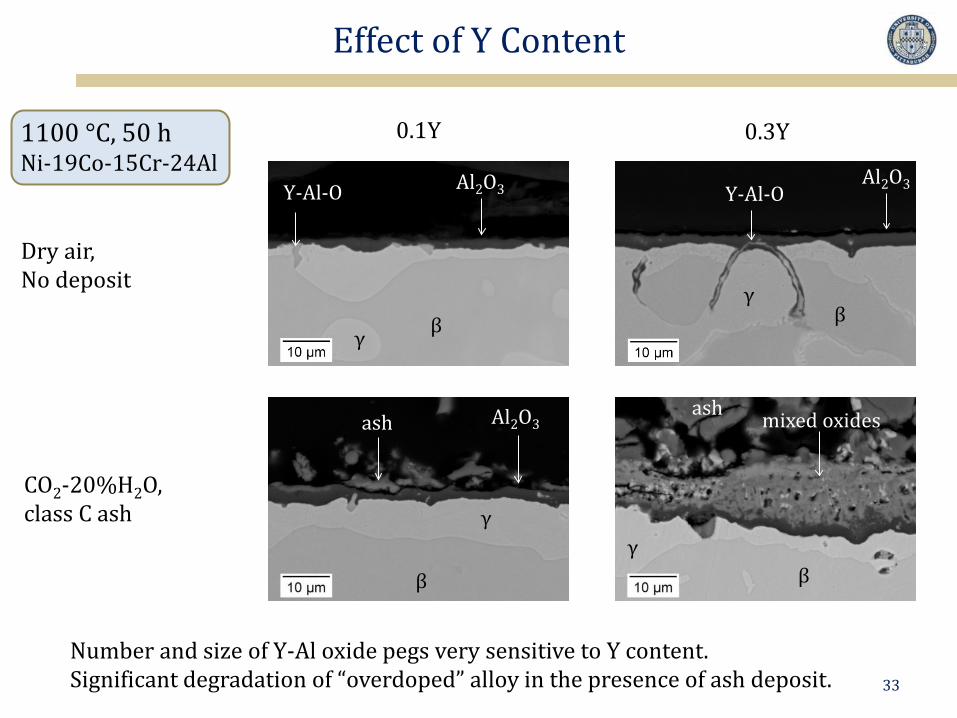
33
0.3Y 0.1Y
Number and size of Y-Al oxide pegs very sensitive to Y content. Significant degradation of “overdoped” alloy in the presence of ash deposit.
β
γ
Al2O3 ash
Effect of Y Content
β γ
ash mixed oxides
β γ
Y-Al-O Al2O3
β γ
Y-Al-O Al2O3
Dry air, No deposit
CO2-20%H2O, class C ash
1100 °C, 50 h Ni-19Co-15Cr-24Al

34
Factors Considered in the Study
Alloy • phase compositions • γ-β fractions • Y content
Environment • temperature • gas
(air vs CO2-H2O) • 𝑝𝑝O2 , 𝑝𝑝SO3
Deposit • sulfates • oxides
Factors affecting fly-ash corrosion
1. Experimental protocol 2. Reactivity of class C ash,
effect of alloy composition 3. Reactivity of individual
oxides: CaO 4. Interactions between oxide
and sulfate constituents, and gas 𝑝𝑝SO3 and temperature

35
1100 °C, 50 h dry air
CaO
SiO2
MgO α-Fe2O3
Al2O3
Ni-19Co-16Cr-23Al-0.1Y (γ-65β)
Exposure to Individual Oxides
Thermally grown Al2O3 reacts at a significant rate with CaO and MgO
CxAy Al2O3 Al2O3 MgAl2O4 Al2O3
Al2O3 Al2O3
36
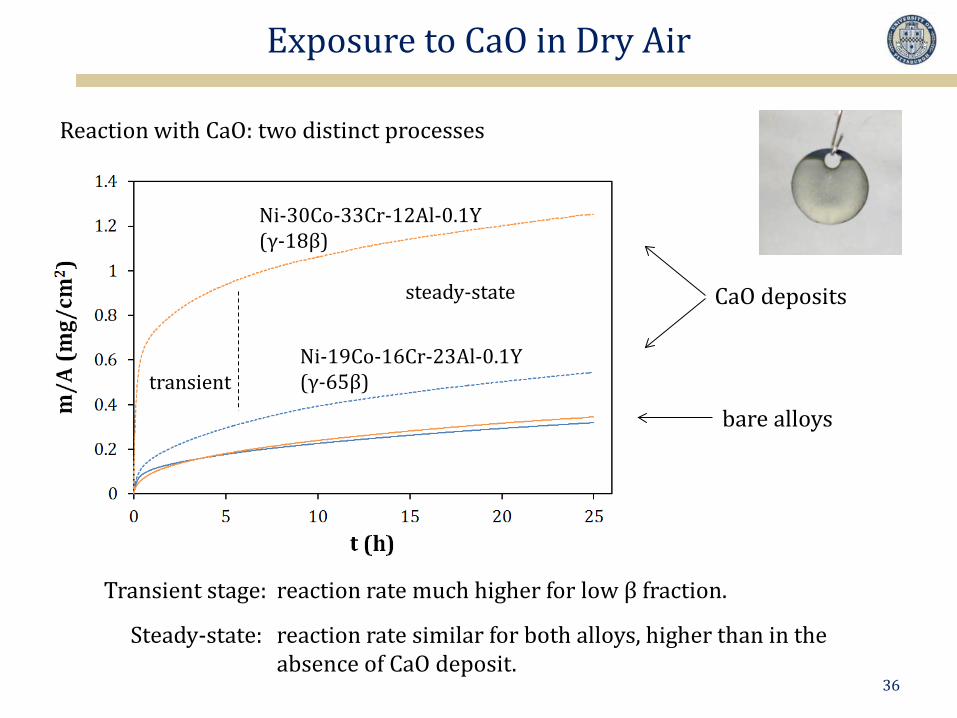
Exposure to CaO in Dry Air
bare alloys
CaO deposits
Ni-19Co-16Cr-23Al-0.1Y (γ-65β)
steady-state
transient
Transient stage: reaction rate much higher for low β fraction.
Steady-state: reaction rate similar for both alloys, higher than in the absence of CaO deposit.
Reaction with CaO: two distinct processes
Ni-30Co-33Cr-12Al-0.1Y (γ-18β)

Ni-30Co-33Cr-12Al-0.1Y (γ-18β)
Reaction rate decreases when alloy passivates.
α-Al2O3 CxAy
(Ni,Co)O Ca-Cr-O
Low β alloys
37
Exposure to CaO in dry air
1100 °C, 50 h Reaction with CaO: two distinct processes
CxAy
α-Al2O3
γ β
Ni-19Co-16Cr-23Al-0.1Y (γ-65β)
Steady-state reaction of CaO with TGO to form xCaO-yAl2O3 layers; minimal alloy consumption.
High β alloys

38
CaO-Cr2O3 phase diagram
adapted from Kaiser et al, J. Am. Ceram. Soc. 1992
CaO + Ca5(CrO4)3O
Ca 5
(CrO
4)3O
Ca5(CrO4)3O + CaCrO4
CaO + 9CaO·4CrO3·Cr2O3 ”941
”
CaO + Ca5Cr3O12
Ca 5
Cr 3
O12
L
eutectic at 1061 °C
Reaction CaO-Cr2O3 to form a liquid (K.T. Chiang, G.H. Meier, R.A. Perkins, J. Materials for Energy Systems, 1984)
α-Al2O3 CxAy
Exposure to CaO in Dry Air
1100 °C
(Ni,Co)O Ca-Cr-O
γ composition (at. %): Ni Co Cr Al 23 32 37 8.2
Ni-30Co-33Cr-12Al-0.1Y (γ-18β)

39
adapted from Kaiser et al, J. Am. Ceram. Soc. 1992
γ composition (at. %): Ni Co Cr Al 23 32 37 8.2
(Ni,Co)O Ca-Cr-O
α-Al2O3 CxAy
→ as γ is consumed, Al is rejected until Al2O3 can form
Exposure to CaO in Dry Air
CaO CaCr2O4
CaAl2O4
liq.
C12A7
C3A
CrHy (3CaO·3Al2O3·CaCrO4)
Ca5(CrO4)3 Ca3(CrO4)2
1100 °C
low Al2O3 solubility in liquid phase
Metastable phase diagram Ni-30Co-33Cr-12Al-0.1Y
(γ-18β)

40
low β alloy high β alloy transient Cr2O3
γ connected highly susceptible to
transient attack
γ isolated non-susceptible to
transient attack
Susceptibility to transient attack determined by distribution of Cr-rich γ phase in alloy
Exposure to CaO in dry air
! In service conditions (thermal cycles), reaction product spallation will cause transient stage to be repeated.
Transient attack extremely severe for 100 % γ alloy
Ni-33Co-35Cr-7Al-0.1Y, 50 h at 1100 °C
no passivation
> 150 µm

41
How does Al2O3 reaction to form xCaO-yAl2O3 affect Al consumption ?
CxAy
α-Al2O3
50 h, 1100 °C
Exposure to CaO in Dry Air
Ni-19Co-16Cr-23Al-0.1Y (γ-65β)

42
Analytical solution:
d𝑋𝑋d𝑡𝑡
=𝑝𝑝2𝑋𝑋
− 𝛼𝛼𝑞𝑞
2 𝑞𝑞𝑡𝑡
Kinetics of Al2O3 formation-destruction
Al2O3 growth rate equation:
𝑋𝑋2 = 𝑘𝑘𝑡𝑡
NiCoCrAlY
Al2O3
CaO
O2-
Ca2+, O2-
O2-
Al
𝑌𝑌
X
CAx
CaO deposit: enhanced Al consumption → decreased lifetime Example: 190 µm bondcoat
Time for β depletion through half-thickness No deposit: 31,000 h CaO: 16,000 h i.e., 48 % reduction
thic
knes
s (µ
m)
𝑘𝑘 =122𝑝𝑝 + 𝛼𝛼2𝑞𝑞 − 𝛼𝛼 𝑞𝑞 4𝑝𝑝 + 𝛼𝛼2𝑞𝑞

43
Factors Considered in the Study
Alloy • phase compositions • γ-β fractions • Y content
Environment • temperature • gas
(air vs CO2-H2O) • 𝑝𝑝O2 , 𝑝𝑝SO3
Deposit • sulfates • oxides
Factors affecting fly-ash corrosion
1. Experimental protocol 2. Reactivity of class C ash,
effect of alloy composition 3. Reactivity of individual
oxides: CaO 4. Interactions between oxide
and sulfate constituents, and gas 𝒑𝒑𝐒𝐒𝐎𝐎𝟑𝟑 and temperature

44
Role of Ash Oxide and Sulfate Contents
Synthetic C-ash C-ash with no sulfates
Combination of sulfates and oxides is needed to cause alloy degradation.
Sulfates only (Na2SO4)
1100 °C
Ni-30Co-30Cr-12Al-0.1Y CO2-20%H2O
Class C ash (wt. %)
SiO2 Al2O3 CaO Fe2O3 MgO Na2SO4 K2SO4
26 20 33 6 8 5 1
Ni-30Co-30Cr-12Al-0.1Y dry air
Ni-30Co-27Cr-12Al-0.1Y dry air

45
Deposit reactivity at 1100 °C
Al2O3-30%CaO
Al2O3 CxAy
Al2O3-30%CaO-10%SiO2-10%Na2SO4
Cr2O3
new Al2O3
ash: Al2O3 + CxAy
Breakaway and repassivation; similar to class C ash reaction Acidification of Na2SO4 melt by SiO2 probable cause of Al2O3 failure
1100 °C CO2-20H2O-1.6O2 Ni-30Co-27Cr-12Al-0.1Y
Formation of xCaO-yAl2O3 layers
45

-10
-9
-8
-7
-6
-5
-4
-3
-2
800 900 1000 1100 1200
log
pSO
3
T (°C) 46
CO2-H2O-O2 O2-0.1SO2
ash + Cr, Co oxide
𝑝𝑝SO3 in O2-0.1SO2
CaO
CaSO4
1100 °C Al2O3-CaO
CaSO4 = CaO + SO3
→ CaO is not stable in O2-0.1SO2
Consumption of Al2O3: xAl2O3 + yCaO = CxAy
Al2O3 CxAy
Al2O3
Effect of 𝑝𝑝SO3 at 1100 °C

-10
-9
-8
-7
-6
-5
-4
-3
-2
800 900 1000 1100 1200
log
pSO
3
T (°C) 47
𝑝𝑝SO3 in O2-0.1SO2
CaSO4
3CaSO4 + Al2O3 = C3A + 3SO3
CaSO4 + 6Al2O3 = CA6 + SO3
CaSO4 + Al2O3 = CA + SO3
CA
C3A
CA6
1100 °C Al2O3-CaO
→ CaSO4 is more stable than the aluminates (i.e., CaO is neutralized)
CO2-H2O-O2 O2-0.1SO2
ash + Cr, Co oxide Al2O3
CxAy Al2O3
Effect of 𝑝𝑝SO3 at 1100 °C

Effect of Temperature on CaO Reactivity
48
1100 °C 900 °C
(Ni,Co)O ash: Al2O3 + CxAy
mixed oxides Al2O3 CxAy
ash: Al2O3 + CxAy
CO2-20H2O-1.6O2 Al2O3-CaO Ni-30Co-27Cr-12Al-0.1Y
CxAy layers + continuous Al2O3 → alloy passivated
Mixed oxides + Al2O3 protrusions → no passivation

49
Kinetics of Al2O3–CaO Reaction
d𝑋𝑋d𝑡𝑡
=𝑝𝑝2𝑋𝑋
− 𝛼𝛼𝑞𝑞
2 𝑞𝑞𝑡𝑡
𝑋𝑋2 = 𝑘𝑘𝑡𝑡
𝑘𝑘 =122𝑝𝑝 + 𝛼𝛼2𝑞𝑞 − 𝛼𝛼 𝑞𝑞 4𝑝𝑝 + 𝛼𝛼2𝑞𝑞
NiCoCrAlY
Al2O3
CaO
CAx
O2-
Ca2+, O2-
O2-
Al
𝑌𝑌
X
p: parabolic constant for pure oxidation, from TGA with no deposit q: parabolic growth rate of CxAy, from thickness measurements
Net growth rate of Al2O3
Minimum Al concentration to sustain Al2O3 growth (Wagner’s analysis)
NiCoCrAlY
Al2O3
𝑗𝑗Alalloy
𝑗𝑗Aloxide
𝑗𝑗Alalloy =
𝑁𝑁Al0 − 𝑁𝑁Al
𝑖𝑖
𝑉𝑉alloy𝐷𝐷�AlNi
𝜋𝜋𝑡𝑡
𝑗𝑗Aloxide =
1𝑉𝑉oxide
𝑘𝑘2𝑡𝑡 limiting case 𝑁𝑁𝐴𝐴𝐴𝐴𝑖𝑖 = 0
𝑗𝑗Alalloy = 𝑗𝑗Al
oxide
𝑁𝑁Al0 =
2𝑉𝑉𝑎𝑎𝐴𝐴𝐴𝐴𝑎𝑎𝑎𝑎𝑉𝑉𝑎𝑎𝑜𝑜𝑖𝑖𝑜𝑜𝑜𝑜
𝜋𝜋𝑘𝑘2𝐷𝐷�Al
Ni

50
CO2-H2O-O2 Al2O3-30%CaO
Alloy composition: Ni-30Co-27Cr-12Al-0.1Y
(at. %) 1100 °C 900 °C (extrapolated)
α-Al2O3 α-Al2O3 θ-Al2O3
min 𝑁𝑁Al0 1.4 0.3 11.1
𝑁𝑁Al0 in γ 9.9 6.3
α-Al2O3
θ-Al2O3
γ-Al2O3
graph adapted from H.J. Grabke, Intermetallics 7 (1999)
Kinetics of Al2O3–CaO Reaction
1100 °C 900 °C
mixed oxides Al2O3 CxAy (= xCaO-yAl2O3)
Al2O3-30%CaO
-10
-9
-8
-7
-6
-5
-4
-3
-2
800 900 1000 1100 1200
log
pSO
3
T (°C)
𝑝𝑝SO3 in O2-0.1SO2
CaSO4
CA
C3A
CA6
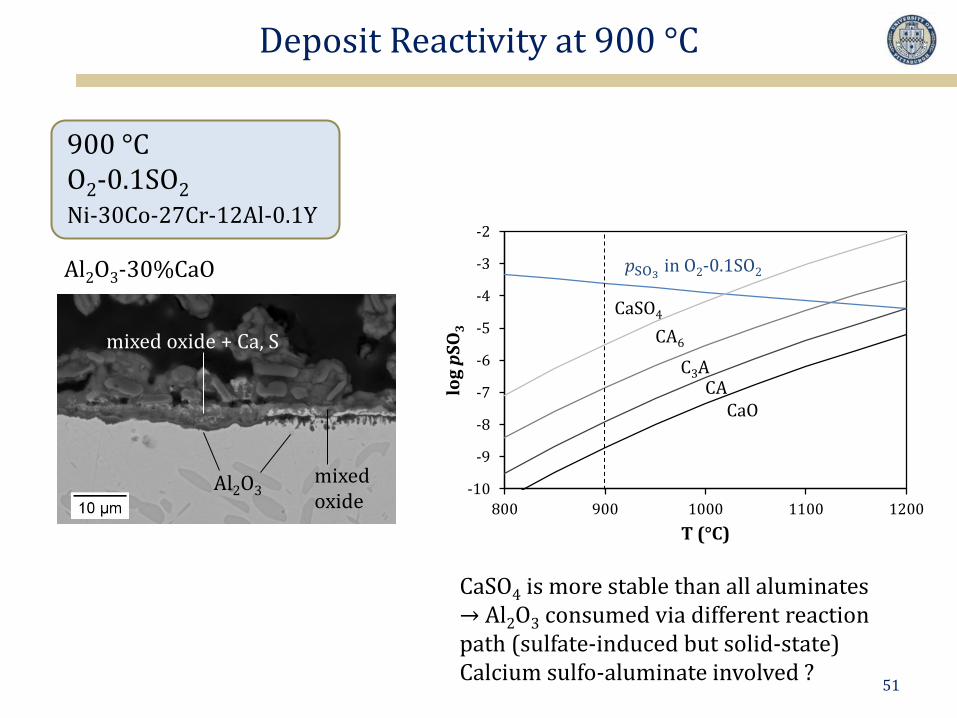
CaSO4 is more stable than all aluminates → Al2O3 consumed via different reaction path (sulfate-induced but solid-state) Calcium sulfo-aluminate involved ?
CaO
51
Deposit Reactivity at 900 °C
900 °C O2-0.1SO2 Ni-30Co-27Cr-12Al-0.1Y
Al2O3 mixed oxide
mixed oxide + Ca, S
52
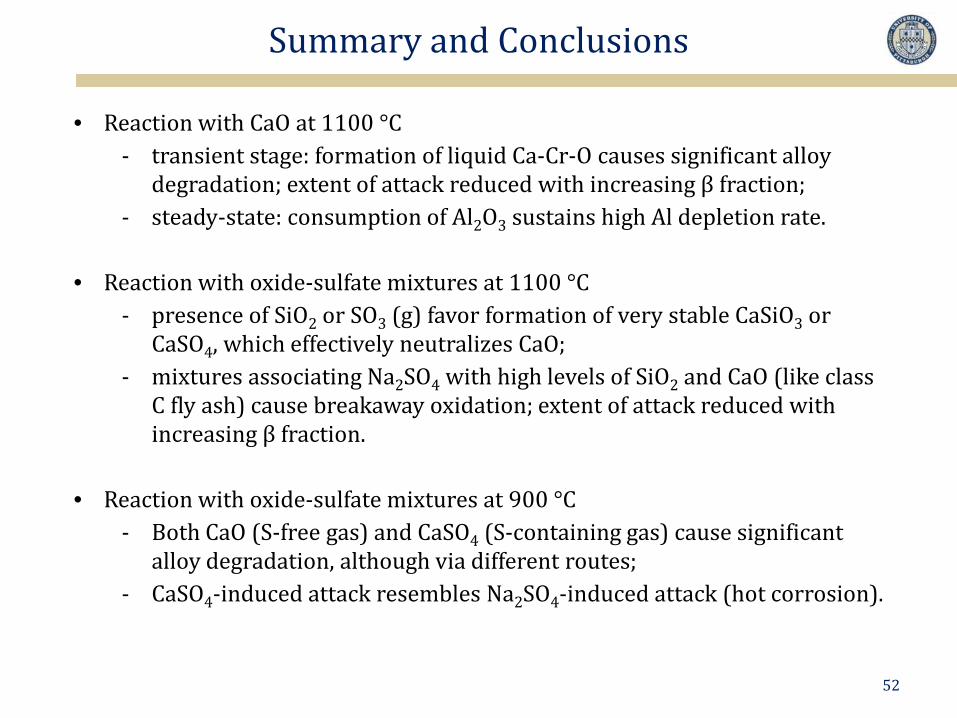
Summary and Conclusions
• Reaction with CaO at 1100 °C - transient stage: formation of liquid Ca-Cr-O causes significant alloy
degradation; extent of attack reduced with increasing β fraction; - steady-state: consumption of Al2O3 sustains high Al depletion rate.
• Reaction with oxide-sulfate mixtures at 1100 °C
- presence of SiO2 or SO3 (g) favor formation of very stable CaSiO3 or CaSO4, which effectively neutralizes CaO;
- mixtures associating Na2SO4 with high levels of SiO2 and CaO (like class C fly ash) cause breakaway oxidation; extent of attack reduced with increasing β fraction.
• Reaction with oxide-sulfate mixtures at 900 °C - Both CaO (S-free gas) and CaSO4 (S-containing gas) cause significant
alloy degradation, although via different routes; - CaSO4-induced attack resembles Na2SO4-induced attack (hot corrosion).

53
• Different modes of degradation may involve conflicting alloy requirements; compromise is needed depending on application of interest;
• It is critical to fine tune the amount of reactive elements like Y.
Summary and conclusions
beneficial
detrimental
high xCr high fβ

54
Thank you for your attention

55
Additional slides (bondcoat work)

56
Al,O + Ca, Mg, Si
Y-Al-O + Cr, Ca, Mg, Si
Y-Al-O Y-Al-O + Cr, Ni, Co Y-Al-O
Y2O3
Yttrium-rich pegs are involved in severe alloy attack. Situation similar to type II hot corrosion*. *M. Task, PhD thesis, University of Pittsburgh (2012)
0.3Y version
Effect of Y content
1100 °C, 50 h Ni-19Co-15Cr-24Al

Corrosion testing
CaO deposit in lab air, 50h, 1100 °C
Better resistance with - low xCr - high fβ
xCaO-yAl2O3
Al2O3
(Ni,Co)O Ca-Cr-O
xCaO-yAl2O3
Ni,Co xCr
xAl
γ γ+σ
β
β+γ
Al2O3
xCaO-yAl2O3

Corrosion testing
Ni,Co xCr
xAl
γ γ+σ
β
β+γ
Better resistance with - high xCr - low fβ
type I hot corrosion: Na2SO4, O2-1000 ppm SO2, 20 h 900 °C
mixed oxide
Cr-rich oxide Al2O3
protrusions
(Ni,Co)O
Cr-rich oxide Cr-rich sulfide
Al,Cr oxide
mixed oxide
Al,Cr sulfide
mixed oxide

59
Moving forward: • Study of alloy and thermally grown Al2O3 reaction with sulfates;
relation with type I hot corrosion.
• Use of computational thermodynamics to design alloys which allow systematic investigation of effect of phase fraction vs phase composition; application to various types of degradation. Examples included here: CaO corrosion at 1100 °C, Na2SO4 corrosion at 900 °C (type I hot corrosion)

Al2O3-CaO-SiO2-Na2SO4
Deposit Reactivity at 900 °C
900 °C O2-0.1SO2 Ni-30Co-27Cr-12Al-0.1Y
Al2O3-CaO
Al2O3 mixed oxide
mixed oxide + Ca, S
ash original Al2O3 Cr2O3
Al2O3 protrusions
Local Al2O3 failure due to reaction with CaSO4 or Na2SO4

CMAS Failure
A. G. Evans, D. R. Clarke and C. G. Levi: J. Eur. Ceram. Soci., 2008, 28, (7), 1405–1419.
Common Modes of TBC Failure
Calcium Magnesium Alumino Silicate (CMAS): • Deposits contain CaO-MgO-Al2O3-SiO2 • Melting at high temperatures ≥1250°C • Molten deposit infiltrates top coat • Thermo-chemical interactions with YSZ • Thermo-mechanical interactions
61

CMAS
62
Dissolution of YSZ into CMAS melt Re-precipitation of ZrO2 with different microstructure and composition
YSZ+CMAS, 1300°C, 4h
Unaffected YSZ
CMAS
Reprecipitated ZrO2 grains
Thermo-Chemical Effects CMAS
Thermo-Mechanical Effects
C. Mercer, S. Faulhaber, A. G. Evans and R. Darolia, Acta Materialia, vol. 53, pp. 1029-1039, 2005
Surface above melting point of CMAS Cooling: delamination of TBC in infiltrated regions as a result of ΔE and ΔCTE
YSZ+CMAS, 1300°C, 4h
P. Mohan, T. Patterson, B. Yao, Y. Sohn, J. Thermal Spray Tech., 19(1-2) pp. 156-167, 2010

63
Kinetics of Al2O3 formation-destruction
NiCoCrAlY
Al2O3
CaO
O2-
Kinetics Transport Reaction
2Al3+ + 3O2- = Al2O3
Ca2+, O2-
CaO = Ca2+ + O2-
O2-
→ Al2O3 net growth:
Al2O3 formation
CxAy growth
d𝑋𝑋d𝑡𝑡
=d𝑋𝑋 f
d𝑡𝑡+
d𝑋𝑋 d
d𝑡𝑡=
𝑝𝑝2𝑋𝑋
− 𝛼𝛼𝑞𝑞2𝑌𝑌
d𝑋𝑋 f
d𝑡𝑡=
𝑝𝑝2𝑋𝑋
d𝑌𝑌d𝑡𝑡
=𝑞𝑞2𝑌𝑌
= −𝑉𝑉CxAy𝑦𝑦𝑉𝑉Al2O3
d𝑋𝑋 d
d𝑡𝑡
Al
Y
X
Al2O3 destruction
i.e. d𝑋𝑋d𝑡𝑡
=𝑝𝑝2𝑋𝑋
− 𝛼𝛼𝑞𝑞
2 𝑞𝑞𝑡𝑡
xCa2+ + xO2- + yAl2O3 = CxAy
d𝑌𝑌d𝑡𝑡
=𝑞𝑞2𝑌𝑌
Y(0) neglected 𝑌𝑌2 = 𝑞𝑞𝑡𝑡
CxAy
𝛼𝛼 =𝑦𝑦𝑉𝑉Al2O3𝑉𝑉CxAy
=
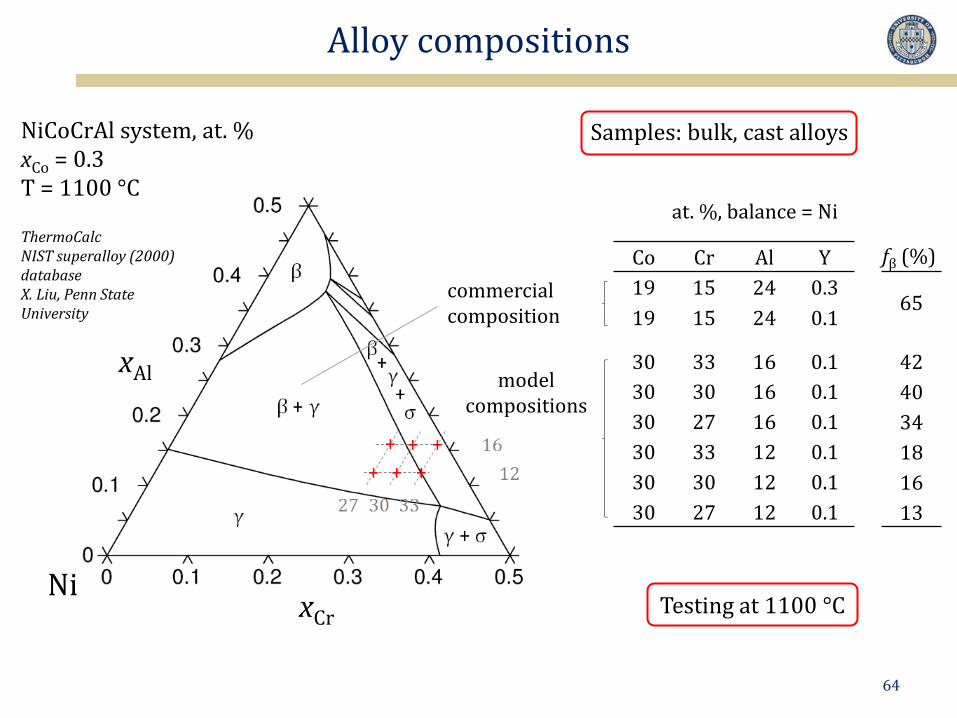
Alloy compositions
64
Co Cr Al Y fβ (%) 19 15 24 0.3
65 19 15 24 0.1
30 33 16 0.1 42 30 30 16 0.1 40 30 27 16 0.1 34 30 33 12 0.1 18 30 30 12 0.1 16 30 27 12 0.1 13
at. %, balance = Ni
commercial composition
model compositions
Ni xCr
xAl
NiCoCrAl system, at. % xCo = 0.3 T = 1100 °C ThermoCalc NIST superalloy (2000) database X. Liu, Penn State University
Testing at 1100 °C
Samples: bulk, cast alloys

27Cr 30Cr 33Cr
12Al
16Al
Low magnification micrographs
γ
β
σ β
β
β β
β
γ
γ
γ γ γ
σ σ
65
Appendix

Phase volume fractions
Phase compositions
# γ β σ 3 87 13 4 84 16 5 81 18 1.0 6 66 34 7 59 40 1.6 8 36 42 22
γ β σ # Co Cr Al Co Cr Al Co Cr Al 3 32 29 10 17 10 33 4 32 33 8.5 18 11 32 5 32 37 8.2 19 14 33 28 58 3.3 6 34 35 8.4 21 12 33 7 35 37 7.8 22 14 32 30 57 3.3 8 37 37 7.6 23 14 32 31 57 3.3
Determined by SEM-EDS at. %, balance = Ni
Determined by image analysis from SEM micrographs (cross-section)
66
Appendix

67
Oxidation (no deposit)
0
0.1
0.2
0.3
0.4
0.5
0.6
0.7
Δm/A
(mg/
cm2 )
AA
BA
CA
DA
Weight changes
dry air air – 20H2O CO2 – 20H2O CO2 – 20H2O – 1.6O2
27Cr 30Cr 33Cr 27Cr 30Cr 33Cr
16Al 12Al 15Cr-24Al
0.3Y 0.1Y
Δm/A (t = 10 h, 50 h) → kp ~ 8 x 10-13 g2cm-4s-1
typical of α-Al2O3 at 1100 °C
1100 °C, 50 h
All alloys form Al2O3 in all atmospheres

68
0
0.5
1
1.5
2
2.5
3
3.5airCO2-H2O
27Cr 30Cr 33Cr 27Cr 30Cr 33Cr
16Al 12Al
dry air CO2-20H2O
Oxidation (no deposit)
1100 °C, 50 h Weight gain (mg/cm2)
dry air
33Cr-12Al (γ-18β) 30Cr-16Al (γ-40β)
Scale thickness (µm)
• Thinner Al2O3 scales in CO2-H2O
• In air, less transient oxidation with higher β fraction

69
Oxidation (no deposit)
dry air CO2-20H2O
33Cr-12Al (γ-18β)
27Cr-12Al (γ-13β)
All alloys form Al2O3 in all atmospheres (high Cr and Al contents, Al2O3 does not form volatile compound, good barrier to carbon)
Thinner scales in CO2-H2O than in air.
Al2O3
γ
Al2O3
γ
Al2O3
γ
Al2O3
γ
1100 °C, 50 h

70
Commercial ash Synthetic mixture
Ni-30Co-30Cr-12Al-0.1Y 1100 °C, 50 h CO2-H2O
Complex reaction morphology induced by reaction with commercial fly ash is reproduced using a synthetic mixture → ability to test various deposit compositions
γ γ α-Al2O3
Cr2O3 (Ni,Co)O
Experimental protocol
α-Al2O3
Cr2O3 (Ni,Co)O
mixed oxide mixed oxide
Class C ash (wt. %)
SiO2 Al2O3 CaO Fe2O3 MgO Na2SO4 K2SO4
26 20 33 6 8 5 1

71
33Cr-12Al (γ-18β)
Non-uniform degradation. Locally thick reaction product, contains large amounts of alloy constituents.
ash
Al2O3
685 690 695 700Wavelength (nm)
α-Al2O3
Absence of θ doublet
Photo-stimulated luminescence spectroscopy
Exposure to C-ash in CO2-H2O

72
Class C ash 1 h exposures
Effect of gas composition
1 h
1100 °C Ni-30Co-27Cr-12Al-0.1Y
N2-21O2
CO2-20H2O-1.6O2
AlN
No particular effect of CO2, H2O or low 𝑝𝑝O2 Nitridation due to N2 in air
CO2-20H2O (eq. pO2 40 ppm)
α-Al2O3
CO2-H2O, no deposit, 50 h
Absent a deposit, all alloys studied formed external Al2O3 scales in all atmospheres

73
from Phase diagrams for ceramists, vol. 1, Levin et al, eds (1964)
CxAy
α-Al2O3
γ β
T (°
C)
2300
2100
1900
1700
1500
1300
CaO Al2O3 20 40 60 80
CaO + liq.
CaO + C3A
C12A7 C12A7 wt. % CA+ C3A+
CA +
CA2
CA2 +
CA6 Al2O
3 + C
A 6
Al2O3 + liq.
CA6 + liq.
CA2 + liq.
CA + liq. C3A +
liq.
C3A C12A7 CA CA2 CA6
CaO
1100 °C, 50 h
Interaction deposited oxide-TGO with consumption of Al2O3, but no significant loss of alloy constituents.
Exposure to CaO in dry air
Ni-19Co-16Cr-23Al-0.1Y (γ-65β)

74
t < 5 h thick top layer, α-Al2O3 established 5 < t < 50 h only xCaO-yAl2O3 layers grow → top layer formation is rapid, then stops (i.e., transient)
5 h 50 h
1100 °C
Exposure to CaO in dry air
α-Al2O3 CxAy
(Ni,Co)O Ca-Cr-O
α-Al2O3 CxAy
(Ni,Co)O Ca-Cr-O
Ni-30Co-33Cr-12Al-0.1Y (γ-18β)

75
Preoxidation prevents rapid transient attack
10 h preoxidation, 40 h CaO
Ca-Cr-O
α-Al2O3 CxAy
no preoxidation, 50 h CaO
α-Al2O3 CxAy
γ
(Ni,Co)O
1100 °C
Exposure to CaO in dry air
Ni-30Co-33Cr-12Al-0.1Y (γ-18β)

76
Large β fraction → same mechanism occurs to a lower extent (alloy degradation is more rapidly undercut by Al2O3).
(Ni,Co)O Ca-Cr-O
CxAy
α-Al2O3 γ
β
5h, 1100 °C
Exposure to CaO in dry air
(Ni,Co)O Ca-Cr-O
CxAy α-Al2O3 γ
Ni-30Co-33Cr-12Al-0.1Y (γ-18β)
Ni-19Co-16Cr-23Al-0.1Y (γ-65β)

Ash-induced degradation: reaction mechanism
77
1 h
250 h
50 h 250 h
γ+AlN
γ – no AlN
Case of dry air Evolution of the reaction morphology with reaction time

78
Deposit reactivity at 1100 °C
Al2O3-CaO
Al2O3-SiO2-CaO
+ SiO2
ash + Cr,Co,Ni oxides
Al2O3 CxAy (= xCaO-yAl2O3)
+ Na2SO4
ash: Al2O3 + CaSiO3
Al2O3-SiO2-CaO-Na2SO4
Cr2O3
new Al2O3
ash: Al2O3 + CxAy
acidification of Na2SO4 melt by SiO2 ?
Al2O3
1100 °C CO2-H2O-O2 Ni-30Co-27Cr-12Al-0.1Y

79
CaSO4
CaSO4
contains Al, Cr, Ca, S
Reaction product yet to be identified but significant amounts of Al and Cr have reacted with CaSO4
Al2O3-CaO
ash: Al2O3+CaSO4
Deposit reactivity at 900 °C
900 °C O2-SO2 Ni-30Co-27Cr-12Al-0.1Y

SiO2-CaO ash: SiO2+CaSiO3+CaSO4
CaSO4 more stable than CaSiO3 → neutralization not effective
Al2O3 + SiO2
Al2O3-CaO
ash: Al2O3+CaSO4
Deposit reactivity at 900 °C
900 °C O2-SO2 Ni-30Co-27Cr-12Al-0.1Y

81
TBCs Provided by PST
dSpecimen Group #
Substrate Alloy
Bond Coat Type
Bond Coat Thickness
(mils) TBC Powder
TBC Density (%T.D.)
TBC Thickness
(mils) Quantity
1a René N5 Dual Layer NiCoCrAlY
7-8 High Purity
YSZ 85 15 10
1b PWA 1484 Dual Layer NiCoCrAlY
7-8 High Purity
YSZ 85 15 13
2a René N5 Dual Layer NiCoCrAlY
7-8 High Purity
YSZ 92 15 10
2b PWA 1484 Dual Layer NiCoCrAlY
7-8 High Purity
YSZ 92 15 13
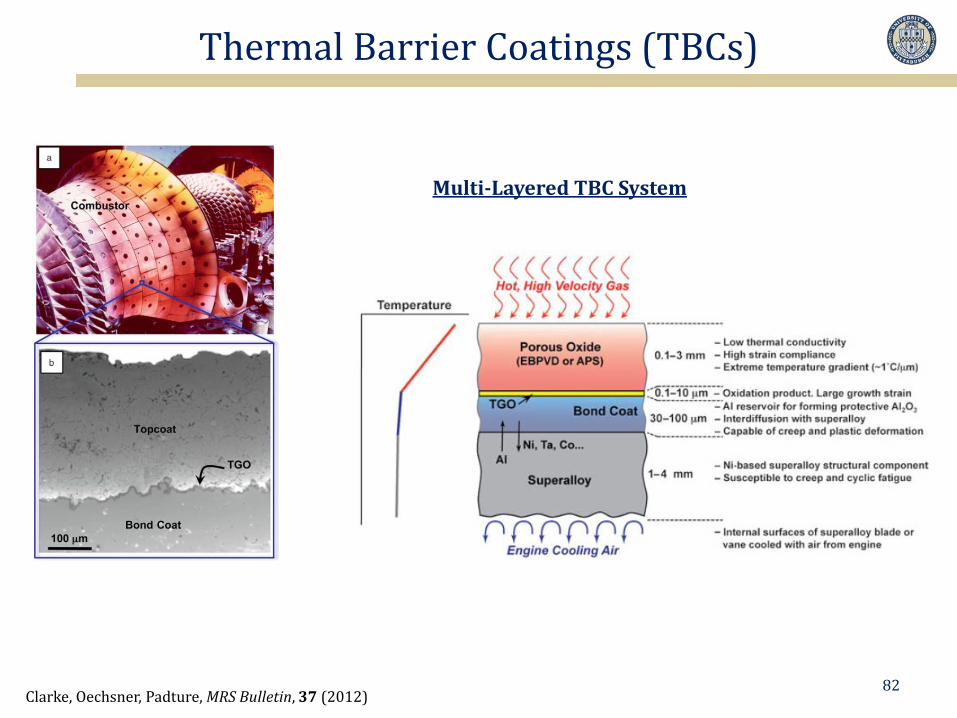
Thermal Barrier Coatings (TBCs)
Clarke, Oechsner, Padture, MRS Bulletin, 37 (2012)
Multi-Layered TBC System
82

Thermal Barrier Coatings (TBCs)
83
Yttria Stabilized Zirconia (YSZ) Top Coat
• ZrO2: low thermal conductivity • High resistance to thermal cycling • ~7wt% Y2O3: t’ phase Clarke, Oechsner, Padture, MRS Bulletin, 37 (2012)
R.C. Reed, The Superalloys: Fundametals and Applications, Cambridge (2006).

Cyclic TBC Exposure to High-SiO2 Ash
“High-SiO2” Ash+.1K2SO4 Wt% SiO2 45 Al2O3 22.5 CaO 9 Fe2O3 9 MgO 4.5 K2SO4 10
84
Early Failure of HPLD TBCs with “high-SiO2” ash with K2SO4
• Failure determined by complete delamination of top coat • Significant damage to YSZ before complete failure
Dry Air Air+Steam
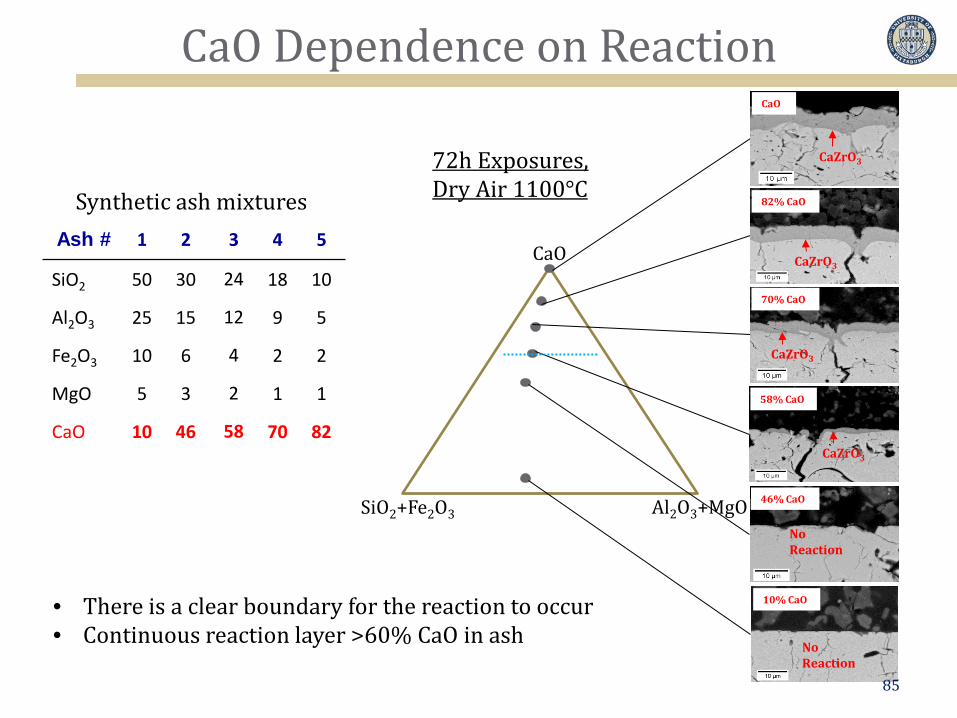
CaO Dependence on Reaction
CaO
SiO2+Fe2O3 Al2O3+MgO
• There is a clear boundary for the reaction to occur • Continuous reaction layer >60% CaO in ash
72h Exposures, Dry Air 1100°C
46% CaO
No Reaction
10% CaO
No Reaction
CaO
CaZrO3
82% CaO
CaZrO3
70% CaO
CaZrO3
58% CaO
CaZrO3
Ash # 1 2 3 4 5
SiO2 50 30 24 18 10
Al2O3 25 15 12 9 5
Fe2O3 10 6 4 2 2
MgO 5 3 2 1 1
CaO 10 46 58 70 82
Synthetic ash mixtures
85

TBC Failure After Cyclic Exposure
Comparison of failure: High-CaO Ash+5%FeS+5%K2SO4
HPLD Top Coat Failure DVF Top Coat Failure
86
Failure along TGO/BC Interface
Failure in YSZ far from TGO
Location of TBC spallation is different.

TBC Failure After Cyclic Exposure
Mixed Ni-Co-Cr-Al-Y Oxides
TBC Failure after 444 Cycles at 1100°C Synthetic Ash (70%CaO) + 5%FeS + 5%K2SO4
Bond Coat
TGO
YSZ
87
TBC Failure after 1200 Cycles at 1100°C without deposit
Similar failure, but ash causes failure to occur early.

Cyclic Exposure to High-SiO2 Ash
88
HPLD TBC high-SiO2 Ash + 0.10K2SO4 Dry Air 260 Cycles: Re-apply every 20 cycles
Si, K, O
HPLD TBC high-SiO2 Ash + 0.10K2SO4 Air+20%H2O

Reactions of Fly Ash with YSZ
1300 °C, 100h
Free-standing YSZ isothermal exposure to C-Ash in dry air 1300°C.
89
Destabilization of t’ phase from liquid fly-ash interaction with YSZ.
Hamilton; Nagelberg, Journal of the American Ceramic Society, 67[10], pp. 686-690 (1984).
Raman spectra used to identify change from t’ phase

Temperature Dependence of Reaction
X
X
Different ratios of oxides can result in different melting point.
Melted ash penetrated into YSZ
Adapted from Eriksson, et al, Metallurgical Transactions B, 24B (1993) 807-816.
Class C Ash 1200 °C, 24h in Dry Air
90