deformation csg - spe74561.pdf
TRANSCRIPT

Copyright 2002, IADC/SPE Drilling Conference This paper was prepared for presentation at the IADC/SPE Drilling Conference held in Dallas, Texas, 26–28 February 2002. This paper was selected for presentation by an IADC/SPE Program Committee following review of information contained in an abstract submitted by the author(s). Contents of the paper, as presented, have not been reviewed by the International Association of Drilling Contractors or the Society of Petroleum Engineers and are subject to correction by the author(s). The material, as presented, does not necessarily reflect any position of the IADC or SPE, their officers, or members. Papers presented at the IADC/SPE meetings are subject to publication review by Editorial Committees of the IADC and SPE. Electronic reproduction, distribution, or storage of any part of this paper for commercial purposes without the written consent of the Society of Petroleum Engineers is prohibited. Permission to reproduce in print is restricted to an abstract of not more than 300 words; illustrations may not be copied. The abstract must contain conspicuous acknowledgment of where and by whom the paper was presented. Write Librarian, SPE, P.O. Box 833836, Richardson, TX 75083-3836, U.S.A., fax 01-972-952-9435. ___________________________________________________________________________
Abstract Ultrasonic logging has been used extensively in Colombia, in the Andes foothills, to quantitatively evaluate casing wear and deformation. Casing strings can be lost to casing buckling, shearing and excessive wear. Active stresses applied to the casing strings from the active movement of faults contribute to the degradation of casing integrity and strength. These deformations are very costly and often cause the well bore to be abandoned or re-drilled. Imaging of the casing in planar view, 2D cross-section and in 3D perspective view are often helpful to better understand the deformation extent, location, and possible causes. A number of somewhat extreme examples of casing deformation due to active stress regimes are analyzed to demonstrate the circumstances that different size casings may be subjected to in areas of high lateral stresses. Some of these examples illustrate casing that appears damaged beyond repair, but is still holding pressure and allows entry into the well. Other casing deformation is much less extreme, but reduces the casing strength very substantially. Casing internal diameters, thicknesses, and the acoustic impedance of the material behind the casing are measured and interpreted. These measurements are then visualized using 1D, 2D, and 3D displays of the data. Correlations to geologic and geophysical events are shown in 3D to illustrate and define potential high-stress, problem areas and help in casing design for the severe environment.
Introduction-Geology of Colombia The 18 sedimentary basins in Colombia cover a total area of 1.04 million square kilometers, 80% on land and 20% offshore in the Caribbean and Pacific. The producing basins are located in several widely separated areas of Colombia with diverse geographic settings. Only 30% of the total sedimentary area is considered to have reasonable geological information, while the remaining 70% is either little known or unexplored. It is important to note that exploration maturity in Colombia is still rather low with one exploratory well per 1,000 square kilometers. The area is tectonically very active with continuous seismic activity of varying levels. The Andes mountains are the result of plate tectonics and the producing fields are not only in the foothills of the Andes where the large Cusiana and Cupiagua fields are located, but also in the forelands, and in the upper, middle and lower Magdalena valley. The maximum horizontal stress direction as shown in Figure 1 varies from NW-SE to almost E-W. Cusiana and Buenos Aires are producing fields in Colombia that produce high rates of oil and gas from sandstone formations in the Andes foothills. The Cusiana field area is located on the Eastern flank of the Andes in the foothills. The field is characterized by an over-thrust structure and active tectonism. The lithology is alternating sand-shale sequences. These formations have relatively low formation porosities of 5-6 porosity units, but have relatively good permeabilities of around 1 md at this porosity level with permeabilities rising to around 80md at 8 PU. The majority of the reservoir has an average porosity in the 5-6PU range. The wells drilled into these formations produce from 5000 to 25000 barrels of oil per day (BOPD). The three productive sand formations are Mirador, Barco and Guadalupe.
IADC/SPE 74561
Case Studies of Casing Deformation due to Active Stresses in the Andes Cordillera, Colombia. Marvin E. Markley, Schlumberger New Orleans, Nigel Last, BP Sunbury, Sandra Mendoza, Schlumberger Bogota, Colombia, Santiago Mujica, BP Bogota, Colombia

2 M. E. MARKLEY, N. LAST, S. MENDOZA, S. MUJICA IADC/SPE 74561 _________________________________________________________________________________________________________________________
Fig.1--Map of Colombia indicating major stress directions and types of stress faults encountered. Stresses around the borehole acting on the casing
Fig.2—Schematic of different stresses acting on the borehole and the casing.
In the Andes, hole stability problems are common due to the stress imbalances acting on the borehole. The minimum horizontal stress is significantly less than the maximum horizontal stress, which maybe similar or greater in magnitude to the vertical stress or overburden stress. Borehole breakout is common, especially in the weaker rocks (shales). Borehole breakout occurs in the direction of minimum horizontal stress.
Once casing is set, the stresses that have been released by drilling the borehole into the stressed formations try to re-establish equilibrium. If there is a good cement job, stresses are retransmitted to the casing almost immediately. If there is a poor cement job, the forces are transmitted to the casing after a time lag. These forces cause casing deformation and ovalization. The deformation may be substantial. This casing ovalization progresses over time and causes a reduction in casing strength as well as numerous operational problems such as casing hangers that leak and packers that will not set or leak, among others problems.
Fig.3—Schematic of compressional forces that act both over short and long intervals of casing. More catastrophic events may be associated with shear movements. Shear movements can be more sudden and may happen over a short period of time, although localized deformations have been observed to progress over time, as well.
Fig.4—Schematic of shear movement associated with faults. There have been numerous events in the field of casing “events” where the casing cannot be re-entered. These may be associated with fault movements, although correlation with the major faults in the area has not been conclusive. A signature of this type of event will be shown below. Monitoring Logs The ultrasonic log is used to monitor the progress of the casing deformation over time and to image the deformations and anomalies that are encountered. The ultrasonic imager (USI) transducer sends an ultrasonic impulse, between the frequencies of 200 and 700 kHz, and

CASE STUDIES OF CASING DEFORMATION DUE TO ACTIVE IADC/SPE 74561 STRESSES IN THE ANDES CORDILLERA, COLOMBIA 3 _________________________________________________________________________________________________________________________
then switches to receive mode. The sound impulse travels through the well fluid and strikes the casing. Most of the energy is reflected back toward the transducer.
Fig.5—Sketch of the ultrasonic tool The remaining energy enters the casing, undergoing multiple reflections between the casing/annulus surface and the casing/wellbore surface. At each surface some of the energy is reflected and some is transmitted, depending on the acoustic impedance contrast at the interface. As the acoustic impedance of the casing material and of the borehole fluid is essentially constant, the signal inside the casing decays at a rate that is dependent on the acoustic impedance of the material outside the casing. The Log Measurements The log itself makes measurements of the internal casing radius, the casing thickness, the cement quality, and casing corrosion. The presentation is as seen in Figure 6: The example in Figure 7 is a compressed ultrasonic log over 800 feet of 9 5/8in casing with a continuous ovalization of 3%. Notice that although the casing is ovalized there is no change in thickness, the cement is still apparently good, and there is no indication of internal anomalies on the amplitude image.
Fig.6—Sample ultrasonic log presentation showing the different tool measurements and whether they are derived from the first signal arrival or the frequency of the arrival. An example of the casing deformation seen in the field is shown in Figure 7.
Fig.7—Example of deformation over 800 feet of interval.

4 M. E. MARKLEY, N. LAST, S. MENDOZA, S. MUJICA IADC/SPE 74561 _________________________________________________________________________________________________________________________ Ovalization Computation Ovalization can be defined in a number of ways. For this analysis the following equation is used:
The above equation for percent ovalization has the advantage that it compensates for small differences in fluid velocity in the borehole fluid by dividing the maximum internal radius by the minimum internal radius, cancelling any effect of varying fluid velocity in the borehole. The computation is also insensitive to casing size changes, ie going from 13 3/8 to 9 5/8 to 7 inch casings. Effects of casing wear on the ovalization computation. Care must be used when quantitatively analyzing ovalization, since the maximum and minimum internal radii include the effects of casing wear. In areas of excessive wear, the ovalization computation will be pessimistic and exaggerate the value for percent ovalization.
Fig.8—Sample log with excessive casing wear. The above logged interval (Figure 8) of 9 5/8in casing shows severe wear from tripping a drill string. Any ovalization computation in this interval would be exaggerated by the amount of wear. The interval has very little ovalization.
Fig.9—A Sample log over 250 feet of casing showing severe wear, a casing hole, and excessive ovalization, without wear. In the above example (Figure 9), there is wear without ovalization, a hole, and ovalization. Statistic analysis of ovalization could exaggerate the percent ovalization if the statistics included the wear interval or the hole. To properly quantify the ovalization, the computation must correct for any wear before a time-lapse comparison can be made. This was done and only ovalization without wear was used in the time-lapse analysis of casing ovalization. To correct for the effect of wear the ovalization computation was effectively disallowed whenever the thickness computation (computed from resonance, not the first casing arrival) was greater than .045inch. The effect of this is shown in Figure 10. Composite Ovalization Data over 10 years There are various curve fits that could be done to the data, but at this time it would appear that the data suggests two trends. First, an early time trend rapidly causes some initial ovalization within the first year to about 2.5 to 3.5 % ovalization. Later in time, the data suggests that the deformation assumes a new slower trend of deformation, but does not stop or necessarily reach equilibrium. A well was analyzed that had casing set for approximately 10 years. This well marched the trend for slow continuous ovalization over time. It would be premature to make any conclusions from this limited data set, although the trends are apparent.
MaximumInternalRadius
MinimumInternalRadius− 1.0
*100 = %Ovalization

CASE STUDIES OF CASING DEFORMATION DUE TO ACTIVE IADC/SPE 74561 STRESSES IN THE ANDES CORDILLERA, COLOMBIA 5 _________________________________________________________________________________________________________________________
Fig.10 Removal of casing wear from the ovalization by using the thickness computation This data does suggest that within the operational life of the field, deformation and ovalization will be sufficient to affect any operational consideration for access to the well bore.
Fig.11—Casing Ovalization in Colombia versus time.
It has been suggested that cemented concentric casings are a possible solution to the deformation. Concentric casings are stronger and with good cement, can be substantially stronger than the individual strengths of either casing string by itself. There has been an increased use of cemented “scab liners” that give a cemented concentric casing string in a number of wells. The operational decision making process for cementing these liners will not be covered in this paper. Casing Ovality with time—Concentric Casings The below example (Figure 12) shows concentric cemented casing strings of 13 3/8in and 9 5/8in casings inside a section of 17.5in drilled borehole. Casing ovality just after the inner 9 5/8in casing was set is computed at about 1%, which is near the baseline or “noise” level for the computation. We see an average of 1% ovality in new casings.
Fig.12—An ultrasonic log in concentric casing strings with good cement with 1% ovalization. Six months later, the ovality of this cemented concentric string of casing is at 3% as shown in Figure 13. Stress anomalies around salt domes are often addressed by setting and cementing dual strings of casing. Here the stresses act through both strings.

6 M. E. MARKLEY, N. LAST, S. MENDOZA, S. MUJICA IADC/SPE 74561 _________________________________________________________________________________________________________________________
. Fig.12—The same concentric casing string 6 months later shows 3% ovalization. Even though in this interval, there is a reverse fault identified from the seismic, the rapid ovalization over a long interval is probably, however, due to a reestablishment of stresses relieved during the drilling process. The combined casing strings do deform in a short time similar to single casing strings. The long term deformation, is however less. 3D Visualization of casing deformation and wear.
Fig.13—Very short interval deformation and ovalization. Deformation may occur across a very short interval indicating an event similar to the shear movement described previously. These events can sometimes be imaged effectively using 3D visualization of the casing using the ultrasonic data.
Fig.14—3D visualization of ultrasonic data showing casing deformation and some shear movement. Care must be used when visualizing and analyzing these possible shear events. In the initial stages of these events, the casing may still hold pressure and the ultrasonic tool (and drill pipe) may still pass this point, but the image appears to show very damaged casing. The casing has been damaged such that the tool is decentered due to the “bend” in the casing and the measurement window may be lost around the tool. The tool may lose data due to the severe decentralization. These shear events may cause the wellbore to be lost quickly or may move more slowly and take years. These events are obviously very localized events over only tens of feet.
Fig.15—Ovalization of a Magdalena Valley well (9%) with orientation of maximum horizontal stress.
CASE STUDIES OF CASING DEFORMATION DUE TO ACTIVE IADC/SPE 74561 STRESSES IN THE ANDES CORDILLERA, COLOMBIA 7 _________________________________________________________________________________________________________________________
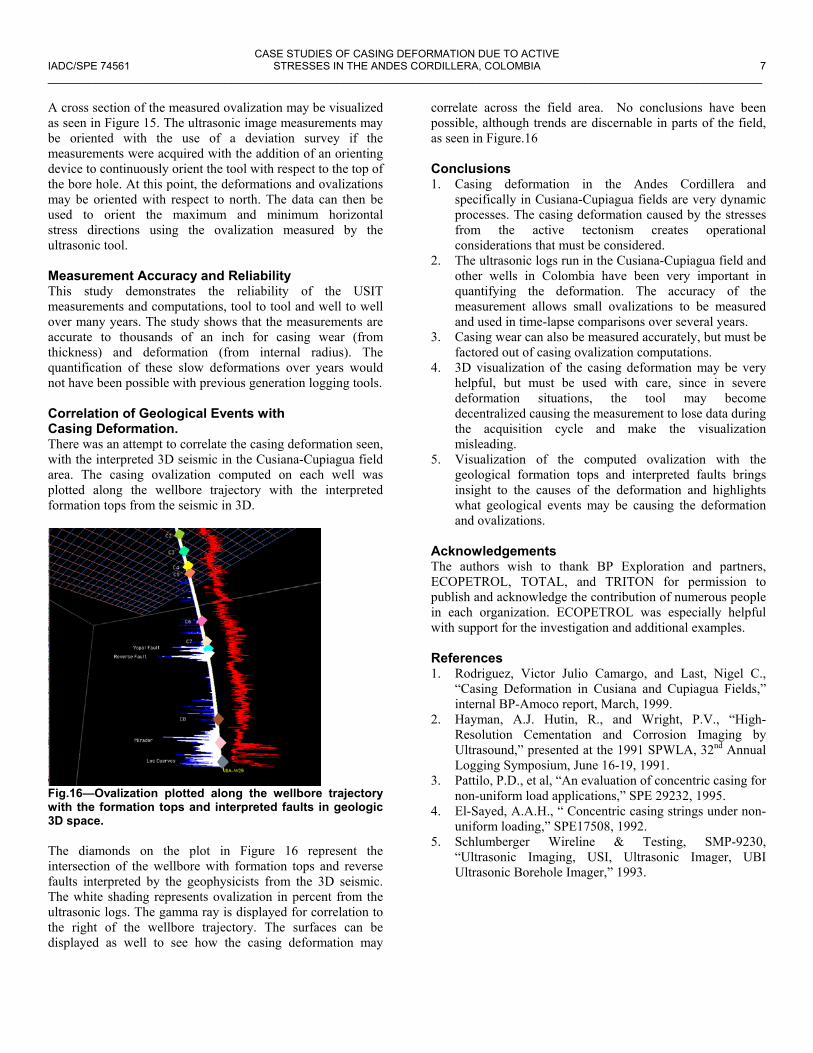
A cross section of the measured ovalization may be visualized as seen in Figure 15. The ultrasonic image measurements may be oriented with the use of a deviation survey if the measurements were acquired with the addition of an orienting device to continuously orient the tool with respect to the top of the bore hole. At this point, the deformations and ovalizations may be oriented with respect to north. The data can then be used to orient the maximum and minimum horizontal stress directions using the ovalization measured by the ultrasonic tool. Measurement Accuracy and Reliability This study demonstrates the reliability of the USIT measurements and computations, tool to tool and well to well over many years. The study shows that the measurements are accurate to thousands of an inch for casing wear (from thickness) and deformation (from internal radius). The quantification of these slow deformations over years would not have been possible with previous generation logging tools. Correlation of Geological Events with Casing Deformation. There was an attempt to correlate the casing deformation seen, with the interpreted 3D seismic in the Cusiana-Cupiagua field area. The casing ovalization computed on each well was plotted along the wellbore trajectory with the interpreted formation tops from the seismic in 3D.
Fig.16—Ovalization plotted along the wellbore trajectory with the formation tops and interpreted faults in geologic 3D space. The diamonds on the plot in Figure 16 represent the intersection of the wellbore with formation tops and reverse faults interpreted by the geophysicists from the 3D seismic. The white shading represents ovalization in percent from the ultrasonic logs. The gamma ray is displayed for correlation to the right of the wellbore trajectory. The surfaces can be displayed as well to see how the casing deformation may
correlate across the field area. No conclusions have been possible, although trends are discernable in parts of the field, as seen in Figure.16 Conclusions 1. Casing deformation in the Andes Cordillera and
specifically in Cusiana-Cupiagua fields are very dynamic processes. The casing deformation caused by the stresses from the active tectonism creates operational considerations that must be considered.
2. The ultrasonic logs run in the Cusiana-Cupiagua field and other wells in Colombia have been very important in quantifying the deformation. The accuracy of the measurement allows small ovalizations to be measured and used in time-lapse comparisons over several years.
3. Casing wear can also be measured accurately, but must be factored out of casing ovalization computations.
4. 3D visualization of the casing deformation may be very helpful, but must be used with care, since in severe deformation situations, the tool may become decentralized causing the measurement to lose data during the acquisition cycle and make the visualization misleading.
5. Visualization of the computed ovalization with the geological formation tops and interpreted faults brings insight to the causes of the deformation and highlights what geological events may be causing the deformation and ovalizations.
Acknowledgements The authors wish to thank BP Exploration and partners, ECOPETROL, TOTAL, and TRITON for permission to publish and acknowledge the contribution of numerous people in each organization. ECOPETROL was especially helpful with support for the investigation and additional examples. References 1. Rodriguez, Victor Julio Camargo, and Last, Nigel C.,
“Casing Deformation in Cusiana and Cupiagua Fields,” internal BP-Amoco report, March, 1999.
2. Hayman, A.J. Hutin, R., and Wright, P.V., “High-Resolution Cementation and Corrosion Imaging by Ultrasound,” presented at the 1991 SPWLA, 32nd Annual Logging Symposium, June 16-19, 1991.
3. Pattilo, P.D., et al, “An evaluation of concentric casing for non-uniform load applications,” SPE 29232, 1995.
4. El-Sayed, A.A.H., “ Concentric casing strings under non-uniform loading,” SPE17508, 1992.
5. Schlumberger Wireline & Testing, SMP-9230, “Ultrasonic Imaging, USI, Ultrasonic Imager, UBI Ultrasonic Borehole Imager,” 1993.