deformation analysis of an afrd for mine tailings storage ... · deformation analysis of an afrd...
TRANSCRIPT

Proceedings of the 19th International Conference on Soil Mechanics and Geotechnical Engineering, Seoul 2017
Deformation analysis of an AFRD for mine tailings storage and power generation
Analyse de déformation d'un AFRD pour le stockage des résidus minières et production d'électricité Osvaldo Ledesma, Alejandro Verri K. & Alejo O. Sfriso SRK Consulting and University of Buenos Aires. Chile 300, Buenos Aires, Argentina, [email protected]
ABSTRACT: The numerical analysis of a 171m high asphalt-faced rockfill dam for tailings storage and power generation is presented for both static and seismic conditions. For static loading, the effect of compaction was investigated and FoS were computed in both 2D and 3D geometries. For seismic loading, 30 ground-motion records were selected from a large database using a proxy model and fed into 2D simulations, and four were run in 3D simulations. It is concluded that the design settlement of the dam is 1.2±0.2 m after construction and additional 5.4m for the design earthquake.
RÉSUMÉ: L'analyse numérique en conditions statiques et sismiques d'un barrage en enrochement á masque en béton armé de 171m de hauteur pour le stockage des résidus et la production d'énergie est présentée. Pour le chargement statique, l'effet de compactage a été étudié et le facteurs de sécurité ont été calculés dans les géométries 2D et 3D. Pour le chargement sismique, plus de 30 enregistrements de mouvements de terrains ont été sélectionnés à partir d'une grande base de données en utilisant un modèle proxy et ils sont incorporées dans les simulations 2D et quatre simulations 3D ont été réalisées. Il est conclu que le tassement de conception du barrage est 1.2±0.2m après la construction et 5.4m supplémentaires pour le séisme de référence. KEYWORDS: asphalt-faced rockfill dam, deformation analysis, time-dependent seismic analysis, hysteretic damping, proxy model.
1 INTRODUCTION
Frieda River Limited commissioned SRK Consulting to undertake a pre-feasibility study of a tailing, waste and hydroelectric power integrated storage facility located in the Nena River and servicing the Frieda River Mine Project in West Sepik province, Papua New Guinea (Lupppnow and Hockley 2016). While the main objective of the dam is to store 798Mm3 of waste including tailings, it should generate 800GHh annual hydroelectric power as subsidiary value.
The dam site is a tropical forest having an average annual rainfall of 8.000mm and a probable maximum precipitation (PMP) of 920mm. The ISF catchment is approximately 258km2, which results in a peak flow of 9.500m3/s for the PMP.
A 28Mm3 asphalt-face zoned rockfill dam is considered for the project. The starter embankment would be ~96m high, the final embankment ~171m high, ~550m wide, built in five stages. Upstream and downstream slopes would be 1.5h:1.0h and 1.7h:1.0v respectively. A 225.000m2 asphalt liner up to 2.0m thick would be placed on the upstream face. These are landmark figures: if built, Frieda Rived Dam will almost double the height of Colibita dam (90m), the highest AFRD to date, and exceed Quxue Dam (165m), the highest asphalt core rockfill dam to date.
Due to its combination of staggered construction and power generation, the dam would be equipped with five decant inlets at increasing elevations, two diversion/decant tunnels, three hydroelectric power intakes, and a side-hill spillway. At closure, the spillway would be extended and lowered, and a 500m wide blanket would be placed in front of the embankment to move the pond away and control seepage if the asphalt layer degradates.
The study presented here assesses: i) the stability and defor-mation of the dam for various alternate dam designs; ii) stresses and deformation in the asphalt face during construction and operation; iii) earthquake-induced settlements, deformations and liner stresses; and iv) opportunities for optimization by changing zoning, compaction requirements, and construction sequence.
The information presented in this paper is a minor subset of the full study which covered various aspects including hydrology, water load balance, hydrogeology, geochemistry, geotechnics, construction materials, tailings disposal procedures, operational aspects, closure, risk assessment, waste rock dump design and budgeting for the entire integrated storage facility.
2 PROJECT AND SITE CONDITIONS
2.1 Geological setting
The Frieda River area is dominated by a series of E–W to ENE–WSW oriented fault systems: the Saniap Fault, the Frieda Fault, and the Fiak-Leonard Schultz Fault. The dam is located on a block of Ok Binai Phyllites – metasiltstone, metasandstone, phyllite, and schists – intruded in the west by the Nena Diorite and bounded by the Saniap Fault (N) and the Frieda Fault (S). Phyllites, diorites and indurated materials from a recent landslip (to be removed) are found in the footprint of the dam. 2.2 Seismicity
Papua New Guinea is located on the Pacific ‘Rim of Fire’, the tectonic boundary between the Indo-Australian Plate and the Pacific Plate. The dam is located on the southern boundary of the New Guinea Thrust Belt, which includes low-angle thrusting, left-lateral strike-slip structures, and active volcanism. The New Guinea Subduction Trench underlies the western part of Papua New Guinea. A probabilistic and deterministic seismic hazard assessment (PSHA and DSHA) has been undertaken for the site to determine design ground motions, taking into account various sources of seismicity including the potentially active Frieda Fault. The evaluation also caters for the seismic source zones depth ranges to account for the observed strong depth-dependent seismicity pattern in the Papua New Guinea region. The design ground motions obtained are PGA 1.09g and Arias Intensity (AI) 13.8m/s and source-to-site distances R 40-70km.
3 ANALYSIS OF CONSTRUCTION AND OPERATION
3.1 Modelling strategy
The main objectives of the modelling were to evaluate the vertical and horizontal displacements of the embankment during construction, operation and seismic loading. Several models were run using Plaxis 2D or Plaxis 3D (www.plaxis.nl). Being a “dry” dam, all modelling assumed drained conditions, i.e. no pore pressure generation and dissipation were considered. Factors of safety for various scenarios were computed using the strength reduction technique.

Proceedings of the 19th International Conference on Soil Mechanics and Geotechnical Engineering, Seoul 2017
3.2 Geometry, mesh, constitutive models
2D models employed 11.316 15-noded elements with an average size of 6.35 m. 3D models employed 264.452 10-node elements with an average size of 47.0 m (Figure 1).
Linear elasticity was employed for the ground rock. HS-Small, an isotropic hardening plasticity model embedded with small-strain hysteretic elasticity and a cap closure was employed for all construction materials (Brinkgreve et al 2016). SSC model was employed to estimate the long-term creep settlements. A linear elastic plate with nil stiffness was employed for the liner. The embankment was divided into zones which were assigned different strength parameters to mimic the pressure dependency of the friction angle (Table 1). For a complete description of the material models and parameters see (Brinkgreve et al 2016).
Table 1. Strength parameters for the dam body.
Parameter Outer core Mid-core Inner core Tailings 𝛾 [kN/m3] unit weight 22 22 22 20 𝑐 [kN/m2] cohesion 5 5 5 1 𝜙 [º] friction angle 46 43 40 34 𝜓 [º] dilatancy angle 2 2 2 0
Figure 1. 3D mesh, 379.045 nodes and 264.452 10-node elements. In 2D models, tailings were included in the mesh as a horizontal layer at the design height for each raise, extending to the FE mesh boundary. In 3D models, a distributed load, calibrated from 2D runs, was employed instead. Raises were simulated by staged construction using several layers per raise (Figure 2). In each layer, the sequence was: i) activate; ii) double unit weight of the fresh layer; iii) set unit weight back to normal, achieving OCR=2.0 for the layer with minimal disruption of the stress field in the rest of the dam.
Figure 2. Starter stage and four raises, employed in 2D and 3D models. 3.3 Behavior during construction
Figure 3 (left) shows the normalized settlement obtained in 2D models in the centerline of the dam for the stages shown in Figure 2. A max. settlement of 1.00±0.10m and a horizontal displace-ment of 0.23±0.07m were computed. The 3D model yielded very similar results, thus proving mesh-independence and consistency of the numerical calibration of both models. Sensitivity analyses were performed: i) an oedometeric stiffness half of base case resulted in a max. settlement of 1.38m; ii) no compaction (OCR 1.0) resulted in a max. settlement of 3.08m (Figure 3, right and Figure 4). The predicted crest settlement is at the low end of the expected value for similar dams, a result that can be explained by the fact that the oedometer stiffness of the rockfill was calibrated to simulate seismic amplifications realistically rather than a producing a conservative settlement prediction.
Figure 3. Settlement contour for base case (left) and sensitivity analyses (right). 𝑧 is vertical coordinate, 𝐻 is height of dam, 𝛿 is settlement.
Figure 4. Sum of phase vertical displacement contours for the last construction stage assuming OCR = 1.0 for the embankment material. Factors of Safety by the strength reduction method were 1.46 for the 2D model and 1.53 for the 3D model. In both cases, failure occurred in the downstream slope, as the upstream slope was stabilized by the tailings. Factors of safety were proven mesh-independent by repeating the exercise using different meshes. 3.4 Stress and deformation of the asphalt face
Membrane stresses in the liner were calculated for the last raise (Figure 5, positive is tension). The max value is 1380kPa in compression, dip direction. The contact between the asphalt face and the abutment and between the asphalt face and the rockfill were modelled as fully compliant, i.e., no relative displacements were allowed between the different materials at the contact surfaces. As a consequence, concentration of tension stresses which normally develop in the abutments is over-estimated.
Figure 5. Liner membrane stress, horizontal (above) and dip dir (below). 3.5 Long-term settlement and deformation
Being located in a region where eight meters of rainfall are expected each year, settlement induced by changes in humidity of the pore-space (Oldecop and Alonso 2007) was deemed a non-issue in this case.
Proceedings of the 19th International Conference on Soil Mechanics and Geotechnical Engineering, Seoul 2017
Creep deformation was simulated by switching the constitutive model from HS-Small to SSCM and running a series of parametric analyses using assumed parameters. A long-term (30 years) additional settlement 0.20±0.08m was obtained, yielding a total post-construction settlement of 1.20±0.18m. 4 BEHAVIOR UNDER SEISMIC LOADING
4.1 Analysis procedure
A suite of ground-motion records targeted to comply with any single intensity measure (IM) – a prescribed PGA, Arias Intensity (AI), etc. – will generally show a large dispersion of computed crest displacements for a given dam because the dam response is highly nonlinear, its behaviour depending on multiple aspects of the record including number of significant acceleration pulses, energy, duration, and frequency content. IMs, developed for single-degree-of-freedom structures and spectral-matching procedures, fall short in identifying suitable design records.
Nonlinearity imposes the need of running several records to provide an assessment of the variability of the response and a confidence interval. Ideally, full 3D models (Palma et al 2014) should be employed. The high computational cost of these 3D simulations, however, yields this approach unpractical for a large database of records. The few records that can be actually run should, however, yield a realistic estimation of the seismic demand – in this case, crest settlement – for a given service level.
The procedure for selecting those records is: i) run a proxy model using a large database of records scaled for the target IM; ii) compute the median value µ and variance s2 of settlements in log scale; iii) build a reduced subset of 30-40 records preserving µ and s2; iv) perform a FE time-history analysis using the reduced subset – in this case, 30 2D runs; v) compute µ and s2 of the new results; and vi) pick 3-4 representative records from the subset, run full 3D time-history analyses and compute µ for this small subset. The rationale behind this procedure follows:
First, it is assumed that a simple model exists where rockfill properties leading to a median response will lead to a median response of a full model. If this is the case, this model can be employed as proxy, i.e., an estimator of the µ and s2 of the ‘true’ response preserving aleatory uncertainty. Due to the simplicity of the proxy model, it might be expected that the median response is biased with respect to the ‘true’ median value.
Then, it is assumed that a 2D time-history FE simulation is an unbiased estimator of the median seismic demand, leading to the ‘true’ median and ‘true’ variance of the response – in this case, crest settlement obtained after 30 2D FE runs.
Finally, 3D time-history analyses are required to take into account 3D aspects like valley shape, spatial zonation of the dam and heterogeneities in the foundation materials.
The reported results are the median crest settlement from 2D and 3D simulations and the design values for 16% and 5% probability of exceedance – 84th and 95th percentile respectively.
The epistemic uncertainty can be reduced by increasing the number of records in the subset feeding the 2D models; the aleatory uncertainty can be reduced by increasing the size of the full database feeding the proxy model (Ang and Tang 1984).
4.2 Ground-motion database
The database gathers records from RENADIC (terremotos.ing. uchile.cl), COSMOS (strongmotioncenter.org), REDACIS (sig. cismid-uni.org) and PEER (peer.berkeley.edu) including shallow crustal events and subduction events. Low-amplitude records (PGA<200mm/s2), low-magnitude events (M<4.5), records with unknown site conditions and records with sample rates >0.02sec were excluded. The remaining 10218 accelerograms from 792 earthquakes were employed. This set was scaled to two target service levels, AI 13.8m/s and PGA 1.09g, and de-convoluted to bedrock by a linear-equivalent hysteretic site-response model.
4.3 The proxy model
A Newmark-type proxy model designed for the probabilistic displacement analysis of rockfill dams in 3D dam-canyon systems was developed (Núñez 2006, Verri 2011). The model is based on a generalization of the shear-beam model and on analytical closed-form solutions for 3D dam-canyon systems under rigid-base excitation (Ambraseys 1960, Ohmachi 1981, Gazetas and Dakoulas 1985). A brief description of the model follows:
Dam input parameters: width 𝐵, height 𝐻), crest length 𝐿, upstream and downstream slopes 𝛽), valley shape, and pressure-dependent shear stiffness 𝐺(𝑝) of the dam body (Figure 6).
Motion input parameters: time-history record scaled to target service level at bedrock, non-linearly convoluted through the alluvium thickness, if present, to the base of the dam.
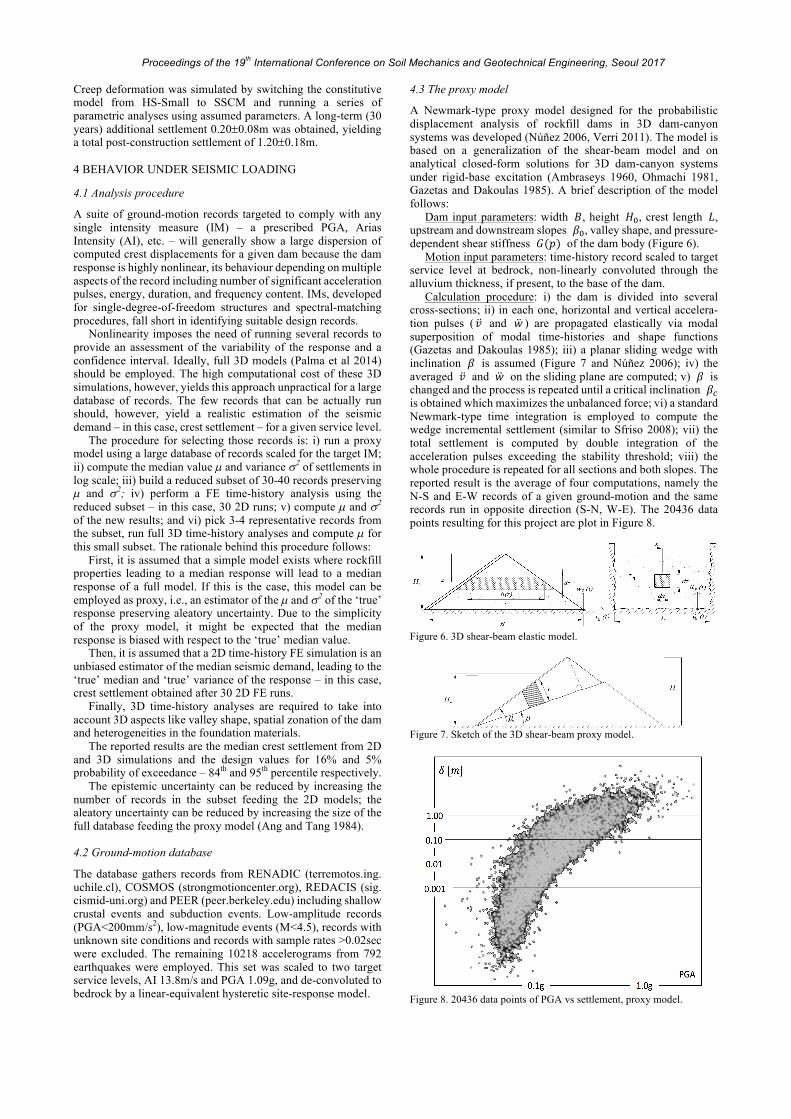
Calculation procedure: i) the dam is divided into several cross-sections; ii) in each one, horizontal and vertical accelera-tion pulses (𝑣 and 𝑤 ) are propagated elastically via modal superposition of modal time-histories and shape functions (Gazetas and Dakoulas 1985); iii) a planar sliding wedge with inclination 𝛽 is assumed (Figure 7 and Núñez 2006); iv) the averaged 𝑣 and 𝑤 on the sliding plane are computed; v) 𝛽 is changed and the process is repeated until a critical inclination 𝛽2 is obtained which maximizes the unbalanced force; vi) a standard Newmark-type time integration is employed to compute the wedge incremental settlement (similar to Sfriso 2008); vii) the total settlement is computed by double integration of the acceleration pulses exceeding the stability threshold; viii) the whole procedure is repeated for all sections and both slopes. The reported result is the average of four computations, namely the N-S and E-W records of a given ground-motion and the same records run in opposite direction (S-N, W-E). The 20436 data points resulting for this project are plot in Figure 8.
Figure 6. 3D shear-beam elastic model.
Figure 7. Sketch of the 3D shear-beam proxy model.
Figure 8. 20436 data points of PGA vs settlement, proxy model.

Proceedings of the 19th International Conference on Soil Mechanics and Geotechnical Engineering, Seoul 2017
A decision was made not to use regression empirical models which are common estimators of median displacements in terms of single-valued or vector-valued intensity measures (e.g. Yegian and Marciano 1991, Kramer and Smith 1997). It is argued that the aleatory uncertainty included in the error term of these models was obtained for the record set employed in each regression model and therefore cannot be directly extrapolated to a different record set like the one employed in this study.
30 records were selected from the proxy model. When scaled to AI 13.8m/s, they result in a PGA range 0.80g to 2.50g. When scaled to PGA 1.09g, the resulting AI range is 2.5m/s to 24.2m/s.
4.4 Seismic-induced settlements
Vertical and horizontal residual displacements are summarized in Figure 9 and 10. Not surprisingly, scatter is large in both figures, proving that no single IM can be used to select a design ground motion. In Figure 9, the highest settlement is obtained for a mid-range AI, while in Figure 10, the highest settlement is obtained for a PGA somehow in the low range of the graph.
Figure 9. Settlement and horizontal displacement as a function of AI.
Figure 10. Settlement and horizontal displacement as a function of PGA. Combining both results (PGA and AI) of 2D simulations, a median residual settlement of 2.35m was obtained for the target service level. For the 84th and 95th percentile, the obtained values were 5.30m and 9.00m respectively.
Three 3D simulations yielded very similar results to the 2D simulations using the same records. It was concluded that 2D results – µ and s – sufficed for this stage of the study. A design crest settlement of 5.40m was reported as the final result. An example of the shear strain contours is shown in Figure 11.
Figure 11. Post-earthquake shear strain contour, PGA 1.09g, AI 5.8m/s.
4.5 Seismic-induced liner stress
Post-earthquake membrane stresses were computed using the 3D simulations. Results obtained were +940kPa/-984kPa in horizontal direction and +840kPa/-1180kPa in dip direction. Large tensile dip-dir stresses might induce cracking of the asphalt layer. While at closure the tailings would quickly heal the eventual cracks, a filler material zone was provided in case cracks develop before the tailings reach the crack level. 5 CONCLUSIONS
Frieda Dam is the project of a 171m high AFRD designed to store 798Mm3 of waste and to generate 800GHh annually. Being located in a region of high seismicity, a seismic-induced deformation analysis employing time-history finite-element simulations was committed for the pre-feasibility study.
A procedure for selecting ground-motion records was introduced in this paper. The procedure employs a large database, a proxy model and 2D time-history analyses to yield a small set of ground motions suitable for performing 3D simulations and for computing design seismic demand indicators.
A max. settlement of 1.00±0.10m was computed for the construction period; an additional 0.20±0.08m was estimated to occur in long term. A median settlement of 2.35m and a design settlement of 5.40m (84th percentile) were obtained for the target service level. Post-earthquake membrane stresses, computed in the 3D simulations, showed large tensile dip-dir stresses that might induce horizontal cracking of the asphalt layer. A filler material zone was provided to arrest these crack.
6 ACKNOWLEDGEMENTS
We acknowledge our team, D. Luppnow and D. Hockley for their valuable feedback and contributions during the development of this study. We also acknowledge Edward Chong and PanAust for permission to publish this material and W. Gibson, J. Swaisgood and A. Lizcano for their contributions and peer-review. 7 REFERENCES
Ambraseys N. 1960. On the shear response of a two-dimensional truncated wedge subjected to an arbitrary disturbance. Bull. Seism. Soc. Am. 50 (1) 45-56.
Ang A. and Tang W. 1984. Probability concepts in engineering planning and design: decision, risk, and reliability. Wiley.
Brinkgreve R. B., Kumarswamy S. and Swolfs W. 2016. Plaxis Material Models Manual. Plaxis BV.
Gazetas G. and Dakoulas P. 1985. A class of inhomogeneous shear models for seismic response of dams and embankments. Soil Dyn. Earthq. Eng. 4 (4) 1-22.
Luppnow D. and Hockley D. 2016. PNA007 Frieda River Project RL277m FEL2 Design Report. SRK Consulting (Australia).
Kramer S. and Smith M. 1997. Modified Newmark model for seismic displacements of compliant slopes. ASCE J. Geotech. Geoenv. Eng. 123 (7) 635-644.
Núñez, E. 2006. Estimación de asentamientos por acción sísmica en presas de enrocado. COBRAMSEG 2016 (4) 2067-2072.
Ohmachi T. 1981. Analysis of dynamic shear strain distributed in three dimensional earthdam models. Intl. Conf. of Recent Adv. Geotech. Earth. Eng. Soil Dyn.
Oldecop L. and Alonso E. 2007. Theoretical investigation of the time-dependent behaviour of rockfill. Geotechnique 57 (3) 289-301.
Palma C., Sfriso A. and Carboni S. 2014. Análisis de esfuerzos y deformaciones de la presa Reventazón utilizando FLAC 3D. VIII COCHIGE, CD-ROM.
Sfriso A. 2008. Numerical assessment of the deformation of CFRD dams during earthquakes. XII Conf. IACMAG, 4054-4061.
Verri, A 2011. Selección de registros para el análisis y diseño sísmico de presas de enrocado. Anal. Acad. Nac. Ing. Argentina, 31p.
Yegian M., Ghahraman E. and Marciano G. 1991. Earthquake-induced permanent deformation probabilistic approach. ASCE J. Geotech. Eng. 117(1) 35-50.