definition, importance and determinants of...
TRANSCRIPT

1
DDEFINITION, IMPORTANCE AND DETERMINANTS OF PRODUCTIVITY
Dean Parham, Deepa Economics [email protected]
Contents 1. What is productivity? 2 Types of productivity measures 2 Interpretation of productivity measures 3 What do productivity measures capture? 3 2. Why is productivity important? 4 Does productivity growth mean lower employment? 6 3. Factors that improve productivity 7 Hierarchy of productivity determinants 7 Productivity growth patterns in the 20th century 10 Productivity growth in the modern era 11 4. Policy strategies to improve productivity 13 References 14 Appendixes 1. Measurement of productivity 15 2 International patterns of productivity growth 17

2
11. What is productivity?
Productivity is a measure of the rate at which outputs of goods and services are produced per unit of input (labour, capital, raw materials, etc). It is calculated as the ratio of the amount of outputs produced to some measure of the amount of inputs used.
Productivity measures are used at the level of firms, industries and entire economies. Depending on the context and the selection of input and output measures, productivity calculations can have different interpretations.
Improving productivity can have connotations of economising on the use of inputs — for example, adopting efficient production processes that minimise waste. Equally, improving productivity can have connotations of yielding more output — for example, using resources in activities or with technologies that generate more output.
Conceptually, productivity is a ‘supply-side’ measure, capturing technical production relationships between inputs and outputs. But, implicitly, it is also about the production of goods and services that are desired, valued and in demand.
Types of productivity measures
Productivity = (1)
Productivity can be expressed as a physical measure (for example, number of cars produced per employee), a monetary measure (for example, thousands of dollars of output per hour worked), or an index (for example, output per unit of labour = 100 in 1997-98).
In principle, inputs can be broadly defined to cover people's time, their skills, land, raw materials, machinery and equipment, energy (for example, electricity) and so on. But, most commonly, inputs are defined in terms of:
labour (number of employees or hours of work) and
capital (buildings, machinery and equipment, etc).
Labour productivity (LP) is the ratio of output to the input of labour. Typically, it is measured as the amount of output produced per hour worked.
Multifactor productivity(MFP) is the ratio of output to the combined input of labour and capital. Sometimes this measure is referred to as total factor productivity.
Output
Inputs

3
The measurement of productivity is set out briefly in Appendix 1. OECD (2001) provides an extensive and authoritative guide.
IInterpretation of productivity measures
Labour productivity should be interpreted carefully if used as a measure of efficiency. In particular, it reflects more than just the efficiency or productivity of workers. Labour productivity is the ratio of output to labour input; and output is influenced by many factors that are outside of workers’ influence — including the nature and amount of capital equipment that is available, the introduction of new technologies, management practices and so on.
At a national level, labour productivity growth is sometimes used as an approximate indicator of the growth in prosperity. GDP measures both total output and total income generated. Unless there are dramatic changes in the average hours worked per person in the population (or the international terms of trade, or the proportion of income paid abroad), the growth in national labour productivity (output per hour worked) provides a close approximation to the growth in national income per person.
In principle, multifactor productivity is a better indicator of efficiency. It measures how efficiently and effectively the main factors of production — labour and capital — combine to generate output.
Labour productivity and multifactor productivity both increase over the long term. Usually, the growth in labour productivity exceeds the growth in multifactor productivity (reflecting the influence of relatively rapid growth of capital on labour productivity).
What do productivity measures capture?
Productivity measures, constructed as set out in Appendix 1, capture a number of effects in practice:
technological change:
- technological advances that are embodied in capital equipment are reflected in improvements in LP (through capital deepening);
- disembodied technological change is reflected in MFP;
human capital improvements;

4
- because improvements in human capital are not captured in the labour input, their contributions to productivity are captured in MFP1;
reductions in inefficiency;
- if firms are operating inefficiently, movements toward best practice will be reflected in LP through capital deepening (if it involves investment in new capital) and especially in MFP;
scale economies;
- even though the measurement method assumes constant returns to scale, any increasing returns to scale are picked up in MFP growth2; and
composition effects;
- since the levels of productivity differ between industries (even if all firms are operating at their own maximums of efficiency), a shift of resources from low to high productivity (level) industries will raise average productivity and will therefore be reflected in aggregate LP and MFP growth.
These effects will be captured to the extent that changes in output and inputs of labour and capital are accurately measured. Accurate measurement will not always be the case, however. For example, it is difficult for statistical agencies to capture all improvements in the quality of services, which should be measured as increases in output.
22. Why is productivity important?
Productivity growth is important because it contributes to growth in output, income and living standards.
Expressing the definition (1) in growth rate form, we get:
Productivity growth = Output growth – Input growth
Rearranging:
Output growth = Input growth + Productivity growth
That is, input growth and productivity growth both contribute to output growth.
Next, we observe that output growth is equal to income growth (if output is measured as value added). And so, productivity growth leads to income growth in an economy.
1 In some cases, the labour input measure is adjusted for ‘quality’ improvements. Accumulation of human capital would then be reflected in labour input, rather than MFP. 2 The measures will, however, be subject to some error.
5
Finally, if we measure living standards as GDP per head:
where P = population, H = hours worked.
Since GDP is both a measure of income and output and since GDP per hour worked is a measure of labour productivity, growth in productivity will raise income per person. In practice, the other term on the right hand side (hours worked per person) only changes gradually and by a relatively small amount over time. Consequently, productivity growth accounts for the most part of growth in average income over the long term.
At a firm or industry level, the benefits of productivity growth can be distributed in a number of different ways:
to the workforce through better wages and conditions;
to shareholders and superannuation funds through increased profits and dividend distributions;
to customers through lower prices;
to the environment through more stringent environmental protection; and
to governments through increases in tax payments (which can be used to fund social and environmental programs).
Productivity growth is important to the firm because it means that it can meet its (perhaps growing) obligations to workers, shareholders, and governments (taxes and regulation), and still remain competitive or even improve its competitiveness in the market place.
As mentioned, there are essentially two ways to promote growth in output: bring additional inputs into production; or increase productivity. Adding more inputs will not increase the income earned per unit of input (unless there are increasing returns to scale). In fact, it is likely to mean lower average wages and lower rates of profit. But, when there is productivity growth, even the existing commitment of resources generates more output and income. Income generated per unit of input increases. Additional resources are also attracted into production and can be profitably employed.
At the national level, productivity growth raises living standards because more real income improves people’s ability to purchase goods and services (whether they are
6
necessities or luxuries), enjoy leisure, improve housing and education and contribute to social and environmental programs (see Box 1).
DDoes productivity growth mean lower employment?
At the firm or industry level, a productivity-enhancing factor, such as the introduction of new technology, can mean that fewer workers are required to meet production needs. This is not always the case, however, as a firm with innovative products can stimulate such strong demand that it needs to put on more workers to raise production to meet the demand.
At the aggregate or economy-wide level, the general evidence is that productivity growth does not mean fewer employment opportunities. Productivity growth stimulates sufficient growth in income and output to generate overall employment growth. As an illustration, employment growth and a reduction in unemployment accompanied Australia's record productivity growth in the 1990s.
Box 1 Two views on the importance of productivity growth ‘Productivity isn’t everything, but in the long run it is almost everything. A country’s
ability to improve its standard of living over time depends almost entirely on its ability to raise its output per worker. World War II veterans came home to an economy that doubled its productivity over the next 25 years; as a result, they found themselves achieving living standards their parents had never imagined. Vietnam veterans came home to an economy that raised its productivity less than 10 percent in 15 years; as a result, they found themselves living no better — and in many cases worse — than their parents.’
Paul Krugman 1992, The Age of Diminished Expectations: US Economic Policy in the 1980s, MIT Press, Cambridge, p. 9.
‘Over long periods of time, small differences in rates of productivity growth compound, like interest in a bank account, and can make an enormous difference to a society’s prosperity. Nothing contributes more to reduction of poverty, to increases in leisure, and to the country’s ability to finance education, public health, environment and the arts.’
Alan Blinder and William Baumol 1993, Economics: Principles and Policy, Harcourt Brace Jovanovich, San Diego, p. 778.

7
33. Factors that improve productivity
This section examines the factors that determine productivity growth. Exploration of these factors can help to explain why countries differ in their productivity performance. It can also provide some clues as to what can, and cannot, be done to improve a country’s productivity performance.
Hierarchy of productivity determinants
The sources of productivity are complex and interrelated and differ from country to country. Rather than discuss the full range of determinants and the possible interrelationships between them, it is useful to think of a hierarchy in which determinants can be grouped (Figure 1).
Figure 1 Hierachy of productivity determinants
The first group is the immediate sources of productivity growth. These have a direct or immediate effect on productivity. Adoption of a new production technology is a good example. Figure 2 sets out immediate sources of labour productivity growth. Improvements in labour productivity are sourced in the most immediate sense from capital deepening (increases in the capital-to-labour ratio) and improvements in MFP. Technology, economies of scale, accumulation of physical and human capital, compositional change, changes in labour inputs all affect the rate of capital deepening or MFP growth.
Underlying influences form the next layer. They have an indirect and often longer-term effect on productivity by influencing changes in the immediate factors. Government policies fall into this category. Before discussing this layer of influences further, we jump to the fundamental determinants of a country’s productivity performance, which
Productivity
Immediate sources
Underlying influences
Fundamental determinants
Factors such as adoption of new technologies that are direct sources of productivity.
Factors such as government policies that influence the proximate sources of productivity.
Deep factors such as resource endowments that provide a context within which underlying influences operate and influence productivity.

8
are essentially ‘givens’—at least in the short to medium term. The nature, relevance and effect of underlying influences—and in particular policy strategies—must be examined in the context of these ‘deep’ fundamental influences. It is appropriate therefore to discuss fundamental determinants before moving on to underlying influences.
Figure 2 Proximate sources of productivity growth
The fundamental influences are ‘deep’ factors that have ultimate influence on a country’s productivity performance. Natural resource endowments are a fundamental determinant. For example, a plentiful supply of fertile land would enable more labour and capital to be devoted to agricultural production. Endowments of minerals would enable mining production, and so on. Notions of comparative advantage and gains from trade drive countries to specialise in their patterns of production. Since the productivity levels of industries differ, the potential aggregate level of productivity differs between countries. An abundance of labour can also determine the basic structure of an economy. The fundamental layer also includes influences such as culture (industriousness and entrepreneurial traits), social capital, geography (distance from large markets, urban agglomeration) and deep formal or informal institutions (for example, corruption). Some fundamental influences (such as geographical position of a country) are fixed, whereas some (such as culture) do change to some degree, but over long time horizons.3
3 Even factors such as resource endowments are changeable to some degree over time. For example, new technologies can make mineral deposits more accessible.
Labour productivity
Capital deepening
Multifactor productivity
Firm/industry composition
Technology (Disembodied)
Human capital
Economies of scale
Technical efficiency
Physical capital
Employment
Average hours worked
Embodied technology
9
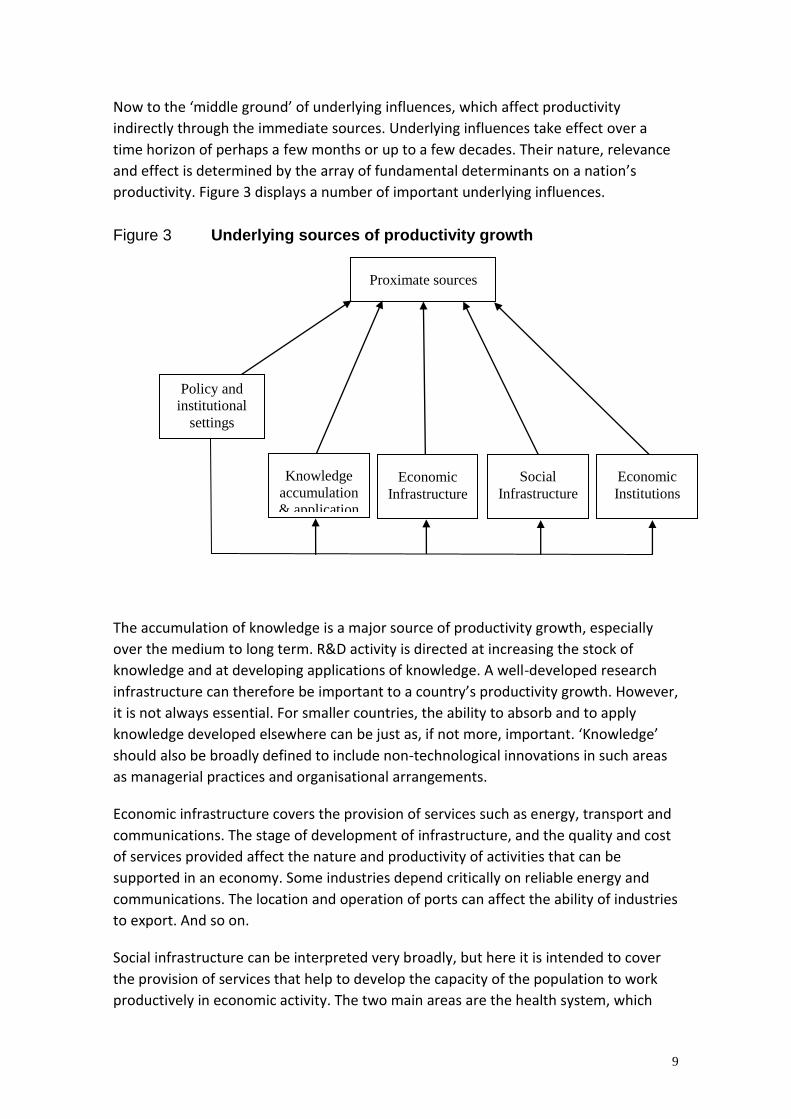
Now to the ‘middle ground’ of underlying influences, which affect productivity indirectly through the immediate sources. Underlying influences take effect over a time horizon of perhaps a few months or up to a few decades. Their nature, relevance and effect is determined by the array of fundamental determinants on a nation’s productivity. Figure 3 displays a number of important underlying influences.
Figure 3 Underlying sources of productivity growth
The accumulation of knowledge is a major source of productivity growth, especially over the medium to long term. R&D activity is directed at increasing the stock of knowledge and at developing applications of knowledge. A well-developed research infrastructure can therefore be important to a country’s productivity growth. However, it is not always essential. For smaller countries, the ability to absorb and to apply knowledge developed elsewhere can be just as, if not more, important. ‘Knowledge’ should also be broadly defined to include non-technological innovations in such areas as managerial practices and organisational arrangements.
Economic infrastructure covers the provision of services such as energy, transport and communications. The stage of development of infrastructure, and the quality and cost of services provided affect the nature and productivity of activities that can be supported in an economy. Some industries depend critically on reliable energy and communications. The location and operation of ports can affect the ability of industries to export. And so on.
Social infrastructure can be interpreted very broadly, but here it is intended to cover the provision of services that help to develop the capacity of the population to work productively in economic activity. The two main areas are the health system, which
Proximate sources
Policy and institutional
settings
Knowledge accumulation & application
Social Infrastructure
Economic Infrastructure
Economic Institutions

10
helps to promote continuing workforce engagement in employment, and the education system, which helps to develop the knowledge, skills and attributes of the workforce and its capacity to improve productivity in the economy.
Economic institutions are formal and informal mechanisms for establishing rules and coordination and exchange in the economy. They include product markets, financial markets, mechanisms for determination of wages and conditions, equity markets, regulatory institutions and property rights regimes. Enforcement mechanisms to ensure the rules are obeyed also form an important part of the institutional structure. They can affect productivity by influencing the costs of compliance and doing business, and the incentives and ability to change and to innovate.
Government policy and institutional settings affect the proximate factors, either indirectly by helping to shape other underlying factors (eg the development and operation of infrastructure) or directly by specific policies that affect the proximate sources of productivity. The government policy and institutional environment also has a broader influence to the extent that it promotes economic stability and trust. Economic stability is good for investment, and that includes the investments in physical and human capital that help to promote productivity. Trust comes from political stability and good, transparent policy making processes. It enables businesses and people to make long-term investments and commitments that are good for productivity over the long term.
PProductivity growth patterns in the 20th century
Different countries have taken different pathways to productivity growth. In part, this reflects differences in the fundamental determinants of productivity performance. But it also reflects differences in strategies.
The United States has been the centre of much technological advance. There have also been major non-technological breakthroughs in management and organisational methods. Generally speaking there has been heavy reliance on private enterprise in the United States (government support for weapons and aerospace being important exceptions), with substantial rewards for successful innovation.
European countries have also had a tradition of technological development. However, generally speaking there has been more government intervention and ‘corporatist’ involvement of big business and big unions. Social objectives have been prominent in policy. This framework has had the effect of raising labour productivity, but has come at a cost in terms of low utilisation (high unemployment). Moreover, the framework has not served many European countries so well from the mid-1990s as they have been unable to keep up with US productivity growth. Some European countries have shown strong productivity growth through extraction of oil (The Netherlands and,

11
more recently, Norway) and Ireland has shown very strong productivity growth based on manufacturing ICT equipment for Europe with US investment and knowledge.
Asian countries have engaged in catch-up over the long term, particularly through technology strategies in some countries. There have been institutional issues, however, as manifest in the financial crisis and stagnant productivity in Japan in the 1990s. There has also been discussion about the degree to which different countries have, in earlier decades, relied on input accumulation or productivity growth as sources of economic growth.
A major reason for Australia’s relatively poor productivity performance through the 1950s to the 1980s was that its policy and institutional environment reinforced the closed, inward-looking and rigid nature of the economy. The effect on living standards, at least for most of the time, was masked by strong earnings from agricultural and mining exports. But as commodity prices declined and global competition in manufactures intensified in the 1980s, the need for a ‘productivity shape-up’ became imperative. A series of policy and institutional reforms were introduced from the mid-1980s. Australia’s productivity performance accelerated in some industries in the 1980s and at the aggregate level in the 1990s.
Productivity growth in the modern era
A new era of productivity growth opened up in the 1990s. Productivity growth accelerated in the United States and, from an OECD perspective, only a very few countries were able to follow in raising productivity growth. Certainly, the absence of a productivity uplift in Europe was a particular puzzle.
Three related factors underpinned productivity growth in some countries:
Greater competition. Competitive pressures intensified through trade from low-cost exporting countries and, in some cases, increased domestic competition.
- Stronger competition is a central driver of productivity growth. It provides strong incentive for firms to improve their performance for survival and growth.
Globalisation. Greater integration between economies through trade and investment brought opportunities to outsource production on a global scale.
- Globalisation has driven productivity improvements by intensifying competition and by bringing about a reorganisation of production on a global scale to where it is most efficiently conducted.
Technology. Developments in information and communications technologies (ICT), which not only provided opportunities for strong productivity growth directly (discussed below), but also assisted globalisation by enabling better transfer of information and international coordination of economic activities.
12
The ICT story is worth dwelling on, as it has quite broad implications for productivity growth in the modern era. It was mentioned above that ICT has played a large role in the US productivity acceleration from the mid-1990s. Many European countries have not been able to use ICT as a substantial source of productivity growth.4
ICT is linked to productivity growth in three ways. First, substantial MFP gains are possible in the production of ICT equipment. The gains stem from the ability to manufacture more and more powerful and functional equipment, without a commensurate increase in inputs. Second, investment by using industries in ICT equipment raises the rate of capital deepening (substitution of capital for labour). Third, users are able to use ICT equipment as a platform for their own innovation in products and processes (a source of MFP gain). For example, users are able to develop new information-intensive or Internet-based products; or can implement new supply-chain arrangements. Services industries have become major centres for productivity gain based on use of ICTs.
These three ways are interrelated. The MFP gains in production are passed on in the form of lower prices, which stimulates user investment. The gains to be had from user innovation also influence the level of investment that users are prepared to make.
ICT is now viewed as a ‘general purpose technology’ that has very wide application throughout the economy and provides a very broad platform for innovation. But one of the key requirements for productive use of ICT is the ability to implement new business models—new work arrangements, new organisational structures, new core functions, new management and remuneration schemes.
It is in relation to ICT use that European countries have differed from the United States and some other countries (including Australia) in their ability to generate productivity gains. Research at the OECD and the US Federal Reserve Board has shown that product and labour market regulation conditions the degree to which ICT brings productivity gains. Low product market regulation means strong competition and incentives to be more productive. Along with low labour market regulation, it also provides greater flexibility for businesses to implement new business models. For example, businesses will not invest in new ICT equipment and systems to the same degree if they are not able to easily change employment numbers and job descriptions.
4 The difference in productivity acceleration between the US and Europe was a motivating factor for the OECD to embark on its ‘Growth Project’. The findings highlighted an important role for ICT, but emphasised the differences in ‘framework conditions’ operating in different countries. These conditions are essentially policy and institutional factors that have been tagged as underlying influences on productivity in this paper.

13
44. Policy strategies to improve productivity
The prominent US economist, Paul Krugman, famously said, ‘Productivity isn’t everything. But in the long run, it is almost everything.’ (Box 1)
To elaborate, productivity is not the ultimate economic objective, but it is a very important intermediate objective that serves to improve economic welfare and living standards. We have seen that, while growth in productivity and in labour utilisation are both sources of improvement in living standards, productivity growth has made by far the major contribution over the long term.
There is other dimension to Krugman’s statement. In the short run, developments that bring productivity gains also involve costs. Costs must also be taken into account in the welfare calculation. But in the long run, the gains from productivity-enhancing developments are overwhelming and the short-term adjustment costs become a distant memory. For example, the widespread introduction of personal computers reduced the role and employment opportunities of specialist typists. But with time and adjustment in training, the adverse effects have diminished and the productivity gains have endured. Over the long haul, there is nothing as powerful as productivity in raising standards of living.
And so, when it comes to formulating policy strategies to promote productivity growth, governments need to take account of costs, which are often short term and concentrated, but keep an eye on the enduring long-term gains.
A focus on productivity growth is even more of an imperative in view of the looming challenges many countries face—specifically, ageing populations and climate change. Productivity growth provides the means to maintain growth in living standards as labour utilisation declines and as costs associated with environmental protection increase.
The ability of government policy strategies to promote productivity growth is conditioned by the fundamental factors of nature, history and geography. These may limit the ability of governments to influence productivity outcomes or may enhance it in some circumstances.
That said, there is a role for governments to foster a business environment that is conducive to productivity growth. This can include appropriate development of economic and social infrastructure, economic institutions, the national innovation system and so on. There are three touchstones that are particularly relevant to fostering productivity growth in the modern era:
Incentives. Allowing and indeed fostering competition is the central driver of productivity growth. Incentives to be innovative and productive are also affected by such factors as tax structures and regulatory regimes.

14
Capability. Development of skills is increasingly important. Specialised skills are needed to develop and apply technologies. Management and entrepreneurial skills are needed to seek new opportunities and manage change. Skills in ICT use are needed at the operational level. The education and training system and the innovation system have a major role in developing the skills and knowledge needed for productivity growth.
Flexibility. The flexibility to experiment, to innovate and to adapt to change is crucial. Flexibility is needed in labour and capital markets and needs to be a characteristic of regulation.
Particularly in a fast-changing world, there is little role for interventions designed to insulate sections of the economy from competition or to promote the advancement of specific industries or activities.
RReferences
Dolman, B., Parham, D. and Zheng, S. 2007, Can Australia Match US Productivity Performance?, Productivity Commission Staff Working Paper, Canberra
OECD (Organisation for Economic Co–operation and Development) 2001, OECD Productivity Manual: A Guide to the Measurement of Industry–level and Aggregate Productivity Growth, OECD, Paris.
Parham, D. and Zheng, S. 2006, ‘Aggregate and Industry Productivity Estimates for Australia’, Australian Economic Review, vol. 39, no. 2, pp. 216–26

15
Appendix 1
MMeasurement of productivity
Given the prime interest in ‘national’ or ‘aggregate’ productivity, the discussion of measurement is based on the practices generally used by national statistical offices. A framework of conventions is set out in SNA93. The OECD Productivity Manual also provides a very useful reference. See Parham and Zheng (2006) on measurement in Australia.
Industry coverage Measurement of productivity is usually confined to the ‘business sector’ or ‘market sector’ of the economy. These sectors exclude a number of services industries, usually in the government sector where outputs are not generally ‘marketed’ and are therefore difficult to measure in a way that is independent of the amount of inputs used. For example, the size (output) of government administration is usually measured in terms of the amount spent, which in turn is related to use of labour and capital. Because outputs cannot be independently measured (and therefore productivity cannot be meaningfully measured), these industries are excluded from the productivity calculations. To use a business sector measure as an indicator of national productivity implicitly assumes that productivity in the non-business sector is the same as the business sector average.
Output measure Aggregate output is usually measured in terms of value added (gross output less use of intermediate inputs). Because output needs to be measured across many different goods and services, price information is also needed to aggregate (the value of) individual outputs generated. Appropriate price deflators are then needed to strip out the effects of inflation and to take account of improvements in the quality of goods and services produced. (A quality improvement is normally considered to be an increase in output). Output is measured as an index of the volume of goods and services produced.
Labour input Where possible, hours worked, rather than the numbers of employees, is used as the measure of labour input. With an increase in part-time employment, hours worked provides the more accurate measure of labour input.
Capital input Capital input is ideally represented by the services delivered by the available capital stock. The measured available capital stock takes account of depreciation. This can be a ‘net capital stock’ — a wealth measure — which takes account of financial depreciation (declines in the value of assets). But more and more countries are

16
adopting a ‘capital services’ or ‘productive capital stock’ approach, which takes account of the decline in the rate at which assets deliver capital services over time due, for example, to physical wear and tear.
Combined capital and labour inputs Indexes of labour and capital inputs are aggregated to form an index of ‘combined inputs’. The preferred approach is to form a Tornqvist index, which has a number of desirable statistical properties and is consistent with a flexible form of a (translog) production function. It assumes constant returns to scale and that competitive markets exist to ensure that labour and capital are paid according to their marginal products.

17
Appendix 2
IInternational patterns of productivity growth
We start with a review of international patterns of productivity growth over a long period as it indicates some important characteristics of productivity growth. For this purpose, the United States is taken to be the productivity leader in the sense that it has generally used the most efficient technologies and methods of production, distribution and sales. The performance of other countries is examined in terms of the degree to which they have been able to catch up to US productivity.
The United States First, the pace of productivity growth has shifted over time. Shifts in the productivity frontier — as indicated by labour productivity growth in the US business sector — have come at distinctly different rates in three stages since 1950:
a high rate of growth from 1950 to 1973 (3.0 per cent per year);
a slower rate from 1973 to 1992 (1.6 per cent per year); and
a return to stronger growth from 1992 to 2005 (2.4 per cent per year).
Second, frontier shifts in the US economy have had a strong industry dimension. In terms of broad industry sectors, the strong productivity growth of the 1950s and 1960s was primarily sourced from agriculture and manufacturing; and the acceleration in the 1990s came from manufacturing and services.
The diversity in the timing and extent of productivity accelerations is more marked at the level of individual industries. For example, within the manufacturing sector, there was strong productivity growth in chemical products and transport equipment (including motor vehicles) in the 1950s and 1960s, but it subsequently faded (figure 1). Manufacturing of electronic and other electrical equipment showed strong MFP growth in all periods and especially so in the 1990s. The industrial machinery and computer equipment industry joined as a major contributor in the 1970s and 1980s and was a leading performer in the 1990s. These last two industries contain the production of information and communications technology (ICT) equipment. ICT manufacturing alone contributed around 0.4 percentage points of the 1 per cent a year growth in US aggregate MFP over the decade from the mid-1990s.
The 1990s productivity acceleration in services has been associated with the innovative use of ICT equipment and has been concentrated in telecommunications, wholesale trade, retail trade and certain financial services. Productivity growth in wholesale and retail trade was on a par with manufacturing productivity growth and,

18
since they are together the same size as manufacturing, they have contributed as much as manufacturing to aggregate US productivity growth.
Figure 1 Multifactor productivity in selected industries, United States Index, 1950 = 100
Data source: BLS
Catch up According to theory, the productivity leader is at the forefront of technology and its rate of productivity growth relies on new technological breakthroughs. Follower countries can achieve faster rates of productivity growth than the leader and catch up to the leader’s productivity level as they engage in ‘technological catch-up’ — by adopting the leader’s technologies and know-how, without undergoing the same investment, learning and adjustment costs; and by ‘leapfrogging’ some technologies rendered obsolete by the leader’s later discoveries.
It is widely recognised that other OECD countries were able to catch up, at least to some degree, to US productivity over the course of the 20th century.5 OECD countries with productivity levels at 75 per cent or more of the US level numbered 4 in 1950, 12 in 1973, and 18 in 1995.6
There are several qualifications, however, on viewing catch-up as an inexorable force.
First, the pattern of catch-up has varied over time. Catch-up was most rapid in the period from 1950 to 1973. Differences in productivity levels among OECD countries
5 Outside the OECD there is no general tendency for productivity levels to converge with those in high-income countries. One explanation is that the potential for catch-up depends upon a range of conditions — political institutions, culture, education, natural resource endowments and savings rates. Among high-income OECD countries these conditions were similar and there was historical convergence to similar productivity levels. 6 Counts are based on The Conference Board and Groningen Growth and Development Centre, Total Economy Database, September 2006.
50
100
150
200
250
300
1949 1955 1961 1967 1973 1979 1985 1991 199750
100
150
200
250
300Chemicals and allied products
Industrial machinery and computer equipment
Transportation equipment
Electronic and other electrical equipment
19
closed by around two-thirds over this period. However, the overall rate of convergence slowed after 1973 and even further after the mid-1990s.
Second, the patterns of catch-up have varied between countries. While many countries have attained similar productivity levels to those in the United States, other countries have seen productivity gaps maintained over long periods. Countries fell into four groups:
those that overtook the US productivity level in the post-war period — France, Belgium, Norway, The Netherlands and Germany — and in the process took their relativities above pre-war levels;
those that caught up to the US level to a large degree — Japan, Denmark, Finland, Spain and the United Kingdom;
those that showed weak catch-up — Canada and Australia; and
those that fell behind — New Zealand.
Industry differences across countries provide a further qualification to the notion of automatic catch-up. A country’s industry mix can affect its aggregate level of productivity — countries with a bias toward oil extraction have been able to overtake the US productivity level. Depending on a country’s industry mix, it may be easier or harder for it to catch up.
A country’s scope for catch-up will also depend on within-industry possibilities for catch-up. The historical patterns of international productivity catch-up within individual industries are striking for their diversity. The dispersion in productivity levels across OECD countries has fallen within some industry groups — electricity, gas & water supply, finance & business services and transport & communications. In particular, within electricity, gas & water supply, the dispersion in productivity levels has fallen almost by half. In other industries — agriculture, manufacturing and wholesale and retail — the dispersion in productivity levels has not declined.
An APEC perspective The above discussion has focussed on OECD countries, simply because that was the perspective taken in a recent research project (Dolman, Parham and Zheng 2007). The following charts present a brief picture of developments among APEC countries.
There has been a mixture of performance among APEC countries in terms of catch-up to the leader. Some have not caught up or have only caught up to a mild degree. Others have caught up to substantial degree (figure 2). Recent relative productivity standings are presented in figure 3.

20
Figure 2 Labour productivity in selected APEC economies Output per employed person, US = 100
Data source: The Conference Board and Groningen Growth and Development Centre, Total Economy Database, January 2007.
Figure 3 Labour productivity in selected APEC economies, 2005 1990 USD PPP per employed person
Data source: The Conference Board and Groningen Growth and Development Centre, Total Economy Database, January 2007.
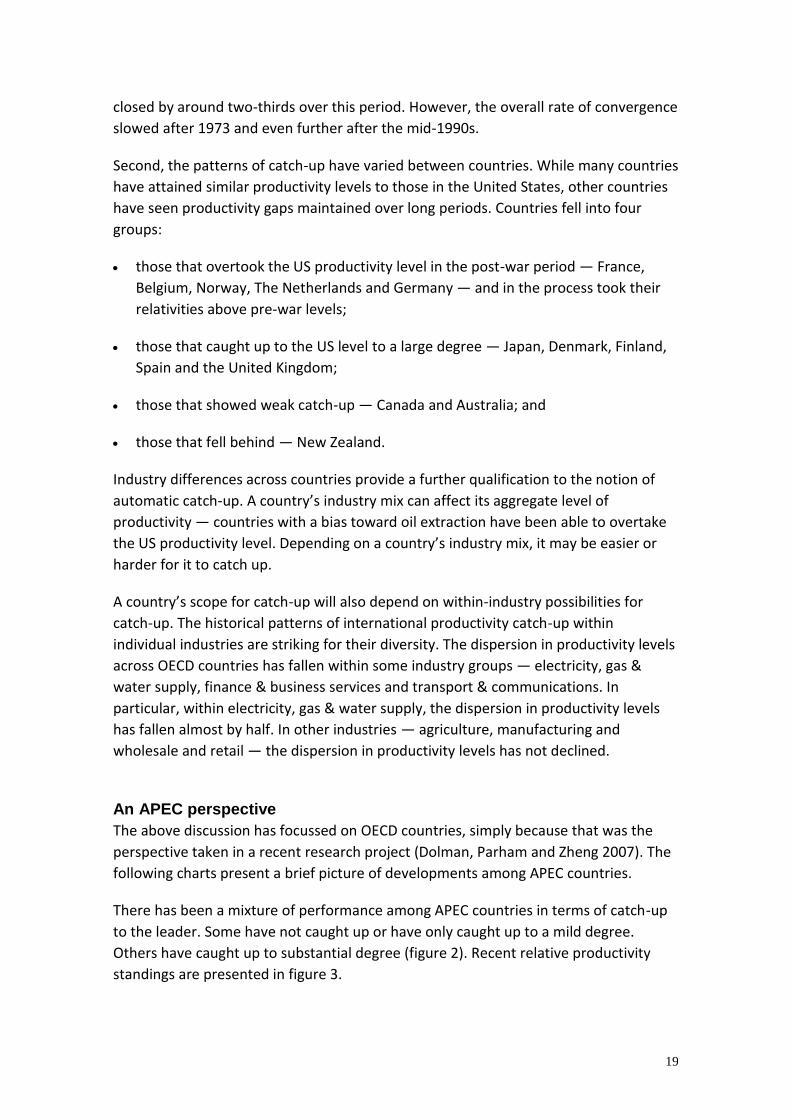
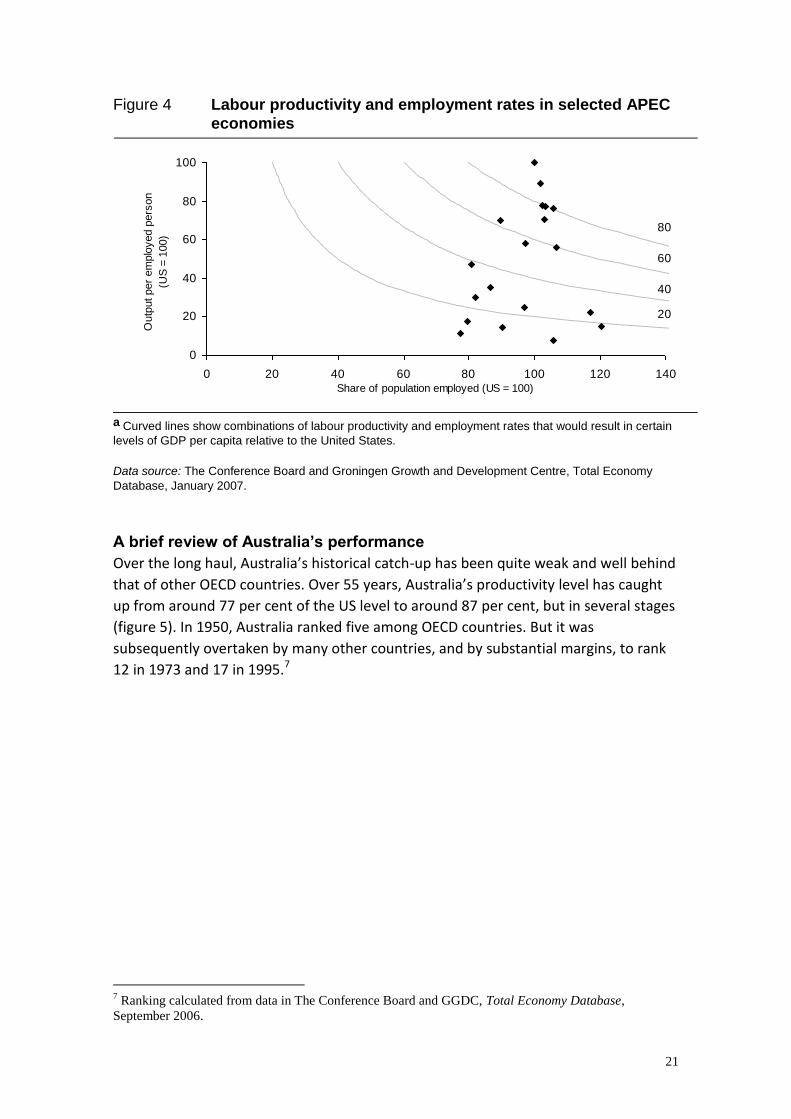
The distribution of APEC countries according to their levels of average income is presented in figure 4 (greater distance from the origin means more average income). The figure also conveys how differences in labour productivity and labour utilisation contribute to differences in average income. It is readily apparent that differences in productivity levels explain most of the variation in average incomes.
0
20
40
60
80
100
1960 1965 1970 1975 1980 1985 1990 1995 2000 20050
20
40
60
80
100
Malaysia
Korea
Chinese Taipei
Thailand
China
Hong Kong, China
Japan
Singapore
0
10000
20000
30000
40000
50000
60000
70000
Viet N
am
Philipp
ines
Indon
esia
China
Peru
Thail
and
Russia
Mexico
Malays
iaChil
e
New Zea
land
Repub
lic of
Korea
Chines
e Taip
eiJa
pan
Singap
ore
Austra
lia
Canad
a
Hong K
ong,
China
United
States
0
10000
20000
30000
40000
50000
60000
70000
21
Figure 4 Labour productivity and employment rates in selected APEC economies
a Curved lines show combinations of labour productivity and employment rates that would result in certain levels of GDP per capita relative to the United States.
Data source: The Conference Board and Groningen Growth and Development Centre, Total Economy Database, January 2007.
A brief review of Australia’s performance Over the long haul, Australia’s historical catch-up has been quite weak and well behind that of other OECD countries. Over 55 years, Australia’s productivity level has caught up from around 77 per cent of the US level to around 87 per cent, but in several stages (figure 5). In 1950, Australia ranked five among OECD countries. But it was subsequently overtaken by many other countries, and by substantial margins, to rank 12 in 1973 and 17 in 1995.7
7 Ranking calculated from data in The Conference Board and GGDC, Total Economy Database, September 2006.
0
20
40
60
80
100
0 20 40 60 80 100 120 140Share of population employed (US = 100)
Out
put p
er e
mpl
oyed
per
son
(US
= 10
0)
80
60
40
20

22
Figure 5 Australia chasing the frontier Australian productivity, per cent of US levela
a The ‘typical convergence path’ is based on average OECD speeds of convergence for the periods 1950 to 1973, 1973 to 1995 and 1995 to 2005. Data source: Authors’ calculations based on The Conference Board and GGDC, (Total Economy Database, September 2006).
Australia caught up little between 1950 and the early 1970s—a period of strong catch-up across the OECD. It can be seen from figure 5 that Australia was well behind the average rate of catch-up (indicated by the dotted line). There was a period of catch-up from the early 1970s to the early 1980s. However, this catch-up coincided with the productivity slowdown in the United States (and elsewhere) and an unsustained boost to productivity in Australia due to developments in labour markets. Real wage inflation in Australia from the mid-1970s held down labour utilisation (by raising unemployment) and boosted productivity. There was a ‘correction’ in the second half of the 1980s as a series of Prices and Incomes Accords unwound earlier real wage rises, leading to growth in employment and labour utilisation and much slower labour productivity growth. Australia’s relative productivity fell back as a result.
There was a second period of catch-up beginning in the early 1990s. Australia’s 1990s productivity surge was stronger, and began earlier, than that in the United States. Australia’s labour productivity reached a peak of 89 per cent in 1998 (a 6 percentage point increase over 6 years). But it has slipped back since, as Australian productivity growth has slowed, while in the United States the rapid pace of the late 1990s has been maintained. The marked drop over the past couple of years may turn out to have a cyclical component, due to a number of developments (such as drought and a phase of hefty investment in mining) that have held back Australia’s productivity growth over the short term.
70
75
80
85
90
1950 1955 1960 1965 1970 1975 1980 1985 1990 1995 2000 200570
75
80
85
90
Typical OECD convergence path
Actual
1973-1995Average = 83
1950-1973 Average = 77
1995-2005Average = 87

23
Key points Productivity growth has strong time and industry dimensions.
- The rates of change in the productivity frontier, as reflected in the rates of productivity growth of the world’s leader, has varied over time as opportunities for productivity growth open up, and close up, in different industries.
- Similarly, the degree of catch-up to the productivity leader has varied across time and industries.
- A particular industry does not necessarily remain a source of strong productivity growth over time.
Catch-up to the productivity leader is by no means automatic.
- The degree of catch-up has varied across countries. Some European countries have caught up fully (or even overtaken), many countries have caught up to some degree, but some have caught up little or not at all.
- There are clearly country-specific factors that determine the differences in productivity performance of countries. Differences in industry mix help to explain some of the differences. But there are other factors as well.