defining the benefits of nnrti treatment new data, new parameters
TRANSCRIPT

Defining the benefits of NNRTI treatment New data, new parameters

Defining the benefits of NNRTI treatmentNew data, new parametersJürgen Rockstroh, MD
Professor of Medicine
University of Bonn, Germany

Agenda
Time Title Speaker
10.15–10.20 Welcome and introduction Jürgen Rockstroh
10.20–10.45 Nevirapine today: what do we know?
Laura Waters
10.45–11.15 Nevirapine tomorrow Joe Gathe
11.15–11.45 Defining success in HIV treatment: should we broaden the parameters?
Vicente Soriano
11.45–12.15 Discussion and debate session All

Housekeeping
Please ensure all mobile phones are set to silent mode
Please use the question cards available and hand these to the hostesses for the discussion sessions

This symposium contains information that is in the public domain but may not be in the labels of the agents discussed.
Inclusion of this material does not represent recommendations for usage but is provided for educational
purposes only.
The views expressed in these presentations are those of the presenters and do not necessarily
reflect the views of Boehringer Ingelheim GmbH.
Please refer to your local label before use of any agents discussed.

Nevirapine Today:What Do We Know?
Dr Laura WatersBrighton & Sussex University NHS Trust, Brighton, UK

Disclosures
Received funding and/or honoraria from all major pharmaceutical companies working in virology

Overview
First-line treatment Current 1st line recommendations What is the latest evidence for nevirapine first-line?
Switching Reasons for switch Switch recommendations and options Benefits of switching to nevirapine

Brighton cohort, ART uptake, and virological failure (VF)
2000 2001 2002 2003 2004 2005 2006 2007 2008 20090
200
400
600
800
1000
1200
1400
1600
1800
2000
Cohort ART VF
% with VF 11% 5% 4% 6% 3% 2% 2% 2% 2% 1%
Personal Communication. Dr Martin Fisher, June 2011
Year
Pat
ien
t n
um
ber

Current guidelines for initiating treatment:preferred and alternative regimens
BHIVA (2008)1 EACS V5.4 (2011)2
IAS-USA (2010)3 DHHS (2011)4‡
NRTIpreferred
TDF/FTCABC/3TC
TDF/FTCABC/3TC
TDF/FTC TDF/FTC
NRTI alternative
ddIZDV
ZDV/3TCddI/3TC or FTC
ABC/3TC ABC/3TCZDV/3TC
3rd drugpreferred
EFV EFV, NVP*ATV/r, LPV/r,
DRV/r, SQV/r, RAL
EFVATV/r, DRV/r
RAL
EFV ATV/r, DRV/r
RALLPV/r†
3rd drug alternative
LPV/r, FPV/r, ATZ/r, SQV/r, NVP*, ATZ **
SQV/r, FPV/r LPV/r, FPV/r, MVC
NVP*, FPV/r, LPV/r
1. Gazzard et al. HIV Medicine 2008;9:563–608; 2. http://www.europeanaidsclinicalsociety.org/guidelinespdf/EACS-EuroGuidelines_FullVersion.pdf ; 3. Thompson et al. JAMA 2010;304:321-333; 4. http://www.aidsinfo.nih.gov/contentfiles/adultandadolescentgl.pdf
*Only when CD4<250 cells/µL in females and <400 cells/µL in males**Where there are established CV disease risk factors and a PI is required†Preferred for pregnant women only (combined with ZDV/3TC)‡Note that specific combinations are recommended

ATV/r vs EFVPrimary virologic endpoint
A5202: Overall
ATV/r versus EFV withABC/3TC: HR 1.13 (95% CI 0.82, 1.56) Prob. VF free at wk 96: 83.4 vs. 85.3%, diff -1.9% (95% CI -6.8, 2.6)TDF/FTC: HR 1.01 (95% CI 0.70, 1.46) Prob. VF free at wk 96: 89.0 vs. 89.8%, diff -0.8% (95% CI -4.9, 3.3)
EFV + TDF/FTCEFV + ABC/3TCATV/r + TDF/FTCATV/r + ABC/3TC

ARTEN involved a relatively advanced ARV-naïve population
Baseline demographics
NVP qd (n=188)
NVP bid (n=188)
ATZ/r (n=193)
Mean age (years) 38.4 40.0 37.6
Male gender (%) 80.9 86.7 83.9
Caucasian (%) 78.2 81.9 79.8
Western Europe (%) 72.3 71.8 68.4
Hepatitis B or C at screening (%) 11.2 10.6 11.9
MSM/IDU (%) 50.5/5.9 54.8/5.9 52.8/6.7
pHIV-RNA >105 log copies/mL (%) 62.8 62.8 65.8
Mean CD4+ count (cells/L) 176.8 187.4 187.8
CD4+ count <50 cells/L (%) 7.4 9.0 6.2
Soriano et al. IAS 2009, Cape Town, South Africa. Poster LBPE07; Soriano et al; Antivir Ther 2011;16:333-348
Nevirapine is not currently indicated for qd dosing in Europe

ARTEN: treatment response(ITT analyses; Week 48)
Pat
ien
ts a
chie
vin
g
trea
tmen
t re
spo
nse
(%
)
Treatment response by primary endpoint (ITT) (two visits prior Wk 48)
95% CI= -5.9% to 9.8%; p=0.63
67 65
0
20
40
60
80
100
ATZ/rCombinedNVP
95% CI= -10.4% to 4.5%; p=0.44
7470
0
20
40
60
80
100
ATZ/rCombinedNVP
Treatment response by sensitivity analysis: TLOVR algorithm (ITT)
Pat
ien
ts a
chie
vin
g
trea
tmen
t re
spo
nse
(%
)
Soriano et al. IAS 2009, Cape Town, South Africa. Poster LBPE07; Soriano et al; Antivir Ther 2011;16:333-348
Nevirapine is not currently indicated for qd dosing in Europe
TLOVR; time to loss of virological response

ARTEN: grade 3−4 events of interest
Combined NVP ATZ/r
DAIDS Grade (% patients) G3 G4 G3 G4
ALT 3.7 3.5 1.6 0.0
AST 4.0 2.1 2.1 0.5
Total bilirubin 1.6 1.6 44.6* 8.8
*Leading to discontinuation in one patient
Soriano et al; Antivir Ther 2011;16:333-348 Nevirapine is not currently indicated for qd dosing in Europe
Grade 3−4
% Combined NVP ATZ/r
Rash 1.6 0.0
No Grade 4 rashes
No cases of SJS, TEN, or deaths due to liver or skin toxicity
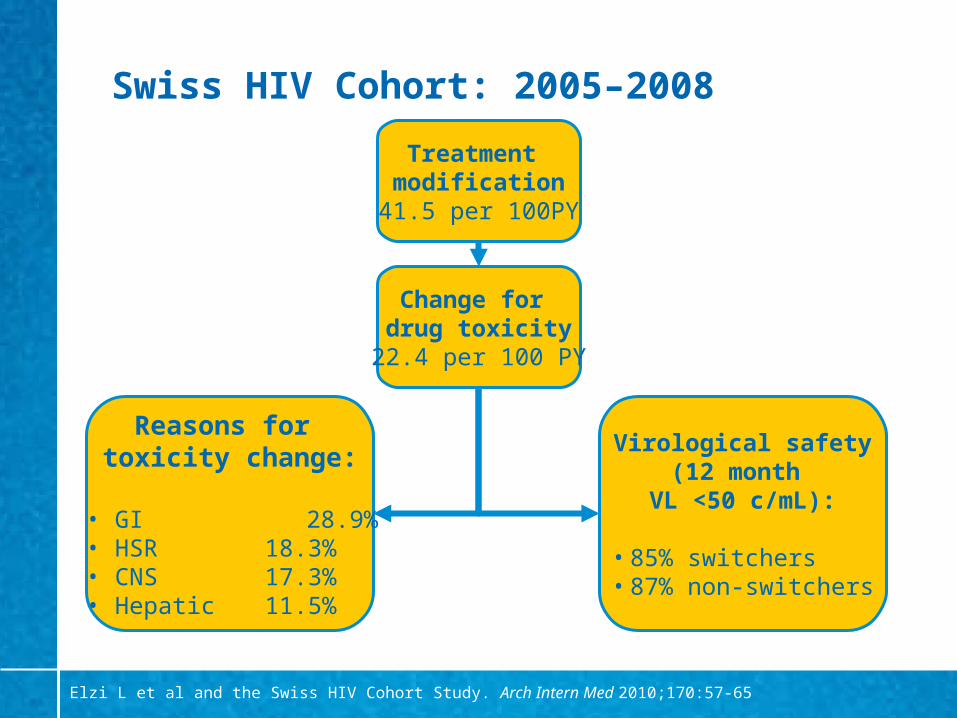
Swiss HIV Cohort: 2005–2008
Treatment modification
41.5 per 100PY
Change for drug toxicity
22.4 per 100 PY
Virological safety(12 month
VL <50 c/mL):
• 85% switchers• 87% non-switchers
Reasons for toxicity change:
• GI 28.9% • HSR 18.3% • CNS 17.3%• Hepatic 11.5%
Elzi L et al and the Swiss HIV Cohort Study. Arch Intern Med 2010;170:57-65

0.00
0.25
0.50
0.75
1.00
Pro
bab
ility
of
trea
tmen
t ch
ang
e
0 3 6 9 12Months
ZDV/3TC + EFVTDF/FTC + EFVABC/3TC + EFV
AZT/3TC + LPV/rTDF/FTC + LPV/rTDF/FTC + ATZ/rTDF/FTC + NVP
Time to treatment modification (all reasons)according to the cART regimen
p<0.001
Elzi L et al and the Swiss HIV Cohort Study. Arch Intern Med 2010;170:57-65
NVP initial toxicity, but limited long-term treatment modification
n=1318

Toxicity management
Earlier ART
Longer life expectancy
Better understanding
of toxicity
Ageing & impact of HIV?
Toxicity management will form more
and more of our workload!

Switching: EACS Guidelines
“Intra-class switch preferable if drug-specific related adverse event”
“PI/r to NNRTI switch for simplification, prevention or improvement of metabolic abnormalities, adherence facilitation.
NVP has the advantage of its metabolic profile. EFV has the advantage of possible FDC”
http://www.europeanaidsclinicalsociety.org/guidelinespdf/EACS-EuroGuidelines_FullVersion.pdf

ARTEN: impact on lipid levels
Mean change from baseline to Week 48
(LOCF) in TC:HDL-c ratio
Mea
n c
han
ge
in r
atio
p=0.0001
-0.24
0.13
-0.3
-0.25
-0.2
-0.15
-0.1
-0.05
0
0.05
0.1
0.15
Combined NVPATZ/r
Adapted from Podzamczer et al. HIV Med 2011;12:374-382 Nevirapine is not currently indicated for qd dosing in Europe
24.4
0.02
19.6
27.8
0
5
10
15
20
25
30
Total cholesterol Triglycerides
Combined NVP ATZ/r
Mean change from baseline to Week 48 (LOCF)
in TC and TG
p=0.0382 p=0.0001
Mea
n c
han
ge
(LO
CF
; m
g/d
L)

Many studies support virological & immunological efficacy of switching
Backbone RAVE SWEET BICOMBO
3rd agent ATARITMO SSAT0029 Several T20 to RAL studies

Recent label change for switching to nevirapine
August 2010 update to Summary of Product Characteristics:
‒ “VIRAMUNE should not be initiated in adult females with CD4 cell counts greater than 250 cells/mm3 or in adult males with CD4 cell counts greater than 400 cells/mm3, who have a detectable plasma HIV-1 RNA unless the benefit outweighs the risk.” 1
Therefore
‒ It is now possible to switch patients with undetectable viral loads (<50 copies/ml) to NVP irrespective of their CD4 cell counts
Viramune SPC, August 2010.

Switch to NVP: relative risks of NVP treatment-limiting toxicities – 7 cohorts
Kesselring et al. AIDS 2009;23:1-11
Toxicities or patient/physician choice = TOXPC
TOXPC, 2610/10186 discontinuedTOXPC 18 wks, 1088/10186 discontinuedHSR with detailed reasons for discontinuation, 458/6547 discontinued
Hazard ratios for discontinuation due to toxicity or HSRs for ARV naïve and experienced patients stratified by CD4 count and VL

Long-term CNS effects with efavirenz vs raltegravir and vs rilpivirine (TMC278)
1. Markowitz et al. J Acquir Immune Defic Syndr 2009;52:350-356; 2. Pozniak et al. AIDS 2010;24:55–65
% p
atie
nts
Rilpivirine is not currently licensed for use in Europe
Series10
10
20
30
40
50
60
70
80
90
100
33
17
60
21
TMC278* (n=93)EFV (n=89)
Neuropsychiatric AEs by 96 weeks: Protocol 0041
Neuropsychiatric symptoms by 96 weeks: Study C2042
Neurological AEs of interest
PsychiatricAEs
% p
atie
nts
*25 mg once daily dose – dose taken into Phase III trials
RAL (n=160) EFV (n=38)0
10
20
30
40
50
60
70
80
90
100
34
58

Switching from efavirenz to nevirapine: impact on CNS toxicity
Retrospective review of switch from EFV to NVP 1998-2007 (n=67) Mean EFV exposure: 25.6 months (range: 1-96 months) Other regimen components unchanged Median CD4 cell count at switch: 576 cells/mm3
All 62 patients with VL <50 copies/mL pre-switch maintained virological suppression post-switch (median 42.6 months [range: 3 months to 10 years])
0/67 patients who switched from EFV to NVP developed rash
On EFV before switch
After switch from EFV to NVP
Neuropsychiatric side effects (n) 43 13
Sleep disturbance (n) 34 9
Ward et al. HIV 9, 2008. Glasgow UK. Poster P057

Switching from EFV to NVP in ACTG A5095: switches due to CNS toxicity
Schouten et al. Clin Infect Dis 2010;50:787–791
No NVP discontinuations for CNS symptoms
Patients switched to NVP due to CNS symptoms (n=47)
Resolved CNS symptoms (n=46) Persistent CNS symptoms (n=1)
No recurrent CNS symptoms (n=41)
New CNS symptoms (n=5)

Comparison of CV risk factors and ultrasonography among patients treated for >5 years with NVP or EFV
CV risk factor(median value)
Nevirapine (n=156) Efavirenz (n=120)
Baseline Follow up P Baseline Follow up P
TC (mg/dL) 199 189 0.0081 177 194 0.0001
HDLc (mg/dL) 44.7 47.1 0.0076 43.2 44.8 0.3938
LDLc (mg/dL) 126 118 0.0054 108 116 0.01
TG (mg/dL) 184 136 0.0001 144 230 0.0001
BMI (kg/m2) 24.1 23.8 0.097 23.6 24.2 0.002
Glucose (mg/dL) 94 93 0.4694 94 101 0.0025
Ultrasonography (% patients)
Baseline Follow up P Baseline Follow up P
Normal 69 64 0.8029 77 26 0.0001
Pathological 31 36 23 74
Statistically significant changes in a favourable directionStatistically significant changes in an unfavourable direction
Subclinical carotid lesions detected by colour-Doppler ultrasonograph
Maggi et al. J Antimicrob Chemother 2011;66:896–900
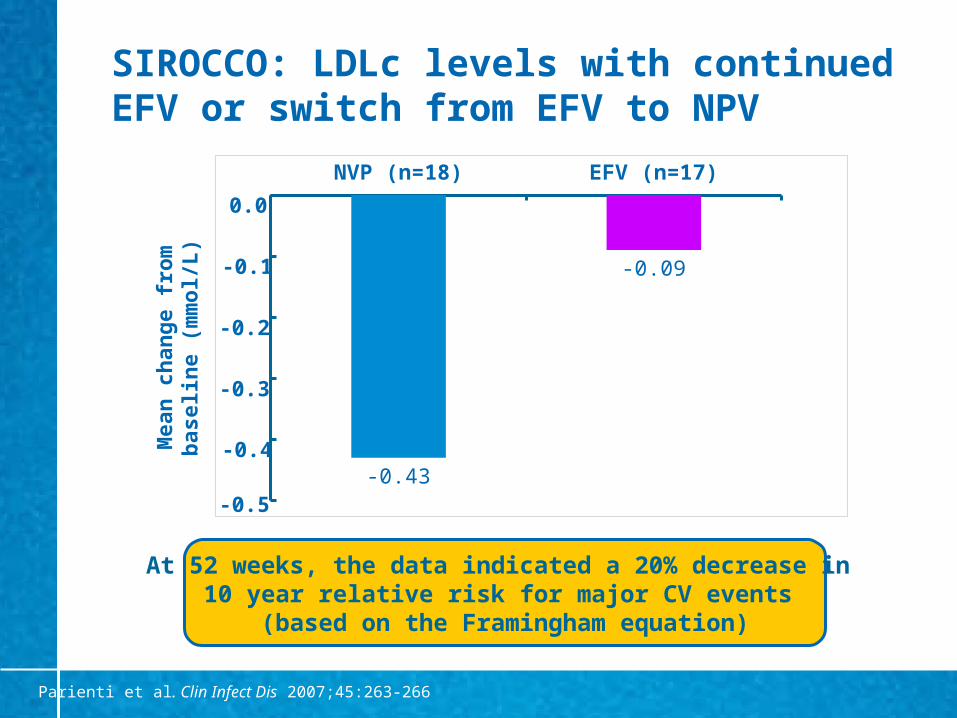
SIROCCO: LDLc levels with continued EFV or switch from EFV to NPV
Parienti et al. Clin Infect Dis 2007;45:263-266
NVP (n=18) EFV (n=17)
-0.43
-0.09
At 52 weeks, the data indicated a 20% decrease in 10 year relative risk for major CV events
(based on the Framingham equation)
Mea
n c
han
ge
fro
m
bas
elin
e (m
mo
l/L)
0.0
-0.1
-0.2
-0.3
-0.4
-0.5
Other within class options
Etravirine Unlicensed indication to use as a 3rd agent (ie without a PI) Twice daily dose
Etravirine SPC , Janssen-Cilag, April 2010: http://www.medicines.org.uk/emc/medicine/21185/SPC/

Median number of Grade 2–4 CNS AE following a switch from EFV to ETR
0
0.5
1
1.5
2
2.5
3
3.5
Combined Analysis
Baseline (n=38)
Week 12 (n=32)
p<0.001
Med
ian
nu
mb
er
G2–
4 C
NS
AE
Waters et al. AIDS 2011;25:65-71

Change in lipids 12 weeks after switching from EFV to ETR
Mean Baseline mmol/L
(IS arm)
Mean Baseline mmol/L
(DS arm)
Mean change mmol/L (SD)
(both arms)p-value
Total cholesterol
5.33 5.26 -0.64(1.02)
<0.001
HDL-cholesterol
1.34 1.09 -0.04(0.21)
ns
LDL-cholesterol
3.58 3.41 -0.58(1.09)
0.021
Triglycerides 1.45 1.73 -0.19(0.62)
0.092
Waters et al. AIDS 2011;25:65-71
IS: immediate switch; DS: delayed switch

N CD4 (cells/µL)Day 0, median
CD4 (cells/µL)Latest value, median
VL <200 c/mLDay 0, %
VL <200 c/mLLatest value (%)
Naïve 67 271 551 0 97
Failure 54 289 565 0 96
Switch 240 461 547 100 100
12-year experience of NVP-containing regimens in routine clinical practice
Reliquet et al. HIV Clin Trials 2010;11:110–117
Patients receiving NVP from 1996–2008N=592 followed up
61% (N=361) still on NVPMedian duration: 176 weeks
(range: 0.3–600)
N=231 discontinuedReasons for discontinuation:• 42% failure• 28% side effects• 30% other causes
Comparative 5-year persistence from April 2003–April 2008 for most frequently prescribed 3rd agent: NVP 61%; EFV 41%; LPV/r 23% (p<0.0001)

Summary
NVP combined with TDF/FTC is an effective treatment option in ARV-naïve patients when used within CD4+ cell count thresholds
NVP provides an established switch option and now can be used without CD4 restrictions in virally suppressed patients
NVP has a favourable lipid profile which may be important given that long-term morbidities include CV disease

Nevirapine Tomorrow
Joseph C Gathe, Jr, MD, FACP, FIDSATherapeutic Concepts, PA
Houston, TX, [email protected]

Disclosures
Received funding and/or honoraria from all major pharmaceutical companies working in virology

Nevirapine Tomorrow
Can twice daily nevirapine be improved?Historical perspectiveAvailable data
Basic science Clinical science
Conclusions
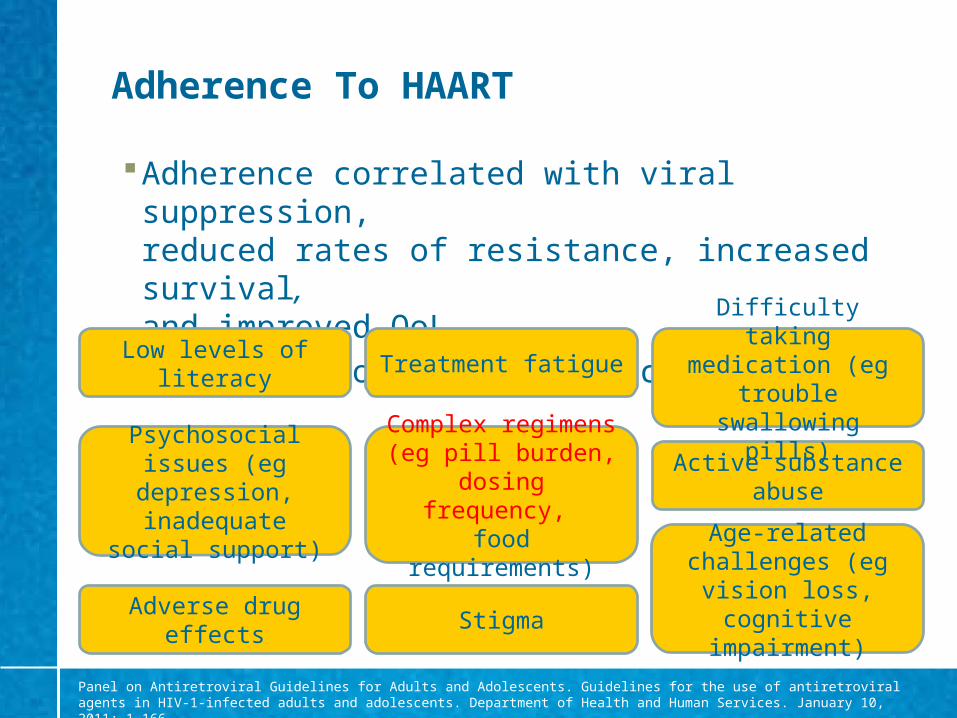
Adherence To HAART
Adherence correlated with viral suppression, reduced rates of resistance, increased survival, and improved QoL
Predictors of poor adherence:
Panel on Antiretroviral Guidelines for Adults and Adolescents. Guidelines for the use of antiretroviral agents in HIV-1-infected adults and adolescents. Department of Health and Human Services. January 10, 2011; 1–166
Low levels of literacy
Age-related challenges (eg vision
loss, cognitive impairment)
Active substance abuse
Stigma
Difficulty taking medication (eg trouble
swallowing pills)
Adverse drug effects
Treatment fatigue
Complex regimens (eg pill burden, dosing
frequency, food requirements)
Psychosocial issues (eg depression,
inadequate social support)

Adherence With QD vs More Frequent Dosing
Boyle et al. HIV Clin Trials 2008;9:164–176
% p
atie
nts
Correct adherence following switch to a qd regimen (EFV/3TC/D4T XR) vs continued use of a bid or more
frequent ARV regimen
Correct adherence = % days with the correct number of doses taken, evaluated with Medication Event Monitoring System (MEMS) caps

Nevirapine Tomorrow
Can twice daily viramune be improved?Historical perspectiveAvailable data
Basic science Clinical science
Conclusions

Can Twice Daily Nevirapine Be Improved?
Nevirapine immediate release (NVP IR) 200 mg twice-daily (bid) is a well established component of effective triple HAART therapy1,2,3
A nevirapine preparation given once daily (qd) would be beneficial in providing dosing symmetry with the guideline recommended qd combination nucleoside therapies3,4
Is this possible?
YES!!!
1. Gazzard et al. HIV Med 2008; 9:563–6082. EACS Guidelines 2009 http://www.europeanaidsclinicalsociety.org/guidelinespdf/1_Treatment_of_HIV_Infected_Adults.pdf; 3. DHHS 2011 http://aidsinfo.nih.gov/contentfiles/AdultandAdolescentGL.pdf; 4.Thompson A et al. JAMA 2010; 304:321–333
Nevirapine is not currently indicated for qd dosing in Europe.

Past Experience With Nevirapine
Safety
2004 2NN study (D4T/3TC) + NVP daily or NVP bid or EFV daily or NVP/EFV
Suggested some AEs may be related to extremes of NVP pharmacokinetic (PK) parameters
Lowering NVP Cmax may reduce common AEs
van Leth et al. Lancet 2004;363:1253–63
Nevirapine is not currently indicated for qd dosing in Europe.

Past Experience With Nevirapine
Efficacy (2NN data) Efficacy not predicted by PK at NVP 400 mg/day dose Patients with lowest NVP trough plasma levels did as well as
patients with the highest levels Viral decay and 48-week data supported use of NVP 3 µg/mL
steady state equivalent plasma exposure as target
Median NVP Cmin of 3 µg/mL should be target
van Leth et al. HIV Clin Trials 2005;6:254-261; Leth et al. AIDS Res Hum Retroviruses 2006:22:232–239

Nevirapine Tomorrow
Can twice daily viramune be improved?Historical perspectiveAvailable data – once daily nevirapine
Basic science Clinical science
Conclusions
Nevirapine is not currently indicated for qd dosing in Europe.

The Basics Of Nevirapine eXtended Release (XR)
NVP XR should ideally show: qd dosing No specific dietary requirements Lower peak plasma levels without compromising efficacy Comparable/improved safety and maintained efficacy vs bid
dosing of NVP IR
Formulation: hydrophilic polymer matrix system, widely used in oral controlled release drug delivery
Nevirapine is not currently indicated for qd dosing in Europe.

The Basics Of Nevirapine XR: Target PK
Hours
NV
P p
lasm
a co
nce
ntr
atio
n (
µg
/mL
)
0
2
4
6
8
0 4 8 12 16 20 24
NVP IR (bid)NVP XR (qd)
Steady state Cmin 3 µg/mL (>30 fold higher than IC90 of wild type virus*)
Cmax/Cmin ratio <1.5
Nevirapine is not currently indicated for qd dosing in Europe.*IC90 for wild type virus = 100 ng/mL
IC90

Nevirapine XR: Overview Of Development
Phase Ia (single dose)
~10 prototypes, healthy
volunteersQ1–Q3 2006
Phase Ib: ERVIR multiple-dose PK (to steady state), NVP IR-
pretreated HIV patients switched to NVP XR
Q4 2006–Q2 2007
Phase III, VERXVE 48-wk final NVP XR formulation vs NVP IR (bid)
Q4 2007–Q3 2009
Phase III, TRANXITION48-wk transition study from NVP IR to XR
Q4 2008–Q3 2010
Colonic absorption
Q2–Q4 2005
Nevirapine is not currently indicated for qd dosing in Europe.

Nevirapine XR: Overview Of Development
Phase Ia (single dose)
~10 prototypes, healthy
volunteersQ1–Q3 2006
Phase Ib: ERVIR multiple-dose PK (to steady state), NVP IR-
pretreated HIV patients switched to XR
Q4 2006–Q2 2007
Phase III, VERXVE 48-wk final NVP XR formulation vs NVP IR (bid)
Q4 2007–Q3 2009
Phase III, TRANXITION48-wk transition study from NVP IR to XR
Q4 2008–Q3 2010
Colonic absorption
Q2–Q4 2005
Nevirapine is not currently indicated for qd dosing in Europe.

The Basics Of Nevirapine XRPhase Ib: ERVIR
Objectives: To establish the steady state PK profile of 2 different NVP XR
formulations (formulation A and formulation B) under fasting and fed conditions
To compare the steady state bioavailability of the 2 different NVP XR formulations with NVP IR (200 mg bid)
Open-label, multiple-dose, parallel group study: 4 countries: Germany, Switzerland, France, USA Enrolled HIV-infected patients (viral load <50 c/mL; n=92)
treated for >12 weeks with a stable regimen based on NVP IR 200 mg bid
Plasma samples at steady-state after IR and XR collected over 24h
Quinson et al. ICAAC 2009, Poster, Abstract A1-1310; Battegay et al. 12th EACS, Nov 2009; HIV Med 10, Suppl 2: 76-77
Nevirapine is not currently indicated for qd dosing in Europe.

ERVIR Results: NVP XR vs NVP IR 400 mg Formulation A
-4 0 4 8 12 16 20 24Time (h)(day)
Mea
n N
VP
pla
sma
con
c. (
ng
/mL
) ±
SD
0
2000
4000
6000
8000
10000 IR 400 mg
XR 400 mg fastedXR 400 mg fed
Quinson et al. ICAAC 2009, Poster, Abstract A1-1310; Battegay et al. 12th EACS, Nov 2009; HIV Med 10, Suppl 2: 76-77
Nevirapine is not currently indicated for qd dosing in Europe.
IC90
*IC90 for wild type virus = 100 ng/mL
n=24

Pharmacokinetic data: relative bioavailability
Fasted Fed0
102030405060708090
100100 100
80
94Nevirapine IR
Nevirapine XR
Bio
avai
labi
lity
(%)
Relative to nevirapine (100%) The bioavailability for nevirapine XR under fasted conditions was 80% The bioavailability for nevirapine XR under fed conditions was 94%
Quinson A et al. ICAAC 2009, Poster, Abstract A1-1310; Battegay, M et al. 12th EACS, Nov 2009; HIV Med 10, Suppl 2: 76-77

The Basics Of Nevirapine XRCan Nevirapine Be Given QD?
Administration of NVP XR 400 mg qd resulted in extended absorption and reductions in peak levels at steady state while attaining similar troughs levels as NVP IR
NVP 400 XR formulation A exhibited better bioavailability and lower variability than other XR formulations
NVP XR formulations demonstrated similar rates of AEs and nearly all were mild
No virologic failures were observed
NVP XR 400 mg formulation Aselected for Phase III studies
Nevirapine is not currently indicated for qd dosing in Europe.
Quinson et al. ICAAC 2009, Poster, Abstract A1-1310; Battegay et al. 12th EACS, Nov 2009; HIV Med 10, Suppl 2: 76-77

Nevirapine Tomorrow
Can twice daily viramune be improved?Historical perspectiveAvailable data
Basic science Clinical science
Conclusions

Nevirapine XR: overview of clinical development
Phase Ia (single dose)
~10 prototypes, healthy
volunteersQ1–Q3 2006
Phase Ib: ERVIR multiple dose PK (to steady state), NVP IR-
pretreated HIV patients switched to XR
Q4 2006–Q2 2007
Phase III, VERXVE 48-wk final NVP XR formulation vs NVP IR (bid)
Q4 2007–Q3 2009
Phase III, TRANXITION48-wk transition study from NVP IR to XR
Q4 2008–Q3 2010
Colonic absorption
Q2–Q4 2005
Nevirapine is not currently indicated for qd dosing in Europe.

Efficacy and safety of nevirapine extended-release once daily versus
nevirapine immediate-release twice daily in treatment-naïve HIV-1 infected patients
J Gathe, J Andrade-Villaneuva, S Santiago et al.
Antivir Ther 2011;16: in press

VERXVE: Objectives And Study Design
• Objective:– To evaluate the efficacy and safety of NVP XR 400 mg qd
vs NVP IR 200 mg bid, in ARV treatment-naïve, HIV–1-infected patients
• Study design:– 48 week, double-blind, double-dummy, non-inferiority study
• Subjects:– NVP eligible adult subjects with CD4/mm3 counts of 50–400 for
men and 50–250 for women – Baseline viral load (VL) stratification (≤100,000 vs
>100,000 copies/mL)
Nevirapine is not currently indicated for qd dosing in Europe.Gathe et al. Antivir Ther 2011;16: in press (doi:10.3851/IMP1803)

Eligible patient
Screening
NVP IR 200 mg qd +TDF/FTC for 14 days
Randomisation
Group A (n=505)400 mg qd
NVP XR + TDF/FTC
Group B (n=506)200 mg bid
NVP IR + TDF/FTC
VERXVE Study Schema
Nevirapine is not currently indicated for qd dosing in Europe.Gathe et al. Antivir Ther 2011;16: in press (doi:10.3851/IMP1803)

VERXVE: Study Endpoints
• Primary endpoint:– Sustained virologic response at 48 weeks – defined as VL
<50 copies/mL prior to and at week 48, without virologic rebound or change of ARV therapy
• Secondary endpoints:– Time-to-loss of virologic response (TLOVR) – Time to new AIDS or AIDS-related progression event or death– AEs, SAEs, AEs leading to discontinuation; laboratory
parameters– PK parameters – NVP plasma trough concentrations– Genotypic resistance associated with virologic failure
Nevirapine is not currently indicated for qd dosing in Europe.Gathe et al. Antivir Ther 2011;16: in press (doi:10.3851/IMP1803)
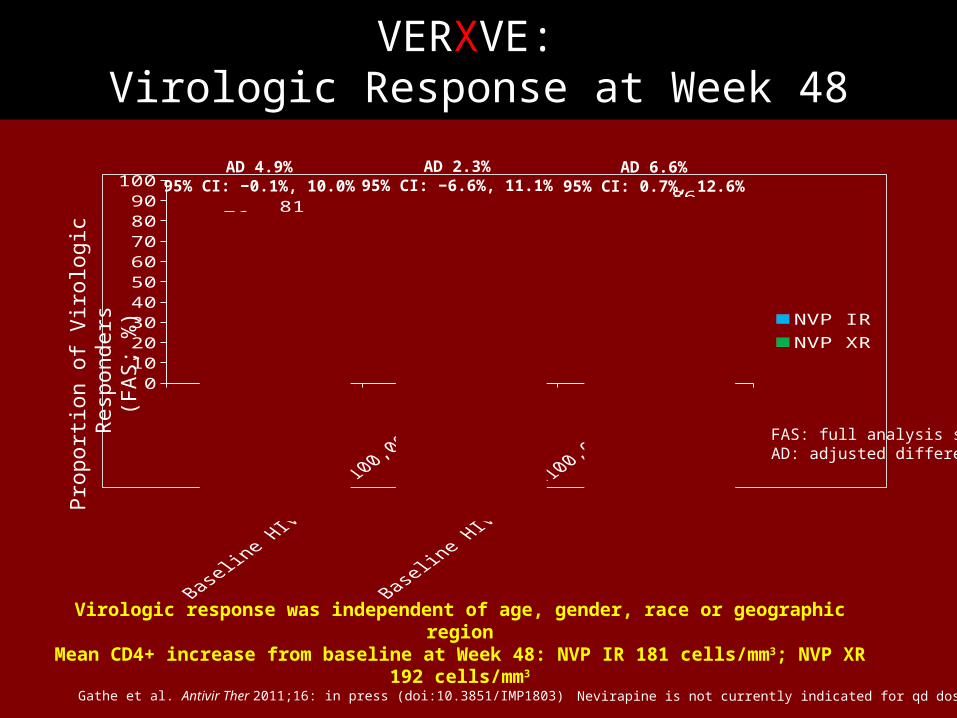
Total
Basel
ine
HIV-R
NA >10
0,00
0 c/
mL
Basel
ine
HIV-R
NA <10
0,00
0 c/
mL
0
20
40
60
80
10076 71
798173
86
NVP IRNVP XR
Pro
port
ion
of V
irolo
gic
Res
pond
ers
(FA
S; %
)
AD 4.9%95% CI: −0.1%, 10.0%
AD 2.3%95% CI: −6.6%, 11.1%
AD 6.6%95% CI: 0.7%, 12.6%
Virologic response was independent of age, gender, race or geographic regionMean CD4+ increase from baseline at Week 48: NVP IR 181 cells/mm3; NVP XR 192 cells/mm3
FAS: full analysis setAD: adjusted difference
n=506 n=505 n=203 n=194 n=303 n=311
VERXVE: Virologic Response at Week 48
Nevirapine is not currently indicated for qd dosing in Europe.Gathe et al. Antivir Ther 2011;16: in press (doi:10.3851/IMP1803)

Weeks
Mea
n d
ose
tro
ug
h N
VP
(µ
g/m
L)
10th percentile trough concentration for Viramune XR
0
1
2
3
4
5
6
4 6 8 12 16 24 32 40 48
NVP IR (4.11 µg/mL)NVP XR (3.35 µg/mL)
(~38-fold higher)
IC90 for wild type HIV-1 virus*
VERXVE: Multiple Dose Trough Concentrations NVP IR and NVP XR
Geometric Mean, µg/mL
Boehringer Ingelheim: Data on file
Nevirapine is not currently indicated for qd dosing in Europe.*IC90 for wild type virus = 100 ng/mL

Selected AEs Of Interest During The Randomisation Phase (Post-NVP IR Lead-In)
NVP IR, n (%) NVP XR, n (%)
Treatment-related rash (all grades)
25 (4.9) 29 (5.7)
Grade 3 rash 3 (0.6) 3 (0.6)
Stevens Johnson Syndrome
3 (0.6)* 0 (0.0)
Any hepatic event 46 (9.1) 28 (5.5)
Symptomatic hepatic events
22 (4.3) 14 (2.8)
*2 grade 3 and 1 grade 4 cases. No instances of SJS or grade 4 rash in the nevirapine XR group
Nevirapine is not currently indicated for qd dosing in Europe.Gathe et al. Antivir Ther 2011;16: in press (doi:10.3851/IMP1803)

VERXVE: Conclusions
• The VERXVE pivotal trial demonstrated:
– Non-inferior efficacy for NVP XR compared withNVP IR independent of baseline viral load, age, race, gender, region, HIV-1 subtype or CDC class
– No new AEs identified, reflecting similar safety and tolerability profiles for both formulations
Nevirapine is not currently indicated for qd dosing in Europe.Gathe et al. Antivir Ther 2011;16: in press (doi:10.3851/IMP1803)

Nevirapine XR: Overview Of Clinical Development
Phase Ia (single dose)
~10 prototypes, healthy
volunteersQ1–Q3 2006
Phase Ib: ERVIR multiple-dose PK (to steady state), NVP IR-
pretreated HIV patients switched to XR
Q4 2006–Q2 2007
Phase III, VERXVE 48-wk final XR formulation vs NVP IR (bid)
Q4 2007–Q3 2009
Phase III, TRANXITION48-wk transition study from NVP IR to XR
Q4 2008–Q3 2010
Colonic absorption
Q2–Q4 2005
Nevirapine is not currently indicated for qd dosing in Europe.

TRANXITION: Objectives And Study Design
Objectives: To assess the efficacy, safety and tolerability of switching HIV-1
infected patients from NVP IR to XR vs continued NVP IR
Study design: Open-label, randomised, parallel group study
Subjects: Adults with HIV RNA <50 copies/mL Randomised 2:1 to NVP XR 400 mg qd vs NVP IR 200 mg bid
n=200 vs 100 patients Stratified by background therapy and CD4+ count
Patients remain on previous background therapy Treatment duration: 48 weeks
Nevirapine is not currently indicated for qd dosing in Europe.
Arasteh et al. JIAS 2010;13(Suppl 1):abstract P45 and poster
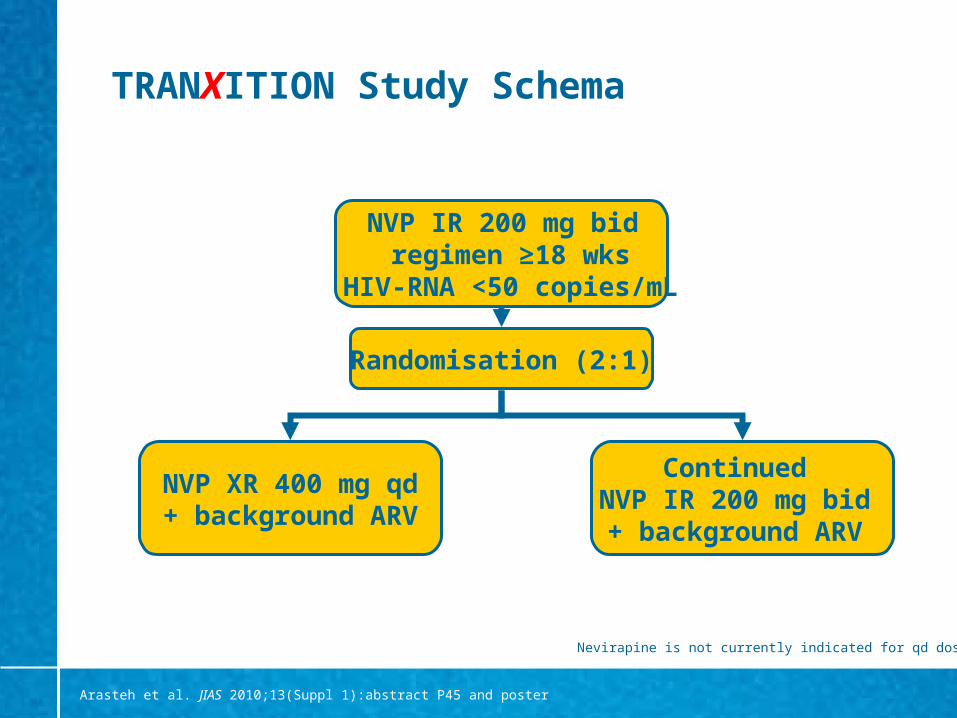
TRANXITION Study Schema
NVP IR 200 mg bid regimen ≥18 wks
HIV-RNA <50 copies/mL
Randomisation (2:1)
NVP XR 400 mg qd+ background ARV
Continued NVP IR 200 mg bid + background ARV
Nevirapine is not currently indicated for qd dosing in Europe.
Arasteh et al. JIAS 2010;13(Suppl 1):abstract P45 and poster

TRANXITION: Endpoints
Primary endpoint: sustained treatment response at 24 weeks Sustained treatment response: viral load <50 copies/mL for
two consecutive visits prior to Week 24
Secondary endpoints: Virologic response after 48 weeks of treatment Proportion of patients with viral load <50 copies/mL
at each visit Change in CD4+ cell count from baseline at each visit Genotypic resistance associated with virologic failure Incidence of AIDS progression or death
Nevirapine is not currently indicated for qd dosing in Europe.
Arasteh et al. JIAS 2010;13(Suppl 1):abstract P45 and poster

Conclusions: Nevirapine Tomorrow
It remains important for health care professionals to have as many evidence-based treatment options for the millions of HIV infected patients worldwide
Once-daily regimens may make it easier for patients to accept and adhere to therapy
Nevirapine XR qd provides the potential for: Dosing symmetry with preferred combination
nucleoside analogues A more convenient treatment regimen for patients
compared with bid dosing Nevirapine is not currently indicated for qd dosing in Europe.

Defining success in HIV treatment: should we broaden the parameters?
Vicente Soriano
Infectious Diseases Department
Hospital Carlos III
Madrid, Spain

Disclosures
Received funding and/or honoraria from most major pharmaceutical companies working in virology

Background
Although NNRTIs as a class have been available for over 15 years, new data continue to emerge on older (NVP and EFV) as well as newer agents (ETV)
Although current ARV regimens allow suppression of viral load (HIV-RNA <50 copies/mL) in most adherent individuals, there is still room to improve efficacy– Consideration of new parameters may help in this task

New parameters of interest
What is the potential significance of ultra-sensitive viral load measurement?
What is the clinical value of baseline tropism assessment?
What is the clinical relevance of Vitamin D levels in HIV-infected patients?

New parameters of interest
What is the potential significance of ultra-sensitive viral load measurement?
What is the clinical value of baseline tropism assessment?
What is the clinical relevance of Vitamin D levels in HIV-infected patients?

Ultra-sensitive VL measurement
Residual HIV replication is a major obstacle for HIV eradication using ARV drugs
Low-level HIV replication may contribute to systemic inflammation and drives organ dysfunction in the long-term
Selection of drug resistance has been described in patients with undetectable plasma viremia but low-level replication in other compartments
Encephalitis and meningoencephalitis have been reported in patients treated with ARVs with low CNS penetration

154 HIV-infected patients on ARV therapy with plasma HIV-RNA <50 copies/mL (average: 29 months)
Mean nadir CD4 count 270 cells/µL
NVP was the only independent predictor of VL <2.5 copies/mL
NVP shows a greater penetration into extravascular compartments
Plasma HIV-RNA<2.5 copies/mL
% p
atie
nts

AIDS 2011; 25: 341-344
165 pts with plasma HIV-RNA <50 c/mL for >6 months on TDF/FTC + NVP or EFV
HIV-RNA 1–49 c/mL was independently associated with:– EFV vs NVP (OR 2.9; p=0.005)– Shorter length of viral
suppression (OR 2.3; p=0.004) Good penetration of NVP in
anatomic compartments could explain greater control of viral replication
Plasma HIV-RNA <1 cop/mL
% p
atie
nts p<0.001
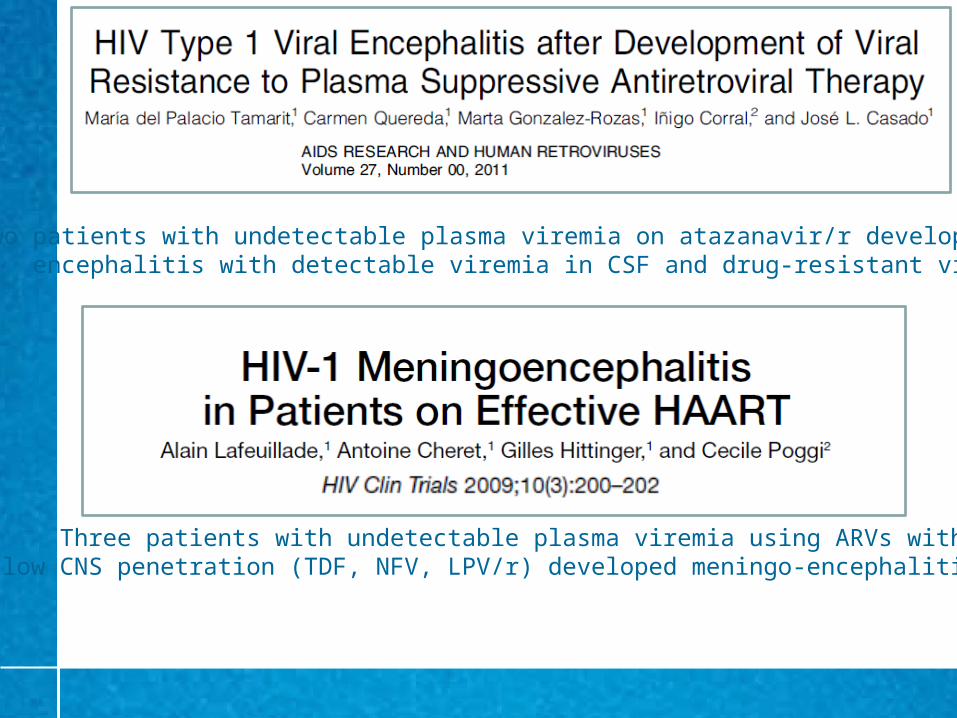
Two patients with undetectable plasma viremia on atazanavir/r developed encephalitis with detectable viremia in CSF and drug-resistant viruses
Three patients with undetectable plasma viremia using ARVs withlow CNS penetration (TDF, NFV, LPV/r) developed meningo-encephalitis

Sanctuary site penetration-effectiveness ranks
CNS 1* Genital tract 2
4 3 2 1 1 (>50%) 0.5 (10–50%) 0 (<10%) NRTIs ZDV ABC ddI TDF TDF
FTC 3TC ZDV d4T ABC
FTC3TCddI
NNRTIs NVP DLV ETR NVP EFV EFV ETRPIs IDV/r DRV/r ATZ NFV IDV/r APV/r NFV
fAPV/r ATZ/r RTV ATZ/r RTVIDV fAPV SQV DRV/r LPV/r
LPV/r SQV/r TPV/r
Entry/Fusioninhibitors
MVC T-20 MVC T-20
Integrase inhibitors
RAL RAL
1. Letendre et al. 17th CROI 2010; abstract 172; 2. Lambert-Niclot et al. J Med Virol 2011;83:1391–1394
*Rank: 4 (much above average) to 1 (below average)

New parameters of interest
What is the potential significance of ultra-sensitive viral load measurement?
What is the clinical value of baseline tropism assessment?
What is the clinical relevance of Vitamin D levels in HIV-infected patients?

The ARTEN study
Key data 569 ARV-naive HIV individuals Non-inferiority of NVP vs ATV/r Similar CD4 gain with NVP
and ATV/r The combination of NVP +
TDF/FTC was effective Use of CD4 thresholds for NVP
initiation was associated with manageable side effects
Better lipid profile following NVP than ATV/r
Soriano et al. Antivir Ther 2011;16:339-48.
Pat
ien
ts a
chie
vin
g
trea
tmen
t re
spo
nse
(%
)
Treatment response by primary endpoint (ITT)
(HIV-RNA <50 copies/mL at 2 visits prior Wk 48)
95% CI= -5.9% to 9.8%; p=0.63
67 65
0
20
40
60
80
100
ATZ/rNVP qd + bid
Nevirapine is not currently indicated for qd dosing in Europe

Tropism sub-study in ARTEN

ARTENMain characteristics of the tropism sub-study population
Seclen et al. J Infect Dis 2011;204:139–144
Treatment arm HIV tropism
ATV/r NVP P R5 X4 P
N 146 282 – 336 55 –
Male, % 84.2 87.6 >0.1 88.4 85.5 >0.1
Non-B subtypes, % 21.9 22.7 >0.1 20.8 10.9 0.099
HCV coinfection, % 11.0 10.3 >0.1 11.0 9.1 >0.1
Median baseline plasma HIV RNA level, log copies/mL (IQR)
5.19 (4.71–5.61)
5.17 (4.73–5.59)
>0.15.16
(4.67–5.59)5.38
(5.03–5.69)0.044
Median baseline CD4, cells/µL (IQR)
180 184 >0.1 188 145 <0.001

Endpoint, week
HIV tropism Treatment arm
R5 X4 P ATV/r NVP P
Median CD4, cells/µL (IQR)
24116
(56–197)117
(66–172)>0.1
116 (72–204)
111 (45–189)
>0.1
48156
(83–244)180
(86–235)>0.1
180 (99–251)
152 (78–230)
0.037
HIV RNA <50 copies/mL (% patients)
24 83.2 60.9 0.001 77.2 82.1 >0.1
48 91.6 76.9 0.009 88.5 92.0 >0.1
ARTEN Virologic and immunologic outcomes
Seclen et al. J Infect Dis 2011;204:139–144

ARTENPredictors of VL response and CD4 recovery
Seclen et al. J Infect Dis 2011;204:139–144
End-point, covariable β Coefficient (95% CI) P
CD4 count, cells/µL
Week 24 Viral tropism (R5) - >0.1
Baseline CD4 cell count -14.73 (-27.50 to -1.96) 0.024
Baseline viral load 33.74 (14.44–53.04) 0.001
Week 48 Viral tropism (R5) - >0.1
Treatment arm (ATV/r) 35.05 (7.82–62.27) 0.012
Baseline viral load 47.86 (27.14–68.58) <0.001
Viral load of <50 copies/mL OR (95% CI)
Week 24 Baseline CD4 cell count 1.40 (0.99–1.96) 0.055
Viral tropism (R5) 2.62 (1.24–5.52) 0.012
Baseline viral load 0.19 (0.10–0.36) <0.001
Week 48 Viral tropism (R5) 2.43 (0.96–6.16) 0.061
Viral subtype (non-B subtypes)
0.43 (0.18–1.01) 0.054
Baseline CD4 cell count 1.68 (1.04–2.72) 0.035
Baseline viral load 0.41 (0.20–0.84) 0.014

ARTENPredictors of VL response and CD4 recovery in HIV clade B viruses (n=315)
Seclen et al. J Infect Dis 2011;204:139–144
End-point, covariable β Coefficient (95% CI) P
CD4 cell count, cells/µL
Week 24 Viral tropism (R5) - >0.1
Baseline CD4 cell count -18.34 (-32.14 to -4.53) 0.009
Baseline viral load 36.68 (14.54–58.83) 0.001
Week 48 Viral tropism (R5) - >0.1
Treatment arm (ATV/r) 32.24 (1.33–63.15) 0.041
Baseline viral load 55.55 (31.30–79.81) <0.001
Viral load of <50 copies/mL OR (95% CI)
Week 24 Viral tropism (R5) 3.50 (1.61–7.64) 0.002
Baseline viral load 0.17 (0.08–0.34) <0.001
Week 48 Viral tropism (R5) 4.02 (1.48–10.96) 0.007
Baseline viral load 0.22 (0.09–0.56) 0.001

HIV tropism in ARTENSummary
In ARV-naive patients beginning ART, baseline HIV-1 tropism is an independent predictor of viral load response
Baseline tropism testing should be considered along with viral load, CD4 count and resistance testing in all newly diagnosed HIV individuals
Potential implications for interpretation of clinical trials comparing drug regimens

New parameters of interest
What is the potential significance of ultra-sensitive viral load measurement?
What is the clinical value of baseline tropism assessment?
What is the clinical relevance of Vitamin D levels in HIV-infected patients?
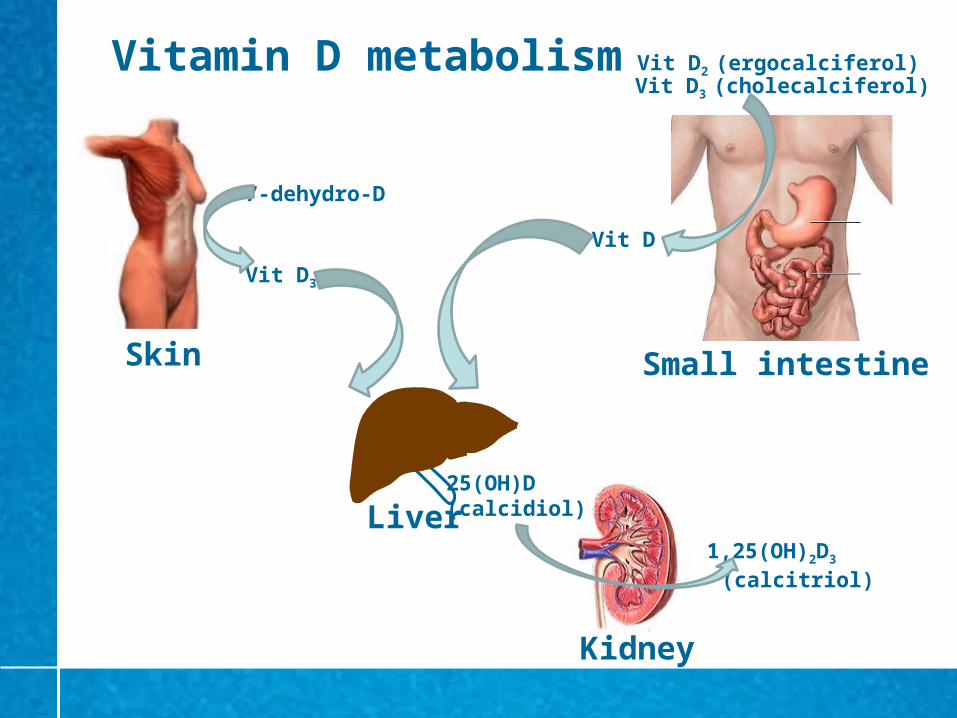
Vitamin D metabolism
Skin Small intestine
Liver
Kidney
7-dehydro-D
Vit D3
Vit D
25(OH)D (calcidiol)
1,25(OH)2D3
(calcitriol)
Vit D2 (ergocalciferol)Vit D3 (cholecalciferol)

Screening for Vit D deficiency is recommended only in patients at risk
Measurement of serum 25(OH)D is the best parameter to evaluate Vit D status
Vit D deficiency definition:
– Serum 25(OH)D <20 ng/mL (50 nmol/L)
Oral treatment with Vit D2 or D3 supplements (up to 10,000 IU/day) should be considered for individuals with serum 25(OH)D deficiency
Intake of 1500–2000 IU/day Vit D are required to keep serum 25(OH)D >30 ng/mL

Diseases associated with Vitamin D deficiency
Type 2 diabetes mellitus Cardiovascular disease Chronic hepatitis C HIV infection

Vitamin D levels in HIV-infected adults in NYC
274 HIV-infected adults 25(OH)D levels by RIA Multivariate analysis for
Vit D deficiency: Black race:
OR 4.1; p=0.007 Detectable HIV-RNA:
OR 2.4, p=0.024
Deficiency (<25)
Insufficiency (25-74)
Optimal (>75)0
10
20
30
40
50
60
70
80
21
69
10
Kim et al. ARHR (in press)
25(OH)D (nmol/L)
% p
atie
nts

Determinants of Vitamin D insufficiency
Reduced milk consumption Decreased sun exposure (sunscreen use) Obesity Others: fat malabsorption syndromes, nephrotic
syndrome, primary hyperparathyroidism, anticonvulsants, ARV drugs (efavirenz, tenofovir, PI/r)
Holick M et al. J Clin Endocrin Metab 2011 (in press)Gharakhanian & Kotler. AIDS 2011; 25: 531-3.

2
Risk factors for severe vitamin D deficiency [25(OH)D <10µg/L; <25 nmol/L]
in 843 HIV-infected patients on cART
Exposure to EFV but not NVP associated with severe Vitamin D deficiency
Welz et al. AIDS 2010;24:1923–1928
Risk factor Univariate analysis Multivariate analysis
OR (95% CI) P OR (95% CI) P
Black ethnicity 2.7 (2.0–3.7) <0.001 2.7 (2.0–3.7) <0.001
Female sex 1.4 (1.04–1.8) 0.03 1.1 (0.8–1.5) NS
Winter season 2.2 (1.6–2.9) <0.001 2.1 (1.6–2.9) <0.001
CD4 nadir <200 cells/µL 1.5 (1.1–2.0) 0.01 1.4 (1.0–1.9) 0.05
Current EFV use 1.9 (1.4–2.5) <0.001 2.0 (1.5–2.7) <0.001
Current NVP use 0.7 (0.6–1.0) 0.06 0.6 (2.3–4.1) NS
Current PI use 0.7 (0.5–0.9) 0.01 0.9 (0.6–1.3) NS
Current TDF use 0.8 (0.6–1.0) <0.1 0.8 (0.6–1.1) NS

SUN study
70% prevalence of Vit D insufficiency/deficiency (<30 ng/ml) in a cohort of 672 HIV+ patients in the US
Comparison: 79% in US adults from the NHANES database
Predictors of Vit D insufficiency/deficiency: – Non-Caucasian race– High BMI– Decreased UV exposure– Efavirenz
Efavirenz reduces 5̀ ng/mL 25(OH)D by inducing 24-hydroxylase, that catabolizes 25(OH)D and 1,25(OH)D
Dao et al. Clin Infect Dis2011; 52: 395-404

Vit D deficiency & HIV infectionSummary
The prevalence of Vit D deficiency/insufficiency is high in HIV+ subjects in the US and West Europe ( `70%)
Besides classical predictors of low Vit D levels, as reduced sun exposure, obesity and black race, the use of efavirenz is a consistent risk factor for Vit D deficiency
The long-term consequences of low Vit D levels must be assessed, including effects on the immune system and skeletal fragility

Defining success in HIV treatment: should we broaden the parameters?
Discussion and debate

Defining the benefits of NNRTI treatment New data, new parameters