defined by excellence
TRANSCRIPT

LANKA WALLTILES PLCAnnual Report 2020/21
Defined by Excellence

14
39
ContentAbout Us 2Our Vision and Mission 6About the Report 7Performance Highlights 8Chairman’s Message 12Managing Director’s Message 16Board of Directors 20Corporate Management 24Our Focus and Strategy 27Creating Value for Our Stakeholders 28How we Engage with Our Stakeholders 30Our Strategy 32Determining Material Issues 34Risks & Opportunities 35Operating Environment 39Business Line Reviews 42Our Stakeholders and Capital 51Stewardship 74Remuneration Committee Report 81Audit Committee Report 82Related party Transactions Review Committee Report 83Annual report of The Board of Directors on the Affairs of The Company 85Chief Executive Officer’s and Chief Financial Officer’s Responsibility Statement 90Statement of Directors Responsibilities 91
Independent Auditor’s Report 94Statement of Financial Position 97Statement of Profit or Loss and Other Comprehensive Income 98Statement of Changes in Equity 99Statement of Cash Flows 100Notes to the Financial Statements 101GRI Index 182Five Year Summary - Statement of Profit or Loss 184Five Year Summary - Statement of Financial Position 186Major Shareholders 188Statement of Value Added 191Notes 192Notice of Meeting 194Form of Proxy 195
GRI - 102-44,102-47
Scan to view this Integrated Annual Report online athttp://www.lankatiles.com

Over the years, Lanka Walltiles has exemplified principles encompassing practicality, functionality, aesthetics, and excellence; values inherent to us and are the fundamental principles behind our portfolio of products and services.
During the year under review, we at Lanka Walltiles transformed and augmented our offerings to serve our valued stakeholders; examining the various factors defined by years of crafting the art of excellence. Today as we remain true to the fundamentals that have kept us steadfast in the face of overwhelming odds, the report you hold is a testament to how we are built to weather any storm that the future may hold through a remarkable sense of perseverance and resilience.
Lanka Walltiles. We’re defined by excellence.
Defined by Excellence

|2|Lanka Walltiles PLC
Group diversified to four Operating segment
29,423 Mn
14
4 sectors
4,013 Mn
Group Revenue
Group Profit
The diversity of our operation spread acocss 14 Subsidiary
About UsLanka Walltiles PLC is the leading manufacturer of tiles in the country with a market share of over 40% and investments in Aluminium, Plantations and Packaging. A strong brand and a network of showrooms, distributors and franchisees support distribution of our products island-wide and overseas. Our operations are carried out through two modern manufacturing facilities in Sri Lanka complemented by certified systems and processes that support our brand.
Group operations span four business sectors
Revenue Rs. 19,330 MnPBT Rs. 3,857 MnSegment Assets Rs. 23,996 MnEmployees 1323
Revenue Rs. 3,894 MnPBT Rs. 449 MnSegment Assets Rs. 4,034 MnEmployees 349
Revenue Rs. 4,074 MnPBT Rs. 357 MnSegment Assets Rs. 3,545 MnEmployees 542
Revenue Rs. 2,125 MnPBT Rs. (81) MnSegment Assets Rs. 4,145 MnEmployees 4,895
Tile
s & Asso
ciated Items Aluminium Products
Plantation Products
Pack
agin
g M
ater
ialsBusiness
sectors
Key Numbers
7,109 33,710 17,799 1,444 3,222Group Employees Total Assets Rs. Mn PPE Rs. Mn Capital Expenditure
Rs. MnSuppliers
GRI - 102-5

|3| Annual Report 2020/21
A new product range for 2020/21
ISO 9001 for Quality Managements system
ISO 14000 for Environment Management Systems
OHSAS 18000 for Occupational Health and Safety
Green Label Certification
Made to International Standards
Enjoying the re�ned treasures of the earthAdorn your home
Dream big
With the essence of nature With the Plus of being essential
With a concrete attitude
With the enchanting experience with the nature
GRI - 102-2
|4|Lanka Walltiles PLC
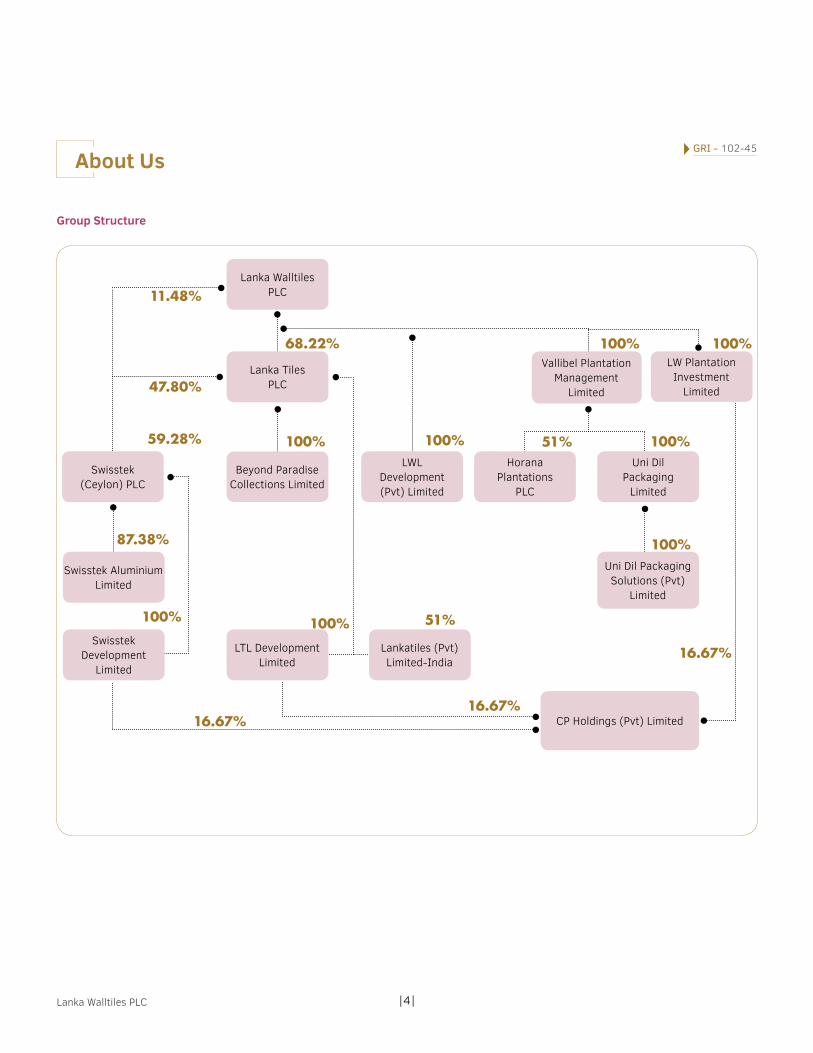
Lanka WalltilesPLC
Lanka TilesPLC
Swisstek (Ceylon) PLC
LWL Development(Pvt) Limited
Horana Plantations
PLC
Uni Dil Packaging
Limited
Swisstek AluminiumLimited
Uni Dil Packaging Solutions (Pvt)
Limited
CP Holdings (Pvt) Limited
Swisstek Development
Limited
Beyond ParadiseCollections Limited
11.48%
47.80%
59.28%
68.22%
100% 100%
100% 100% 51% 100%
100% 100%
100%
16.67%
16.67%16.67%
51%
87.38%
LTL DevelopmentLimited
Lankatiles (Pvt)Limited-India
Vallibel Plantation Management
Limited
LW Plantation Investment
Limited
Group Structure
About UsGRI - 102-45

|5| Annual Report 2020/21
Our Economic Impact
Tile and Aluminium product manufacturing are key import substitution industries and the Group supported the domestic demand as the government focused on curtailing imports to defend the currency and manage balance of payments
Import Substitution
Industry
The Lanka Walltiles Group provides employment to 7,109 full-time employees
Direct Employment
Through our network of dealers, franchise outlets, and outsourced services we create indirect employment opportunities for approximately 1,000 people. We also support the livelihoods of 4,104 tilers and fabricators in the country. We also train around 300 tilers every year together with the National Vocational Qualifications Institute and provide tiles and mortar for the trainees free of charge
Indirect Employment
We created economic value of Rs. 9.1 Bn and distributed Rs. 4.9 Bn to employees, government and providers of finance as given in our Economic Value Added Statement on page 191 of this report.Economic
Value Created
The Lanka Walltiles Group paid taxes totalling to Rs. 2,239 Mn comprising direct taxes of Rs. 406 Mn which included income tax, and pass through taxes of Rs. 1,833 Mn in the form of VAT.
The Group earned US$ 5.2 Mn in foreign exchange during the year which includes exports of tiles, packaging and tea.
Taxation Paid
Foreign Exchange
Earned
GRI - 102-7

|6|Lanka Walltiles PLC
Vision
Mission
Creating a fine art of living
Creating contemporary fashionable lifestyles for our customers while adding value to our stakeholders by excelling in everything we do with the strength of our inherited values
Our Vision and Mission
Values1. Quality: Every tile is manufactured to the highest
quality standards and we can proudly claim that our products are second to none.
2. Style: Our portfolio features a wide range of tiles in a variety of colours, textures and sizes including special trim and decorated tiles.
3. Elegance: Classic style, innovative designs and simple elegance make all our products distinctive in local and international markets.
4. Value: Our stakeholders are diverse and demanding. Over the years we have delivered unmatched value to all of them.
GRI - 102-16

|7| Annual Report 2020/21
About the reportThis is the 4th Integrated Annual Report of Lanka Walltiles PLC which seeks to present a balanced performance of the Group during the financial year ended 31st March 2021 and its resources as at the same date. Our most recent report prior to this was the Annual Integrated Report for the year ending 31st March 2020 which was produced on time despite the lockdowns for nearly 2 months.
Frameworks AppliedFrameworks used in preparation of this report are set out below:
Statutory Frameworks
Voluntary Frameworks
Assurance
• Companies Act No.7 of 2007
• Sri Lanka Financial Reporting Standards issued by the Institute of Chartered Accountants of Sri Lanka
• Listing Rules of the Colombo Stock Exchange
• Code of Best Practice on Corporate Governance issued by the Institute of Chartered Accountants of Sri Lanka
• IR Framework issued by the International Integrated Reporting Council
• GRI Standards “In Accordance – Core”
• Communicating Sustainability issued by the Colombo Stock Exchange
• Assurance has been provided by Ernst & Young on the Financial Statements including the Notes to the Accounts.
In compiling this report we have adhered to the guiding principles set out in the IR Framework. The diversity of our operations spread across 14 companies operating in 4 sectors makes conciseness a challenge as we also need to maintain completeness of the report. The prevailing uncertainty necessitates disclosure of sufficient, relevant financial and non-financial information relating to the sectors as the impact of the pandemic and developments thereafter have a varied impact across the operating sectors.
Scope & Boundaries Financial information is presented in accordance with regulatory requirements and present a view the entire Group including all subsidiaries. Non-financial
of uncertainty regarding the complex combinations of variables and assumptions used to forecast the same and the uncertainties related to forecast external information used in internal forecasts.
Guiding Principles of IR Framework• Strategic focus and future
orientation
• Connectivity of information
• Stakeholder relationships
• Materiality
• Conciseness
• Reliability & Completeness
• Consistency & Comparability
AcknowledgementThe Annual Report of Lanka Walltiles PLC for the year ended 31st March 2021 has been prepared and reviewed by the Management of the Company who have recommended the same to the Group’s Board Audit Committee and Board for their approval.
The Board Acknowledges its responsibility to ensure the integrity of the Annual Report which provides a balanced view of the performance of the Group, addressing all material issues that may have an impact on the Group’s capacity to create value over the short term. The Board is of the opinion that the Integrated Annual Report of Lanka Walltiles PLC for the financial year ending 31st March 2021 is presented in accordance with the <IR> Framework 2021. The report was unanimously approved by the Board on 31st May 2021 and is signed on its behalf by.
information present a view of the entire Group unless otherwise stated.
Forward Looking StatementsForward looking statements included in this report are based on opinions, forecasts and judgements which are associated with varying degrees of uncertainty as they relate to future events, outcomes and impacts which are beyond our control. They are included as we believe this information supports assessment of the future prospects of the Group. Every effort has been made to use reliable sources of information and sources are indicated where relevant. The Board and other preparers of the Annual Report provide this information without recourse or any liability whatsoever due to the relatively high levels
GRI - 102-1,102-46,102-49, 102-50, 102-51,102-52,102-53,102-54
Dhammika PereraChairman
J. D. N. KekulawalaAudit Committee Chairman
J. A. P. M. Jayasekera Managing Director

|8|Lanka Walltiles PLC
Performance highlights
Group CompanyFinancial Performance Unit 2021 2020 Variance
(%) 2021 2020 Variance
(%) Revenue Rs. '000 29,423,381 19,929,709 48 5,988,521 3,493,619 71
Gross Profits Rs. '000 9,236,033 4,784,930 93 2,066,437 956,605 116
Earnings Before Interest and Tax (EBIT) Rs. '000 5,331,516 1,973,221 170 1,886,469 279,201 576
Profit before tax (PBT) Rs. '000 4,582,442 803,676 470 1,755,531 59,124 2,869
Profit after tax (PAT) Rs. '000 4,013,420 414,649 868 1,617,518 38,026 4,154
Profits attributable to shareholders Rs. '000 2,960,211 405,115 631 1,617,518 38,026 4,154
Gross profit margin % 31 24 31 35 27 26
Net profit margin % 14 2 556 27 1 2,382 Return on assets (ROA) % 11.9 1.2 860 19.1 0.4 4,626 Return on equity (ROE) % 20.7 2.7 676 24.9 0.7 3,420
Interest cover No of times 7 2 298 14 1 1,036
Financial Position
Total assets Rs. '000 33,710,005 33,422,877 1 8,470,829 9,410,828 (10)
Capital expenditure Rs. '000 1,443,890 1,222,880 18 219,239 184,394 19
Interest bearing liabilities Rs. '000 6,541,664 11,408,192 (43) 236,109 2,287,347 (90)
Other liabilities Rs. '000 7,773,522 6,457,033 20 1,744,009 1,752,935 (1)
Shareholders’ equity Rs. '000 14,571,216 11,621,070 25 6,490,712 5,370,546 21
Gearing: Debt/Equity % 34 73 (54) 4 43 (91)
Net assets per share* Rs./share 53.37 42.54 25 23.78 19.67 21
Current ratio No of times 1.6 1.2 27 2.2 1.2 80
Quick assets ratio No of times 0.9 0.4 125 1.0 0.3 262
Shareholder information
No of shares in issue No 273,000,000 54,600,000 - 273,000,000 54,600,000 -
Dividend per share* Rs./share 2.72 - - 2.72 - -
Earnings per share* Rs./share 10.84 1.48 632 5.92 0.14 4,129
Market capitalization Rs. '000 10,292,100 2,244,060 359 10,292,100 2,244,060 359
Dividend payout ratio % 25 - 46 -
48% 868% 632%Top-line growth of Group Revenue The Group recorded its highest
ever Profit after tax growthThe Group Earnings per share growth
*Net assets, Earnings and Dividends per share for the year 2020 is calculated by using the number of shares in issue adjusted for the sub-division of five shares for each ordinary share held.

|9| Annual Report 2020/21
Group CompanyUnit 2021 2020 Variance
(%) 2021 2020 Variance
(%) Human capitalNumber of employees No 7,109 7,424 (4) 537 521 3 Female participation No 3,177 3,293 (4) 61 60 2 New recruits No 849 1,405 (40) 83 122 (32)Investment in employee learning
Rs. '000 953 2,820 (100) 118 400 (71)
Average training hours Hours 3,447 9,421 (100) 620 3,890 (84)Employee retention rate % 84 78 8 87 78 12 Minor injury rate Rate
per 100 Workers
2 2 - 3 5 (40)
Manufactured and Intellectual capital
Value of PPE Rs. '000 17,798,602 16,884,149 5 4,603,885 4,524,000 2
Capital expenditure Rs. '000 1,443,890 1,222,880 18 219,239 184,394 19
Depreciation and amortization
Rs. '000 1,010,341 960,034 5 184,107 182,010 1
New product designs No 345 369 (7) 203 165 23
Investment in R&D Rs. '000 6,747 23,662 (71) 2,290 4,180 (45)Social and Relationship capitalDealers No 333 297 12 38 34 12 Distributors No 57 55 4 30 30 - Member in Tilers clubs No 4,104 3,885 6 4,104 3,885 6 Franchises No 72 67 7 47 46 2 Number of suppliers No 3,222 3,054 6 385 399 (4)SME suppliers No 1,745 1,730 1 282 303 (7)Proportion of spending on local suppliers
Rs. '000 9,941,000 9,365,471 6 2,170,000 1,982,454 9
Payments to suppliers Rs. '000 16,357,000 16,590,083 (1) 3,020,000 3,202,322 (6)CSR Rs. '000 9,883 6,023 (80) 373 684 (45)No of beneficiaries of CSR Approx. 20,000 12,543 12 4,000 3,575 12 Natural CapitalRaw materials consumed MT 213,990 208,271 3 34,952 37,748 (7)Aluminium Billets MT 5,522 3,636 52 - - - Energy consumption Litres 1,066,872 1,393,444 (23) 57,151 133,767 (57)LPG Kg 14,551,597 15,001,372 (3) 5,241,154 5,495,872 (5)Firewood/Bio Mass Kg 9,485,496 10,123,640 (6) - - - Emission(Scope 1) (Tco2) 32,828 34,885 (6) 10,809 9,339 16 Electricity Units 38,886,801 38,929,381 (0) 9,818,027 10,177,109 (4)Water withdrawn M3 240,626 239,585 0 43,609 42,509 3 Effluents discharges M3 108,017 144,169 (25) 33,112 34,321 (4)

|10|Lanka Walltiles PLC
Delivering Quality
|11| Annual Report 2020/21
Delivering Quality
Chairman’s Message 12Board of Directors 20Corporate Management 24

|12|Lanka Walltiles PLC
Chairman’s Message“The launch of a range of collections and designs added to the vibrancy of the Company's portfolio by offering a multitude of special accessories, large format tiles and mosaics for elegant interiors.”
Dhammika Perera Chairman
Dear Shareholders,
Lanka Walltiles PLC powered through the challenges of a global pandemic to deliver a stellar performance recording impressive earnings growth of 868% to record Rs.4,013 Mn as profit after tax for FY 2020/21. Timely investments in new technology, developing market infrastructure and capacity building of our people aligned with changes in the operating environment to provide conducive conditions for growth. Agile strategy enabled the Group to seize the unexpected opportunities and drive growth in this capital-intensive sector, leveraging its portfolio of contemporary designs and formats.

|13| Annual Report 2020/21
Poised for growthLanka Walltiles and Lanka Tiles launched over 27 new collections of tiles in the latter half of 2019/20 which gained traction during FY 2020/21. The launch of 345 collections/designs during the year added to the vibrancy of the portfolio which now offered special accessories, large format tiles and mosaics for elegant interiors. Collaboration with Italian designers elevated the concepts and designs to compete successfully in advanced economies in line with the Group’s aspirations to grow exports. The interest has been encouraging with our tiles now listed on Amazon and Wayfair.
Subdued demand in global markets necessitated a change in strategy to focus on the domestic market. Import restrictions of non-essential items including tiles and favourable interest on housing loans combined to drive steady demand for tiles in the domestic market. We expanded our factory outlet network rapidly as budget conscious customers sought a “no frills’ offering. The Group also expanded our showrooms with the full service offering for other customers which have been key to building the brand, with trained staff articulating the customer value proposition and consistent layouts reinforcing the messaging.
Headwinds and TailwindsGlobal output contracted by 3.3% during the year as curtailing the pandemic became a priority for countries around the world. Overnight lockdowns in countries saw a shift to working from home as social distancing became the norm. Business disruptions were widespread resulting in increased unemployment and economic hardship to many. World trade in goods and services declined by 8.5% as countries that engage in the manufacture of goods and delivery of services were subject to disruption.
Sri Lanka was on track for a faster than expected recovery after the April 2019 Easter Sunday terror attacks although there were stresses at the onset of the pandemic. The ensuing healthcare crisis and economic crisis gave rise to conflicting priorities and governments around the world struggled to find the right balance. Stringent measures adopted in the first wave led to a contraction of the economy in the first quarter but a successful outcome on the healthcare crisis. The second quarter saw positive economic growth as economic activity resumed from May 2020. The onset of the second wave in October 2020 saw a decline in economic activity again although its impact was less. These

|14|Lanka Walltiles PLC
two waves resulted in a contraction of the Sri Lankan economy by 3.6% with concerns raised on sustainability of debt servicing and the devaluation of the currency which were exacerbated by the downgrading of sovereign ratings.
The import restrictions imposed on non-essential items and the interest caps imposed on housing loans proved to be strong tailwinds that enabled us to accelerate sales as planned. Strong demand enabled us to maximise capacity utilisation which also increased cost efficiencies, facilitating an impressive performance.
An Agile ResponseAll sectors commenced operations during the lockdown with the Plantation sector starting work within a week and others following soon after. Safety was a key priority across all sectors and protocols were implemented throughout the Group which were adjusted in line with the advice of local health authorities to safeguard customers and employees. The Tiles sector focused on seizing the domestic market growth opportunity to deliver an impressive performance. Unidil packaging improved performance despite the challenges due to strong growth from their customers, investment in new technology and lower paper pulp prices. Plantations benefitted from an uptick in tea, rubber and palm oil prices although productivity and government policy on agriculture may hinder sustainable growth of this sector. Aluminium sector pursued a value addition strategy to drive top line growth while margin growth was driven through Aluminium recycling initiatives which minimised the impact of import restrictions.
The Group’s investment portfolio is skewed to the Tile sector which accounts for an overwhelming majority of its assets (65%), liabilities (48%), and earnings (85%). Two household names, Lanka Walltiles and Lanka Tiles are the main players in
the sector with Swisstek Ceylon producing the mortar and grout required, which is an associated item, as the key players. Investments in the Aluminium sector skews the Group’s exposure to the performance of the construction sector which declined by 13.2% during the year. Portfolio diversity is achieved through the investments in the Plantations and Packaging sectors which account for the 12% and 11% of consolidated assets respectively.
PerformanceTop line growth of 48% driven mostly by the Tiles sector enabled the Group to record revenue of Rs.29,423 Mn which is the highest revenue recorded in the history of the Group. Capacity utilisation, cost efficiencies and lower finance costs underpinned the Group’s phenomenal growth of earnings to Rs.4,013 Mn for the year ended 31st March 2021 which is also the highest profit achieved by the Group. These achievements reflect the professionalism of the team, a commitment to quality and innovation and an indomitable spirit that drives our growth.
Every sector has performed better than the previous year which is attributable to the detailed refinement of plans and oversight of performance throughout one of the most challenging years in recent times.
Balance sheet strength improved as net assets increased from Rs.15,557 Mn to Rs.19,395 Mn during the year as retained profits increased equity. Strong cash flows enabled repayment of Rs.4,866 Mn in interest bearing liabilities and strengthening of debt equity ratios from 73% in FY 2019/20 to 34% at the close of the year.
Value to ShareholdersThe Group focused on unlocking value to shareholders as the Colombo Stock Exchange saw the ASPI increase by 55.77% from 4,571.63 to 7,121.28. The share price of Lanka Walltiles PLC increased from Rs.41.10 per share to Rs.188.50 providing shareholders a return of 358% for the financial year from capital appreciation.
Lanka Walltiles also paid out two cash dividends of Rs.3.60 per share and Rs.10.00 per share on November 2020 and February 2021 which is a return of a further 33% for shareholders based on the share price at the beginning of the year, creating 391% for shareholders for the financial year from both dividends and capital gains.
The sub-division of shares of 1:5 approved at the Extraordinary General Meeting has unlocked further value with increased liquidity of the share. At the time of writing, a sub-divided share was priced at Rs.52.90 which is an increase of 40% post sub-division.
Your Board recommends a dividend of Rs. 3.10 per share taking in to account the performance which amounts to Rs. 846 Mn as the 3rd and final dividend for the year ended 31st March 2021 giving shareholders a return of 8% for the financial year.
Chairman’s Message

|15| Annual Report 2020/21
Rs.29,423 Mn
358%
REVENUE - GROUP
SHAREHOLDERS RETURN FROM CAPITAL APPRECIATION
Dhammika PereraChairman
31st May 2021
Governance MattersThe Board sharpened focus with the onset of the pandemic as the risks and uncertainty escalated during the year. The Board maintained close communication with the leadership team, staying on top of developments in key areas of vulnerability. Performance and plans were reviewed frequently to assess the health and safety of our people, liquidity and availability of funds which were key priorities for the Board.
The Board endorsed the decision to maintain salaries of employees without resorting to pay cuts or retrenchments despite what appeared to be an extremely challenging year ahead with looming liquidity constraints. The reward has been the performance set out in the pages of this report which bear testimony to the inspired performance and loyalty of the team at Lanka Walltiles.
We expanded the Board as we welcomed Mr. Sanjeewa Jayaweera as a Non-Executive Director to the Board, increasing the breadth of skills and experience within the Board. Accordingly, we now have a significant majority of Non-Executive Directors of whom 5 are independent, enhancing the objectivity of the Board.
Integrating SustainabilityThe Group has been an early champion of integrating Environment, Social & Governance principles into the decision making processes, promoting integrated thinking. This has supported increasing levels of awareness of sustainability principles supported by reliable metrics to enable objective analysis of impacts. All sectors of the Group nurture responsible cultures, minimising waste, optimising efficiencies and ensures health and safety of the people. Certifications endorse the sustainability of our operations, high standards of service and operational excellence that underpins our success. This has also unlocked savings throughout our processes proving our mantra that long term sustainability is synonymous with sustainable profitability.
OutlookThe economic outlook remains uncertain as the pandemic emerges with new waves and strains resulting in border closures and disruptions to economic activity. In Sri Lanka too, we are in shut down for a third wave and the duration of the pandemic will be a key determinant of our economic recovery. The country’s weakened economic conditions raise a number of concerns such as the exchange rate, pressure for upward movement of interest rates, extension of moratoria and sustainability of sovereign debt repayments. On a positive note, the financial services sector and the exports sector have performed well and lending to the construction industry increased in 2020. Interest rates remain low and inflation has also been kept in check. However, vaccinations remain below global averages, increasing our vulnerabilities.
Lanka Walltiles will continue to supply the domestic market through its network of showrooms, factory outlets and franchise partners. We will also pursue expansion of export markets as import restrictions are likely to be a temporary reprieve. We will also revisit our plans to create a one stop shop when import restrictions are eased in the future. These plans are subject to change as uncertainties remain elevated and the potential for converging challenges remain high. We will continue to maintain healthy funding and liquidity positions to enable us to steer through the uncertainty ahead.
AppreciationI commend the leadership of Mr. Mahendra Jayasekera in inspiring his team to deliver the impressive performance set out in the annual report and thank our employees for their commitment and hard work during a difficult time for all. Our business partners have shared our journey and I thank them for their support. I thank the members of the Board who have provided invaluable insights in navigating a difficult year. I thank our shareholders for their confidence over the years and seek their continued support in the year ahead.

|16|Lanka Walltiles PLC
Managing Director’s Message“The Group revenue increased by 48% to reach a phenomenal performance in the Tiles sector and positive contributions from all other sectors, in a year marked with business disruptions, uncertainty and volatility.”
J. A. P. M. Jayasekera Managing Director
Dear Stakeholders,
Lanka Walltiles PLC delivered a stellar performance in FY 20/21 recording the highest profit in the history of the Group of Rs. 4,013 Mn as we aligned our strategies to operate in a post pandemic era with an absence of norms. Decisions taken in the early days of the lockdown to recommence production at our factories and to provide assurance to our staff that their jobs and salaries were safe were akin to a leap of faith. However, the results delivered validate these decisions that were taken primarily out of stakeholder concern and a determination to make our plans work.
GRI - 102-14

|17| Annual Report 2020/21
Planning for the Abnormal From the beginning of the lockdown in March 2020, there was a realisation that we needed to plan for an absence of norms. Despite the mountain of inventory that we had in our warehouses and a complete closure of showrooms, we decided to re-commence production without shutting down the kilns which was a costly task. Inventory was moved to showrooms in various provinces as they opened to ensure that customers had tiles and tilers were able to get work. Our plan was to accelerate sales and catch up for lost time as soon as we were able to open up.
Health and safety was the main priority as we needed to provide a safe work place for employees and we worked with local health authorities to implemented strict health and safety protocols which were continuously reinforced. This enabled us to minimise preventable disruptions that supported continuous production throughout the year while ensuring the safety of our employees.
The government lowered interest rates and extended moratoria for affected businesses which enabled us to extend the cash runways. Wide-ranging import restrictions were also imposed to defend the currency and manage the trade and balance of payment deficits. This changed the supply demand dynamics in the domestic market over the first quarter of the financial year as domestic manufacturers were able to compete without the influx of cheap but low-quality tiles from countries with excess capacity. Export sales also recorded 39% growth year on year, passing the Rs.1 Bn milestone.
It is also noteworthy that the government also imposed interest rate caps on housing loans at 7% for the first 5 years and1% above the AWPLR thereafter. This supported healthy growth of 12.6% for lending for construction with total lending reaching Rs.1.3 Tn to the sector. A corresponding
increase of 12.4% was observed in housing loans in commercial banking sector portfolios which is a sub-sector of the lending for construction. This also supported demand growth during the year as customers took advantage of the low interest rates to invest in housing.
With technical difficulties experienced in the mosaic plant behind us, we were ready to produce at maximum capacity supporting efficient absorption of overheads. This was key to increasing operating margins as we intended to maintain prices at current levels due to the negative market sentiments.
Customer Focused Our new range of mosaic tiles and large format tiles added a vibrancy to our collections that appealed to the customers, supporting steep growth of the top line each quarter in line with our plans. With the gradual opening of our own showrooms and franchise showrooms, customer safety was added to our priorities and appropriate precautions were put in place to safeguard both customers and employees.
Our pricing remained constant throughout the year in view of lower disposable incomes in the country although costs increased during the year exerting pressure on margins towards the end of the year. Discounts were also offered during festive seasons, enabling customers to stretch their budgets. Volume growth of 74% supported movement of mortar and grout manufactured by Swisstek as customers opted to purchase both from our showrooms.
We also observed strong sales growth in our factory outlets as a segment of customers became more price conscious due to the prevailing uncertainties, seeking bargains. Consequently, we opened 04 new factory outlets during the year increasing the ability of customers to access our products.
We also opened 01 new showroom which provide a full service offering to customers including a design service for their bathrooms from our own interior designers who are familiar with our product range. We continued to engage customers via our digital platforms through our websites, social media and the 'LANKATILES' App which provided design ideas for the tiles. The 'LANKATILES' App also enabled customers to find tilers in their area.
A Portfolio ViewTiles & Associated itemsThe Tiles and Associated items sector recorded strong growth of 74% to reach Rs.19,330 Mn in revenues supported by a new tile formats, expansion of customer touchpoints, stable pricing and government policies to address compelling economic issues that proved favourable for domestic tile manufacturers. Initiatives to drive responsible consumption such as Total Productive Maintenance and increased scrutiny of costs supported improved gross margins from 34% in the previous year to 37% for the year under review. Operating margins improved significantly from 15% to 22% as increased sales supported cost efficiencies throughout the value chain. Accordingly, the sector recorded a phenomenal 382% increase in Profit After Tax which amounted to Rs. 3,421Mn in FY 2020/21 compared to Rs.710 Mn in the previous year. The composition of segment assets changed as inventory decreased and receivables increased. We invested Rs.703 Mn in capex to extend kilns to meet the domestic demand which outpaced supply. Liabilities in the sector reduced by 34% or Rs.3,641 Mn as we repaid debt with strong cash flows.
AluminiumAluminium products also delivered top line growth of 20% with revenues of Rs.3,894 Mn. Gross profit margins improved significantly from18% in the previous year
|18|Lanka Walltiles PLC
to 28% in FY 2020/21 due to focused growth in value added products, increased cost efficiencies through use of recycled of raw materials and import restrictions which supported demand growth of our value-added products. These initiatives enabled the sector to turnaround from a loss of Rs. 40 Mn in the previous year to record a profit of Rs. 342 Mn for FY 2020/21 supported by improved operating margins. Segment assets increased by 4% as we increased capital expenditure by Rs.216 Mn to enhance our value added product range while segment liabilities were reduced by 4%.
PlantationsTop line growth of 21% in the Plantations sector was supported by upward movements tea, rubber and oil palm prices during the year. Tea prices were buoyed by Sri Lanka’s positioning as a reliable supplier with the 150 year old tea auctions going live during the initial weeks of the lockdown while other tea exporting countries faced difficulties due to the pandemic. Rubber prices were supported by increased domestic demand which was also supported by import restrictions. The sector reduced losses from Rs. 535 Mn to Rs.74 Mn as favourable prices supported improved performance. The high cost of production in this sector remains a key concern as wage hikes mandated by the government without
links to productivity pose issues for the entire industry, resulting in a withdrawal by all regional plantation companies from the collective bargaining agreement with the matter being contested in courts at present. Regretfully, the Plantation company also witnessed violence against the Manager of Alton estate which resulted in its closure for over 40 days as the entire management of all regional plantation companies came out in support of the need to ensure a safe workplace for all.
PackagingThe Unidil Packaging Group increased revenue by 6% as revenue reached Rs. 4,074 Mn. The installation of a state of the art Printing facility together with a decrease in paper pulp prices supported improved profitability of the sector. Accordingly, the sector recorded Profit after tax of Rs.325 Mn, a 15% increase over the previous year as finance costs reduced considerably due to lower interest rates and decreased borrowings. The sector continued to operate throughout the lockdown, supporting their customers who were classified as essential sectors. Packaging contributed 8% to the Group bottom line and accounts for 11% of the Group’s Total assets at the close of the year.
PerformanceGroup revenue increased by 48% to reach a historical high of Rs.29,423 Mn supported by the phenomenal performance of the Tiles sector and positive contributions from all other sectors in a year marked with business disruptions, uncertainty and volatility, tempered by policy changes that proved favourable to growth. Gross margins improved from 24% in the previous year to 31% for FY 2020/21 supported by higher capacity utilisation and production efficiencies driven by increased efficiencies in the new technology and awareness among all employees for responsible
consumption. Operating margins also improved from 10% to 18% enabling absorption of operating costs. Finance costs decreased as interest rates declined significantly and the Group consciously reduced debt levels further to gear for the uncertainty that prevails a year after the onset of the pandemic. The effective tax rate also declined from 28% to 18% as tax rates declined and capital allowances were claimed. Accordingly, the Group recorded its highest ever profit after tax of Rs.4,013 Mn for FY 2020/21 which is an impressive increase of 868% over the previous year’s bottom line of Rs.414 Mn.
The Group’s financial position strengthened with equity/net assets increasing by 25% from Rs.15,558 Mn to Rs.19,359 Mn. There was minimal expansion of the balance sheet with total assets remaining largely in line with the previous year although the composition changed with a 37% decrease in inventories and increases in Cash and Bank balances Property Plant and Machinery and trade receivables reflecting improved working capital management.
“ESG factors are integrated into the Group’s decision making processes- which supported investments in resource efficient technologies that supported responsible consumption of raw materials, energy and water.”
Managing Director’s Message

|19| Annual Report 2020/21
Interest bearing liabilities were reduced by Rs.4,866 Mn with the debt equity ratio moving from 73% in FY 2019/20 to a much more comfortable 34% at the close of FY 2020/21. This was an appropriate approach for a year in which there was an marked absence of norms, taking the company to a position of strength from which to consider its strategic options as a new norm emerges with the control of the pandemic at a future date.
SustainabilityBalancing stakeholder concerns was a key priority during the year to ensure that we were socially and environmentally responsible despite the health and economic crises that saw unemployment rise at record levels and daily hardship for many entities and people. We supported our franchise partners and distributors tide over the lockdown period by meeting the costs of the salaries of their staff for this period saving livelihoods of over 311 people during a time of hardship. This enabled them to resume activities as the country eased out of lockdown, accelerating sales to make up for lost time.
As stated above, ESG factors are integrated into the Group’s decision making processes which supported investments in resource efficient technologies that supported responsible consumption of raw materials, energy and water. This was enhanced by initiatives such as Total Productive Maintenance which created a sustainability mindset throughout our processes, driving efficiencies throughout.
This report is an important link providing visibility into the integration of ESG factors into our operations upholding transparency and integrity in reporting as we provide a balanced review.
OutlookThe IMF forecast global growth of 6% for the world economy and 4% for Sri Lanka in April 2021. Weeks later we see the materialisation of downside risks as the country moved into lockdown with the third wave. We are cautiously optimistic about the upward revisions in the IMF forecasts over the past two quarters as vaccinations roll out, supportive government policies strengthen recovery and people adjust and adapt to working around the challenges. Learnings from the past year also show that hope and positivity are infectious and has the potential to change seemingly negative outlooks to positive outcomes as we address each concern. The import restriction was and remains a temporary reprieve as we eagerly look forward to the strengthening of the global and local economy supporting sustainable growth and profitability.
Upward movement in commodity prices will be a key concern for the packaging sector which will have a knock on effect for manufacturers of packaged products as paper pulp prices increased sharply during the year. The Aluminium sector will also be affected by the increased commodity prices. The exchange rate will also play a critical role as it will drive up costs for all imported inputs.
The Plantation sector continues to wrestle with the politicization of the sector which has been exacerbated by the bank on agrochemicals and the directive to uproot 10% of oil palm plantations each year moving forward.
For Lanka Tiles, exports will be a focus area and we will also monitor demand and supply factors to finalise expansion plans. We start from a position of strength with a strong balance sheet and low levels of debt with significant head room for our aspirations.
AcknowledgementsThis was a year of working together to overcome challenges and I thank all the staff of the Lanka Walltiles Group for their commitment and hard work which enabled us to record an outstanding performance. I also thank our Board for their invaluable guidance in uncertain times which supported alignment of strategy to the fluid operating environment. Our franchise partners and distributors played a key role in moving inventory and strengthening the brand and we are deeply appreciative of their efforts. I thank our loyal customers for their patronage and feedback which shape our offering. I conclude by thanking our shareholders for their support during the year and look forward to continued trust and confidence.
J. A. P. M. JayasekeraManaging Director
31st May 2021

|20|Lanka Walltiles PLC
MR. DHAMMIKA PERERAChairman
MR. A M WEERASINGHE Deputy Chairman
MR. J A P M JAYASEKERA Managing Director
Board of Directors
Mr Dhammika Perera is a quintessential strategist and a business leader with interests in a variety of key industries including manufacturing, banking and finance, leisure, plantations, and hydropower generation. He has over 30 years of experience in building formidable businesses through unmatched strategic foresight and extensive governance experience gained through membership of the Boards of quoted and unquoted companies.
Mr Perera is the Chairman of Vallibel One PLC, Royal Ceramics Lanka PLC, Lanka Tiles PLC, Lanka Walltiles PLC, The Fortress Resort PLC, Vallibel Power Erathna PLC, Greener Water Limited, Delmege Limited, and LB Microfinance Myanmar Company Limited. He is the Co-Chairman of Hayleys PLC, The Kingsbury PLC and Singer (Sri Lanka) PLC, Executive Deputy Chairman of LB Finance PLC, Deputy Chairman of Horana Plantations PLC. He is also an Executive Director of Vallibel Finance PLC and serves on the Boards of Amaya Leisure PLC, Haycarb PLC, Hayleys Fabric PLC and Dipped Products PLC. Also, a Director of Dhammika and Priscilla Perera Foundation.
Founder of Royal Ceramics Lanka PLC in 1990. A Gem Merchant by profession. Mr. Weerasinghe has been in the business field for more than 37 years involved in Real Estate, Construction, Transportation and Hospital Industry and a Landed Proprietor. He is the Chairman of Lanka Ceramics PLC, Singhe Hospitals PLC, Weerasinghe Property Development (Pvt) Ltd., Weerasinghe Gems (Pvt) Ltd., and serves as a Director of Swisstek (Ceylon) PLC and Swisstek Aluminium Ltd.
Mr. Mahendra Jayasekera is the Managing Director of Lanka Walltiles PLC, Lanka Tiles PLC, Swisstek (Ceylon) PLC, Lanka Ceramic PLC and Swisstek Aluminium Limited. He is also a Director of HNB Assurance PLC, Uni Dil Packaging Limited and Uni Dil Packaging Solutions Limited. He is also the Chairman of Cost and Management Accounting Standard Board.
Mr. Jayasekera holds a BSc Special (Hons) degree in Business Administration from the University of Sri Jayawardenapura. Further, Mr.Jayasekera is a Fellow Member of the Institute of Chartered Accountants of Sri Lanka and a Fellow Member of the Institute of Certified Management Accountants of Sri Lanka.

|21| Annual Report 2020/21
DR. S SELLIAHDirector
MR. T G THORADENIYADirector
MR. K D G GUNARATNEDirector
Dr. Selliah holds an MBBS Degree and a Master’s Degree (M Phill), and has over two decades of experience in diverse fields including Manufacturing, Healthcare, Insurance, Logistics and Packaging, Renewable Power , Plantation, Retail etc.
Dr. Selliah is currently the Deputy Chairman of Asiri Hospital Holdings PLC, Asiri Surgical Hospital PLC and Central Hospitals Private Ltd.
Dr. Selliah is the Chairman of JAT Holdings Ltd., Vydexa (Lanka) Power Corporation (Pvt) Ltd. and Cleanco Lanka (Pvt) Ltd. Dr. Selliah is also the Deputy Chairman of Evoke International Ltd.
He is a Director of Lanka Tiles PLC, HNB Assurance PLC, Softlogic Holdings PLC, Odel PLC, Lanka Walltiles PLC, Lanka Ceramic PLC, ACL Cables PLC, Swisstek (Ceylon) PLC and Swisstek Aluminium (Pvt) Ltd.
He has also served as a Senior Lecturer in the Medical Faculty for many years in the past. Currently he serves as a Council Member of the University of Colombo.
Dr.Selliah also serves on the following Board sub committees of some of the companies listed above as a member or Chairman: Human Resource and Remuneration committee, Related party Transaction committee, Audit committee, Investment committee and Strategic Planning committee.
Mr. Thoradeniya has over two decades of senior management experience in multi- industry scenarios. He is the Group Director Marketing and Business Development of Royal Ceramics Lanka PLC. He sits on the Boards of several public quoted and privately held companies, including Lanka Ceramics PLC, Lanka Walltiles PLC, Lanka Tiles PLC, Hayleys Fibre PLC, Delmege Ltd, Vallibel Plantation Management Ltd, Dipped Products (Thailand) Ltd, Unidil Packaging (Pvt) Ltd, Fentons Ltd and Swisstek Aluminium Ltd, among others. He has been credited as a proven business innovator across industries. A marketer by profession, he was in the pioneering batch of Chartered Marketers of the Chartered Institute of Marketing (UK)
Mr. Gunaratne studied at St. Thomas’ College Mt. Lavinia and was a member of the Western Province Council during the period 1989 to 2009. He currently holds the position of Chairman Lanka Hotels & Residences (Pvt) Ltd and Urban Investments & Development Company (Pvt) Ltd. He also serves as a Director of Lanka Tiles PLC, Lanka Walltiles PLC, Lanka Ceramic PLC, Dipped Products PLC, Swisstek (Ceylon) PLC, Singer Industries Ceylon PLC and Regnis Lanka PLC and as an Alternate Director at Horana Plantations PLC.

|22|Lanka Walltiles PLC
Ms. A M L PageDirector
MR. R. N. SOMARATNE Director
MR. J. D. NIHAL KEKULAWALA Director
Ms. Anjalie Page holds a BSc (Hons) Psychology (First Class) from the University of Nottingham, United Kingdom and a MSc in Economics, Finance and Management (Distinction) from the University of Bristol, United Kingdom.
Ms. Page has been employed at several institutions in Sri Lanka and overseas.
Mr. R Nandajith Somarathe currently serves as a Director of Hayleys Fabrics PLC and currently working in the capacity of General Manager (Manufacturing) for Royal Ceramics Group which includes Lanka Tiles PLC and Lanka Walltiles PLC.
He has served in Ansell Lanka (Pvt) Ltd and in Central Engineering Consultancy Bureau (CECB) before joining Royal Ceramics Lanka PLC in 1993. Mr. Somaratne counts more than 28 years’ experience in the manufacturing field.
Mr. Somaratne holds an MBA from the University of Colombo, Post Graduate Diploma in Industrial Engineering from NIBM and B.Sc. in Physical Science from the University of Peradeniya. He obtained a Post Graduate Diploma in Business Finance and Strategy from the Business School of CA Sri Lanka.
He has undergone several corporate leadership training programs including Corporate Leadership Management Program conducted by HIDA, Japan.
Mr. Kekulawala had held senior positions in the Hatton National Bank including Chief Financial Officer, Senior Deputy General Manager Strategy & Compliance. He worked as the lead consultant responsible for commencing commercial banking operations in the Solomon Islands and also functioned as the inaugural CEO of the bank.
Mr. Nihal Kekulawala is a Fellow of the Institute of Chartered Accountants in England & Wales and a Fellow of the Institute of Chartered Accountants in Sri Lanka and a Fellow of the Chartered Institute of Bankers in England. He holds a MBA from the University of Manchester.
Board of Directors

|23| Annual Report 2020/21
MR. S M LIYANAGEDirector
Mr. S R JayaweeraDirector
Mr. Liyanage is a respected professional with over 10 years’ experience and a record for exceptional performance. He has demonstrated transformational leadership in business transformation for the companies under the Vallibel One PLC Group.
He has a degree in Bachelor of Science in Industrial Management and Statistics from the Wayamba University of Sri Lanka and Master of Business Administration from University of Kelaniya. He holds a Diploma in Information Technology from University of Colombo.
He currently serves as a Group Director - Continuous Improvement and Research at Vallibel One PLC, where he is responsible for business strategic planning, supply chain development, developing new business and coordinating manufacturing excellence projects at the Vallibel Group of Companies.
He currently serves on the Board of Directors of Royal Ceramic Lanka PLC, Lanka Walltiles PLC, Lanka Tiles PLC, Lanka Ceramics PLC, Swisstek Alluminium Limited, Uni Dil Packaging Limited and Horana Plantation PLC. He was certified as a Lean Six Sigma Black Belt and has trained as a Lean Six Sigma Master Black Belt. He was also declared as a certified TPM practitioner and has a publication on the topic of Lean Six Sigma 4.0 at the OELSS conference in Colombo.
Mr. Liyanage is a Member of the Alumina Association of SSMI Asia and Global. He has participated in International Business and Management at MSU, Malaysia
Mr. Jayaweera was appointed to the Board of Lanka Walltiles PLC on 9th October 2020. Mr. Jayaweera counts over two decades of experience in working for top corporates including several John Keells Group of Companies listed on the Colombo Stock Exchange. He brings with him years of expertise in the fields of Financial Accounting, Management Accounting, Hotel Management, Manufacturing, Retail, Audit and Compliance. He is also serves as a Non Executives Director on the Board of Lanka Tiles PLC, Royal Ceramics PLC and Delmage Ltd.
|24|Lanka Walltiles PLC
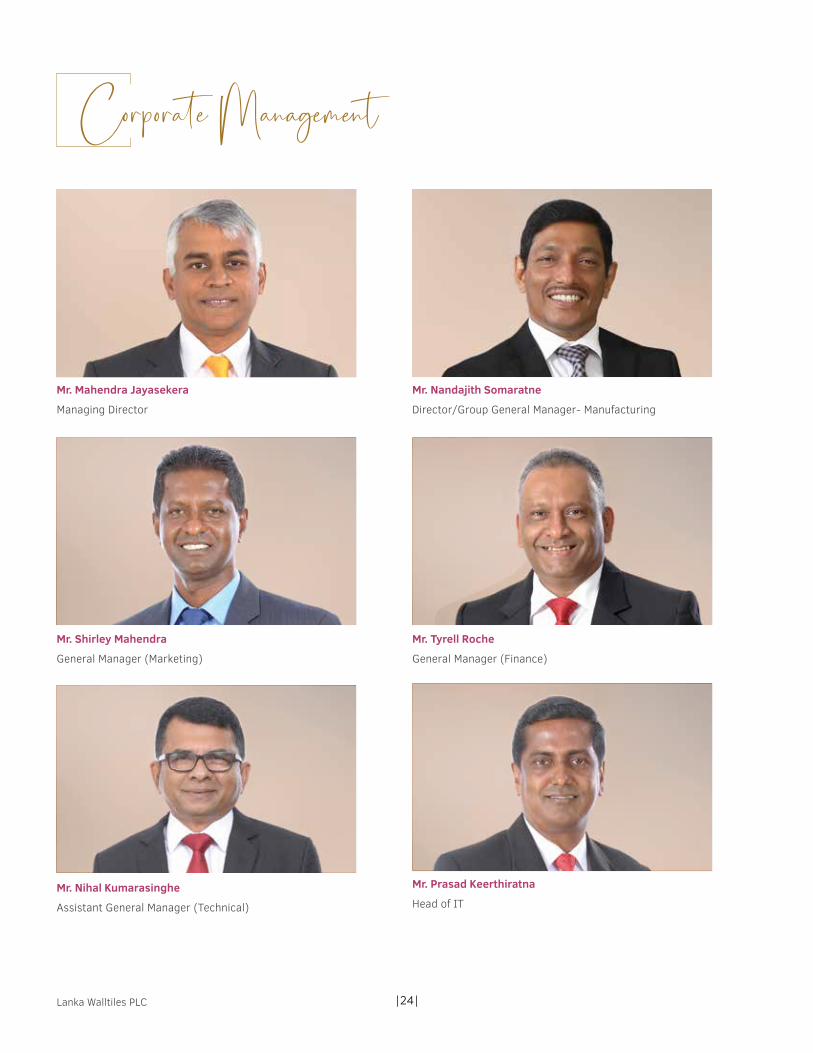
Corporate Management
Mr. Mahendra Jayasekera
Managing Director
Mr. Nandajith Somaratne
Director/Group General Manager- Manufacturing
Mr. Shirley Mahendra
General Manager (Marketing)
Mr. Tyrell Roche
General Manager (Finance)
Mr. Nihal Kumarasinghe
Assistant General Manager (Technical)
Mr. Prasad Keerthiratna
Head of IT

|25| Annual Report 2020/21
Mr. Athula Hewapathirana Group HR Manager
Mr. B A M Thilakasiri
Group Stores Manager
Mr. Stanley Yalegama
Factory Manager
Ms. Sajeewani Amarasinghe
Group Finance Manager
Mr. Anura Ratnayake
Group Business Development Manager
Ms. Kaushalya Sudasinghe
Group Manager - Sales Administration
|26|Lanka Walltiles PLC
Demonstrating Resilience
Our Focus and Strategy 27Creating Value for Our Stakeholders 28How we Engage with Our Stakeholders 30Our Strategy 32Determining Material Issues 34Risks & Opportunities 35Operating Environment 39Business line reviews 42Our Stakeholders and Capital 51

|27| Annual Report 2020/21
HOW WE CREATE VALUE
VALUE DELIVERED
Our Focus and StrategyCreating Value for Our Stakeholders
OUR VISION Creating a find art of living
OUR RESOURCES
Managing Our Strategic Investments other Sectors -
Plantation, Packaging, and Alumimium - refer pages 44 to 49
Risk Management Corporate Governance
HumanCapital
Manufactured and Intellectual
Capital
Social and Environmental
Capital
Natural CapitalFinancial Capital
Tile SectorUnderstand consumer trends
Source finest ingredients
Manufacture using latest technology
Conform to certifications
Ensure product quality
Efficient distribution
Aluminium Sector
Plantation Sector
Packaging Sector
Revenue Growth, ROE - refer page 8
Training and Developement,
Retention ratio - page 60 to 64
Capital Expenditure - refer page 8
Certifications and Standards
Suppliers, Dealers, and franchise
holders
Energy Savings
Refer page 35 Refer page 74
|28|Lanka Walltiles PLC
Creating Value for Our Stakeholders
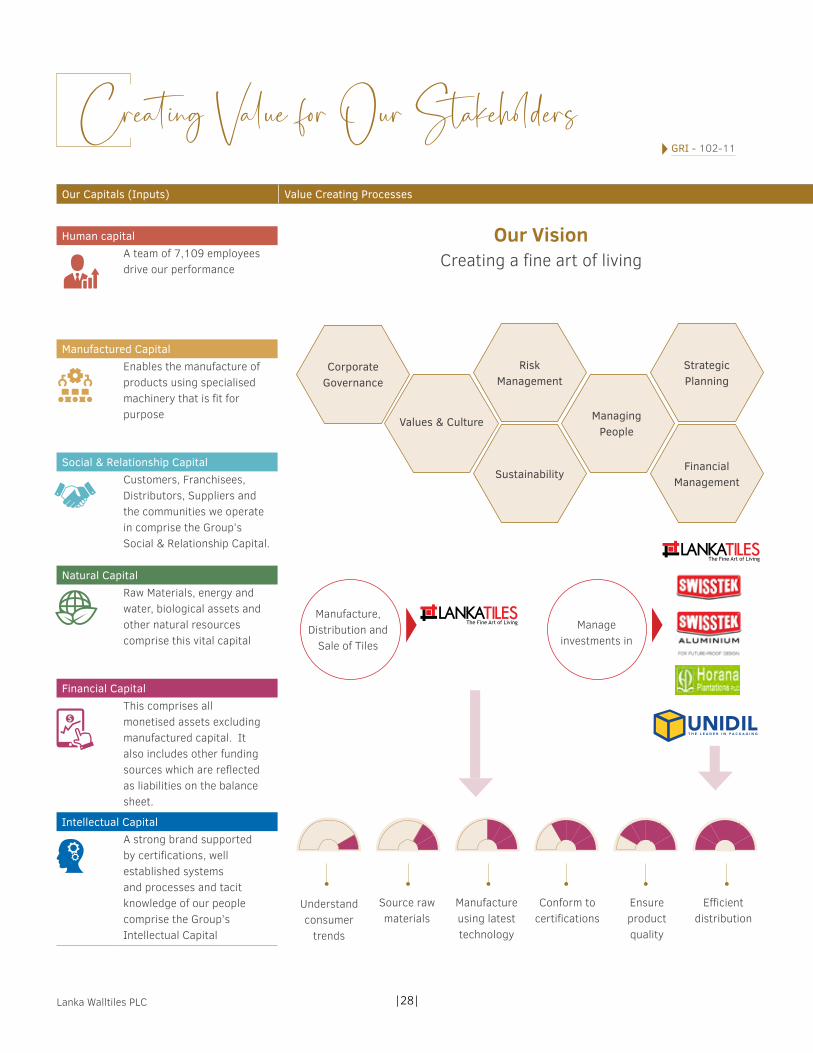
Human capitalA team of 7,109 employees drive our performance
Manufactured CapitalEnables the manufacture of products using specialised machinery that is fit for purpose
Social & Relationship CapitalCustomers, Franchisees, Distributors, Suppliers and the communities we operate in comprise the Group’s Social & Relationship Capital.
Natural CapitalRaw Materials, energy and water, biological assets and other natural resources comprise this vital capital
Financial CapitalThis comprises all monetised assets excluding manufactured capital. It also includes other funding sources which are reflected as liabilities on the balance sheet.
Intellectual CapitalA strong brand supported by certifications, well established systems and processes and tacit knowledge of our people comprise the Group’s Intellectual Capital
Our VisionCreating a fine art of living
Corporate Governance
Values & Culture Managing People
Risk Management
Strategic Planning
Sustainability Financial
Management
Manufacture, Distribution and
Sale of Tiles
Manage investments in
Understand consumer
trends
Source raw materials
Manufacture using latest technology
Conform to certifications
Ensure product quality
Efficient distribution
Our Capitals (Inputs) Value Creating Processes Value Created (Outputs) Outcomes
GRI - 102-11

|29| Annual Report 2020/21
Tiles9,233,184 Sqm of floor and wall tiles sales
225,917 Sqm of trim and mosaic tiles sales
Aluminium1,082 MT Aluminium Products supplied to fabricators and construction projects supporting their value creation processes3,507 MT Aluminium Products supplied through a network of distributors to meet consumer needs in domestic market
Packaging23,292 MT of packaging sales of boxes
3,699 MT of packaging sales of sacks
Plantations2,469 MT of Tea sales
890 MT of Rubber sales
1,319 MT of Oil Palm sales
Our Capitals (Inputs) Value Creating Processes Value Created (Outputs) Outcomes
EmployeesRemuneration Rs. 3,625 Mn Training 3,447 Hours Recruitments 849
GovernmentsForeign Exchange
Generation US$ 5.2 MnDirect Taxes Paid Rs.406 Mn Indirect Taxes Rs. 1,833 Mn
CommunitiesOver 1,745 SME & Micro
Suppliers Investment in Social Welfare
Rs. 9.9 MnOver 20,000 beneficiaries
from CSR
Business PartnersPayments to Suppliers 16,357 Mn
+ Import substitution in both tiles and aluminium sectors, saving foreign exchange outflows for country
+ Supporting the construction industry of the country
+ Supporting livelihoods of tilers and Aluminium fabricators
+ Supporting business growth of franchisees and distributors
+ Recycling aluminium that would have gone to landfills
- Mining of ball clay and Feldspar
- Emissions from factories
• Consumption
• 213,990 MT Raw Material
• 240,626 M3 Litres of Water withdrawal
• 1,066,872 Litres of Energy
• Discharge of treated effluents 108,017 M3
• Waste to Landfills
• Total Direct Emissions 32,828 (Tco2)
Total Emission Reduce our Emission
2,956(Tco2)
GRI - 305-1,305-2,305-3

|30|Lanka Walltiles PLC
We value our sound reputation of doing business with integrity and our relationships with Stakeholders are maintained to build trust. We rely on many stakeholders - the following have been identified as key for the success of our business.
Workforce
6,568 permanent employees
337 contract workers
204 outsourced
Customers
Online and Showroom customers
projectBusiness Partners
Tilers, Fabricators, Franchise partners
Suppliers
Local and overseas
Communities
Local Community
Dealer Networks
Providers of Capital
Debt providers and Equity Investors
Regulatory authorities
and industry associations.
Our stakeholders
MAT
TERS
IDEN
TIFI
ED
• Competitive remuneration
• Talent and skills development
• Career progression
• Health and safety
• Cordial relationships with Trade Unions
• Product quality.
• Reliable services
• Accessibility choices
• Innovative designs
• Competitive pricing.
• Increasing earning capacities
• Skills development
• Development of retail infrastructure
• Fair pricing
• Ensure high quality of raw materials
• Foster long term relationships
• Harmonious relationships
• Environmental grievances
• Support in developing communities
• Revenue growth
• Profitability
• Cash management
• Returns
• Leverage
• Repayment capacity
• Renewal of licenses
• Ethical business operations
• Compliance to regulations
How we Engage with Our StakeholdersGRI - 102-40,102-42,102-43
|31| Annual Report 2020/21
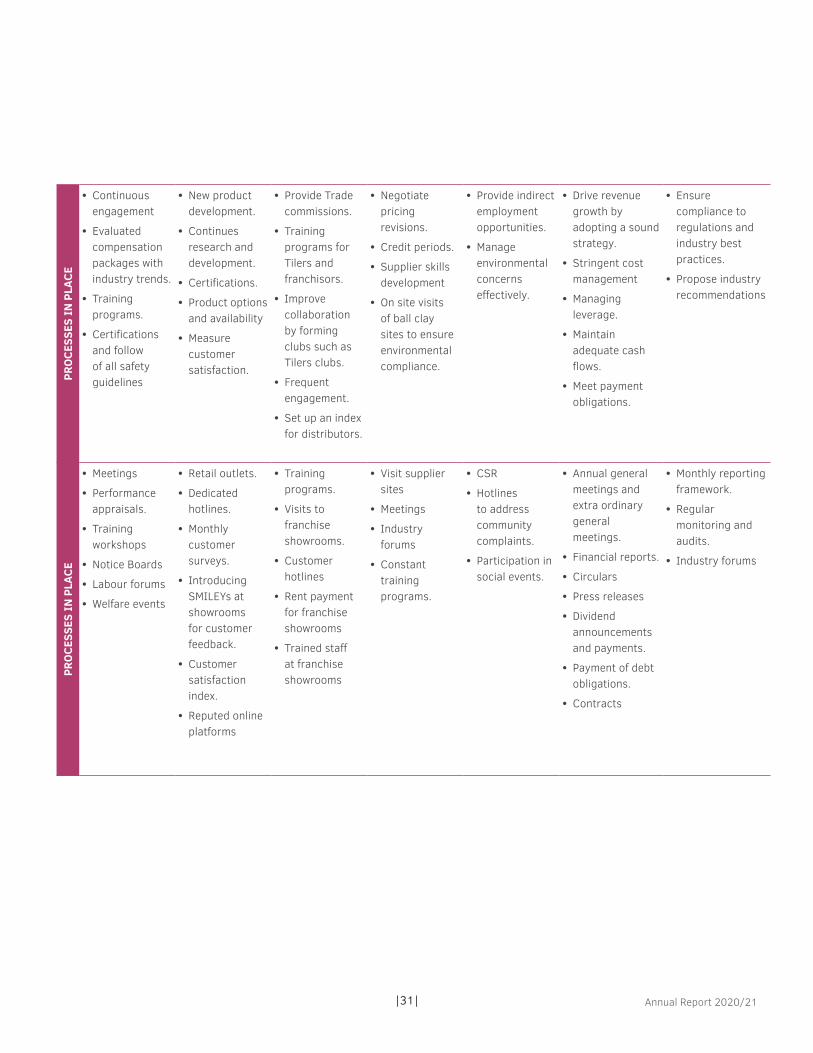
PROC
ESSE
S IN
PLA
CE
• Continuous engagement
• Evaluated compensation packages with industry trends.
• Training programs.
• Certifications and follow of all safety guidelines
• New product development.
• Continues research and development.
• Certifications.
• Product options and availability
• Measure customer satisfaction.
• Provide Trade commissions.
• Training programs for Tilers and franchisors.
• Improve collaboration by forming clubs such as Tilers clubs.
• Frequent engagement.
• Set up an index for distributors.
• Negotiate pricing revisions.
• Credit periods.
• Supplier skills development
• On site visits of ball clay sites to ensure environmental compliance.
• Provide indirect employment opportunities.
• Manage environmental concerns effectively.
• Drive revenue growth by adopting a sound strategy.
• Stringent cost management
• Managing leverage.
• Maintain adequate cash flows.
• Meet payment obligations.
• Ensure compliance to regulations and industry best practices.
• Propose industry recommendations
PROC
ESSE
S IN
PLA
CE
• Meetings
• Performance appraisals.
• Training workshops
• Notice Boards
• Labour forums
• Welfare events
• Retail outlets.
• Dedicated hotlines.
• Monthly customer surveys.
• Introducing SMILEYs at showrooms for customer feedback.
• Customer satisfaction index.
• Reputed online platforms
• Training programs.
• Visits to franchise showrooms.
• Customer hotlines
• Rent payment for franchise showrooms
• Trained staff at franchise showrooms
• Visit supplier sites
• Meetings
• Industry forums
• Constant training programs.
• CSR
• Hotlines to address community complaints.
• Participation in social events.
• Annual general meetings and extra ordinary general meetings.
• Financial reports.
• Circulars
• Press releases
• Dividend announcements and payments.
• Payment of debt obligations.
• Contracts
• Monthly reporting framework.
• Regular monitoring and audits.
• Industry forums

|32|Lanka Walltiles PLC
The Group begun re-bounding from the impacts of the 2019 Easter Bombings when the Global Epidemic came about impacting Sri Lanka more significantly in the first and second quarter of the financial year. The Pandemic had severe implications on our operations and our strategies were re-assessed to face the situation under hand.
Our Strategy
Our StrategyMaintain Growth and
Market ShareImprove
efficiencyDevelop manufacturing
capacityIncrease Shareholder
Returns
Initiatives Maintain consistent Pricing even with the shortages of inventory in-order to build customer loyalty.
Complete implementation of the Total productive maintenance (TPM) program to drive process efficiencies.
Invest and provide financial support to franchise to over-come economic difficulties during the Pandemic period.
Manage leverage
Expand manufacturing facilities.
Stringent COVID-19 prevention protocols implemented and monitored at factories, offices, franchises and outlets.
Upgrade production lines and install new high-tech machinery
Sustain profitability
Innovate new designs and styles
Increase sourcing of raw materials from our group companies.
Developing local resources by providing training and exposure to new high-tech plants
Manage strategic investments.
Maintain product quality. Deliver our environmental commitments.
Optimize use of cash and liquid assets.
Indicators to measure performance
• Growth in Revenue 48%• Customer satisfaction at
touch points• Expansions- mosaic
factory
• Rs.179 Mn Packing Material sourced From internal suppliers
• Training and Development Rs. 0.9 Mn
• Wastage %• Energy Saving
Outcomes • Local sales Revenue increased by 48%
• Export Revenue increased by 40%
• Net profit Rs. 4,013 Mn compared to 415 Mn in 2020
• Investment on Franchise outlets Rs. 72.9
• Investment in plant machinery Rs. 552 Mn
• Research and development Rs. 7 Mn
• Shareholder returns• ROE 21%• Dividend per share of Rs.
2.27.
Opportunities • Restrictions in Imports provided opportunity to expand our market share and look into new growth opportunities.
• Availability of high-quality clay locally.
• Online sourcing opportunities
• Opportunities to expand capacities.
• New outlook on improving efficiencies
• Increase in reliance on local expertise
• Market leaders in the industry for the past 40 years
• New investment opportunities

|33| Annual Report 2020/21
Our StrategyMaintain Growth and
Market ShareImprove
efficiencyDevelop manufacturing
capacityIncrease Shareholder
Returns
Challenges • Subdued economic growth.
• Shortage of Raw Materials due to restrictions on imports
• COVID-19 restrictions and economic impact effecting consumer buying.
• Increased costs on COVID-19 protocols and healthy safety measures.
• Currency depreciation.• Increased inflation
• Restriction due to the Pandemic
• Limitations in resources and expertise
• Shortage of inventory • Limitation on revenue
avenues due to global pandemic
• Increase cost on health and safety measures
Our Medium-Term Plans to Drive Growth While Operating Sustainably
Enablers
Provide new and alternative
production options to meet demand.
Increase in Shareholder Fund
Cost Management
Growth in PPE
Optimise capacity
Revenue Growth
Continue to invest in health and safety
measures
Increase in Capacities
Maintain our environmental commitments
Reduction in Wastage

|34|Lanka Walltiles PLC
Determining Material IssuesContinues assessment processes are in place to identify, assess and refine material risks in relation to our Stakeholders and performances of the Company and Group and the following highlighted areas in the materiality map are the focus areas of the Board of Directors that is used as a basis of our reporting throughout the year.
Sign
ifica
nce
to L
WT
Significance to Stakeholders
Not Material Low Impact Significant
Low Impact Significant High Importance
Significant High Importance Critical
Material concerns
Topics Critical High Significant
Economic • Response to Global Pandemic
• Market presence• Customer satisfaction• Product pricing• Market share• Innovation• Product quality• Supply chain
• Product availability.• Process efficiencies
• Capacity expansion• Indirect economic
impact.
Economic • Compliance• Materials• Energy• Carbon emissions• Effluents and waste
• Supplier environmental assessments
• Water
Employee • Employment• Health and safety
• Training and development
• Productivity
• Employee relations• Attrition
Social • Customer Health and safety
• Indirect employment
• Marketing communication
• Marketing and labelling
• Community relationships
Environmental commitments
Employee matters
Social matters
Economic
Environmental policy
Employment policy Health and safety policy Grievance policy
CSR Policies
Policy on regulatory and government
How we align our material topics and related policies with global
sustainability goals (SDGs).
GRI - 102-47

|35| Annual Report 2020/21
GRI - 102-18
Risks & OpportunitiesThe Group’s approach to risk management enables it to identify both risks and opportunities as they are two sides of the same coin. Risk management is the process of identifying, assessing and managing threats to the Groups capital, earnings and reputation which is a structured process within the Group.
GovernanceThe Group adopts the Three Lines of Defense model with responsibilities for risk management allocated as follows:
Risks are identified by operational managers who are involved in the day to day operations of the business
Formulate risk policies and approve mitigative actions.
Ensure risk policies and internal controls are well communicated and implemented.
Self risk assessment and ensure risk exposures are within predefined limits by implementing internal controls.
These risks are escalated to the Corporate management team, the CEO and the group executive committee. Identified risks are prioritized based on likelihood and impact. Suitable mitigation actions are developed to minimize our exposure to principal risk categories.
These are approved by the Board at meetings where the Board of directors take on the ultimate responsibility of risk management.
Third lineIndependent assurance and oversight of risk management function.
Second lineRisk monitoring.
First lineRisk assessments and implementation of internal controls.
Apex governance body 1.Board of Directors.2.Audit committee
Corporate management team1. CEO2.Group executive committee
Supervisors Executives
COVID-19 Global Pandemic
Devaluation of rupee
Import restrictions imposed on non-essential items
Lower interest rates
Discontinuation of Palm oil plantations
Rs.1000 wage increase mandated by government
Ban on agrochemicals in April 2021
Key Developments

|36|Lanka Walltiles PLC
Restrictions on production
Business ethics
Financial Risk
Health and Safety of employees and customers
Product Quality
Operational risks
Fluctuations in exchange rates and interest rates
Environmental concerns
Cyber attacks
Change on Government Policies
Stakeholder relationships
Capital risks
Our principal risks in 2020/21
Principal risks indicators Potential impact Mitigation & Management
Restrictions on Production
• Subdued economic and global growth due to the Global Pandemic
• COVID-19 and Lockdown restrictions
• Shortages of Raw Materials• Declining construction of
commercial and domestic buildings.
• Production capacity shortages• Inventory shortages• Not being able to meet demands
• Increased cost of production
• Investments in automation and high-tech machinery
• Finding alternative Raw Materials• Innovate new product designs• Invest Rs. 6.7 Mn on research and development.
Health and Safety of Employees and Customers
• COVID-19 infection rate• COVID-19 and Lockdowns
restrictions• Employee capacities• Declining in customers
• Labour shortages• Inventory shortages• Not being able to meet demands• Increased cost of production.
• Stringent policies and procedures for COVID-19 prevention and monitoring.
• Adherence to Government and Health Ministry guidelines.
• Increased investment in Health and Safety• Cost incurred on COVID-19 related expenses
during the year Rs. 46 Mn• Staff training.
Commodity Prices
• Prices for agricultural products such as tea and rubber are determined by the market forces of supply and demand.
• Price of paper pulp used by the Packaging sector is expected to increase significantly in 2021
• Revenue growth.• Gross profit margins.
Growth in Price of Rubber 21%Growth in Price of Tea 18%
Paper pulp increase in 2021
• Developed value added products for niche markets.
• Crop diversification. • Expanded presence in export markets.
Risks & Opportunities

|37| Annual Report 2020/21
Principal risks indicators Potential impact Mitigation & Management
Business Ethics
• Risk of management fraud, employee fraud and other illegal acts.
• Donations• Corruption and bribery
• Business reputation• Profitability. • Stakeholder relationships
No. of illegal acts or frauds reported during the year -NIL
• Monthly internal audit of business transactions. • Quarterly audit meetings and monthly Board
meetings with supervisors to review the financial status of company.
• Integrity of financial statements evaluated by external auditors.
• A related party transactions review committee to independently review related party transactions.
• Policies such as related party transaction polices.
Change in Government Policies
• Increases in minimum wage of the plantation employees.
• Restrictions on Importation of Raw Materials
• Impact on Gross Profit margins• Shortages of Raw Materials
Increase in GP margin 31%
• Maintained close relations with the government and industry associations.
• Assist in formulating industry best practices, laws and regulations.
• Look for alternative local raw materials
Product Quality
• Introduced new formats of tiles using the new production lines installed for manufacture of large format and mosaic tiles
• Brand reputation• Revenue growth• Market share• Product returns• Customer satisfaction
Customer Satisfaction rate 35%
• Conformed to certifications• Stringent product testing at own laboratories. • Continuous investments in research and
development
Environmental Concerns
• Air pollution
• Waste disposal
• Compliance
• Brand image
• Community relationships.
• Fines and penalties
• License approvals.
• An environmental policy is in place ensuring stringent compliance to environmental regulations.
• Assess clay suppliers to ensure mines are adequately backfilled.
• Implement measures to reduce energy consumption.
• Ensure safe disposal of waste and minimized waste disposals.
Stakeholder Relationships
• Suppliers
• Distributors
• Customers such as Tilers, Fabricators, Tea brokers.
• Any unfavourable impacts on our stakeholder relationships could affect our supply chain, market presence and overall
profitability.
• Continuous engagement
• Diverse supply chain
• Provide opportunities to develop skills through training programs for Tilers.
• Increase collaboration by forming clubs with market influencers such as Tilers.

|38|Lanka Walltiles PLC
Risks & Opportunities
Principal risks indicators Potential impact Mitigation & Management
Financial Risk
• Changes in interest rates
• Exchange rate movements
• Liquidity risks
• Credit risk
• Sensitivity analysis are performed to evaluate the potential impact on profitability.
5% change in market variable
Impact on profit before tax ( Rs. 000)
Exchange rate impact on translation
53,207
Market interest rate 32,708
• Trade receivables were maintained within credit limits and secured by Bank guarantees.
• Exports under DA terms are insured.
• Flexible funding arrangements by maintaining a mix of both committed and uncommitted credit lines.
• Maintain a mix of both fixed rate and floating rate debt.
• Reporting and monitoring the debt maturity profile.
Capital Risk
• Gearing ratio was 34% compared to 74% last year.
• Profitability
• Returns to equity investors
ROE 21%
• Maintain a strong credit profile
• Focus on managing cash
Operational Risk
• Machine downtime• Health and safety related
incidents• COVID-19 restrictions on
operations.
• Capacity utilization• Employee productivity• Profitability
• Annual plant upgrades• Five -year strategic plan to increase capacity.• Health and safety policies• Provision of adequate protective gear• Insurance schemes cover 100% of permanent
employee. • All plant and machinery are purchased from
reliable suppliers. These are also periodically tested to ensure safety for use.
Cyber Attacks
• Increased online activity due to work from home practices necessitated by the pandemic
• Increased cyber attacks in 2020
• Impaired functionality of security of systems• Threat to security of Group’s information
assets
• Appointed a Chief information security officer (CISO).
• Cybersecurity risk and management policy• Implemented a Disaster recovery plan.• Independent review of cybersecurity risk is done
by third parties.
Availability of Raw Material
• Potential shortage of ball clay used in manufacture of tiles in Sri Lanka
• The Group has purchased land with deposits of ball clay for future use

|39| Annual Report 2020/21
Operating EnvironmentAs Lanka Walltiles operates across diverse industry sectors and derives revenue from globally diverse markets, its performance is impacted by socio-economic conditions in both the domestic and global economy. Developments are closely monitored and considered in the Group’s strategic decision-making processes to identify potential opportunities and also to manage risks.
Domestic EconomySri Lanka’s economy contracted by 3.6% as the onset of the COVID-19 pandemic followed a difficult year for the country that was impacted by the Easter Bombings in 2019. The lockdown for nearly 2 months from March to May led to a contraction in the 2nd quarter of 2020 as economic activity was at a minimal level with only essential services in operation. Unemployment rate increased from 4.8% in 2019 to 5.5% in 2020 and household income declined to Rs.43,511 in 2020.
Inflation declined from 4.8% at end of 2019 to 4.2% by end 2020, remaining within the target policy range of 4-6%. Policy interest rates were lower by 250 basis points in 2020 as the government adopted an accommodative stance on monetary policy. The pandemic accelerated the devaluation of the rupee which depreciated from Rs.178.98 against the US dollar in 2019 to Rs.185.52 by end 2020. Wide ranging import restrictions were imposed to defend the currency and manage the trade and balance of payment deficits.
The government introduced wide ranging moratoria to support businesses affected by the pandemic at concessionary rates. Additionally, housing loan interest rates were capped at 7% for 5 years with the rate thereafter being 1% over AWPR which supported growth in commercial bank portfolio for the construction industry and for housing.
Imports declined by 20% due to import restrictions on non-essential items and reduced fuel prices which fell sharply with the onset of the pandemic in the 2nd quarter of 2020. Exports declined due to subdued demand in key export markets although there was an uptick in exports thereafter reflecting a recovery. Narrowing of the trade deficit during the year is largely attributable to the import restrictions.
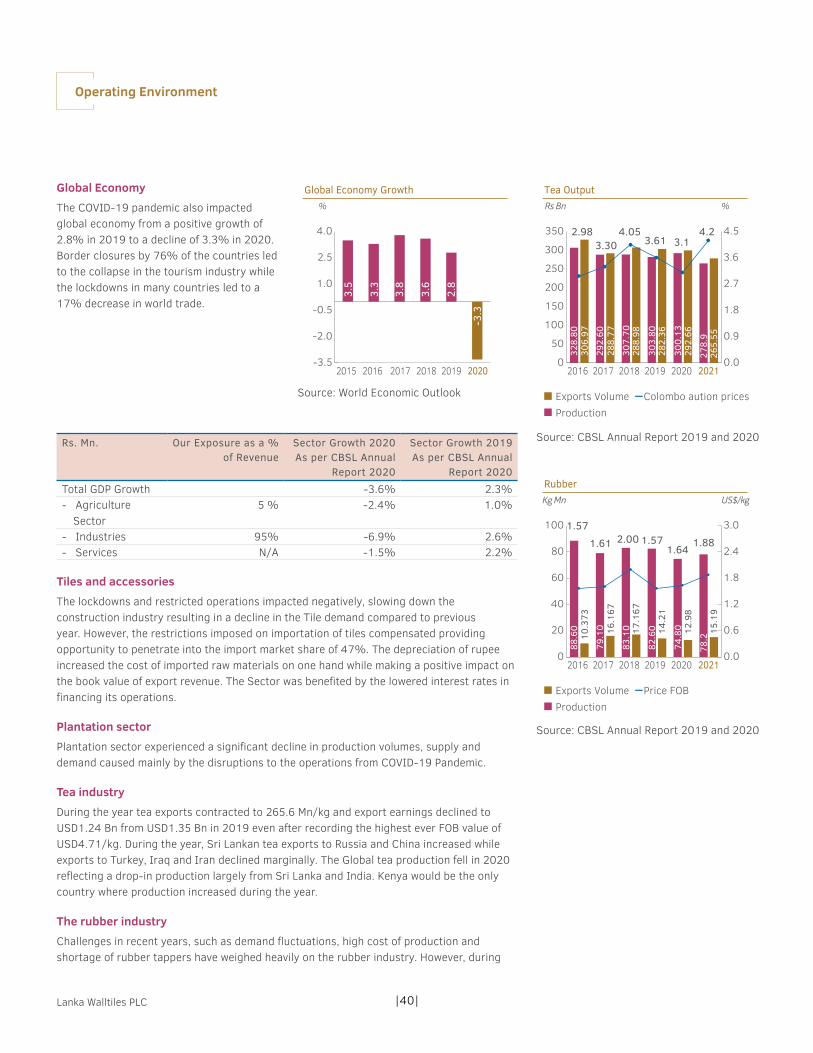
Global EconomyThe COVID-19 pandemic also impacted global economy from a positive growth of 2.8% in 2019 to a decline of 3.3% in 2020. Border closures by 76% of the countries led to the collapse in the tourism industry while the lockdowns in many countries led to a 17% decrease in world trade.
Source: CBSL Annual Report 2019 and 2020
Exchange Rate Rs./USD
0
50
100
150
200
2017 2018 2019 2020
152.
46
162.
54
178.
98
185.
52
GDP Growth
0
1
2
3
4
5
2015 2016 2017 2018 2019 2020
3.3
4.5
5.0
3.1
2.3
1.3
%
External trade US $ Mn
-15,000-10,000
-5,0000
5,00010,00015,00020,00025,000
-20.
9710
,047
11,9
40
16,0
55
-6,0
08
-7,9
97
-10,
343
19,
937
22,
233
11,
890
ImportsExport
202020192018
Trade Deficit
GRI - 203-2
|40|Lanka Walltiles PLC
Global EconomyThe COVID-19 pandemic also impacted global economy from a positive growth of 2.8% in 2019 to a decline of 3.3% in 2020. Border closures by 76% of the countries led to the collapse in the tourism industry while the lockdowns in many countries led to a 17% decrease in world trade.
Rs. Mn. Our Exposure as a % of Revenue
Sector Growth 2020As per CBSL Annual
Report 2020
Sector Growth 2019As per CBSL Annual
Report 2020Total GDP Growth -3.6% 2.3%- Agriculture
Sector5 % -2.4% 1.0%
- Industries 95% -6.9% 2.6%- Services N/A -1.5% 2.2%
Tiles and accessoriesThe lockdowns and restricted operations impacted negatively, slowing down the construction industry resulting in a decline in the Tile demand compared to previous year. However, the restrictions imposed on importation of tiles compensated providing opportunity to penetrate into the import market share of 47%. The depreciation of rupee increased the cost of imported raw materials on one hand while making a positive impact on the book value of export revenue. The Sector was benefited by the lowered interest rates in financing its operations.
Plantation sectorPlantation sector experienced a significant decline in production volumes, supply and demand caused mainly by the disruptions to the operations from COVID-19 Pandemic.
Tea industryDuring the year tea exports contracted to 265.6 Mn/kg and export earnings declined to USD1.24 Bn from USD1.35 Bn in 2019 even after recording the highest ever FOB value of USD4.71/kg. During the year, Sri Lankan tea exports to Russia and China increased while exports to Turkey, Iraq and Iran declined marginally. The Global tea production fell in 2020 reflecting a drop-in production largely from Sri Lanka and India. Kenya would be the only country where production increased during the year.
The rubber industry Challenges in recent years, such as demand fluctuations, high cost of production and shortage of rubber tappers have weighed heavily on the rubber industry. However, during
Source: World Economic Outlook
Source: CBSL Annual Report 2019 and 2020
Source: CBSL Annual Report 2019 and 2020
Global Economy Growth
-3.5
-2.0
-0.5
1.0
2.5
4.0
2015 2016 2017 2018 2019 2020
3.8
3.3
3.5
3.6
2.8
-3.3
%
Tea Output
Exports Volume Colombo aution prices
Rs Bn %
Production
0
50
100
150
200
250
300
350
265.
5527
8.9
292
.66
300
.13
282
.36
303
.80
288
.98
307
.70
288
.77
292
.60
306
.97
328
.80
201820172016 2019 2020 2021
4.2 3.1 3.61
4.05 3.30
2.98
0.0
0.9
1.8
2.7
3.6
4.5
Rubber
Exports Volume Price FOB
Kg Mn US$/kg
Production
0
20
40
60
80
100
15.1
978
.2
12.9
8 7
4.80
14.2
1 8
2.60
17.1
67 8
3.10
16
.167
79.
10
10.3
73 8
8.60
201820172016 2019 2020 2021
1.881.64
1.57 2.00 1.61 1.57
0.0
0.6
1.2
1.8
2.4
3.0
Operating Environment

|41| Annual Report 2020/21
The local packing industry was also impacted by fluctuating paper prices and a depreciating rupee. During the year, global paper prices increased significantly by 55% to USD 479/MT as supply tightened with China's ban on paper production.
the latter part of the year favourable weather conditions pushed the production marginally upwards. Sheet rubber production grew by 4.6% while crepe rubber production declined by 10.2% during the year. The increase in natural rubber prices in the global market led to a surge in rubber prices at the Colombo Rubber Auction towards the end of the year.
Oil palm cultivationOil palm cultivation that was started in the 1960’s in the Galle district has extended to the Kalutara and Matara districts owing to the increasing global demand for palm oil which is around 70 Mn tones per year. However, uncertain government policies have a negative impact on the industry. A total ban on cultivation was imposed in 2020 and a directive was issued in April 2021, requiring the uprooting of 10% of oil palm cultivation.
The government decision to ban agrochemicals will also have a negative impact on the plantation sector and the plantation companies are raising awareness on the issue with the government at present.
AluminiumThe contraction of the construction sector by 13.2% resulted in a decline in demand for Aluminium. However, the ban on import of aluminium by the Government of Sri Lanka created a lacuna in the market for value added aluminium products. Additionally, billet prices declined which provided much needed relief to local manufacturers.
Globally, aluminium usage declined by 4.1% in 2020 impacted by the COVID 19 outbreak. Despite the lower demand production increased by over 65 Mn tones, resulting in increased inventories due to the supply-demand gap. However, outlook for 2021 forecasts a 7.5% rise in the demand
for aluminium on predictions of rebound in major markets across the world and a high growth rate in China.
PackagingThe highly competitive Packaging industry in Sri Lanka held by a handful of manufacturers who share 70% of the market share. The market is largely dependent on the export sector - mainly garment, tea and rubber and the FMCG sector. Therefore, the Packaging industry was also identified to be an essential service during the Pandemic lockdowns to cater to the relevant sectors enabling uninterrupted operations.
The devaluation of the rupee impacted the profit margins of the sector due to increasing cost of imported raw materials. This negative impact was offset to a greater extent by the lower material prices during the beginning of the year. However, the escalating price of pulp and other chemicals used in paper production is on a rising trend towards the end of the year impacting margins going forward.
Source: CBSL Annual Report 2019 and 2020
Tea Textile %
-25
-20
-15
-10
-5
0
5
10
-20.
97
-7.8
4
5.24
-5.7
5
-6.6
3
5.68
Growth in textile exportsGrowth in tea exports
202020192018
Aluminium
2018 2019 2020 2021
Production (Mt 000')Aluminum prices ($/mt)
0
500
1,000
1,500
2,000
2,500
3,000
0
10,000
20,000
30,000
40,000
50,000
60,000
70,000
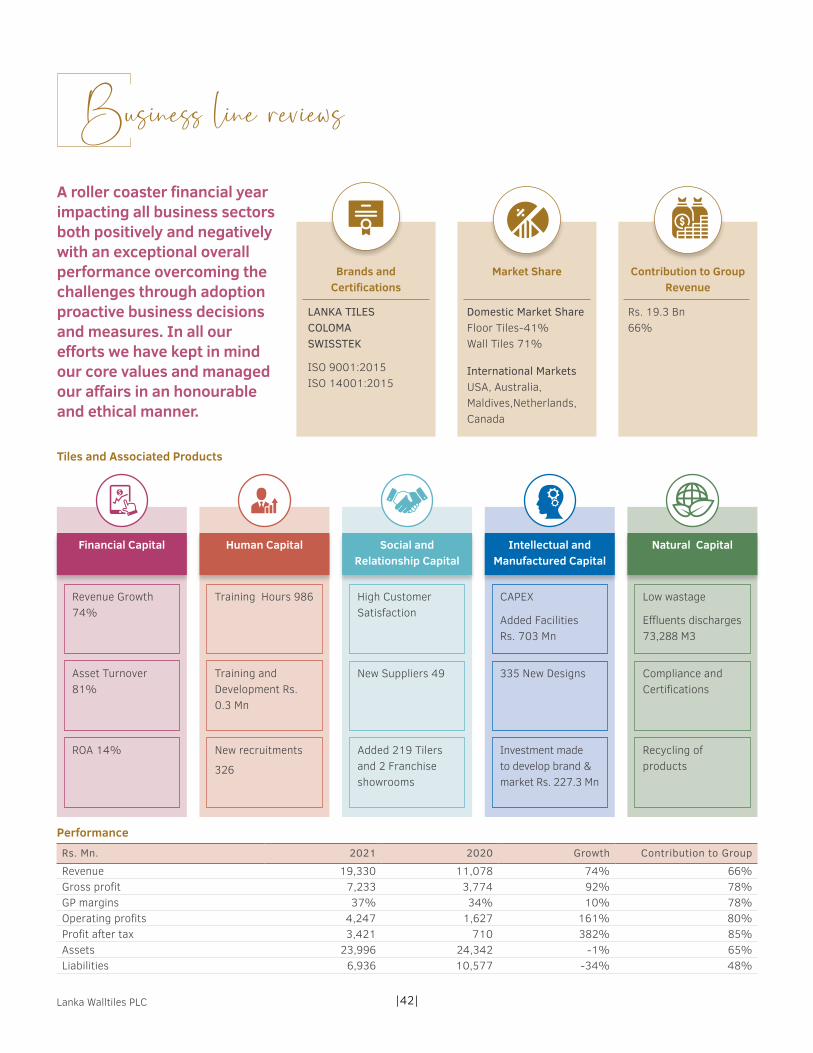
|42|Lanka Walltiles PLC
A roller coaster financial year impacting all business sectors both positively and negatively with an exceptional overall performance overcoming the challenges through adoption proactive business decisions and measures. In all our efforts we have kept in mind our core values and managed our affairs in an honourable and ethical manner.
Brands and Certifications
Market Share Contribution to Group Revenue
Business line reviews
Financial Capital Human Capital Social and Relationship Capital
Intellectual and Manufactured Capital
Natural Capital
Revenue Growth 74%
Training Hours 986 High Customer Satisfaction
CAPEX
Added Facilities Rs. 703 Mn
Low wastage
Effluents discharges 73,288 M3
New Suppliers 49 335 New Designs Compliance and Certifications
Added 219 Tilers and 2 Franchise showrooms
Investment made to develop brand & market Rs. 227.3 Mn
Recycling of products
Asset Turnover 81%
Training and Development Rs. 0.3 Mn
ROA 14% New recruitments
326
Tiles and Associated Products
PerformanceRs. Mn. 2021 2020 Growth Contribution to Group
Revenue 19,330 11,078 74% 66%Gross profit 7,233 3,774 92% 78%GP margins 37% 34% 10% 78%Operating profits 4,247 1,627 161% 80%Profit after tax 3,421 710 382% 85%Assets 23,996 24,342 -1% 65%Liabilities 6,936 10,577 -34% 48%
LANKA TILESCOLOMASWISSTEK
ISO 9001:2015ISO 14001:2015
Domestic Market Share Floor Tiles-41%Wall Tiles 71%
International Markets USA, Australia, Maldives,Netherlands, Canada
Rs. 19.3 Bn66%

|43| Annual Report 2020/21
Overall the Tile sector performed outstandingly well overcoming each of its challenges with Revenue growth magnifying by 74% (2020: 1%). The shortages in the market and the ability to provide for the shortages in a timely, efficient manner cushioned the decline in demand contributing to the growth in Revenue.
“We are proud to note that even with the shortages in the market the price of our products was not increased keeping to our reputation of ethical business practices”
Adopting to the changes in operating environment, the Walltiles sub-sector converted a large part of its plant to floor tiles by introducing a floor tile raw material mix and manufactured new sizes of tiles to meet customer demand. Stringent COVID prevention health and safely controls resulted in factories and outlets being able to operate with minimum breakdowns. Further the financial support and guidance and training given to our franchise business assisted in them to keep their business running during restricted operating environment. All of these proactive initiatives have contributed to the growth of Revenue.
Even with a dipped global economic growth Export Revenue further contributed to the growth in Revenue, increasing sales by 40%
Revenue Growth
Environment - Wastage saving
Energy Saving
Social - CSR and other projects Rs. 9.8 Mn
Human - Investment on Training and Developement Rs. 0.3 Mn
COVID-19 business decisions Staff retention 83%
Salary cuts - Nil
Investment on Health and Safety measures Rs. 12 Mn
2021 74%
2020 1%2019 10%
OutlookWe believe that the year 2021/22 is a year to stabilize operations, by being optimistically cautious about the fiscal policy framework. We hope to expand our export markets by renewing our relationships with China and India and expanding our distributor network through collaborative partnerships. Investments to expand our product portfolio and to increase production capacities are also in our planned outlook.
compared to 12% in 2020. Certification for mosaic tiles to enter US and Mexico markets, the increase demand in mosaic tiles and widening our distributor networks have contributed to the growth.
The gross profit margins were maintained at 32% to 33% consistent from previous year through our processes for reduction of wastage compensating the high cost of energy and raw materials. Groups’ focus on higher margin products further contributed towards the gross profit.
Operating profit for the year was recorded at Rs. 4,247 Mn compared to Rs. 1,627 Mn in 2020, a commendable growth of 92%. The growth in gross profit and curtailment of operating expenses in line with the inflation rates and increase in other operating income due to exchange gain on foreign currency earning have resulted in the growth.
The Sector ended with a healthy balance sheet with asset ratio and quick asset ratio recoding at 2.0 and 1.2 extents well above the industry average. Total Assets of the sector decrease by 1% to Rs. 23.99 Bn. The shortages in market the Sector made way to dispose most of the inventory holding to two months inventory compared to ten months of previous year and the increase in Debtors by 7% is in line with the increase in Revenue. Total Liabilities reduced by 48% mainly due to the settlement of overdraft facilities previously obtained contributing to the healthy asset ratios.
Performance
RevenueRevenue growthOperating marginsROA
Rs Bn %
0
5,000
10,000
15,000
20,000
XX XX
20182017 2019 2020 2021-1001020304050607080
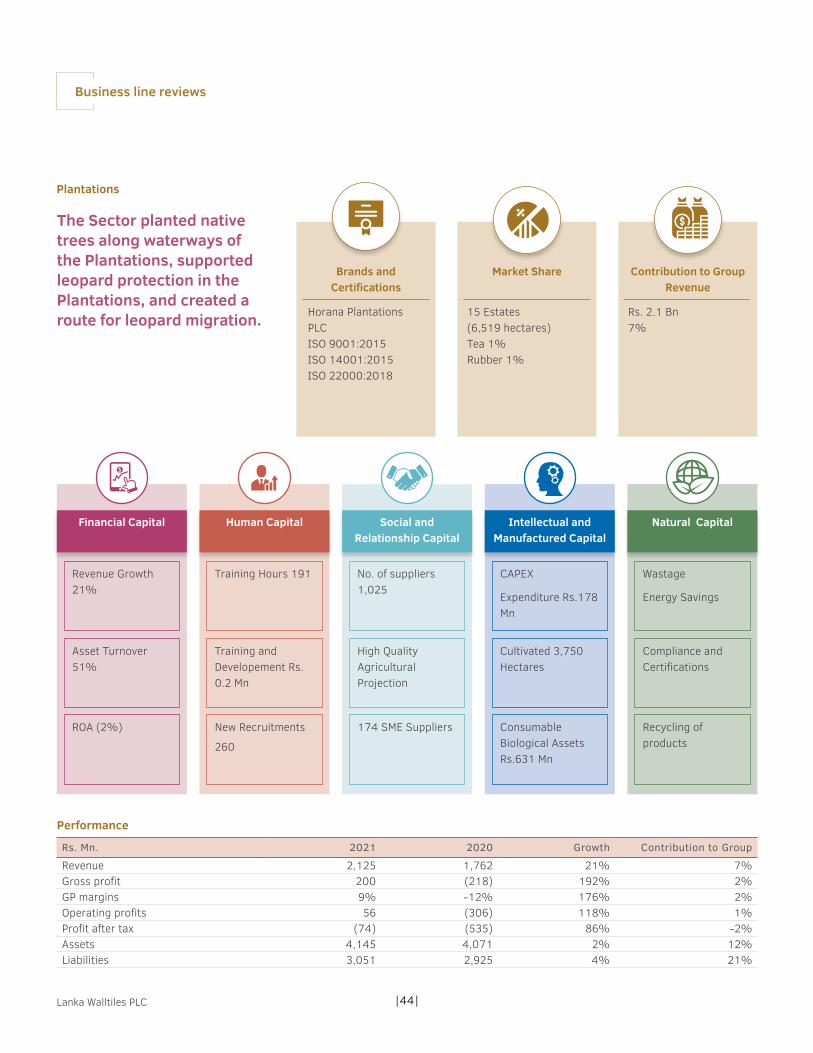
|44|Lanka Walltiles PLC
Financial Capital Human Capital Social and Relationship Capital
Intellectual and Manufactured Capital
Natural Capital
Plantations
The Sector planted native trees along waterways of the Plantations, supported leopard protection in the Plantations, and created a route for leopard migration.
Revenue Growth 21%
Training Hours 191 No. of suppliers 1,025
CAPEX
Expenditure Rs.178 Mn
Wastage
Energy Savings
High Quality Agricultural Projection
Cultivated 3,750 Hectares
Compliance and Certifications
174 SME Suppliers Consumable Biological Assets Rs.631 Mn
Recycling of products
Asset Turnover 51%
Training and Developement Rs. 0.2 Mn
ROA (2%) New Recruitments
260
Performance
Rs. Mn. 2021 2020 Growth Contribution to Group
Revenue 2,125 1,762 21% 7%Gross profit 200 (218) 192% 2%GP margins 9% -12% 176% 2%Operating profits 56 (306) 118% 1%Profit after tax (74) (535) 86% -2%Assets 4,145 4,071 2% 12%Liabilities 3,051 2,925 4% 21%
Business line reviews
Brands and Certifications
Market Share Contribution to Group Revenue
Horana Plantations PLCISO 9001:2015ISO 14001:2015ISO 22000:2018
15 Estates (6,519 hectares)Tea 1% Rubber 1%
Rs. 2.1 Bn7%

|45| Annual Report 2020/21
The Plantation sector was once again directly impacted by the economic conditions and changes in regulations. Overcoming the challenges, the sector recorded an Turnover of Rs. 2,125 Mn at the end of the financial year a 21% growth compared to previous year. The highest contributor to Revenue the Tea sub-sector recorded a growth of 12% compared to previous year mainly due to the increase in Tea prices and the depreciation of the rupees. The shortages in the market due to the COVID-19 impacts further strengthen the demand also contributing to the growth. The Rubber sub-sector contributing 19% to the Sector Revenue increased its Revenue by 21% compared to previous year ending at Rs. 399.5 Mn (2020: Rs. 265.1 Mn). The steady increase in rubber prices from USD 1.63 in 2020 to USD 1.89 in 2021 was the main contributing factor for the growth. Limited operations in the Oil Palm sub-sector contributed 3% to total revenue with a growth rate of 1% compared to 2020 and other minor crops contributed Rs. 20 Mn, 4% to the sector Revenue.
The growth of Revenue was over-powered by the constant increases in direct costs. Increases in minimum wages, scarcity of
manure, shortages in packing material and relational increase in these costs and the devaluation of rupee impacting cost of fuel and other costs. Gross profit of the sector ending at Rs. 200 Mn compared to Rs. 218 Mn in 2020 a 192% growth well below the growth rate in Revenue.
“Further to government legislations, the write off of the oil palm nursery amounting to Rs. 17 Mn has heavily impacted the bottom line of the sector”
During the year the Sector contributed to Society by supporting the NGO - Save the Children to increase awareness on children’s rights. Other initiatives included planting of native trees along waterways of the Plantations and putting up signs on the need for protecting the leopard in the Plantations a route for leopard migration. Plans are also underway for the population surveys of flora and fauna done every two years which will include extending of scope for restoration work of microsystems.
Revenue Growth
Environment - Wastage saving
Energy Saving
Social - CSR and other projects amounting to Rs.12.8 Mn
Human - Investment on Training and Developement Rs. 0.2 Mn
COVID-19 business decisions Staff retention 86%
Salary cuts - Nil
Investment on Health and Safety measures Rs. 4.3 Mn
2021 21%
2020 (11%)2019 (10%)
OutlookMixed signals surrounding subsidies relating to manure are expected to affect upcoming yields and further increases in direct costs are expected due to the depreciation of the rupee and import restrictions. The Price of Tea is expected the decline due to the excess stocks in the Kenyan market. These factors and the impact of COVID-19 Global Pandemic management will have a bearing on the outlook of the Sector.
Performance
RevenueRevenue growthOperating marginsROA
Rs Bn %
0
500
1,000
1,500
2,000
2,500
XX XX
20182017 2019 2020 2021-250
-120
10
140
270
400

|46|Lanka Walltiles PLC
Financial Capital Human Capital Social and Relationship Capital
Intellectual and Manufactured Capital
Natural Capital
Aluminium
Amplifying consistency in product quality and services was a key factor to overcome turbulent economic conditions and restricted operating environments.
Revenue Growth 20%
Employee Retention 67%
High Customer Satisfaction
CAPEX Expenditure Rs.149 Mn
Energy Savings Rs. 13.2 Mn
Payment to Suppliers Rs.2,196 Mn
New Product Designs 10
Compliance and Certifications
No. of New Dealers 39
Complied with 03 Certifications
Recycling of products
Asset Turnover 97%
Training and Developement Rs. 0.4 Mn
ROA 8% New Recruitments 161
Performance
Rs. Mn. 2021 2020 Growth Contribution to Group
Revenue 3,894 3,235 20% 13%Gross profit 1,075 577 87% 12%GP margins 28% 18% 55% 12%Operating profits 620 255 143% 12%Profit after tax 342 (40) 957% 9%Assets 4,034 3,884 4% 12%Liabilities 2,589 2,710 -4% 18%
Business line reviews
Brands and Certifications
Market Share Contribution to Group Revenue
SWISSTEK ALUMINIUMQUALICOAT Certifications
Domestic Market 30% Rs. 3.9 Bn13%

|47| Annual Report 2020/21
Revenue of the Aluminium sector increased by 20% to Rs. 3,894 Mn (2020: Rs. 3,234 Mn) amplifying consistency in product quality and services – the key factor to be able to overcome the dampened economic conditions and restricted operating environment.
The high-end construction project the Water Front project by Cinnamon Life and many other large-scale apartment and infrastructure projects choosing Swisstek Aluminium as the preferred supplier continued to contribute towards the growth in revenue. Further, the fabrications and finished products line expanded improving revenue growth and profit margins.
Swisstek Aluminium Ltd is the first Sri Lankan Aluminium extrusion company to claim Qualicoat sea Side certificate
Revenue Growth
Environment - Wastage saving
Energy Saving
Social - CSR and other projects amounting to Rs. 0.8 Mn
Human - Investment on Training and Developement Rs. 0.4 Mn
COVID-19 business decisions Staff retention 67%
Salary cuts - Nil
Investment on Health and Safety measures Rs. 2.9 Mn
2021 20%
2020 3%2019 (6%)Performance
RevenueRevenue growthOperating marginsROA
Rs Bn %
0500
1000150020002500300035004000
XX XX
20182017 2019 2020 2021-10-5051015202530
CERTIFICATEfor a COATING APPLICATOR
Swisstek Aluminium Limited
hereby authorises
No. 76/7, Pahala Dompe11680 Dompe
Sri Lanka
to use the quality label in conformity with theQUALICOAT 2021 Specifications, applicable from 1 January 2021
Licence No.: 5202
Valid until: 31.12.2021
Date of Granting: 17.08.2018
QUALICOAT
Mohammed C. Panam President
Sue C. C. ParediManaging Director
Zurich, 1 January 2021
QUALICOAT | Tödistrasse 48, 8002 Zurich, Switzerland | www.qualicoat.net

|48|Lanka Walltiles PLC
Financial Capital Human Capital Social and Relationship Capital
Intellectual and Manufactured Capital
Natural Capital
Packaging
Strategic sourcing of raw materials enabled the Company to minimise waste, improve productivity, efficiency and wastage.
Revenue Growth 6%
Employee Retention 82%
Higher customer satisfaction
CAPEX Expenditure Rs.176 Mn
Low wastage
Energy Savings
SME Suppliers 647 Capacity Utilization 71%
Reduce Direct emission 207(Tco2)
Payments to Suppliers Rs. 3,926 Mn
Complied with 6 Certifications
Recycling of products
Asset Turnover 115%
Training Hours 185
ROA 9% New Recruitments 103
Performance
Rs. Mn. 2021 2020 Growth Contribution to Group
Revenue 4,074 3,855 6% 14%Gross profit 728 652 12% 8%GP margins 18% 17% 6% 8%Operating profits 408 397 3% 8%Profit after tax 325 283 15% 8%Assets 3,545 3,137 13% 11%Liabilities 1,808 1,647 10% 13%
Business line reviews
Brands and Certifications
Market Share Contribution to Group Revenue
UNI-DIL Packaging Domestic Market 19% Rs. 4.1 Bn 14%

|49| Annual Report 2020/21
A focus and proactive strategy has proven to overcome many challenges such as having to close down production facilities due to COVID-19 threats, lockdown restrictions and increase in raw material costs due to rupee depreciation and restrictions in imports. The Sector witnessed a topline growth of 6% (2020: 9%) and the highest ever recorded net profit in history of the Company of Rs. 325 Mn a 15% year on year growth. The strategic sourcing of raw materials at its low price points compensating the increase in exchange rate, technology introduced to minimize waste, expansion of mechanization and automation substituting the labour shortages, improved productivity, efficiency and wastage, stringent controls of overheads and the reduction of income taxes were key contributors to the growth in bottom-line.
The Sector continued its CSR projects during the year at Dompe Base Hospital’s by supplying of nutritious food, TV, cupboards and other items and support. The area community was aided by funding the building of two bus halts and naming of roads in collaboration with local social organisations.
Revenue Growth
Environment - Wastage saving
Energy Saving
Social - SME suppliers -85%
Human - Investment on Training and Developement Rs. 0.4 Mn
COVID-19 business decisions Staff retention 82%
Salary cuts - Nil
Investment on Health and Safety measures Rs. 26.7
2021 6%
2020 9%2019 25%
Plans for market expansion is under way with new and enhanced technologies to be introduced for improved efficiencies.
OutlookSeventy percent of our cost of sales is the cost of raw materials and its price is heavily dependent on the fluctuations of the rupee – having to manage the possibilities of severe impacts of such is considered to be our biggest challenge ahead. Plans for market expansion is under way with new and enhanced technology to be introduced for improved efficiencies and to meet customer demands and providing value through high-levels of visibility.
Performance
RevenueRevenue growthOperating marginsROA
Rs Bn %
0
1,000
2,000
3,000
4,000
5,000
XX XX
20182017 2019 2020 2021-5
0
5
10
15
20
25
30

|50|Lanka Walltiles PLC

|51| Annual Report 2020/21
Our Stakeholders and Capital
Financial Capital and Our Performance in 2021
Lanka Walltiles Group demonstrated its resilience as it delivered a strong performance during the financial year 2020/21 to record a profit after tax of Rs. 4,013 Mn, overcoming the challenges stemming from the COVID-19 pandemic. A stakeholder-focused approach coupled with an agile strategy enabled us to seize opportunities that arose amidst the crisis to unlock value for our shareholders.
34%
1.61
DEBT: EQUITY RATIO GROUP
GROUP LIQUIDITY RATIO
EARNINGS
Group Revenue Rs. 29,423 Mn
GROWTH
Growth 48%PAT Growth 868%
STABILITY
Net Assets Rs. 14,571 MnMarket Share
Wall Tiles - 71%Floor Tile-41%
RevenueRs Bn
0
5
10
15
20
25
30
2018 2019 2020 2021
18.
31
19.
63
19.
93
29.
42
EPS & Revenue Growth
2018 2019 2020 2021
EPS(Rs.)Revenue Growth(%)
0
10
20
30
40
50
EBITRs Bn
0
1
2
3
4
5
6
2018 2019 2020 2021
2.6
8
2.0
3
1.9
7
5.3
3

|52|Lanka Walltiles PLC
Income Statement Highlights
Rs. Mn. 2021 2020 CHANGE
Revenue (Rs. Mn) 29,423 19,930 9,493Revenue Growth 48% 1% 47%Gross Profit 9,236 4,784 4,452Gross Profit Margin 31% 24% 7%Operating Profit 5,332 1,973 3,359Net Finance Costs (749) (1,170) 421Profit Before Tax 4,582 804 470Profit After Tax 4,013 415 868EPS 10.8 1.5 632
0.86GROUP QUICK ASSET RATIO
Revenue
Rs.29.42BnREVENUE 2021 48% GrowthHighest contributor - Tile Sector
Revenue by Sector 2021 2020 Growth %
Tile 19,330 11,078 74%Plantation 2,125 1,762 21%Aluminium 3,894 3,235 20%Packaging 4,074 3,855 6%
The Group delivered a highly commendable financial performance achieving revenue growth of 48% to record its highest consolidated revenue in its history of Rs.29,423 Bn. Revenue growth was largely driven by the Tiles sector which recorded strong growth of 74% with all other sectors also recording top line growth. With the onset of the pandemic in March and the country in lockdown at the beginning of the financial year, all Group entities reviewed plans for the year and aligned them to accelerate growth when the country opened for business with a determination to reach targets. A wider portfolio including the new mosaic range and the large format tiles enhanced the customer appeal and was in line with contemporary design trends enabling sales teams to move inventory. We also took precautions to minimise disruptions due to COVID-19 by implementing stringent health and safety protocols at all production facilities, warehouses, showrooms and other business locations. These measures aligned our teams to drive to the key strategic priorities for the Group with a positive message that we planned to overcome the challenges that lay ahead.
Our Stakeholders and Capital
PATRs Bn
0.00.51.01.52.02.53.03.54.0
2018 2019 2020 2021
1.6
0.8
0.4
4.0
PPE & Capital Expenditure
2018 2019 2020 2021
PPECapital Expenditure
0
5
10
15
20
Rs Bn
Total Assets & Net Assets
2018 2019 2020 2021
Total Assets(Rs.Bn.) Net Assets(Rs.Bn)
10
15
20
25
30
35
Rs Bn
Revenue Analysis by Sector%
0
20
40
60
80
100
2018 2019 2020 2021
54 56 56 66
12 10 9
71815
1618
1619
1314
TilePlantation
AluminiumPackaging

|53| Annual Report 2020/21
Tiles
LW focused on driving revenue growth to with uninterrupted production and distribution flows that supported availability throughout our growing network of customer touchpoints. The opening of four factory outlets increased our reach with the price conscious customers who wanted a no frills approach while the opening of one Franchise showrooms and digital engagement platforms supported the needs of customers who wanted a full service value proposition. Wide-ranging import restrictions imposed by the government on non-essential to defend the currency and stabilise the balance of payments and trade deficits in May 2020 changed the supply demand dynamics in the domestic market. Imported tiles had a 47% share of the domestic tile market and there was an influx of cheap imports as countries with excess tile manufacturing capacity supplied the domestic market at unrealistic prices. Tariff protection for domestic manufacturers had also been gradually eased over the years, leaving room for dumping. Over the next few months, the demand for tiles was met by the domestic manufacturers of tiles, saving significant foreign exchange for the country as the pressure on the currency increased. We refrained from increasing the prices of tiles despite the cost increases and demand exceeding supply which provided a rationale and clear opportunity to do so due to the prevailing economic conditions in the country. Exports also increased by 39% to surpass the Rs.1 bn mark, accounting for 3.5% of sales. Overall, the Tiles sector contributed to 51% of Group revenues compared to 56% in the previous year.
Aluminium
The Aluminium sector recorded 20% top line growth with revenue of Rs.3,894 Mn for 2020/21 despite a 13.2% decrease in the Construction sector. A strong project pipeline supported the earnings as well as an increased focus on value added
products. The sector contributed 7% to consolidated revenues compared to 16% in FY 2020/21.
Plantations
The Plantation sector revenues increased by 21% tea and rubber prices moved up as Sri Lanka maintained a steady supply of tea despite the disruptions due to COVID-19 and domestic demand for rubber increased due to import restrictions. This sector contributed 7% to revenue compared to 9% in the previous year.
Please refer the Business review on page 46 for further analysis of revenue of each sector.
Cost of Sales and Gross ProfitsGross Profit of the Group increased by 93% during the year contributing Rs. 9,263 Mn (2020: Rs.4,788 Mn) to the Group. This was supported by Total Productive Maintenance initiatives which supported efficiencies and minimising of rejects. Packaging and Aluminium sectors benefited from lower prices in the early half of the year with margins narrowing toward the end of the year as prices increased. Devaluation of the currency also added to the margin pressure in the 4th quarter as the rupee devalued by 6.5%.
Timely decisions to purchase raw materials at favourable points and introductions of new technologies to improve efficiencies assisted in managing overall costs of raw material and energy. The increase in minimum wage has further impacted the direct cost in the Plantation sector. The introduction of higher profit margin products contributed to growth in profit margins and the growth in Revenue has been the main contributor to the growth in Gross Profit.
Gross Profit Margin
2021 2020
Tile 37% 33%Plantation 28% - 12%Aluminium 9% 18%Packaging 17% 16%
Operating Expenses
Increase in Expenses
2021 % Change
Tile 3,084 43%Plantation 192 12%Aluminium 465 20%Packaging 394 21%
Operating expenses increased by 39% to Rs. Rs.4,133 Mn reflecting the increase in the level of operations as revenue grew at 48%. Close attention to cost control within the Group curtailed the expansion of operating expenses.
Operating Expenses
Administrative ExpensesDistribution Costs
%
33
67
Finance Costs & ProfitsEarning before interest and taxation amounted to Rs.5,332 Mn which is an increase of 170% over Rs.1,973 Mn in the previous year. Strong revenue growth, improved gross margins and a lower rate of growth in operating, administration and selling expenses supported the increase in Earnings before Interest and Taxation.
With the growth in Revenue the Group was able to settle most of its overdraft

|54|Lanka Walltiles PLC
facilities saving on interest on short term facilities. The reduction in interest rates by the regulatory bodies also contributed to the savings on financial cost Rs. 770 Mn in 2021 compared to Rs. 1, 171 in 2020. The Group obtained Rs. 650 Mn as Long Term Borrowings taking advantage of the low interest rates for its strategic investments. The effective tax rate declined from 48% in 2019/20 to 12% in 2020/21 due to revised tax rates, increased capital allowances and a deferred tax reversals. Consequently,
Total AssetsGroup’s Total Assets increased by 1% (2020:8%) to Rs.33.71Bn. (2020: Rs.33.42Bn). The marginal increase is mainly due to the increase in PPE by Rs. 914 Mn contributed mainly by the Packaging Sector and the net effects of the decrease of Inventory on hand and the increase of Debtors resultant of in-line growth of revenue.
Total LiabilitiesTotal Liabilities of the Group declined by 20% (2020: +17%) to Rs.14,315 Mn (2020: Rs.17,865 Mn) compared to previous year. The healthy cash flow abled the settlement of overdraft facilities and timely repayments of short and long-term loans has brought down the total liabilities.
Our Stakeholders and Capital
Total Assets%
12
11
1265
TilePlantation
AluminiumPackaging
Total Liabilities%
21
13
18
48
TilePlantation
AluminiumPackaging
Balance Sheet Highlights
Rs. Mn. 2019/20 2019/20 CHANGE
Total Assets 33,710 33,423 1%Property Plant and Equipment 17,798 16,884 5%Cash And Cash Equivalents 3,034 413 635%Equity 19,395 15,558 25%Long Term Liabilities 5,643 6,285 (10%)Current Liabilities 8,672 11,580 (25%)Debt to Equity Ratio 43% 73% (40%)Current Ratio 1.61 1.26 28%Quick Asset Ratio 0.86 0.38 126%
Profit after tax amounted to Rs.4,013 Mn which is a phenomenal increase of 868% over the previous year’s PAT of Rs.415 Mn. Earnings per share increased by 632% to Rs.10.84 compared to Rs.1.48 per share in 2020.
Investment in PPE and Growth in assets
Investment in PPE
Rs Bn %
Growth in assets
7.62
20.73
15.8513.32
0
500
1000
1500
2,000
2,500
3,000
2018 2019 2020 20215
10
15
20
25
Group LiabilitiesRs Mn
0
2,000
4,000
6,000
8,000
10,000
3,52
0 2,
878
2,76
5 2,
765
8,64
3 3,
969
4,70
3 2,
937
LT In
tere
stbe
arin
g
LT o
ther
liabi
litie
s
ST In
tere
stbe
arin
glia
bilit
ies
ST O
ther
liabi
litie
s
20212020

|55| Annual Report 2020/21
Rs.10.8
Rs.4013Mn
EPS
PAT
Liquidity RatioGroup liquidity position improved from the previous year indicating a healthy balance sheet mainly due to the reduction in Total Liabilities. The Current Ratio and Quick Asset Ratio of 1.61 and 0.86 respectively is an improvement of 1.26 and 0.38 compared to previous year is commendable considering the sunk domestic and global economic growths impacted by the Global Pandemic.
Capital expenditureThe Group continued with its long-term investment plans even with dampened economic conditions having confidence of its carefully predetermined strategic plans. During the year, the Group invested Rs. 1,149 Mn (2020: Rs. 1,054 Mn) on property, plant and equipment of which Rs.552 Mn of investments where on plant and machinery of the Packaging Sector and Tiles Sector implementing state of the art technologies improving efficiencies, wastage and customer visibility. Further, the Plantation Sector invested Rs. 123 Mn in upgrading their factories to substitute labour shortages.
Cash flow and working capital management
Capital Structure
Total borrowings
LKR Mn %
EquityGearingROCE
0
5,000
10,000
15,000
20,000
25,000
30,000
2018 2019 2020 202101020304050607080
Cash and cash equivalents of the Group at financial year end bounced-back from a negative of Rs. 2,395 Mn in 2020 to a surplus of Rs. 2,270 in 2021. Elevated Growth in Revenues by 48% and effective cash-flow management - settlement of overdraft facilities and timely repayment of loans, a reduction of Rs. 4,866 Mn compared to previous years, strategic inventory management and close review of debtors has contributed to the surplus. During the year the Group Invested Rs. 1,149 Mn in property plant and equipment which is elaborated under capital expenditure. Cash flows from Financing Activities amounted to Rs. 14,049 Mn in new borrowings and Rs.16,849 Mn in repayments of borrowings.
Capital structureA turnaround from a high gearing ratio of 73% in 2020 to 34% in 2021 indicating a healthy balance sheet as at March 31st, 2021.
Return to ShareholdersOutlookOur overall strategy for 2022 is to stabilize operations in the domestic market while increasing focus on export markets as the advanced economies recover from the pandemic. We will continue to invest to obtain latest technological support to improve efficiencies, wastage management and for continuous improvements in customer service in-order to gain market share and new markets. Tightening of variable costs and close monitoring of direct cost to take advantage of market pricing is considered key to meet our strategic objective. The import restrictions maybe lifted in the future if the currency stabilises which will increase the competition in the domestic market. However, we are very well positioned for growth in the year ahead as well.
Rs. Mn. 2021 2020 Improvement %
ROE (%) 20.6 2.7 662Adjusted Net Assets per Share(Rs.) 53.37 42.57 25Adjusted Earnings per share(Rs.) 10.84 1.48 632Market Price per share(before Sub
Division)-(Rs.)188.50 41.10 358
Market capitalization(Rs.000) 10,292,100 2,244,060 358Adjusted Dividend per share (Rs.) 2.72 - -
Group Liabilities
0.0
0.5
1.0
1.5
2.0
0.8
6 0
.38
0.4
7 0
.64
1.5
6 1
.34
1.6
1 1
.26
2021Quick asset ratio Current ratio
202020192018

|56|Lanka Walltiles PLC
Long standing relationships with our customers, suppliers and communities are a key strength for us to overcome an extraordinarily challenging year and we in turn have continued to nurture our relationships in the same manner, upholding their trust. During the year we have implemented several measures at a cost to us to assist them to get through the difficult times.
CUSTOMERS
57 Distributors333 Dealers72 Franchisees4,000+ Tilers
SUPPLIERS
Large scale suppliersSME suppliers
COMMUNITIES
Office and factory surroundingsDealer network surroundingslocal community
Our Social and Relationship Capitals
Naturing relationships with our Customers• Following stringent COVID-19 prevention
health guidelines to ensure Customer safety and improving customer experience at stores.
• Providing product choices and product availability at a reasonable price even during market shortages.
• Maintaining product quality and standards.
• Providing delivery efficiencies by meeting customer needs on a timely manner.
• Enhancing relationships with customers by forming customer communities such as Tile Club
Fostering our Supplier relationships• Maintaining fair pricing in product
purchase and paying supplier dues on a timely manner.
• Continued to purchase the same volumes of raw materials enabling suppliers to stay afloat even during the periods of plant closure as well.
• Continuous supplier training and development, supplier product quality and health and safety measures monitoring and monitoring of adherence to related laws and regulations by suppliers through routine visits to clay mines.
Uplifting relationships with our Communities• Providing direct and indirect employment
opportunities.
• Increased dealers during the past two years by 27%. New hires during the year 849.
• CSR projects
• Mother and Children friendly plantation programme certified by a globally recognised initiative; "Save the Children".
Our Stakeholders and Capital
Social and Relationship Capital
• Providing infrastructure facilities and financial assistance to dealers and franchise owners such as rent fee retail outlets, trained staff, credit periods and COVID-19 relief financial assistance.
• Training and development on the job as well as off site including methods on doing business in a socially and environmentally responsible manner.
• Commenced a website for Tilers to showcase their work and be connected to customers.
GRI - 102-12,102-9,102-10,204-1,413-1, 416-1,416-2,417-1,417-2,417-3,308-1

|57| Annual Report 2020/21
Rs. 17.8Bn in PPE
Rs. 6 Bn Manufacturing
Facilities
72 Showrooms
Rs. 1.4 Bn CAPEX
Franchise ShowroomsNo:
01020304050607080
5851 67 72
Number of Franchise Showrooms
2018 2019 2020 2021
Investment in PPE
Net Book ValueDepreciationCapex
0
5
10
15
20
20182017 2019 2020 20210
4
8
12
16
20
Bn.
PPE By sector%
96
14
71
Tiles SectorPlantation Sector
Aluminium SectorPackaging Sector
Manufactured Capital
Manufactured Capital is a critical part of the Group’s value creation process enabling manufacture and delivery of our products efficiently and responsibly, strengthening the brand. We have invested in state-of-the-art manufacturing facilities that are operated under stringent controls to optimize capacity and to maintain consistency in product quality.
GRI - 203-1

|58|Lanka Walltiles PLC
Tile Aluminium Plantation Packaging
Wall tiles
Facility: Meepe
Capacity: 2.6 Mn Sqm.
Products: varied colours, textures and styles of wall tiles
State-of-the-art aluminium extrusion facility located in Dompe
Capacity of 8,400 MT
Produce: Aluminium profiles.
Tea Factories 09
Rubber Factories 06
State-of-the-art manufacturing facility Japanese machinery is located in Dekatana
Capacity: 34,080 MT
Produce: corrugated cartons and paper sacks
Tea Production Capacity Utilisation 81%
Production Capacity Utilisation 71%
Warehouse Capacity utilization: 100%
Rubber Production Capacity Utilisation 83%
Production-26,916MT
Floor tiles
Facility: Ranala.
Capacity: 5.1 Mn Sqm.
Products: Glazed, Vitrified & Ceramic floor tiles
Production Capacity Utilisation 60%
Warehouse Capacity utilization: 100%
Production Capacity Utilisation 83%
Warehouse Capacity utilization: 71%
New Products 10
New Products 335
Investments in 2021 Rs. 6.7 Mn
Our Manufacturing facilities
6,115,836 sqm 40,161 MT 4,591 MT
26,916 MT 2,52 MT 873 MT
TILE PRODUCTION GROUT & MORTAR PRODUCTION QUALITY ALUMINIUM EXTRUSIONS
PACKAGING PRODUCTION TEA PRODUCTION RUBBER PRODUCTION
Our Stakeholders and Capital

|59| Annual Report 2020/21
Tile sector Tile sector Tile sector
Outlook for 2021/22The year 2020 has been an extraordinarily challenging year that has put to test our strong business progressions. We have always believed in the need to invest in technology and this vision has assisted us during these challenging years.
We will continue to invest in high-tech, state-of-the-art facilities and resources and as at year end the following initiatives have been taken:
• Invest in expansion of normal production capacities by lengthening a kiln in both the floor tile and walltile sub-sectors.
• Automate the Bambarakelle tea factory; the largest factory for better efficiencies.
• Installation of Solar power for five factories for better cost efficiencies
• Investment in new machinery with high-end technology for improved efficiencies.
• Enhancement of the automation processes to provide higher levels of visibility on the progress of orders through the system. This minimizes anxiety about delivery timings, adding value to our customers.
Investing in technologies, state of the art facilities and resources immensely contributed towards sustaining the quality of our products throughout the year.

|60|Lanka Walltiles PLC
7,109NO. OF EMPLOYEES
A significant part of our cadre is male due to the nature of our manufacturing activities and cultural norms.
No: of Promotions
66
New Hires 849
Remuner-ation
Rs. 3,625 Mn
3,447 hours of trainings on health
and safety, mental well-
being
Complaints on code of
conduct - Nil
We are proud to note that we have not retrenched any of our staff or
implemented pay-cuts to overcome the challenging circumstances faced during the year. We believe these investments will have a positive impact on the long
term of our business.
Employees by Sector 2021 2020 2019 2018
Tiles and Accessories 1,323 1,205 1,376 1,257 Plantation 4,895 5,399 5,769 5,825 Aluminium 349 282 448 388 Packaging 542 538 408 376 Total 7,109 7,424 8,001 7,846
Under 30 years
30-50 years
Over 50 years
Male Female
Employee Turnover 305 628 232 854 311New Recruitments 470 311 68 707 142
Human Capital
Even with the pandemic affecting all of us in different ways, the efforts of our people empowered us to be proactive and work efficiently and safely, uninterrupted, whether on the factory floor, at retail outlets, on plantations or from a home office. The Health and Safety including the mental well-being of our team was given highest priority in our strategising process and have proven to be worth of an investment. As at 31st March 2021 the Group had 7,109 employees working, as classified below.
Our Stakeholders and Capital
Type of Employment Contract%
53
92
PermanentContract/ Temporary
Outsourced
Employee analysis by province%
3
42
54
CentralWestern
0ther
Group total employees by gender%
45
55
MaleFemale
GRI - 102-8, 102-41, 201-3, 401-1, 401-2, 401-3, 403-1, 403-2, 403-4, 404-1, 404-2, 404-3, 405-2,

|61| Annual Report 2020/21
66
140
849
NO. OF PROMOTIONS
NO. OF MINOR INJURIES
NEW HIRES
Nurturing Our Culture - governance and policies Our work culture is based on sound governance and policies to ensure a conducive working environment for our employees covering the following key areas:
Equal Opportunity and Human Rights
Managing Talent
Training and Developement
Safety at Work
Retention
• Structured Reporting Channels
• Equal Opportunities and Human Rights
• Code of Conduct
• Work balance
• Child labour policy
• Structured remuneration policy based on performance
• Adherence to labour laws
• Training on mental health development
• Training on skills development
• Investment in COVID prevention and detection
• Training on health and safety
• Continuous monitory procedures
• Health and safety certifications
• Grievances reporting
• Communication channels with unions
• Open door policy
By sector %
58
69
19
Tiles SectorPlantation Sector
Aluminium Sector Packaging Sector
Structured Reporting Lines are in place to monitor and make progressions on matters related to Human Resource management. Monthly meetings with the Board of Directors include a report from the human resource department where matters arising are discussed. Our open-door policy is strongly inbuilt in our culture ensuring open communication channels.
Board of Directors
Human Resources Manager
Board Remuneration Committee
HR Department
Equal Opportunity and Human Rights• Employee relationships are maintained
through guidance from the Code of Conduct established within the Group which is widely circulated to instil our work culture.
• Our Group prohibits employment of anyone under 18 years of age and precludes use of compulsory or forced labour
• We strictly adhere to all labour laws of Sri Lanka including the Shop and Office Employees’ Act, Factories Ordinance and Gratuity Act and confirm that there are no penalties for non- compliance of the said laws.
• All employment undertaken by Group falls within the nationally established institutional and legal frameworks, and all statutorily required payments towards provident funds are made on behalf of staff.

|62|Lanka Walltiles PLC
• We maintained a ratio of basic salary of women to men at 1:1 and our training, development and career progression does not have any gender limitation ensuring equal opportunity.
Freedom of AssociationMost of our workforce are members of trade unions established within the Group. We have continued to maintained harmonious relationships with them and there have been no significant trade union disputes during the year that require reporting.
Remunerations and BenefitsThe Group remuneration and benefits for the year amounted to Rs. 3625 Mn compared to Rs. 3,117 Mn in 2020. During the year Rs. 46 Mn was invested for the health and safety of our employees mainly for COVID-19 related training, prevention and detection.
Employee remuneration and benefits
2021Rs. '000
2020Rs. '000
2019Rs. '000
2018Rs. '000
Staff cost 3,139,476 2,667,349 2,497,026 2,664,405 Define contribution schemes EPF
and ETF 295,117 279,831 251,464 237,674
Defined benefit plans - Gratuity 190,630 169,765 126,289 135,738
Parental leave taken during the year 2021 2020
Employees entitled to parental leave 6,308 12,942 Employees who utilized parental leave 48 136 Employees who returned to work after parental leave 29 71 Employees who are still in employment 12 months after
returning from parental leave 44 139
We take the extra effort to care of our people extending our support beyond their basic remuneration and following are some of the main benefits provided by each sector:
Plantation This should be in one sentence Aluminium Sector
Packaging
• Housing facilities to 90% of cadre
• Improving livelihoods and sanitation facilities of employees and their families.
• Financial support for the higher education of employees' children
• Loan facilities to estate workers by collaborating with the Estate worker housing co-operatives.
• COVID testing and medical reimbursements
• Financial assistance for higher education.
• Launch of sleeping bags to create a relaxed work environment.
• Foreign tours
• Staff outings
• Staff discounts
• Medical Insurance
• COVID testing and medical reimbursements
• Transportation facilities
• Uniforms and PPE facilities
• Medical Insurance
• Loan facilities at low interest rates
Training and Development and Retention The restricted operating environment curtailed our training programmes which would have taken place otherwise. However, the change in environment made us re-assess our capabilities to identify the need for furthering our technological and expert knowledge. On the job training on virtual technology were done throughout the Group with the support of the IT departments and in-house knowledge on hi-tech needed to be enhanced to manage the operations of the factories which would have been outsourced otherwise.
Our Stakeholders and Capital

|63| Annual Report 2020/21
Employee Retention and Career progression The Group policy is such that it encourages internal promotion. Annual performance reviews are in place to assess, identify and provide training wherever necessary for career progression.
Total Hires during the year 849
Number of internal promotions during the
year 66
Investment on Training and Developement Rs. 0.95 Mn
Health and SafetyEnsuring a safe working environment with effective COVID-19 prevention measures and other health and safety guidelines to create a safe work-place at our factories, plantations, retail outlets and offices continued to be a priority. During the year Rs. 46 Mn was invested for health guidelines to curtail COVID -19 spread in workplaces and employee well-being programmes including COVID-19 prevention. In addition, we continue comply with internationally recognized safety standards such as OHSAS 18001 at our Lanka Walltiles factories and showrooms and a Safety Committee is in operation to monitor occupational health and safety.
Average Training hours per employee 2021 2020
By CategorySenior management and above 25 86Executive staff 408 921Non-Executive staff 3,014 7,927Other - 487By GenderMale 3,150 8,355Female 297 1,066

|64|Lanka Walltiles PLC
Health and safety Measures
Safety measures adopted in machinery
• Stringent COVID supervision and prevention protocols, training and monitoring processes being implemented has ensured negligible down-time due to infections.
• Regular awareness sessions and display signs and other safety information throughout the factory, retail outlets and office premises.
• At factories, Health and safety topics are covered under collective bargaining agreements
• Adequate protective gear such as goggles, helmets, gloves and industrial standard boots are provided and made compulsory that employees wear the protective gear.
• Our procurement processes ensure that machinery, equipment and tools are only purchased from creditable suppliers, after extensive evaluation, meticulous tested prior to and after implementation.
• Routine maintenance checks are performed to assess the safety of machinery and equipment.
• During the year under review there have not been any major accidents due to negligence.
Employee Engagement and Grievance MechanismsAn open-door policy to is maintained for continuous engagement with employees. Both formal and informal mechanisms such as regular staff and team meetings and social and welfare events are held throughout the year to provide channels of communication.
The Group has a grievance policy in line with best practices of OHSAS 18001 and all grievances are considered strictly confidential and addressed through a structured resolution process. There were no significant grievances reported during the year.
Our Stakeholders and Capital

|65| Annual Report 2020/21
Raw material and Waste Management
Recycle and reuse materials.
Visit supplier mines to ensure environmental compliance
Energy Consumption
Monitor energy intensity. Energy consumption was
decreased (electricity) by 5% and (LPG) by 3% compared to last year
Minimizing Emissions
Managing air and sound pollution.
Minimizing Carbon emissions.
Testing air quality.
Manage Water Consumption
Measure water consumption.
Increasing employee awareness on using water sparingly.
Goals for 2020/21 Highlights for the year Goals for 2021/22
• Successful implementation of waste heat recovery project in Horana factory
• Encourage reusing and recycling
Our Environmental Policy• Comply with all legislation, standards and codes of practice which are relevant to our business activities.
• Committed to improve our environment by preventing pollution and conserving natural resources.
• Implement a framework to set and review environmental objectives periodically.
• Communicate the environmental management process to all relevant persons.
• Our environmental policy is displayed on our company website to be viewed by our stakeholders.
• Energy savings of 119,634 Kwh through varied energy saving initiatives
• Reduction in GHG Emission by 2,956(Tco2)
• Implementing heat recovery projects in Ranala and Eheliyagoda factories
Natural Capital
The Group’s natural capital comprises of its' land, raw materials such as ball clay, feldspar, silica sand, aluminium and paper which are vital for the sustainability of our business. Accordingly the Group has in place policies to ensure compliance with environmental regulations, responsible consumption of natural resources, disposal of waste, effluents and emissions and rejuvenation of the environment.
GRI - 301-2,302-4,305-1,305,2,305-3

|66|Lanka Walltiles PLC
Natural Capital 2021 2020
Total extent of Land 221A 220ATotal Raw Material Consumption (MT) 219,512 211,908 Recycle 9,619 12,562 Recycled materials as a % of Raw Materials consumed 4% 6%Water withdrawal (M3) 240,626 239,586 Water withdrawal (M3)/ Rs. Mn revenue 8 12
Land During the year, group of companies purchased 292 acres of land for mining and agricultural purposes. The land bank was valued at Rs. 5 Bn in 2020/21 and account for 15% of our asset portfolio.
Mining of clay results in a depletion of natural resources and quarries need rehabilitation after extraction. We ensure that all our mines including that of our suppliers are backfilled in compliance to the environmental laws.
Material Consumption by Type (MT)
Type 2021 2020
RenewableBillet 5,522 4,943 Chemicals 379 305 Cornstarch 485 460 Dolomite 347 769 Field Latex Rubber 3,925 2,118 Green Leaf 12,319 18,499 Ink 95 82 Paper 26,796 26,084 Powder 29,391 123 Non – RenewableBall Clay 37,777 44,763 Feldspar A 58,761 62,730 Frit c/0107161 197 292 Grey Cement 15,623 13,005 Kaolin 4,377 5,378 Silica Sand Dark 22,638 31,647 White Cement 880 710
219,512 211,908
Material Consumed By Segment
Material change chart heading
2021 2020
Tile 140,601 159,294 Packaging 27,374 26,626Aluminium 35,292 5,371 Plantation 16,245 20,617 Total 219,512 211,908
EnergyEnergy consumption is a key area of focus as it is a significant cost. The Plantations sector has in place a number of initiatives for renewable energy such as firewood, biomass and hydro power. However, the Tiles, Aluminium and Packaging sectors are heavily reliant of non-renewable energy for their operations. Consumption of energy decreased during the year compared to previous year due to the decreased production. However, the energy intensity ratios declined for the Tiles, across the sectors driven by higher capacity utilisation. The Group was able to save 119,634Kwh of electricity through various energy saving initiatives during the year. These initiatives include,
• Successful implementation of waste heat recovery project in the Horana factory.
• Shifting to renewable energy sources wherever possible. Our corrugated packaging plant have replaced furnace oil with firewood.
• Planting of trees for fire wood by Horana Plantation.
• Installation of capacitor banks.
• Encourage off peak electricity usage and reduce usage during peak hours.
• Using energy saving LED lights in showrooms and replacing air conditioners to inverter type.
• Installation of skylights to save electricity consumption during day time.
Bearer Biological assetsGroup assets include Rs. 2,155 Mn in biological assets through Horana Plantations PLC located in the Central and Western. A total of 3,750 Hectares are cultivated with Tea, rubber and other crops such oil palm,coconuts,cinnamon,coffee pepper, fruits & vegetables etc. This includes our 15 estates located in 03 prime areas.
MaterialsManufacture of tiles requires resources such as ball clay, feldspar and kaolin which are finite. The Lanka Walltiles Group is conscious about this need and have in place a number of initiatives to minimize wastage and reuse these resources. Effective implementation of TPM and other initiatives supported a decrease in wastage and an increase in reused material. We consumed 140,253MT of non-renewable material including clay, silica sand and cement. Most minerals used in tile manufacturing are recycled while the balance is used to refill the clay mines. During the year Group reused 9619MT of materials.
Our Stakeholders and Capital
GRI - 301-1,301-2,302-3,302-4,
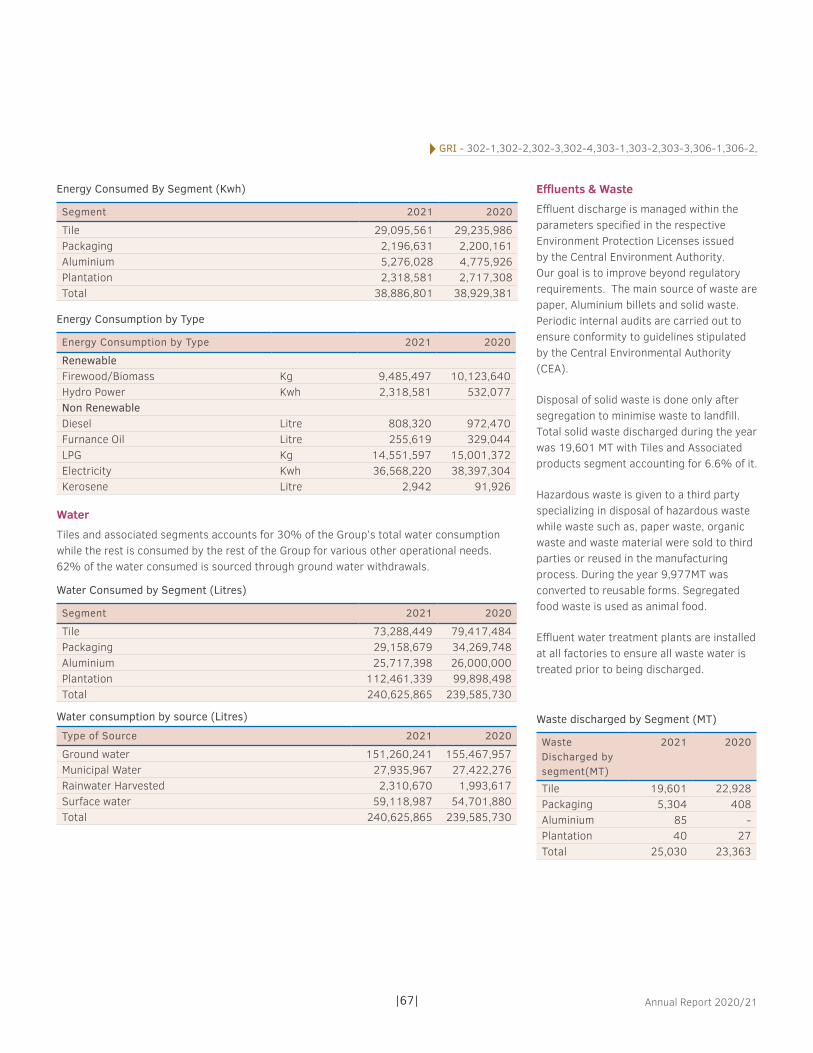
|67| Annual Report 2020/21
GRI - 302-1,302-2,302-3,302-4,303-1,303-2,303-3,306-1,306-2,
Energy Consumed By Segment (Kwh)
Segment 2021 2020
Tile 29,095,561 29,235,986 Packaging 2,196,631 2,200,161 Aluminium 5,276,028 4,775,926 Plantation 2,318,581 2,717,308 Total 38,886,801 38,929,381
Energy Consumption by Type
Energy Consumption by Type 2021 2020
RenewableFirewood/Biomass Kg 9,485,497 10,123,640 Hydro Power Kwh 2,318,581 532,077 Non RenewableDiesel Litre 808,320 972,470 Furnance Oil Litre 255,619 329,044 LPG Kg 14,551,597 15,001,372 Electricity Kwh 36,568,220 38,397,304 Kerosene Litre 2,942 91,926
Water Tiles and associated segments accounts for 30% of the Group’s total water consumption while the rest is consumed by the rest of the Group for various other operational needs. 62% of the water consumed is sourced through ground water withdrawals.
Water Consumed by Segment (Litres)
Segment 2021 2020
Tile 73,288,449 79,417,484 Packaging 29,158,679 34,269,748 Aluminium 25,717,398 26,000,000 Plantation 112,461,339 99,898,498 Total 240,625,865 239,585,730
Water consumption by source (Litres)
Type of Source 2021 2020
Ground water 151,260,241 155,467,957 Municipal Water 27,935,967 27,422,276 Rainwater Harvested 2,310,670 1,993,617Surface water 59,118,987 54,701,880 Total 240,625,865 239,585,730
Effluents & WasteEffluent discharge is managed within the parameters specified in the respective Environment Protection Licenses issued by the Central Environment Authority. Our goal is to improve beyond regulatory requirements. The main source of waste are paper, Aluminium billets and solid waste. Periodic internal audits are carried out to ensure conformity to guidelines stipulated by the Central Environmental Authority (CEA).
Disposal of solid waste is done only after segregation to minimise waste to landfill. Total solid waste discharged during the year was 19,601 MT with Tiles and Associated products segment accounting for 6.6% of it.
Hazardous waste is given to a third party specializing in disposal of hazardous waste while waste such as, paper waste, organic waste and waste material were sold to third parties or reused in the manufacturing process. During the year 9,977MT was converted to reusable forms. Segregated food waste is used as animal food.
Effluent water treatment plants are installed at all factories to ensure all waste water is treated prior to being discharged.
Waste discharged by Segment (MT)
Waste Discharged by segment(MT)
2021 2020
Tile 19,601 22,928 Packaging 5,304 408 Aluminium 85 - Plantation 40 27 Total 25,030 23,363

|68|Lanka Walltiles PLC
Disposal of solid waste (MT)
Segment 2021 2020
Composting 24 14 Inclination 72 57 Landfill 5,963 6,116 On site Storage 1,097 1,444 Other 23 34 Recycled 7,874 5,361 Reused 9,977 10,337 Total 25,030 23,363
Waste water(Mn Litres)
Segment 2021 2020
Municipality sewerage
3,632,000 4,261,000
Recycled 53,616,489 79,293,744 Soakage Pits 20,985,675 30,939,065 River,lakes & waterland
29,782,850 29,675,800
Total 108,017,014 144,169,609
Emissions & NoiseThe quality of air and level of noise within factory doors and outdoors impact our environment. We focus on reducing our carbon footprint and containing air and noise pollution. The main forms of emissions in tile manufacturing include Greenhouse gas (GHG) emissions, tile dust and other types of air emissions.
Ongoing initiatives include:
• Minimizing emissions:
• Using cleaner production methods and machinery with eco-friendly features
• Ensure Kiln chimneys are at a height that allows for the evaporation of any released vapours without harming the environment.
• Programs to improve fuel efficiency in manufacturing.
• Installed dust collectors to minimize dust emissions. The dust collected was reused in the production process.
• Improved internal control systems to measure and manage sound pollution. The crushing process continued to be outsourced to a third party located within the factory radius. In addition, certain production areas were sound proofed due to high level of sound in production processors. We also purchased land surrounding our
factories.
• Testing air quality and monitoring emissions
• Ensured factory emissions are below the permissible levels set by the CEA.
• Monitor air emissions for ensure Sulphur dioxides and nitrogen dioxides are maintained below regulatory level.
• The air quality around the Meepe factory was well within the regulatory permissible level of 100 Micrograms.
• All vapours and air emissions are non-toxic and regularly monitored to measure any changes in the level of toxicity.
• Dust emissions of the company are well below the maximum permissible levels of the CEA.
Environmental Compliance
Environmental compliance is primarily focused on the parameters set out in the Environmental Protection License and the requirements of environmental certifications obtained which benchmark the Group’s practices with international best practice. We also ensure that our suppliers for clay and other mined products have in place valid licenses and that they comply with the requirements of the licenses including rehabilitation of the same in line with the license.
Our Stakeholders and Capital
GRI - 303-2,303-3,305-1,305-2,305-3,306-1,306-2

|69| Annual Report 2020/21
Trusted Brands
Certifications
Skills & Expertise
Operational Excellence
Innovation
Highlights Outlook
• Addition of large format tiles
• Addition of mosaic tiles
• Launch of 345 new collections
• Increase in brand value by Rs. 296
• Efficiencies from Total Productive Maintenance
• Consistent brand messaging
• Compliance with certification requirements
• Continuing innovation
• Continuing TPM and other productivity and efficiency programs
• Additional certifications required for entry to markets
• Strengthening internal controls and systems
• Retention of our team
Trusted brands
Rs. 1,409Mn
Lanka Tiles brand valued at
by Brand Finance Sri Lanka in 2021
Intellectual Capital
These intangible capitals of the Group are critical for differentiation of our unique value proposition and products and play a key role in shaping our performance and reputation. In this section, we explore the components of this non-monetised capital that underpins our value creation process.
The Lanka Tiles Group has three well recognised brands. Lanka Tiles, the brand under which both Lanka Tiles and Lanka Walltiles tiles are made is a household name and the #1 tile brand in Sri Lanka. Synonymous with quality, this brand was valued at Rs. 1,409 Mn by brand finance Sri Lanka in 2021. Swisstek is the brand for grout and the Aluminium profiles and a range of value added products that are also household names. Unidil is the brand of the Group’s packaging sector which is a trusted brand by corporates to meet their packaging needs.
GRI - 307-1

|70|Lanka Walltiles PLC
a dedicated business development team identifies potential areas for market and product development. Innovation is also used in managing resources more efficiently and minimizing any negative impact to the environment. R&D personnel closely work with the production team to assist them in increasing efficiency and effectiveness in the manufacturing process.
Operational ExcellencePhase I of Total Productive Maintenance has been successfully rolled out and completed in all tile and Aluminium factories resulting in significant resource, time and cost efficiencies. The Group is now moving to Phase II of TPM which is expected to further streamline operations.
The year also saw automation and digitalisation of a number of processes at the factories and offices. Digitalisation was key supporting working from home during the year. These initiatives included the following;
• Provide VPN facility to work from home
• Internet facility
• Budgeted to provide Laptop & desktop facilities to employees
CertificationsCertifications play a key role as it provides assurance to business partners and customers about our policies and processes. It also provides access to export markets and ensures that our processes are benchmarked to international best practice in key areas of operations.
Autonomous maintenance
Planned maintenance
Quality integration
Focused improvements
Early equipment
management
Training and education
Safety, health and
environment
TPM in administration
Total Productive Maintenance
Our brands are built on a reputation of superior quality, the aesthetic appeal of our products and a comprehensive product range add lustre to the brand. Continuous reinforcement of brand messaging through our customer touchpoints strengthen the brand. As home grown brands, we have been able to maintain our competitive edge in the local market while making steady progress in establishing as a leading contender in the export market.
Skills and expertiseThe skills, expertise and tacit knowledge of our teams are a key source of differentiation and competitive advantage. Many of our employees join at entry levels and their skills are nurtured through structured training programmes and on the job training in the Group. All sectors require specialised skills at various levels and we work with a number of organisations that develop talent pools to recruit suitable candidates.
As we need to retain employees to develop their skills, retention of employees plays a key role in building sustainable competitive advantage. The adjacent chart reflects our ability to retain employees across all sectors. A coaching and mentoring culture nurtured over the years supports knowledge transfer among the employees, nurturing the Group’s tacit knowledge.
Our Stakeholders and Capital
Investment on New Product Designs
Research and Development
Rs Mn No.
No.of New Product
369345
611
517
0
5
10
15
20
25
30
20182017 2019 2020 2021
25 29 24
7
300
400
500
600
700
800
InnovationThe Group has nurtured a culture of innovation supporting continuous product innovation and process improvement across all sectors. This is vital to ensure our products are relevant to customer needs, driving demand creation. Innovation in processes support operational excellence, improvement in turnaround times, minimisation of waste and reduced consumption driving margin growth. It also supports disruption of the business from within, ensuring that we remain competitive.
Product innovation - A strong pipeline of products supports continued innovation e ensuring that the portfolio remains future forward and on trend.
The Lanka Tiles Research and Development team is responsible for analysing market trends and customer preferences while

|71| Annual Report 2020/21
Certification Description Sectors Certified
ISO 9001 : 2015 Certification Quality management system Tile
ISO 14001 : 2015 Certification Minimize how their operations negatively affect the environment; comply with applicable laws, regulations, and other environmentally oriented requirements; and continually improve in the above.
Tile
CE Mark Product Certification Mark that indicates conformity with health, safety, and environmental protection standards for products sold within the European Economic Area.
Tile
Green Label Certification Product is less damaging to the environment or to the people making it more safer and environmentally friendlier than other similar products.
Tile
SLS 1181 Product Certification Manage their risks from fire by reducing the losses associated with property damage and business interruption
Tile
OHSAS 18001 : 2009 Certification Occupational health and safety Tile
ISO 9001: 2015 Certification Quality management system Plantation
ISO 22000: 2018 Food Safety Management Systems and HACCP Certification
Minimum permitted levels of agro-chemicals, heavy metals and micro biological content.
Plantation
Forest Stewardship Council Certification (Rubber)
Certifies that the rubber plantations is consistent with parameters of environmentally sound management
Plantation
Ethical Tea Partnership (ETP) Certification
The impacts of climate change, safe usage of agrochemicals and initiatives on water management.
Plantation
Rainforest Alliance Certification Promotes efficient agriculture, biodiversity conservation and sustainable community development.
Plantation
ISO 14001 :2015 Certification Environmental policy and requirements. Plantation
Fair Trade Certification Product certification within the market-based movement fair trade. Plantation
Green House Gas Inventor Verification Certification
Reduce GHG emissions. Plantation
FSSC-ISO 2200:2018 Certification Food safety related risk Packaging
SLS 1474 Certification Food safety related risk Packaging
SLS 1492 Certification Food safety related risk Packaging
FSC Certification Forest Stewardship Council certification Packaging
ISO 9001:2015 Certification Quality management system Packaging
ISO 14001:2015 Certification Organization whose processes impact the environment Packaging
Qualicoat Certification Quality Label for Liquid and Powder Organic Coatings on Aluminium for Architectural Applications.
Aluminium
ISO 9001:2015 Certification Quality management system Aluminium
SLAS1410:2011 Certification Extruded aluminium alloy products for Architectural applications Certification Aluminium

|72|Lanka Walltiles PLC
Inspiring Growth

|73| Annual Report 2020/21
Inspiring Growth
Stewardship 74Remuneration Committee Report 81Audit Committee Report 82Related party Transactions Review Committee Report 83Annual report of The Board of Directors on the Affairs of The Company 85Chief Executive Officer’s and Chief Financial Officer’s Responsibility Statement 90Statement of Directors Responsibilities 91Annual report of The Board of Directors on the Affairs of The Company 85Chief Executive Officer’s and Chief Financial Officer’s Responsibility Statement 90Statement of Directors Responsibilities 91
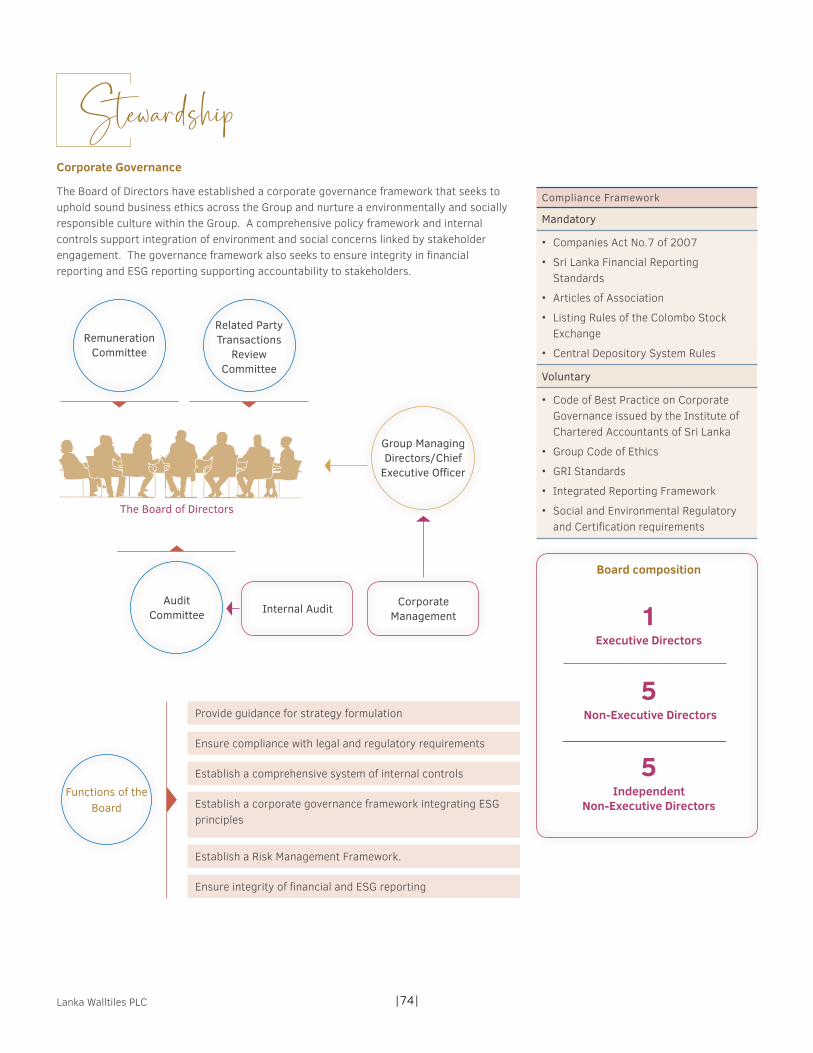
|74|Lanka Walltiles PLC
StewardshipCorporate Governance
The Board of Directors have established a corporate governance framework that seeks to uphold sound business ethics across the Group and nurture a environmentally and socially responsible culture within the Group. A comprehensive policy framework and internal controls support integration of environment and social concerns linked by stakeholder engagement. The governance framework also seeks to ensure integrity in financial reporting and ESG reporting supporting accountability to stakeholders.
The Board of Directors
Remuneration Committee
Related Party Transactions
Review Committee
Group Managing Directors/Chief
Executive Officer
Audit Committee Internal Audit Corporate
Management
Compliance Framework
Mandatory
• Companies Act No.7 of 2007
• Sri Lanka Financial Reporting Standards
• Articles of Association
• Listing Rules of the Colombo Stock Exchange
• Central Depository System Rules
Voluntary
• Code of Best Practice on Corporate Governance issued by the Institute of Chartered Accountants of Sri Lanka
• Group Code of Ethics
• GRI Standards
• Integrated Reporting Framework
• Social and Environmental Regulatory and Certification requirements
Provide guidance for strategy formulation
Ensure compliance with legal and regulatory requirements
Establish a comprehensive system of internal controls
Establish a corporate governance framework integrating ESG principles
Establish a Risk Management Framework.
Ensure integrity of financial and ESG reporting
Functions of the Board
Board composition
Executive Directors
Non-Executive Directors
Independent Non-Executive Directors
1
5
5

|75| Annual Report 2020/21
As at 31st March 2021 the Board of Directors were as follows:
Director Status
Dhammika Perera Non- ExecutiveA M Weerasinghe Non- ExecutiveJ A P M Jayasekera ExecutiveDr. S Selliah Non-Executive - IndependentT G Thoradeniya Non- ExecutiveR N Somaratne Non- ExecutiveK D G Gunaratne Non- Executive - IndependentA M L Page Non- Executive - IndependentJ D N Kekulawala Non- Executive - IndependentS M Liyanage Non- ExecutiveS R Jayaweera (Appointed w.e.f 09.10.2020) Non- Executive- independent
Corporate Governance 2020/21• Disclosure to Colombo Stock
Exchange on COVID-19 impacts
• 1st Virtual Annual General Meeting of shareholders
• Appointment of Mr.Sanjeewa Jayaweera to the Board of Lanka Walltiles PLC
• Approval of first interim dividend of Rs.3.60 per share in November 2020
• Approval of second interim dividend of Rs.10 per share in February 2021
• Extraordinary General Meeting of shareholders to approve sub-division of share with a 1:5 ratio
The Board CompositionThe Board of Directors comprises 1 executive director and 10 Non-Executive Directors of whom 5 are independent. Collectively the Board has financial acumen, industry knowledge, marketing and technical knowledge necessary to provide strategic direction, ensure compliance and manage foreseeable risks.
Dr. S Selliah, Mr. K D G Gunaratne, Ms. A M L Page and Mr. S R Jayaweera are Directors of Lanka Tiles PLC. However, they are considered independent directors as:
• They are not involved actively in the management of Lanka Walltiles.
• They do not hold a significant percentage of share on Lanka Tiles.
Accordingly, the directors were considered independent in compliance to criteria set out in the Listing Rules of the Colombo Stock Exchange.
Chairman & Managing DirectorThe Chairman’s and Managing Director’s roles are segregated, facilitating a balance of power. The Managing Director is appointed by the Board and is responsible for implementing strategic plans of the Group and driving performance within a defined framework and is a member of the Board. The Board receives quarterly reports from the Managing Director confirming compliance with regulatory requirements.
Board CommitteesFour main sub-committees appointed by the Board take on the responsibilities for management of affairs of the Group. These committees are as follows:
Gender
MaleFemale
10
1
Age
30-4546-6061-70
2
4
5
Tenure of Service
<5 Year5 -10 Year10 -20 Year>20 Year
4
5
1
1

|76|Lanka Walltiles PLC
Audit Committee Remuneration Committee Related Party Transaction Review Committee
Group Management Committee
02 Independent Directors and 01 Non Executive Director, of whom one is a Chartered Accountant
Comprises 03 Independent Non Executive directors of the parent Company, Royal Ceramics Lanka PLC
Comprises of 03 Directors- 02 Independent Non-Executive and 01 Non-Executive Director
Comprises the members of the Corporate Management whose designations are given on pages 24 to 25
Board
1. Reviews the integrity of financial statements in accordance with Sri Lanka Financial Reporting Standards.
2. Ensure compliance to legal and regulatory requirements of Companies Act and other relevant financial reporting related regulations and requirements.
3. Assess the External Auditor’s independence and performance.
4. Review adequacy and effectiveness of risk management
The Committee assists the Board in determining a suitable remuneration package.
Refer page 82 for Audit Committee Report
Refer page 81 for Remuneration Committee Report.
Refer pages 83 to 84 for Related Party Transactions Review Committee Report.
The Annual reports provides a concise and balanced review of the performance for the year.
To ensure on behalf of the Board, that all Related Party Transactions of the Group are consistent with the Code of Best Practice on Related Party Transactions issued by the SEC.
Stewardship
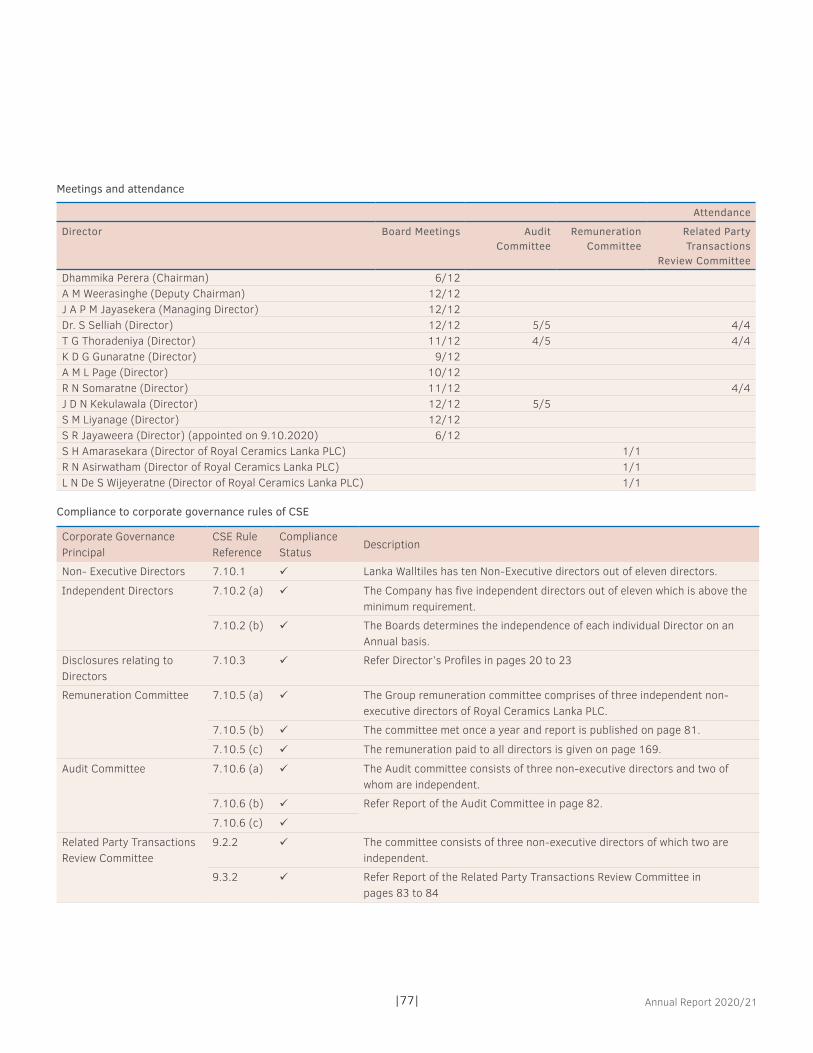
|77| Annual Report 2020/21
Meetings and attendance
Attendance
Director Board Meetings Audit Committee
Remuneration Committee
Related Party Transactions
Review CommitteeDhammika Perera (Chairman) 6/12A M Weerasinghe (Deputy Chairman) 12/12J A P M Jayasekera (Managing Director) 12/12Dr. S Selliah (Director) 12/12 5/5 4/4T G Thoradeniya (Director) 11/12 4/5 4/4K D G Gunaratne (Director) 9/12A M L Page (Director) 10/12R N Somaratne (Director) 11/12 4/4J D N Kekulawala (Director) 12/12 5/5S M Liyanage (Director) 12/12S R Jayaweera (Director) (appointed on 9.10.2020) 6/12S H Amarasekara (Director of Royal Ceramics Lanka PLC) 1/1R N Asirwatham (Director of Royal Ceramics Lanka PLC) 1/1L N De S Wijeyeratne (Director of Royal Ceramics Lanka PLC) 1/1
Compliance to corporate governance rules of CSE
Corporate Governance Principal
CSE Rule Reference
Compliance Status
Description
Non- Executive Directors 7.10.1 Lanka Walltiles has ten Non-Executive directors out of eleven directors.
Independent Directors 7.10.2 (a) The Company has five independent directors out of eleven which is above the minimum requirement.
7.10.2 (b) The Boards determines the independence of each individual Director on an Annual basis.
Disclosures relating to Directors
7.10.3 Refer Director’s Profiles in pages 20 to 23
Remuneration Committee 7.10.5 (a) The Group remuneration committee comprises of three independent non-executive directors of Royal Ceramics Lanka PLC.
7.10.5 (b) The committee met once a year and report is published on page 81.
7.10.5 (c) The remuneration paid to all directors is given on page 169.
Audit Committee 7.10.6 (a) The Audit committee consists of three non-executive directors and two of whom are independent.
7.10.6 (b) Refer Report of the Audit Committee in page 82.
7.10.6 (c)
Related Party Transactions Review Committee
9.2.2 The committee consists of three non-executive directors of which two are independent.
9.3.2 Refer Report of the Related Party Transactions Review Committee in pages 83 to 84

|78|Lanka Walltiles PLC
Compliance to the code of best practices on Corporate Governance issued by the Institute of Chartered Accountants of Sri Lanka in 2017
Guidelines Status of Compliance
The Board A.1
Frequency of Board Meetings • Meetings of the Board was held every month.
• The attendance of Board meetings is described in the table above.
Role and responsibility of the Board The main roles of the Board were:
• Formulate and implement an effective strategy.
• Risk management
• Ensure compliance to all relevant laws and regulations.
• Maintain an effective governance framework consisting of policies and internal controls.
• Appoint and re-elect the members of the Board. Every member of the
• Board is re-elected at regular intervals at least once in three years.
Compliance with applicable law The Board ensured the Group is compliant with all applicable, rules, laws and regulations.
Company Secretary The services and advice of the Company Secretary M/s. PW Corporate Secretarial (Pvt.) Ltd. is available at any given time to the Board. The Secretary also informs the Board of any new laws and regulations that will need to be adhered with.
Other
• Independent judgement
• Dedication of adequate time and effort
• Training of directors.
• The Board of Directors are committed in providing independent judgment in the decision- making process.
• The Directors attended all Board meetings in person and allocate adequate time and effort in managing the affairs of the group.
• All Directors have a considerable experience in the Ceramic industry. The Directors have also participated in training programs both locally and overseas during the financial year to further upskill their knowledge and competencies.
Chairman and CEO
Division of responsibilities between the Chairman and CEO
• The Chairman holds the responsibility of overseeing the activities the Board.
• The executive responsibility of overseeing the business of the company is held by the Managing director.
• There is a clear distinction of responsibilities within the Board.
A.2
Prepare good corporate governance and facilitate effective discharge of Board functions
During the year, the Chairman conducted 12 Board meetings to maintain close contact with the directors. In addition, informal meetings were with non- executive directors whenever necessary.
A.3
Financial Acumen
Availability of sufficient financial acumen and knowledge.
The Managing Director is a Fellow Chartered Accountant and possess the necessary financial knowledge and expertise to assist the Board in managing the financial matters of the company.
A.4
Board Balance A.5
The Board should have an adequate number of Directors with a balance of Executive and Non-Executive Directors of sufficient calibre along with independent Directors.
The Board comprises of eleven Executive and Non-Executive Directors.
Stewardship

|79| Annual Report 2020/21
Guidelines Status of Compliance
Supply of information
Relevant information and agenda to be circulated in a timely manner to the Board.
The Board papers are circulated a week prior to Board meetings to provide an adequate briefing on relevant information.
A.6
Changes to the Board
Procedure for appointing the Board of directors.
• All new appointments are informed to the SEC as per existing regulations.
• Appointments are undertaken by the Board of directors.
A.7
Re-election As per the Articles of Association one third of the Directors are required to retire from office and apply for re-election every year by shareholders.
A.8
Information disclosure to shareholders All Directors have declared their details on pages 20 to 23 as Director profiles. A.10
Appraisal of the Board
Boards should periodically appraise their own performance in order to ensure that responsibilities are discharged in a satisfactory manner
The Board evaluates performance by:
• Assessing the achievement of corporate goals.
• Evaluating the effectiveness of strategy.
• Adherence to laws and regulations.
• Managing stakeholder requirements.
A.9
The Board is required to assess the performance of the CEO annually.
The CEO is reviewed annually by the Board based on the strategic targets set for the year.
A.11
Directors Remuneration
Formal and transparent procedure for developing policies on remuneration.
The remuneration committee assists the Board of directors in matters concerning the remuneration of directors and employees of the organization.
B.1
Levels of remuneration The remuneration levels are aligned to industry standards and comply with statutory labour laws and regulations. We offer an attractive remuneration to motivate and retain Directors, senior management and the employees of the Group.
B.2
Disclosure of Remuneration The remuneration report can be found in page 81 of the report which explains the adherence to the remuneration policy of the group.
The aggregate remuneration paid to Executive and Non executive Directors are disclosed on Page 169.
B.3
Relations with stakeholders
Constructive use of the Annual General Meeting and conduct of General Meetings
The board encourages the active participation of the shareholders at the Annual general meeting (AGM).
C.1
Communication with shareholders The company secretary is considered the official contact person for shareholders. However, other processors are also in place to contact the company.
C.2
Major and Material Transactions There were no transactions during the period under review which are considered as material/ Major as per the companies Act. The report of the Related Party Transactions Review Committee is on the pages 83 to 84.
C.3
Accountability and Audit
Financial and Business Reporting The annual reports present a balanced and concise overview of the activities of the Group. It also includes the financial accounts, management reviews and Director reports.
D.1
Risk Management and Internal Control A sound risk management framework is adopted by the group consisting of policies, internal controls and periodic monitoring. These are described in the risk management section of the report.
D.2

|80|Lanka Walltiles PLC
Guidelines Status of Compliance
Audit Committee The activities of the Audit committee are described in page 82 D.3
Related Party Transactions Review Committee
Related Party Transactions Review Committee report on Pages 83 to 84. In addition, the details of related party transactions are described in line with LKAS 24.
D.4
Code of Business Conduct and Ethics The Board of directors have adopted the Code of Best Practice issued by the Institute of Chartered Accountants of Sri Lanka and the Securities Exchange Commission
D.5
Corporate Governance Disclosures Adheres to established principles and practices of good Corporate Governance. These are described in the Corporate governance report in page 74.
D.6
Shareholders – Institutional Investors
Shareholder Voting All institutional shareholders are encouraged to participate at shareholder meetings and their views are communicated to all concerned.
E.1
Evaluation of Governance Disclosures The Annual report describes the corporate governance process. E.2
Investing / Divesting Decision The Annual report provides all information to support informed decision making. The Annual and quarterly reports are published in the Colombo stock exchange website.
F.1
Shareholder participation in meetings All shareholders are encouraged to participate at the Annual General Meeting / Extraordinary General Meeting and cast their votes. AGMs are noticed in advance as per Companies Act.
F.2
Internet of Things and Cybersecurity
The Board should have a process to manage the cyber risks and how the IT devices within and outside the group connect to the organization network.
Designated Chief Information Security Officer (CISO) to manage the IT operations of the group.
Cybersecurity risks are managed through a cyber security policy and a robust cyber security risk management process.
Further details are described in the risk management report.
G.1
ESG reporting
The Board is responsible on providing an adequate disclosure of the ESG performance of the group to stakeholders
The Annual reports provides a holistic review of performance. The performance of the various capitals used by the group are described in separate sections of the report.
H.1
ESG governance Refer page 65 of the report. H.1
Statement of complianceThe Company has complied with the requirements of the Code of Best Practices on Corporate Governance issued by the Institute of Chartered Accountants of Sri Lanka and Section 7: Continuing Listing Rules and Section 9: Related Party Transactions issued by the Colombo Stock Exchange. Further, the Board confirms that all statutory payments due to the Government, other regulatory institutions and to employees, have been made on time.
Dhammika Perera J A P M JayasekeraChairman Managing Director
Stewardship

|81| Annual Report 2020/21
Remuneration Committee Report
Role of the Remuneration CommitteeThe Remuneration Committee is a sub - committee of Royal Ceramics Lanka PLC Board, to which it is accountable. The Committee evaluates the performance of the respective Group Company Boards, its Chief Executive Officers, Key Management Personal and executive staff against the set objectives and goals, and determines the remuneration policy of the Group Company for all levels of employees. The Committee supports and advises the Board on remuneration and remuneration related matters and makes decisions under delegated authority with a view to aligning the interests of employees and shareholders.
Composition of the Remuneration CommitteeThe Remuneration Committee comprises of the following three independent non-executive Directors of Royal Ceramics Lanka PLC who is the parent company of Lanka Walltiles PLC
Mr. S H Amarasekera - Chairman
Mr. R N Asirwatham
Mr. L N De S Wijeyeratne
The Managing Director attends the Committee meeting by invitation. The Company Secretary is the secretary of the Remuneration Committee.
The above Committee members possess vast experience in the fields of Business Management, Human Resources Management, Labour Relations and Labour Law. Hence, the Committee has adequate expertise in remuneration policy and business management to deliberate and propose necessary changes and improvements to meet the roles and responsibility of the Committee.
MeetingsThe Remuneration Committee met once for the year. The attendance of the members at the meeting is as follows.
Mr. S H Amarasekera - 1/1
Mr. R N Asirwatham - 1/1
Mr. L N De S Wijeyeratne - 1/1
Functions performed by the Remuneration Committeea. Evaluating and recommending
the remuneration payable to the Board, Managing Director and the Key Management Personnel of the Company, to the Board to make the final determination. Based on that, the aggregate remuneration paid to Executive and Non Executive Directors for the last financial year is given on page 149 of the Annual Report under key management remuneration.
b. Ensuring that the Board complies with the Companies Act in relation to Directors remunerations, especially the requirements of section 216. It also ensures that employees are adequately compensated based on their performance and contribution for the period under review and future potential.
c. Constructing a specific remuneration policy and remuneration framework that enables the Company to attract and retain a high quality and representative staff in its operations and do this inter alia with reference to appropriate market rates where these are relevant, and benchmarking specific categories where required.
d. Ensuring internal equity and fairness in and between the various pay categories and building incentives in the cost of employment structure to encourage and reward excellent performance, on objectively defined criteria.
e. Ensuring that staff costs are within the budget set by the Board, and are sustainable over time
ConclusionThe Committee is satisfied that it has performed the responsibilities that were delegated to it by the Board for the year under review and the necessary objectives were achieved for the year under review.
Mr. S H Amarasekera Chairman
Remuneration Committee31st May 2021

|82|Lanka Walltiles PLC
Audit Committee Report
Role of the Audit CommitteeThe Audit Committee is a Sub Committee of the Board, to which it is accountable. The function of the Audit Committee is defined in the Audit Committee Charter. Primarily it is to assist the Board in its oversight of the integrity of the Financial Statements of the Company, to assess the adequacy of the risk management framework of the Company, assess the independence and the performance of the Company’s external audit function and internal audit functions, and review compliance of the Company with legal and regulatory requirements.
Composition of the Audit CommitteeThe Audit Committee comprised of the following three Directors.
Mr. J. D. N. Kekulawala Chairman - Independent Non - Executive
Dr. S. Selliah Committee Member Independent Non - Executive
Mr. T. G. Thoradeniya Committee Member - Non - Executive
The Managing Director and the General Manager – Finance attend the meetings at the invitation of the Audit Committee.
The Company Secretary functions as the Secretary to the Audit Committee. Representatives of the Company, external auditors and internal auditors also attend Audit Committee meetings by invitation.
The Audit Committee has the required expertise in finance, law and business management to deliberate Audit Committee matters and recommend necessary action to be taken.
MeetingsThe Audit Committee met 05 times during the year. The attendance of the members at the meeting is as follows.
Mr. J. D. N. Kekulawala - 5/5Dr. S. Selliah - 5/5Mr. T. G. Thoradeniya - 4/5
Functions performed by the Audit Committee a. The Committee reviewed the
provisional financial statements that were published for financial year 2020/21 and the audited financial statements of financial year 2020/21. It reviewed the preparation, presentation and adequacy of disclosures in the financial statements of the Company, in accordance with Sri Lanka Accounting Standards. It also reviewed the Company’s compliance with financial reporting requirements, information requirements of the Companies Act and other relevant financial reporting related regulations and requirements.
b. The Committee reviewed the quarterly internal audit reports. The internal audit function is carried out by M/s. BDO Partners. The Internal audits are done on a process based audit framework to improve process performance and control.
c. The Committee reviewed the external auditors’ report and management letter for the last year. All recommendations proposed by the external auditors were discussed with the senior partner and recommendations proposed were duly carried out by the management. In addition the Audit Committee reviewed external auditors and the engagement partner’s relationships with the Company, and assessed that the external auditors are independent.
d. The Audit Committee in conjunction with the Managing Director of the Company reviewed the Company’s disclosure controls and procedures and internal control over financial reporting.
e. The Audit Committee reviewed the Company’s framework and practices with respect to risk assessment and
risk management, including discussing with management the Company’s major financial risk exposures and the steps that have been taken to monitor and control such exposures.
f. The Audit Committee reviewed the company’s arrangement for the confidential receipt, retention and treatment of complaints alleging fraud, received from any sources and pertaining to accounting, internal controls or other such matters and assured the confidentiality to whistle-blowing employees. It also reviewed the company’s procedures for detecting and preventing fraud and bribery and receiving reports on non-compliance and reviewed the procedure for receiving and dealing with “Non-Compliance with Laws and Regulations (NOCLAR) referred by Professional Accountants.
g. Performed other activities related to this charter as requested by the Board of Directors. Oversaw special investigations as needed. Reviewed and assessed the adequacy of the committee charter annually and requested board approval for proposed changes, and ensured appropriate disclosure as may be required by law or regulations.
ConclusionThe Audit Committee is satisfied that the Company’s accounting policies, independence of the auditors and risk management policies are adequate for its operations. The Audit Committee has also accomplished responsibilities and functions that are delegated to it by the Board and outlined in the Charter.
J. D. N. KekulawalaChairman - Audit Committee
31st May 2021

|83| Annual Report 2020/21
The Related Party Transactions Review Committee (RPTRC) of the Company was formed by the Board in January 2016 in accordance with Section 9 of the Listing Rules of the Colombo Stock Exchange to ensure compliance with those Rules facilitating independent review, approval and oversight of Related Party Transactions of the Company.
PURPOSE OF THE COMMITTEEThe purpose of the RPTRC of the Company is to conduct an independent review approval and oversight of all related party transactions of Lanka Walltiles PLC and to ensure that the Company complies with the rules set out in the Listing Rules. The primary objectives of the said rules are to ensure that the interests of the shareholders as a whole are taken into account when entering into related party transactions, and to prevent Directors, key management personnel or substantial shareholders from taking advantage of their positions. To exercise this purpose the Committee has adopted the related party transaction Policy which contains the company’s Policy governing the review, approval and oversight of related party transactions.
RESPONSIBILITIES OF THE RELATED PARTY TRANSACTIONS REVIEW COMMITTEEThe following are key responsibilities have been set out in the Charter for RPTRC;
a) Ensure that the Company complies with the rules set out in the Listing Rules
b) Subject to the exceptions given in the Listing Rules, review, in advance all proposed related party transactions
c) Perform other activities related to the Charter as requested by the Board
d) Have meetings every fiscal quarter and report to the Board on the Committee’s activities
e) Share information with the Audit Committee as necessary and appropriate, to permit the Audit Committee to carry out its statutory, regulatory and other responsibilities with regard to related party transactions.
f) Review the Charter and Policy at least annually and recommend amendments to the Charter and Policy to the Board as and when determined to be appropriate by the Committee.
Composition of the CommitteeThe RPTRC comprises of the following three Non-executive Directors.
1. Dr. S. Selliah – Chairman
2. Mr. J. D. N. Kekulawala
3. Mr. T. G. Thoradeniya
The Managing Director and the General Manager - Finance, attend meetings by invitation and the Company Secretary functions as the secretary to the Committee.
The Committee members possess vast experience in business management and financial expertise to perform the duty of the Committee successfully.
MeetingsThe Committee held four meetings during the year the attendance of the members at the meeting is as follows.
1. Dr. S. Selliah - Chairman 4/4
2. Mr. J. D. N. Kekulawala 4/4
3. Mr. T. G. Thoradeniya 4/4
The minutes of the Committee meetings were tabled at Board meetings, for the review of the Board.
Procedures for Reporting Related Party TransactionsThe Managing Director (MD) is responsible for reporting to the Committee, for its review and approval the information set out under Rule 30 of the Code at the minimum, in respect of each related party transaction proposed to be entered into other than the exceptions given in Rule 27 of the code. Moreover, on a quarterly basis, the MD is required to report to the Committee on the approved related party transactions actually entered into by the Company.
The Committee has approved the Related Party Transactions Declaration Form required to be filled by the Directors and key management personnel of the Company. The Company uses this form to capture the related party transactions at the end of every quarter.
Review of Related Party TransactionsThe Committee reviewed all related party transactions of the Company for the financial year 2020/21. In terms of Rule 9.3.2 of the Listing Rules of the Colombo Stock Exchange on related party transactions, there were no one-recurrent related party transactions entered into during the course of the financial year with an aggregate value which exceeded the lower of 10% of the equity or 5% of the assets. There were no recurrent related party transactions carried out during the financial year ended 31st March 2021, the aggregate value of which exceeded 10% of the revenue.
In the opinion of the Committee, the terms of these transactions were not more favourable to the related parties than those generally available to the public. The details of related party transactions entered into during the year, are given in Note 30 to the Financial Statements, on pages 164 to 169 of this Annual Report.
Related party Transactions Review Committee Report

|84|Lanka Walltiles PLC
DeclarationA declaration by the Board of Directors on compliance with the rules pertaining to Related Party Transactions appears on the report of the Board of Directors on pages 85 to 89 of this Annual Report.
Dr. S. Selliah
Chairman - Related Party Transactions Review Committee
31st May 2021
Related party Transactions Review Committee Report

|85| Annual Report 2020/21
Annual report of The Board of Directors on the Affairs of The Company
The Directors of Lanka Walltiles PLC have pleasure in presenting their Annual Report together with the Audited Financial Statements of the Company for the year ended 31st March 2021.
This Annual Report of the Board on the affairs of the Company contains the information required in terms of the Companies Act No. 07 of 2007, the Listing Rules of the Colombo Stock Exchange and is guided by recommended best practices.
General Lanka Walltiles PLC is a public limited liability company which was incorporated under the Companies Ordinance No.51 of 1938 as a public company on 24th day of September 1975. Pursuant to the requirements of the new Companies Act No. 7 of 2007, the Company was re-registered on 24th July 2007 and bears registration number PQ55.
Principal activities of the Company and review of performance during the year The main activity of Lanka Walltiles PLC, is the manufacture of glazed ceramic walltiles for export and for sale in the local market.
This Report together with the Financial Statements, reflect the state of affairs of the Company.
Financial StatementsThe Financial Statements of the Company duly signed by two Directors on behalf of the Board and the Auditors are given on page 97.
Summarised Financial Results
2021 2020Rs.’000 Rs.’000
Revenue 29,423,381 19,929,709Profit for the year 4,013,420 414,649
Independent Auditors’ ReportThe Report of the Independent Auditors on the Financial Statements of the Company is given on pages 94 to 96.
Accounting PoliciesThe financial statements of the Company have been prepared in accordance with the revised Sri Lanka Accounting Standards and the policies adopted thereof are given on page 101 to 118 Figures pertaining to the previous period have been re-stated where necessary to conform to the presentation for the year under review.
Directors’ responsibility for Financial ReportingThe Directors are responsible for the preparation of Financial Statements of the Company to reflect a true and fair view of the state of its affairs. The Directors are of the view that these financial statements have been prepared in conformity with requirements of the Sri Lanka Accounting Standards, the Companies Act No.7 of 2007 and the Listing Rules of the Colombo Stock Exchange.
DirectorsThe names of the Directors who held office as at the end of the accounting period are given below and their brief profiles appear on pages 20 to 23.
Executive Director
Mr. J A P M Jayaskera Managing Director
Non - Executive Directors
Mr. Dhammika Perera Chairman
Mr. A M Weerasinghe Deputy Chairman
Mr. T G Thoradeniya
Mr. M W R N Somaratne
Mr. S M Liyanage
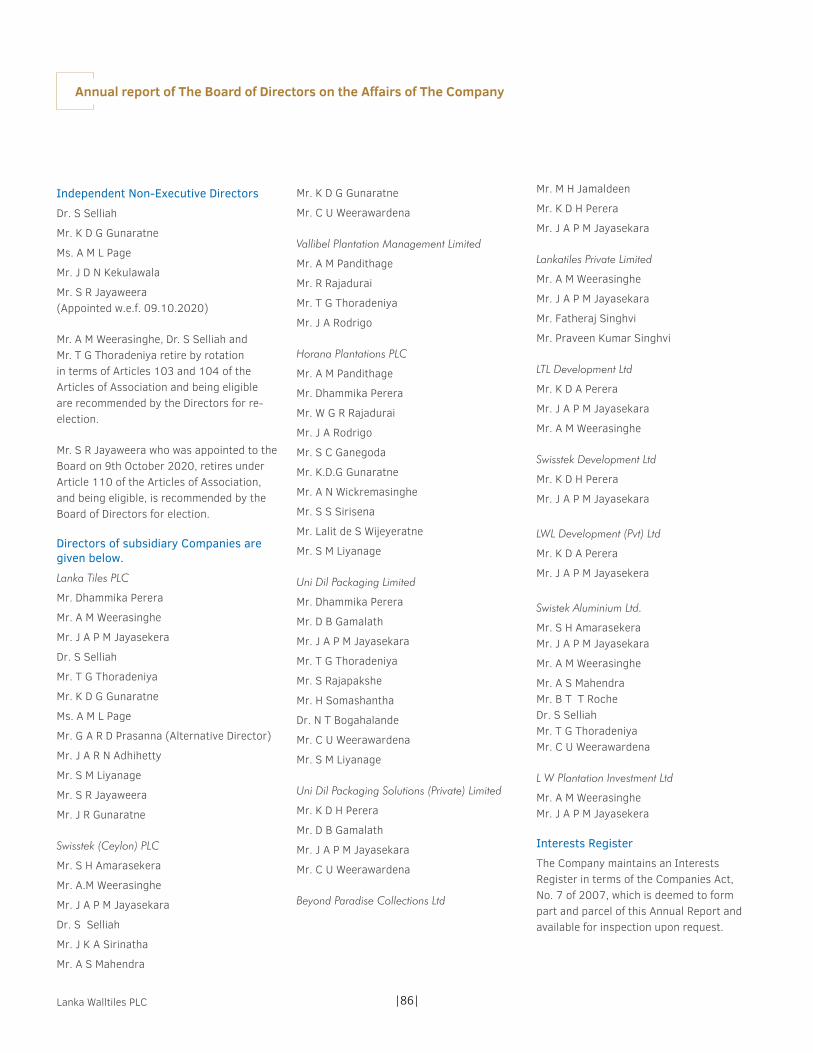
|86|Lanka Walltiles PLC
Independent Non-Executive Directors
Dr. S Selliah
Mr. K D G Gunaratne
Ms. A M L Page
Mr. J D N Kekulawala
Mr. S R Jayaweera (Appointed w.e.f. 09.10.2020)
Mr. A M Weerasinghe, Dr. S Selliah and Mr. T G Thoradeniya retire by rotation in terms of Articles 103 and 104 of the Articles of Association and being eligible are recommended by the Directors for re-election.
Mr. S R Jayaweera who was appointed to the Board on 9th October 2020, retires under Article 110 of the Articles of Association, and being eligible, is recommended by the Board of Directors for election.
Directors of subsidiary Companies are given below.
Lanka Tiles PLC
Mr. Dhammika Perera
Mr. A M Weerasinghe
Mr. J A P M Jayasekera
Dr. S Selliah
Mr. T G Thoradeniya
Mr. K D G Gunaratne
Ms. A M L Page
Mr. G A R D Prasanna (Alternative Director)
Mr. J A R N Adhihetty
Mr. S M Liyanage
Mr. S R Jayaweera
Mr. J R Gunaratne
Swisstek (Ceylon) PLC
Mr. S H Amarasekera
Mr. A.M Weerasinghe
Mr. J A P M Jayasekara
Dr. S Selliah
Mr. J K A Sirinatha
Mr. A S Mahendra
Mr. K D G Gunaratne
Mr. C U Weerawardena
Vallibel Plantation Management Limited
Mr. A M Pandithage
Mr. R Rajadurai
Mr. T G Thoradeniya
Mr. J A Rodrigo
Horana Plantations PLC
Mr. A M Pandithage
Mr. Dhammika Perera
Mr. W G R Rajadurai
Mr. J A Rodrigo
Mr. S C Ganegoda
Mr. K.D.G Gunaratne
Mr. A N Wickremasinghe
Mr. S S Sirisena
Mr. Lalit de S Wijeyeratne
Mr. S M Liyanage
Uni Dil Packaging Limited
Mr. Dhammika Perera
Mr. D B Gamalath
Mr. J A P M Jayasekara
Mr. T G Thoradeniya
Mr. S Rajapakshe
Mr. H Somashantha
Dr. N T Bogahalande
Mr. C U Weerawardena
Mr. S M Liyanage
Uni Dil Packaging Solutions (Private) Limited
Mr. K D H Perera
Mr. D B Gamalath
Mr. J A P M Jayasekara
Mr. C U Weerawardena
Beyond Paradise Collections Ltd
Mr. M H Jamaldeen
Mr. K D H Perera
Mr. J A P M Jayasekara
Lankatiles Private Limited
Mr. A M Weerasinghe
Mr. J A P M Jayasekara
Mr. Fatheraj Singhvi
Mr. Praveen Kumar Singhvi
LTL Development Ltd
Mr. K D A Perera
Mr. J A P M Jayasekara
Mr. A M Weerasinghe
Swisstek Development Ltd
Mr. K D H Perera
Mr. J A P M Jayasekara
LWL Development (Pvt) Ltd
Mr. K D A Perera
Mr. J A P M Jayasekera
Swistek Aluminium Ltd.
Mr. S H Amarasekera Mr. J A P M Jayasekara
Mr. A M Weerasinghe
Mr. A S Mahendra Mr. B T T Roche Dr. S Selliah Mr. T G Thoradeniya Mr. C U Weerawardena
L W Plantation Investment Ltd
Mr. A M Weerasinghe Mr. J A P M Jayasekera
Interests Register
The Company maintains an Interests Register in terms of the Companies Act, No. 7 of 2007, which is deemed to form part and parcel of this Annual Report and available for inspection upon request.
Annual report of The Board of Directors on the Affairs of The Company

|87| Annual Report 2020/21
All related party transactions which encompasses the transactions of Directors who were directly or indirectly interested in a contract or a related party transaction with the Company during the accounting period are recorded in the Interests Register in due compliance with the applicable rules and regulations of the relevant Regulatory Authorities.
The relevant interests of Directors in the shares of the Company as at 31st March 2021 as recorded in the Interests Register are given in this Report under Directors’ shareholding.
Directors’ Remuneration
The Directors’ remuneration is disclosed under key management personnel compensation in Note 30.2 to the Financial Statements on page 169.
Directors’ Interests in Contracts
The Directors have no direct or indirect interest in any other contract or proposed contract with the Company. Except for the transactions referred to in Note 30.2 to the Financial Statements, the Company did not carry out any transaction with any of the Directors.
The Company carried out transactions during the year in the ordinary course of its business at commercial rates with the following director related entities. as given in Note No 30.
Auditors
Messrs Ernst & Young, Chartered Accountants served as the Auditors during the year under review and also provided non audit/ consultancy services. They do not have any interest in the Company other than that of Auditor and provider of tax related services.
A total amount of Rs. 1.68 Mn .is payable by the Company to the Auditors for the year under review comprising Rs. 1.39 Mn as audit fees and Rs. 0,29 Mn for non-audit services.
The Auditors have expressed their willingness to continue in office. The Audit Committee at a meeting held on 17th May 2021 recommended that they be re-appointed as Auditors. A resolution to re-appoint the Auditors and to authorise the Directors to determine their remuneration will be proposed at the Annual General Meeting.
Independence of Auditors
Based on the declaration provided by Messrs Ernst & Young, Chartered Accountants and to the extent that the Directors are aware, the Auditors do not have any relationship with (other than that of the Auditor), or interest in, the Company, which in the opinion of the Board, may reasonably be considered to have a bearing on their independence within the meaning of the Code of Professional Conduct and Ethics issued by The Institute of Chartered Accountants of Sri Lanka as at the reporting date.
Stated Capital
The Stated Capital of the Company is Rs.787,765,736/-.
On 26th March 2021 the Shareholders approved the sub-division of every one (01) Ordinary Share held by a Shareholder in to five (05) Ordinary Shares thereby increasing the total number of issued shares of the Company from 54,600,000 to 273,000,000.
Directors’ Shareholding
The relevant interests of Directors in the shares of the Company as at 31st March 2021 and 31st March 2020 are as follows.
Shareholdingas at
Shareholdingas at
31/03/2021 31/03/2020
Mr. Dhammika Perera - -Mr. A M Weerasinghe - -Mr. J A P M Jayasekera 995 199Dr. S Selliah - -Mr. T G Thoradeniya - -Mr. K D G Gunaratne - -Ms. A M L Page - -Mr. M W R N Somaratne 55,000 11,000Mr. J D N Kekulawala - -Mr. S M Liyanage - -Mr. S R Jayaweera (Appointed w.e.f 09th October 2020)
- -

|88|Lanka Walltiles PLC
Shareholders There were 12,278 shareholders registered as at 31st March 2021 (11,330 shareholders as at 31st March 2021). The details of distribution are given on page 189 of this Report.
Major Shareholders, Distribution Schedule and other information
Information on the distribution of shareholding, analysis of shareholders, market values per share, earnings, dividends, net assets per share, twenty largest shareholders of the Company, percentage of shares held by the public as per the Listing Rules of the Colombo Stock Exchange are given on page 188 to 190 under Share Information.
Employment PolicyThe Company’s employment policy is totally non-discriminatory which respects individuals and provides carrier opportunities irrespective of the gender, race or religion.
As at 31st March 2021 - 537 persons were in employment (521 persons as at 31st March 2020).
Reserves
The reserves of the Company with the movements during the year are given in Note 13 to the Financial Statements on page 141.
Land holdings
The book value of property, plant and equipment as at the balance sheet date amounted to Rs. 4,603,885.
The extents, locations, valuations and the number of buildings of the Company’s land holdings are given below:
Location No. of Buildings Land in Extent Valuation31/03/2021 A R P Rs.000
Head Office 1 1 1 2.1 1,550,310Meepe Factory 29 25 1 37.2 1,916,307Total 30 26 2 39.3 3,446,617
The movement of fixed assets during the year is given in Note 3 to the financial statements.
Dividends
An interim dividend of Rs. 3.60 per share for the year ending 31st March 2021 was paid on 9th December 2020.
A second interim dividend of Rs. 10/- per share for the year ending 31st March 2021 was paid on 17th March 2021.
A third interim dividend of Rs. 3.10 per share for the year ended 31st March 2021 will be paid on 29th June 2021.
Substantial Shareholdings
The Company is controlled by Royal Ceramics Lanka PLC which holds 54.55% (2020 - 54.55%) of the issued share capital of the Company.
The ultimate parent Company is Vallibel One PLC.
Investments
Details of the Company’s quoted and unquoted investments as at 31st March 2021 are given in Notes 5 to the Financial Statements on pages 136 to 137.
Donations
The Company made donations amounting to Rs. 65,790/- in total, during the year under review. (2020 Rs. 885,185/-).
Risk Management
An ongoing process is in place to identify and manage the risks that are associated with the business and operations of the Company. The Directors review this process through the Audit Committee.
Specific steps taken by the Company in managing the risks are detailed in the section on Risk Management on pages 35.
Statutory Payments
The Directors confirm that to the best of their knowledge, all taxes, duties and levies payable by the Company, all contributions, levies and taxes payable on behalf of, and in respect of employees of the Company and all other known statutory dues as were due and payable by the Company as at the Balance Sheet date have been paid or, where relevant provided for, except for certain assessments where appeals have been lodged.
Contingent Liabilities
Except as disclosed in Note to the Financial Statements on page 170, there were no material Contingent Liabilities as at the Balance Sheet date.
Annual report of The Board of Directors on the Affairs of The Company

|89| Annual Report 2020/21
Events occurring after the Balance Sheet date
Except for the matters disclosed in Note 32 to the Financial Statements on page 171 there are no material events as at the date of the Auditor’s report which require adjustment to, or disclosure in the Financial Statements.
Corporate Governance
The Board of Directors confirm that the Company is compliant with section 7.10 of the Listing Rules of the CSE.
An Audit Committee, Remuneration Committee and Related Party Transaction Review Committee function as Board sub committees, with Directors who possess the requisite qualifications and experience. The composition of the said committees is as follows.
Audit Committee
Mr. J D N Kekulawala - Chairman
Dr. S Selliah
Mr. T G Thoradeniya
Remuneration Committee
Mr. S H Amarasekera - Chairman
Mr. R N Asirwatham
Mr. L N De S Wijeyeratne
Related Party Transactions Review Committee
Dr. S Selliah - Chairman
Mr. J D N Kekulawala
Mr. T G Thoradeniya
The Directors declare that the Company is in compliance with Rule 9 of the Listing Rules of the Colombo Stock Exchange pertaining to Related Party Transactions during the Financial Year ended 31st March 2021.
The Corporate Governance of the Company is reflected in its strong belief in protecting and enhancing stakeholder value in a sustainable manner, supported by a sound system of policies and practices. Prudent internal controls ensure professionalism, integrity and commitment of the Board of Directors, Management and employees.
The Corporate Governance Statement on pages 74 to 80 explains the measures adopted by the Company during the year.
Corporate Social Responsibility
The Company continued its Corporate Social Responsibility Programme, details of which are set out on page 56 of this Report.
Environmental Protection
After making adequate enquiries from the management, the Directors are satisfied that the Company operates in a manner that minimizes the detrimental effects on the environment and provides products and services that have a beneficial effect on the customers and the communities within which the Company operates.
Going Concern
In determining the basis of preparing the financial statements for the year ended 31st March 2021, based on available information, the management has assessed the existing and anticipated effects of COVID-19 on the Group Companies and the appropriateness of the use of the going concern basis.
Having presented the outlook for each industry group to the LWPLC Board and after due consideration of the range and likelihood of outcomes, the Directors are satisfied that the Company, its subsidiaries, associates have adequate resources to continue in operational existence for the foreseeable future and continue to adopt the going concern basis in preparing and presenting these financial statements.
Annual General Meeting
The Notice of the Forty Fourth (44th) Annual General Meeting appears on page 194.
This Annual Report is signed for and on behalf of the Board of Directors by
Dhammika Perera
Chairman
J A P M Jayasekera
Managing Director
P W Corporate Secretarial (Pvt) Ltd
Secretaries
31st May 2021
Colombo

|90|Lanka Walltiles PLC
The financial statements are prepared in compliance with the Sri Lanka Accounting Standards issued by the Institute of Chartered Accountants of Sri Lanka and the requirements of the Companies Act No. 7 of 2007 and any other applicable statues to the extent applicable to the Company. There are no departures from the prescribed accounting standards in their adoption. The accounting policies used in the preparation of the financial statements are appropriate and are consistently applied, except where otherwise stated in the notes accompanying the financial statements.
The Board of Directors and the management of your Company accept responsibility for the integrity and objectivity of these financial statements. The estimates and judgements relating to the financial statements were made on a prudent and reasonable basis, in order that the financial statements reflect in a true and fair manner, the form and substance of transactions, and reasonably present the Company’s state of affairs. To ensure this, the Company has taken proper and sufficient care in installing a system of internal control and accounting records, for safeguarding assets, and for preventing and detecting frauds as well as other irregularities, which is reviewed, evaluated and updated on an ongoing basis.
Our internal auditors have conducted periodic audits to provide reasonable assurance that the established policies and procedures of the Company were consistently followed. However, there are inherent limitations that should be
recognized in weighing the assurances provided by any system of internal controls and accounting.
The financial statements were audited by M/s. Ernst & Young, Chartered Accountants, the independent auditors. The independency of the external auditor has been assessed by the audit committee and the Board and have been determined as independent.
The Audit Committee of your Company meets periodically with the internal auditors and the external auditors to review the manner in which these auditors are performing their responsibilities, and to discuss auditing, internal control and financial reporting issues. To ensure complete independence, the external auditors and the internal auditors have full and free access to the members of the Audit Committee to discuss any matter of substance.
It is also declared and confirmed that the Company has complied with, and ensured compliance by the auditors, with the guidelines for the audit of Listed Companies.
It is also confirmed that the Company is compliant with the Code of Best Practice in Corporate Governance issued by the Institute of Chartered Accountants of Sri Lanka and the Code of Best Practice on Related Party Transactions, issued by the Securities and Exchange Commission of Sri Lanka.
J. A. P. M. Jayasekera
Managing Director
B. T. T. Roche
General Manager (Finance)
31st May 2021
Chief Executive Officer’s and Chief Financial Officer’s Responsibility Statement
|91| Annual Report 2020/21
The Directors are required by the Companies Act, No. 7 of 2007 to prepare financial statements for each financial year, which give a true and fair view of the statement of affairs of the Company as at the end of the financial year and the income and expenditure of the Company for the financial year.
The Directors are also responsible to ensure that the financial statements comply with any regulations made under the Companies Act which specifies the form and content of financial statements and any other requirements which apply to the Company’s financial statements under any other law.
The Directors consider that the financial statements presented in this Annual Report have been prepared using appropriate accounting policies, consistently applied and supported by reasonable and prudent judgments and estimates and in compliance with the Sri Lanka Accounting Standards, Companies Act, No. 7 of 2007, Sri Lanka Accounting and Auditing Standards Act No. 15 of 1995.
The Directors are responsible for ensuring that the Company keeps sufficient accounting records, which disclose the financial position of the Company with reasonable accuracy and enable them to ensure that the financial statements have been prepared and presented as aforesaid. They are also responsible for taking measures to safeguard the assets of the Company and in that context to have proper regard to the establishment of appropriate
systems of internal control with a view to prevention and detection of fraud and other irregularities.
The Directors continue to adopt the going concern basis in preparing the financial statements. The Directors, after making inquiries and review of the Company’s Business Plan for the financial year 2020/21, including cash flows and borrowing facilities, consider that the Company has adequate resources to continue in operation.
By Order of the Board
LANKA WALLTILES PLC
P W Corporate Secretarial (Pvt) Ltd
Secretaries
31st May 2021
Statement of Directors Responsibilities

|92|Lanka Walltiles PLC
Securing Value

|93| Annual Report 2020/21
Securing Value
FINANCIAL STATEMENTS
Independent Auditor’s Report 94Statement of Financial Position 97Statement of Profit or Loss and Other Comprehensive Income 98Statement of Changes in Equity 99Statement of Cash Flows 100Notes to the Financial Statements 101

|94|Lanka Walltiles PLC
Independent Auditor’s Report
Report on the audit of the Consolidated Financial Statements
Opinion
We have audited the financial statements of Lanka Walltiles PLC (“the Company”) and the consolidated financial statements of the Company and its subsidiaries (“the Group”), which comprise the statement of financial position as at 31 March 2021, and the statement of comprehensive income, statement of changes in equity and statement of cash flows for the year then ended, and notes to the financial statements, including a summary of significant accounting policies.
In our opinion, the accompanying financial statements of the Company and the Group give a true and fair view of the financial position of the Company and the Group as at 31 March 2021, and of their financial performance and cash flows for the year then ended in accordance with Sri Lanka Accounting Standards.
Basis for opinion
We conducted our audit in accordance with Sri Lanka Auditing Standards (SLAuSs). Our responsibilities under those standards are further described in the Auditor’s responsibilities for the audit of the financial statements section of our report. We are independent of the Group in accordance with the Code of Ethics issued by CA Sri Lanka (Code of Ethics) and we have fulfilled our other ethical responsibilities in accordance with the Code of Ethics. We believe that the audit evidence we have obtained is sufficient and appropriate to provide a basis for our opinion.
Key audit matters
Key audit matters are those matters that, in our professional judgement, were of most significance in our audit of the financial statements of the current period. These matters were addressed in the context of our audit of the financial statements as a whole, and in forming the auditor’s opinion thereon, and we do not provide a separate
opinion on these matters. For each matter below, our description of how our audit addressed the matter is provided in that context.
We have fulfilled the responsibilities described in the Auditor’s responsibilities for the audit of the financial statements section of our report, including in relation to these matters. Accordingly, our audit included the performance of procedures designed to respond to our assessment of the risks of material misstatement of the financial statements. The results of our audit procedures, including the procedures performed to address the matters below, provide the basis for our audit opinion on the accompanying financial statements.

|95| Annual Report 2020/21
Key Audit Matter How our audit addressed the key audit matterMeasurement of the carrying values of Land and Buildings
Included within Property, Plant and Equipment and Investment Property are Land and Buildings carried at fair value. As of reporting date, such land and buildings within Property, Plant and Equipment and Investment Property amounted to Rs. 8,816 Mn and Rs. 814 Mn respectively. The fair values of such land and buildings were determined using independent external valuers engaged by the Group.
Fair valuation of Land and Buildings was a key audit matter due to:
• the degree of significant assumptions, judgements and estimation uncertainties associated with such fair valuations which included consideration of the impacts of COVID-19. The fair valuation this year contains higher estimation uncertainties as there were fewer market transactions (as a consequence of the prevailing pandemic), which are ordinarily a strong source of evidence regarding fair value.
Key areas of significant assumptions, judgments, and estimates included the estimate of per perch value of land and per square foot value of buildings.
Our audit procedures included the following;
• We evaluated the competence, capability and objectivity of the external valuers engaged by the Group;
• We read the external valuers’ reports and understood the key assumptions, judgments and estimates made and the approach taken by the valuers in determining the valuation;
• We engaged our internal specialized resources to assist us in assessing the appropriateness of the valuation techniques used and the reasonableness of the significant assumptions, judgements and estimates such as per perch price of Land and per square foot value of Buildings used by the valuers;
• We discussed with the external valuers and those charged with governance, the external valuers’ assumptions, judgments and estimates used by the external valuers and compared the same with relevant published data; and
• We assessed the adequacy of the disclosures made in Notes 3.1 and 3.8 in the financial statements.
Other information included in the Group’s 2021 Annual ReportOther information consists of the information included in the Annual Report, other than the financial statements and our auditor’s report thereon. Management is responsible for the other information.
Our opinion on the financial statements does not cover the other information and we do not express any form of assurance conclusion thereon.
In connection with our audit of the financial statements, our responsibility is to read the other information and, in doing so, consider whether the other information is materially inconsistent with the financial statements or our knowledge obtained in the audit or otherwise appears to be materially misstated. If, based on the work we have performed, we conclude that there is a material misstatement of this other information, we are required to report that
fact. We have nothing to report in this regard
Responsibilities of management and those charged with governance for the financial statementsManagement is responsible for the preparation of financial statements that give a true and fair view in accordance with Sri Lanka Accounting Standards, and for such internal control as management determines is necessary to enable the preparation of financial statements that are free from material misstatement, whether due to fraud or error.
In preparing the financial statements, management is responsible for assessing the Group’s ability to continue as a going concern, disclosing, as applicable, matters related to going concern and using the going concern basis of accounting unless management either intends to liquidate the Group or to cease operations, or has no
realistic alternative but to do so.
Those charged with governance are responsible for overseeing the Company’s and the Group’s financial reporting process.
Auditor’s responsibilities for the audit of the financial statementsOur objectives are to obtain reasonable assurance about whether the financial statements as a whole are free from material misstatement, whether due to fraud or error, and to issue an auditor’s report that includes our opinion. Reasonable assurance is a high level of assurance, but is not a guarantee that an audit conducted in accordance with SLAuSs will always detect a material misstatement when it exists. Misstatements can arise from fraud or error and are considered material if, individually or in the aggregate, they could reasonably be expected to influence the economic decisions of users taken on the basis of these financial statements.
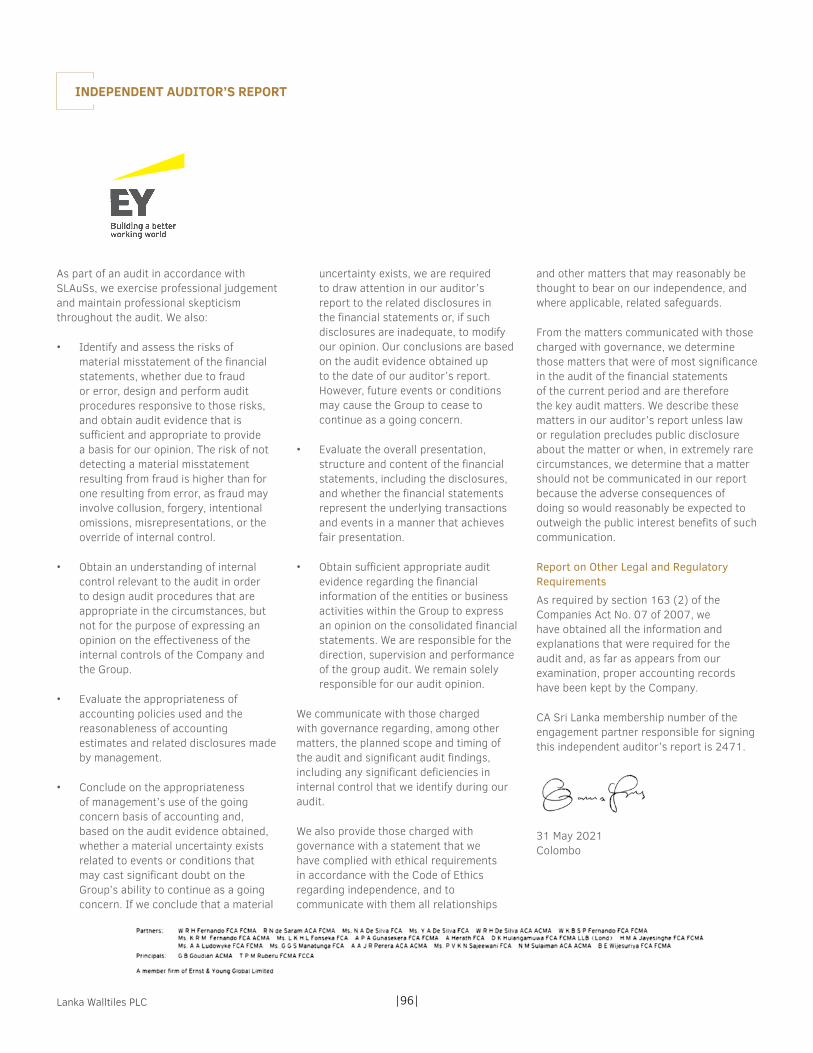
|96|Lanka Walltiles PLC
As part of an audit in accordance with SLAuSs, we exercise professional judgement and maintain professional skepticism throughout the audit. We also:
• Identify and assess the risks of material misstatement of the financial statements, whether due to fraud or error, design and perform audit procedures responsive to those risks, and obtain audit evidence that is sufficient and appropriate to provide a basis for our opinion. The risk of not detecting a material misstatement resulting from fraud is higher than for one resulting from error, as fraud may involve collusion, forgery, intentional omissions, misrepresentations, or the override of internal control.
• Obtain an understanding of internal control relevant to the audit in order to design audit procedures that are appropriate in the circumstances, but not for the purpose of expressing an opinion on the effectiveness of the internal controls of the Company and the Group.
• Evaluate the appropriateness of accounting policies used and the reasonableness of accounting estimates and related disclosures made by management.
• Conclude on the appropriateness of management’s use of the going concern basis of accounting and, based on the audit evidence obtained, whether a material uncertainty exists related to events or conditions that may cast significant doubt on the Group’s ability to continue as a going concern. If we conclude that a material
uncertainty exists, we are required to draw attention in our auditor’s report to the related disclosures in the financial statements or, if such disclosures are inadequate, to modify our opinion. Our conclusions are based on the audit evidence obtained up to the date of our auditor’s report. However, future events or conditions may cause the Group to cease to continue as a going concern.
• Evaluate the overall presentation, structure and content of the financial statements, including the disclosures, and whether the financial statements represent the underlying transactions and events in a manner that achieves fair presentation.
• Obtain sufficient appropriate audit evidence regarding the financial information of the entities or business activities within the Group to express an opinion on the consolidated financial statements. We are responsible for the direction, supervision and performance of the group audit. We remain solely responsible for our audit opinion.
We communicate with those charged with governance regarding, among other matters, the planned scope and timing of the audit and significant audit findings, including any significant deficiencies in internal control that we identify during our audit.
We also provide those charged with governance with a statement that we have complied with ethical requirements in accordance with the Code of Ethics regarding independence, and to communicate with them all relationships
and other matters that may reasonably be thought to bear on our independence, and where applicable, related safeguards.
From the matters communicated with those charged with governance, we determine those matters that were of most significance in the audit of the financial statements of the current period and are therefore the key audit matters. We describe these matters in our auditor’s report unless law or regulation precludes public disclosure about the matter or when, in extremely rare circumstances, we determine that a matter should not be communicated in our report because the adverse consequences of doing so would reasonably be expected to outweigh the public interest benefits of such communication.
Report on Other Legal and Regulatory RequirementsAs required by section 163 (2) of the Companies Act No. 07 of 2007, we have obtained all the information and explanations that were required for the audit and, as far as appears from our examination, proper accounting records have been kept by the Company.
CA Sri Lanka membership number of the engagement partner responsible for signing this independent auditor’s report is 2471.
31 May 2021Colombo
INDEPENDENT AUDITOR’S REPORT

|97| Annual Report 2020/21
Group CompanyAs at 31st March 2021 2020 2021 2020
Note Rs.'000 Rs.'000 Rs.'000 Rs.'000
ASSETSNon-current assetsProperty, plant and equipment 3.1 17,798,601 16,884,149 4,603,885 4,524,000 Consumable biological assets 3.1 630,578 632,177 - - Investment Properties 3.8 813,619 816,805 - - Intangible assets 4 35,814 37,113 - - Investments in subsidiaries 5 - - 1,276,096 1,276,096 Investments in associates 7 170,000 - - Long term receivables 6 - 27,285 - - Right of use assets 3.9 338,971 389,880 33,785 57,885
19,787,583 18,787,409 5,913,766 5,857,981
Current assets Inventories 8 6,484,986 10,226,419 1,410,768 2,762,580 Trade and other receivables 9 4,246,624 3,875,187 792,031 673,756 Contract Assets 18.3 40,164 38,079 - - Amounts due from related parties 10 63,324 48,450 70,690 64,981 Income tax receivable 49,231 30,336 - - Short term investments 11 3,877 3,754 3,877 3,754 Cash and cash equivalents 28 3,034,216 413,243 279,697 47,776
13,922,422 14,635,468 2,557,063 3,552,847 Total assets 33,710,005 33,422,877 8,470,829 9,410,828
EQUITY AND LIABILITIESEquity attributable to equity holders of the parentStated capital 12 787,765 787,765 787,765 787,765 Reserves 13 3,541,400 2,850,974 2,057,891 1,812,082 Retained earnings 10,242,050 7,982,331 3,645,057 2,770,701 Shareholders' funds 14,571,215 11,621,070 6,490,713 5,370,548
Non controlling interest 4,823,606 3,936,582 - - Total equity 19,394,821 15,557,652 6,490,713 5,370,548
Non-current liabilitiesInterest bearing liabilities 14 2,572,712 2,765,040 39,922 72,735 Deferred tax liabilities 15 1,879,638 2,421,476 623,783 967,884 Retirement benefit liability 16 1,071,475 975,933 173,041 142,902 Deferred income & Capital grants 17 118,995 122,832 - -
5,642,820 6,285,281 836,746 1,183,521
Current liabilitiesTrade and other payables 18 4,034,728 2,785,122 635,763 483,266 Contract liability 18.3 85,407 14,843 30,350 - Income tax liabilities 497,320 45,924 201,192 12,839 Amounts due to related parties 19 85,957 90,903 79,878 146,043 Current portion of interest bearing liabilities 14 3,968,952 8,643,152 196,187 2,214,611
8,672,364 11,579,944 1,143,370 2,856,759 Total equity and liabilities 33,710,005 33,422,877 8,470,829 9,410,828
I certify that, these Financial Statements are in compliance with the requirements of the Companies Act No.07 of 2007.
B T T RocheGeneral Manager (Finance)
The Board of Directors is responsible for these financial statements. Signed for and on behalf of the Board,
J A P M Jayasekera Dhammika Perera Managing Director ChairmanThe accounting policies and notes on pages 101 to 180 form an integral part of the financial statements.Figures in brackets indicate deductions.
31 May 2021Colombo
Statement of Financial Position

|98|Lanka Walltiles PLC
Group CompanyFor the Year ended 31 March 2021 2020 2021 2020
Note Rs.'000 Rs.'000 Rs.'000 Rs.'000
Revenue from contracts with customers 20 29,423,381 19,929,709 5,988,521 3,493,619 Cost of Sales (20,187,348) (15,144,779) (3,922,084) (2,537,014)Gross Profit 9,236,033 4,784,930 2,066,437 956,605 Other Income 21 231,906 165,489 823,986 36,823 Change in fair value of investment property 3.8 (3,186) - - - Distribution Costs (2,700,250) (1,921,242) (751,723) (528,567)Administrative Expenses (1,332,036) (1,055,957) (211,242) (185,660)Other Operating Expenses (100,951) - (40,989) - Finance Cost 22 (769,888) (1,171,381) (130,938) (220,077)Finance Income 23 20,814 1,837 - - Profit Before Tax 24 4,582,442 803,676 1,755,531 59,124 Income Tax Expense 25 (569,022) (389,027) (138,013) (21,099)Profit for the Year 4,013,420 414,649 1,617,518 38,026
Other Comprehensive Income Net Other Comprehensive Income not to be reclassified to profit or loss in subsequent periods (net of tax):Revaluation of Land and Building 3 706,394 - 49,811 - Acturial Gain/ (Loss) on Retirement Benefit Liability 16 (29,951) (35,285) (10,305) (9,970)Deferred tax on components of other comprehensive income 25 234,531 6,801 197,882 2,792 "Net Other Comprehensive Income/ (Loss) that will not be reclassified to profit or loss in subsequent periods" 910,974 (28,484) 237,388 (7,178)Net Other Comprehensive Income that may be reclassified to profit or loss in subsequent periods (net of tax):Foreign currency translation differences of foreign operations 618 (305) - - Net Other Comprehensive Income/ (Loss) that may be reclassified to profit or loss in subsequent periods 618 (305) - - Other Comprehensive Income/(Loss) for the Year, net of tax 911,592 (28,789) 237,388 (7,178)Total Comprehensive Income for the Year, net of tax 4,925,012 385,860 1,854,906 30,848
Profit attributable to :Equity holders of the parent 2,960,211 405,115 1,617,518 38,026 Non controlling interest 1,053,209 9,534 - - Profit for the year 4,013,420 414,649 1,617,518 38,026
Total comprehensive income attributable to :Equity holders of the parent 3,628,176 386,307 1,854,906 30,848 Non controlling interest 1,296,836 (447) - - Total Comprehensive Income for the Year 4,925,012 385,860 1,854,906 30,848
Adjusted Basic Earnings Per Share - Profit Attributable to Ordinary Equity Holders
26 10.84 1.48 5.92 0.14
The accounting policies and notes on pages 101 to 180 form an integral part of the financial statements.
Figures in brackets indicate deductions.
Statement of Profit or Loss ond Other Comprehensive Income

|99| Annual Report 2020/21
Stated capital
Revaluationreserve
Retained earnings
Total Non controlling
interest
Total
Rs.'000 Rs.’000 Rs.’000 Rs.’000 Rs.’000 Rs.’000
GROUPBalance as at 1st April 2019 787,765 2,850,974 7,602,815 11,241,554 3,943,553 15,185,107 Adjustments on initial application of SLFRS - 16 (6,791) (6,791) (6,524) (13,315)Profit for the Year - - 405,115 405,115 9,534 414,649 Other Comprehensive Income - - (18,808) (18,808) (9,981) (28,789) Total Comprehensive Income - - 386,307 386,307 (447) 385,860 Balance as at 1st April 2020 787,765 2,850,974 7,982,331 11,621,070 3,936,582 15,557,652 Profit for the Year - - 2,960,211 2,960,211 1,053,209 4,013,420 Other Comprehensive Income - 690,426 (22,461) 667,965 243,627 911,592 Total Comprehensive Income - 690,426 2,937,750 3,628,176 1,296,836 4,925,012 Write back of unclaimed dividends - - 9,487 9,487 1,603 11,090 Dividends - 1st Interim 2020/21 (Rs. 3.60 per share) - - (196,560) (196,560) - (196,560) 2nd Interim 2020/21 (Rs. 10.00 per share) - - (546,000) (546,000) - (546,000)
- - (742,560) (742,560) - (742,560)Dividends to non controlling interest 55,042 55,042 (411,415) (356,373)Balance as at 31 March 2021 787,765 3,541,400 10,242,050 14,571,215 4,823,606 19,394,821
Stated capital
Revaluationreserve
Retained earnings
Total
Rs.'000 Rs.’000 Rs.’000 Rs.’000
COMPANYBalance as at 01 April 2019 787,765 1,812,082 2,739,853 5,339,700 Profit for the Year - - 38,026 38,026
Other Comprehensive Income - - (7,178) (7,178)Total Comprehensive Income - - 30,848 30,848
Balance as at 1st April 2020 787,765 1,812,082 2,770,701 5,370,548 Profit for the Year - - 1,617,518 1,617,518
Other Comprehensive Income - 245,809 (8,421) 237,388 Total Comprehensive Income - 245,809 1,609,097 1,854,906 Write back of unclaimed dividends - - 7,819 7,819 Dividends
1st Interim 2020/21 (Rs. 3.60 per share) - - (196,560) (196,560)2nd Interim 2020/21 (Rs. 10.00 per share) - - (546,000) (546,000)
- - (742,560) (742,560)Balance as at 31 March 2021 787,765 2,057,891 3,645,057 6,490,713
The accounting policies and notes on pages 101 to 180 form an integral part of the financial statements.
Figures in brackets indicate deductions.
Statement of Changes in Equity

|100|Lanka Walltiles PLC
Group CompanyFor the Year ended 31 March 2021 2020 2021 2020
Note Rs.'000 Rs.'000 Rs.'000 Rs.'000
CASH FLOWS FROM OPERATING ACTIVITIESProfit before income tax 4,582,442 803,677 1,755,531 59,124 Depreciation & amortisation 24 1,010,341 960,034 184,107 182,010 Amortisation of right of use Lease Assets 3.9 93,354 66,250 24,100 19,967 Income from investments - - (747,572) - Profit/ (loss) on sale of property, plant & equipment 21 (7,668) 197 (763) 51 Finance income 23 (20,814) (1,837) - - Finance costs 22 769,888 1,171,381 130,938 220,077 Provision for retirement benefit obligations 16 177,947 167,210 26,551 23,113 Capital expenditure written off 43,145 14,878 - - Allowance/ (reversal) for obsolete and slow moving inventories 8 72,134 27,723 8,100 - Allowance for impairment of trade receivable 9 47,319 23,581 5,000 1,300 Deferred income / capital grants amortisation 17 (7,386) (6,800) - - Changing in fair value of biological assets (75) (39,824) - - Fair value in investment property 3.8 3,186 - - - Foreign exchange (gain)/ loss (17,960) (3,766) - - Write off/(Write back) of inventories 8 (21,542) 8,831 (5,368) 3,459 Operating profit/(loss) before working capital changes 6,724,311 3,191,535 1,380,624 509,101
Working capital adjustments:(Increase)/decrease in inventories 3,695,479 (1,946,054) 1,349,084 (541,432)(Increase)/decrease in trade and other receivables (420,842) (41,495) (123,275) 139,833 (Increase)/decrease in due from related parties (14,874) (11,434) (5,709) 7,775 Increase/(decrease) in due to related parties (4,946) (9,710) (66,164) (45,334)Increase /(decrease) in trade and other payables 1,317,232 (423,119) 182,846 (183,466)Increase/(decrease) in investments (123) (254) (123) (254)Cash generated from/(used in) operations 11,296,237 759,469 2,717,283 (113,777)
Interest received 20,814 1,837 - - Finance costs paid (753,037) (1,131,143) (130,938) (220,077)Retirement benefit plan costs paid 16 (113,724) (111,839) (6,717) (8,926)Income tax paid (406,035) (171,791) (95,882) (35,426)Net cash flows from/(used in) operating activities 10,044,255 (653,467) 2,483,746 (378,206)
CASH FLOWS FROM / (USED IN) INVESTING ACTIVITIES Acquisition of property, plant & equipment 3 (1,149,262) (1,054,219) (219,239) (184,394)Acquisition of Intangible asssets 4.2 (1,527) (13,673) - Acquisition of plantation assets 3 (123,101) (154,988) - - Investment in Associate 7 (170,000) - - - Proceeds from sale of property, plant & equipment 14,995 4,914 5,822 2,932 Dividend Income - - 747,572 - Net cash flows from/(used in) investing activities (1,428,895) (1,217,966) 534,155 (181,462)
CASH FLOWS FROM / (USED IN) FINANCING ACTIVITIES Interest bearing loans & borrowings obtained 14 14,048,935 12,825,892 1,871,175 2,449,348 Repayment of interest bearing borrowings 14 (16,848,633) (11,944,667) (3,138,018) (2,186,449)Repayment of Lease liability (66,543) (52,323) (23,508) (17,915)Dividends paid - on Ordinary Shares 25 (742,560) - (742,560) - Dividend paid to non controlling interest (356,373) - - - Dividend write back 11,090 - 7,819 - Capital grants received 17 3,550 3,904 - - Net cash flows from/(used in) financing activities (3,950,534) 832,806 (2,025,092) 244,984
Net increase/(decrease) in cash and cash equivalents 4,664,826 (1,038,626) 992,809 (314,683)Foreign exchange difference arising on translation of foreign operation 618 (305) - - Cash and cash equivalents at the beginning of the year 28 (2,394,967) (1,356,035) (769,298) (454,614)Cash and cash equivalents at the end of the year 28 2,270,477 (2,394,967) 223,511 (769,298)
The accounting policies and notes on pages 101 to 180 form an integral part of the financial statements.
Figures in brackets indicate deductions.
Statement of Cash Flows

|101| Annual Report 2020/21
Notes to the Financial Statements1. CORPORATE INFORMATION
1.1 General
Lanka Walltiles PLC (“Company”) is a limited liability company incorporated and domiciled in Sri Lanka and listed on the Colombo Stock Exchange. The registered office and the principal place of business of the Company is located at No. 215, Nawala Road, Narahenpita, Colombo 05.
1.2 Principal activities and nature of operations
During the year, the principal activities of the Company were the manufacture and sale of ceramic walltiles for export and local markets and holding investments.
The principal activities of the other Companies of the Group are disclosed in Note 5.2 to the Financial Statements.
1.3 Parent enterprise and ultimate parent enterprise
The Company’s parent entity is Royal Ceramics Lanka PLC. In the opinion of the Directors, the Company’s ultimate parent undertaking and controlling party is Vallibel One PLC, which is incorporated in Sri Lanka.
The Group’s ultimate controlling party is Mr. K.D.D. Perera.
1.4 Date of authorization for issue
The Financial Statement of Lanka Walltiles PLC and its Subsidiaries for year ended 31 March 2021 was authorized for issue in accordance with a resolution of the Board of Directors.
2. SUMMARY OF SIGNIFICANT ACCOUNTING POLICIES
2.1 Basis of Preparation
The financial statements of the Company and the Group have been prepared in accordance with Sri Lanka Accounting Standards comprising SLFRS and LKAS (hereafter “SLFRS”) as issued by the Institute of Chartered Accountants of Sri Lanka.
2.1.1 Basis of measurement
The financial statements of the Company and the Group have been prepared on a historical cost basis, other than for following assets measured at fair value;
1. Property, Plant and Equipment – Land and Buildings
2. Biological assets (fair value less cost to sell)
3. Investment properties
The financial statements are presented in Sri Lankan Rupees (Rs), except when otherwise indicated.
2.1.2 Statement of Compliance
The financial statements of the Company and consolidated financial statements of the Group have been prepared in accordance with Sri Lanka Accounting Standards (“SLFRS”) as issued by Institute of Chartered Accountants of Sri Lanka.
The preparation and presentation of these financial statements is in compliance with the requirements of the Companies Act No.07 of 2007.
2.1.3 Going concern
When preparing financial statements, management has made assessments of the ability of the constituents of the Group
to continue as going concern, taking into account all available information about the future, including intentions of curtailment of business, as decided by Board.
The Board is confident that the Group has the resources and capability to withstand the negative effects and uncertainties created by the Covid-19 Pandemic. The Group Management is closely monitoring and taking the necessary steps to manage and minimize the potential downside risks to the operation due to the COVID – 19 pandemic
2.1.4 Changes in accounting policies and disclosure
New and amended standards and interpretations
The Group applied for the first time, certain standards and amendments, which are effective for annual periods beginning on or after 1 April 2020.
The Group has not early adopted any other standard, interpretation or amendment that has been issued but is not yet effective.
a) Amendments to SLFRS 3: Definition of a Business
The amendment to SLFRS 3 Business Combinations clarifies that to be considered a business, an integrated set of activities and assets must include, at a minimum, an input and a substantive process that, together, significantly contribute to the ability to create output. Furthermore, it clarifies that a business can exist without including all of the inputs and processes needed to create outputs. These amendments had no impact on the financial statements of the Group but may impact future

|102|Lanka Walltiles PLC
periods should the Company enter into any business combinations.
b) Amendments to LKAS 1 and LKAS 8 Definition of Material
The amendments provide a new definition of material that states, “information is material if omitting, misstating or obscuring it could reasonably be expected to influence decisions that the primary users of general purpose financial statements make on the basis of those financial statements, which provide financial information about a specific reporting entity.” The amendments clarify that materiality will depend on the nature or magnitude of information, either individually or in combination with other information, in the context of the financial statements. A misstatement of information is material if it could reasonably be expected to influence decisions made by the primary users.
These amendments had no impact on the financial statements of, nor is there expected to be any future impact to, the Group.
c) Amendments to references to the conceptual framework in SLFRS standards
Revisions to the Conceptual Framework were made because some important issues were not covered and some guidance was unclear or out of date. The revised Conceptual Framework includes: a new chapter on measurement; guidance on reporting financial performance; improved definitions of an asset and a liability, and guidance supporting these definitions; and clarifications in important areas, such as the roles of stewardship,
prudence and measurement uncertainty in financial reporting.
These amendments had no impact on the financial statements of the Group.
2.1.5 Comparative information
The accounting policies have been consistently applied by the Company and they are consistent with those used in the previous years. Previous year’s figures and phrases have been re-arranged whenever necessary to conform to current presentation.
2.1.6 Basis of Consolidation
The consolidated financial statements comprise the financial statements of the Company and its subsidiaries as at 31 March 2021.
Subsidiaries and equity accounted investees are disclosed in Note 05 to the Financial Statements.
2.1.6.1 Subsidiaries
Subsidiaries are those entities controlled by the Group. Control is achieved when the Group is exposed, or has rights, to variable returns from its involvement with the investee and has the ability to affect those returns through its power over the investee. Specifically, the Group controls an investee if, and only if, the Group has:
1. Power over the investee (i.e., existing rights that give it the current ability to direct the relevant activities of the investee)
2. Exposure, or rights, to variable returns from its involvement with the investee
3. The ability to use its power over the investee to affect its returns
Generally, there is a presumption that a majority of voting rights result in control. To support this presumption and when the Group has less than a majority of the voting or similar rights of an investee, the Group considers all relevant facts and circumstances in assessing whether it has power over an investee, including:
1. The contractual arrangement with the other vote holders of the investee
2. Rights arising from other contractual arrangements
3. The Group’s voting rights and potential voting rights
The Group re-assesses whether or not it controls an investee if facts and circumstances indicate that there are changes to one or more of the three elements of control. Consolidation of a subsidiary begins when the Group obtains control over the subsidiary and ceases when the Group loses control of the subsidiary. Assets, liabilities, income and expenses of a subsidiary acquired or disposed of during the year are included in the consolidated financial statements from the date the Group gains control until the date the Group ceases to control the subsidiary.
Profit or loss and each component of other comprehensive income (OCI) are attributed to the equity holders of the parent of the Group and to the non-controlling interests, even if this results in the non-controlling interests having a deficit balance. When necessary, adjustments are made to the financial statements
NOTES TO THE FINANCIAL STATEMENTS

|103| Annual Report 2020/21
of subsidiaries to bring their accounting policies into line with the Group’s accounting policies. All intra-group assets and liabilities, equity, income, expenses and cash flows relating to transactions between members of the Group are eliminated in full on consolidation.
A change in the ownership interest of a subsidiary, without a loss of control, is accounted for as an equity transaction.
If the Group loses control over a subsidiary, it derecognises the related assets (including goodwill), liabilities, non-controlling interest and other components of equity while any resultant gain or loss is recognised in profit or loss. Any investment retained is recognised at fair value.
Companies in the Group, the Group holdings in its subsidiary are given in Note 5.2 to the financial statements.
2.1.6.2 Equity accounted investees (Investment in associates)
The Group’s investment in its associate is accounted for using the equity method. An associate is an entity in which the Group has significant influence. Under the equity method, the investment in the associate is carried in the Statement of Financial Position at cost plus post acquisition changes in the Group’s share of net assets of the associate. Goodwill relating to the associate is included in the carrying amount of the investment and is neither amortised nor individually tested for impairment. The Statement of Profit or Loss of income reflects the share of the results of operations of the
associate. Where there has been a change recognised directly in the equity of the associate, the Group recognises its share of any changes and discloses this, when applicable, in the Statement of Changes in Equity. Unrealised gains and losses resulting from transactions between the Group and the associate are eliminated to the extent of the interest in the associate.
The share of profit of an associate is shown on the face of the Statement of Profit or Loss. This is the profit attributable to equity holders of the associate and therefore is profit after tax and non-controlling interests in the subsidiaries of the associate. The Financial Statements of the associate are prepared for the same reporting period as the Group.
After application of the equity method, the Group determines whether it is necessary to recognise an additional impairment loss on the Group’s investment in its associate. The Group determines at each reporting date whether there is any objective evidence that the investment in the associate is impaired. If this is the case, the Group calculates the amount of impairment as the difference between the recoverable amount of the associate and its carrying value and recognises the amount in the ‘share of profit of an associate’ in the Statement of Profit or Loss. The investment in associate is accounted for using the cost method in the separate financial statements.
2.1.7 Goodwill
Business combinations are accounted for using the acquisition method. The cost of an acquisition is measured as the aggregate of the
consideration transferred measured at acquisition date fair value and the amount of any non-controlling interests in the acquiree. For each business combination, the Group elects whether to measure the non-controlling interests in the acquiree at fair value or at the proportionate share of the acquiree’s identifiable net assets. Acquisition-related costs are expensed as incurred and included in administrative expenses.
Goodwill is initially measured at cost, being the excess of the aggregate of the consideration transferred and the amount recognised for non-controlling interests, and any previous interest held, over the net identifiable assets acquired and liabilities assumed. If the fair value of the net assets acquired is in excess of the aggregate consideration transferred, the Group re-assesses whether it has correctly identified all of the assets acquired and all of the liabilities assumed and reviews the procedures used to measure the amounts to be recognised at the acquisition date. If the reassessment still results in an excess of the fair value of net assets acquired over the aggregate consideration transferred, then the gain is recognised in profit or loss.
After initial recognition, goodwill is measured at cost less any accumulated impairment losses. For the purpose of impairment testing, goodwill acquired in a business combination is, from the acquisition date, allocated to each of the Group’s cash-generating units that are expected to benefit from the combination, irrespective of whether other assets or liabilities of the acquiree are assigned to those units.

|104|Lanka Walltiles PLC
2.2 SIGNIFICANT ACCOUNTING JUDGMENTS, ESTIMATES AND ASSUMPTIONS
2.2.1 Judgements
In the process of applying the Group accounting policies, management has made the following judgements, apart from those involving estimations, which has the most significant effect on the amounts recognized in the financial statements.
a) Useful life-time of the Property, Plant and equipment
The Group reviews the useful lives and methods of depreciation of assets at each reporting date. Judgement of the management is exercised in the estimation of these values, rates, methods and hence they are subject to uncertainty (Note 3)
2.2.2 Estimates and Assumptions
The key assumptions concerning the future and other key sources of estimation uncertainty at the reporting date, that have a significant risk of causing a material adjustment to the carrying amounts of assets and liabilities within the next financial year are discussed below. The respective carrying amounts of assets and liabilities are given in related notes to the financial statements.
a) Defined benefit plans
The cost of defined benefit plan- gratuity is determined using actuarial valuations. The actuarial valuation involves making assumptions about discount rates, future salary increases, mortality rates and future pension increases. Due to the long term nature of these plans, such estimates are
subject to significant uncertainty. Retirement benefit liability of the Group is disclosed in Note 16 for the assumptions used and the sensitivity thereon.
b) Provision for Slow moving inventories
A provision for slow moving inventories is recognized based on the best estimates available to management on their future usability/sale. As management uses historical information as the basis to determine the future usability and recoverability, actual future losses on inventories could vary from the provision made in these financial statements (Note 8).
c) Fair value of Freehold Land and Buildings and Land classified as Investment properties
The Group measures freehold land and buildings as well as Land classified as Investment properties at fair value with changes in fair value being recognized in other comprehensive income and statement of profit and loss respectively. Land and buildings were valued by reference to market-based evidence, using comparable prices adjusted for specific market factors such as nature, location and condition of the property.
Fair value related disclosures for assets measured at fair value are summarized in the Note 3.4 and 3.8 to the financial statements.
d) Impairment of debtors
The Group uses a provision matrix to calculate ECLs for trade receivables and contract assets. The provision rates are based on days past due for groupings of various customer segments that have similar loss
patterns (i.e., by geography, product type, customer type and rating, and coverage by letters of credit and other forms of credit insurance). The provision matrix is initially based on the Group’s historical observed default rates. The Group will calibrate the matrix to adjust the historical credit loss experience with forward-looking information. For instance, if forecast economic conditions (i.e., gross domestic product) are expected to deteriorate over the next year which can lead to an increased number of defaults in the manufacturing sector, the historical default rates are adjusted. At every reporting date, the historical observed default rates are updated and changes in the forward-looking estimates are analysed.
The assessment of the correlation between historical observed default rates, forecast economic conditions and ECLs is a significant estimate. The amount of ECLs is sensitive to changes in circumstances and of forecast economic conditions. The Group’s historical credit loss experience and forecast of economic conditions may also not be representative of customer’s actual default in the future. (Note 9.2)
e) Deferred tax assets
Deferred tax assets are recognised in respect of tax losses to the extent it is probable that future taxable profits will be available against which such tax losses can be set off. Judgment is required to determine the amount of deferred tax assets that can be recognised, based on the likely timing and level of future taxable profits, together with the future tax-planning strategies.
NOTES TO THE FINANCIAL STATEMENTS

|105| Annual Report 2020/21
f) Impairment of Non Financial Assets
The Group assesses whether there are any indicators of impairment for all non-financial assets at each reporting date. Non-financial assets are tested for impairment when there are indicators that the carrying amounts may not be recoverable. When values in use calculations are undertaken, management must estimate the expected future cash flows from the assets or cash generating unit and choose a suitable discount rate in order to calculate the present value of those cash flows.
g) Fair Valuation of Biological Assets
The fair value of managed timber determined based on discounted cash flow method using various financial and non-financial assumptions. The growth of the trees is determined by various biological features that are highly unpredictable. Any change to the assumptions will impact the fair value of biological assets. Key assumptions and sensitivity analysis of the biological assets are given in the note 3.1 (f) and 2.4.2 (b).
2.3 SUMMARY OF SIGNIFICANT ACCOUNTING POLICIES
2.3.1 Foreign currency translation
The financial statements are presented in Sri Lanka Rupees, which is the Group’s functional and presentation currency. Transactions in foreign currencies are initially recorded at the functional currency rate ruling at the date of the transaction. Monetary assets and liabilities denominated in foreign currencies are retranslated at the functional currency rate of exchange
ruling at the reporting date. All differences are taken to profit or loss. Non monetary items that are measured in terms of historical cost in a foreign currency are translated using the exchange rates as at the dates of the initial transactions. Non monetary items measured at fair value in a foreign currency are translated using the exchange rates at the date when the fair value was determined.
2.3.2 Fair Value Measurement
Fair value related disclosures for assets measured at fair value or financial instruments that are not measured at fair value, for which fair values are disclosed, are summarized in the Note 3.1(g) and 13.1 to the financial statements.
The fair value of an asset or a liability is measured using the assumptions that market participants would use when pricing the asset or liability, assuming that market participants act in their economic best interest.
The Group uses valuation techniques that are appropriate in the circumstances and for which sufficient data are available to measure fair value, maximising the use of relevant observable inputs and minimising the use of unobservable inputs.
All assets and liabilities for which fair value is measured or disclosed in the Financial Statements are categorised within the fair value hierarchy, described as follows,
Level 1 - Quoted (unadjusted) market prices in active markets for
identical assets or liabilities
Level 2 - Valuation techniques for which the lowest level input that is significant to the fair value measurement is directly or indirectly observable
Level 3 - Valuation techniques for which the lowest level input that is significant to the fair value measurement is unobservable
For assets and liabilities that are recognised in the Financial Statements on a recurring basis, the Group determines whether transfers have occurred between levels in the hierarchy by re-assessing categorisation (based on the lowest level input that is significant to the fair value measurement as a whole) at the end of each reporting period.
The management determines the policies and procedures for both recurring fair value measurement and for non- recurring measurement.
For the purpose of fair value disclosures, the Group has determined classes of assets and liabilities on the basis of the nature, characteristics and risks of the asset or liability and the level of the fair value hierarchy as explained above.
2.3.3 Taxation
Current taxes
Current income tax assets and liabilities for the current and prior periods are measured at the amount expected to be recovered from or paid to the taxation authorities. The tax rates and tax laws used to compute the amount is those that are enacted or substantively enacted by the reporting date.

|106|Lanka Walltiles PLC
The provision for income tax is based on the elements of income and expenditure as reported in the financial statements and computed in accordance with the provisions of the relevant tax legislations. Current income tax relating to items recognised directly in equity statement is recognised in equity and not in the statement of comprehensive income.
Deferred taxation
Deferred income tax is provided, using the liability method, on temporary differences at the reporting date between the tax bases of assets and liabilities and their carrying amounts for financial reporting purposes.
Deferred income tax liabilities are recognised for all taxable temporary differences except where the deferred income tax liability arises from the initial recognition of an asset or liability in a transaction that is not a business combination and, at the time of the transaction, affects neither the accounting profit nor taxable profit or loss.
Deferred income tax assets are recognised for all deductible temporary differences, carry-forward of unused tax assets and unused tax losses, to the extent that it is probable that taxable profit will be available against which the deductible temporary differences, and the carry-forward of unused tax assets and unused tax losses can be utilised except where the deferred income tax asset relating to the deductible temporary difference arises from the initial recognition of an asset or liability in a transaction that is not a business combination
and, at the time of the transaction, affects neither the accounting profit nor taxable profit or loss; and the carrying amount of deferred income tax assets is reviewed at each reporting date and reduced to the extent that it is no longer probable that sufficient taxable profit will be available to allow all or part of the deferred income tax asset to be utilised.
Deferred income tax assets and liabilities are measured at the tax rates that are expected to apply to the year when the asset is realised or the liability is settled, based on tax rates (and tax laws) that have been enacted or substantively enacted at the reporting date.
Deferred income tax relating to items recognised directly in equity statement is recognized in equity statement and not in the statement of total comprehensive income.
Sales tax
Revenue, expenses and assets are recognised net of the amount of sales tax except where the sales tax incurred on a purchase of assets or services is not recoverable from the taxation authorities in which case the sales tax is recognized as a part of the cost of the asset or part of the expense items as applicable and receivable and payable are stated with the amount of sales tax included. The amount of sales tax recoverable and payable in respect of taxation authorities is included as a part of other receivables and other payables in the Statement of Financial Position.
2.3.4 Borrowing costs
Borrowing costs are recognised as an expense in the period in which they are incurred, except to the extent where borrowing costs that are directly attributable to the acquisition, construction, or production of an asset that takes a substantial period of time to get ready for its intended use or sale, are capitalised as part of that asset.
Borrowing costs that are not directly attributable to the acquisition, construction or production of a qualifying asset are recognized in statement of comprehensive income using the effective interest method.
The amounts of borrowing costs which are eligible for capitalisation are determined in accordance with LKAS 23 – “Borrowing Costs”.
Borrowing cost incurred in respect of specific loans that are utilised for the field development activities have been capitalised as part of the cost of relevant immature plantation. The capitalisation will ceased when crops are ready for commercial harvest.
2.3.5 Inventories
Inventories are valued at the lower of cost and net realizable value, after making due allowances for obsolete and slow moving items. Net realizable value is the price at which inventories can be sold in the ordinary course of business less the estimated cost of completion and the estimated cost necessary to make the sale.
The cost incurred in bringing inventories to its present location and condition is accounted using the following cost formula.
NOTES TO THE FINANCIAL STATEMENTS

|107| Annual Report 2020/21
Manufacturing goods
At the cost of direct materials, direct labour and an appropriate proportion of fixed production overheads based on normal operating capacity, but excluding borrowing cost.
work-in-progress
At actual cost
Trading goods
At purchase cost on first in first out basis
Consumable and spares
At actual cost on weighted average basis
Raw materials
At purchase cost on weighted average cost basis, except for Vallibel Plantation Management Limited, Swisstek Aluminium Limited and Swisstek (Ceylon) PLC which is on a first in first out basis.
Goods in transit
At actual cost
Harvest Crops – Refer note 2.4.4
2.3.6 Financial Instruments
Financial Assets
Initial Recognition and Measurement
Financial assets within the scope of SLFRS 9, are classified, at initial recognition, as subsequently measured at amortised cost, fair value through other comprehensive income (OCI), and fair value through profit or loss.
In order for a financial asset to be classified and measured at amortised cost or fair value through OCI, it needs to give rise to cash flows that are ‘solely payments of
principal and interest (SPPI)’ on the principal amount outstanding. This assessment is referred to as the SPPI test and is performed at an instrument level.
The Group’s business model for managing financial assets refers to how it manages its financial assets in order to generate cash flows. The business model determines whether cash flows will result from collecting contractual cash flows, selling the financial assets, or both.
The classification of financial assets at initial recognition depends on the financial asset’s contractual cash flow characteristics and the Group’s business model for managing them. With the exception of trade receivables that do not contain a significant financing component or for which the Group has applied the practical expedient, the Group initially measures a financial asset at its fair value plus, in the case of a financial asset not at fair value through profit or loss, transaction costs.
Subsequent Measurement
The Group classifies all financial assets in the measurement category of financial assets at amortised cost.
a) Financial assets at amortised cost
This category is the most relevant to the Group. The Group measures financial assets at amortised cost if both of the following conditions are met:
• The financial asset is held within a business model with the objective to hold financial assets in order to collect
contractual cash flows and The contractual terms of the financial asset give rise on specified dates to cash flows that are solely payments of principal and interest on the principal amount outstanding
Financial assets at amortised cost are subsequently measured using the effective interest (EIR) method and are subject to impairment. Gains and losses are recognised in profit or loss when the asset is derecognised, modified or impaired.
The Group’s financial assets at amortised cost includes trade and other receivables, amounts due from related parties, short term investments, long term receivables and cash and cash equivalents.
Derecognition
A financial asset (or, where applicable a part of a financial asset or part of a Group of similar financial assets) is derecognised when:
• The rights to receive cash flows from the asset have expired
• The Group has transferred its rights to receive cash flows from the asset or has assumed an obligation to pay the received cash flows in full.
Impairment of Financial Assets
The Group recognises an allowance for expected credit losses (ECLs) for all debt instruments not held at fair value through profit or loss. ECLs are based on the difference between the contractual cash flows due in accordance with the contract and all the cash flows that the Group expects to receive, discounted at an approximation of the original effective interest rate. The expected

|108|Lanka Walltiles PLC
cash flows will include cash flows from the sale of collateral held or other credit enhancements that are integral to the contractual terms.
ECLs are recognised in two stages. For credit exposures for which there has not been a significant increase in credit risk since initial recognition, ECLs are provided for credit losses that result from default events that are possible within the next 12-months (a 12-month ECL). For those credit exposures for which there has been a significant increase in credit risk since initial recognition, a loss allowance is required for credit losses expected over the remaining life of the exposure, irrespective of the timing of the default (a lifetime ECL).
For trade receivables and contract assets, the Company applies a simplified approach in calculating ECLs. Therefore, the Company does not track changes in credit risk, but instead recognises a loss allowance based on lifetime ECLs at each reporting date. The Company has established a provision matrix that is based on its historical credit loss experience, adjusted for forward-looking factors specific to the debtors and the economic environment.
Financial Liabilities
Initial Recognition and Measurement
Financial liabilities within the scope of SLFRS 9 are classified as financial liabilities at fair value through profit or loss, loans and borrowings, payables or as derivatives designated as hedging instruments in an effective hedge, as appropriate. The Group determines
the classification of its financial liabilities at initial recognition.
All financial liabilities are recognised initially at fair value and, in the case of loans and borrowings, carried at amortised cost. This includes directly attributable transaction costs.
The Group’s financial liabilities include trade and other payables, bank overdrafts and loans and borrowings.
Accordingly Group financial liabilities have been classified as and loans and borrowings.
Subsequent Measurement
The measurement of financial liabilities depends on their classification as follows:
a) Loans and Borrowings
After initial recognition, interest bearing loans and borrowings are subsequently measured at amortised cost using the effective interest rate method. Gains and losses are recognised in the statement of comprehensive income when the liabilities are derecognised as well as through the effective interest rate method (EIR) amortisation process.
Amortised cost is calculated by taking into account any discount or premium on acquisition and fees or costs those are an integral part of the EIR. The EIR amortisation is included in finance costs in the statement of comprehensive income.
Derecognition
A financial liability is derecognised when the obligation under the liability is discharged or cancelled or expires.
2.3.7 Property, plant and equipment
Property, plant and equipment is stated at cost or valuation, excluding the costs of day to day servicing, less accumulated depreciation and accumulated impairment in value. Such cost includes the cost of replacing part of the plant and equipment when that cost is incurred, if the recognition criteria are met. When each major inspection is performed, its cost is recognised in the carrying amount of the plant and equipment as a replacement if the recognition criteria are satisfied.
An item of property, plant and equipment is derecognised upon disposal or when no future economic benefits are expected from its use or disposal. Any gain or loss arising on de-recognition of the asset (calculated as the difference between the net disposal proceeds and the carrying amount of the asset) is included in the income statement in the year the asset is derecognised.
Depreciation is calculated on a straight line basis over the useful life of the assets. The asset’s residual values, useful lives and methods of depreciation are reviewed, and adjusted if appropriate, at each financial year end.
Capital expenditure incurred in relation to fixed assets which are not completed as at the reporting date are shown as capital work-in-progress and is stated at cost. On
NOTES TO THE FINANCIAL STATEMENTS

|109| Annual Report 2020/21
completion, the related assets are transferred to property, plant and equipment. Depreciation on capital work-in-progress commences when the assets are ready for their intended use.
Free hold land and building are subsequently measured at fair value.
Valuations are performed every 3-5 years (or frequently enough) to ensure that the fair value of a revalued asset does not differ materially from its carrying amount.
A revaluation surplus is recognised in other comprehensive income and credited to the revaluation surplus in equity. However, to the extent that it reverses a revaluation deficit of the same asset previously recognised in the income statement, in which case the increase is recognised in the income statement. A revaluation deficit is recognised in profit or loss, except to the extent that it offsets an existing surplus on the same asset recognised in the asset revaluation reserve. Upon disposal, any revaluation reserve relating to the particular asset being sold is transferred to retained earnings.
2.3.8 Leases
The Group assesses at contract inception whether a contract is, or contains, a lease. That is, if the contract conveys the right to control the use of an identified asset for a period of time in exchange for consideration. To assess whether a contract conveys the right to control the use of an identified asset, the Group considered whether;
• The contract involves the use of an identified asset. This may be specified explicitly or implicitly
and should be physically distinct or represent substantially all of the capacity of a physically distinct asset. If the supplier has a substantive substation right, then the asset in not identified.
• The Group has right to obtain substantially all of the economic benefits of asset throughout the period of use; and
• The Group has right to direct the use of the asset. The Group has this right when it has decision-making rights that are most relevant to changing how and for what purpose the asset is used. In rare cases where the decision about how and for what purpose the asset is used is predetermined, the Group has the right to direct the use of the asset if either;
I. The Group has right to operate the asset ; or
II. The Group designated the asset in a way that predetermines how and for what purpose it will be used
a) Group as the Lessor
Leases in which the Group does not transfer substantially all the risks and rewards of ownership of an asset is classified as operating leases. Initial direct costs incurred in negotiating and arranging an operating lease added to the carrying amount of the leased asset and recognised over the lease term on the same basis rental income. Contingent rents are recognised as revenue in the period in which they are earned.
a) Group as the Lessee
The Group applies a single recognition and measurement
approach for all leases, except for short-term leases and leases of low-value assets. The Company recognises lease liabilities to make lease payments and right-of-use assets representing the right to use the underlying assets.
(i) Right-of-use assets
The Company recognises right-of-use assets at the commencement date of the lease (i.e., the date the underlying asset is available for use). Right-of-use assets are measured at cost, less any accumulated depreciation and impairment losses, and adjusted for any remeasurement of lease liabilities. The cost of right-of-use assets includes the amount of lease liabilities recognised, initial direct costs incurred, and lease payments made at or before the commencement date less any lease incentives received. The right-of-use assets are subsequently depreciated using the straight-line method from the commencement date to the lease term. The estimated useful lives of right-of-use assets are determined on the same basis as those of property, plant and equipment and are in the range of 2 to 30 years.
If ownership of the leased asset transfers to the Group at the end of the lease term or the cost reflects the exercise of a purchase option, depreciation is calculated using the estimated useful life of the asset. The right-of-use assets are also subject to impairment. Refer to the accounting policies in section 2.3.12- Impairment of non-financial assets.

|110|Lanka Walltiles PLC
(ii) Lease liabilities
At the commencement date of the lease, the Group recognises lease liabilities measured at the present value of lease payments to be made over the lease term. The lease payments include fixed payments (including in-substance fixed payments) less any lease incentives receivable, variable lease payments that depend on an index or a rate, and amounts expected to be paid under residual value guarantees. The lease payments also include the exercise price of a purchase option reasonably certain to be exercised by the Group and payments of penalties for terminating the lease, if the lease term reflects the Group exercising the option to terminate. Variable lease payments that do not depend on an index or a rate are recognised as expenses (unless they are incurred to produce inventories) in the period in which the event or condition that triggers the payment occurs.
In calculating the present value of lease payments, the Group uses its incremental borrowing rate at the lease commencement date because the interest rate implicit in the lease is not readily determinable. After the commencement date, the amount of lease liabilities is increased to reflect the accretion of interest and reduced for the lease payments made. In addition, the carrying amount of lease liabilities is remeasured if there is a modification, a change in the lease term, a change in the lease payments (e.g., changes to future payments resulting from a change in an index or rate used to determine such lease payments) or a change
in the assessment of an option to purchase the underlying asset. (refer Note 14).
(c) Short-term leases and leases of low-value assets
The Company applies the short-term lease recognition exemption to its short-term leases (i.e., those leases that have a lease term of 12 months or less from the commencement date and do not contain a purchase option). It also applies the lease of low-value assets recognition exemption to leases that are considered to be low value. Lease payments on short-term leases and leases of low-value assets are recognised as expense on a straight-line basis over the lease term.
The accounting policies applicable to the Group as a lessor in the comparative period were not difference from SLFRS 16.
2.3.9 Investment properties
Properties held for capital appreciation and properties held to earn rental income have been classified as Investment Property. Investment Property is recognized if it is probable that future economic benefits that are associated with the Investment Property will flow to the Group and cost of the Investment Property can be reliably measured.
Initial measurement
An Investment Property is measured initially at its cost. The cost of a purchased Investment Property comprises of its purchase price and any directly attributable expenditure. The cost of a self-constructed investment is its cost at
the date when the construction or development is complete.
Subsequent measurement
The Group applies the Fair Value Model for Investment Properties in accordance with Sri Lanka Accounting Standard 40 (LKAS 40), - “Investment Property”. Accordingly, land and buildings classified as Investment Properties are stated at Fair Value.
Investment properties are derecognized when either they have been disposed of or when the investment property is permanently withdrawn from use and no future economic benefit is expected from its disposal. The difference between the net disposal proceeds and the carrying amount of the asset is recognized in the statement of comprehensive income in the period of derecognition. Transfers are made to or from investment property only when there is a change in use. For a transfer from investment property to owner-occupied property, the deemed cost for subsequent accounting is the fair value at the date of change. If owner-occupied property becomes an investment property, the Group accounts for such property in accordance with the policy stated under property, plant and equipment up to the date of change.
2.3.10 Provisions
Provisions are recognised when the Group has a present obligation (legal or constructive) as a result of past events, it is probable that an outflow of resources embodying economic benefits will be required to settle the obligation, and a reliable estimate can be made of the amount
NOTES TO THE FINANCIAL STATEMENTS

|111| Annual Report 2020/21
of the obligation. When the Group expects some or all of a provision to be reimbursed, the reimbursement is recognised as a separate asset but only when the reimbursement is virtually certain. The expense relating to any provision is presented in the statement of total comprehensive income net of any reimbursement.
2.3.11 Retirement benefit obligations
(a) Defined Benefit Plan – Gratuity
A defined benefit plan is a post-employment benefit plan other than a defined contribution plan. The defined benefit is calculated by independent actuaries using Projected Unit Credit (PUC) method as recommended by LKAS 19 – “Employee benefits”. The present value of the defined benefit obligation is determined by discounting the estimated future cash outflows using interest rates that are denominated in the currency in which the benefits will be paid, and that have terms to maturity approximating to the terms of the related liability.
The present value of the defined benefit obligations depends on a number of factors that are determined on an actuarial basis using a number of assumptions about discount rate, expected rates of return on assets, future salary increases and mortality rates. Due to the long-term nature of these plans, such estimates are subject to significant uncertainty. All assumptions are reviewed at each reporting date. Interest expense and the current service cost related to the liability is recognized in profit or loss and actuarial gain or loss is recognized in other comprehensive income.
Accordingly, the employee benefit liability is based on the actuarial valuation as of 31 March 2021.
Funding Arrangements
The Gratuity liability is not externally funded.
(b) Defined Contribution Plans- Employees’ Provident Fund and Employees’ Trust Fund
Employees are eligible for Employees’ Provident Fund Contributions and Employees’ Trust Fund Contributions in line with respective statutes and regulations. These are recognized as an expense in the statement of income as incurred.
The Group contributes 12% and 3% of gross emoluments of the employees to Employees’ Provident Fund and Employees’ Trust Fund respectively.
2.3.12 Impairment of non-financial assets
The Group assesses at each reporting date whether there is an indication that an asset may be impaired. If any such indication exists, the Group makes an estimate of the asset’s recoverable amount. An asset’s recoverable amount is the higher of an asset’s or cash-generating unit’s fair value less costs to sell and its value in use and is determined for an individual asset, unless the asset does not generate cash inflows that are largely independent of those from other assets or groups of assets. Where the carrying amount of an asset exceeds its recoverable amount an asset is considered impaired and is written down to its recoverable amount.
2.3.13 Revenue recognition
Revenue from contracts with customers
The Group is primarily involved in manufacturing and marketing of tiles and associated items, sanitaryware, packing material, aluminium products and agricultural products in Sri Lanka and overseas as detailed in Note. 20. Revenue from contracts with customers is recognised when control of the goods are transferred to the customer at an amount that reflects the consideration to which the Group expects to be entitled in exchange for those goods. The Group/Company is the principal in its revenue arrangements, as it typically controls the goods before transferring them to the customer.
a) Sale of goods - tiles and associated items, sanitaryware packing material, aluminium products
Revenue from sales of goods is recognised at the point in time when control of the goods is transferred to the customer, generally on delivery of the goods which include one performance obligation. Control transition point to recognize the revenue on export sales is determined based on the international commercial terms applicable for the respective transactions. In determining the transaction price for the sale of goods, the Group considers the effects of variable consideration, which is not materially affect on the recognition of revenue.

|112|Lanka Walltiles PLC
b) Sale of Plantation produce
The Group is in the business of cultivation, manufacture and sale of black tea, rubber and other crops (Plantation Produce).
Revenue from sale of plantation produce is recognized at the point in time when the control of the goods is transferred to the customer. Black tea and Rubber produce are sold at the Colombo tea/rubber Auction and the highest bidder whose offer is accepted shall be the buyer, and a sale shall be completed at the fall of the hammer, at which point control is transferred to the customer. Revenue from sale of other crops are recognized at the point in time when the control of the goods has been transferred to the customer generally upon delivery of the goods.
c) Sale of timber with installation services
The supply of timber is recognised at the point of deliver the goods to the customer and the revenue for installation services is recognised over installation period for the transactions that consumes a significant time period for installation. The revenue is recognised at a point in a time either for the transactions which consumes an insignificant installation period or for the transactions where the installation services provided on the same day delivery of goods.
(i) Significant financing component
Generally, the Group receives short-term advances from its customers. Using the practical expedient in SLFRS 15, the Group does not adjust the promised amount of
consideration for the effects of a significant financing component if it expects, at contract inception, that the period between the transfer of the promised good or service to the customer and when the customer pays for that good or service will be one year or less.
(ii) Contract assets
A contract asset is the right to consideration in exchange for goods or services transferred to the customer. If the Group performs by transferring goods or services to a customer before the customer pays consideration or before payment is due, a contract asset is recognised for the earned consideration that is conditional.
(iii) Trade receivables
A receivable represents the Company’s right to an amount of consideration that is unconditional (i.e., only the passage of time is required before payment of the consideration is due). Refer to accounting policies of financial instruments – initial recognition and subsequent measurement.
(iv) Contract liabilities
A contract liability is the obligation to transfer goods to a customer for which the Company has received consideration (or an amount of consideration is due) from the customer. If a customer pays consideration before the Company transfers goods to the customer, a contract liability is recognized when the payment is made or the payment is due (whichever is earlier). Contract liabilities are recognised as revenue when the Company performs under the contract.
Other Sources of Revenue
(a) Interest
For all financial instruments measured at amortised cost and interest bearing financial assets, interest income or expense is recorded using the effective interest rate (EIR), which is the rate that exactly discounts the estimated future cash payments or receipts through the expected life of the financial instrument or a shorter period, where appropriate, to the net carrying amount of the financial asset or liability.
Interest income is included in finance income in the statement of total comprehensive income.
(b) Dividends
Dividend income is recognised when the shareholders’ right to receive payment is established.
(c) Rental income
Rental income receivable under operating leases is recognised on a straight-line basis over the term of the lease.
(d) Other income
Other income is recognised on an accrual basis.
Net gains and losses of a revenue nature on the disposal of property, plant & equipment and other non- current assets including investments have been accounted for in the statement of total comprehensive income, having deducted from proceeds on disposal, the carrying amount of the assets and related selling expenses. On disposal of re-valued property, amount remaining in revaluation reserve relating to that asset is transferred directly to retained earnings.
NOTES TO THE FINANCIAL STATEMENTS

|113| Annual Report 2020/21
Gains and losses arising from incidental activities to main revenue generating activities and those arising from a group of similar transactions which are not material, are aggregated, reported and presented on a net basis.
2.3.14 Segmental Reporting
A segment is a distinguishable component of the Group that is engaged either in providing products or services (business segment) or in providing products or services within a particular economic environment (geographical segment), which is subject to risks and rewards that are different from those of other segments.
Segments of the Group are determined based on product or services supplied by Group.
Segment information is presented in respect of the Group’s business and has been prepared in conformation with the accounting policies adopted for preparing and presenting the consolidated financial statements of the Group. The business segments are reported based on Group’s management and internal reporting structure.
Inter segment pricing is determined at prices mutually agreed by the companies.
Segment result, assets and liabilities include items directly attributable to a segment as well as those that can be allocated on a reasonable basis. Unallocated items mainly comprise of goodwill on consolidation.
The Group comprises the following main business segments:
Tiles and associated items
The manufacture and distribution of wall tiles, floor tiles and related products.
Biological Assets
Cultivation, processing and sale of tea and rubber
Aluminum products
The manufacture and distribution of aluminum extrusions and allied products through a network of dealers & distributors.
Packing materials
The manufacture and distribution of packing materials
Management considers that there is no suitable basis for allocating such assets and related liabilities to geographical segments. Accordingly, segment assets, segment liabilities and other segment information by geographical segment is not disclosed.
2.4 Significant accounting policies that are specific to the business of plantation
2.4.1 Basis of Preparation
These Financial Statements have been prepared in accordance with the historical cost convention basis except for the following material items in the statement of financial position.
• Lease hold right to Bare Land and leased assets of JEDB/SLSPC, which have been revalued as more fully described in Note 3.1.(d) and (e).
• Consumable Mature Biological Assets are measured at fair value less cost to sell as per
LKAS 41 - Agriculture.
• Liability for Retirement Benefit Obligation is recognized as the present value of the defined benefit obligation based on actuarial valuation as per LKAS 19: Employee benefits)
• Agriculture produce harvested from biological assets are measured at fair value as per LKAS 41: Agriculture.
2.4.2 Property, Plant and Equipment
a) Permanent Land Development Cost
Permanent land development costs incurred in making major infrastructure development and building new access roads on leasehold lands. These costs have been capitalized and amortized over the remaining lease period. Permanent impairments to land development costs are charged to the Statement of Profit or Loss and Other Comprehensive Income in full and reduced to the net carrying amounts of such assets in the year of occurrence after ascertaining the loss.
b) Biological Assets
Biological assets are classified as Bearer Biological assets and Consumable Biological assets. Bearer Biological assets include tea and rubber trees, those that are not intended to be sold or harvested, but are however used to grow for harvesting agricultural produce from such Biological assets. Consumable Biological assets include managed timber trees those that are to be sold as Biological assets.
Biological assets are further classified into Mature Biological

|114|Lanka Walltiles PLC
assets and Immature Biological assets. Mature Biological assets are those that have attained harvestable specifications or are able to sustain regular harvests. Immature Biological assets are those that have not yet attained harvestable specifications.
Recognition and Measurement
The entity recognises the Biological assets when, and only when, the entity controls the assets as a result of past events, it is probable that future economic benefits associated with the assets will flow to the entity and the fair value or cost of the assets can be measured reliably.
The expenditure incurred on bearer biological asset fields, which are bearing during the year, has been transferred to mature plantations. Expenditure incurred on consumable biological assets is recorded at cost at initial recognition and thereafter at fair value at the end of reporting date.
The Bearer Biological assets are measured at cost less accumulated depreciation and accumulated impairment losses, if any, in terms of LKAS 16 - Property, Plant and Equipment as per the option provided by the ruling issued by the Institute of Chartered Accountants of Sri Lanka.
The managed timber trees are measured on initial recognition and at the end of each reporting period at fair value less cost to sell in terms of LKAS 41. The cost is treated as approximation to fair value of young plants (age below 5 years) as the
impact on biological transformation of such plants to price during this period is immaterial.
Bearer Biological Assets
The cost of land preparation, rehabilitation, new planting, re-planting, crop diversifying, inter-planting and fertilizing, etc., incurred between the time of planting and harvesting (when the planted area attains maturity), are classified as immature plantations. These immature plantations are shown at direct costs plus attributable overheads, including interest attributable to long term loans used for financing immature plantations.
Permanent impairments to Bearer Biological Assets are charged to the Statement of Profit or Loss and Other Comprehensive Income in full and reduce the net carrying amounts of such assets in the year of occurrence after ascertaining the loss.
Infilling cost on Bearer Biological Assets
The land development costs incurred in the form of infilling are capitalised when infilling results in an increase in the economic life of the relevant field beyond its previously assessed standard of performance and infilling costs so capitalised are depreciated over the newly assessed remaining useful economic life of the relevant mature plantation or unexpired lease period, whichever is lower.
Infilling costs that are not capitalised are charged to the Statement of Profit or Loss and Other Comprehensive Income in the year in which they are incurred.
Growing crop nurseries
Nursery cost includes the cost of direct materials, direct labor and an appropriate proportion of directly attributable overheads, less provision for overgrown plants.
Consumer Biological Assets
The managed timber trees are measured on initial recognition and at the end of each reporting period at its fair value less cost to sell in terms of LKAS 41 - Agriculture. The cost is treated as approximation to fair value of young plants as the impact on biological transformation of such plants to price during this period is immaterial. The fair value of timber trees are measured using Discounted Cash Flow (DCF) method taking in to consideration the current market prices of timber, applied to expected timber content of a tree at the maturity by an independent professional valuer.
NOTES TO THE FINANCIAL STATEMENTS

|115| Annual Report 2020/21
The main variables in DCF model concerns
Variable Comment
Currency valuation Sri Lankan Rupees
Timber content
Estimate based on physical verification of girth, height and considering the growth of the each spices.
Factor all the prevailing statutory regulations enforced against harvesting of timber coupled with forestry plan of the Group.
Economic useful lifeEstimated based on the normal life span of each spices by factoring the forestry plan of the Group.
Selling price
Estimated based on prevailing Sri Lankan market price. Factor all the conditions to be fulfil in bringing the trees in to saleable condition.
Discount RateDiscount rate reflects the possible variations in the Cash flows and the risk related to the biological assets.
The gain or loss arising on initial recognition of Consumable Biological assets at fair value less cost to sell and from a change in fair value less cost to sell of Consumable Biological assets are included in profit or loss for the period in which it arises.
Borrowing Cost
Borrowing costs that are directly attributable to acquisition, construction or production of a qualifying asset, which takes a substantial period of time to get ready for its intended use or sale, are capitalized as a part of the asset.
Borrowing costs that are not capitalized are recognized as expenses in the period in which they are incurred and charged to the Statement of Profit or Loss.
The amounts of the borrowing costs which are eligible for capitalization are determined in accordance with LKAS 23 - “Borrowing Costs”.
Borrowing costs incurred in respect of specific loans that are utilized for field development activities have been capitalized as a part of the cost of the relevant immature plantation. The capitalization will cease when the crops are ready for commercial harvest.
Produce on Bearer Biological Asset
The Company recognizes its agricultural produce prior to harvest separately from its bearer plant. Such agricultural produce prior to harvest continues to be in the scope of LKAS 41 and measured at fair value less costs to sell. Changes in the fair value of such agricultural produce is recognized in profit or loss at the end of each reporting period.
When deriving the estimated quantity the Company limits it to one harvesting cycle and the quantity is ascertained based on the last day of the harvest in the immediately preceding cycle. In order to ascertain the fair value of produce growing on trees, 50% of the estimated crop in that harvesting cycle is considered.”
Non-Harvested Produce on Bearer Biological Asset
The Company recognizes its agricultural produce prior to harvest separately from its bearer plant. Such agricultural produce prior to harvest continues to be in the scope of LKAS 41 and measured at fair value less costs to sell. Changes in the fair value of such agricultural produce is recognized in profit or loss at the end of each reporting period.
When deriving the estimated quantity, the Company limits it to one harvesting cycle and the quantity is ascertained based on the last day of the harvest in the immediately preceding cycle. In order to ascertain the fair value of produce growing on trees, 50% of the estimated crop in that harvesting cycle is considered.
2.4.3 Intangible assets
Basis of recognition
An Intangible asset is recognised if it is probable that future economic benefits associated with the asset will flow to the group and the cost of the asset can be reliably measured.
Basis of measurement
Intangible assets acquired separately are measured on initial recognition at cost. The costs of intangible assets acquired in a business combination is their fair value as at the date of acquisition. Following initial recognition, intangible assets are carried at cost less any accumulated amortisation and accumulated impairment losses. Internally generated intangibles, excluding capitalised development costs, are not capitalised and the

|116|Lanka Walltiles PLC
related expenditure is reflected in the Statement of Profit or Loss in the year in which the expenditure is incurred.
Useful economic lives, amortization and impairment
The useful lives of intangible assets are assessed as either finite or indefinite lives. Intangible assets with finite lives are amortised over the useful economic life and assessed for impairment whenever there is an indication that the intangible asset may be impaired. The amortisation period and the amortisation method for an intangible asset with a finite useful life is reviewed at least at each financial year-end and such changes are treated as accounting estimates. The amortisation expense on intangible assets with finite lives is recognised in the income statement.
The estimated useful lives of assets are as follows:
Software 5 Years
2.4.4 Inventories
a) Agricultural produce harvested from Biological Assets
Agricultural produce harvested from Biological Assets are measured at their fair value less cost to sell at the point of harvest. The finished and semi finished inventories from Agricultural produce are valued by adding the cost of conversion to the fair value of agricultural produce.
b) Agricultural produce after further processing
Further processed output of Agricultural Produce are valued at
the lower of cost and estimated net realizable value, after making due allowance for obsolete and slow moving items. Net realizable value is the price at which stocks can be sold in the normal course of business after allowing for estimated costs of conversion and the estimated costs necessary to bring them to a saleable condition.
The cost incurred in bringing the inventories to its present location and conditions are accounted using the following cost formulas.
Input Material At actual cost on first-in-first-out basis.
Spares and Consumables
At actual cost on first-in-first-out basis.
Produced Stocks
Valued at cost or NRV.
2.4.5 Retirement Benefit Obligation
a) Defined Benefit Plan
The retirement benefit plan adopted is as required under the Payment of Gratuity Act No.12 of 1983 and the Indian Repatriate Act No.34 of 1978 to eligible employees. This item is grouped under Retirement Benefit Liability in the Statement of Financial Position.
Provision for Gratuity on the Employees of the Company is based on an actuarial valuation, using the Project Unit Credit (PUC) method as recommended by LKAS 19 “Retirement Benefit Costs”. The actuarial valuation was carried out by a professionally qualified firm of actuaries, Meserss. Acturial Management Consultants (Private) Limited as at 31.03.2021.
However, according to the Payment of Gratuity Act No.12 of 1983, the liability for payment to an employee arises only after the completion of 5 years continued services.
The liability is not externally funded.
b) Defined Contribution Plans - Provident Funds and Trust Fund
The Company contributes 12% on consolidated salary of the employees to Ceylon Planters’ Provident Society (CPPS)/Estate Staff’s Provident Society (ESPS)/ Employees’ Provident Fund (EPF).
All the employees of the Company are members of the Employees’ Trust Fund, to which the Company contributes 3% on the consolidated salary of such employees.
2.4.6 Deferred Income
a) Grants and Subsidies
Government grants are recognized where there is a reasonable assurance that the grant will be received, and all attached conditions will be complied with. Where the grant relates to an asset, it is recognized as deferred income and released to income in equal amounts over the expected useful life of the related assets. When the grants relate to an expense item, it is recognized as income over the period necessary to match the grant on a systematic basis to the costs that are intended to compensate.
Grants related to Property, Plant and Equipment other than grants received for consumer biological assets are initially deferred and allocated to income on a systematic basis over the useful life of the
NOTES TO THE FINANCIAL STATEMENTS
|117| Annual Report 2020/21
related Property, Plant and Equipment is more fully mentioned in Note 17 to the Financial Statements.
Grants related to income are recognized in the Statement of comprehensive Income in the year which it is receivable.
Unconditional grants received for consumer biological assets are measured at fair value less cost to sell are recognized in the Statement of Comprehensive income when and only when such grants become receivable.
2.4.7 Revenue Recognition
Refer Note 2.3.13 (b) for the policy of revenue recognition on sale of the plantation products.
2.5 Cash and cash equivalents
Cash and cash equivalents are cash at bank and in hand, call deposits and short term highly liquid investments readily convertible to known amounts of cash and subject to insignificant risk of changes in value.
For the purpose of Statement of Cash Flows, cash and cash equivalents consist of cash in hand, cash at bank deposits in banks net of outstanding bank overdrafts. Investments with short maturities (i.e. three months or less from date of acquisition) are also treated as cash equivalents. Bank overdrafts are disclosed under Interest Bearing Liabilities in the Statement of Financial Position.
2.6 STANDARDS ISSUED BUT NOT EFFECTIVE AS AT 31 March 2021
The new and amended standards that are issued, but not yet effective to the date of issuance of these financial statements are disclosed below. None of the new or amended pronouncements are expected to have a material impact on the consolidated financial statements of the Group in the foreseeable future. The Group intends to adopt these amended standards, if applicable, when they become effective.
a) Amendments to SLFRS 9, LKAS 39, SLFRS 7, SLFRS 4 and SLFRS 16 – Interest Rate Benchmark Reform (Phase 1 & 2)
The amendments to SLFRS 9 & LKAS 39 provide a number of reliefs, which apply to all hedging relationships that are directly affected by interest rate benchmark reform. A hedging relationship is affected if the reform gives rise to uncertainty about the timing and/or amount of benchmark-based cash flows of the hedged item or the hedging instrument.
IBOR reforms Phase 2 include number of reliefs and additional disclosures. Amendments supports companies in applying SLFRS when changes are made to contractual cashflows or hedging relationships because of the reform.
These amendments to various standards are effective for the annual reporting periods beginning on or after 01 January 2021.
b) Amendments to SLFRS 16 - COVID – 19 Related Rent Concessions
The amendments provide relief to lessees from applying SLFRS 16 guidance on lease modification accounting for rent concessions arising as a direct consequence of the Covid-19 Pandemic.
As a practical expedient, a lessee may elect not to assess whether a Covid-19 related rent concession from a lessor is a lease modification. A lessee that makes this election accounts for any change in lease payments resulting from Covid-19 related rent concession the same way it would account for the change under SLFRS16, if the change were not a lease modification.
The amendment applies to annual reporting periods beginning on or after 01 June 2020.
c) Amendments to LKAS 1: Classification of Liabilities as Current or Non-current
In March 2021, ICASL adopted amendments to paragraphs 69 to 76 of LKAS 1 which specify the requirements for classifying liabilities as current or non-current. The amendments clarify:
• What is meant by a right to defer settlement
• That a right to defer must exist at the end of the reporting period
• That classification is unaffected by the likelihood that an entity will exercise its deferral right
|118|Lanka Walltiles PLC
• That only if an embedded derivative in a convertible liability is itself an equity instrument would the terms of a liability not impact its classification
The amendments are effective for annual reporting periods beginning on or after 1 January 2022 and must be applied retrospectively.
d) Onerous Contracts – Costs of Fulfilling a Contract – Amendments to LKAS 37
In March 2021, the ICASL adopted amendments to LKAS 37 to specify which costs an entity needs to include when assessing whether a contract is onerous or loss-making.
The amendments apply a “directly related cost approach”. The costs that relate directly to a contract to provide goods or services include both incremental costs and an allocation of costs directly related to contract activities. General and administrative costs do not relate directly to a contract and are excluded unless they are explicitly chargeable to the counterparty under the contract.
The amendments are effective for annual reporting periods beginning on or after 1 January 2022. The Group will apply these amendments to contracts for which it has not yet fulfilled all its obligations at the beginning of the annual reporting period in which it first applies the amendments
e) Property, Plant and Equipment: Proceeds before Intended Use – Amendments to LKAS 16
In March 2021, the ICASL adopted amendments to LKAS16-Property, Plant and Equipment — Proceeds before Intended Use, which prohibits entities deducting from the cost of an item of property, plant and equipment, any proceeds from selling items produced while bringing that asset to the location and condition necessary for it to be capable of operating in the manner intended by management. Instead, an entity recognises the proceeds from selling such items, and the costs of producing those items, in profit or loss.
The amendment is effective for annual reporting periods beginning on or after 1 January 2022 and must be applied retrospectively to items of property, plant and equipment made available for use on or after the beginning of the earliest period presented when the entity first applies the amendment.
f) Amendments to SLFRS 3:
The amendments update SLFRS 3 so that it refers to the 2018 Conceptual Framework instead of the 1989 Framework. IASB also add to SLFRS 3 a requirement that, for obligations within the scope of LKAS 37, an acquirer applies LKAS 37 to determine whether at the acquisition date a present obligation exists as a result of past events. For a levy that would be within the scope of
NOTES TO THE FINANCIAL STATEMENTS
IFRIC 21 Levies, the acquirer applies IFRIC 21 to determine whether the obligating event that gives rise to a liability to pay the levy has occurred by the acquisition date.Finally, the amendments add an explicit statement that an acquirer does not recognise contingent assets acquired in a business combination. The amendments are effective for business combinations for which the date of acquisition is on or after the beginning of the first annual period beginning on or after 1 January 2022. Early application is permitted if an entity also applies all other updated references (published together with the updated Conceptual Framework) at the same time or earlier.

|119| Annual Report 2020/21
3. PROPERTY, PLANT & EQUIPMENT
3.1 GROUP
Balanceas at
01.04.2020
Revaluations Additions Disposals/Transfers
Balanceas at
31.03.2021Rs.'000 Rs.’000 Rs.'000 Rs.’000 Rs.'000
a) Gross Carrying AmountsAt CostBuildings on leasehold Land 363,505 - 8,017 - 371,522 Plant and Machinery 10,110,827 - 551,562 1,664 10,664,053 Water Supply, Electricity Distribution Scheme 624,974 - 24,031 - 649,005 Tools, Implements, Furniture & Fittings and Electrical Appliances 895,035 - 212,128 (3,344) 1,103,819 Transport & Communication Equipment 608,793 - 24,401 (16,918) 616,276 Total 12,603,134 - 820,139 (18,598) 13,404,675
Balanceas at
01.04.2020
Revaluations Additions Disposals/Transfers
Balanceas at
31.03.2021Rs.'000 Rs.’000 Rs.'000 Rs.’000 Rs.'000
At ValuationFreehold Land 4,811,265 174,929 11,097 - 4,997,291 Buildings 3,513,053 531,465 110,018 (336,127) 3,818,409 Total 8,324,318 706,394 121,115 (336,127) 8,815,700
Balanceas at
01.04.2020
Additions Disposals/Transfers
Balanceas at
31.03.2021In the Course of Construction Rs.'000 Rs.'000 Rs.’000 Rs.'000
Capital Work In Progress - Buildings & Others 375,717 - 552,564 (347,826) 580,455 375,717 - 552,564 (347,826) 580,455
Total 21,303,169 706,394 1,493,818 (702,551) 22,800,830
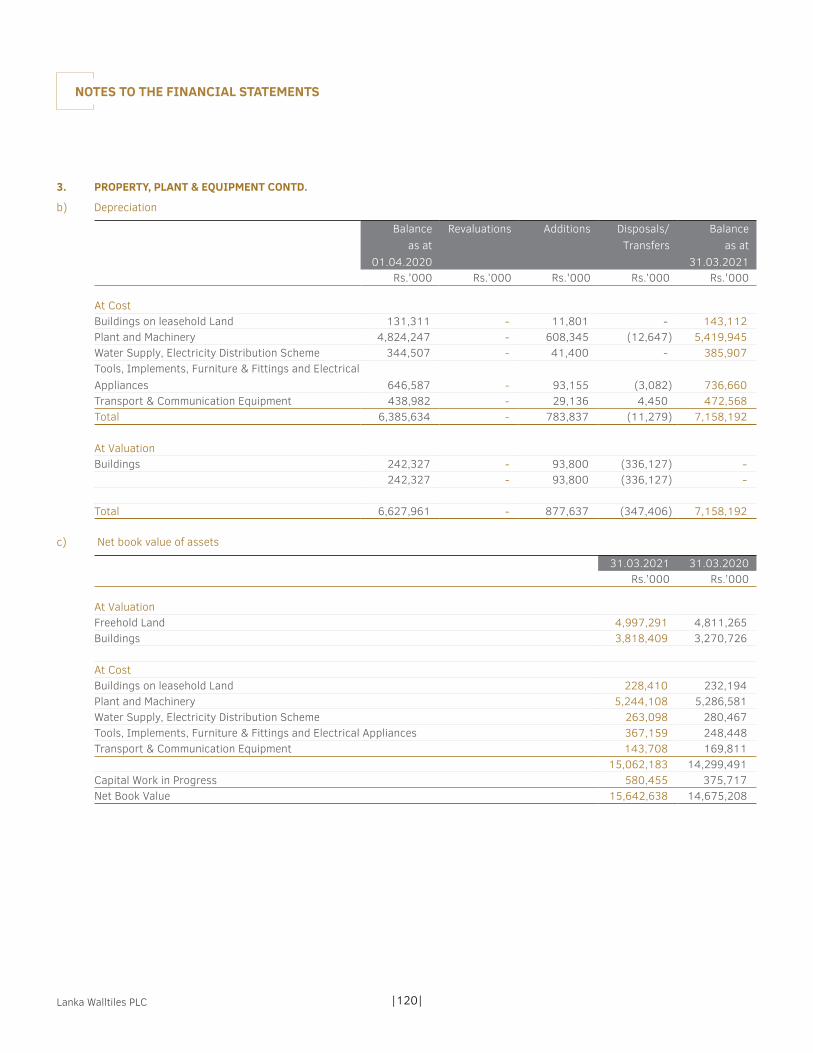
|120|Lanka Walltiles PLC
3. PROPERTY, PLANT & EQUIPMENT CONTD.
b) Depreciation
Balanceas at
01.04.2020
Revaluations Additions Disposals/Transfers
Balanceas at
31.03.2021Rs.'000 Rs.’000 Rs.'000 Rs.’000 Rs.'000
At CostBuildings on leasehold Land 131,311 - 11,801 - 143,112 Plant and Machinery 4,824,247 - 608,345 (12,647) 5,419,945 Water Supply, Electricity Distribution Scheme 344,507 - 41,400 - 385,907 Tools, Implements, Furniture & Fittings and Electrical Appliances 646,587 - 93,155 (3,082) 736,660 Transport & Communication Equipment 438,982 - 29,136 4,450 472,568 Total 6,385,634 - 783,837 (11,279) 7,158,192
At ValuationBuildings 242,327 - 93,800 (336,127) -
242,327 - 93,800 (336,127) -
Total 6,627,961 - 877,637 (347,406) 7,158,192
c) Net book value of assets
31.03.2021 31.03.2020Rs.’000 Rs.’000
At Valuation Freehold Land 4,997,291 4,811,265 Buildings 3,818,409 3,270,726
At Cost Buildings on leasehold Land 228,410 232,194 Plant and Machinery 5,244,108 5,286,581 Water Supply, Electricity Distribution Scheme 263,098 280,467 Tools, Implements, Furniture & Fittings and Electrical Appliances 367,159 248,448 Transport & Communication Equipment 143,708 169,811
15,062,183 14,299,491 Capital Work in Progress 580,455 375,717 Net Book Value 15,642,638 14,675,208
NOTES TO THE FINANCIAL STATEMENTS
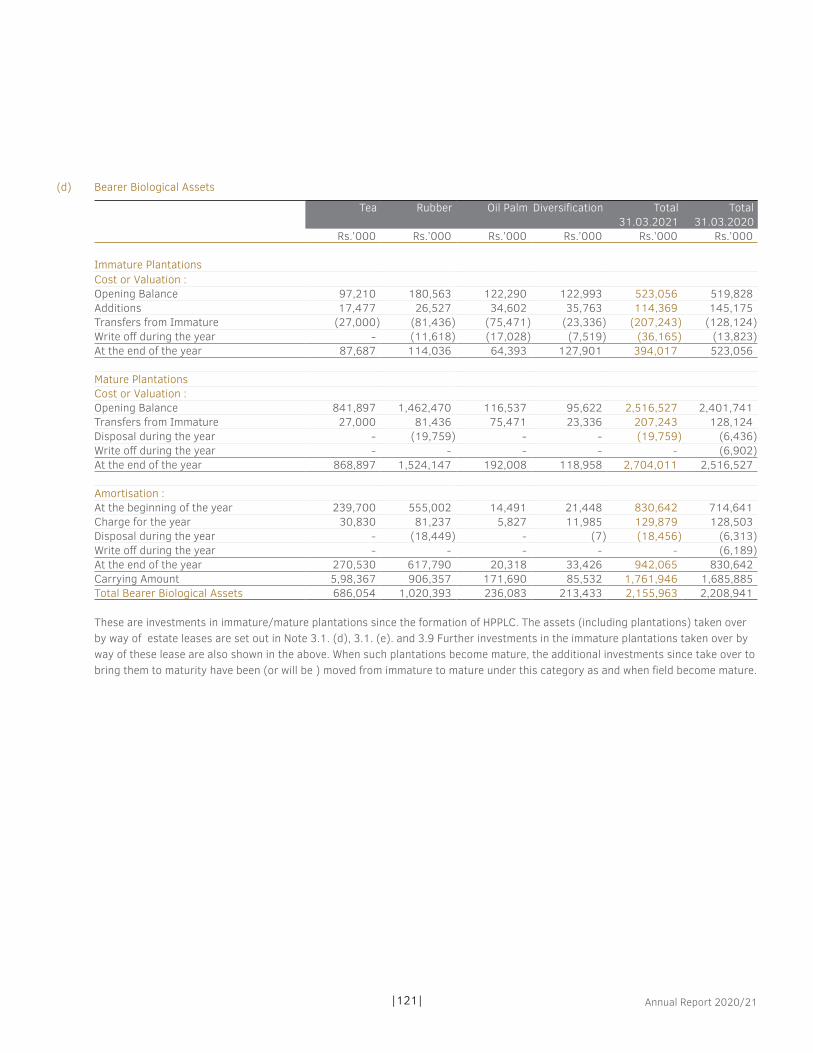
|121| Annual Report 2020/21
(d) Bearer Biological Assets
Tea Rubber Oil Palm Diversification Total Total 31.03.2021 31.03.2020
Rs.’000 Rs.’000 Rs.’000 Rs.’000 Rs.’000 Rs.’000
Immature PlantationsCost or Valuation :Opening Balance 97,210 180,563 122,290 122,993 523,056 519,828 Additions 17,477 26,527 34,602 35,763 114,369 145,175 Transfers from Immature (27,000) (81,436) (75,471) (23,336) (207,243) (128,124)Write off during the year - (11,618) (17,028) (7,519) (36,165) (13,823)At the end of the year 87,687 114,036 64,393 127,901 394,017 523,056
Mature PlantationsCost or Valuation :Opening Balance 841,897 1,462,470 116,537 95,622 2,516,527 2,401,741 Transfers from Immature 27,000 81,436 75,471 23,336 207,243 128,124 Disposal during the year - (19,759) - - (19,759) (6,436)Write off during the year - - - - - (6,902)At the end of the year 868,897 1,524,147 192,008 118,958 2,704,011 2,516,527
Amortisation :At the beginning of the year 239,700 555,002 14,491 21,448 830,642 714,641 Charge for the year 30,830 81,237 5,827 11,985 129,879 128,503 Disposal during the year - (18,449) - (7) (18,456) (6,313)Write off during the year - - - - - (6,189)At the end of the year 270,530 617,790 20,318 33,426 942,065 830,642 Carrying Amount 5,98,367 906,357 171,690 85,532 1,761,946 1,685,885 Total Bearer Biological Assets 686,054 1,020,393 236,083 213,433 2,155,963 2,208,941
These are investments in immature/mature plantations since the formation of HPPLC. The assets (including plantations) taken over by way of estate leases are set out in Note 3.1. (d), 3.1. (e). and 3.9 Further investments in the immature plantations taken over by way of these lease are also shown in the above. When such plantations become mature, the additional investments since take over to bring them to maturity have been (or will be ) moved from immature to mature under this category as and when field become mature.

|122|Lanka Walltiles PLC
(e) Consumable Biological Assets
31.03.2021 31.03.2020Rs.’000 Rs.’000
Immature PlantationsCost :At the beginning of the year 44,273 36,211 Additions 8,730 9,814 Transfers to Mature Plantations (1,135) (1,734)Transferred to Statement of Profit or Loss (2,404) (19)At the end of the year 49,464 44,272
Mature PlantationsCost :At the beginning of the year 587,904 549,707 Decrease due to Harvest (40,015) (16,867)Increase due to new plantations 1,135 1,734 Change in Fair Value less costs to sell 32,090 53,331 At the end of the year 581,114 587,905 Total Bearer Biological Assets 630,578 632,177
(f) Basis of Valuation
Under LKAS 41 the company has valued its manged plantations at fair value less cost to sell. Managed timber plantations as at 31st March 2021 comprised approximately 304.52 hectares.
Managed trees which are less than three years old are considered to be immature consumable biological assets, amounting Rs.49.464 Million as at 31st March 2021. The cost of immature trees is treated as approximate fair value, particularly on the ground that little biological transformation has taken place and the impact of the biological transformation on price is not material. When such plantation become mature , the additional investments since taken over to bring them to maturity are transferred from immature to mature.
The mature consumable biological assets were valued by Chartered Valuers Mr.A.A.M.Fathihu-proprietor of FM Valuers for 2020/21 using Discounted Cash Flow (DFC) method . In ascertaining the fair value of timber, physical verification was carried covering all the estates.
Key assumptions used in valuation are;
The prices adopted are net of expenditure
Discounted rates used by the Valuer are within the range of 14%-16%.
The valuation, as presented in the external valuation model based on the net present value, takes into accounts the long-term exploitation of the timber plantation. Because of the inherent uncertainty associated with the valuation at fair value of the biological assets due to the volatility of the variables, their carrying value may differ from their realisation value. The Board of Directors retains their view that commodity markets are inherently volatile and their long-term price projection are highly unpredictable. Hence, the sensitivity analysis regarding the selling price and discount rate variation as included in this note allows every investor to reasonably challenge the financial impact of the assumptions used in the valuation against his own assumptions.
The biological assets of the Company are mainly cultivated in leased lands. When measuring the fair value of the biological assets it was assumed that these concession can and will be renewed at normal circumstances. Timber content expects to be realised in future and is included in the calculation of the fair value that takes into account the age of the timber plants and not the expiration date of the lease.
The Company is exposed to the following risks relating to its timber plantation:-
NOTES TO THE FINANCIAL STATEMENTS
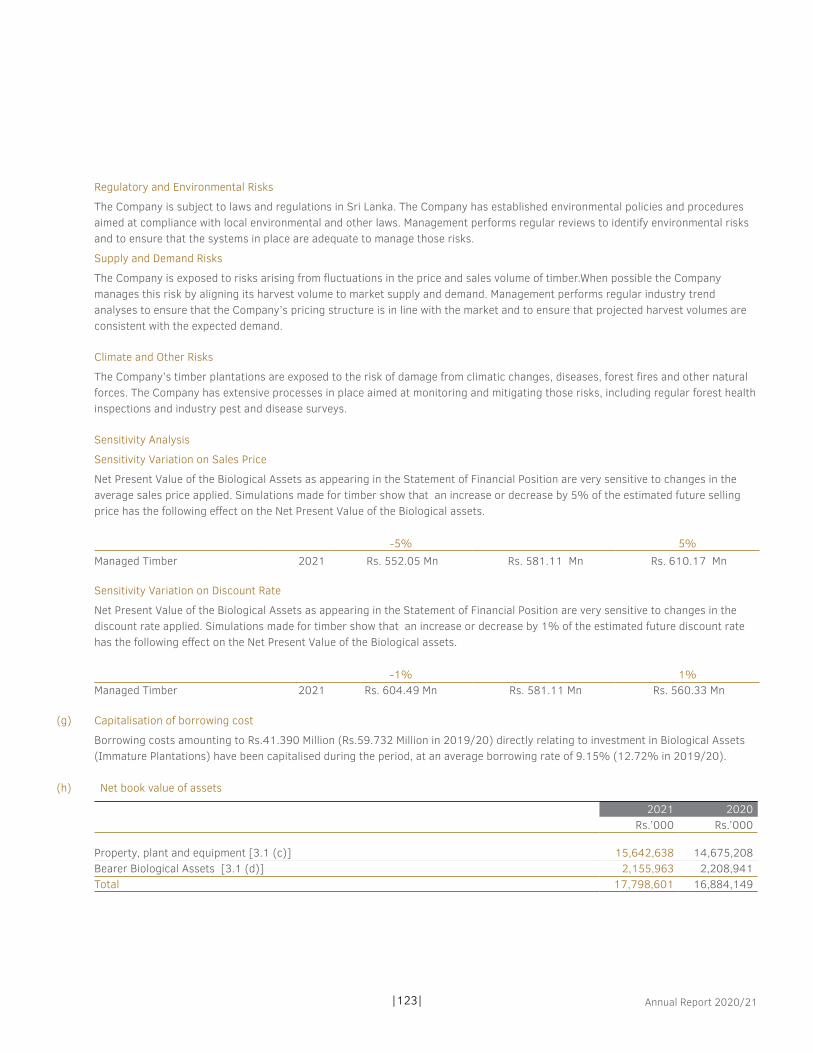
|123| Annual Report 2020/21
Regulatory and Environmental Risks
The Company is subject to laws and regulations in Sri Lanka. The Company has established environmental policies and procedures aimed at compliance with local environmental and other laws. Management performs regular reviews to identify environmental risks and to ensure that the systems in place are adequate to manage those risks.
Supply and Demand Risks
The Company is exposed to risks arising from fluctuations in the price and sales volume of timber.When possible the Company manages this risk by aligning its harvest volume to market supply and demand. Management performs regular industry trend analyses to ensure that the Company’s pricing structure is in line with the market and to ensure that projected harvest volumes are consistent with the expected demand.
Climate and Other Risks
The Company’s timber plantations are exposed to the risk of damage from climatic changes, diseases, forest fires and other natural forces. The Company has extensive processes in place aimed at monitoring and mitigating those risks, including regular forest health inspections and industry pest and disease surveys.
Sensitivity Analysis
Sensitivity Variation on Sales Price
Net Present Value of the Biological Assets as appearing in the Statement of Financial Position are very sensitive to changes in the average sales price applied. Simulations made for timber show that an increase or decrease by 5% of the estimated future selling price has the following effect on the Net Present Value of the Biological assets.
-5% 5%Managed Timber 2021 Rs. 552.05 Mn Rs. 581.11 Mn Rs. 610.17 Mn
Sensitivity Variation on Discount Rate
Net Present Value of the Biological Assets as appearing in the Statement of Financial Position are very sensitive to changes in the discount rate applied. Simulations made for timber show that an increase or decrease by 1% of the estimated future discount rate has the following effect on the Net Present Value of the Biological assets.
-1% 1%Managed Timber 2021 Rs. 604.49 Mn Rs. 581.11 Mn Rs. 560.33 Mn
(g) Capitalisation of borrowing cost
Borrowing costs amounting to Rs.41.390 Million (Rs.59.732 Million in 2019/20) directly relating to investment in Biological Assets (Immature Plantations) have been capitalised during the period, at an average borrowing rate of 9.15% (12.72% in 2019/20).
(h) Net book value of assets
2021 2020Rs.’000 Rs.’000
Property, plant and equipment [3.1 (c)] 15,642,638 14,675,208 Bearer Biological Assets [3.1 (d)] 2,155,963 2,208,941 Total 17,798,601 16,884,149

|124|Lanka Walltiles PLC
(i) Fixed assets include fully depreciated assets, the cost of which at the reporting date amounted to Rs. 2,667.23 Mn (2020- Rs. 2,620.01 Mn)
(j) During the financial year, the Group acquired property, plant & equipment to the aggregate value of Rs. 1,273.78 Mn ( 2020- Rs. 1,222.68 Mn). Cash payments amounting to Rs. 1,273.78 Mn ( 2020 - Rs. 1,222.68 Mn) were made during the year for purchase of property, plant and equipment.
(k) “The following properties are revalued and recorded under freehold land and buildings. Fair Value measurement disclosure for revalued land based on un-observable inputs are as follows, (A) Quoted Price (unadjusted) in active markets for identical assets or liabilities (Level -1).
(B) Inputs other than quoted prices included within level 1 that are observable for the asset or liability, either directly (that is, as prices) or indirectly (that is derived from prises) (Level -2)
(C) Input for the asset or liability that are not based on observable market data (that is, unobservable inputs) (Level -3).
Company Location Extent Valuer Valuation Date Valuation Details
Significant unobservable input : price per perch/ acre/range
Fair Value measurement
(Level 3) Rs.000’s
Lanka Tiles PLC
Factory Premises , Jaltara , Ranala 28A-02R-32.69P
FRT Valuation Services (pvt) Ltd
31 March 2021 Market approach
Rs. 50,000/- to 120,000/- per perch
517,878
Factory Premises , Jaltara , Ranala 415,638 sqft FRT Valuation Services (pvt) Ltd
31 March 2021 Contractor’s method
Rs 1000/- to Rs. 4250/- per sqft
1,191,022
Land Adjancent to the Factory Premises , Jaltara , Ranala
08A-02R-08.56P
FRT Valuation Services (pvt) Ltd
31 March 2021 Market approach
Rs. 120,000/- to 200,000/- per perch
203,001
Land Adjancent to the Factory Premises , Jaltara , Ranala
25,604 sqft FRT Valuation Services (pvt) Ltd
31 March 2021 Contractor's method
Rs 1,200/- to Rs. 4500/- per sqft
49,099
Lanka Tiles Warehouse , Samurdhi Mawatha Biyagama
02A-00R-15.93P
FRT Valuation Services (pvt) Ltd
31 March 2021 Market approach
Rs. 1,000,000/- per perch
335,949
Lanka Tiles Warehouse , Samurdhi Mawatha Biyagama
48,531 sqft FRT Valuation Services (pvt) Ltd
31 March 2021 Contractor’s method
Rs 1500/- to Rs. 4000/- per sqft
192,451
Ball Clay Land Kalutara' 5A-01R-0.83P FRT Valuation Services (pvt) Ltd
31 March 2021 Market approach
Rs. 10,000/- per acre
53
Land at Nugegoda 00A-00R-32.03P
FRT Valuation Services (pvt) Ltd
31 March 2021 Market approach
Rs. 7,500,000/- per perch
240,200
Bare Land Henpola road Madampe 13A-00R-02P FRT Valuation Services (pvt) Ltd
31 March 2021 Market approach
Rs. 3,300,000/- per acre
42,900
Uni Dil Packing Ltd.
Land at Narampola road, Moragala, Deketana
A12-R03-P37.1
Mr. D.G.Newton 31 March 2021 Market based evidence
Rs.85,000/- per perch
124,211
Building and land improvement at Narampola road, Moragala, Deketana
179,357 sq.ft Mr. D.G.Newton 31 March 2021 Depreciated Replacement cost
Rs.750/- to Rs. 2,000/- per sq.ft
334,090
Uni Dil Packaging Solutions Ltd
Land at Narampola road, Moragala, Deketana
A2-R2-P35 Mr. D.G.Newton 31 March 2021 Market based evidence
Rs. 80,000/- per perch
34,800
Building at Narampola road, Moragala, Deketana
32103 sq.ft Mr. D.G.Newton 31 March 2021 Depreciated Replacement cost
Rs.1,750/- to Rs. 2,500/- per sq.ft
65,700
NOTES TO THE FINANCIAL STATEMENTS
3. PROPERTY, PLANT & EQUIPMENT CONTD.
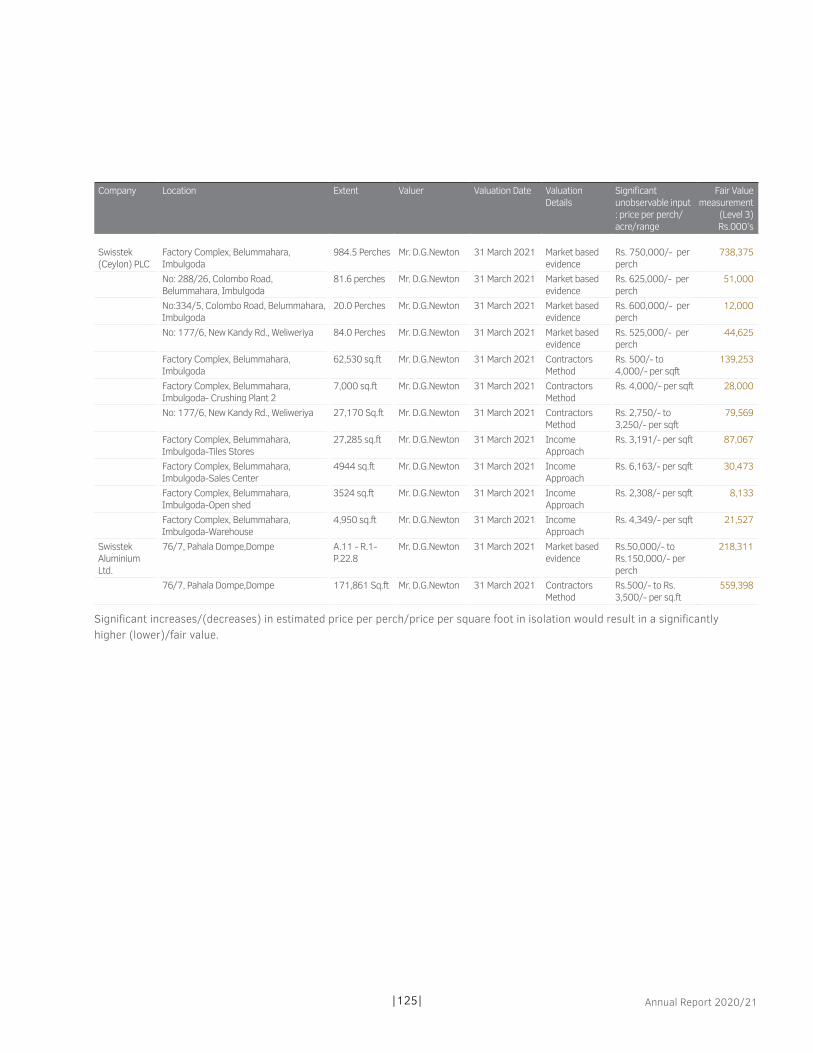
|125| Annual Report 2020/21
Company Location Extent Valuer Valuation Date Valuation Details
Significant unobservable input : price per perch/ acre/range
Fair Value measurement
(Level 3) Rs.000’s
Swisstek (Ceylon) PLC
Factory Complex, Belummahara, Imbulgoda
984.5 Perches Mr. D.G.Newton 31 March 2021 Market based evidence
Rs. 750,000/- per perch
738,375
No: 288/26, Colombo Road, Belummahara, Imbulgoda
81.6 perches Mr. D.G.Newton 31 March 2021 Market based evidence
Rs. 625,000/- per perch
51,000
No:334/5, Colombo Road, Belummahara, Imbulgoda
20.0 Perches Mr. D.G.Newton 31 March 2021 Market based evidence
Rs. 600,000/- per perch
12,000
No: 177/6, New Kandy Rd., Weliweriya 84.0 Perches Mr. D.G.Newton 31 March 2021 Market based evidence
Rs. 525,000/- per perch
44,625
Factory Complex, Belummahara, Imbulgoda
62,530 sq.ft Mr. D.G.Newton 31 March 2021 Contractors Method
Rs. 500/- to 4,000/- per sqft
139,253
Factory Complex, Belummahara, Imbulgoda- Crushing Plant 2
7,000 sq.ft Mr. D.G.Newton 31 March 2021 Contractors Method
Rs. 4,000/- per sqft 28,000
No: 177/6, New Kandy Rd., Weliweriya 27,170 Sq.ft Mr. D.G.Newton 31 March 2021 Contractors Method
Rs. 2,750/- to 3,250/- per sqft
79,569
Factory Complex, Belummahara, Imbulgoda-Tiles Stores
27,285 sq.ft Mr. D.G.Newton 31 March 2021 Income Approach
Rs. 3,191/- per sqft 87,067
Factory Complex, Belummahara, Imbulgoda-Sales Center
4944 sq.ft Mr. D.G.Newton 31 March 2021 Income Approach
Rs. 6,163/- per sqft 30,473
Factory Complex, Belummahara, Imbulgoda-Open shed
3524 sq.ft Mr. D.G.Newton 31 March 2021 Income Approach
Rs. 2,308/- per sqft 8,133
Factory Complex, Belummahara, Imbulgoda-Warehouse
4,950 sq.ft Mr. D.G.Newton 31 March 2021 Income Approach
Rs. 4,349/- per sqft 21,527
Swisstek Aluminium Ltd.
76/7, Pahala Dompe,Dompe A.11 - R.1- P.22.8
Mr. D.G.Newton 31 March 2021 Market based evidence
Rs.50,000/- to Rs.150,000/- per perch
218,311
76/7, Pahala Dompe,Dompe 171,861 Sq.ft Mr. D.G.Newton 31 March 2021 Contractors Method
Rs.500/- to Rs. 3,500/- per sq.ft
559,398
Significant increases/(decreases) in estimated price per perch/price per square foot in isolation would result in a significantly higher (lower)/fair value.
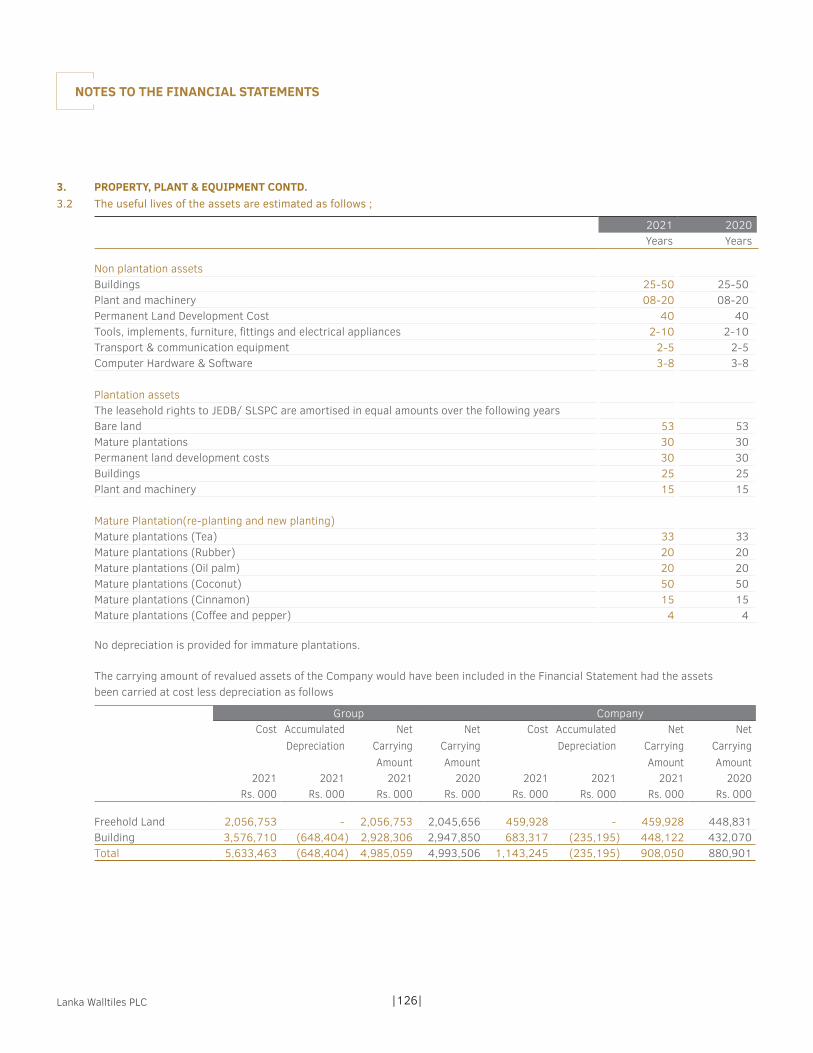
|126|Lanka Walltiles PLC
3. PROPERTY, PLANT & EQUIPMENT CONTD.3.2 The useful lives of the assets are estimated as follows ;
2021 2020Years Years
Non plantation assetsBuildings 25-50 25-50Plant and machinery 08-20 08-20Permanent Land Development Cost 40 40Tools, implements, furniture, fittings and electrical appliances 2-10 2-10Transport & communication equipment 2-5 2-5Computer Hardware & Software 3-8 3-8
Plantation assetsThe leasehold rights to JEDB/ SLSPC are amortised in equal amounts over the following yearsBare land 53 53Mature plantations 30 30Permanent land development costs 30 30Buildings 25 25Plant and machinery 15 15
Mature Plantation(re-planting and new planting)Mature plantations (Tea) 33 33 Mature plantations (Rubber) 20 20 Mature plantations (Oil palm) 20 20Mature plantations (Coconut) 50 50Mature plantations (Cinnamon) 15 15Mature plantations (Coffee and pepper) 4 4
No depreciation is provided for immature plantations.
The carrying amount of revalued assets of the Company would have been included in the Financial Statement had the assets been carried at cost less depreciation as follows
Group CompanyCost Accumulated
DepreciationNet
CarryingAmount
Net CarryingAmount
Cost AccumulatedDepreciation
Net CarryingAmount
Net CarryingAmount
2021 2021 2021 2020 2021 2021 2021 2020Rs. 000 Rs. 000 Rs. 000 Rs. 000 Rs. 000 Rs. 000 Rs. 000 Rs. 000
Freehold Land 2,056,753 - 2,056,753 2,045,656 459,928 - 459,928 448,831 Building 3,576,710 (648,404) 2,928,306 2,947,850 683,317 (235,195) 448,122 432,070 Total 5,633,463 (648,404) 4,985,059 4,993,506 1,143,245 (235,195) 908,050 880,901
NOTES TO THE FINANCIAL STATEMENTS

|127| Annual Report 2020/21
3. PROPERTY, PLANT & EQUIPMENT CONTD.
3.3 Property, Plant & Equipment
COMPANY Balanceas at
01.04.2020
Addition Revaluations Disposals/Transfers/
Write-off
Balanceas at
31.03.2021Gross Carrying Amounts Rs.'000 Rs.'000 Rs.000 Rs.’000 Rs.'000
Plant and Machinery 2,154,887 111,372 - 14,329 2,280,588 Water Supply, Electricity Distribution Scheme 149,987 2,171 - - 152,158 Tools, Implements, Furniture & Fittings and Electrical Appliances 209,921 25,021 - (2,315) 232,627 Transport & Communication Equipment 172,541 - - (26,128) 146,413 Total 2,687,336 138,564 - (14,114) 2,811,786
Balanceas at
01.04.2020
Addition Revaluations Disposals/Transfers/
Write-off
Balanceas at
31.03.2021At Valuation Rs.'000 Rs.'000 Rs.’000 Rs.'000
Freehold Land 2,567,804 11,097 (144,912) - 2,433,989 Buildings 861,719 37,318 194,723 (61,133) 1,032,627 Total 3,429,523 48,415 49,811 (61,133) 3,466,616
In the Course of Construction Balanceas at
01.04.2020
Addition Revaluations Disposals/Transfers/
Write-off
Balanceas at
31.03.2021Rs.'000 Rs.'000 Rs.’000 Rs.’000 Rs.'000
Capital Work In Progress Plant & Machinery and Building 47,570 158,693 - (126,433) 79,830
47,570 158,693 - (126,433) 79,830
Total 6,164,429 345,672 49,811 (201,680) 6,358,232
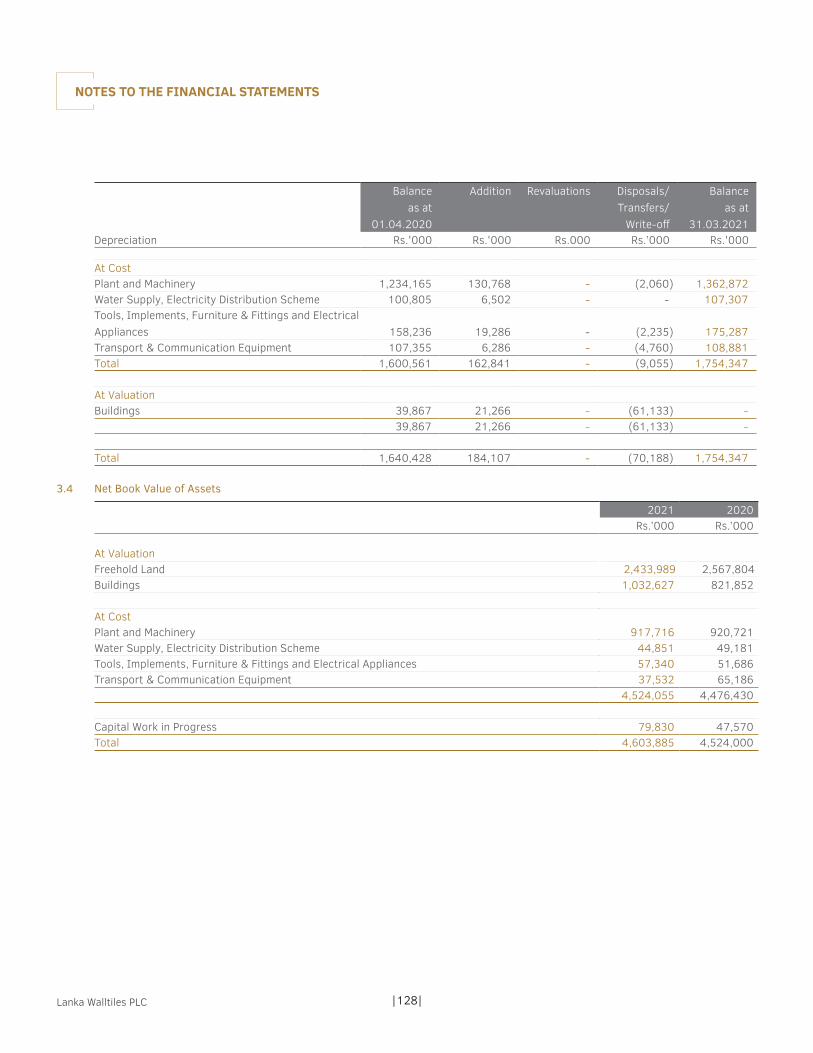
|128|Lanka Walltiles PLC
Balanceas at
01.04.2020
Addition Revaluations Disposals/Transfers/
Write-off
Balanceas at
31.03.2021Depreciation Rs.'000 Rs.'000 Rs.000 Rs.’000 Rs.'000
At CostPlant and Machinery 1,234,165 130,768 - (2,060) 1,362,872 Water Supply, Electricity Distribution Scheme 100,805 6,502 - - 107,307 Tools, Implements, Furniture & Fittings and Electrical Appliances 158,236 19,286 - (2,235) 175,287 Transport & Communication Equipment 107,355 6,286 - (4,760) 108,881 Total 1,600,561 162,841 - (9,055) 1,754,347
At ValuationBuildings 39,867 21,266 - (61,133) -
39,867 21,266 - (61,133) -
Total 1,640,428 184,107 - (70,188) 1,754,347
3.4 Net Book Value of Assets
2021 2020Rs.’000 Rs.’000
At Valuation Freehold Land 2,433,989 2,567,804 Buildings 1,032,627 821,852
At Cost Plant and Machinery 917,716 920,721 Water Supply, Electricity Distribution Scheme 44,851 49,181 Tools, Implements, Furniture & Fittings and Electrical Appliances 57,340 51,686 Transport & Communication Equipment 37,532 65,186
4,524,055 4,476,430
Capital Work in Progress 79,830 47,570 Total 4,603,885 4,524,000
NOTES TO THE FINANCIAL STATEMENTS

|129| Annual Report 2020/21
3. PROPERTY, PLANT & EQUIPMENT CONTD.
3.4 Assets At Valuation
3.4.1 The fair value of freehold lands and buildings were determined by means of a revaluation during the financial year 2020/21 in reference to market based evidence and the details of the valuations are indicated below,
Location Extent Valuer Valuation Date
Valuation Details
Significant unobservable input: price per perch/ acre/range
Significant unobservable inputs (Level 3) Rs.000’s
No. 215, Nawala Road, Narahenpita, Colombo 05
A1-R1-P2.1 FRT Valuation Services (Pvt) Ltd
31 March 2021
Market based evidence
Rs. 7,000,000/- per perch
1,414,700
Mr. Ranjan J Samarakone
31 March 2020
Market based evidence
Rs. 7,000,000/- per perch
1,414,700
36,170 Square feet building
FRT Valuation Services (Pvt) Ltd
31 March 2021
Contractor's basis method valuation
Rs.2,000/-to Rs 4,500/- per square feet
135,610
35,990 Square feet building
Mr. Ranjan J Samarakone
31 March 2018
Contractor's basis method valuation
Rs.1,000/-to Rs 3,500/- per square feet
85,281
Plan No 2205 Situated at Mawathgama and Galagedara Village
A25-R1-P37.16 FRT Valuation Services (Pvt) Ltd
31 March 2021
Market based evidence
Rs. 250,000/- per perch
1,019,290
A23-R1-P24.16 Mr. Ranjan J Samarakone
31 March 2020
Market based evidence
Rs. 300,000/- per perch
1,123,200
308,612 Square Feet building
FRT Valuation Services (Pvt) Ltd
31 March 2021
Contractor's basis method valuation
Rs.2,000/-to Rs 6,000/- per square feet
897,017
279,361 Square Feet building
Mr. Ranjan J Samarakone
31 March 2018
Contractor's basis method valuation
Rs.2,000/-to Rs 4,000/- per square feet
726,664
3.5 Right of use Assets
During the financial year 2013, the Company acquired a right to leasehold land to the value of Rs.14.60 Mn for a period of 30 years. which is disclosed in Note 3.10 under Right of use Assets.
3.6 During the financial year, the Company acquired property, plant and equipment to the aggregate value of Rs. 219.24 Mn (2020 - Rs.184.4 Mn). Cash payments amounting to Rs.219.24 Mn (2020 - Rs.184.4 Mn) were made during the year for purchase of Property, Plant and Equipment.
3.7 Fixed assets include fully depreciated assets. The cost of which at the reporting date amounted to Rs. 907.19 Mn (2020 - Rs.841.90 Mn) which are still in use.

|130|Lanka Walltiles PLC
3.8 Investment property
Group Company2021 2020 2021 2020
Rs.'000 Rs.'000 Rs.'000 Rs.’000
Opening balance 816,805 816,805 - - Addition - - - - Net fair value gain recognised in profit or loss (3,186) - - - Closing balance 813,619 816,805 - -
3.8.1 The fair value of freehold lands and buildings were determined by means of an independent revaluation carried out by Chartered valuation surveyors during the financial year 2020/21 in reference to market based evidence and the details of the valuations are indicated below;
Company Location Extent Valuation
Date
Valuer Valuation
Details
Significant
unobservable
input : price per
perch/ acre/
range
Significant
unobservable
inputs (Level 3)
Rs.000’s
LWL
Development
Limited
Agalagedara Village,
Divulapitiya, Gampha
48A-03R-17.9P 31 March
2021
FRT Valuation
Services (Pvt) Ltd
Market based evidence Rs. 8,000,000/-
per Acre
390,900
Waradala Village,
Divulapitiya, Gampha
4A-01R-15.9P 31 March
2021
FRT Valuation
Services (Pvt) Ltd
Market based evidence Rs.5,000,000/-
per Acre
21,800
Agalagedara Village,
Divulapitiya, Gampha
00A-00R-45 P 31 March
2021
FRT Valuation
Services (Pvt) Ltd
Market based evidence Rs.125,000/- per
Perch
5,625
Agalagedara Village,
Divulapitiya, Gampha
00A-00R-6.90 P 31 March
2021
FRT Valuation
Services (Pvt) Ltd
Market based evidence Rs.70,000/- per
Perch
475
Agalagedara Village,
Divulapitiya, Gampha
48A-03R-17.9P 31 March
2020
Mr. Ranjan J
Samarakone
Market based evidence Rs. 8,000,000/-
per Acre
390,895
Waradala Village,
Divulapitiya, Gampha
4A-01R-15.9P 31 March
2020
Mr. Ranjan J
Samarakone
Market based evidence Rs.5,000,000/-
per Acre
21,746
Agalagedara Village,
Divulapitiya, Gampha
00A-00R-45 P 31 March
2020
Mr. Ranjan J
Samarakone
Market based evidence Rs.200,000/- per
Perch
9,000
Agalagedara Village,
Divulapitiya, Gampha
00A-00R-6.90 P 31 March
2020
Mr. Ranjan J
Samarakone
Market based evidence Rs.50,000/- per
Perch
345
Beyond
Paradise
Collection
Limited
Agalagedara Village,
Divulapitiya, Gampha
48A-03R-17.9P 31 March
2021
FRT Valuation
Services (Pvt) Ltd
Market based evidence Rs. 8,000,000/-
per Acre
390,895
House 981.sq.ft 31 March
2021
FRT Valuation
Services (Pvt) Ltd
Market based evidence Rs.4,000/- per
sq.ft
3,924
Agalagedara Village,
Divulapitiya, Gampha
48A-03R-17.9P 31 March
2020
Mr. Ranjan J
Samarakone
Market based evidence Rs. 8,000,000/-
per Acre
390,895
House 981.sq.ft 31 March
2020
Mr. Ranjan J
Samarakone
Market based evidence Rs.4,000/- per
sq.ft
3,924
Significant increases/(decreases) in estimated price per perch/price per square foot in isolation would result in a significantly higher (lower)/fair value..
NOTES TO THE FINANCIAL STATEMENTS

|131| Annual Report 2020/21
3.9 Right of Use Assets/ Lease Liabilities- Company
Set below, are the carrying amounts of the Group’s right if use assets and liabilities and the movements during the period.
Land Building Total Rs. 000 Rs. 000 Rs. 000
Right of Use Asset As at 1 April 2019 11,681 34,702 46,383 Additions - 31,469 31,469 Less: Amortization Expense (487) (19,480) (19,967)As at 31 March 2020 11,194 46,691 57,885
As at 1 April 2020 11,194 46,691 57,885 Additions - - - Less: Amortization Expense (487) (23,613) (24,100)As at 31 March 2021 10,707 23,078 33,785
Lease Liability As at 1 April 2019 - 34,702 34,702 Additions 31,469 31,469 Interest Expense - 4,520 4,520 Less: Payments - (22,434) (22,434)As at 31 March 2020 - 48,257 48,257
As at 1 April 2020 - 48,257 48,257 Interest Expense - 4,526 4,526 Less: Payments - (28,034) (28,034)As at 31 March 2021 - 24,749 24,749
*Net book value of the lease assets presented under Note 3, Property, Plant and Equipment as at 31 March 2019 has been transferred to Right-to-use Assets with the adoption of SLFRS 16-Leases, with effect from 1 April 2019. Prior period amounts has not been restated.
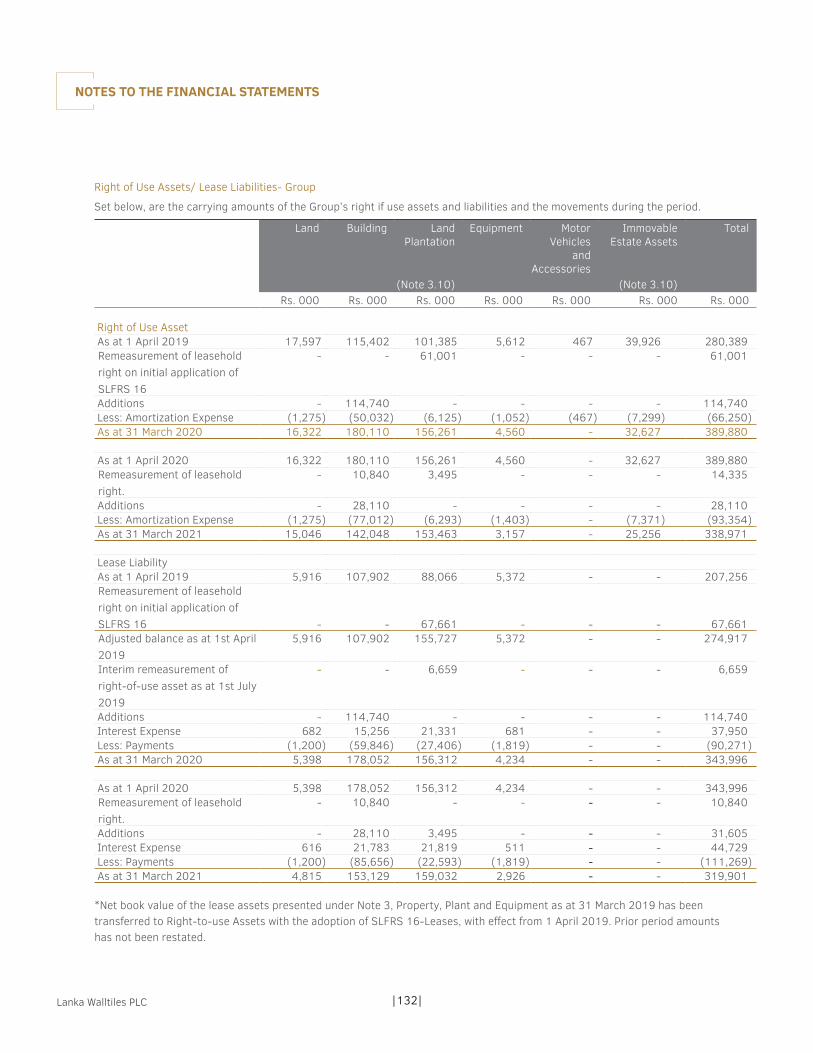
|132|Lanka Walltiles PLC
Right of Use Assets/ Lease Liabilities- Group
Set below, are the carrying amounts of the Group’s right if use assets and liabilities and the movements during the period.
Land Building Land Plantation
Equipment Motor Vehicles
and Accessories
Immovable Estate Assets
Total
(Note 3.10) (Note 3.10) Rs. 000 Rs. 000 Rs. 000 Rs. 000 Rs. 000 Rs. 000 Rs. 000
Right of Use Asset As at 1 April 2019 17,597 115,402 101,385 5,612 467 39,926 280,389 Remeasurement of leasehold right on initial application of SLFRS 16
- - 61,001 - - - 61,001
Additions - 114,740 - - - - 114,740 Less: Amortization Expense (1,275) (50,032) (6,125) (1,052) (467) (7,299) (66,250) As at 31 March 2020 16,322 180,110 156,261 4,560 - 32,627 389,880
As at 1 April 2020 16,322 180,110 156,261 4,560 - 32,627 389,880 Remeasurement of leasehold right.
- 10,840 3,495 - - - 14,335
Additions - 28,110 - - - - 28,110 Less: Amortization Expense (1,275) (77,012) (6,293) (1,403) - (7,371) (93,354) As at 31 March 2021 15,046 142,048 153,463 3,157 - 25,256 338,971
Lease Liability As at 1 April 2019 5,916 107,902 88,066 5,372 - - 207,256 Remeasurement of leasehold right on initial application of SLFRS 16 - - 67,661 - - - 67,661 Adjusted balance as at 1st April 2019
5,916 107,902 155,727 5,372 - - 274,917
Interim remeasurement of right-of-use asset as at 1st July 2019
- - 6,659 - - - 6,659
Additions - 114,740 - - - - 114,740 Interest Expense 682 15,256 21,331 681 - - 37,950 Less: Payments (1,200) (59,846) (27,406) (1,819) - - (90,271) As at 31 March 2020 5,398 178,052 156,312 4,234 - - 343,996
As at 1 April 2020 5,398 178,052 156,312 4,234 - - 343,996 Remeasurement of leasehold right.
- 10,840 - - - - 10,840
Additions - 28,110 3,495 - - - 31,605 Interest Expense 616 21,783 21,819 511 - - 44,729 Less: Payments (1,200) (85,656) (22,593) (1,819) - - (111,269) As at 31 March 2021 4,815 153,129 159,032 2,926 - - 319,901
*Net book value of the lease assets presented under Note 3, Property, Plant and Equipment as at 31 March 2019 has been transferred to Right-to-use Assets with the adoption of SLFRS 16-Leases, with effect from 1 April 2019. Prior period amounts has not been restated.
NOTES TO THE FINANCIAL STATEMENTS

|133| Annual Report 2020/21
The following are the amounts recognised in profit or loss:
Group Company2021 2020 2021 2020
Rs. 000 Rs. 000 Rs. 000 Rs. 000
Amortization expense of right-of-use assets 93,354 66,250 24,100 19,967 Interest expense on lease liabilities 44,729 37,950 4,526 4,520 Expense relating to short-term leases (included in cost of sales) 38,937 30,429 14,313 6,630 Total amount recognised in profit or loss 177,020 134,629 42,939 31,117
Useful lives of Right of Use Lease Asset are estimated at the range of 2-30 years.
Group Company2021 2020 2021 2020
Rs. 000 Rs. 000 Rs. 000 Rs. 000
Lease Liability -Current 31,666 75,888 5,660 23,438 Payable With in One to Five Years 128,370 102,873 19,089 24,819 Payable after Five Years 159,866 165,235 - -
319,902 343,996 24,749 48,257
3.9.1 The leasehold rights to the bare land on all estates (except for Dumbara Estate which is under an operating lease) have been taken into the books of Horana Plantations PLC.(HPPLC), as at 22nd June 1992, immediately after formation of HPPLC, in terms of the opinion obtained from the Urgent Issue Task Force (UITF) of the Institute of Chartered Accountants of Sri Lanka. For this purpose lands have been revalued at Rs.204.931 Mn. being the value established for these lands by Valuation Specialist, D.R.Wickremasinghe just prior to the formation of HPPLC.
3.9.2 In terms of the opinion obtained from the UITF all immovable estate Property, Plant and Equipment under finance leases have been taken into the books of the Company retroactive to 22nd June 1992. For this purpose all estate immovables have been revalued at their book values as they appear in the books of the lessor(JEDB/SLSPC), as the case may be on the day immediately preceding the date of formation of HPPLC.
3.9.3 Investments in Bearer Biological assets which were immature, at the time of handing over to HPPLC by way of estate lease, are shown under Bearer Biological assets - immature (Revalue as at 22.06.1992). Further investments in such a bearer biological assets (Immature to bring them to maturity are shown under “ Note 3.1 (d) Bearer Biological assets (Immature Plantation). When these plantations become mature the additional investment to bring them to maturity will be moved from the Note 3.1 (d) - Bearer Biological assets Immature plantations) to Note 3.1 (d) - Bearer Biological assets Mature Plantations) shown under Note 3.1(d) and corresponding move from bearer biological assets (Immature) to bearer biological assets (Mature) will be made in the above category, namely cost incurred before take over.
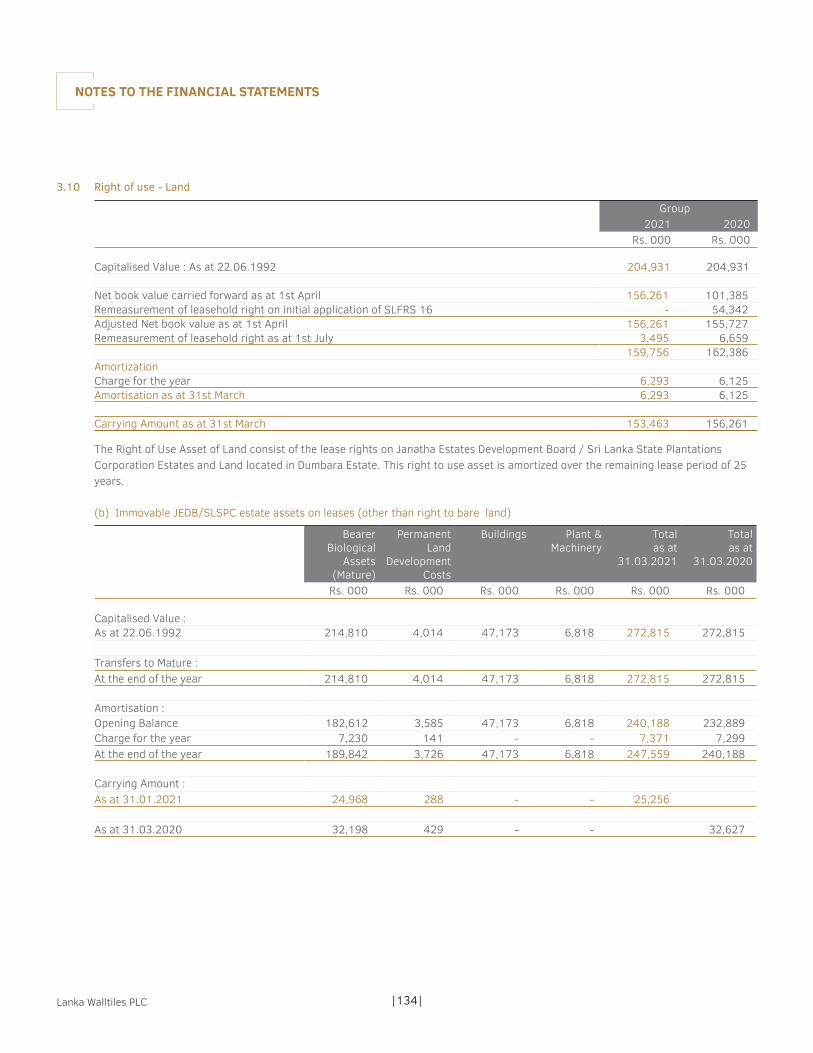
|134|Lanka Walltiles PLC
3.10 Right of use - Land
Group2021 2020
Rs. 000 Rs. 000
Capitalised Value : As at 22.06.1992 204,931 204,931
Net book value carried forward as at 1st April 156,261 101,385 Remeasurement of leasehold right on initial application of SLFRS 16 - 54,342 Adjusted Net book value as at 1st April 156,261 155,727 Remeasurement of leasehold right as at 1st July 3,495 6,659
159,756 162,386 AmortizationCharge for the year 6,293 6,125 Amortisation as at 31st March 6,293 6,125
Carrying Amount as at 31st March 153,463 156,261
The Right of Use Asset of Land consist of the lease rights on Janatha Estates Development Board / Sri Lanka State Plantations Corporation Estates and Land located in Dumbara Estate. This right to use asset is amortized over the remaining lease period of 25 years.
(b) Immovable JEDB/SLSPC estate assets on leases (other than right to bare land)
Bearer Biological
Assets (Mature)
Permanent Land
Development Costs
Buildings Plant & Machinery
Total as at
31.03.2021
Total as at
31.03.2020
Rs. 000 Rs. 000 Rs. 000 Rs. 000 Rs. 000 Rs. 000
Capitalised Value :As at 22.06.1992 214,810 4,014 47,173 6,818 272,815 272,815
Transfers to Mature :At the end of the year 214,810 4,014 47,173 6,818 272,815 272,815
Amortisation :Opening Balance 182,612 3,585 47,173 6,818 240,188 232,889 Charge for the year 7,230 141 - - 7,371 7,299 At the end of the year 189,842 3,726 47,173 6,818 247,559 240,188
Carrying Amount :As at 31.01.2021 24,968 288 - - 25,256
As at 31.03.2020 32,198 429 - - 32,627
NOTES TO THE FINANCIAL STATEMENTS
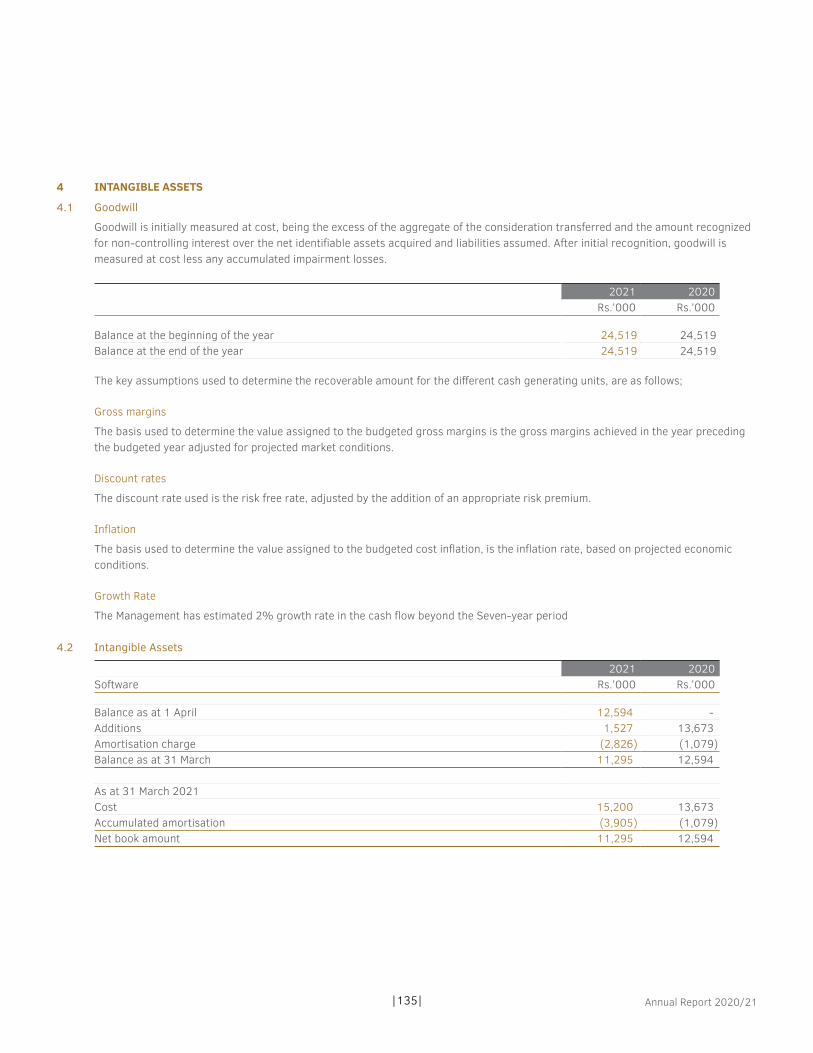
|135| Annual Report 2020/21
4 INTANGIBLE ASSETS
4.1 Goodwill
Goodwill is initially measured at cost, being the excess of the aggregate of the consideration transferred and the amount recognized for non-controlling interest over the net identifiable assets acquired and liabilities assumed. After initial recognition, goodwill is measured at cost less any accumulated impairment losses.
2021 2020Rs.’000 Rs.’000
Balance at the beginning of the year 24,519 24,519 Balance at the end of the year 24,519 24,519
The key assumptions used to determine the recoverable amount for the different cash generating units, are as follows;
Gross margins
The basis used to determine the value assigned to the budgeted gross margins is the gross margins achieved in the year preceding the budgeted year adjusted for projected market conditions.
Discount rates
The discount rate used is the risk free rate, adjusted by the addition of an appropriate risk premium.
Inflation
The basis used to determine the value assigned to the budgeted cost inflation, is the inflation rate, based on projected economic conditions.
Growth Rate
The Management has estimated 2% growth rate in the cash flow beyond the Seven-year period
4.2 Intangible Assets
2021 2020Software Rs.’000 Rs.’000
Balance as at 1 April 12,594 - Additions 1,527 13,673 Amortisation charge (2,826) (1,079)Balance as at 31 March 11,295 12,594
As at 31 March 2021Cost 15,200 13,673 Accumulated amortisation (3,905) (1,079)Net book amount 11,295 12,594

|136|Lanka Walltiles PLC
5 INVESTMENTS IN SUBSIDIARIES
Company Numberof Shares
Holding Cost Market Value/
Directors’Valuation*
Cost MarketValue/
Directors’Valuation*
2021 2020 2021 2020 2021 2021 2020 2020’000 ’000 % % Rs.’000 Rs.’000 Rs.’000 Rs.’000
5.1 Subsidiarya) Quoted
Lanka Tiles PLC 180,945 36,189 68.22 68.22 935,958 6,722,107 935,958 1,813,069 Swisstek (Ceylon) PLC 15,706 3,141 11.48 11.48 41,247 339,255 41,247 84,814 Total Quoted Investment in Subsidiary 977,205 7,061,362 977,205 1,897,883
b) Non-quoted VPML Plantation Management (Pvt) Ltd 10,336 10,336 100.00 100.00 298,891 298,891 298,891 298,891 LWL Development (Pvt) Ltd 0.001 0.001 100.00 100.00 0.001 - 0.001 - LW Plantation Investment Limited 0.001 - 100.00 - 0.001 - - -Total Non-quoted Investments in Subsidiaries 298,891 298,891 298,891 298,891
Total Net Carrying Value of Investments in Subsidiaries 1,276,096 1,276,096
*Non quoted investments of the Company has been valued by the directors based on the cost of investments.
NOTES TO THE FINANCIAL STATEMENTS
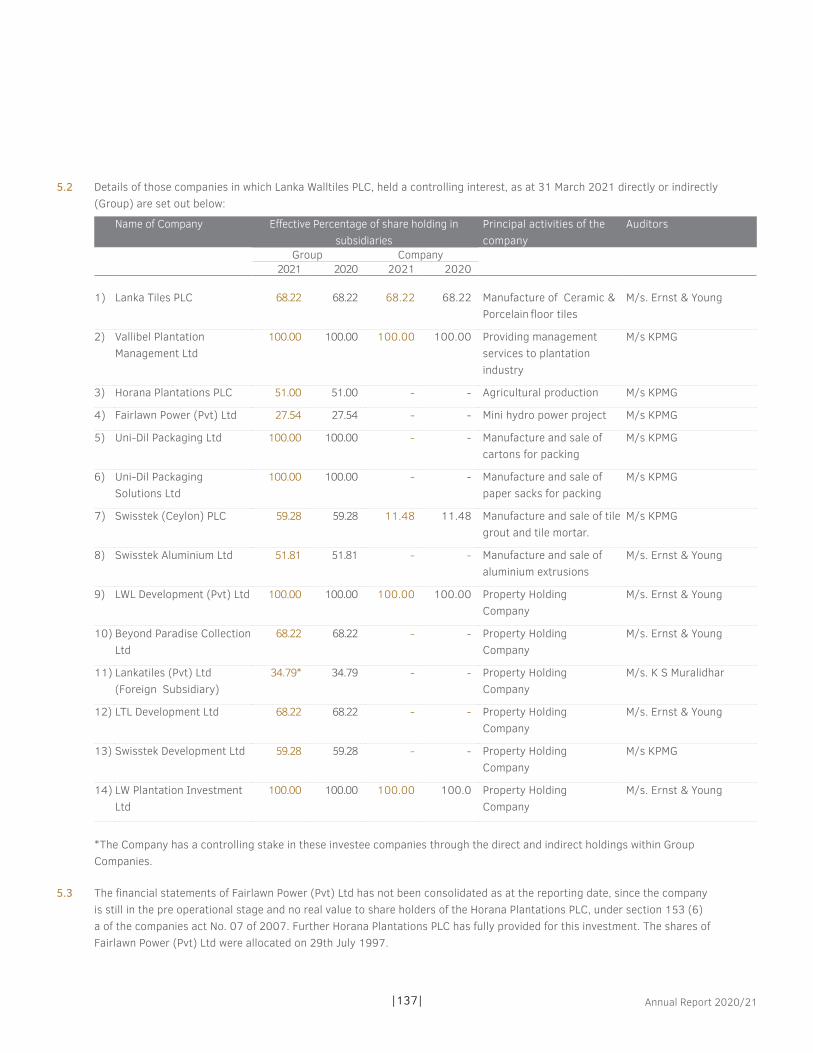
|137| Annual Report 2020/21
5.2 Details of those companies in which Lanka Walltiles PLC, held a controlling interest, as at 31 March 2021 directly or indirectly (Group) are set out below:
Name of Company Effective Percentage of share holding in subsidiaries
Principal activities of the company
Auditors
Group Company2021 2020 2021 2020
1) Lanka Tiles PLC 68.22 68.22 68.22 68.22 Manufacture of Ceramic & Porcelain floor tiles
M/s. Ernst & Young
2) Vallibel Plantation Management Ltd
100.00 100.00 100.00 100.00 Providing management services to plantation industry
M/s KPMG
3) Horana Plantations PLC 51.00 51.00 - - Agricultural production M/s KPMG
4) Fairlawn Power (Pvt) Ltd 27.54 27.54 - - Mini hydro power project M/s KPMG
5) Uni-Dil Packaging Ltd 100.00 100.00 - - Manufacture and sale of cartons for packing
M/s KPMG
6) Uni-Dil Packaging Solutions Ltd
100.00 100.00 - - Manufacture and sale of paper sacks for packing
M/s KPMG
7) Swisstek (Ceylon) PLC 59.28 59.28 11.48 11.48 Manufacture and sale of tile grout and tile mortar.
M/s KPMG
8) Swisstek Aluminium Ltd 51.81 51.81 - - Manufacture and sale of aluminium extrusions
M/s. Ernst & Young
9) LWL Development (Pvt) Ltd 100.00 100.00 100.00 100.00 Property Holding Company
M/s. Ernst & Young
10) Beyond Paradise Collection Ltd
68.22 68.22 - - Property Holding Company
M/s. Ernst & Young
11) Lankatiles (Pvt) Ltd (Foreign Subsidiary)
34.79* 34.79 - - Property Holding Company
M/s. K S Muralidhar
12) LTL Development Ltd 68.22 68.22 - - Property Holding Company
M/s. Ernst & Young
13) Swisstek Development Ltd 59.28 59.28 - - Property Holding Company
M/s KPMG
14) LW Plantation Investment Ltd
100.00 100.00 100.00 100.0 Property Holding Company
M/s. Ernst & Young
*The Company has a controlling stake in these investee companies through the direct and indirect holdings within Group Companies.
5.3 The financial statements of Fairlawn Power (Pvt) Ltd has not been consolidated as at the reporting date, since the company is still in the pre operational stage and no real value to share holders of the Horana Plantations PLC, under section 153 (6)a of the companies act No. 07 of 2007. Further Horana Plantations PLC has fully provided for this investment. The shares of Fairlawn Power (Pvt) Ltd were allocated on 29th July 1997.

|138|Lanka Walltiles PLC
6 LONG TERM RECEIVABLES
GROUP2021 2020
Rs.'000 Rs.'000
Advance company tax receivable - 27,285 Total - 27,285
7 INVESTMENTS IN ASSOCIATES
Group Holding Carrying Value2021 2020 2021 2020
% % Rs.000 Rs.000
Non-quoted InvestmentsC P Holdings (Private) Limited 35.39% - 170,000 -
Movement in Investments in Associates
Group Group Compnay2021 2020 2021 2020
Rs.000 Rs.000 Rs.000 Rs.000
As at the beginning of the year - - - - Investment 170,000 - - - As at end of the year 170,000 - - -
During the year the Group invested in CP Holdings (Pvt) Ltd through its subsidiary Companies namely LTL Development Limited, Swisstek Development Limited and LW Plantation Investment Limited at 16.67% each. Accordingly, the effective investment holding of CP Holding (Pvt) Ltd is 35.39% as at the reporting date.
CP Holdings (pvt) Ltd
Summarised Statement of financial position
As at 31 March 2021 2020Rs.000 Rs.000
Current Assets 22,216 - Non current assets 326,966 -
Current liabilities 9,323 - Non current liabilities - - Net Assets 339,859 -
NOTES TO THE FINANCIAL STATEMENTS

|139| Annual Report 2020/21
8 INVENTORIES
Group Company2021 2020 2021 2020
Rs.'000 Rs.'000 Rs.'000 Rs.’000
Raw materials 3,267,168 2,772,694 284,007 223,646 Work in progress 278,773 314,782 29,425 41,850 Finished goods 2,104,550 6,194,473 633,037 2,093,956 Goods in transit 144,232 360,221 - 908 Consumables and spares 698,118 577,558 504,324 434,145 Harvested crops 206,306 153,484 - - Non-harvested produce on bearer biological assets 7,999 3,361 - - Shading Tree Nurseries 128 - - -Allowances for obsolete and slow moving spares (222,288) (150,154) (40,025) (31,925)Total 6,484,986 10,226,419 1,410,768 2,762,580
Write off/(Write back) during the year (21,542) 8,831 (5,368) 3,459
9 TRADE AND OTHER RECEIVABLES
Group Company2021 2020 2021 2020
Rs.'000 Rs.'000 Rs.'000 Rs.’000
Trade debtors - related parties (9.1) 23,507 29,484 7,018 2,384 - Other 3,188,037 2,857,531 606,185 492,317
3,211,544 2,887,015 613,203 494,701 Less: Allowances for doubtful debts (118,034) (70,715) (11,070) (6,070)
3,093,510 2,816,300 602,133 488,631 Advance and prepayments 611,210 746,068 157,255 112,981 Other debtors & VAT Receivable 506,623 274,308 29,990 62,136 Loans to company officers 35,281 38,511 2,653 10,008 Total 4,246,624 3,875,187 792,031 673,756
Group Company2021 2020 2021 2020
Rs.'000 Rs.'000 Rs.'000 Rs.’000
Allowances for doubtful debtsOpening Balance as at 1 April 70,715 47,134 6,070 4,770Provided during the year 47,319 23,581 5,000 1,300Utilised/reversed during the year - - - - Closing balance as at 31 March 118,034 70,715 11,070 6,070

|140|Lanka Walltiles PLC
9.1 Trade debtors - related parties
Group Company2021 2020 2021 2020
Company Relationship Rs.'000 Rs.'000 Rs.'000 Rs.’000
Lanka Tiles PLC Subsidiary Company - - 6,933 - Lanka Ceramic PLC Affiliated Company 19 4 - - Royal Ceramics Lanka PLC Parent Company 22,221 22,798 - 1,504 Rocell Bathware Ltd Affiliated Company 913 380 - - Singer Sri Lanka PLC Affiliated Company - 152 - - The Kingsbery PLC Affiliated Company - 40 - - Swisteck Aluminium Ltd Subsidiary Company - - - 142 Swisteck Ceylon PLC Subsidiary Company - - - 572 Uni Dil Packaging (Pvt) Ltd Subsidiary Company - - 3 3 MN Properties (Pvt) Ltd Affiliated Company 81 162 82 163Delmage Forsyth & Co.Ltd Affiliated Company 50 3,933 - - Hayleys Agriculture Holdings Limited Affiliated Company - 391 - - Hayleys Agro Fertilizer (Pvt) Ltd Affiliated Company 223 76 - - Kelani Valley Plantations PLC Affiliated Company - 1,500 - - Talawakelle Tea Estates PLC Affiliated Company - 48 - - Total 23,507 29,484 7,018 2,384
9.2 As at 31 March, the ageing analysis of trade receivables are as follows:
Neither past duenor impaired
Past due but not impaired< 3 Months 3- 12 Months > 1 Year Impaired Total
Company Rs.’000 Rs.'000 Rs.'000 Rs.’000 Rs.'000 Rs.’000
2021 545,985 4,125 36,795 15,229 11,069 613,2032020 264,175 101,680 100,759 24,491 3,596 494,701
Neither past duenor impaired
Past due but not impaired< 3 Months 3- 12 Months > 1 Year Impaired Total
Group Rs.’000 Rs.'000 Rs.'000 Rs.’000 Rs.'000 Rs.’000
2021 2,558,770 390,400 93,878 52,012 116,486 3,211,5442020 1,339,255 1,021,578 425,979 87,316 31,471 2,887,015
10 AMOUNTS DUE FROM RELATED PARTIES
Group Company2021 2020 2021 2020
Company Relationship Rs.'000 Rs.'000 Rs.'000 Rs.’000
Lanka Ceramic PLC Affiliated Company 2,210 834 - - Swisstek Aluminium Ltd Subsidiary company - - - 47,682 Rocell Bathware Limited Affiliated Company 12,286 5,299 2,287 1,475 LWL Development (Pvt) Ltd Subsidiary company - - 15,825 15,824 LW Plantation Investment Ltd Subsidiary company - - 52,578 -Royal Ceramics Lanka PLC Parent Company 48,828 42,155 - - Nilano Garments (Pvt) Ltd Affiliated Company - 162 - - Total 63,324 48,450 70,690 64,981
NOTES TO THE FINANCIAL STATEMENTS

|141| Annual Report 2020/21
11 SHORT TERM INVESTMENTS
Group Company2021 2020 2021 2020
Rs.'000 Rs.'000 Rs.'000 Rs.’000
Deposit of Tsunami donations 3,877 3,754 3,877 3,754 Total 3,877 3,754 3,877 3,754
12 STATED CAPITAL
12.1 Issued & fully paid
Group Company2021 2020 2021 2020
Rs.'000 Rs.'000 Rs.'000 Rs.’000
Balance at the beginning of the year 787,765 787,765 787,765 787,765 Balance at the end of the year 787,765 787,765 787,765 787,765
12.2 Issued & fully paid
Group Company2021 2020 2021 2020'000 '000 '000 ’000
Balance at the beginning of the year 54,600 54,600 54,600 54,600 Share Split 218,400 - 218,400 -Balance at the end of the year 273,000 54,600 273,000 54,600
The ordinary shares of the company were subdivided by splitting each issued ordinary share into 05 ordinary shares from 26th March 2021. Consequently the total number of existing issued Ordinary Shares were increased from 54,600,000 to 273,000,000 without changing the Stated Capital of the Company which will remain at Rs. 787,765,000/-.
12.3 The holders of ordinary shares confer their right to receive dividends as declared from time to time and are entitled to one vote per share at a meeting of the Company. All shares rank equally with regard to the Company’s residual assets.
13 RESERVES
Group Company2021 2020 2021 2020
Rs.'000 Rs.'000 Rs.'000 Rs.’000
Revaluation reserve (13.1) 3,541,400 2,850,974 2,057,891 1,812,082 Total 3,541,400 2,850,974 2,057,891 1,812,082
13.1 Revaluation reserve
Group Company2021 2020 2021 2020
Rs.'000 Rs.'000 Rs.'000 Rs.’000
On: Property Plant & EquipmentAs at 01 April 2,850,974 2,850,974 1,812,082 1,812,082 Revaluation of freehold land and building net of differed tax 690,426 - 245,809 - As at 31 March 3,541,400 2,850,974 2,057,891 1,812,082
The above revaluation surplus consists of net surplus resulting from the revaluation of freehold land described in Note 3.1 (k)

|142|Lanka Walltiles PLC
14 INTEREST BEARING LIABILITIES
Group Company2021 2020 2021 2020
Rs.'000 Rs.'000 Rs.'000 Rs.’000
Non CurrentLong term loans (14.1) 2,284,476 2,496,932 20,833 47,917 Lease Liability-Plantation(14.2) 158,217 155,616 - - Lease Liability-Other (Note-3.9) 130,019 112,492 19,089 24,819 Total 2,572,712 2,765,040 39,922 72,735
CurrentLong term loans (14.1) 889,668 932,098 34,340 83,040 Lease Liability-Plantation(14.2) 815 696 - - Lease Liability-Other (Note-3.9) 30,850 75,192 5,660 23,438 Short term loans 2,283,880 4,826,956 100,000 1,291,060 Bank overdrafts (28) 763,739 2,808,210 56,187 817,074 Total 3,968,952 8,643,152 196,187 2,214,611
Total 6,541,664 11,408,192 236,109 2,287,347
14.1 Long term loans
Group Company2021 2020 2021 2020
Rs.'000 Rs.'000 Rs.'000 Rs.’000
At the beginning 3,429,030 3,654,817 130,957 261,014 Loans obtained 645,000 468,963 - - Exchange gain/(loss) 1,734 11,168 - - Repayments (901,620) (705,918) (75,783) (130,057)At the end 3,174,144 3,429,030 55,174 130,957
Amount payable within 12 months 889,668 932,098 34,340 83,040 Amount payable after 12 months 2,284,476 2,496,932 20,833 47,917 Total 3,174,144 3,429,030 55,173 130,957
Short term loansAt the beginning 4,826,956 3,708,776 1,291,060 898,104 Loans obtained 13,403,935 12,356,929 1,871,175 2,449,348 Repayments (15,947,012) (11,238,749) (3,062,235) (2,056,392)At the end 2,283,880 4,826,956 100,000 1,291,060
NOTES TO THE FINANCIAL STATEMENTS

|143| Annual Report 2020/21
14.2 Lease Liabilities to JEDB/SLSPC Estates and Dumbara Land
2021 2020Gross
LiabilityFuture
FinanceCost
NetLiability
GrossLiability
FutureFinance
Cost
NetLiability
Rs.’000 Rs.'000 Rs.'000 Rs.’000 Rs.'000 Rs.’000
Movement :As at 1st April 556,056 (399,744) 156,312 141,227 (53,161) 88,066 Initial remeasurement of lease liability as at 1st April 2019 - - - 418,539 (350,877) 67,661 Adjusted balance as at 1st April 2019 556,056 (399,744) 156,312 559,765 (404,038) 155,727 Interim remeasurement of right-of-use asset as at 1st July 12,159 (8,664) 3,495 23,697 (17,037) 6,659
568,215 (408,407) 159,807 583,462 (421,075) 162,387
Repayments during the year (22,593) - (22,593) (27,406) - (27,406)Interest Expense for the year - 21,819 21,819 - 21,331 21,331 As at 31st March 545,621 (386,589) 159,032 556,056 (399,744) 156,312
Payable as follows :Payable within One Year Payable by due dates 22,593 (21,778) 815 22,107 (21,411) 696
22,593 (21,778) 815 22,107 (21,411) 696
Payable after One Year :- Payable within Two to Five Years 90,910 (85,635) 5,276 88,965 (84,585) 4,380 Payable after Five Years 432,118 (279,177) 152,941 444,984 (293,748) 151,236
523,028 (364,811) 158,217 533,949 (378,333) 155,616
Total Payable 545,622 (386,590) 159,032 556,056 (399,744) 156,312
14.3 The weighted average incremental borrowing rate applied to the lease liabilities was 14.44%.
The rental payable under the JEDB/SLSPC lease is Rs. 5.526 Million per annum until 21st July 2045 and this amount to be inflated annually by Gross Domestic Production (GDP) Deflator. The future liability will be remeasured annually based on the inflated annual lease rental.
The expected rental payable under the Dumbara lease is Rs. 134,125/- per annum from 2022 onwards with an increment of 5% in every five years.

|144|Lanka Walltiles PLC
14.4 Details of long term loans of the Group
Financial Institution
Repayment terms PrincipalRs’000
Interestrateper annum
Security 2021Rs. ‘000
2020Rs. ‘000
Lanka Walltiles PLCCommercial Bank of Ceylon PLC
60 monthly instalments
584,000 AWPLR+0.5% Tripartite agreement for Rs.392.8 Mn between Bank,Lanka Walltiles PLC & the custodian (Pan Asia Bank) over 7,210,000 Shares of Lanka Tiles PLC.
9,340 58,040
DFCC Bank PLC 48 monthly instalments
100,000 AWDR+1% Corporate Guarantee from Lanka Tiles PLC.
45,833 72,917
Company Total - Lanka Walltiles PLC 55,173 130,957
Lanka Tiles PLCDFCC Bank PLC 72 monthly
instalments (12 month Grace period)
AWPLR+0.75% A primary mortgage over land, buildings and plant and machinery located at Ranala amounting to Rs.1500 Mn
1,166,666 1,466,342
Company Total - Lanka Tiles PLC 1,166,666 1,466,342
Uni-Dil Packaging LimitedSCB US $ 114,079
Quarterly instalments USD 310,000
LIBOR+3.8% Primary concurrent Mortgage bond for LKR 170 Mn over Property
54,769 146,306
USD 274.08 USD 770.39 Company Total - Uni-Dil Packaging Limited 54,769 146,306
NOTES TO THE FINANCIAL STATEMENTS

|145| Annual Report 2020/21
Financial Institution
Repayment terms PrincipalRs’000
Interestrateper annum
Security 2021Rs. ‘000
2020Rs. ‘000
Horana Plantations PLCHatton National Bank PLC
72 monthly instalments 150,000 AWPLR + 1.00% Primary mortgage for 550 million over the leasehold rights of Frocester Estate Primary mortgage for 400 million over the leasehold rights of Bambrakelly Estate
19,800 21,900
200,000 AWPLR + 1.00% 50,150 50,150200,000 AWPLR + 0.75% 72,350 73,280250,000 AWPLR + 2.50% 187,600 192,800200,000 AWPLR + 1.75% 195,800 200,000250,000 AWPLR + 1.75% 250,000 -
Hatton National Bank PLC
60 monthly instalments 100,000 AWPLR+0.75% Primary mortgage over leasehold rights of Bambarakelly,Eildon Hall and Frocester Estates.
26,860 28,240
Hatton National Bank PLC
60 monthly instalments 130,114 AWPLR+1.5% Primary mortgage over leasehold rights of Bambarakelly Estate
17,352 17,352
Sri Lanka Tea Board
36 monthly instalments,After a 24 months grace period.
33,000 AWPLR+1.0% No security has been offered - 4,583
Industry Distress Financing Facility
36 monthly instalments 46,935 5.00% No security has been offered - 2,796
Commercial Bank of Ceylon PLC
48 monthly instalments,After a 24 months grace period.
100,000 AWPLR + 2.00% Primary Floating Mortgage for Rs.120.00 Million, over the leasehold rights land and buildings of Stockholm Estate.
81,930 90,270
Sampath Bank PLC
72 monthly installments,After a 24 months grace period.
100,000 AWPLR + 1.80% Primary Mortgage for Rs.200 Million, over the leasehold rights land and buildings of Gouravilla Estate.
200,000 200,000
Hatton National Bank PLC
60 monthly instalments 150,000 AWPLR + 1.25% Primary mortgage over leasehold rights of Alton, Bambarakelly,Eildon Hall and Gouravilla
- 150,000
Commercial Bank of Ceylon PLC
60 monthly installments
350,000 8.5%-Fixed Rate Primary mortgage Bond over receivables of Tea sales routed through Forbes and Workers Tea Brokers (pvt) Ltd and Jhon Keels PLC
350,000 -
Seylan Bank PLC 24 monthly installments
15,000 4.00% No security has been offered
11,665 -
Company Total - Horana Plantations PLC 1,463,507 1,031,371

|146|Lanka Walltiles PLC
Financial Institution
Repayment terms
PrincipalRs’000
Interestrateper annum
Security 2021Rs. ‘000
2020Rs. ‘000
Swisstek (Ceylon) PLCDFCC Bank PLC 60 monthly
instalments 110,000 AWPLR+1.25% Mortgage over Land, Building,
Plant & Machinery , Stocks and Book debts owned by Swisstek Aluminium Ltd.
107,599 102,736
Bank of Ceylon 54 monthly instalments
170,000 AWPLR+1.5% Mortgage over immovable property at Balummahara, Imbulgoda
59,490 124,990
Commercial Bank
60 monthly instalments
35,000 AWPLR+1.5% Mortgage over immovable property at Balummahara, Imbulgoda
20,960 24,470
Company Total - Swisstek (Ceylon) PLC 188,049 252,196
Swisstek Aluminium LimitedDFCC Bank PLC 60 monthly
instalments 500,000 AWPR+1.4% Mortgage over land, building,
plant & machinery 233,333 333,333
60 monthly instalments
200,000 AWPR+1.5% Movable Machinery 12,645 63,226
Hatton National Bank PLC
48 monthly instalments
80,000 AWPR+1.5% Simple Receipt - 5,300
Company Total - Swisstek Aluminium Limited 245,978 401,859
NOTES TO THE FINANCIAL STATEMENTS

|147| Annual Report 2020/21
14.5 Fair Value of Financial Assets and Liabilities not Carried at Fair Value Set out below is a comparison, by class, of the carrying amounts and fair values of the Company’s financial instruments that are not
carried at fair value in the Financial Statements. This table does not include the fair values of non–financial assets and non–financial liabilities.
Group Carrying Amount Fair value2021 2020 2021 2020
Rs.'000 Rs.'000 Rs.'000 Rs.’000
Financial AssetsTrade and Other Receivables 3,635,413 3,129,118 3,635,413 3,129,118 Amounts due from related parties 63,324 48,450 63,324 48,450 Contract Assets 40,164 38,079 40,164 38,079 Short term investments 3,877 3,754 3,877 3,754 Cash and cash equivalents 3,034,216 413,243 3,034,216 413,243 Total 6,776,994 3,632,644 6,776,994 3,632,644
Financial LiabilitiesTrade and Other Payables 2,265,572 1,686,536 2,265,572 1,686,536 Contract Liability 85,407 14,843 85,407 14,843 Loans and Borrowings- Current 3,968,952 8,643,152 3,968,952 8,643,152 Loans and Borrowings- Non Current 2,572,712 2,765,040 2,572,712 2,765,040 Total 8,892,643 13,109,571 8,892,643 13,109,571
Company Carrying Amount Fair value2021 2020 2021 2020
Rs.'000 Rs.'000 Rs.'000 Rs.’000
Financial AssetsTrade and Other Receivables 604,787 498,639 604,787 498,639 Amounts due from related parties 70,690 64,981 70,690 64,981 Short term investments 3,877 3,754 3,877 3,754 Cash and cash equivalents 279,697 47,776 279,697 47,776 Total 959,051 615,150 959,051 615,150
Financial LiabilitiesTrade and Other Payables 320,372 344,743 320,372 344,743 Contracrt Liability 30,350 - 30,350 - Loans and Borrowings- Current 196,187 2,214,611 196,187 2,214,611 Loans and Borrowings- Non Current 39,922 72,735 39,922 72,735 Total 586,831 2,632,089 586,831 2,632,089
The following describes the methodologies and assumptions used to determine the fair values for those financial instruments which are not already recorded at fair value in the Financial Statements.
Assets for which Fair Value Approximates Carrying Value For financial assets and financial liabilities that have a short term maturity (original maturities less than a year), it is assumed that
the carrying amounts approximate their fair values.
Majority of the Interest-bearing loans and borrowings balances comprise floating rate instruments therefore fair value of the value due to banks approximate to the carrying value as at the reporting date.
Fixed Rate Financial Instruments In fair valuing financial assets and financial liabilities with fixed rate , Average Weighted Primary Lending rates published by the CBSL
were used.

|148|Lanka Walltiles PLC
15 DEFERRED TAX LIABILITIES
Group Company2021 2020 2021 2020
Rs.'000 Rs.'000 Rs.'000 Rs.’000
At the beginning of the year 2,421,476 2,341,613 967,884 989,442 Reclasification from deferred tax assets - (847) - - Charge/ (Reversal) Recognised in Profit or Loss ( Note 25.2)
- Arising on During the Year Movement 106,465 87,512 (16,028) (18,766)- Due to Change in Tax Rates (413,772) - (130,191) -
Charge/ (Reversal) Recognised in Other Comprehensive Income (Note 25.2)
- Arising on During the Year Movement 96,292 (6,801) 7,230 (2,792)- Due to Change in Tax Rates (330,823) - (205,112) -
At the end 1,879,638 2,421,476 623,783 967,884
15.1 Statement of Financial Position
Group Company2021 2020 2021 2020
Rs.'000 Rs.'000 Rs.'000 Rs.’000
Deferred Tax LiabilityCapital Allowances 1,458,610 1,930,058 268,722 426,459 Revaluation surplus 761,534 989,933 396,079 592,076 Revaluation surplus on Investment Property 84,582 99,577 - - Lease Liability 2,579 1,167 - -
Deferred Tax Assets Retirement Benefit Liability (184,421) (199,543) (31,667) (40,013)Carried Forward Tax Losses (189,619) (346,635) - - Provision for Obsolete and Slow Moving, Consumables and Spares (46,146) (38,879) (7,325) (8,939)Allowances for Doubtful Debts (7,481) (14,202) (2,026) (1,699)Total 1,879,638 2,421,476 623,783 967,884
16 RETIREMENT BENEFIT LIABILITY
Group Company2021 2020 2021 2020
Rs.'000 Rs.'000 Rs.'000 Rs.’000
At the Beginning of the Year 1,004,063 913,408 142,902 118,746
Current service cost 80,353 73,811 12,551 13,062 Net interest on the net defined benefit liability (asset) 97,594 93,398 14,290 10,050
177,947 167,209 26,551 23,112
Net Actuarial Gain / loss for the year 29,951 35,285 10,305 9,970 Payments made during the Year (113,724) (111,839) (6,717) (8,926)
(83,773) (76,554) 3,588 1,044
Payable for retired employees included under current liabilities (26,762) (28,130) - -
At the End of the Year 1,071,475 975,933 173,041 142,902
NOTES TO THE FINANCIAL STATEMENTS

|149| Annual Report 2020/21
Lanka Walltiles PLC - Company
In order to illustrate the significance of the salary escalation rates and discount rates assumed in this valuation a sensitivity analysis for all employees in Lanka Walltiles PLC is as follows;
2021 2020Rs. 000 Rs. 000
Discount Rate as at 31 March Effect on DBO due to decrease in the discount rate by 1% 14,394 9,563 Effect on DBO due to increase in the discount rate by 1% (12,591) (8,540)
Salary Escalation Rate as at 31 March Effect on DBO due to decrease in the salary escalation rate by 1% (12,421) (9,049)Effect on DBO due to increase in the salary escalation rate by 1% 13,891 9,965
Lanka Walltiles PLC - Group
In order to illustrate the significance of the salary escalation rates and discount rates assumed in this valuation a sensitivity analysis for all employees of Lanka Walltiles PLC, Lanka Tiles PLC, Horana Plantation PLC ,Swisteck Ceylon PLC, Swisteck Alluminium Limited, Uni Dil Packaging (Pvt) Ltd and Uni Dil packaging Solutions (Pvt) Ltd is as follows;
2021 2020Rs. 000 Rs. 000
Discount Rate as at 31 March Effect on DBO due to decrease in the discount rate by 1% 82,868 72,161 Effect on DBO due to increase in the discount rate by 1% (86,817) (63,258)
Salary Escalation Rate as at 31 March Effect on DBO due to decrease in the salary escalation rate by 1% (84,216) (47,087)Effect on DBO due to increase in the salary escalation rate by 1% 80,603 50,997
Lanka Walltiles PLC - Company
Distribution of Present value of define benefit obligation
Less than a year
Between 1-2 years
Between 2- 5 years
Over year 5 Total
As at 31 March 2021Defined Benefit Obligation 23,117 19,035 32,442 98,448 173,041
Group
Distribution of Present value of define benefit obligation
Less than a year
Between 1-2 years
Between 2- 5 years
Over year 5 Total
As at 31 March 2021Defined Benefit Obligation 167,093 94,080 202,352 607,951 1,071,475

|150|Lanka Walltiles PLC
16 RETIREMENT BENEFIT LIABILITY CONTD.
Lanka Walltiles PLC
The defined benefit liability as of 31 March 2021 was actuarially valued by Messrs. Actuarial and Management Consultants (Pvt) Ltd. qualified actuary.
The principal assumptions underlying the valuation are as follows;
2021 2020
Discount rate (per annum) 7.00% 10.00%Salary scale (per annum) - Executives 9.70% 12.50% - Non Executives 10.00% 10.00%
Retirement Age 55 Years 55 YearsStaff Turnover ratio 7% up to
49 years, thereafter 0%
7% up to 49 years,
thereafter 0%Weighted Average duration of defined benefit obligation (Years) 8.25 6.89
Lanka Tiles PLC
The defined benefit liability of Lanka Tiles PLC was actuarially valued by Messrs.Actuarial and Management Consultants (Pvt) Ltd qualified actuary on 31 March 2021.
Principal Actuarial Assumptions are as follows
2021 2020
Discount rate 7.00% 10.00%Future salary increases - Executives 8.60% 12.50% - Non Executives 10.00% 10.00%
55 Years 55 YearsIn addition to above, demographic assumptions such as mortality, withdrawal disability and retirement age were considered for the actuarial valuation.Weighted Average duration of defined benefit obligation (Years) 5.76 4.90
Horana Plantations PLC
An Actuarial Valuation of the retirement benefit obligation was carried out as at 31st March 2021 by Mr.M. Poopalanathan, Actuarial & Management Consultants (Pvt) Ltd.
The valuation method used by the actuaries to value the benefit is the “Project Unit Credit (PUC) Method”, the method recommended by the Sri Lanka Accounting Standards (LKAS) No.19 “Employee Benefits”.
NOTES TO THE FINANCIAL STATEMENTS

|151| Annual Report 2020/21
Principal Actuarial Assumptions are as follows
2021 2020
Rate of interest 8% 10%Rate of salary increase
Workers 5.68% per annum 15.00% for every two years beyond
Staff 8% per annum 12.50% for first three years & 2.00% per annum beyond
Head Office Staff 8% per annum 10.00% per annum beyondRetirement age
Workers 60 years 60 yearsStaff 60 years 60 yearsHead Office Staff 55 years 55 years
Weighted Average duration of defined benefit obligation (Years) Staff 9.83 8.56 Workers 9.31 8.97
Uni Dil Packaging Ltd and Uni Dil Packaging Solution Ltd
Messrs. Actuarial and Management Consultants (Pvt) Ltd., actuaries carried out an actuarial valuation for Uni Dil Packaging Ltd and Uni Dil Packaging Solution Ltd of the defined benefit plan gratuity as at 31 March 2021.
The valuation method used by the actuaries to value the benefit is the “projected Unit Credit Method”.
2021 2020
Discount rate p.a 8.00% 10.00%Rate of salary increase 10.00% 10.00%Staff turnover factor 7.00% 9.00%Retirement age (Years) 55 55The Company will continue as a going concern.
Weighted Average duration of defined benefit obligation (Years) Uni Dil Packaging Ltd 6.60 5.69 Weighted Average duration of defined benefit obligation (Years) Uni Dil Packaging Solution Ltd 8.07 7.19

|152|Lanka Walltiles PLC
16 RETIREMENT BENEFIT LIABILITY CONTD.
Swisstek (Ceylon) PLC
Gratuity liability based on the actuarial valuation carried out by Messrs Actuarial and Management (Pvt) Ltd on 31 March 2021.
2021 2020
Principal Actuarial Assumptions are as followsDiscount rate p.a 7.00% 10%Rate of salary increase 11.00% 11%Retirement age (Years) 55 55
Weighted Average duration of defined benefit obligation (Years) 8.59 7.55
Swisstek Aluminium Limited
Gratuity liability based on the actuarial valuation carried out by Messrs Actuarial and Management (Pvt) Ltd on 31 March 2021.
2021 2020
Principal Actuarial Assumptions are as followsDiscount rate p.a 7.00% 11.00%Rate of salary increase 10.00% 10.00%Retirement age (Years) 55 55
Weighted Average duration of defined benefit obligation (Years) 6.31 5.78
17 CAPITAL GRANTS
Group2021 2020
Rs.'000 Rs.’000
Capital grants (17.1) 118,995 122,832Total 118,995 122,832
NOTES TO THE FINANCIAL STATEMENTS
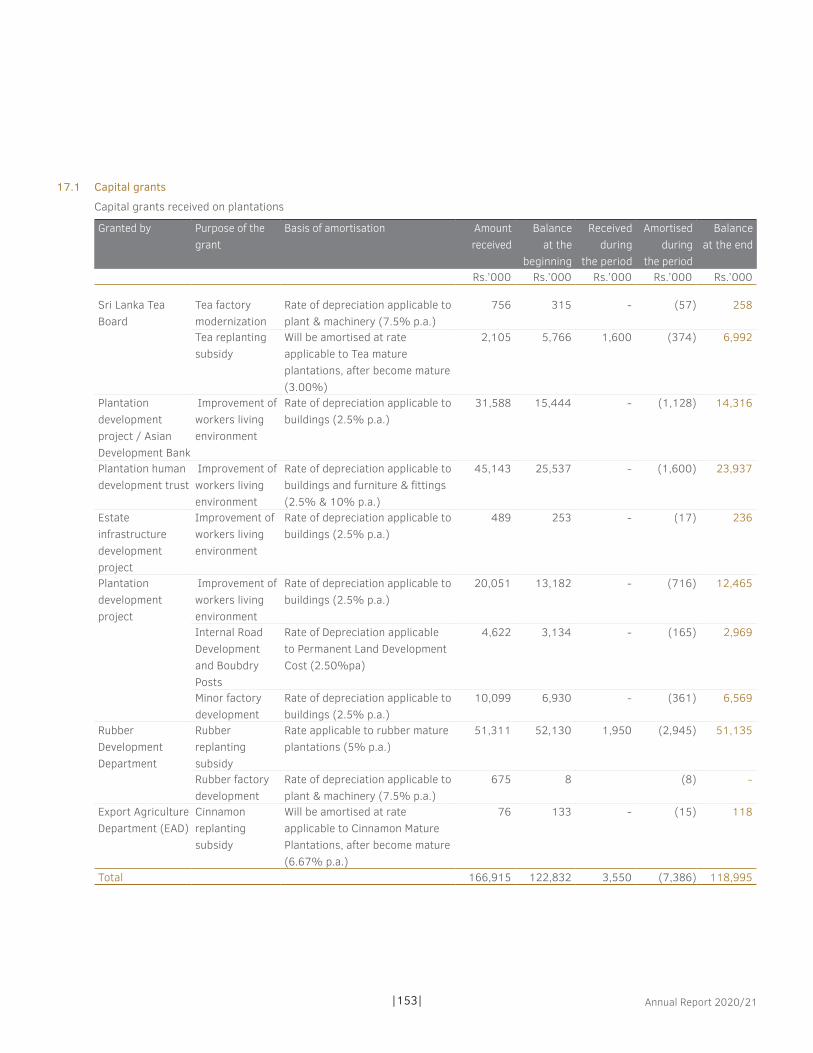
|153| Annual Report 2020/21
17.1 Capital grants
Capital grants received on plantations
Granted by Purpose of thegrant
Basis of amortisation Amount received
Balance at the
beginning
Received during
the period
Amortised during
the period
Balanceat the end
Rs.’000 Rs.’000 Rs.’000 Rs.’000 Rs.’000
Sri Lanka Tea Board
Tea factory modernization
Rate of depreciation applicable to plant & machinery (7.5% p.a.)
756 315 - (57) 258
Tea replanting subsidy
Will be amortised at rate applicable to Tea mature plantations, after become mature (3.00%)
2,105 5,766 1,600 (374) 6,992
Plantation development project / Asian Development Bank
Improvement of workers living environment
Rate of depreciation applicable to buildings (2.5% p.a.)
31,588 15,444 - (1,128) 14,316
Plantation human development trust
Improvement of workers living environment
Rate of depreciation applicable to buildings and furniture & fittings (2.5% & 10% p.a.)
45,143 25,537 - (1,600) 23,937
Estate infrastructure development project
Improvement of workers living environment
Rate of depreciation applicable to buildings (2.5% p.a.)
489 253 - (17) 236
Plantation development project
Improvement of workers living environment
Rate of depreciation applicable to buildings (2.5% p.a.)
20,051 13,182 - (716) 12,465
Internal Road Development and Boubdry Posts
Rate of Depreciation applicable to Permanent Land Development Cost (2.50%pa)
4,622 3,134 - (165) 2,969
Minor factory development
Rate of depreciation applicable to buildings (2.5% p.a.)
10,099 6,930 - (361) 6,569
Rubber Development Department
Rubber replanting subsidy
Rate applicable to rubber mature plantations (5% p.a.)
51,311 52,130 1,950 (2,945) 51,135
Rubber factory development
Rate of depreciation applicable to plant & machinery (7.5% p.a.)
675 8 (8) -
Export Agriculture Department (EAD)
Cinnamon replanting subsidy
Will be amortised at rate applicable to Cinnamon Mature Plantations, after become mature (6.67% p.a.)
76 133 - (15) 118
Total 166,915 122,832 3,550 (7,386) 118,995

|154|Lanka Walltiles PLC
18 TRADE AND OTHER PAYABLES
Group Company2021 2020 2021 2020
Rs.'000 Rs.'000 Rs.'000 Rs.’000
Trade creditors - other 2,080,236 1,516,306 245,399 220,728 - related parties [18.1] 98,313 99,342 14,714 81,257
2,178,549 1,615,648 260,113 301,985 Sundry creditors including accrued expenses 1,769,157 1,098,586 315,391 138,523 Provision for terminal benefits (current) [16.0] 26,762 28,130 - - Donations in respect of Tsunami fund 3,877 3,754 3,877 3,754 Unclaimed dividends 56,383 39,004 56,382 39,004 Total 4,034,728 2,785,122 635,763 483,266
18.1 Trade creditors - related parties
Group Company2021 2020 2021 2020
Company Relationship Rs.'000 Rs.'000 Rs.'000 Rs.’000
Lanka Ceramic PLC Affiliated Company 13,195 25,991 - 9,324 Royal Ceramics Lanka PLC Parent Company 6,549 41 - - Hayleys Agriculture Holding Affiliated Company 1,269 472 - - Hayleys Agro Fertilizer (Pvt) Ltd Affiliated Company 645 2,519 - - Hayleys Business Solutions International (Pvt) Ltd Affiliated Company 13 - - - Hayleys PLC Affiliated Company 13,358 19,493 - - The Kingsbery PLC Affiliated Company - 16 Diesel & Motor Engineering PLC Affiliated Company - 27 - - Kelani Valley Plantations PLC Affiliated Company 2,350 652 - - Talawakelle Tea Estates PLC Affiliated Company 217 - - - Puritas (Pvt) Ltd Affiliated Company 13 19 - - Logiwiz Limited Affiliated Company 3 - - - Lanka Tiles PLC Subsidiary Company - - - 67,420 Swisstek Aluminium Limited Subsidiary Company - - 255 Unidil Packaging Solution Ltd Subsidiary Company - - 14,459 4,513 Valibel One PLC Ultimate Parent Company 60,701 50,112 - -
98,313 99,342 14,714 81,257
NOTES TO THE FINANCIAL STATEMENTS

|155| Annual Report 2020/21
18.3 Contract Assets
Group Company2021 2020 2021 2020
Rs.'000 Rs.'000 Rs.'000 Rs.’000
As at 1st April 38,079 58,269 - - During the year recognized 2,085 (20,190) - - As at 31st March 40,164 38,079 - -
The contract assets primarily relate to company’s rights to consideration for work completed but not billed at the reporting date on supply of timber. The contract assets are transferred to receivables when the rights become unconditional. This usually occurs when the Company issues an invoice to the customer.
18.4 Contract Liabilities
Group Company2021 2020 2021 2020
Rs.'000 Rs.'000 Rs.'000 Rs.’000
As at 1st April 14,843 79,177 - - Advance received 85,407 - 30,350 - During the year recognized (14,843) (64,334) - - As at 31st March 85,407 14,843 30,350 -
The contract liability primarily relates to the advance consideration received from customers for Supply of tiles, timber and installation of timber flooring, for which revenue is recognized overtime. This will be recognized as revenue when the company issues an invoice to the customer, which is expected to occur over the next year.
19 AMOUNTS DUE TO RELATED PARTIES
Group Company2021 2020 2021 2020
Company Relationship Rs.'000 Rs.'000 Rs.'000 Rs.’000
Lanka Tiles PLC Subsidiary Company - - 47,646 122,832 Swisstek Ceylon PLC Subsidiary Company - - 682 4,305 Swisstek Aluminium (Pvt) Ltd Subsidiary Company - - 1,424 - Royal Ceramics Lanka PLC Parent Company 29,367 56,153 10,928 9,139 Lanka Ceramic PLC Affiliated Company 3,202 3,213 3,202 3,213 Vallibel One PLC Ultimate Parent Company 51,288 29,437 15,996 6,554 Delmage Forsyth & Co. Ltd. Affiliated Company 2,100 2,100 - - Total 85,957 90,903 79,878 146,043

|156|Lanka Walltiles PLC
20 REVENUE
20.1 Disaggregated revenue information
Set out below is the disaggregation of the Company’s/ Group’s revenue from contracts with customers:
Revenue from Contracts with Customers
Group Company Year ended 31st March 2021 2020 2021 2020
Rs.'000 Rs.'000 Rs.'000 Rs.’000
Types of goods or serviceSale of Tiles & Associated Items 19,329,845 11,077,653 5,988,521 3,493,619 Sale of Plantation Produce 2,125,306 1,762,154 - - Sale of Packing Materials 4,074,409 3,854,957 - - Sale of Aluminium Products 3,893,821 3,234,945 - - Total revenue from contract with customers 29,423,381 19,929,709 5,988,521 3,493,619
Geographical marketsLocal 28,388,378 19,190,151 5,324,188 2,862,683 Foreign - Export 1,035,003 739,558 664,333 630,936 Total revenue from contract with customers 29,423,381 19,929,709 5,988,521 3,493,619
Timing of revenue recognitionGoods transferred at a point in time 29,423,381 19,929,709 5,988,521 3,493,619 Total revenue from contract with customers 29,423,381 19,929,709 5,988,521 3,493,619
Segmental information is given in Note 33 to the financial statements.
20.2 Contract balances
Group Company2021 2020 2021 2020
Rs.'000 Rs.'000 Rs.'000 Rs.’000
Trade and other receivables (Note 09) 4,246,624 3,875,187 792,031 673,756 Contract assets (Note 18.3) 40,164 38,079 - - Contract liability (Note 18.4) 85,407 14,843 30,350 -
NOTES TO THE FINANCIAL STATEMENTS

|157| Annual Report 2020/21
21 OTHER INCOME
Group Company2021 2020 2021 2020
Rs.'000 Rs.'000 Rs.'000 Rs.’000
Income from investments in related Parties - Dividend - - 747,572 - Rental income - Related parties - - 24,011 24,828 Amortisation of capital and revenue grants - Related parties 7,386 6,800 - - Profit/(Loss) on sale of property, plant and equipment 7,668 (197) 763 (51)Change in fair value of consumable biological assets 40,089 56,693 - - Sundry income 125,126 93,978 7,963 3,831 Exchange gain 51,637 8,215 43,677 8,215 Total 231,906 165,489 823,986 36,823
22 FINANCE COST
Group Company2021 2020 2021 2020
Rs.'000 Rs.'000 Rs.'000 Rs.’000
Interest expense on overdrafts 140,233 175,423 27,980 63,411 Interest expense on bank loans 610,863 999,012 98,432 152,146 Finance charges on lease liabilities 44,729 37,950 4,526 4,520 Exchange loss 15,453 18,728 - - Less : Capitalisation of borrowing costs on immature plantations (41,390) (59,732) - - Total 769,888 1,171,381 130,938 220,077
23 FINANCE INCOME
Group Company2021 2020 2021 2020
Rs.'000 Rs.'000 Rs.'000 Rs.’000
Interest income 20,814 1,837 - - Total 20,814 1,837 - -

|158|Lanka Walltiles PLC
24 PROFIT BEFORE TAX
Is stated after Charging /(Crediting)
Group Company2021 2020 2021 2020
Rs.'000 Rs.'000 Rs.'000 Rs.’000
Included in cost of salesDepreciation and Amortization cost 934,002 906,019 165,390 165,880 Amortization of Right of use Lease Asset 21,524 14,943 - -Defined benefit plan costs - gratuity 131,080 130,545 13,275 13,372 Defined contribution plan costs - EPF & ETF 240,474 231,277 29,751 27,710 Other staff cost 2,537,211 2,223,281 364,592 341,071 Inventory written off and allowances 31,144 23,291 8,100 3,459
Included in administration expensesDepreciation and Amortization cost 60,263 40,760 12,239 11,336 Amortization of Right of use Lease Asset 9,649 4,822 - -Defined benefit plan costs - gratuity 52,578 34,789 11,724 9,714 Defined contribution plan costs - EPF & ETF 35,024 31,279 5,921 4,624 Other staff cost 331,396 260,371 45,404 36,568 Audit Fee 7,990 7,628 1,680 1,579 Technical Fee 290,720 129,476 47,940 28,023
Included in distribution costDepreciation and Amortization cost 16,076 13,255 6,478 4,794 Amortization of Right of use Lease Asset 62,181 46,485 24,100 19,967 Defined benefit plan costs - gratuity 6,972 4,431 1,552 - Defined contribution plan costs - EPF & ETF 19,619 17,275 6,714 6,025 Other staff cost 270,869 183,697 97,344 62,995 Allowance for doubtful Debts 47,319 18,187 5,000 1,300
NOTES TO THE FINANCIAL STATEMENTS

|159| Annual Report 2020/21
25 INCOME TAX EXPENSES
25.1 The major components of income tax expense are as follows ;
Group CompanyYear ended 31st March 2021 2020 2021 2020
Rs.'000 Rs.'000 Rs.'000 Rs.’000
(a) Current income tax Current income tax charge 885,089 278,618 277,324 36,127 Under/(over) provision of current taxes in respect of prior years (34,318) 7,054 6,907 3,738 Economic Service Charge (non-claimable) 25,557 12,600 - - Tax effect on inter company dividends - 3,243 - -
876,328 301,515 284,231 39,865 (b) Deferred income tax Deferred taxation charge/(reversal) (307,306) 87,512 (146,218) (18,766)Income tax expense reported in the Income statement 569,022 389,027 138,013 21,099
(c) Deferred tax expense reported in the OCI (234,531) (6,801) (197,882) (2,792)Total 334,491 382,226 (59,869) 18,307
25.2 Reconciliation between current tax expense and the product of accounting profit.
Group CompanyYear ended 31st March 2021 2020 2021 2020
Rs.'000 Rs.'000 Rs.'000 Rs.’000
Accounting profit before income tax 4,582,442 803,675 1,755,531 59,124 Income considered as separate source of income 33,227 37,273 771,582 24,828 Income exempt from tax - (19,922) - - Non deductible expenses 1,555,248 1,327,855 257,573 246,564 Deductible expenses (2,431,745) (1,593,912) (1,707,616) (201,491)Total Statutory Income 3,739,172 554,969 1,077,070 129,025 Tax losses utilised (511,558) (66,751) - - Net Taxable profit 3,227,614 488,218 1,077,070 129,025
Taxable Profit 3,259,953 1,091,398 1,077,070 129,025 Taxable Loss (32,340) (603,180) - - Net Taxable profit 3,227,614 488,218 1,077,070 129,025
Current income tax expense Taxation -14% 155,492 - 92,995 - Taxation -18% 622,003 3,231 154,221 - Taxation -24% 107,594 - 30,108 - Taxation -28% - 275,387 - 36,127 Total 885,089 278,618 277,324 36,127

|160|Lanka Walltiles PLC
Deferred income tax reported in income statement
Group CompanyYear ended 31st March 2021 2020 2021 2020
Rs.'000 Rs.'000 Rs.'000 Rs.’000
Capital Allowances (486,446) 80,019 (157,739) (14,430)Retirement Benefit Liability 21,256 (13,331) 10,232 (3,972)Carried Forward Tax Losses 158,432 31,159 - - Lease Liability (4) 1,167 - - Provision for Obsolete and Slow Moving, Consumables and Spares 2,241 (6,070) 1,614 - Allowances for Doubtful Debts (2,786) (5,432) (326) (364)Deferred taxation charge/(reversal) (307,307) 87,512 (146,219) (18,766)
Deferred income tax reported in other comprehensive incomeRevaluation Surplus (228,399) - (195,997) - Retirement Benefit Liability (6,132) (6,801) (1,885) (2,792)Total (234,531) (6,801) (197,882) (2,792)
Effective Income Tax Rate 12.42% 48.41% 7.86% 35.69%
Horana Plantation PLC
The deferred tax asset has been recognised in the Financial Statements to the extent that it is probable that future taxable profit will be available against which the accumulated tax losses can be utilized. Therefore, the tax asset arising from accumulated tax losses carried forward was limited only to the extent of existing temporary differences as at 31st March 2021. The unutilized tax losses considered for the deferred tax is based on the probable future taxable profits available against which the Company can utilize therefrom. Hence a deferred tax asset of Rs. 84,054,541/- has not been recognised in respect of unutilized tax losses of Rs. 600,389,581/- as at 31st March 2021.
25.3 Notes on income tax of Group companies
Lanka Walltiles PLC, Lankla Tiles PLC, Vallibel Plantation Management Ltd, Unidil Packaging (Private) Limited and Swisstek (Ceylon) PLC
The statutory tax rate of above companies are as follows;
2021 2020
Local sales and other profits 24% & 18% 28%Qualified export profit 14% 28%Specified profits 20%/14% 20%/14%
Swisstek Aluminium Ltd
Income tax exemption given for the Swisstek Aluminium Ltd has been ended by 01st September 2016 and company liable to pay tax at a rate of 20% on trade profit and 24% on other income.
Horana Plantations PLC
Profit from Agricultural business will be taxed at rate of 14% as per the Inland Revenue Act No. 24 of 2017. Other income will be taxed at the rate of 24%.
Gains and profits earned or derived from the sale of produce of an undertaking for agro farming without subjecting such produce to any process of production or manufacture are exempted within the period of five years of assessment commencing on April 1, 2019. Further, Agro Processing and Other Income liable at the rates of 14% and 24% respectively.
NOTES TO THE FINANCIAL STATEMENTS

|161| Annual Report 2020/21
26 EARNINGS PER SHARE
26.1 Earnings per share - basic
BasicearningspershareiscalculatedbydividingthenetprofitfortheyearattributabletoordinaryshareholdersofLankaWalltilesPLCbytheweightedaveragenumberofordinarysharesoutstandingduringtheyear.
Theweightedaveragenumberofordinarysharesoutstandingduringtheyearandthepreviousyearareadjustedforeventsthathavechangedthenumberofordinarysharesoutstandingwithoutacorrespondingchangeintheresourcessuchasabonusissue.
Thefollowingreflectstheincomeandsharedatausedinthebasicearningspersharecomputations.
Group Company2021 2020 2021 2020
Rs.'000 Rs.'000 Rs.'000 Rs.’000
Amountsusedasthenumerator:Profitattributabletoequityholdersforbasicearningspershare 2,960,211 405,115 1,617,518 38,026
Group Company2021 2020 2021 2020'000 '000 '000 ’000
Numberofordinarysharesusedasthedenominator:Weightedaveragenumberofordinarysharesinissueapplicabletobasic earnings per share
273,000 273,000 273,000 273,000
Adjustedbasicearningspershare(Rs) 10.84 1.48 5.92 0.14
*Basicearningspershareof2020havebeenrestatedbasedonthepostsubdivisionweightedaveragenumberofordinarysharesasat31stMarch2021.
27 DIVIDENDS PAID
Group Company2021 2020 2021 2020
Rs.'000 Rs.'000 Rs.'000 Rs.’000
Declared and paid during the yearEquitydividendsonordinaryshares:
FirstInterim2020/21(Rs.3.60pershare) 196,560 - 196,560 - SecondInterim2020/21(Rs.10.00pershare) 546,000 - 546,000 - Total 742,560 - 742,560 -
DividendPayoutRatio(%) 25% 0% 46% 0%

|162|Lanka Walltiles PLC
28. CASH AND CASH EQUIVALENTS Components of cash and cash equivalents
Group Company2021 2020 2021 2020
Rs.'000 Rs.'000 Rs.'000 Rs.’000
Favourable cash & cash equivalents balanceCash & bank balances 3,034,216 413,243 279,697 47,776
3,034,216 413,243 279,697 47,776
Unfavourable cash & cash equivalent balances Bank overdrafts (14) (763,739) (2,808,210) (56,186) (817,074)
Total cash and cash equivalents for the purpose of cash flow statement
2,270,477 (2,394,967) 223,511 (769,298)
29. ASSETS PLEDGED
Following Assets have been pledged as security for liabilities, in addition to the items disclosed in Note 14.4 to these financial statements.
Lanka Tiles PLC
Bank overdrafts are secured primarily on inventories.
Uni Dil Packaging (Pvt) Ltd
Rs.’000
Import Loan 1 (Hatton National Bank PLC) Immovable Property 110,000Inventories and Debtors 145,000
Import Loan 2 ( Standard Chartered Bank) Land and Building, Immovable Machinery and Debtors 70,000Inventories and Debtors 134,000
Import Loan 3 ( DFCC Bank) Inventories and Debtors 150,000
Uni Dil Packaging Solutions Ltd
Import Loans are secured by Primary on mortgage bond over land and building for Rs. 30 million at Naranpola, Dekatana for the banking facilities of Hatton National Bank PLC and registered primary floating mortgage bond over stock and book debts for Rs. 60 million for the banking facilities of Hong kong & Shanghai Banking corporation.
NOTES TO THE FINANCIAL STATEMENTS

|163| Annual Report 2020/21
Horana Plantations PLC
The following securities were offered for bank overdraft facilities.
Financial Type of Rate of FacilityInstitution Securities Interest Available
Rs.'000
Seylan Bank PLC Mortgage over leasehold rights of Mahanilu Estate and including buildings, fixed and floating assets.
AWPLR+2% (with the floor Rate of 8.5%)
100,000
Commercial Bank of Ceylon PLC Mortgage over leasehold rights of Stockholm Estate and Fairlawn Estate, including buildings, fixed and floating assets.
AWPLR+0.5% (Weekly Review)
250,000
Hatton National Bank PLC Mortgage over leasehold rights of Eildon Hall Estate, including buildings , fixed and floating assets.
AWPLR+0.75% (weekly Review)
150,000
Sampath Bank PLC Primary Mortgage Bond for Rs.100 Million over leasehold rights of Gouravilla Estate.
AWPLR+1.8% (Monthly Review)
100,000
Lanka Walltiles PLC
Hatton National Bank -Rs. 100 bank overdraft is secured primarily on register primary floating mortgage bond for Rs.390 Mn over the project assets comprising of land, building and machinery at Meepe.
Swisstek Aluminium Limited
Financial Type of Rate of FacilityInstitution Securities Interest Available
Rs.'000
Hatton National Bank ( Import Loan) Trading Stock and Trade Debtors AWPLR +0.5% 300,000DFCC Bank(Term loan) Primary mortgage over plant and machinery AWPLR +1.5% 200,000 DFCC Bank(Import loan and Bank Overdrafts
Secondary mortgage over stock and book debtors AWPLR +0.5% 800,000

|164|Lanka Walltiles PLC
30
RELA
TED
PART
Y DI
SCLO
SURE
S
De
tails
of s
igni
fican
t rel
ated
par
ty d
iscl
osur
es a
re a
s fo
llow
s
30.1
C
ompa
ny
Tran
sact
ions
with
the
Pare
nt
and
ultim
ate
Pare
nt C
ompa
ny
(Roy
al C
eram
ic L
anka
PLC
an
d Va
llibe
l One
PLC
)
Tran
sact
ions
with
Su
bsid
iarie
s an
d Affi
liate
Co
mpa
nies
Tota
l
2021
2020
2021
2020
2021
2020
R. '0
00R.
'000
R. '0
00R.
'000
R. '0
00R.
'000
Bala
nce
as a
t 01
April
(1
4,18
9) (2
1,54
2) (1
45,7
45)
(239
,723
) (1
59,9
34)
(261
,265
)
Sale
of T
iles/
(Sal
es re
turn
s) 1
,504
1
,746
6
26
(406
) 2
,130
1
,340
Pu
rcha
se o
f raw
mat
eria
ls -
-
(3
0,19
0) (4
5,09
8) (3
0,19
0) (4
5,09
8)Pu
rcha
se o
f oth
er it
ems
(32,
725)
(106
) (6
4,19
5) (6
9,08
9) (9
6,92
1) (6
9,19
6)Sa
le o
f raw
mat
eria
ls 1
,904
3
61
13,
593
4,8
08
15,
497
5,1
69
Sett
lem
ents
/(Re
cove
ries)
by
the
Com
pany
70,
493
37,
160
40,
285
314
,018
1
10,7
78
351
,178
Re
nt re
ceiv
ed/(
paid
)-
-
8,7
16
5,7
45
8,7
16
5,7
45
Expe
nses
app
ortio
ned
80
605
3
59,8
49
107
,754
3
59,9
29
108
,359
Co
mm
issi
on o
n sa
les
-
(74)
(9,3
76)
(14,
461)
(9,3
76)
(14,
534)
Expe
nses
incu
rred
and
tran
sfer
red
-
(1,2
08)
(170
,457
) (1
49,6
30)
(170
,457
) (1
50,8
38)
Cred
it Ca
rds
Colle
cted
On
Beha
lf O
f Sub
sidi
ary
- -
6
,933
(6
7,51
7) 6
,933
(6
7,51
7)Tr
ansf
er fr
om R
oyal
Por
cela
in (P
vt) L
td -
2
,202
-
1,3
43
-
3,5
45
Tech
nica
l Fee
s (E
xpen
ses)
/inc
ome
(53,
990)
(33,
333)
- 6
,511
(5
3,99
0) (2
6,82
2)Ba
lanc
e as
at 3
1 M
arch
(2
6,92
4) (1
4,18
9) 1
0,03
9 (1
45,7
45)
(16,
885)
(159
,934
)
Incl
uded
Und
erTr
ade
and
othe
r rec
eiva
ble
-
1,5
04
7,0
17
880
7
,017
2
,385
Tr
ade
and
othe
r pay
able
-
-
(14,
714)
(81,
257)
(14,
714)
(81,
257)
Amou
nt d
ue fr
om re
late
d pa
rtie
s -
-
7
0,69
1 6
4,98
1 7
0,69
0 6
4,98
1 Am
ount
due
to re
late
d pa
rtie
s (2
6,92
4) (1
5,69
3) (5
2,95
5) (1
30,3
49)
(79,
878)
(146
,043
)Ba
lanc
e as
at 3
1 M
arch
(2
6,92
4) (1
4,18
9) 1
0,03
9 (1
45,7
45)
(16,
885)
(159
,934
)
NOTES TO THE FINANCIAL STATEMENTS

|165| Annual Report 2020/21
The above subsidiaries and affiliates include following companies;
Company
Lanka Tiles PLC
Uni dil Packaging (Pvt) Ltd
Vallibel Plantation Management (Pvt) Ltd
Horana Plantations PLC
Swisstek Aluminium Limited
Swisstek (Ceylon) PLC
Royal Porcelain (Pvt) Ltd
Rocell Bathware Limited
LWL Development (Pvt) Ltd
Beyond Paradise Collection Limited
Lankatiles (Pvt) Ltd LTL Development Ltd Swisstek Development Ltd
MN Properties (Pvt) Ltd
Lanka Ceramics PLC LW Plantation Investment Limited
Terms and conditions with related parties
The ‘Sales to’ and ‘Purchases from’ related parties are made on commercial terms agreed with respective parties.
Outstanding balances as at the year end are unsecured,interest free and settlement occur in cash with in short Period of time.
Technical fees paid to Royal Ceramic Lanka PLC and Vallibel One PLC are for services rendered in providing technical advises to improve manufacturing process of Lanka Walltile PLC, Lanka Tiles PLC and Swisstek Aluminum Limited.
Credit cards collection & part of the settlement represents the sales proceeds of the subsidiaries received by the parent company’and it will be settled by transferring of funds back to the relevant companies.
Commission on sales paid to Royal Ceramic Lanka PLC & Swisstek Ceylon PLC for the sales of tiles at their Owned location.

|166|Lanka Walltiles PLC
30 RELATED PARTY DISCLOSURES CONTD.
30.2 Group - Related Party Transactions30.2.1 Lanka Tile PLC
Name of the company Relationship Nature of the transaction
2021 2020
Rs. ‘000 Rs. ‘000
(a) Sale of goods /services toRoyal Porcelain (Pvt) Ltd Affiliated Company Raw materials - 375
Consumables 20 - Glaze 889 - Spares 4 4
Rocell Bathware Ltd. Affiliated Company Raw materials 2,654 2,654 Spares 1,529 2,067 Packing 30 11 Glaze 13,062 - Consumables 179 2,932
(b) Purchase of goods/Services from:Lanka Ceramic PLC Affiliated Company Raw materials 76,406 132,875 Swisstek Aluminum Ltd Affiliated Company Trading Items 76,446 65,121 Swisteck (Ceylon)PLC Affiliated Company Trading Items 586,400 380,317
Sales Commission 36,584 57,619 Uni-Dil Packing (Pvt) Ltd Affiliated Company Packing Material 122,235 115,144Royal Ceramics Lanka PLC Affiliated Company Raw materials 119 777
Spares 118 141 Consumables 659 3,093 Glaze 7,634 - Technical fees 19,834 10,162
Vallibel One PLC Affiliated Company Technical fees 178,509 91,454Delmage Freight Services (Pvt) Ltd Affiliated Company Services - 4,663 Heyleys Travels & Tours (Private) limited Affiliated Company Services 124 2,502 Heyleys Agriculture Holding Limited Affiliated Company Services 40 - Heyleys Electronic Lighting (Private) Limited Affiliated Company Services 405 - Heyleys Industrial Solutions (Private) Limited Affiliated Company Services - 20
NOTES TO THE FINANCIAL STATEMENTS
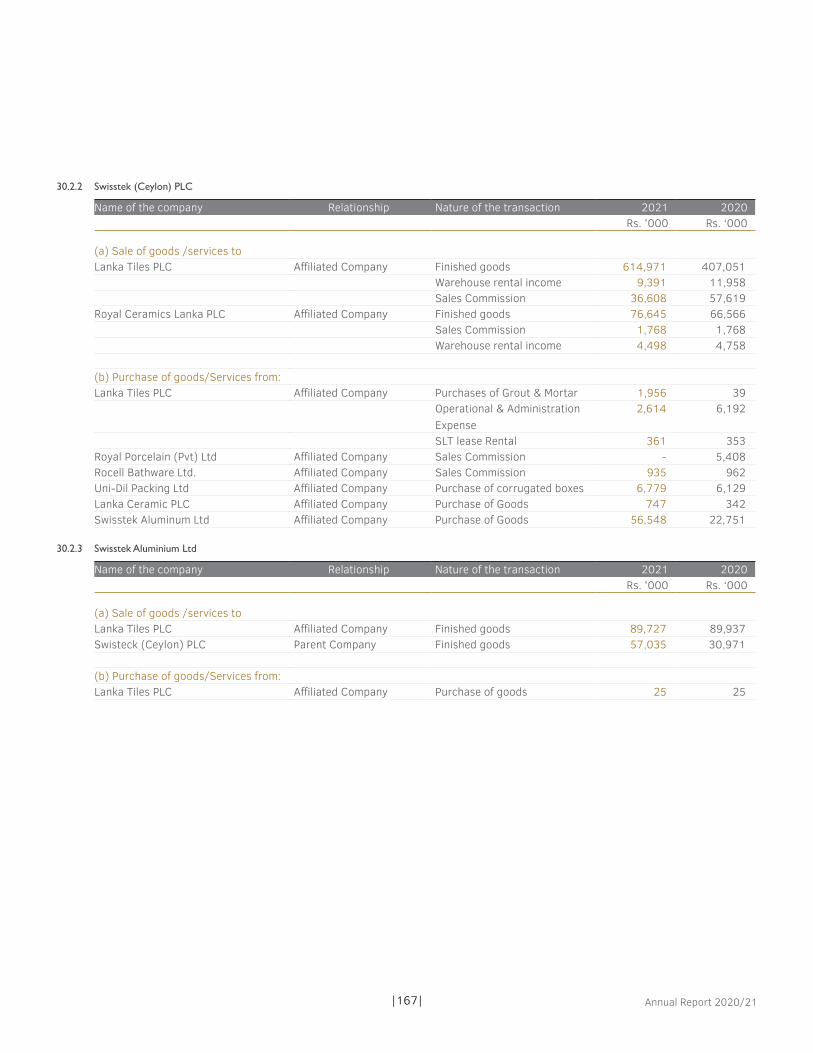
|167| Annual Report 2020/21
30.2.2 Swisstek (Ceylon) PLC
Name of the company Relationship Nature of the transaction 2021 2020Rs. '000 Rs. ‘000
(a) Sale of goods /services toLanka Tiles PLC Affiliated Company Finished goods 614,971 407,051
Warehouse rental income 9,391 11,958 Sales Commission 36,608 57,619
Royal Ceramics Lanka PLC Affiliated Company Finished goods 76,645 66,566 Sales Commission 1,768 1,768Warehouse rental income 4,498 4,758
(b) Purchase of goods/Services from:Lanka Tiles PLC Affiliated Company Purchases of Grout & Mortar 1,956 39
Operational & Administration Expense
2,614 6,192
SLT lease Rental 361 353 Royal Porcelain (Pvt) Ltd Affiliated Company Sales Commission - 5,408Rocell Bathware Ltd. Affiliated Company Sales Commission 935 962 Uni-Dil Packing Ltd Affiliated Company Purchase of corrugated boxes 6,779 6,129 Lanka Ceramic PLC Affiliated Company Purchase of Goods 747 342 Swisstek Aluminum Ltd Affiliated Company Purchase of Goods 56,548 22,751
30.2.3 Swisstek Aluminium Ltd
Name of the company Relationship Nature of the transaction 2021 2020Rs. '000 Rs. ‘000
(a) Sale of goods /services toLanka Tiles PLC Affiliated Company Finished goods 89,727 89,937 Swisteck (Ceylon) PLC Parent Company Finished goods 57,035 30,971
(b) Purchase of goods/Services from:Lanka Tiles PLC Affiliated Company Purchase of goods 25 25

|168|Lanka Walltiles PLC
30 RELATED PARTY DISCLOSURES CONTD.30.2.4 Uni Dil Packaging Ltd
Name of the company Relationship Nature of the transaction
2021 2020
Rs. '000 Rs. ‘000
(a) Sale of goods /services to Horana Plantations PLC Affiliated Company Finished goods 169 - Uni-Dil Packing Solution Limited Affiliated Company Finished goods 70,873 9,108 Royal Porcelain (Pvt) Ltd Affiliated Company Finished goods - (419)Swisteck (Ceylon)PLC Affiliated Company Finished goods 6,477 6,129 Royal Ceramics Lanka PLC Affiliated Company Finished goods - 22
(b) Purchase of goods/Services from:Horana Plantations PLC Affiliated Company Finished goods - 73Vallibel One PLC Affiliated Company Technical fees 52,924 32,393
30.2.5 Uni Dil Packaging Solutions Ltd
Name of the company Relationship Nature of the transaction
2021 2020
Rs. '000 Rs. ‘000
(a) Sale of goods toRoyal Porcelain (Pvt) Ltd Affiliated Company Finished goods 53,800 107,449 Royal Bathware LTD Affiliated Company Finished goods 31,253 24,513 Royal Ceramics Lanka PLC Affiliated Company Finished goods 89,590 76,587 Lanka Walltiles PLC Affiliated Company Finished goods 64,174 67,594 Lanka Tiles PLC Affiliated Company Finished goods 121,907 115,221 Horana Plantation PLC Affiliated Company Finished goods 9,473 11,045 Nilano Garments (Pvt) Ltd Affiliated Company Finished goods 149 -
(b) Purchase of goods/services from/Expenses ReimbursementUni Dil Packaging Ltd Parent Company Purchase of goods 70,873 9,108 Royal Porcelain (Pvt) Ltd Affiliated Company Finished goods 15 -
30.2.6 Horana Plantations PLC
Name of the company Relationship Nature of the transaction
2021 2020
Rs. '000 Rs. ‘000
(a) Sale of goods /services to Uni Dil Packaging (Pvt) Ltd Affiliated Company Sale of tea 240 525 Lanka Ceramic PLC Affiliated Company Sale of tea 38 52 Delmage Forsyth & Co.Ltd Affiliated Company Sale of tea 33,153 42,703 Dipped Products PLC Affiliated Company Sale of Latex - 23,619 The Kingsbury PLC Affiliated Company Sale of Coconuts 4 76
NOTES TO THE FINANCIAL STATEMENTS

|169| Annual Report 2020/21
Name of the company Relationship Nature of the transaction
2021 2020
Rs. '000 Rs. ‘000
(b) Purchase of goods/services from/Expenses Reimbursement Uni Dil Packaging (Pvt) Ltd Affiliated Company Purchase of goods 351 507 Uni Dil Packaging Solutions Ltd Affiliated Company Purchase of goods 10,261 11,630 Royal Ceramics Lanka PLC Affiliated Company Purchase of tiles 51 - Hayleys PLC Affiliated Company Management Fee 11,216 -
Office Rent & related services
8,749 4,699
Hayleys Agriculture Holdings Ltd Affiliated Company Chemicals 3,207 3,352 Hayleys Agro Fertilizer (Pvt) Ltd Affiliated Company Fertilizer 24,231 36,139 Hayleys Business Solutions International (Pvt) Ltd
Affiliated Company Salary Processing Fee 167 152
Hayleys Aventura(Pvt) Ltd Affiliated Company Office Premises Related Services
- 164
Logiwiz Limited Affiliated Company Document Storage Rental
40 24
NYK Lanka (Pvt) Ltd Affiliated Company Office Premises Related Services
179 477
Singer Sri Lanka PLC Affiliated Company Purchase of Equipment 404 23 Puritas (Pvt) Ltd Affiliated Company Maintenance of Water
Purification Plant - 73
Diesel & Motor Engineering PLC Affiliated Company Purchase of Motor Vehicle Spares
220 151
30.2 Transactions with key management personnel of the company
The key management personnel of the company are the members of its Board of Directors and that of its parent.
Key management personnel compensation Group Company2021 2020 2021 2020
Rs.'000 Rs.'000 Rs.'000 Rs.’000
Short Term Employment Benefits 136,498 123,280 33,322 29,613 Post Employment Benefits 42,763 38,893 15,065 13,612 Total 179,261 162,173 48,387 43,225

|170|Lanka Walltiles PLC
31. COMMITMENTS AND CONTINGENCIES 31.1 Capital commitments There were no significant capital commitments as at reporting date in the Company or Group except as detailed below,
Lease & Other commitments a). Lanka Tiles PLC is committed to pay Rs. 14,808,000/- as rent per annum for the use of land & buildings situated in Nawala.
b). Horana Plantation PLC has commitments under lease rentals on Dumbara Estate as given below;
Finance lease rentals payable to the Secretary to the Treasury ;22.06.2019 to 21.06.2045 (per annum) Rs. 5.228 million
c). Swisstek Aluminium Limited has a commitment on letter of credits amounting to Rs.80.01 million as at the reporting date.
31.2 Contingenciesa) Horana Palntaion PLC Several other cases and disputes are pending against the company in Labour Tribunal and Courts. All these cases are being
vigorously contested /prosecuted and our lawyers have advised that an evaluation of the likelihood of an unfavourable outcome and the amount or range of potential loss cannot be quantified or commented upon at this stage.
Capital Grant received from the Ceylon Electricity Board (CEB) for Stand by Power Generators is subject to a condition of minimum usage of CEB Power as against the Generator Power. A liability will arise only if the above condition is not fulfilled.
Court of Appeal Case No CA WRIT 143/2021 In the past, wages of the Plantation workers were negotiated between Trade Unions and Regional Plantation Companies (RPCs), once
in every two years and a Collective Agreement was signed between the parties. However, the last wage negotiations between the parties were not successful and therefore, the matter was referred to the Wages Board by the Minister of Labour. Consequently, The Wages Board without considering objections of the RPC’s decided the daily wage rate of Tea / Rubber workers as Rs 1,000/- per day and gazetted its decision on 05th March 2021.
Therefore, a “Writ Application” was instituted by the RPCs in the Court of Appeal seeking an interim order, staying and /or suspending the operation of the Gazette issued by the Wages Board, but the Hon Judges of the Court of Appeal declined to issue an interim order but directed the respondents to file objections and the RPCs (Petitioners) to file Counter Objections. As at the date of the Statement of financial position, the above matter is under the purview of the Court of Appeal and, therefore the final decision is pending.
Having discussed with independent legal experts and based on the information available, the Directors are of the view that in the event of an unforeseen verdict unfavorable to the Company/Group from the above court case, the contingent liability on retirement benefit obligation liability would be Rs. 142,435,779 and of which Rs. 11,573,045 need to be charged to Profit or Loss and Rs. 130,862,734 to be charged under Other Comprehensive Income for the year ended 31 March 2021. However, no provisions have been made in the financial statements for the year ended 31 March 2021 in this regard.
b) Lanka Walltiles PLC AAs at the reporting date, the Lanka Walltiles PLC has received assessments issued by the Department of Inland revenue in respect
of Income tax, Value added tax and economic service charge total Rs. 46,988,405/- for the year of assessment 2008/09, 2009/10. The Company has appealed against the assessments in the appeal hearing branch. The Directors believe, based on the information currently available, the ultimate resolution of such assessment is not likely to have a material adverse effect on the Company.
Accordingly no provision for liability has been made in these financial statements.
32 EVENTS OCCURRING AFTER THE REPORTING PERIOD
NOTES TO THE FINANCIAL STATEMENTS
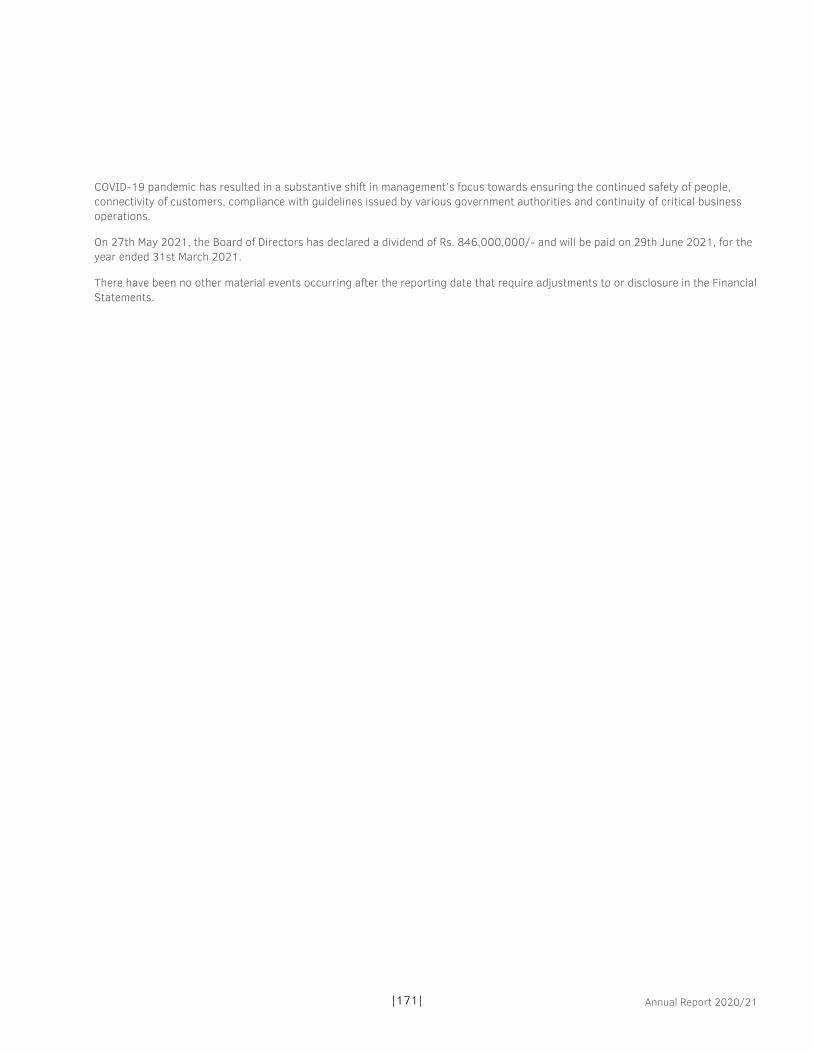
|171| Annual Report 2020/21
COVID-19 pandemic has resulted in a substantive shift in management’s focus towards ensuring the continued safety of people, connectivity of customers, compliance with guidelines issued by various government authorities and continuity of critical business operations.
On 27th May 2021, the Board of Directors has declared a dividend of Rs. 846,000,000/- and will be paid on 29th June 2021, for the year ended 31st March 2021.
There have been no other material events occurring after the reporting date that require adjustments to or disclosure in the Financial Statements.

|172|Lanka Walltiles PLC
33
SEG
MEN
TAL
INFO
RMAT
ION
20
2120
20 T
iles
&
asso
ciat
ed
item
s
Alum
iniu
m
Prod
ucts
P
lant
atio
n pr
oduc
ts
Pac
king
m
ater
ials
In
ter
Segm
ent
Elim
inat
ion
Tota
l T
iles
&
asso
ciat
ed
item
s
Alu
min
ium
Pr
oduc
ts
Pla
ntat
ion
prod
ucts
P
acki
ng
mat
eria
ls
Inte
r Se
gmen
t El
imin
atio
n
Tota
l
Rs.'0
00Rs
.'000
Rs.’0
00Rs
.’000
Rs.’0
00Rs
.’000
Rs.’0
00Rs
.’000
Rs.’0
00Rs
.’000
Rs.'0
00Rs
.’000
Sale
s to
Ext
erna
l Cus
tom
ers
19,3
29,8
453,
893,
821
2,1
25,3
06
4,07
4,40
9 -
2
9,42
3,38
1 11
,077
,654
3,23
4,94
51,
762,
154
3,85
4,95
7 -
1
9,92
9,70
9 In
ter S
egm
ent S
ales
-
-
-
179
,317
(1
79,3
17)
-
-
-
-
186
,240
(1
86,2
40)
-
Tota
l Rev
enue
19,
329,
845
3,8
93,8
21
2,1
25,3
06
4,2
53,7
26
(179
,317
) 2
9,42
3,38
1 1
1,07
7,65
4 3
,234
,945
1
,762
,154
4
,041
,197
(1
86,2
40)
19,
929,
709
Gros
s Pr
ofit
7,2
32,7
24
1,0
75,2
30
200
,455
7
27,6
24
-
9,2
36,0
33
3,7
73,9
50
576
,528
(2
17,5
42)
651
,994
-
4
,784
,930
Ot
her I
ncom
e 9
7,64
0 9
,531
4
7,53
5 7
4,73
4 (7
20)
228
,720
5
,213
11,
040
83,
515
69,
651
(3,9
30)
165
,489
Di
strib
utio
n Co
sts
(2,2
21,2
05)
(333
,102
) -
(1
45,9
43)
-
(2,7
00,2
50)
(1,5
23,3
02)
(244
,597
) -
(1
53,3
43)
-
(1,9
21,2
42)
Adm
inis
trat
ive
Expe
nses
(761
,357
) (1
31,5
96)
(191
,644
) (2
48,1
58)
720
(1
,332
,035
) (6
28,5
60)
(88,
192)
(171
,797
) (1
71,3
38)
3,9
30
(1,0
55,9
57)
Othe
r Ope
ratin
g Ex
pens
es (1
00,9
51)
-
-
-
-
(100
,951
)Fi
nanc
e Co
st (4
10,0
42)
(171
,234
) (1
37,3
63)
(51,
249)
-
(769
,888
) (6
26,1
91)
(308
,237
) (1
46,6
16)
(90,
337)
-
(1,1
71,3
81)
Fina
nce
Inco
me
20,
412
-
402
-
-
2
0,81
4 1
,596
-
2
41
-
-
1,8
37
Profi
t Bef
ore
Tax
3,8
57,2
21
448
,829
(8
0,61
5) 3
57,0
07
-
4,5
82,4
42
1,0
02,7
03
(53,
458)
(452
,197
) 3
06,6
27
-
803
,675
In
com
e Ta
x Ex
pens
e (4
36,5
38)
(107
,008
) 6
,370
(3
1,84
6) -
(5
69,0
22)
(292
,729
) 1
3,57
1 (8
3,01
4) (2
3,61
2) (3
,243
) (3
89,0
27)
Net P
rofit
for t
he y
ear
3,4
20,6
83
341
,821
(7
4,24
5) 3
25,1
61
-
4,0
13,4
20
709
,975
(3
9,88
7) (5
35,2
11)
283
,015
(3
,243
) 4
14,6
49
Segm
ent A
sset
s23
,996
,027
4,0
34,4
50
4,1
44,7
80
3,54
5,38
3 (2
,010
,636
)33
,710
,005
24,
341,
759
3,8
84,1
45
4,0
70,7
51
3,1
36,9
37
(2,0
10,7
15)
33,
422,
877
Segm
ent L
iabi
litie
s6,
936,
246
2,5
89,1
80
3,0
51,1
01
1,8
07,5
70
(68,
912)
14,3
15,1
84 1
0,57
7,49
0 2
,710
,419
2
,924
,629
1
,647
,302
5
,386
1
7,86
5,22
5
Othe
r Seg
men
t Inf
orm
atio
nTo
tal c
ost i
ncur
red
durin
g th
e pe
riod
to
depr
ecia
tion
and
amor
tisat
ion
717
,460
1
11,7
89
190
,713
8
3,73
3 1
,103
,695
6
50,0
88
108
,833
1
87,6
91
79,
673
1,0
26,2
85
Prop
erty
, pla
nt &
equ
ipm
ent
703
,450
2
16,4
36
54,
619
176
,285
1
,150
,789
9
06,8
96
44,
628
10,
211
92,
483
1,0
54,2
19
Biol
ogic
al a
sset
s -
-
1
23,1
01
-
123
,101
-
-
1
54,9
88
-
154
,988
tr
ade
debt
ors
and
inve
ntor
y im
pairm
ent
75,
300
21,
800
(301
) 2
2,65
4 1
19,4
53
23,
008
13,
497
4,1
54
10,
645
51,
304
prov
isio
n fo
r ret
irem
ent b
enefi
t 6
1,20
7 7
,281
9
2,94
1 1
6,51
8 1
77,9
47
56,
790
5,5
95
91,
779
13,
045
167
,210
Reco
ncili
atio
n of
net
pro
fit fo
r the
yea
rSe
gmen
t net
pro
fit fo
r the
yea
r 4
,013
,420
4
17,8
91
Divi
dend
tax
on In
ter s
egm
ent
divi
dend
-
(3,2
43)
Grou
p ne
t pro
fit fo
r the
yea
r 4
,013
,420
4
14,6
48
Reco
ncili
atio
n of
ass
ets
Segm
ent A
sset
s 3
5,72
0,64
1 3
5,43
3,59
2 In
ter-
seg
men
t bal
ance
elim
inat
ions
(68,
912)
5,3
86
Inve
stm
ent i
n su
bsid
iary
elim
inat
ion
(1,9
41,7
24)
(2,0
16,1
01)
33,
710,
005
33,
422,
877
Reco
ncili
atio
n of
liab
ilitie
sSe
gmen
t Lia
bilit
ies
14,
384,
096
17,
859,
840
Inte
r- s
egm
ent b
alan
ce e
limin
atio
ns (6
8,91
2) 5
,386
1
4,31
5,18
4 1
7,86
5,22
5
NOTES TO THE FINANCIAL STATEMENTS

|173| Annual Report 2020/21
34. FINANCIAL RISK MANAGEMENT
The Group activities are exposed to variety of financial risks: market risk (including currency risk, fair value interest rate risk, cash flow interest rate risk and price risk), credit risk and liquidity risk.
The Group overall financial risk management programme focuses on the unpredictability of financial markets and seeks to minimise potential adverse effects on the financial performance of the company. Financial risk management is carried out through risk reviews, internal control systems, insurance programmes and adherence to the company financial risk management policies. The board of directors regularly reviews these risks and approves the risk management policies, which covers the management of these risks.
Market risk
Market risk is the risk that the fair value of future cash flows of the financial instruments will fluctuate because of the changes in market prices.
(i) Foreign currency exchange risk – risk that the value of a financial instrument will fluctuate due to changes in foreign exchange rates.
(ii) Cash flow interest rate risk – risk that future cash flows associated with a financial instrument will fluctuate.
Foreign currency/ exchange risk
Foreign currency risk is the risk that the fair value or future cash flows of a financial instrument will fluctuate because of changes in foreign exchange rates.
The group operate internationally and are exposed to foreign exchange risk arising from various currency exposures, primarily with respect to the USD and Euro.
Foreign exchange risk arises mainly as a result of foreign exchange gains/losses on translation of US dollar - denominated loans granted, trade receivables, trade creditors and Euro - denominated trade creditors.
The Sri Lankan Rupee witnessed a sharp depreciation against the US Dollar & Euro during the year on the back of economic turmoil in global, regional and local markets resulting from the COVID-19 pandemic. The Group companies exposed to foreign currency-denominated payments with local currency revenues are adversely impacted to undue fluctuations in exchange rates.
Foreign currency sensitivity Change in Change in profit before
tax Group
Company
Rs. ‘000 Rs. ‘000
2021 5.0% 53,207 3,762 2020 5.0% 37,897 1,348
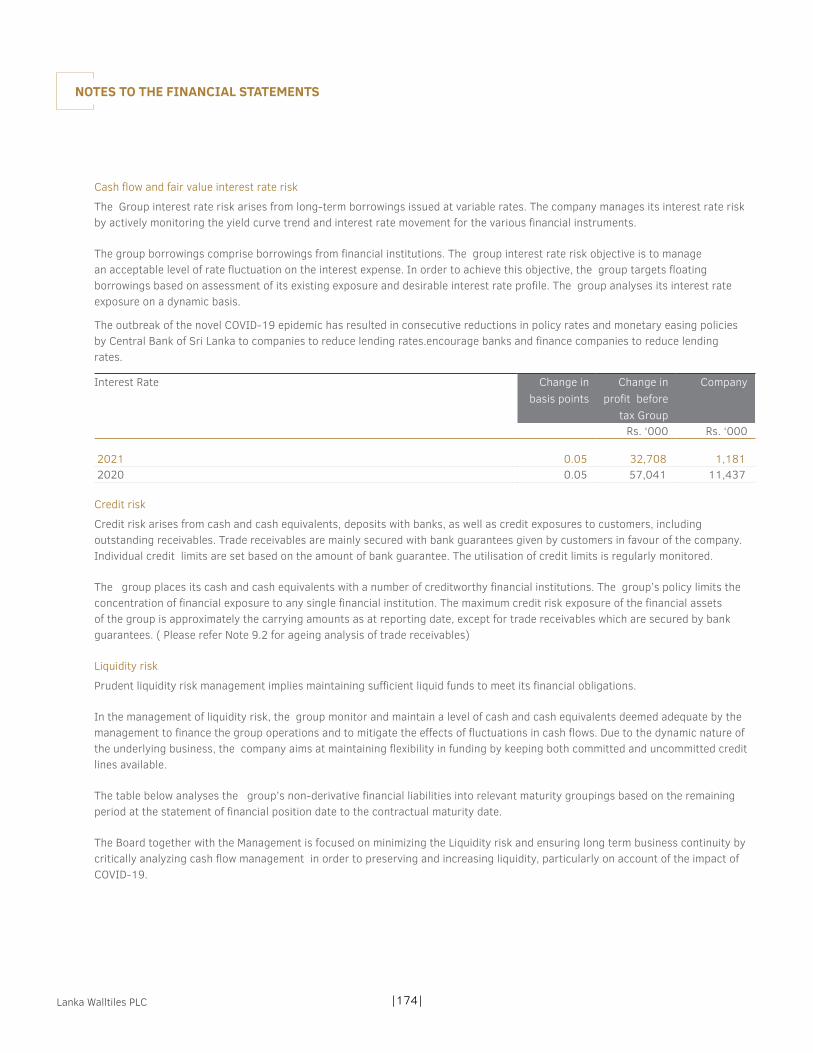
|174|Lanka Walltiles PLC
Cash flow and fair value interest rate risk
The Group interest rate risk arises from long-term borrowings issued at variable rates. The company manages its interest rate risk by actively monitoring the yield curve trend and interest rate movement for the various financial instruments.
The group borrowings comprise borrowings from financial institutions. The group interest rate risk objective is to manage an acceptable level of rate fluctuation on the interest expense. In order to achieve this objective, the group targets floating borrowings based on assessment of its existing exposure and desirable interest rate profile. The group analyses its interest rate exposure on a dynamic basis.
The outbreak of the novel COVID-19 epidemic has resulted in consecutive reductions in policy rates and monetary easing policies by Central Bank of Sri Lanka to companies to reduce lending rates.encourage banks and finance companies to reduce lending rates.
Interest Rate Change in basis points
Change in profit before
tax Group
Company
Rs. ‘000 Rs. ‘000
2021 0.05 32,708 1,181 2020 0.05 57,041 11,437
Credit risk
Credit risk arises from cash and cash equivalents, deposits with banks, as well as credit exposures to customers, including outstanding receivables. Trade receivables are mainly secured with bank guarantees given by customers in favour of the company. Individual credit limits are set based on the amount of bank guarantee. The utilisation of credit limits is regularly monitored.
The group places its cash and cash equivalents with a number of creditworthy financial institutions. The group’s policy limits the concentration of financial exposure to any single financial institution. The maximum credit risk exposure of the financial assets of the group is approximately the carrying amounts as at reporting date, except for trade receivables which are secured by bank guarantees. ( Please refer Note 9.2 for ageing analysis of trade receivables)
Liquidity risk
Prudent liquidity risk management implies maintaining sufficient liquid funds to meet its financial obligations.
In the management of liquidity risk, the group monitor and maintain a level of cash and cash equivalents deemed adequate by the management to finance the group operations and to mitigate the effects of fluctuations in cash flows. Due to the dynamic nature of the underlying business, the company aims at maintaining flexibility in funding by keeping both committed and uncommitted credit lines available.
The table below analyses the group’s non-derivative financial liabilities into relevant maturity groupings based on the remaining period at the statement of financial position date to the contractual maturity date.
The Board together with the Management is focused on minimizing the Liquidity risk and ensuring long term business continuity by critically analyzing cash flow management in order to preserving and increasing liquidity, particularly on account of the impact of COVID-19.
NOTES TO THE FINANCIAL STATEMENTS

|175| Annual Report 2020/21
34. FINANCIAL RISK MANAGEMENT CONTD.
Group
At 31 March 2021 Less than 3 months
Between 3 months and 1
year
Between year 1 and 2 year
Between year 2 and year 5
Over 5 years
Rs. ‘000 Rs. ‘000 Rs. ‘000 Rs. '000 Rs. ‘000
Interest Bearing Loans and Borrowings 2,267,882 1,814,892 932,756 1,873,310 574,972 Trade and other payables 4,034,728 Nil Nil Nil Nil Lease Liability of Right of Use Assets 8,281 26,754 44,162 123,239 571,882
At 31 March 2020 Less than 3 months
Between 3 months and 1
year
Between year 1 and 2 year
Between year 2 and year 5
Over 5 years
Rs. ‘000 Rs. ‘000 Rs. ‘000 Rs. '000 Rs. ‘000
Interest Bearing Loans and Borrowings 6,205,383 2,728,737 901,274 2,153,945 773,149 Trade and other payables 2,785,122 - - - - Amounts due to related parties 90,903 - - - - Lease Liability of Right of Use Assets 19,604 63,137 29,667 130,320 612,810
Company
At 31 March 2021 Less than 3 months
Between 3 months and 1
year
Between year 1 and 2 year
Between year 2 and year 5
Over 5 years
Rs. ‘000 Rs. ‘000 Rs. ‘000 Rs. '000 Rs. ‘000
Interest Bearing Loans and Borrowings 174,986 24,348 29,332 17,179 - Trade and other payables 635,763 - - - - Amounts due to related parties 79,878 - - - - Lease Liability of Right of Use Assets 1,410 4,677 7,232 17,179 -
At 31 March 2020 Less than 3 months
Between 3 months and 1
year
Between year 1 and 2 year
Between year 2 and year 5
Over 5 years
Rs. ‘000 Rs. ‘000 Rs. ‘000 Rs. '000 Rs. ‘000
Interest Bearing Loans and Borrowings 1,078,890 1,229,332 34,083 57,218 - Trade and other payables 483,266 - - - - Amounts due to related parties 146,043 - - - - Lease Liability of Right of Use Assets 5,819 19,752 6,558 27,358 -

|176|Lanka Walltiles PLC
Capital management risk
The primary objective of the Group’s capital management is to ensure that it maintains a strong credit rating and healthy capital ratios in order to support its business and maximise shareholder value.
The Group manages its capital structure and makes adjustments to it in light of changes in economic conditions. To maintain or adjust the capital structure, the group may or may not make dividend payments to shareholders, return capital to shareholders or issue new shares or other instruments.
Consistent with others in the industry, the Group monitors capital on the basis of the gearing ratio. This ratio is calculated as total borrowings by total equity. Total borrowings including non-current and current borrowings as shown in the statements of financial position. Total equity is calculated as ‘Total equity’ in the statements of financial position.
The gearing ratio as at 31 March is as follows:
Group Company2021 2020 2021 2020
Rs.'000 Rs.'000 Rs.'000 Rs.’000
Borrowings 6,541,664 11,408,192 236,109 2,287,347 Total equity 19,394,822 15,557,652 6,490,712 5,370,548 Gearing ratio ; Debt to Equity 34% 73% 4% 43%
NOTES TO THE FINANCIAL STATEMENTS

|177| Annual Report 2020/21
35. MATERIAL PARTLY-OWNED SUBSIDIARIES
Financial information of subsidiaries that have material non-controlling interests is provided below:
Proportion of equity interest held by non-controlling interests:
Name Country of incorporation and operation 2021 2020% %
Lanka Tiles PLC Sri Lanka 31.78% 31.78%Horana Plantation PLC Sri Lanka 49.00% 49.00%Swisstek (Ceylon) PLC Sri Lanka 55.91% 55.91%Swisstek Aluminium Limited Sri Lanka 61.48% 61.48%Beyond Paradise Collection Limited Sri Lanka 31.78% 31.78%Lankatiles (Pvt) Ltd India 65.21% 65.21%LTL Development Limited Sri Lanka 31.78% 31.78%Swisstek Development Limited Sri Lanka 55.91% 55.91%
Accumulated Balances of the Material Non - Controlling Interest
Name 2021 2020Rs. ‘000 Rs. '000
Accumulated Balances of Material Non - Controlling Interest Lanka Tiles PLC 2,750,792 2,187,325 Horana Plantation PLC 372,552 403,798 Swisstek (Ceylon) PLC 871,781 693,504 Swisstek Aluminium Limited 764,721 590,552 Beyond Paradise Collection Limited 57,643 55,709 Lankatiles (Pvt) Ltd 6,257 5,694 LTL Development Limited (88) - Swisstek Development Limited (52) - Total 4,823,606 3,936,582

|178|Lanka Walltiles PLC
NOTES TO THE FINANCIAL STATEMENTS
34. FINANCIAL RISK MANAGEMENT CONTD.
Name 2021 2020Rs. ‘000 Rs. '000
Profit allocated to Material Non - Controlling InterestLanka Tiles PLC 714,587 159,446 Horana Plantation PLC (38,157) (242,485)Swisstek (Ceylon) PLC 164,683 116,561 Swisstek Aluminium Limited 210,141 (24,521)Beyond Paradise Collection Limited 1,933 323 Lankatiles (Pvt) Ltd 160 210 LTL Development (Pvt) Limited (88) - Swisstek Development (Pvt) Limited (50) - Total 1,053,209 9,534
The summarised financial information of these subsidiaries is provided below. This information is based on amounts before inter-company eliminations.
Summarised statement of profit or loss for year ended 31 March 2021
Lanka Tiles PLC
Horana Plantation
PLC
Swisstek (Ceylon) PLC
Swisstek Aluminium
Limited
Beyond Paradise
Collection Limited
Lankatiles (Pvt) Ltd
LTL Development
Limited
Swisstek Development
Limited
Rs. 000' Rs. 000’ Rs. 000’ Rs. 000’ Rs. 000’ Rs. 000’ Rs. 000’ Rs. 000’
Revenue 12,626,485 2,125,306 1,552,534 3,893,821 - - - - Cost of sales (7,892,721) (1,924,851) (1,120,012) (2,818,591) - - - - Distribution costs (1,462,202) - (99,706) (333,102) - - - - Administrative expenses (490,573) (187,160) (58,626) (131,596) (1,731) (269) (276) (93)Finance costs (223,839) (137,361) (54,649) (171,234) - - - - Profit before tax 2,644,503 (76,129) 361,363 448,829 - - - - Income tax (307,635) (1,742) (5,658) (107,008) - - - - Profit for the year 2,336,868 (77,871) 355,705 341,821 6,083 246 (276) (93)Total comprehensive income
2,718,191 (67,038) 564,778 341,548 6,083 864 (276) (93)
Attributable to non-controlling interests
714,587 (38,157) 164,683 210,141 1,933 160 (88) (52)
Dividends paid to non-controlling interests
272,305 - 103,305 35,805 - - - -

|179| Annual Report 2020/21
35. MATERIAL PARTLY-OWNED SUBSIDIARIES CONTD.
Summarised statement of profit or loss for year ended 31 March 2020
Lanka Tiles PLC
Horana Plantation
PLC
Swisstek (Ceylon) PLC
Swisstek Aluminium
Limited
Beyond Paradise
Collection Limited
Lankatiles (Pvt) Ltd
LTL Development
Limited
Swisstek Development
Limited
Rs. 000' Rs. 000’ Rs. 000’ Rs. 000’ Rs. 000’ Rs. 000’ Rs. 000’ Rs. 000’
Revenue 6,694,824 1,762,154 1,418,975 3,234,945 - - - - Cost of sales (4,275,376) (1,979,696) (1,021,078) (2,658,417) - - - - Distribution costs (1,028,280) - (80,216) (244,597) - - - - Administrative expenses (388,677) (170,053) (49,457) (88,192) (391) (301) - - Finance costs (334,564) (146,615) (70,868) (308,237) - - - - Profit before tax 695,033 (470,374) 286,977 (53,458) - - - - Income tax (193,316) (24,493) (78,508) 13,571 - - - - Profit for the year 501,717 (494,868) 208,469 (39,887) 1,017 323 - - Total comprehensive income
502,113 (513,022) 208,018 (41,124) 1,017 18 - -
Attributable to non-controlling interests
159,446 (242,485) 116,561 (24,521) 323 211 - -
Dividends paid to non-controlling interests
- - - - - - - -
Summarised statement of financial position as at 31 March 2021
Lanka Tiles PLC
Horana Plantation
PLC
Swisstek (Ceylon) PLC
Swisstek Aluminium
Limited
Beyond Paradise
Collection Limited
Lankatiles (Pvt) Ltd
LTL Development
Limited
Swisstek Development
Limited
Rs. 000' Rs. 000’ Rs. 000’ Rs. 000’ Rs. 000’ Rs. 000’ Rs. 000’ Rs. 000’
Current Assets 6,276,263 426,587 1,021,672 2,480,493 5,400 12,735 - - Non- Current Assets 6,701,370 3,362,949 1,767,970 1,553,957 394,819 - 56,667 56,667 Current Liabilities 2,359,557 995,262 785,613 2,275,042 177,799 97 56,739 56,942 Non- Current Liabilities 1,807,533 2,046,463 336,278 314,138 41,045 - - - Total equity 8,810,542 747,812 1,667,752 1,445,271 181,375 12,638 (73) (276)Attributable to:Equity holders of parent 6,010,552 381,384 735,312 556,774 123,734 4,397 (50) (122)Non-controlling interest 2,799,990 366,428 932,440 888,497 57,641 8,241 (23) (154)

|180|Lanka Walltiles PLC
35. MATERIAL PARTLY-OWNED SUBSIDIARIES CONTD.
Summarised statement of financial position as at 31 March 2020
Lanka Tiles PLC
Horana Plantation
PLC
Swisstek (Ceylon) PLC
Swisstek Aluminium
Limited
Beyond Paradise
Collection Limited
Lankatiles (Pvt) Ltd
LTL Development
Limited
Swisstek Development
Limited
Rs. 000' Rs. 000’ Rs. 000’ Rs. 000’ Rs. 000’ Rs. 000’ Rs. 000’ Rs. 000’
Current Assets 6,491,998 309,543 837,566 2,437,641 4,200 11,848 - - Non- Current Assets 6,345,899 3,411,853 1,598,505 1,446,504 394,819 - - - Current Liabilities 3,660,067 1,225,155 655,754 2,380,888 175,841 74 - - Non- Current Liabilities 2,228,716 1,684,663 492,598 329,531 47,885 - - - Total equity 6,949,115 811,579 1,287,720 1,173,728 175,292 11,774 - - Attributable to: - - Equity holders of parent 4,740,686 413,906 567,756 452,165 119,584 4,096 - - Non-controlling interest 2,208,429 397,674 719,964 721,563 55,708 7,678 - -
Summarised cash flow information for year ending 31 March 2021
Lanka Tiles PLC
Horana Plantation
PLC
Swisstek (Ceylon) PLC
Swisstek Aluminium
Limited
Beyond Paradise
Collection Limited
Lankatiles (Pvt) Ltd
LTL Development
Limited
Swisstek Development
Limited
Rs. 000' Rs. 000’ Rs. 000’ Rs. 000’ Rs. 000’ Rs. 000’ Rs. 000’ Rs. 000’
Operating 5,865,053 113,766 334,574 850,801 1 250 56,667 56,667 Investing (425,535) (177,660) 12,600 (216,436) - - (56,667) (56,667)Financing (2,441,780) 378,900 (305,775) (400,849) - - - - Net increase / (decrease) in cash and cash equivalents
2,997,738 315,006 41,399 233,516 1 250 - -
Summarised cash flow information for year ending 31 March 2020
Lanka Tiles PLC
Horana Plantation
PLC
Swisstek (Ceylon) PLC
Swisstek Aluminium
Limited
Beyond Paradise
Collection Limited
Lankatiles (Pvt) Ltd
LTL Development
Limited
Swisstek Development
Limited
Rs. 000' Rs. 000’ Rs. 000’ Rs. 000’ Rs. 000’ Rs. 000’ Rs. 000’ Rs. 000’
Operating (821,733) (152,041) 160,482 417,983 - 300 - - Investing (624,498) (165,100) (100,219) (44,565) - - - - Financing 965,376 103,123 (69,573) (403,932) - - - - Net increase / (decrease) in cash and cash equivalents
(480,855) (214,018) (9,311) (30,514) - 300 - -
Quantifying Perfection
NOTES TO THE FINANCIAL STATEMENTS

|181| Annual Report 2020/21
Supplementary InformationGRI Index 182Five Year Summary - Statement of Profit or Loss 184Five Year Summary - Statement of Financial Position 186Major Shareholders 188Statement of Value Added 191NoteS 192Notice of Meeting 194Form of Proxy 195
Quantifying Perfection

|182|Lanka Walltiles PLC
Page References
General Disclosures 102-1 Name of the organization 7General Disclosures 102-2 Activities, brands, products, and services 3General Disclosures 102-3 Location of headquarters End of the ReportedGeneral Disclosures 102-10 Significant changes to the organization and its supply chain 56General Disclosures 102-11 Precautionary Principle or approach 28General Disclosures 102-12 External initiatives 56General Disclosures 102-14 Statement from senior decision-maker 16-19General Disclosures 102-16 Values, principles, standards, and norms of behaviour 6General Disclosures 102-18 Governance structure 35General Disclosures 102-40 List of stakeholder groups 30-31General Disclosures 102-41 Collective bargaining agreements 60-64General Disclosures 102-42 Identifying and selecting stakeholders 30-31General Disclosures 102-43 Approach to stakeholder engagement 30-31General Disclosures 102-44 Key topics and concerns raised Content PageGeneral Disclosures 102-45 Entities included in the consolidated financial statements 4General Disclosures 102-46 Defining report content and topic Boundaries 7General Disclosures 102-47 List of material topics Content PageGeneral Disclosures 102-49 Changes in reporting 7General Disclosures 102-5 Ownership and legal form 2-4 & End of the ReportedGeneral Disclosures 102-50 Reporting period 7General Disclosures 102-51 Date of most recent report 7General Disclosures 102-52 Reporting cycle 7General Disclosures 102-53 Contact point for questions regarding the report 7General Disclosures 102-54 Claims of reporting in accordance with the GRI Standards 7General Disclosures 102-55 GRI content index 182-183General Disclosures 102-56 External assurance 94General Disclosures 102-7 Scale of the organization 5General Disclosures 102-8 Information on employees and other workers 60-64General Disclosures 102-9 Supply chain 56Economic Performance 201-1 Direct economic value generated and distributed 191Economic Performance 201-3 Defined benefit plan obligations and other retirement plans 60-64Indirect Economic Impacts 203-1 Infrastructure investments and services supported 57Indirect Economic Impacts 203-2 Significant indirect economic impacts 39-41Procurement Practices 204-1 Proportion of spending on local suppliers 9Materials 301-1 Materials used by weight or volume 66Materials 301-2 Recycled input materials used 65,66Energy 302-1 Energy consumption within the organization 67Energy 302-2 Energy consumption outside of the organization 67Energy 302-3 Energy intensity 66-67Energy 302-4 Reduction of energy consumption 65-67Water 303-1 Water withdrawal by source 67Water 303-2 Water sources significantly affected by withdrawal of water 67-68Water 303-3 Water recycled and reused 67-68Emissions 305-1 Direct (Scope 1) GHG emissions 9, 29,65,68Emissions 305-2 Energy indirect (Scope 2) GHG emissions 9, 29,65,68Emissions 305-3 Other indirect (Scope 3) GHG emissions 9, 29,65,68Effluents and Waste 306-1 Water discharge by quality and destination 67-68Effluents and Waste 306-2 Waste by type and disposal method 67-68
GRI IndexGRI - 102-55
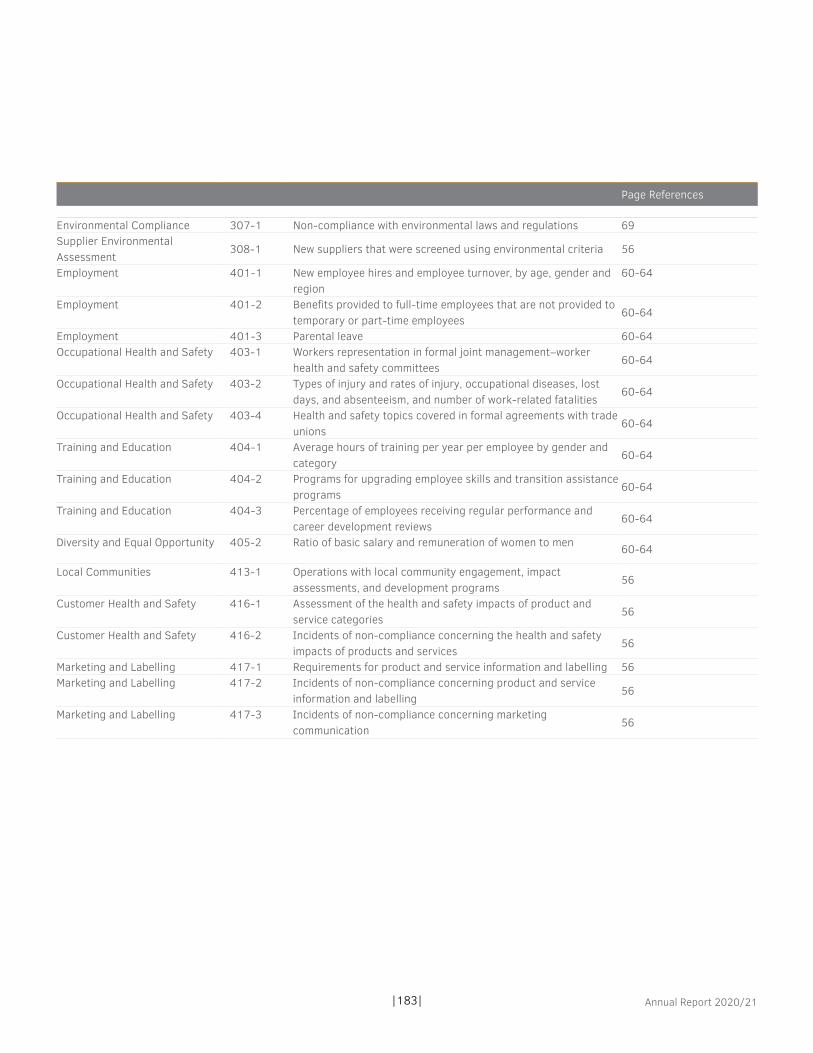
|183| Annual Report 2020/21
Page References
Environmental Compliance 307-1 Non-compliance with environmental laws and regulations 69Supplier Environmental Assessment
308-1 New suppliers that were screened using environmental criteria 56
Employment 401-1 New employee hires and employee turnover, by age, gender and region
60-64
Employment 401-2 Benefits provided to full-time employees that are not provided to temporary or part-time employees
60-64
Employment 401-3 Parental leave 60-64Occupational Health and Safety 403-1 Workers representation in formal joint management–worker
health and safety committees60-64
Occupational Health and Safety 403-2 Types of injury and rates of injury, occupational diseases, lost days, and absenteeism, and number of work-related fatalities
60-64
Occupational Health and Safety 403-4 Health and safety topics covered in formal agreements with trade unions
60-64
Training and Education 404-1 Average hours of training per year per employee by gender and category
60-64
Training and Education 404-2 Programs for upgrading employee skills and transition assistance programs
60-64
Training and Education 404-3 Percentage of employees receiving regular performance and career development reviews
60-64
Diversity and Equal Opportunity 405-2 Ratio of basic salary and remuneration of women to men 60-64
Local Communities 413-1 Operations with local community engagement, impact assessments, and development programs
56
Customer Health and Safety 416-1 Assessment of the health and safety impacts of product and service categories
56
Customer Health and Safety 416-2 Incidents of non-compliance concerning the health and safety impacts of products and services
56
Marketing and Labelling 417-1 Requirements for product and service information and labelling 56Marketing and Labelling 417-2 Incidents of non-compliance concerning product and service
information and labelling56
Marketing and Labelling 417-3 Incidents of non-compliance concerning marketing communication
56
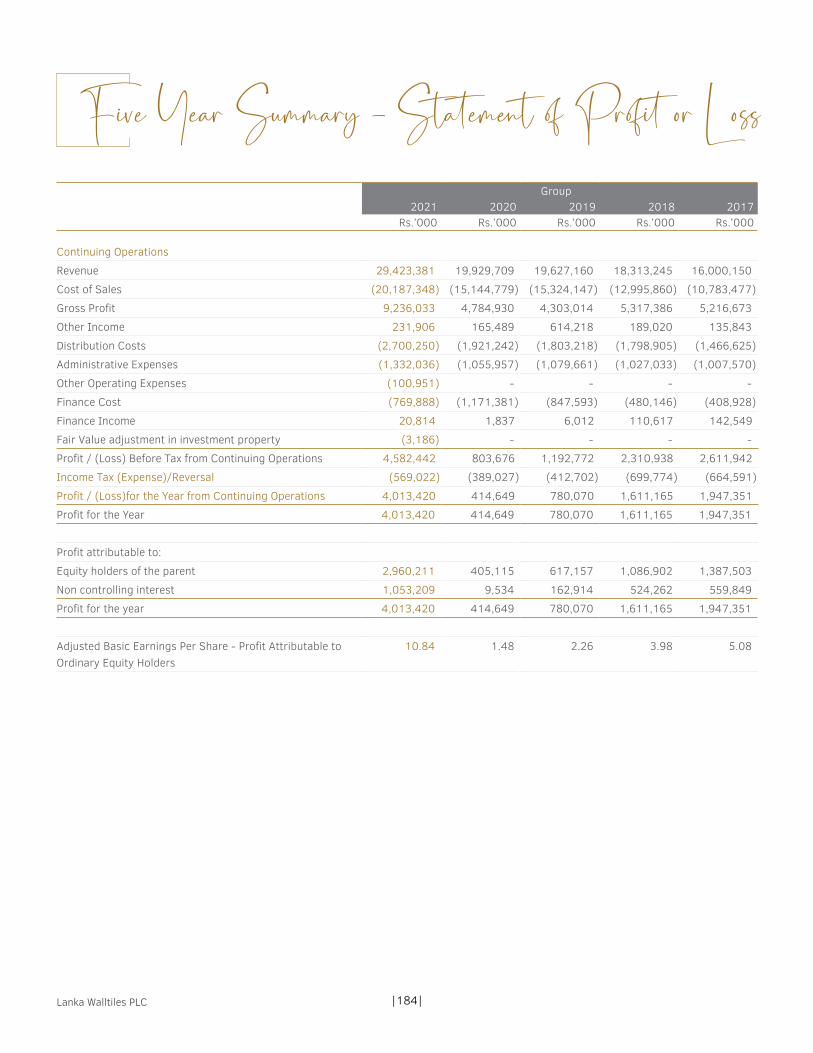
|184|Lanka Walltiles PLC
Group2021 2020 2019 2018 2017
Rs.’000 Rs.’000 Rs.’000 Rs.’000 Rs.’000
Continuing Operations
Revenue 29,423,381 19,929,709 19,627,160 18,313,245 16,000,150
Cost of Sales (20,187,348) (15,144,779) (15,324,147) (12,995,860) (10,783,477)
Gross Profit 9,236,033 4,784,930 4,303,014 5,317,386 5,216,673
Other Income 231,906 165,489 614,218 189,020 135,843
Distribution Costs (2,700,250) (1,921,242) (1,803,218) (1,798,905) (1,466,625)
Administrative Expenses (1,332,036) (1,055,957) (1,079,661) (1,027,033) (1,007,570)
Other Operating Expenses (100,951) - - - -
Finance Cost (769,888) (1,171,381) (847,593) (480,146) (408,928)
Finance Income 20,814 1,837 6,012 110,617 142,549
Fair Value adjustment in investment property (3,186) - - - -
Profit / (Loss) Before Tax from Continuing Operations 4,582,442 803,676 1,192,772 2,310,938 2,611,942
Income Tax (Expense)/Reversal (569,022) (389,027) (412,702) (699,774) (664,591)
Profit / (Loss)for the Year from Continuing Operations 4,013,420 414,649 780,070 1,611,165 1,947,351
Profit for the Year 4,013,420 414,649 780,070 1,611,165 1,947,351
Profit attributable to:
Equity holders of the parent 2,960,211 405,115 617,157 1,086,902 1,387,503
Non controlling interest 1,053,209 9,534 162,914 524,262 559,849
Profit for the year 4,013,420 414,649 780,070 1,611,165 1,947,351
Adjusted Basic Earnings Per Share - Profit Attributable to Ordinary Equity Holders
10.84 1.48 2.26 3.98 5.08
Five Year Summary - Statement of Profit or Loss

|185| Annual Report 2020/21
Company2021 2020 2019 2018 2017
Rs.’000 Rs.’000 Rs.’000 Rs.’000 Rs.’000
Continuing Operations
Revenue 5,988,521 3,493,619 3,220,934 3,316,247 3,345,337
Cost of Sales (3,922,084) (2,537,014) (2,291,881) (2,106,806) (2,013,574)
Gross Profit 2,066,437 956,605 929,053 1,209,441 1,331,763
Other Income 823,986 36,823 214,793 424,965 309,426
Distribution Costs (751,723) (528,566) (483,030) (445,167) (381,220)
Administrative Expenses (211,242) (185,660) (206,134) (208,646) (210,028)
Other Operating Expenses (40,989) - - - -
Finance Cost (130,938) (220,077) (166,487) (113,185) (105,269)
Profit / (Loss) Before Tax from Continuing Operations 1,755,531 59,124 288,196 867,409 944,673
Income Tax (Expense)/Reversal (138,013) (21,099) (56,915) (176,368) (171,908)
Profit / (Loss)for the Year from Continuing Operations 1,617,518 38,026 231,281 691,041 772,765
Profit for the Year 1,617,518 38,026 231,281 691,041 772,765
Profit attributable to:
Equity holders of the parent 1,617,518 38,026 231,281 691,041 772,765
Profit for the year 1,617,518 38,026 231,281 691,041 772,765
Adjusted Basic Earnings Per Share - Profit Attributable to Ordinary Equity Holders
5.92 0.14 0.85 2.53 2.83

|186|Lanka Walltiles PLC
Group2021 2020 2019 2018 2017
Rs.'000 Rs.'000 Rs.’000 Rs.'000 Rs.'000
Non-current assetsProperty, plant and equipment 17,798,601 16,884,149 16,822,752 14,316,493 12,988,436 Consumable bilogical assets 630,578 632,177 585,920 536,575 490,535 Investment Property 813,619 816,805 816,805 459,407 - Intangible assets - goodwill 35,814 37,113 24,519 24,519 24,519 Investments in associates 170,000 - - - - Long term receivables - 27,285 27,285 27,285 27,285 Right of use assets 338,971 389,880 - - - Deferred tax asset - - 847 14,686 12,176
19,787,583 18,787,409 18,278,128 15,378,965 13,542,950
Current assetsInventories 6,484,986 10,226,419 8,316,920 6,113,247 4,313,824 Trade and other receivables 4,246,624 3,875,187 3,837,082 3,450,285 2,885,572 Contract Assets 40,164 38,079 58,269 - -Amounts due from related parties 63,324 48,450 37,016 55,427 8,729 Income tax receivable 49,231 30,336 123,962 60,854 24,674 Short term investments 3,877 3,754 3,499 3,239 3,296 Cash and cash equivalents 3,034,216 413,243 401,580 660,879 1,423,632
13,922,422 14,635,468 12,778,329 10,343,930 8,659,727 Total assets 33,710,005 33,422,877 31,056,458 25,722,894 22,202,677
EQUITY AND LIABILITIESEquity attributable to equity holders of the parentStated capital 787,765 787,765 787,765 787,765 787,765 Reserves 3,541,400 2,850,974 2,850,974 2,566,671 2,409,494 Retained earnings 10,242,050 7,982,331 7,602,813 7,162,378 6,597,189 Shareholders' funds 14,571,215 11,621,070 11,241,553 10,516,814 9,794,448
Non controlling interest 4,823,606 3,936,582 3,943,554 3,897,935 3,764,563 Total equity 19,394,821 15,557,652 15,185,107 14,414,750 13,559,011
Non-current liabilitiesInterest bearing liabilities 2,572,712 2,765,040 2,950,245 1,712,118 1,773,267 Deferred tax liabilities 1,879,638 2,421,476 2,341,613 2,032,023 1,042,939 Retirement benefit liability 1,071,475 975,933 882,161 778,830 656,086 Deferred income & Capital grants 118,995 122,832 125,726 136,532 138,189
5,642,820 6,285,281 6,299,745 4,659,503 3,610,480 Current liabilitiesTrade and other payables 4,034,728 2,785,122 3,117,585 2,714,644 1,789,552 Contract liability 85,407 14,843 79,177 - -Income tax liabilities 497,320 45,924 9,829 81,844 168,839 Amounts due to related parties 85,957 90,903 100,613 48,528 17,045 Current portion of interest bearing liabilities 3,968,952 8,643,152 6,264,402 3,803,622 3,057,748
8,672,364 11,579,944 9,571,606 6,648,638 5,033,184 Total equity and liabilities 33,710,005 33,422,877 31,056,458 25,722,894 22,202,677
Five Year Summary - Statement of Financial Position

|187| Annual Report 2020/21
Company2021 2020 2019 2018 2017
Rs.'000 Rs.'000 Rs.’000 Rs.'000 Rs.'000
Non-current assetsProperty, plant and equipment 4,603,885 4,524,000 4,536,281 4,114,548 3,323,749 Investments in subsidiaries 1,276,096 1,276,096 1,276,096 1,276,096 1,276,097 Right of use assets 33,785 57,885
5,913,766 5,857,981 5,812,377 5,390,644 4,599,845
Current assetsInventories 1,410,768 2,762,580 2,224,608 1,606,272 1,335,580 Trade and other receivables 792,031 673,756 814,889 725,049 499,333 Amounts due from related parties 70,690 64,981 72,756 34,628 17,739 Short term investments 3,877 3,754 3,499 3,239 3,296 Cash and cash equivalents 279,697 47,776 33,240 61,004 43,372
2,557,063 3,552,847 3,148,992 2,430,193 1,899,321 Total assets 8,470,829 9,410,828 8,961,369 7,820,837 6,499,167
EQUITY AND LIABILITIESEquity attributable to equity holders of the parentStated capital 787,765 787,765 787,765 787,765 787,765 Reserves 2,057,891 1,812,082 1,812,083 1,531,815 1,237,011 Retained earnings 3,645,057 2,770,701 2,739,853 2,661,459 2,494,799 Shareholders' funds 6,490,713 5,370,548 5,339,701 4,981,039 4,519,576
Total equity 6,490,713 5,370,546 5,339,701 4,981,039 4,519,576
Non-current liabilitiesInterest bearing liabilities 39,922 72,735 119,134 165,180 324,981 Deferred tax liabilities 623,783 967,884 989,442 887,282 367,375 Retirement benefit liability 173,041 142,902 118,746 108,706 75,825
836,746 1,183,521 1,227,322 1,161,169 768,180 Current liabilitiesTrade and other payables 635,763 483,266 666,730 479,476 414,318 Contract liability 30,350 - - - -Income tax liabilities 201,192 12,841 8,402 23,833 72,269 Amounts due to related parties 79,878 146,043 191,377 167,860 86,707 Current portion of interest bearing liabilities 196,187 2,214,611 1,527,838 1,007,459 638,118
1,143,370 2,856,761 2,394,346 1,678,628 1,211,412 Total equity and liabilities 8,470,829 9,410,828 8,961,369 7,820,837 6,499,167
Five Year Summary - Statement of Financial Position

|188|Lanka Walltiles PLC
20 MAJOR SHAREHOLDERS OF THE COMPANY
NAME No. of Shares No. of Shares
31-03-2021 % 31-03-2020 %
1 ROYAL CERAMICS LANKA PLC 148,921,090 54.550 29,784,218 54.550
2 MR. A A PAGE 25,548,780 9.359 5,159,756 9.450
3 ARUNODHAYA INVESTMENTS (PRIVATE) LIMITED 6,313,345 2.313 1,262,669 2.313
4 ARUNODHAYA (PRIVATE) LIMITED 6,313,345 2.313 1,262,669 2.313
5 ARUNODHAYA INDUSTRIES (PRIVATE) LIMITED 6,313,345 2.313 1,262,669 2.313
6 SRI LANKA INSURANCE CORPORATION LTD-LIFE FUND 4,038,000 1.479 807,600 1.479
7 MRS. A SELLIAH 3,733,895 1.368 746,779 1.368
8 MRS. A KAILASAPILLAI 3,486,670 1.277 697,334 1.277
9 ANDYSEL PRIVATE LIMITED 2,100,000 0.769 420,000 0.769
10 MR. K ARAVINTHAN 1,680,000 0.615 336,000 0.615
11 MR. W G D C RANAWEERA 1,629,470 0.597 - 0.000
12 MR. M N DEEN 1,412,500 0.517 - 0.000
13 HATTON NATIONAL BANK PLC/MR GERAD SHAMIL NIRANJAN PERIS 1,239,665 0.454 64,000 0.117
14 BANK OF CEYLON A/C CEY BANK CENTURY GROWTH FUND 1,124,915 0.412 199,760 0.366
15 CAPITAL TRUST HOLDINGS LTD 1,065,500 0.390 - 0.000
16 MR. K A S R NISSANKA 1,053,825 0.386 40,000 0.073
17 COMMERCIAL BANK OF CEYLON PLC/CAPITAL TRUST HOLDINGS LIMITED 1,000,495 0.366 - 0.000
18 AMES TILE & STONE LTD 887,250 0.325 177,450 0.325
19 HATTON NATIONAL BANK PLC/ HENNASY GEETH BALASURIYA 875,075 0.321 - 0.000
20 MR. S VASUDEVAN 845,795 0.310 121,788 0.223
SUB TOTAL 219,582,960 80.433 42,342,692 77.551
OTHER 12,272 SHAREHOLDERS 53,417,040 19.567 12,257,308 22.449
ISSUED CAPITAL 273,000,000 100.000 54,600,000 100.000
Major Shareholders
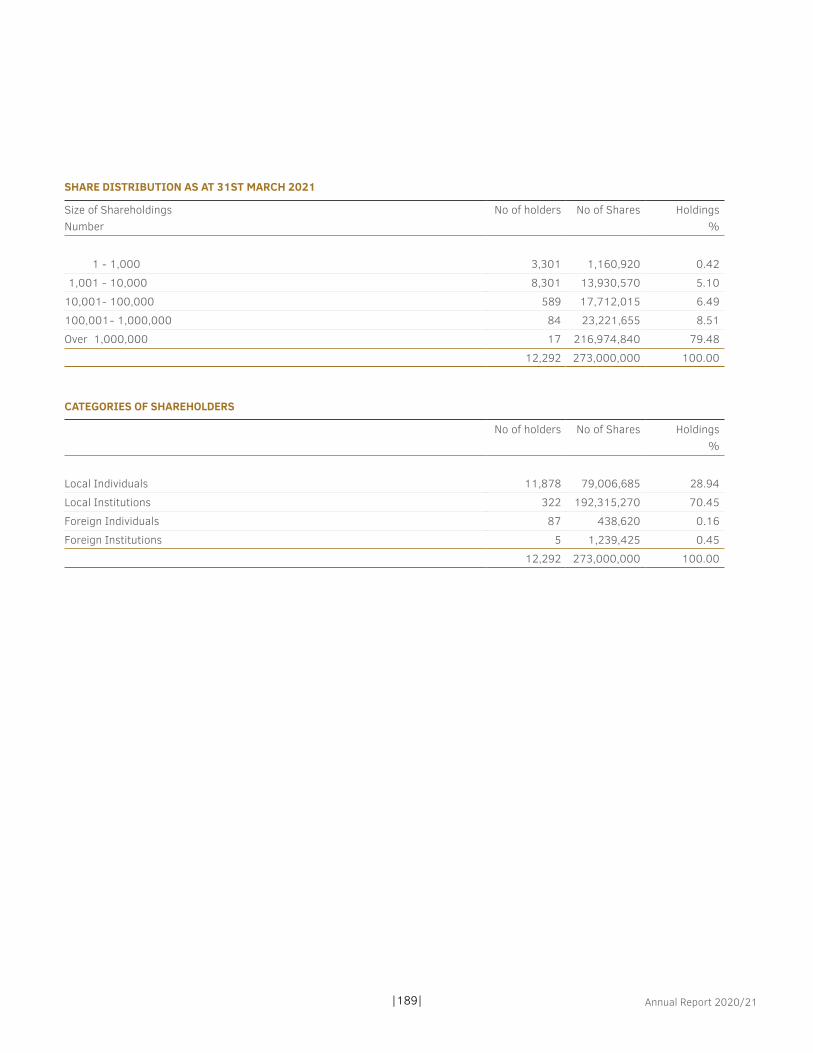
|189| Annual Report 2020/21
SHARE DISTRIBUTION AS AT 31ST MARCH 2021
Size of ShareholdingsNumber
No of holders No of Shares Holdings %
1 - 1,000 3,301 1,160,920 0.42
1,001 - 10,000 8,301 13,930,570 5.10
10,001 - 100,000 589 17,712,015 6.49
100,001 - 1,000,000 84 23,221,655 8.51
Over 1,000,000 17 216,974,840 79.48
12,292 273,000,000 100.00
CATEGORIES OF SHAREHOLDERS
No of holders No of Shares Holdings %
Local Individuals 11,878 79,006,685 28.94
Local Institutions 322 192,315,270 70.45
Foreign Individuals 87 438,620 0.16
Foreign Institutions 5 1,239,425 0.45
12,292 273,000,000 100.00
Major Shareholders

|190|Lanka Walltiles PLC
DIRECTORS’ & CEO’S SHAREHOLDING AS AT 31ST MARCH 2021
Name of Director No. of shares %
Mr. Dhammika Perera - -Mr. A M Weerasinghe - -Mr. J A P M Jayasekera 995 0.000Dr. S Selliah - -Mr. T G Thoradeniya - -Mr. K D G Gunaratne - -Ms. A M L Page - -Mr. M W R N Somaratne 55,000 0.020Mr. J D N Kekulawala - -Mr. S M Liyanage - -Mr. S R Jayaweera (Appointed w.e.f 09th October 2020) - -
The fractional shares of 210 arising from the Sub division were issued jointly in the names of Mr. A A Page and Mr. L De Chikera
The fractional shares of 2,445 arising from the Sub division of shares were issued jointly in the names of Mr. A A Page and Mr. J A P M Jayasekera.
SHARE PRICE FOR THE YEAR
2021 2020
Market price per share
Highest during the year - 29-01-2021 Rs. 340.00 -(29-01-2021) Rs. 81.50 -(29-11-2019)
Lowest during the year - 12-05-2020 Rs. 39.00 -(12-05-2020) Rs. 40.00 -(20-03-2020)
As at end of the year Rs. 37.70* -(26-03-2021) Rs. 41.10
*Closing share price was arrived at by dividing the closing price as at 26th March 2021 by 5 to reflect the closing price of a sub divided share
Number of Transactions during the year 36,796
Number of Shares traded during the year 26,960,935
Value of shares traded during the year Rs. 4,010,174,820.35
PUBLIC HOLDING
Public Holding
The Percentage of shares held by the Public as at 31st March 2021 26.958%
No of public shareholders representing the above percentage 12,278
The float adjusted market capitalization as at 31st March 2021 is Rs. 2,774,513,215.50**
**“The last day of trading during the quarter was 26th March 2021, on which day shares were traded prior to being sub divided .The closing price of the share on that day was Rs.188.50, which should therefore be taken as the closing price of the share. If the said price is applied to calculate the market capitalization based on the number of shares post sub division, it will not be an accurate reflection of the Market Capitalization. Therefore the said price of Rs. 188.50 was divided by 5 to reflect the closing price of a sub divided share.
The Float adjusted market capitalization of the Company falls under Option 4 of Rule 7.13.1 (a) of the Listing Rules of the Colombo Stock Exchange and the Company has complied with the minimum public holding requirement applicable under the said Option.
Major Shareholders

|191| Annual Report 2020/21
2021 % 2020 % 2019 % 2018 % 2017 Rs.'000 % Rs.'000 % Rs.’000 % Rs.’000 % Rs.’000 %
GroupTurnover 29,423,381 19,929,709 19,627,160 18,313,245 16,000,150 Other income 252,720 167,326 620,230 299,637 278,392 Cost of material and services purchased
(20,605,995) (14,013,881) (14,409,902) (12,438,227) (10,303,206)
Value Added 9,070,106 6,083,155 5,837,488 6,174,655 5,975,336
To employees as remuneration
3,625,222 59.6 3,116,945 51.2 2,874,779 49.2 3,037,814 49.2 2,747,892 46.0
To providers of funds as interest
769,888 12.7 1,171,381 19.3 847,593 14.5 486,146 7.9 408,146 6.8
To state as taxes 569,022 9.4 389,028 6.4 412,702 7.1 699,774 11.3 664,591 11.1 To shareholders as dividends
742,560 12.2 - 0.0 163,800 2.8 518,700 8.4 409500 6.9
Depreciation 1,103,695 18.1 1,026,284 16.9 813,876 13.9 709,855 11.5 636,109 10.6 Reserves 2,259,719 37.1 379,516 6.2 724,739 12.4 722,366 11.7 1,109,098 18.6 Total 9,070,106 149.1 6,083,155 100.0 5,837,488 100.0 6,174,655 100.0 5,975,336 100.0
Statement of Value AddedGRI - 201-1

|192|Lanka Walltiles PLC
Notes

|193| Annual Report 2020/21

|194|Lanka Walltiles PLC
NOTICE IS HEREBY GIVEN that the Forty Fourth (44th) Annual General Meeting of Lanka Walltiles PLC will be held by way of electronic means on the 30th day of June 2021 at 10.30 a.m. centered at the Board Room of Royal Ceramics Lanka PLC, No. 20, R A de Mel Mawatha, Colombo 03 for the following purposes:
1. To receive and consider the Annual Report of the Board of Directors on the affairs of the Company and the Statement of Accounts for the year ended 31st March 2021 and the Report of the Auditors thereon.
2. To re-elect Mr. A M Weerasinghe, who retires by rotation in terms of Articles 103 and 104 of the Articles of Association, as a Director of the Company.
3. To re-elect Dr. S Selliah, who retires by rotation in terms of Articles 103 and 104 of the Articles of Association, as a Director of the Company.
4. To re-elect Mr. T G Thoradeniya, who retires by rotation in terms of Articles 103 and 104 of the Articles of Association, as a Director of the Company.
5. To elect Mr. S R Jayaweera who retires in terms of the Articles of Associations, as a Director of the Company.
6. To re-appoint Messrs Ernst & Young, Chartered Accountants, the retiring Auditors and to authorize the Directors to determine their remuneration.
7. To authorize the Directors to determine Donations for the ensuing year.
By Order of the BoardLANKA WALLTILES PLC
P W Corporate Secretarial (Pvt) LtdDirector / Secretaries
At Colombo31st May 2021
Notes:
1) A shareholder entitled to attend or attend and vote at the Meeting is entitled to appoint a Proxy who need not be a shareholder, to attend and vote instead of him/her. A Proxy need not be a member of the Company. A Form of Proxy is enclosed for this purpose.
2) A Form of Proxy is enclosed in this Report.
3) The completed Form of Proxy should be deposited at the Registered Office of the Company, No. 215, Nawala Road, Narahenpita, Colombo 05, not less than forty-eight (48) hours before the time fixed for the commencement of the Meeting.
Notice of Meeting
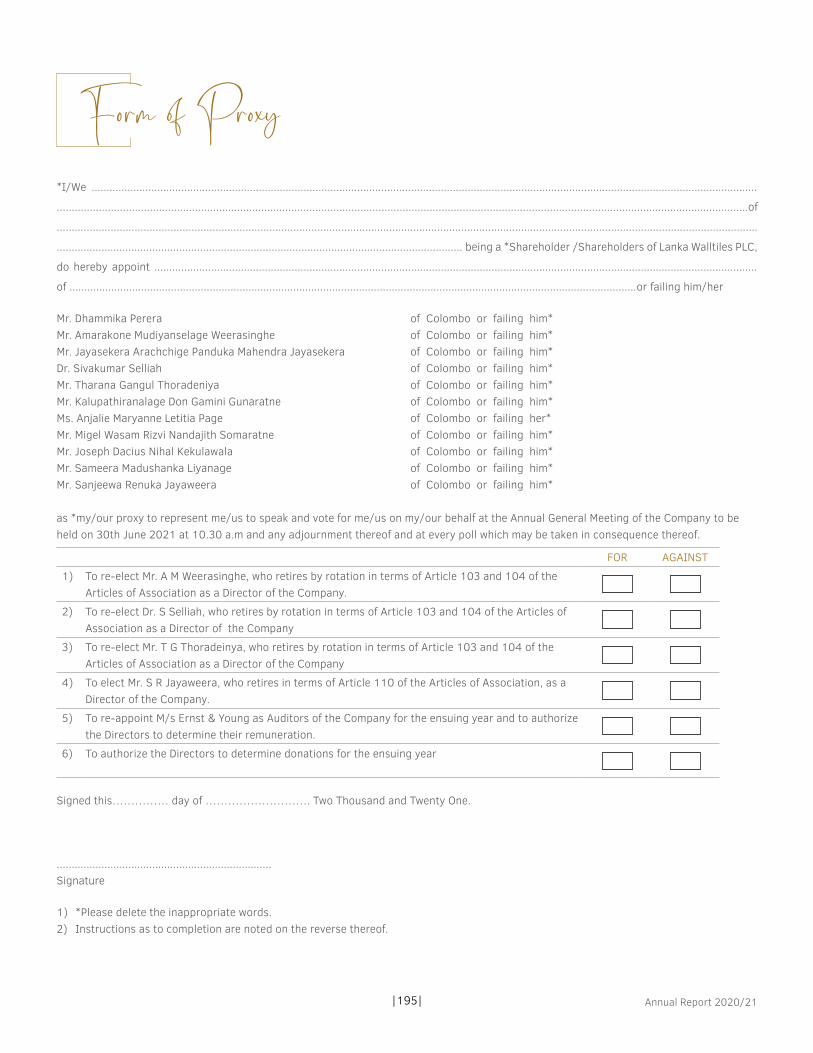
|195| Annual Report 2020/21
*I/We ...............................................................................................................................................................................................................................
......................................................................................................................................................................................................................................of
..........................................................................................................................................................................................................................................
........................................................................................................................................ being a *Shareholder /Shareholders of Lanka Walltiles PLC,
do hereby appoint ..........................................................................................................................................................................................................
of ..............................................................................................................................................................................................or failing him/her
Mr. Dhammika Perera of Colombo or failing him*Mr. Amarakone Mudiyanselage Weerasinghe of Colombo or failing him*Mr. Jayasekera Arachchige Panduka Mahendra Jayasekera of Colombo or failing him*Dr. Sivakumar Selliah of Colombo or failing him*Mr. Tharana Gangul Thoradeniya of Colombo or failing him*Mr. Kalupathiranalage Don Gamini Gunaratne of Colombo or failing him*Ms. Anjalie Maryanne Letitia Page of Colombo or failing her*Mr. Migel Wasam Rizvi Nandajith Somaratne of Colombo or failing him*Mr. Joseph Dacius Nihal Kekulawala of Colombo or failing him*Mr. Sameera Madushanka Liyanage of Colombo or failing him*Mr. Sanjeewa Renuka Jayaweera of Colombo or failing him*
as *my/our proxy to represent me/us to speak and vote for me/us on my/our behalf at the Annual General Meeting of the Company to be held on 30th June 2021 at 10.30 a.m and any adjournment thereof and at every poll which may be taken in consequence thereof.
FOR AGAINST
1) To re-elect Mr. A M Weerasinghe, who retires by rotation in terms of Article 103 and 104 of the Articles of Association as a Director of the Company.
2) To re-elect Dr. S Selliah, who retires by rotation in terms of Article 103 and 104 of the Articles of Association as a Director of the Company
3) To re-elect Mr. T G Thoradeinya, who retires by rotation in terms of Article 103 and 104 of the Articles of Association as a Director of the Company
4) To elect Mr. S R Jayaweera, who retires in terms of Article 110 of the Articles of Association, as a Director of the Company.
5) To re-appoint M/s Ernst & Young as Auditors of the Company for the ensuing year and to authorize the Directors to determine their remuneration.
6) To authorize the Directors to determine donations for the ensuing year
Signed this…………… day of ………………………. Two Thousand and Twenty One.
........................................................................Signature
1) *Please delete the inappropriate words.2) Instructions as to completion are noted on the reverse thereof.
Form of Proxy

|196|Lanka Walltiles PLC
INSTRUCTIONS AS TO COMPLETION
1. The full name, National Identity Card number and the registered address of the shareholder appointing the Proxy and the relevant details of the Proxy should be legibly entered in the Form of Proxy which should be duly signed and dated.
2. The Proxy shall –
(a) In the case of an individual be signed by the shareholder or by his/her attorney, and if signed by an Attorney, a notarially certified copy of the Power of Attorney should be attached to the completed Proxy if it has not already been registered with the Company.
(b) In the case of a company or corporate / statutory body either be under its Common Seal or signed by its Attorney or by an Officer on behalf of the company or corporate / statutory body in accordance with its Articles of Association or the Constitution or the Statute (as applicable).
3. Please indicate with a ‘X’ how the Proxy should vote on each resolution. If no indication is given, the Proxy in his/her discretion will vote as he/she thinks fit.
4. To be valid, the completed Form of Proxy must be deposited with the Company Secretaries, P W Corporate Secretarial (Pvt) Ltd at No. 3/17, Kynsey Road, Colombo 08, Sri Lanka or must be emailed to [email protected] before the time fixed for the meeting.
NAME OF THE COMPANY Lanka Walltiles PLC LEGAL FORMLanka Walltiles PLC is a public limited liability company which was incorporated under the Companies Ordinance No.51 of 1938 as a public company on 24th day of September 1975. Pursuant to the requirements of the new Companies Act No. 7 of 2007, the Company was re-registered on 24th July 2007 and bears registration number PQ 55. DIRECTORSMr. Dhammika Perera (Chairman)Mr. A M Weerasinghe (Deputy Chairman) Mr. J A P M Jayasekera (Managing Director) Dr. S SelliahMr. T G Thoradeniya Mr. K D G GunaratneMs. A M L Page Mr. M W R N Somaratne Mr. J D N KekulawalaMr. S M Liyanage
REGISTERED OFFICE215, Nawala Road, Narahenpita, Colombo 05 Telephone : + 94 -11 - 4526700Facsimile : + 94 -11 - 2805463E-mail : [email protected] : www.lankatiles.com
FACTORY Meepe, Padukka Telephone : + 94 - 11 - 4309809 Facsimile : + 94 - 11 - 2859168 E-mail : [email protected] PARENT COMPANY Royal Ceramics Lanka PLC No. 20, R A De Mel Mawatha Colombo 03 Telephone : + 94 - 11 - 4799400 Facsimile : + 94 - 11 - 4720077 Website : www.rocell.com
SECRETARIES P W Corporate Secretarial (Pvt) Ltd No. 3/17, Kynsey Road Colombo 08 Telephone : + 94 - 11 - 4640360-3 Facsimile : + 94 - 11 - 4740588 E-mail : [email protected]
BANKERS Commercial Bank of Ceylon PLC Hatton National Bank PLC Bank of Ceylon HSBC Bank People’s Bank DFCC Bank PLC Sampath Bank PLC
AUDITORS Ernst & Young Chartered Accountants 201, De Saram Place Colombo 10
Corporate InformationGRI - 102-3,102-5
