define: development of an evaluation framework for … · understand restrictions for...
TRANSCRIPT

ww
w.o
eko.
de
DEFINE: Development of an Evaluation Framework for the Introduction of Electromobility
Two electromobility scenarios for Germany: Market development and their impact on CO2 emissions of passenger cars in DEFINE Abschlussbericht für das Vorhaben ERA-NET Plus Electromobility+ DEFINE: Bestimmung der Marktpotenziale von Elektrofahrzeugen bis zum Jahr 2030 und die Betrachtung von deren Beitrag zum Klimaschutz im Verkehrssektor im Rahmen von Szenarioanalysen
Berlin, 14.11.2014
Authors Peter Kasten Florian Hacker
Head Office Freiburg P.O. Box 17 71 79017 Freiburg Street address Merzhauser Strasse 173 79100 Freiburg Tel. +49 761 45295-0 Office Berlin Schicklerstrasse 5-7 10179 Berlin Tel. +49 30 405085-0 Office Darmstadt Rheinstrasse 95 64295 Darmstadt Tel. +49 6151 8191-0 [email protected] www.oeko.de

Acknowledgement: We would like to thank our colleges from Institut für sozial-ökologische Forschung, Frankfurt, (ISOE) for the support and the work regarding the results of the conjoint analysis that was conducted jointly during this project.

DEFINE: Market development and CO2 emissions (Germany)
Table of Contents
List of Figures 4
List of Tables 5
Summary 7
Zusammenfassung 10
1. Background and motivation 13
1.1. DEFINE – Consortium and concept 13
2. Defining two scenarios – Business-As-Usual (BAU) and Electromobility+ (EM+) 14
2.1. Passenger car technology and costs 15
2.2. Fuel and electricity retail prices 17
2.3. Charging infrastructure 18
3. Market shares and stock of electric vehicles 19
3.1. Methodology and interim results 19
3.1.1. General demand of transportation – Analysis of MiD 2008 data 21
3.1.2. Modelling the purchase decisions – conjoint analysis and potential market shares 23
3.1.3. Market diffusion – consideration of a diffusion factor 27
3.2. Market shares of electric vehicles 28
3.3. Vehicle stock of electric passenger cars 30
4. Electricity dispatch modelling and electric vehicle car usage patterns 31
4.1. Electric vehicle car usage patterns 32
4.2. Electricity dispatch modelling – Two different modes of charging electric vehicles 35
5. Electricity demand and CO2 emissions of electric vehicles 35
6. Conclusion 39
List of References 41
Annex 42
Annex I. Electric vehicle car usage pattern 42
3
DEFINE: Market development and CO2 emissions (Germany)
List of Figures
Figure 3-1: Scheme of methodology for derivation of market share of electric vehicles 20
Figure 3-2: Share of car parking location when the car is parked at home 22 Figure 3-3: Probability of five or more trips per year that exceed the maximum
mileage of BEV (150 km) – Poisson distribution 23 Figure 3-4: Example of conjoint task 24 Figure 3-5: Market diffusion factor development for electric vehicles in DEFINE –
ratio of potential market share 28 Figure 3-6: Passenger car market structure per size class in 2020 and 2030 –
variation in propulsion system 29 Figure 3-7: Total number of electric vehicle new car registrations in 2020 and 2030 30 Figure 3-8: Vehicle stock of electric cars in 2020 and 2030 31 Figure 5-1: CO2 impact of electric vehicles to transport sector and electricity sector
in 2020 and 2030 (M t CO2) – user = user-driven charging; cost = cost-driven charging 36
Figure 5-2: CO2 impact of electric vehicles on transport sector and electricity sector in 2030 (M t CO2) – RE+ scenario (added renewable electricity production capacities) 38
4 ….

DEFINE: Market development and CO2 emissions (Germany)
List of Tables
Table 2-1: Assumptions of battery costs and battery technology development 16 Table 2-2: Assumptions of average specific CO2 emission of conventional cars,
2010 - 2030 17 Table 2-3: Assumptions of fees and rebates of the feebate system in EM+ scenario 17 Table 2-4: Assumptions of energy retail prices for car users 18 Table 3-1: Assumptions of new car registration structure – spatial resolution and
conventional vehicles structure 20 Table 3-2: Characteristics of average passenger cars in the BAU scenario 25 Table 3-3: Characteristics of average passenger cars in EM+ scenario 26 Table 3-4: Market potential of electric vehicles in 2020 and 2030 – divided into
new car buyer groups (size class, spatial planning classification of car owners’ home and parking opportunity at their own property) 27
Table 4-1: Electric vehicle car usage pattern – weekday; mid-size cars 33 Table I-1: Electric vehicle car usage pattern – weekday; core city 42 Table I-2: Electric vehicle car usage pattern – weekday; outskirts/rural area 42 Table I-3: Electric vehicle car usage pattern – Saturday; core city 43 Table I-4: Electric vehicle car usage pattern – Saturday; outskirts/rural area 43 Table I-5: Electric vehicle car usage pattern – Sunday; core city 44 Table I-6: Electric vehicle car usage pattern – Sunday; outskirts/rural area 44
5

DEFINE: Market development and CO2 emissions (Germany)
Summary
The electric vehicle market penetration and the vehicle stock in Germany up to 2030 are derived as part of the developed modelling framework DEFINE that analyses emission and economic effects of market introduction of electromobility. The vehicle stock data is integrated into an electricity dispatch model to illustrate the interactions of electric vehicles’ power demand and the electricity production. Finally, the CO2 emissions of transport and electricity sector are analysed to show the net CO2 impact of electromobility.
Two scenarios are developed to compare the impact of different electric vehicle market developments and to better understand the impact of policy measures for electromobility market support. Three policy measures that improve the economics of electric vehicle usage in comparison to conventional car usage are applied in the EM+ (electromobility+) scenario. The continuation of current policies is assumed in the BAU (business as usual) scenario.
As a first step for derivation of the electric vehicle market, mobility data has been analysed to understand restrictions for electromobility usage. The access to a battery charging spot is a relevant requirement for electric driving. Roughly 70 % of car owners in Germany have a parking spot at their property at their disposal and have the opportunity to install a private charging station. Differences are evident when comparing car owners in core cities (40 – 50 % parking at their own properties) and the outskirts of cities and rural areas (70 – 80 %). Further restrictions for BEV usage occur in the case of long trips that exceed maximum mileage of BEV. This occurs more frequently for mid-size and large cars. Surprisingly, more trips exceeding the maximum mileage of BEV are conducted by car owners in core cities and the restrictions with regard to long trips are more cumbersome for these car owners.
A conjoint analyse has been conducted to simulate the purchase decisions of new car buyers. Approximately 1,500 potential new car buyers were shown a set of a conventional car, a PHEV/REEV and a BEV with randomly varying characteristics to simulate a purchase decision (18 times) and statistical methods are applied to simulate the selection process between potential cars with different propulsion systems in 2020 and 2030. The analyses show higher acceptance of PHEV/REEV than for BEV and the selection of electric vehicles increases from nearly 50 % in the BAU scenario to nearly 58 % in the EM+ scenario. This effect of a higher selection rate of electric vehicles is especially evident with large cars. There is the tendency that purchase of an electric vehicle is the highest with mid-size cars and, counter-intuitively, with car buyers that do not have the possibility of parking the car at their own properties. New car buyers that live in the core city also show higher acceptance of electric vehicles.
The results from the conjoint analysis and the analysis of mobility data are combined to obtain a potential market development that is attenuated by application of a market diffusion factor which considers the lack of variety of electric vehicle models and the time period that is required by the car makers to establish the electric vehicle production facilities and processes. The derived market development is used as input for the TEMPS (transport emissions and policy scenario) model to calculate the vehicle stock and the energy consumption of its cars. The policy measures of EM+ scenarios show their efficiency to support electric vehicle market penetration and more than 5.1 million electric vehicles (~ 13 % of vehicle stock) are registered in 2030. The electric vehicle stock is considerably smaller in the BAU scenario and nearly 10 % of the vehicle stock (3.9 million) are electric driven cars.
Mobility data has been used to derive electric car usage patterns for a complete year (hourly resolution) in order to add the charging of electric vehicles to the DIW electricity dispatch model.
7

DEFINE: Market development and CO2 emissions (Germany)
Information on connectivity to charging stations has been added according to the assumptions of the development of charging infrastructure. Two charging modes are applied in the electricity dispatch modelling: user-driven charging (batteries are fully recharged immediately after being connected to a charging station) and cost-driven charging (the cost of electricity production is minimised upon the condition that all trips of the considered electric vehicle usage patterns are satisfiable). The electricity production capacities and the electricity consumption of the other application sectors are derived from the Netzentwicklungsplan Strom 2013 (German Network Development Plan for Electricity 2013) for the time period up to 2030.
The application of electromobility lowers the CO2 emissions of the transport sector, but might increase the emissions that arise from electricity production due to the additional demand for electricity. Thus, a net CO2 balance of emission changes of the transport and the electricity sector compared to a base scenario with no electric vehicles has been prepared for both scenarios of DEFINE. The increase of the CO2 emissions of the electricity sector outweighs the emission mitigation of the transport in the BAU scenario and the net CO2 emissions rise by 1.0 – 1.6 M t CO2 in 2030 in comparison to the scenario without electric vehicles. The net CO2 emissions increase up to 2020 in the EM+ scenario, but there is a net GHG benefit in 2030 which is mainly facilitated by better energy efficiency levels of conventional cars (driven by lower emission targets of CO2 emission regulation). It is obvious from the net CO2 balance that the addition of electric vehicles to the energy system not only increases the use of renewable capacities, but also enhances the operation hours of fossil power plants when the framework conditions of the Netzentwicklungsplan Strom 2013 are applied.
It is evident that there is a difference in electricity production by simulating varying charging modes of electric vehicles. User-driven charging adds an inflexible load curve to the electricity sector and the electric vehicles are recharged immediately and as fast as possible after being connected to the grid. Thus, renewable energy is accidentally integrated into the energy system, but also fossil power plants enhance their operation in hours at which fossil power plants are the marginal electricity production capacity. Cost-driven charging minimises the cost of electricity production and shifts the recharging of electric vehicles (and the additional power production) preferably to hours of renewable surplus production and to hours at which lignite and hard-coal power plants are the marginal capacity of the power market (night hours). Thus, the renewable capacities are integrated to a maximum. But yet the CO2 emissions are lower in the case of user-driven charging as – contrary to the cost-driven case - the operation hours of gas power plants rather than of lignite and hard coal power plants
Full GHG emission benefit is gained when no additional CO2 emissions are produced in the electricity sector compared to the base case with no electromobility. Renewable capacities which produce the amount of energy that is consumed by the electric vehicle stock are added to the electricity production fleet. Whether and how these added renewable capacities can be integrated into the energy system is analysed. Electricity dispatch model runs that apply user-driven charging for the EM+ scenario show no additional CO2 emissions of the electricity generation sector and the CO2 net benefit is as high as 6.8 M t CO2 in 2030. The integration of the added renewable capacities does not succeed as perfectly when the cost-driven charging mode is simulated. The net CO2 benefit of the market introduction of electric vehicles is as high as 6.5 M t CO2 in this case since some charging is still shifted to low short-term marginal cost production of lignite and hard-coal power plants.
This study, which has been conducted as part of the DEFINE project, shows that there are policy measures which strongly facilitate the market introduction of electric vehicles. The electric vehicle stock increases from 3.9 million (BAU) to more than 5.1 million (EM+) passenger cars in 2030. It is
8 ….

DEFINE: Market development and CO2 emissions (Germany)
also seen that electromobility contains the potential of CO2 emission mitigation of the transport sector, but this potential is not exploited automatically. The electricity production capacities have to be carefully assessed in order to not add CO2 emissions in the electricity production sector compared to a scenario without electromobility. This has been carried out in this study and additional renewable capacities are added to the electricity production fleet derived from the Netzentwicklungsplan Strom 2013. Finally, it is illustrated that it is possible to achieve the full potential of GHG emission mitigation of electric vehicles and that electric vehicles are able to fulfil their role as one part of a GHG emission mitigation strategy for the transport sector.
9

DEFINE: Market development and CO2 emissions (Germany)
Zusammenfassung
Der Modellverbund DEFINE untersucht die Emissionsfreisetzung und die ökonomischen Auswirkungen der Markteinführung von Elektromobilität. Dazu wird in zwei Szenarien der Markthochlauf und der Fahrzeugbestand in Deutschland bis zum Jahr 2030 abgeleitet. Der elektrische Fahrzeugbestand wird daraufhin in ein Strommarktmodell eingespeist, um die Wechselwirkungen zwischen der Stromnachfrage durch die Elektromobilität und der Stromproduktion abzubilden. Im abschließenden Schritt werden die CO2-Emissionen des Verkehrs- und des Stromsektors berechnet, um den Gesamtemissionseffekt von Elektromobilität aufzuzeigen.
Zwei Szenarien der Elektromobilität werden entwickelt, um einerseits die Auswirkungen unterschiedlicher Marktentwicklungen vergleichen zu können und um andererseits die Effekte von Politikmaßnahmen zur Marktunterstützung von elektrischen Fahrzeugen zu verstehen. Drei Politikmaßnahmen zur Verbesserung der Wirtschaftlichkeit der Elektrofahrzeugnutzung sind im EM+-Szenario (electromobility+) hinterlegt. Im Gegensatz dazu ist im BAU-Szenario (business as usual) die heutige Festlegung der Rahmenbedingungen abgebildet.
Zur Berücksichtigung der eingeschränkten Nutzungsmöglichkeiten der Elektromobilität werden bei der Ableitung der Marktentwicklung elektrischer Fahrzeuge zunächst Mobilitätsdaten von heute untersucht. Die Möglichkeit der Batterieladung ist eine entscheidende Voraussetzung für die Nutzung elektrischer Fahrzeuge. Rund 70 % der Fahrzeugbesitzer in Deutschland besitzen eine Parkmöglichkeit auf dem eigenen Grundstück und haben dadurch die Möglichkeit, einen Ladepunkt zu installieren. In Kernstädten besteht dabei wesentlich seltener die Parkmöglichkeit auf dem eigenen Grundstück (40 – 50 %) als in der Umgebung von Städten und in ländlichen Gegenden (70 – 80 %). Weitere Einschränkungen für rein batterieelektrische Fahrzeuge ergeben sich durch Fahrten, die die maximale Reichweite der Pkw überschreiten. Solche Fahrten ereignen sich häufiger mit mittleren und großen Pkw. Überraschenderweise unternehmen Pkw-Besitzer in Kernstädten häufiger Fahrten über der Maximalreichweite von rein batterieelektrischen Pkw und erhöhen somit die Einschränkungen für deren Nutzung.
Für die Simulation der Kaufentscheidung von Neuwagenkäufern wird eine Conjoint-Analyse durchgeführt. Dazu wurde ungefähr 1.500 potenziellen Neuwagenkäufern 18 Mal jeweils ein konventionelles, ein Plug-in Hybridfahrzeug und rein batterieelektrisches Fahrzeug mit zufällig, wechselnden Eigenschaften gezeigt, um die Wahlentscheidung zu simulieren. Im Folgenden werden statistische Methoden angewendet, um den Auswahlprozess zwischen den Pkw mit den verschiedenen Antriebssystemen für die Jahre 2020 und 2030 abzubilden. Im Allgemeinen zeigen die Untersuchungen eine höhere Akzeptanz für Plug-In Hybridfahrzeuge als für rein batterieelektrische Fahrzeuge und die Entscheidung für elektrische Fahrzeuge steigt von ca. 50 % im BAU-Szenario auf fast 58 % im EM+-Szenario. Die Steigerung von BAU zu EM+-Szenario ist am deutlichsten bei großen Pkw. Zudem lässt sich die Tendenz erkennen, dass der Erwerb von elektrischen Fahrzeugen bei mittleren und bei Fahrzeugkäufern ohne Stellplatz auf dem eigenen Grundstück am höchsten ist. Neuwagenkäufer in Kernstädten zeigen auch eine höhere Akzeptanz für Elektromobilität.
Die Ergebnisse der Conjoint-Analyse und der Auswertung der Mobilitätsdaten werden verknüpft, um die Marktentwicklung elektrischer Fahrzeuge ableiten zu können. Dabei wird das Ergebnis durch einen Diffusionsfaktor gedämpft, der die geringeren Auswahlmöglichkeiten an elektrischen Fahrzeugmodellen und die Zeit für den Aufbau der Produktionsketten durch die Hersteller berücksichtigt. Die abgeleitete Marktentwicklung wird als Eingangsgröße für das TEMPS-Modell (transport emissions and policy scenario) verwendet, um den Fahrzeugbestand und dessen
10 ….

DEFINE: Market development and CO2 emissions (Germany)
Energieverbrauch zu ermitteln. Die Politikmaßnahmen des EM+-Szenarios zeigen ihre Wirkung auf die Markteinführung von Elektromobilität und der Bestand steigt auf mehr als 5,1 Millionen elektrische Pkw (~ 13 % des Pkw-Bestands) in 2030. Im BAU-Szenario ist der Bestand an elektrischen Fahrzeugen erheblich geringer und reduziert sich auf ungefähr 10 % des Bestandes (ca. 3,9 Millionen).
Mit Hilfe von Mobilitätsdaten werden Nutzungsmuster elektrischer Fahrzeuge für ein vollständiges Jahr in stündlicher Auflösung abgeleitet, die zur Abbildung von Elektromobilität im Strommarktmodell des DIW genutzt werden. Informationen über die Verbindung zu Ladestationen werden gemäß den Annahmen zur Infrastrukturentwicklung zu den Nutzungsmustern hinzugefügt und es werden in der Abbildung des Strommarkts zwei verschiedene Lademodi untersucht: Im nutzergetriebenen Lademodus werden die Fahrzeugbatterien sofort nach Verbindung mit dem Stromnetz mit maximaler Ladeleistung geladen; im kostengetriebenen Lademodus wird die Aufladung der Fahrzeugbatterien vom Stromsystem unter der Bedingung der Durchführbarkeit aller hinterlegten Fahrten bei minimalen Stromerzeugungskosten durchgeführt und die Ladezeitpunkte und –leistungen somit teilweise verschoben. Die Stromerzeugungskapazitäten und die Stromnachfrage anderer Anwendungssektoren sind aus dem Netzentwicklungsplan Strom 2013 für den Zeitraum bis 2030 abgeleitet.
Elektromobilität verringert durch die Verdrängung fossiler Kraftstoffe die CO2-Emissionen des Verkehrssektors. Im Gegensatz dazu können sich die Emissionen des Stromsektors durch die zusätzliche Stromnachfrage der elektrischen Fahrzeuge erhöhen. Für beide Szenarien in DEFINE wird daher eine gemeinsame CO2-Bilanz für den Verkehrs- und Stromsektor erstellt, in der die Emissionen mit einem Szenario ohne elektrische Pkw verglichen werden. Im BAU-Szenario überwiegt der Anstieg der CO2-Emissionen im Stromsektor die Emissionsreduktion im Verkehrssektor, so dass die Netto-CO2-Emissionen im Jahr 2030 1,0 – 1,6 Millionen Tonnen über denen im Fall ohne Elektromobilität liegen. Im EM+-Szenario steigen die Emissionen durch Elektromobilität bis 2020, es liegt im Jahr 2030 aber eine Gesamtemissionsreduktion vor. Diese wird allerdings hauptsächlich durch die bessere Fahrzeugeffizienz konventioneller Pkw (aufgrund der Annahme niedrigerer Emissionszielwerte der EU CO2-Regulierung für Neufahrzeuge) erreicht. In der Netto-CO2-Bilanz wird deutlich, dass die zusätzliche Nachfrage durch Elektrofahrzeuge im Stromsystem nicht nur eine bessere Ausnutzung der erneuerbaren Stromerzeugungskapazitäten ermöglicht, sondern im Falle der Rahmenbedingungen des Netzentwicklungsplans Strom 2013 auch die Arbeitsstunden fossiler Kraftwerke erhöht.
In der Strommarktabbildung wird ebenfalls offensichtlich, dass bei den verschiedenen Lademodi unterschiedliche Erzeugungskapazitäten zum Einsatz kommen. Nutzergetriebenes Laden führt zu einer fest vorgegebenen Lastkurve durch Elektrofahrzeuge, da die Fahrzeugbatterien sofort nach der Verbindung zum Stromnetz mit maximaler Ladegeschwindigkeit aufgeladen werden. Erneuerbare Energien werden daher zufällig in das Energiesystem integriert; genauso werden fossile Kraftwerke stärker ausgelastet, wenn diese zum Zeitpunkt der Ladung die marginale Stromerzeugungskapazität darstellen. Beim kostengetriebenen Laden werden Kosten der Stromproduktion minimiert und die Ladung der Elektrofahrzeuge (und dadurch die die zusätzliche Last) wird bevorzugt in Stunden erneuerbarer Überschussproduktion und in Stunden, in denen Braunkohle- und Steinkohlekraftwerke die Grenzkraftwerke der Stromproduktion (oftmals Nachtstunden) darstellen, verschoben. Die erneuerbaren Energien werden im kostengetriebenen Lademodus somit bis zum Maximum in das Energiesystem integriert. Dennoch ergeben sich im nutzergetriebenen Lademodus die geringeren CO2-Emissionen, da sich im Gegensatz zum kostengetriebenen Fall vor allem die Nutzungsstunden von Gaskraftwerken, und nicht von Braunkohle- und Steinkohlekraftwerken, erhöhen.
11
DEFINE: Market development and CO2 emissions (Germany)
Der vollständige CO2-Vorteil von elektrischen Fahrzeugen ist erreicht, wenn im Vergleich zum Fall ohne Elektromobilität keine zusätzlichen CO2-Emissionen im Stromsektor auftreten. Daher werden zusätzliche erneuerbare Stromerzeugungskapazitäten in der Höhe der Stromnachfrage des elektrischen Fahrzeugbestands zum angenommen Kraftwerkspark hinzugefügt und es wird untersucht, ob und wie diese erneuerbaren Kapazitäten in das Energiesystem integriert werden können. Im Fall des nutzergetriebenen Ladens entstehen im EM+-Szenario keine zusätzlichen CO2-Emissionen durch die Stromnachfrage der Elektromobilität und die Emissionsreduktion im Verkehrs- und Stromsektor beträgt zusammen 6,8 Millionen Tonnen CO2. Die Integration der zusätzlichen erneuerbaren Stromerzeugungskapazitäten erfolgt bei kostengetriebenem Laden der elektrischen Fahrzeuge auf maximale Art und Weise. Dennoch liegt die Gesamtemissionsreduktion von Verkehrs- und Stromsektor nur bei 6,5 Millionen Tonnen CO2 im Jahr 2030, da auch in diesem Fall aufgrund ihrer niedrigen marginalen Kosten vermehrt Braunkohle- und Steinkohlekraftwerke zum Einsatz kommen.
Diese Studie, die als Teil des DEFINE-Projekts erstellt wurde, zeigt, dass Politikmaßnahmen existieren, die die Markteinführung elektrischer Fahrzeuge erheblich erleichtern. Der Bestand an elektrischen Pkw im Jahr 2030 steigt von 3,9 Millionen (BAU) auf über 5,1 Million (EM+) Fahrzeuge. Es wird auch deutlich, dass Elektromobilität das Potenzial besitzt, die CO2-Emissionen des Verkehrssektors zu reduzieren; vollständig ausgeschöpft wird dieses Potenzial allerdings nicht automatisch. Die Stromerzeugungskapazitäten und ihr Einsatz müssen sorgfältig abgeschätzt werden, um durch Elektromobilität im Vergleich zu einem Szenario ohne elektrische Pkw keine zusätzlichen Emissionen im Stromsektor zu erzeugen. In dieser Studie wurde dies durchgeführt, so dass zusätzliche erneuerbare Stromerzeugungskapazitäten zu dem Kraftwerkspark, der aus dem Netzentwicklungsplan Strom 2013 abgeleitet wurde, hinzugefügt wurden. Auf diese Weise wird gezeigt, dass es möglich ist, das CO2-Vermeidungspotenzial elektrischer Pkw vollständig auszunutzen und dass Elektromobilität seine Rolle als zentraler Bestandteil einer Treibhausminderungsstrategie des Verkehrssektors erfüllen kann.
12 ….
DEFINE: Market development and CO2 emissions (Germany)
1. Background and motivation
Anthropogenic greenhouse gas emissions have to be reduced in the future to meet the global climate protection targets and to prevent an increase in global temperature that is more than 2 degrees. Germany set the target to reduce its overall GHG emissions by 80 to 95 % in 2050 compared to 1990. No GHG emission targets are set for the transport sector but the final energy consumption is supposed to be reduced by 40 % in 2050 compared to 2005.
One of the strategies for reducing the final energy consumption and GHG emissions of the transport sector is the increasing use of carbon-free electricity. Electromobility is one major option to use electricity in the transport sector and makes electricity use available for the motorised private transport. Thus, electromobility is also shown as an integral part of GHG emission reduction in all studies on climate protection scenarios for Germany up to 2050 (Nitsch et al. 2012, Schlesinger et al. 2010, Repenning et al. 2014).
As a consequence, the German government has started a strategy to establish Germany and German car makers as a leading market and leading innovators of electromobility. A target of 1 million electric vehicles in 2020 and 6 million electric vehicles in 2030 was set for the German vehicle stock in 2010. Focus regions in which the use of electric vehicles is tested and financially supported has been established and financial support programs for R&D for electric vehicles have been developed. Today, all major car makers have invested into the development of electric vehicles and first low volume serial production has started.
Electric vehicle usage implies a shift from mineral oil-based fuel to electricity as the energy carrier for the transport sector and a new – potentially flexible – electricity demand is added to the electricity system. Even though the impact on the electricity sector might be considered small with few electric vehicles and a small share of total electricity consumption, the interaction of the electric vehicles and the electricity system is nevertheless worth analysing. Additionally, the supply of carbon-free electricity is not guaranteed as long as non-renewable electricity production capacities are an integral part of the energy system.
Therefore, this study deals with two issues with regard to electromobility. First, two scenarios of the market penetration of electric vehicles are developed and the impact of policy measures applied to support the electric vehicle market is shown. As a second issue, the interactions of electromobility and electricity production are analysed to understand whether and how the framework conditions have to be designed for electromobility to achieve its full potential in terms of GHG emission reduction.
1.1. DEFINE – Consortium and concept
DEFINE – Development of an Evaluation Framework for the Introduction of Electromobility – is being conducted by a consortium of research institutions from Austria (Institut für Höhere Studien - IHS, Wien; Umweltbundesamt - UBA, Wien; Institut für Energiesysteme und Elektrische Antriebe - ESEA, TU Wien), Poland (Center for Social and Economic Research - CASE) and Germany (Deutsches Institut für Wirtschaftsforschung - DIW, Berlin; Oeko-Institut - ÖI, Berlin), which are developing a modelling framework to analyse the GHG emissions and the economic impact of the introduction of electromobility. The consortium is funded by the national funding institutions that are responsible for the coordination of the ERA-NET Transport Trans-national call electromobility+.
Detailed bottom-up modelling of electric vehicle market development in Austria (UBA) and Germany (ÖI) is combined with electricity dispatch modelling of the Austrian (ESEA) and German
13

DEFINE: Market development and CO2 emissions (Germany)
(ESEA and DIW) electricity production markets. The results of the electricity dispatch modelling are used together with transport sector modelling to determine the GHG emissions and energy demand impact of the market introduction of electric vehicles. The data from Austria and Germany are used as input in a top-down CGE economic model from IHS that is enhanced with a more detailed representation of the transport sector in DEFINE. This model can be used to show economic effects that are caused by market penetration of the new technology of electromobility. Additionally, CASE supports IHS for representation of Poland with the CGE model and a case study for Poland is being conducted.
Oeko-Institut used its previous experience with regard to electromobility to support the consortium-wide discussion and lead the scenario development process within the consortium. For Germany, the market penetration and the stock development of electric vehicles were derived and electric car usage patterns were created as an input for the electricity dispatch modelling conducted by DIW. Furthermore, the GHG emission effects of electromobility were quantified by Öko-Institut.
2. Defining two scenarios – Business-As-Usual (BAU) and Electromobility+ (EM+)
All analyses within the DEFINE project were conducted for two different scenarios to show effects of different development patterns of electromobility. Moreover, both scenarios are required to enable the calibration of the CGE modelling framework that has been developed within the DEFINE project.
· The Business-As-Usual (BAU) scenario assumes no relevant changes in legislation and the continuation of current policies. No special measures for market success of electromobility are applied in this scenario.
· The Electromobility+ (EM+) scenario shows a more favourable environment for market success of electromobility. Policies that are advantageous for electromobility are assumed.
A scenario development workshop was held with all project partners to identify the required parameters for all models used within the DEFINE project. The assumptions for these parameters and the policy measures that are applied in the EM+ scenario were subsequently harmonised to ensure consistency for all modelling work conducted within the DEFINE framework. The modelling parameters can be divided into two groups with regard to changes between the scenarios.
· The framework conditions are general parameters that are needed for modelling work and are not necessarily transport-sector-specific. These parameters remain equal for both scenarios.
· Policy measures are applied in the EM+ scenario to support electromobility market development. Parameters which are affected by these measures vary between both scenarios. For Germany, these policy measures are:
a) more ambitious CO2 emission targets of the EU CO2 regulation on new passenger cars,
b) higher energy taxes on fossil fuel, and
c) implementation of a feebate system to support ultra-low emission vehicles.
In the following, only the relevant parameters for modelling work that is conducted by Oeko Institut are shown and consist of assumptions for passenger car technology and cost development, on charging infrastructure development and on energy prices and taxation.
14 ….

DEFINE: Market development and CO2 emissions (Germany)
In DEFINE, electromobility is defined as electric drive passenger cars. Rail traffic, potential electric drive freight road traffic, e-bikes and potential other means of electric transport are not considered in DEFINE. The time span covered in DEFINE is the market introduction phase of 2010 up to 2030.
2.1. Passenger car technology and costs
The required data for evaluation of potential future market shares of electric vehicles is the technical configuration and the retail prices of conventional (CV) and electric cars. In general, electric vehicles are divided into two subgroups:
· Battery electric vehicles (BEVs) are solely driven by an electric engine. The driving mileage is restricted to smaller distances than is the case with conventional cars. The battery of battery electric vehicles is externally charged from the grid which may result in a long charging time.
· Plug-in hybrid electric (PHEV) and range extender electric (REEV) vehicles have two powertrains (electric engine and internal combustion engine) for propulsion. Both systems differ in terms of the combination of both engines. Since most hybrid electric vehicles will probably not have pure parallel or serial engine architectures, both types of hybrid cars are pooled together in all analyses in DEFINE. The internal combustion engine enables – if required – longer driving mileage and faster refuelling. PHEV and REEV are either externally charged from the grid or can use diesel or gasoline as fuel.
Conventional cars are gasoline and diesel cars that contain an internal combustion engine. Electric hybridisation is one possibility to achieve higher efficiency in conventional cars (HEVs: hybrid electric vehicles). Thus, conventional cars may also use an electric engine and a battery that is charged by an internal energy recovery system. The difference to plug-in hybrids is the lack of the possibility to charge the batteries of hybrid electric vehicles externally. Therefore, HEV are put together with conventional diesel and gasoline cars in DEFINE.
Additionally, the vehicle stock is divided further into three size classes for all analyses in DEFINE: small, mid-size and large. This classification is carried out by the KBA classification.
· small: city car (Mini/Kleinstwagen), supermini (Kleinwagen)
· mid-size: small family car (Kompaktklasse), multi-purpose vehicle (Minivan/Großraum-Van)
· large: large family car (Mittelklasse), executive car (Obere Mittelklasse), luxury car (Oberklasse), sport utility vehicle (Geländewagen), sport coupes (Sportwagen).
The classification of all passenger cars into the different propulsion system groups and the three size classes applies for all parts of modelling in DEFINE and most results will be shown with the vehicles classified in this way.
An existing database for vehicle efficiencies and technology costs is used in DEFINE to determine average retail prices as a function of vehicle efficiency. This database uses data from several studies on the potentials and the costs of CO2 mitigation technologies in cars. The methodology of the database and the final results were discussed with stakeholders from the car manufacturing
15

DEFINE: Market development and CO2 emissions (Germany)
industry and science to solidify the quality of the cost data of the potential future vehicles and are summarised in Hülsmann et al. (2014).
The database requires assumptions for battery costs and technology-specific parameters for cost calculation of electric vehicles (see Table 2-1). Additionally, the electrical range of both BEVs and PHEV/REEVs is required in order to obtain cost data from the database and to determine the market share of electric vehicles. The electrical range of the average BEV in DEFINE is assumed to be 150 km in both scenarios. PHEV/REEVs are capable of driving 50 km in full electric mode. BEVs are assumed to be not available in the large size class up to 2030 due to the high battery costs and the additional weight that would be necessary for an assumed electric mileage of 150 km.
Table 2-1: Assumptions of battery costs and battery technology development
Source: Authors’ own assumptions
The costs and retail prices of conventional cars are strongly dependent on the efficiency of vehicles and it is assumed that the efficiency of conventional vehicles is mainly driven by the EU CO2 regulation for new passenger cars. Different CO2 emission targets in 2030 are set for the BAU and the EM+ scenarios to enforce better fuel efficiency – and in consequence higher retail prices – for conventional cars in the EM+ scenario. Increasing market shares of electric vehicles reduce the fuel efficiency requirements for conventional cars with regard to the EU CO2 regulation and have to be considered when deriving the CO2 emission levels of conventional cars. It is assumed that the emission level of conventional cars is 5 g CO2/km higher in 2020 and 10 g CO2/km (BAU) or 12.5 g CO2/km (EM+) higher in 2030 than the overall emission target for all new passenger cars.
Data from 2010 (EEA 2011) shows an unequal distribution of specific CO2 emissions of new registered cars within the EU. Specific CO2 emissions of car registrations in Germany were 7.8 % higher than the overall EU average. This effect can be attributed to higher sales in the large car segments and to higher motorization compared to the EU average. No changes in the car sales structure within the EU are assumed and the CO2 emissions of conventional cars remain 7.8 % higher than the overall EU emissions of conventional cars. Therefore, fuel efficiency increases of 29 % in 2020 and by 41 % (BAU) or 49 % (EM+) in 2030 are assumed for conventional cars with regard to 2010. A summary of all assumptions and requirements of the CO2 emission reductions of conventional cars is shown in Table 2-2.
Specific battery costs Mass specific capacity Depth of discharge*
€2010/kWh kWh/kg %2010 600 0.105 80 / 652020 280 0.105 85 / 702030 200 0.150 90 / 75* The f irst value is assumed for BEV, the second value is assumed for PHEV/REEV.
16 ….

DEFINE: Market development and CO2 emissions (Germany)
Table 2-2: Assumptions of average specific CO2 emission of conventional cars, 2010 - 2030
Source: Authors’ own assumptions
A feebate system is applied as a policy measure in the EM+ to support the market penetration of low emission passenger cars. The feebate system consists of a fee for new cars that exceed the requirements of the EU CO2 regulation for new cars and donates a rebate to low emission cars. The fee for high emission cars is set as equal to the penalty of the CO2 regulation (95 €2010 per g CO2/km above the target value). It is assumed that the conventional cars exceed the emission target by 7.8 % (see above) to calculate the fees which are added to the retail price of the conventional passenger cars.
Electric vehicles are assumed to be supported in the feebate system with decreasing rebates over time and the electrification level. BEV vehicles are granted a double rebate compared to PHEVs and REEVs and the rebate is reduced from 2020 to 2030. All assumptions of the fees and the rebates with regard to the feebate system are summarised in Table 2-3.
Table 2-3: Assumptions of fees and rebates of the feebate system in EM+ scenario
Source: Authors’ own assumptions
2.2. Fuel and electricity retail prices
Fuel and electricity prices strongly differ and are significant for the calculation of the kilometre costs of car usage. Consequently, assumptions have to be made for all energy carriers that are used for cars in order to model the purchase decisions relating to new cars. The retail prices of the fuels and electricity consist of the following cost factors:
· production costs,
· energy taxes,
· value added tax (VAT), and
· miscellaneous costs.
etarget,all,EU xEV effect eCV,EU eCV,Germany
g CO2/km g CO2/km g CO2/km g CO2/km2010 - - 140.3 151.22020 (BAU/EM+) 95 5 100 107.82030 (BAU) 72.5 10 82.5 88.92030 (EM+) 60 12.5 72.5 78.1
small mid size large BEV PHEV2020 569 625 698 2140 10702030 338 386 449 549 275
Fee for conventional cars (€2010) Rebate (€2010)
17

DEFINE: Market development and CO2 emissions (Germany)
All cost factors other than energy taxes are held constant between the BAU and EM+ scenarios. Higher fuel taxes are applied in the EM+ scenario to support electric vehicle market development and to offset lower kilometre cost and lower state income that would result from the better efficiency of new conventional cars.
The basic assumptions relating to fuel prices are taken from the scenarios that were compiled for the derivation of the German government’s Energy Concept (Energiekonzept) (Schlesinger et al. 2010). Retail prices for fuels are adopted directly for the BAU scenario.
The production and the miscellaneous costs are derived from the fuel price data in Schlesinger et al. (2010) and are kept constant in the EM+ scenario. The VAT level (19 %) remains equal as well. A change of fuel taxation – based on energy content and CO2 content of the fuel (50-50 split) – is assumed and the gasoline retail prices were set at 1.70 €2010/l in 2020 and at 2.30 €2010/l in 2030.
Special taxation on electricity for car usage is assumed in 2030 for both scenarios and the tax level based on the energy content of conventional fuels is added to the general electricity taxes. An overview of all assumptions for fuel and electricity retail prices for car owners is given in Table 2-4.
Table 2-4: Assumptions of energy retail prices for car users
Source: Authors’ own assumptions (derived from Schlesinger et al. 2010)
2.3. Charging infrastructure
Information on charging infrastructure is required in different models of the DEFINE modelling cluster. The maximum charging power at charging stations is an essential information for the electricity dispatch models within the DEFINE network. The charging time and availability of charging stations are parameters that are needed in the derivation of the acceptance and the market share of electric vehicles.
Production/ miscellaneous costs
Energy tax Value added tax Retail price Retail price
€2010/GJ €2010/GJ €2010/GJ €2010/GJ €2010/l
BAU - gasoline2020 23,6 17,3 7,8 48,7 1,572030 31,1 14,8 8,7 54,6 1,77
BAU - diesel2020 24,6 11,3 6,8 42,6 1,522030 30,8 9,6 7,7 48,2 1,72
BAU - electricity2020 52,5 4,9 10,9 68,22030 56,7 18,5 14,3 89,5
EM+ - gasoline2020 23,6 20,6 8,4 52,6 1,702030 31,1 28,7 11,4 71,2 2,30
EM+ - diesel2020 24,6 20,9 8,6 54,1 1,932030 30,8 29,1 11,4 71,4 2,55
EM+ - electricity2020 52,5 4,9 10,9 68,22030 56,7 18,5 14,3 89,5
18 ….

DEFINE: Market development and CO2 emissions (Germany)
All assumptions relating to the charging infrastructure are considered to be framework parameters and remain constant in both scenarios. Generally, it will be distinguished between charging at the car owners’ private property and (semi-)public (i.e. at work, public space, shopping malls etc.) charging infrastructure which can be used by all electric vehicle owners. Low charging power (3.7 kW) is assumed to be available at private properties. Medium power charging stations (11 kW) are assumed to be constructed in the (semi-)public area, but the availability of the (semi-)public infrastructure is limited1. Fast charging stations with higher power rates are assumed not to be set up in both scenarios. The charging losses are considered to be 10 % of the electricity that is drawn from the electricity grid.
3. Market shares and stock of electric vehicles
Vehicle stock development is required to calculate the energy demand and the CO2 emissions of the passenger cars. It is also a relevant parameter when analysing the economic effects of market penetration of electric vehicles. Therefore, the market shares and the vehicle stock development up to 2030 are used in DEFINE:
· as a result in itself,
· as input data for the electricity dispatch modelling (in combination with the electric vehicle usage patterns), and
· as input data for the calibration of the CGE economic modelling.
The main input for the vehicle stock derivation is the registration data of new cars. Scrappage rates and annual mileage of vehicles of the passenger car stock are taken from Oeko Institut’s eMobil 2050 study (Hacker et al. 2014) and the vehicle stock is calculated with the TEMPS2 model (see Hacker et al. (2014) for more information on the methodology of TEMPS).
3.1. Methodology and interim results
Various characteristics of electric vehicles, the charging infrastructure and the costs of buying and using a vehicle are assumed to influence the purchase decisions of new car buyers. Furthermore, the supply of electric vehicles is considered in new car registration modelling since the car makers require time to establish the manufacturing processes and the manufacturing sites of electric vehicles and to provide a similar degree of variety in terms of car models and equipment as is the case with conventional cars. A scheme of how the market shares of electric vehicles are derived in DEFINE is shown in Figure 3-1.
1 The following is assumed: The maximum number of electric vehicles is set to 15 % (2020) and 25 % (2030) of the cars that would require semi-public infrastructure since they do not own a parking spot at the owner’s property.
2 Transport Emissions and Policy Scenarios.
19
DEFINE: Market development and CO2 emissions (Germany)
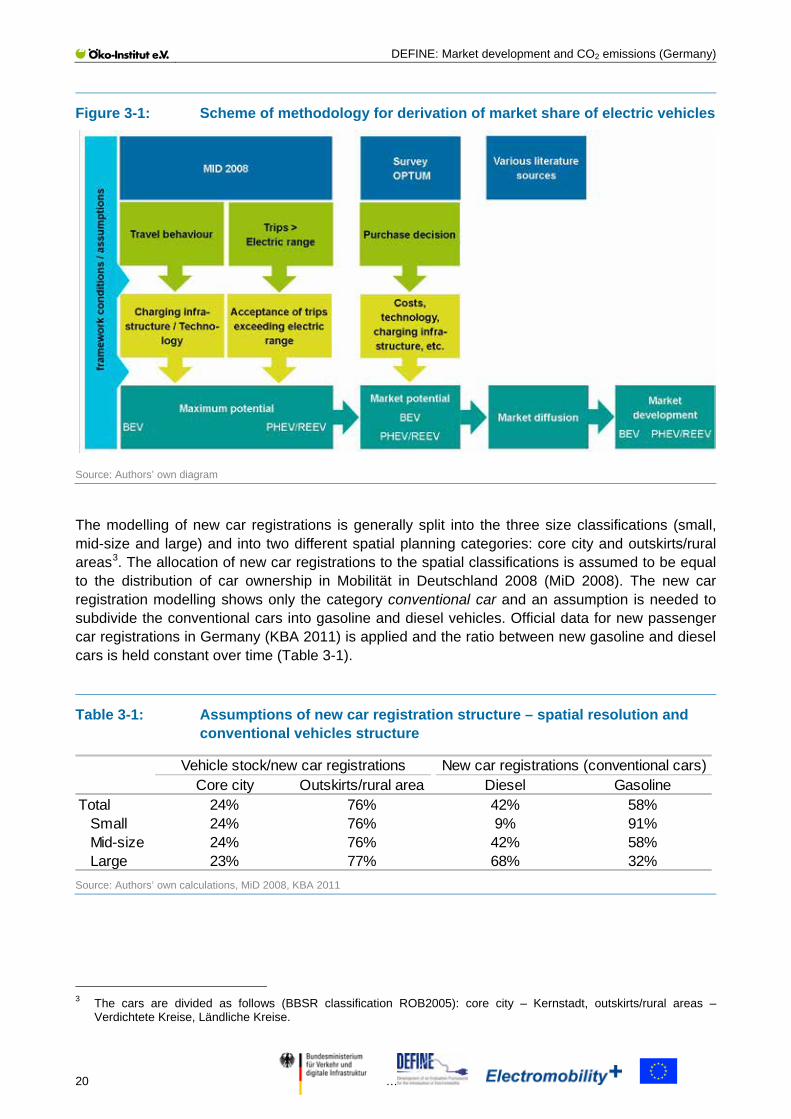
Figure 3-1: Scheme of methodology for derivation of market share of electric vehicles
Source: Authors’ own diagram
The modelling of new car registrations is generally split into the three size classifications (small, mid-size and large) and into two different spatial planning categories: core city and outskirts/rural areas3. The allocation of new car registrations to the spatial classifications is assumed to be equal to the distribution of car ownership in Mobilität in Deutschland 2008 (MiD 2008). The new car registration modelling shows only the category conventional car and an assumption is needed to subdivide the conventional cars into gasoline and diesel vehicles. Official data for new passenger car registrations in Germany (KBA 2011) is applied and the ratio between new gasoline and diesel cars is held constant over time (Table 3-1).
Table 3-1: Assumptions of new car registration structure – spatial resolution and conventional vehicles structure
Source: Authors’ own calculations, MiD 2008, KBA 2011
3 The cars are divided as follows (BBSR classification ROB2005): core city – Kernstadt, outskirts/rural areas – Verdichtete Kreise, Ländliche Kreise.
Core city Outskirts/rural area Diesel GasolineTotal 24% 76% 42% 58%
Small 24% 76% 9% 91%Mid-size 24% 76% 42% 58%Large 23% 77% 68% 32%
New car registrations (conventional cars)Vehicle stock/new car registrations
20 ….

DEFINE: Market development and CO2 emissions (Germany)
3.1.1. General demand of transportation – Analysis of MiD 2008 data
One of the main assumptions for the derivation of the market penetration of electric vehicles is that there are no fundamental changes in the mobility behaviour of car owners up to 2030 and electric vehicles must enable the same driving patterns as today. The source for car usage patterns is the MiD 2008 representative survey which shows the mobility patterns for one day of all members of around 26,000 German households. The data of MiD 2008 was collected within the time span of more than a year to level out seasonal effects of mobility behaviour.
The data on mobility behaviour is provided on the individual level, i.e. each trip of all interviewees is listed as one dataset of the database. Therefore, the data of MiD 2008 is processed in such a way that all trips of a single car are pooled together in one dataset to create a car usage database. This processing step is also used to delete erroneous data (e.g. duplicate datasets, overlapping car usage of several users, implausible velocity or trip length of cars, merely vocational trips4 etc.) from the dataset. Additionally, trips with a parking time of less than 15 minutes are merged to one trip to reduce the number of trips.
The new car usage database is applied to the technical configurations of electric vehicles and to the charging infrastructure assumed in DEFINE. Each car usage dataset is tested for
· the single trip mileage (only applies for BEVs),
· the daily mileage (only applies for BEVs),
· the parking locations (potential charging location) and
· the parking duration
in order to verify the potential of electrical vehicles to fulfil the current car usage. The single trip length and daily mileage are only tested in the case of BEVs since PHEV/REEVs can use their internal combustion engines and refuel the vehicle without major time restrictions. However, trip length and daily mileage do not impose heavy restrictions on BEV usage when the car usage of just one day is analysed.
Potential electric vehicle car usage is more limited due to the charging infrastructure requirement. The database is divided into two groups: cars that have a parking spot at the car owner’s property and cars that do not have a parking spot at the car owner’s property. The second group of cars requires semi-public charging infrastructure and the assumptions for the availability of (semi-)public charging infrastructure are applied (see chapter 2.3). Therefore, the maximum potential of electric vehicles is limited to 15 % (2020) and 25 % (2030) of all cars that require (semi-)public infrastructure. No restrictions are assumed for cars that can potentially be charged at the car owner’s property. An overview of the share of the cars that can potentially be charged at the owner’s property is given in Figure 3-2.
It is evident that cars in the city centre are parked less frequently at the car owner’s property when being parked at home and the limitations resulting from (semi-)public charging infrastructure requirements are higher for car owners who live in the core city. A second trend is seen with regard to the car size. Mid-size and large cars are parked more often at the car owner’s property than small cars and are less subject to semi-public infrastructure restrictions.
4 Information on purely professional trips (“rein berufliche Wege”) was gathered separately and the trips were added subsequently to the dataset. The detail level of these trips does not fulfil the requirements of the methodology applied for market share development in DEFINE.
21

DEFINE: Market development and CO2 emissions (Germany)
Figure 3-2: Share of car parking location when the car is parked at home
Source: Authors’ own calculations, MiD 2008
The restrictions for BEVs relating to maximum mileage and the maximum trip length are extended by a special consideration of long trips. MiD 2008 only gives information on the car usage of one day and the usage restrictions that are imposed by long trips would be underestimated by evaluating only a single day. Therefore, the Poisson distribution is applied to the MiD 2008 database and the probability of the number of trips per year that exceed the maximum mileage of BEV is calculated. It is assumed that the car users accept less than five times per year that they are not able to use the BEV. The probability of the event (five or more trips a year that exceed the maximum mileage of BEV) is set as the maximum potential for BEV (Figure 3-3).
Figure 3-3 shows that the number of long trips imposes strong limitations on BEV car usage when it is assumed that there are no changes to the mobility demands and transport carrier selection. Trips exceeding the maximum mileage of BEVs occur more frequently for large cars and more often for car owners that are living in the city centre. It is noteworthy that the small probability of long trips for small cars by car owners living on the outskirts and in rural areas. The probability value is distinctively smaller than for the other groups of car owners.
22 ….

DEFINE: Market development and CO2 emissions (Germany)
Figure 3-3: Probability of five or more trips per year that exceed the maximum mileage of BEV (150 km) – Poisson distribution
Source: Authors’ own calculations, MiD 2008
The mentioned restrictions are applied to all cars of the car usage database that is derived from the mobility data of MiD 2008. The maximum potential for the market share of electric vehicles is determined and the share of new electric vehicle registrations cannot exceed the maximum potential value for each car buyer group.
3.1.2. Modelling the purchase decisions – conjoint analysis and potential market shares
The modelling of the purchase decisions between passenger cars that have different propulsion systems and different technology and cost characteristics is the main part of the approach used to derive the market penetration of electric vehicles in DEFINE. The purchase decisions of new car buyers depend on different technical features of the provided cars and other soft characteristics such as image and familiarity with new technologies. Pure cost analyses seem not to be sufficient to explain the car registration structure and a conjoint analysis is conducted to model the purchase decisions of new car buyers in 2020 and 2030. The conjoint analysis assumes that the purchase decisions are mainly based on a few relevant attributes and how the new car buyers evaluate different levels of these attributes.
23
DEFINE: Market development and CO2 emissions (Germany)
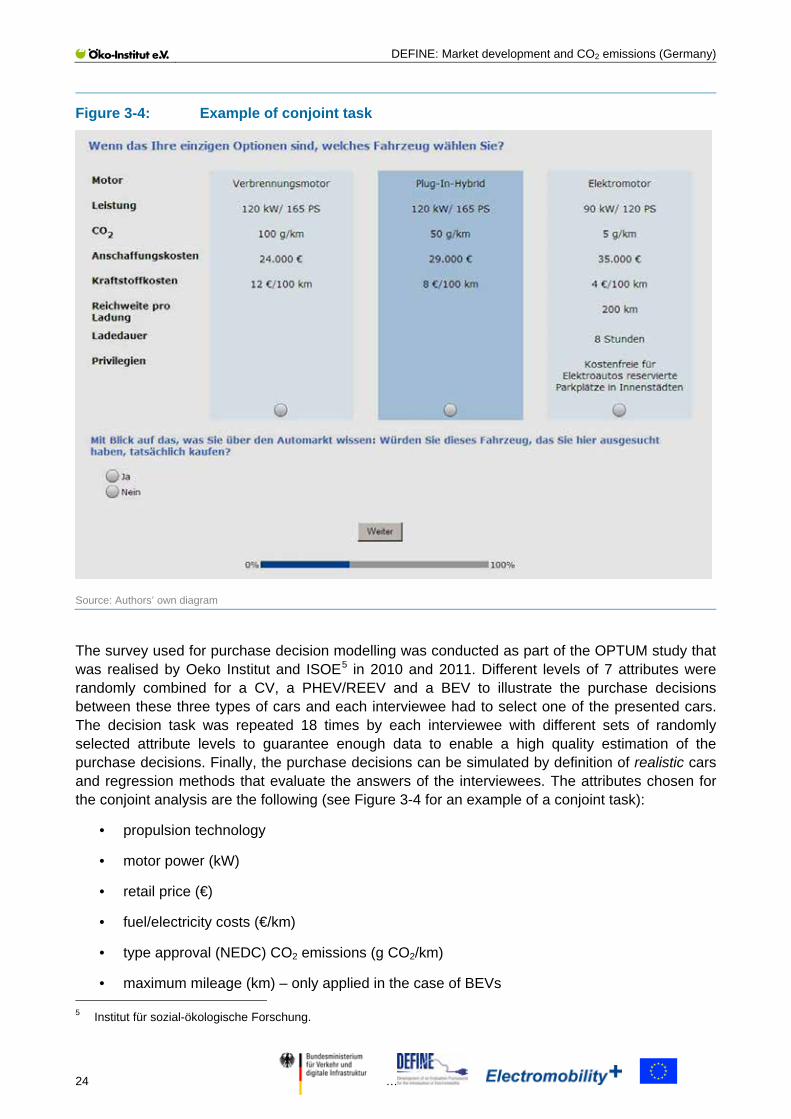
Figure 3-4: Example of conjoint task
Source: Authors’ own diagram
The survey used for purchase decision modelling was conducted as part of the OPTUM study that was realised by Oeko Institut and ISOE5 in 2010 and 2011. Different levels of 7 attributes were randomly combined for a CV, a PHEV/REEV and a BEV to illustrate the purchase decisions between these three types of cars and each interviewee had to select one of the presented cars. The decision task was repeated 18 times by each interviewee with different sets of randomly selected attribute levels to guarantee enough data to enable a high quality estimation of the purchase decisions. Finally, the purchase decisions can be simulated by definition of realistic cars and regression methods that evaluate the answers of the interviewees. The attributes chosen for the conjoint analysis are the following (see Figure 3-4 for an example of a conjoint task):
· propulsion technology
· motor power (kW)
· retail price (€)
· fuel/electricity costs (€/km)
· type approval (NEDC) CO2 emissions (g CO2/km)
· maximum mileage (km) – only applied in the case of BEVs
5 Institut für sozial-ökologische Forschung.
24 ….

DEFINE: Market development and CO2 emissions (Germany)
· charging duration (h) – only applied in the case of BEVs
· privilege of free, reserved parking in city centres (yes/no) – only applied in the case of BEVs.
The conjoint analysis is divided into subgroups according to the size class of the cars and around 500 interviewees per size class participated in the survey. The participants were recruited as a representative sample according to the Verbraucheranalyse 2010 (2010 Consumer Analysis), which handles analyses regarding new car buyers. The interviewees were also required to have stated the desire to buy a new car within two years after participating in the survey. More information about the approach and the methodology of the conjoint analysis is given in Götz et al. (2011).
The definition of a typical, average car per size class and propulsion technology is required for each modelling year to evaluate the survey. The technical configurations and the cost data of the vehicles are taken from the technology database of eMobil 2050 and the assumptions for energy costs and policy measures are applied in the case of the two scenarios (see chapter 2 for more information). An overview of the cars and their attribute levels used in DEFINE for the purchase decision modelling in 2020 and 2030 can be found in Table 3-2 and Table 3-3.
Table 3-2: Characteristics of average passenger cars in the BAU scenario
Source: Authors’ own assumptions (derived from Hülsmann et al. 2014)
Most characteristics of the average cars for conjoint analysis are the same or very similar for 2020 and 2030 and few changes are made between BAU and EM+ scenario. Since the policy measures of EM+ scenario aim to change the cost difference between electric and conventional cars, the greatest variation between the simulation years and the scenarios is assumed for the retail price and the specific fuel/electricity costs. In almost all cases, BEVs have the highest retail price of the different propulsion system options and conventional cars are the most favourable option with regard to the retail price. The retail price gap between electric driven vehicles and conventional cars is reduced in the EM+ scenario by implementation of the feebate system and the higher cost of better energy efficiency level requirements of conventional cars to satisfy the stricter CO2 regulation.
BEV PHEV CV BEV PHEV CV PHEV CV2020
Motor power [kW] 51 60 60 77 90 90 150 150CO2 emissions [g/km] 5 26 93 5 31 110 26 117Retail price [€] 23.541 21.700 14.682 30.259 28.814 21.444 43.575 34.408Fuel/electricity costs [€/100km] 4,07 5,36 7,52 4,64 6,49 8,94 6,05 8,07Maximum mileage [km] 150 150Charging duration [h] 3 3,5Privilege no no
2030Motor power [kW] 51 60 60 77 90 90 150 150CO2 emissions [g/km] 5 22 76 5 26 91 25 96Retail price [€] 21.836 21.026 16.018 28.038 27.809 21.880 41.430 35.158Fuel/electricity costs [€/ 100km] 4,60 5,87 6,95 5,64 7,05 8,26 7,39 7,52Maximum mileage [km] 150 150Charging duration [h] 2,5 3,5Privilege no no
mid-size car large carsmall car
25

DEFINE: Market development and CO2 emissions (Germany)
Table 3-3: Characteristics of average passenger cars in EM+ scenario
Source: Authors’ own assumptions (derived from Hülsmann et al. 2014)
Electric driven vehicles have the considerable advantage of lower energy costs compared to conventional cars, but the difference between cars with different propulsion systems decreases from 2020 to 2030. The main factors are the additional taxation of electricity for car usage and the high efficiency gains of conventional cars that are enforced by CO2 regulation. In fact, the fuel cost per mileage of conventional cars decreases from 2020 to 2030 in the BAU scenario due to their efficiency gains. The EM+ scenario contains higher energy taxes on conventional fossil fuels and the specific energy price gap between electric driving and the use of the combustion engine increases compared to the BAU scenario. However, the even better energy efficiency level of conventional cars outweighs the higher energy taxation levels and specific energy costs of conventional cars decrease from 2020 to 2030 even in the EM+ scenario.
The group of interviewees is divided further for the evaluation step of the conjoint analysis. The conjoint analysis is conducted separately for the three size classes of the DEFINE project. Additionally, the interviewees are divided with regard to the spatial planning classification of their home (core city and outskirts/rural areas) and with regard to the opportunity to charge the vehicle at the owner’s property. These groups show different purchase decision behaviour and involve different restrictions due to their car usage and infrastructure requirements (see chapter 3.1.1).
The conjoint analysis shows that the market potential of electric vehicles is nearly as high as 50 % of all new car buyers and the acceptance of electric vehicles remains almost constant between 2020 and 2030 (Table 3-4). This is caused by the counteracting impact of lower electric vehicle retail prices and higher specific energy costs in 2030 when relating electric vehicles to conventional cars. The overall market potential increases to 58 % in the EM+ scenario and remains nearly constant between 2020 and 2030. The reasoning for the equal acceptance of electric vehicles over time is the same as for the BAU scenario. The conjoint analysis also displays a higher market potential for PHEVs/REEVs in almost all car buyer groups.
BEV PHEV CV BEV PHEV CV PHEV CV2020
Motor power [kW] 51 60 60 77 90 90 150 150CO2 emissions [g/km] 5 26 93 5 31 110 26 117Retail price [€] 21,402 20,631 15,250 28,120 27,744 22,068 42,505 35,106Fuel/electricity costs [€/100km] 4.07 5.53 8.12 4.64 6.69 9.65 6.52 10.24Maximum mileage [km] 150 150Charging duration [h] 3 3.5Privilege no no
2030Motor power [kW] 51 60 60 77 90 90 150 150CO2 emissions [g/km] 5 21 67 5 22 80 22 85Retail price [€] 21,274 21,011 17,712 27,461 28,080 23,094 41,909 38,505Fuel/electricity costs [€/ 100km] 4.52 6.23 7.96 5.55 7.30 9.46 7.92 9.80Maximum mileage [km] 150 150Charging duration [h] 2.5 3.5Privilege no no
small car mid-size car large car
26 ….
DEFINE: Market development and CO2 emissions (Germany)
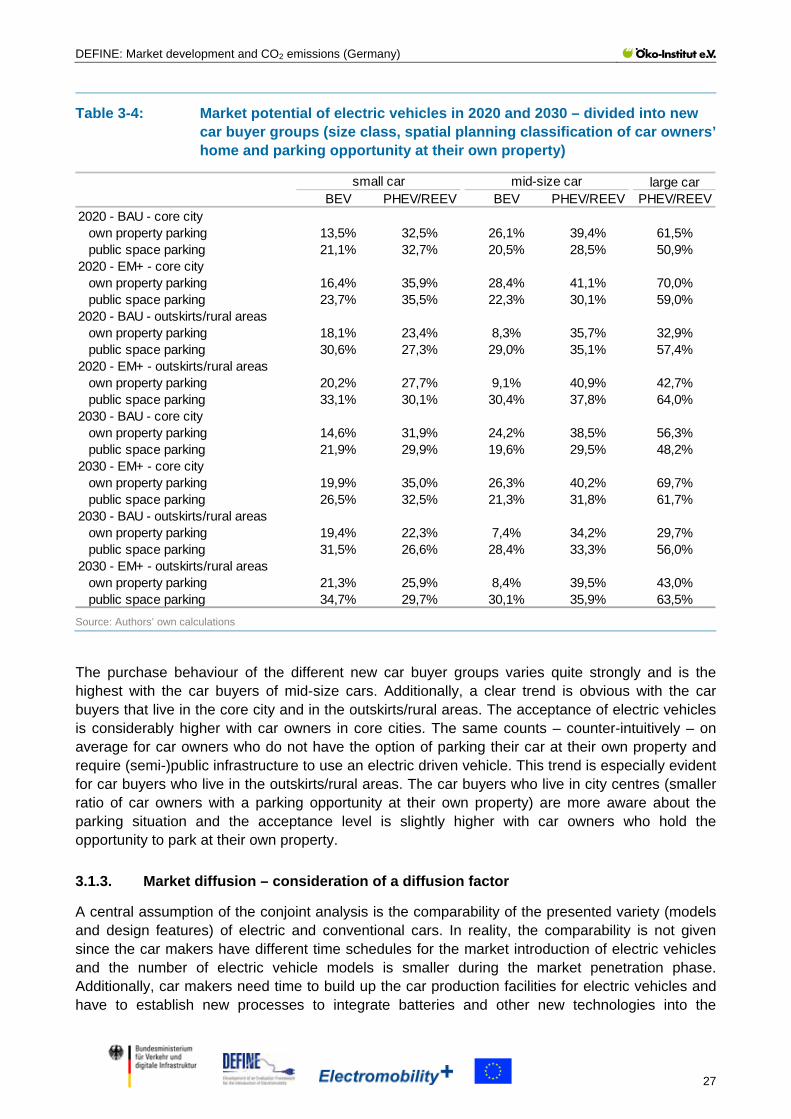
Table 3-4: Market potential of electric vehicles in 2020 and 2030 – divided into new car buyer groups (size class, spatial planning classification of car owners’ home and parking opportunity at their own property)
Source: Authors’ own calculations
The purchase behaviour of the different new car buyer groups varies quite strongly and is the highest with the car buyers of mid-size cars. Additionally, a clear trend is obvious with the car buyers that live in the core city and in the outskirts/rural areas. The acceptance of electric vehicles is considerably higher with car owners in core cities. The same counts – counter-intuitively – on average for car owners who do not have the option of parking their car at their own property and require (semi-)public infrastructure to use an electric driven vehicle. This trend is especially evident for car buyers who live in the outskirts/rural areas. The car buyers who live in city centres (smaller ratio of car owners with a parking opportunity at their own property) are more aware about the parking situation and the acceptance level is slightly higher with car owners who hold the opportunity to park at their own property.
3.1.3. Market diffusion – consideration of a diffusion factor
A central assumption of the conjoint analysis is the comparability of the presented variety (models and design features) of electric and conventional cars. In reality, the comparability is not given since the car makers have different time schedules for the market introduction of electric vehicles and the number of electric vehicle models is smaller during the market penetration phase. Additionally, car makers need time to build up the car production facilities for electric vehicles and have to establish new processes to integrate batteries and other new technologies into the
large carBEV PHEV/REEV BEV PHEV/REEV PHEV/REEV
2020 - BAU - core cityown property parking 13,5% 32,5% 26,1% 39,4% 61,5%public space parking 21,1% 32,7% 20,5% 28,5% 50,9%
2020 - EM+ - core cityown property parking 16,4% 35,9% 28,4% 41,1% 70,0%public space parking 23,7% 35,5% 22,3% 30,1% 59,0%
2020 - BAU - outskirts/rural areasown property parking 18,1% 23,4% 8,3% 35,7% 32,9%public space parking 30,6% 27,3% 29,0% 35,1% 57,4%
2020 - EM+ - outskirts/rural areasown property parking 20,2% 27,7% 9,1% 40,9% 42,7%public space parking 33,1% 30,1% 30,4% 37,8% 64,0%
2030 - BAU - core cityown property parking 14,6% 31,9% 24,2% 38,5% 56,3%public space parking 21,9% 29,9% 19,6% 29,5% 48,2%
2030 - EM+ - core cityown property parking 19,9% 35,0% 26,3% 40,2% 69,7%public space parking 26,5% 32,5% 21,3% 31,8% 61,7%
2030 - BAU - outskirts/rural areasown property parking 19,4% 22,3% 7,4% 34,2% 29,7%public space parking 31,5% 26,6% 28,4% 33,3% 56,0%
2030 - EM+ - outskirts/rural areasown property parking 21,3% 25,9% 8,4% 39,5% 43,0%public space parking 34,7% 29,7% 30,1% 35,9% 63,5%
small car mid-size car
27

DEFINE: Market development and CO2 emissions (Germany)
manufacturing process. These factors are assumed to result in a lag of market penetration compared to the results of the conjoint analysis. Therefore, the acceptance level of electric vehicles from the conjoint analysis has to be reduced for the market penetration derivation.
A common approach to considering these barriers of market penetration is the use of a market diffusion factor. This factor estimates the ratio of the potential market share that can be obtained at a certain time period after the first market introduction of a new technology or a product. All factors that are mentioned in the previous paragraph are pooled together in this factor to facilitate consideration of the different barriers of market penetration.
Figure 3-5: Market diffusion factor development for electric vehicles in DEFINE – ratio of potential market share
Source: Hacker et al. 2011
A market diffusion factor can be determined in different ways. A very detailed approach would be the use of simulation models of changes in the production process and how the car makers adjust to changes in the vehicle market. This approach requires high resolution level models of the car production industry and seems too exaggerated for the modelling approach in DEFINE. A less detailed approach is the use of experiences from market penetration in the past. It was decided that the diffusion factor pathway derived in the OPTUM study (Hacker et al. 2011) would be used. This derivation of the diffusion factor uses historic data of market introduction of hybrid electric vehicles in the US market and a data fit to a Gompertz function is conducted (Figure 3-5). The base year of the market diffusion factor development is set as 2010 and 12 % and 50 % of the potential market share of electric vehicles are assumed as real market share in 2020 and 2030.
3.2. Market shares of electric vehicles
The market shares are derived in consideration of the mobility demands (see chapter 3.1.1), the purchase decisions of a representative group of new car buyers (see chapter 3.1.2) and the lack of
28 ….

DEFINE: Market development and CO2 emissions (Germany)
variety of electric vehicle models and the time that is needed to adapt the production processes to the requirements of electric vehicle production (see chapter 3.1.3). The modelling years for market penetration simulation are 2020 and 2030 and the electric vehicle registrations are set to zero in 2010. The market shares of years in between the modelling years (2010, 2020 and 2030) are not specifically simulated, but are needed for vehicle stock calculations. Therefore, the new registrations for these years are derived by using linear interpolation between the modelling years.
Figure 3-6 shows the market structure per size class as well as the input into the new car registration calculation with TEMPS.
Figure 3-6: Passenger car market structure per size class in 2020 and 2030 – variation in propulsion system
Source: Authors’ own calculations
The market structure mirrors the results from the conjoint analysis and the differences between the two scenarios become evident only in 2030. The market share of electric vehicles increases over time from values of around 5 – 6 % (2020) to a market share of about 23 – 28 % (2030) in the EM+ scenario. The market shares in the BAU scenario are significantly smaller in 2030 (16 – 23 %) and the difference between the two scenarios is the largest in the case of large cars since the acceptance level of electric vehicles increases the most in this size class. Pure electric vehicles (BEVs) gain the largest market shares in the small car segment and increase to 13 % of the new car registrations in 2030 in the EM+ scenario.
The final distribution of new car registrations depends on the calculations of the total number of new cars per size class which is modelled using TEMPS. The total number of electric vehicle registrations in 2020 is around 150,000 cars, of which the larger share is PHEVs and REEVs. The difference between the two scenarios is rather small (around 35,000 cars). The difference between the scenarios adds up to 300,000 cars in 2030 and the number of electric vehicle registrations rises roughly by 50 % from BAU to EM+ scenario. In total, 920,000 electric vehicles will be
29

DEFINE: Market development and CO2 emissions (Germany)
registered in 2030 in the EM+ scenario. The larger share of roughly 750,000 new registered cars is PHEVs and REEVs.
Figure 3-7: Total number of electric vehicle new car registrations in 2020 and 2030
Source: Authors’ own calculations (TEMPS)
3.3. Vehicle stock of electric passenger cars
The relevant parameter for energy demand calculation and the analysis of interactions between the transport sector and the electricity dispatch is the vehicle stock. Oeko Institut’s scenario modelling tool TEMPS is used for vehicle stock derivation and for the energy demand calculations. Assumptions of scrappage rates, annual mileage of cars and the total mileage of all cars are taken from Hacker et al. (2014) and can be found there.
The decisive parameters of the vehicle stock are the number and the corresponding specific energy demand and mileage. The total number and stock structure of electric vehicles are displayed in Figure 3-8. The total number of electric vehicles is distinctively higher in the EM+ scenario than in the BAU scenario since the policy measures for electromobility support an increase in the attractiveness of electric driven cars. In this case, the vehicle stock holds close to 500,000 electric vehicles in 2020 and roughly 5.1 million electric vehicles in 2030. The larger share is PHEVs and REEVs (compare to the new registration in chapter 3.2). This amount represents close to 13 % of all passenger cars in 2030. The total number of electric vehicles decreases to approx. 400,000 in 2020 and 3.9 million electric vehicles when no policy measures are applied for the market penetration support of electromobility. The electric vehicle share is less than 10 % in this case.
The German government set a target of 1 million electric vehicles in 2020 and 6 million electric vehicles in 2030. These targets are not met in both scenarios. The EM+ scenario meets the target
30 ….

DEFINE: Market development and CO2 emissions (Germany)
of 1 million electric vehicles in 2022 and 6 million electric vehicles would be reached in 2031. The calculations of DEFINE only consider passenger cars. Therefore, the targets for electric vehicles could potentially be reached earlier in the scenarios when taking into account other vehicles such as light commercial vehicles and/or microcars.
Figure 3-8: Vehicle stock of electric cars in 2020 and 2030
Source: Authors’ own calculations (TEMPS)
4. Electricity dispatch modelling and electric vehicle car usage patterns
High resolution electricity dispatch modelling simulates the operation of electricity production capacities with regard to a given electricity demand and a given set of electricity production facilities. The electricity demand of electric vehicles is different in the two scenarios and varying electricity dispatch and subsequently different CO2 emissions of the electricity production sectors may arise. Thus, an electricity dispatch model of DIW Berlin is applied in DEFINE to show the effect of electric vehicles on the electricity production sector (see Gerbaulet and Schill 2014).
The main concept of the electricity market is the matching of offered production capacities and the electricity demand at an hourly basis. Each hour, the offered capacities are stacked up according to increasing price (merit order) and the capacities up to the electricity demand are supposed to dispatch the electricity. Additionally, operation restrictions such as the start-up and the shut-down processes of power plants are to be considered. The decisive parameters for pricing at the electricity market are the short-term marginal costs of each electricity production capacity. Therefore, the electricity dispatch can be modelled by minimising the short-term marginal costs as well as start-up costs of the electricity production for a given electricity demand. The operation status and the start-up and shut-down requirements of each power plant are also included in the DIW model to minimise the costs of power production of the total modelling period. Restrictions
31

DEFINE: Market development and CO2 emissions (Germany)
due to the electricity transmission and distribution grid are not considered in this study and electricity dispatch and electric vehicle charging depends wholly on the market scheme that is outlined above.
The framework conditions of the electricity market – electricity production capacities and electricity demand – are derived from the assumptions of the Netzentwicklungsplan Strom 2013 (50 Hertz et al. 2013), which is used for transmission grid planning in Germany. Electricity consumption in Germany (without electricity demand from electric vehicles) is assumed to be around 560 TWh in both 2020 and 2030. Renewable generation capacities increase from 55 GW in 2010 to 121 GW in 2020 and 158 GW in 2030. Additionally, the energy demand of electromobility is required to simulate the impact of electric vehicles on the electricity production sector.
DIW Berlin developed a module for representation of electric vehicles in its electricity dispatch model in DEFINE. The input required for consideration of electric vehicles in electricity dispatch modelling is provided by Oeko Institut and consists of:
· energy consumption of the electric vehicles,
· the information of connectivity to a charging station/spot, and
· the information of maximum charging power at a charging station/spot.
This information is derived by combining the specific energy consumption data of electric vehicle stock development and car using patterns that are based on current passenger car use. Finally, 28 different electric car usage patterns (16 for BEV, 12 for PHEV/REEV) which have the required information for each hour of a year are applied in the electricity dispatch model for representation of the total electric vehicle stock.
4.1. Electric vehicle car usage patterns
Representative mobility data of one day from all members of around 26,000 households is transformed from an individual level to a representation of car use in Germany (see chapter 3.1.1). This new database on car use in Germany is exploited to develop representative yearly car usage profiles that can be applied in electricity dispatch modelling. The electricity dispatch modelling requires the information of energy consumption and connectivity to a charging spot for the whole year and in hourly resolution, but the car usage data from MiD 2008 is given for one day. Thus, average car use profiles for weekdays, Saturday and Sunday are derived and combined to yearly car usage patterns.
As a first step, the whole database is divided with regard to the day of car use (weekday, Saturday and Sunday), the size class of the passenger car (small, mid-size and large) and the spatial planning category (core city and outskirts/rural areas) of where the car owner’s household is located. These new datasets are the basis of the average car usage profiles that are derived for each category and all data is divided further into five car usage profiles:
· profile 1: no car use
· profile 2: first trip before 12 pm and daily mileage above 40 km
· profile 3: first trip before 12 pm, daily mileage less than 40 km and at least one trip to work
· profile 4: first trip before 12 pm, daily mileage less than 40 km and no trip to work, and
· profile 5: first trip after 12 pm.
32 ….

DEFINE: Market development and CO2 emissions (Germany)
The average car usage profiles consist of:
· the starting time of the first trip,
· the starting time of the longest parking period of the day,
· the duration and location of the longest parking period of the day, and
· the ending time of the last trip of the day.
It is assumed that all cars start their first trip from home and end their last trip at home and the cars are parked either at the car owner’s property or in the public space over night. It is also evident that only two trips per day are represented in the average car usage profiles and the daily mileage of the cars is divided into two trips according to the duration of these two trips. Thus, short trips and short parking periods are not incorporated in the average profiles, but the average mileage of all trips is considered in the profiles. Finally, the average of all datasets is specified for each category to obtain average car usage profiles. Average car usage profiles of mid-size cars are presented as an example in Table 4-1; all profiles are shown in Annex I.
Table 4-1: Electric vehicle car usage pattern – weekday; mid-size cars
Source: Authors’ own calculations (derived from MiD 2008)
As a second step, the average car use profiles of one day are combined to obtain weekly car use profiles. All databases were further divided by yearly mileage6 and each car profile of a weekday is randomly connected to one profile of a Saturday and Sunday. Thus, only car usage profiles of the same size class, the same spatial planning classification of the car owner’s home and the same yearly mileage category are combined as weekly car usage profiles. The weekday car usage of this combination is applied for every day of the week and the weekly car usage profile is repeated each week of one year to obtain a yearly profile of car usage.
The MiD 2008 database underestimates – similar to other empirical mobility databases – long trips and the average yearly mileage cannot be described by the addition of daily mobility patterns that are given in MiD 2008. Additionally, some car usage profiles with no car use on the weekdays (see profile 1) are created by the approach used to derive yearly car usage. Therefore, the yearly profiles show less mileage on average than MiD 2008 and other empirical databases state for the entire vehicle stock.
6 Small yearly mileage (< 10,000 km), average yearly mileage (10,000 to 20,000 km) and high yearly mileage (> 20,000 km).
start end start end day nightcore city1 0 - - - - - - 11.361 42%2 85 07:43 09:29 15:58 18:37 06:29 13:06 17.468 14%3 21 07:17 07:57 16:10 17:40 08:13 13:37 14.427 18%4 16 09:32 10:27 13:33 14:49 03:06 18:43 10.480 15%5 25 15:39 16:14 18:18 18:53 02:04 20:46 12.222 12%average 21 12.756outskirts/rural area1 0 - - - - - - 14.026 39%2 84 07:42 09:05 15:54 18:31 06:49 13:11 21.384 20%3 21 07:16 08:08 15:55 17:40 07:47 13:36 15.541 16%4 17 09:25 10:26 13:37 14:49 03:11 18:36 12.277 16%5 28 15:24 16:02 18:25 19:02 02:23 20:22 14.989 10%average 25 15.538
sharefirst trip (hh:mm) second trip (hh:mm) parking (hh:mm)profile daily mileage (km) yearly mileage (km)
33
DEFINE: Market development and CO2 emissions (Germany)
Thus, trips are randomly added to the yearly profiles in a third step to achieve the average yearly mileage of each car profile category (size class and spatial planning category). Generally, long trips and short trips are added to the profiles. The data for short trips is taken from the profiles that are derived for weekdays, Saturday and Sunday. The data for long trips is MiD 2008 average data of all trips beyond a certain trip length. Car usage profiles are varied for BEVs and PHEVs/REEVs as more long trips are added to the yearly PHEV/REEV profiles compared to BEV profiles. In total, the added mileage of BEVs is the same as for PHEVs/REEVs and more short trips are added.
PHEVs and REEVs contain an electric and an internal combustion engine for propulsion. The share of the electric driving mode depends on the car usage, the frequency of grid connectivity and the interaction of both propulsion systems. It seems probable that neither pure serial nor pure parallel drive train architectures will be applied in PHEVs and REEVs. Thus, PHEVs and REEVs are considered in a simplified manner in electricity dispatch modelling. The electric engine is used primarily for driving and the internal combustion engine is exclusively started when the battery for electric driving is completely discharged. As a consequence, the share of electric driving mode merely depends on the car usage pattern and the frequency of charging station connectivity of each car. The differences in the assumptions for connectivity to charging stations become evident when comparing the electric drive share of PHEVs/REEVs for 2020 and 2030. It increases from 55 % to over 60 % due to the higher frequency of grid connectivity and more frequent recharging procedures.
The relevant information for electricity dispatch modelling is the energy consumption of the vehicles and the connectivity (time and maximum charging power) of the passenger cars to the charging station. The energy consumption is directly calculated by the combination of the specific energy consumption of the electric vehicle stock from TEMPS and the driving patterns and the trip lengths derived from MiD 2008. The information on the connectivity to charging stations and to the electricity grid is created by combining the parking (time and location) of the car usage profiles with the assumptions for charging infrastructure and the willingness of the car users to connect the electric car to the grid.
It is assumed that car owners have a charging spot at their property if they buy an electric vehicle and that they connect the car to the charging station at every possible time. An increase of (semi-)public infrastructure over time is adopted in both scenarios (see chapter 2.3). The assumption is that vehicles are connected to a charging station in 10 % of parking events in (semi-)public space (at work, during leisure time activities and shopping, (semi-)public parking overnight) in 2020. The share of connectivity in (semi-)public space increases to 30 % of (semi-)public parking events in 2030. Thus, the connectivity events are randomly distributed over all parking events and the plausibility of all profiles is checked by ensuring the satisfiability of the derived electric car usage and charging spot connectivity profiles.
Finally, 28 different electric vehicle profiles are selected to represent the total electric vehicle stock in the DIW Berlin dispatch model. Profiles of all categories (BEVs and PHEVs/REEVs; small, mid-size and large cars; core city and outskirts/rural areas; parking spot at own property and (semi-)public overnight parking) are selected and the dimension of the average yearly mileage of each size class is obtained on average by the chosen car usage profiles.
34 ….
DEFINE: Market development and CO2 emissions (Germany)
4.2. Electricity dispatch modelling – Two different modes of charging electric vehicles
Time-dependent power demand from electric vehicles and the interaction between electricity dispatch and electromobility are strongly linked to the mode of charging. Two extreme modes of charging can be distinguished: purely user-driven charging and purely cost-driven charging. Pure user-driven charging is characterised by:
· starting the charging process immediately after the connection to the charging station has been established and
· recharging the battery of the electric vehicles as fast as possible to its maximum capacity.
Pure cost-driven charging describes a different mode of recharging electric vehicles and it is characterised by:
· giving the electricity dispatch model full control over the time and power of the charging process on the condition that the vehicle is connected to the charging station and that all trips of the car usage profiles are compliable.
Both modes are analysed in DEFINE and the results with regard to electricity dispatch are presented for both charging modes (see chapter 5). User-driven charging is focusing on the demand of the electric car users and gives them control over the starting time of the recharging process of their cars. Cost-driven charging minimises the cost of the electricity production and potentially reduces power demand peaks of electric vehicles by shifting the charging process to low electricity price hours and by avoiding the power demand peak hours that are linked with high electricity prices. Additionally, transmission and particularly distribution grid bottlenecks may force the energy system operators to shift the charging process to off-peak hours or to reduce the power of the recharging process. This charging mode is not modelled in DEFINE since the applied electricity model of DIW Berlin does not integrate the electricity grid in their simulation runs.
It seems plausible that neither pure user-driven nor pure cost-driven charging will be applied in the case of electric vehicles in the real world. It appears more probable that some kind of hybrid charging mode will be established in which the vehicles are charged immediately to a certain capacity level and the charging process is driven by grid requirements and electricity dispatch prices after reaching this capacity level.
Nevertheless, the results of both charging modes that are presented in chapter 5 give valuable insight to the interactions of increasing shares of electric vehicles and the power market. However, it is important to keep in mind that the given results show both extremes of purely user and purely cost-driven electric vehicle charging.
5. Electricity demand and CO2 emissions of electric vehicles
Electric vehicles have a better energy efficiency than conventional vehicles and the final energy consumption can be reduced by market introduction of electric driven vehicles. The case is not straightforward for CO2 emission mitigation. Obviously, the CO2 emissions are reduced in the transport sector by zero emission driving of electric propulsion systems, but the additional power demand of the electric vehicles might increase the CO2 emissions of the electricity production. However, the level of additional emissions of electricity production – when compared to an energy system without electromobility –can be traced back to electric vehicles alone. The emissions of electricity production depend on several factors, i.e. the flexibility of other electricity consumers, the
35

DEFINE: Market development and CO2 emissions (Germany)
flexibility and controllability of the power production capacities, the market design. Therefore, the rationale of this study is to show the impacts of adding electromobility to the energy system and to understand if and how adjustments have to be made to achieve the full potential of the CO2 mitigation of electric vehicles.
The CO2 balance combines the transport sector modelling and the impact on total emissions in the transport sector (TEMPS) with the electricity dispatch modelling and the emissions from electricity production. The same mileage of the passenger cars is applied in all modelling runs and the electricity production capacities are fixed. The parameters that are changed between the modelling runs are the efficiency of conventional cars (see assumptions for CO2 regulations in chapter 2.1) and the number of electric and conventional cars (see chapter 3.3). Thus, changes in the CO2 balance are caused by the varying energy consumption of conventional cars (efficiency and number of cars) and by different operation of electricity production capacities. The base case that is used for comparison of CO2 emissions in all the following diagrams is a scenario in which the energy efficiency values of the BAU scenario are applied to the transport sector and no electric vehicles are integrated in the vehicle stock.
Figure 5-1: CO2 impact of electric vehicles to transport sector and electricity sector in 2020 and 2030 (M t CO2) – user = user-driven charging; cost = cost-driven charging
Source: Authors’ own calculations (TEMPS, Schill et al. 2014)
Figure 5-1 displays the CO2 impact of the two market scenarios (BAU and EM+) of electric vehicles and the different charging modes (user-driven and cost-driven) that are applied in electricity dispatch modelling. Therefore, the mitigated CO2 emissions of the transport sector are set against the additional CO2 emissions of the electricity generation and the net CO2 balance in comparison to the scenario without electromobility is calculated. It is not surprising that the impact on CO2 emissions (and energy demand) is still very small in 2020. The electricity consumption of electric
36 ….

DEFINE: Market development and CO2 emissions (Germany)
passenger cars accounts for less than 0.2 % of total electricity consumption in 2020. The electromobility share of total electricity consumption increases to roughly 1.2 – 1.6 % in 2030.
As a consequence of the small electric vehicle stock, the effect on CO2 emissions is also very small in 2020. The emissions of the transport sector decrease by 0.3 to 0.4 M t CO2, but the CO2 balance shows a net gain of CO2 emissions due to the rising emissions of the electricity sector. The same holds for the BAU scenario in 2030. The net increase of CO2 emissions is roughly 1.0 – 1.6 M t CO2 even if the transport sector emissions are mitigated by roughly 3 M t CO2. A different result arises for the EM+ scenario. The net CO2 emissions are lower than in the base case and the emission reduction in the transport sector (6.8 M t CO2) outweighs the additional emissions of electricity production. However, the transport sector emission reduction cannot be attributed merely to electromobillity since the EM+ scenario also illustrates the effect of the better energy efficiency of conventional cars in comparison to the BAU scenario and a higher share of electric vehicles. Approx. 70 %7 of the additional CO2 emission mitigation of the transport sector from BAU to EM+ scenario can be ascribed to the lower energy consumption of conventional cars. This high amount is when considering that even in 2030 the larger part of new registrations are conventional cars and the full non-emission driving accounts only for BEVs.
The emissions of the electricity sector differ clearly between the user-driven and the cost-driven charging mode. This can be explained by changes in power plant dispatch. The user-driven charging mode involves a time-independent additional electricity load to the energy system since it is caused only by the car users and the time period of connectivity to the charging stations. Thus, the additional electricity demand starts the electricity production from capacities that have been slightly above the marginal power plant of the merit order curve. At times, this additional electricity production capacity might be surplus renewable energy that remained non-usable before adding electromobility. At other times – especially in the evening hours and in hours of low renewable energy production – the additional operating capacity might be from fossil power plants. Since high grid connectivity of electric vehicles is expected in evening hours, this additional fossil power generation is often provided by peak gas power plants (see Schill et al. 2014).
The cost-driven charging enables the electricity dispatch model to shift the charging to hours of low short-term marginal costs. Renewable production capacities have the lowest marginal costs, followed by lignite and hard-coal power plants. As a consequence, the charging is shifted as much as possible to hours of renewable surplus production and to the night when the electricity load is lower and lignite and hard-coal power plants are the typical marginal power plants. Thus, the CO2 mitigation effect of better integration of renewable electricity into the energy system is combined with electricity production from high-emission production capacities such as lignite and hard-coal power plants. Overall, the cost-driven charging thus shows a higher CO2 intensity of the additional electricity consumption with the given assumptions for electricity production capacities and electricity consumption derived from the Netzentwicklungsplan Strom 2013.
Cost-driven charging also results in optimal integration of renewable energy capacities since their marginal costs are lower compared to all other electricity production options. The electricity dispatch model uses perfect foresight and can shift the charging hours in an optimal manner to renewable electricity production hours. The share of renewable curtailment in 2030 is around 0.65 % (relative to the total potential feed-in of onshore wind, offshore wind, and PV) in the scenario that does not include electricity demand from electromobility. It decreases to 0.55 % in the user-driven charging mode and even further to 0.29 % when the cost-driven charging is applied. In
7 The number is calculated by comparing the difference between BAU and EM+ scenario with the difference between the BAU and sensitivity scenario that holds the conventional car energy efficiency of BAU scenario and the new registration data of EM+ scenario.
37

DEFINE: Market development and CO2 emissions (Germany)
reality, this optimal use of renewables might be hampered by the unwillingness of car users to enable the energy supplier to shift charging hours as well as by restrictions and requirements due to the transmission and distribution grid.
It might be concluded that electromobiltiy does not yield a benefit with regard to CO2 emissions when considering Figure 5-1. This seems to be true with the framework conditions of the power market that are assumed as the base case. A strategy to better exploit the CO2 mitigation potential of electric vehicles would be to add renewable capacities to the electricity system. Therefore, additional electricity dispatch model runs are conducted with additional renewable capacities (RE+) that produce as much electricity as is demanded by electric vehicles are added to the power production system (see Schill et al. 2014). Three sub-scenario model runs for the EM+ scenario in 2030 are conducted by a) using only wind power plants (100 % wind), b) using only photovoltaics (100 % pv) and c) using wind power plants and photovoltaics (50 % wind / 50 % pv) as additional electricity production capacities.
Figure 5-2: CO2 impact of electric vehicles on transport sector and electricity sector in 2030 (M t CO2) – RE+ scenario (added renewable electricity production capacities)
Source: Authors’ own calculations (TEMPS, Schill et al. 2014)
Figure 5-2 shows the net CO2 balance of the transport and the electricity generation sector of the EM+ scenario with the added renewable production capacities. On this account, the emissions of the EM+ scenario are compared to the emissions of the scenario without electric vehicles. It is not surprising that the addition of renewable capacities results in less CO2 emissions in comparison to the previous model runs. The new renewable capacities are almost completely integrated into the power system when applying the cost-driven charging mode. The charging hours are shifted very rarely to hours of additional operation of lignite and hard-coal power plants and the additional emissions of the electricity sector are limited to 0.3 to 0.4 M t CO2. The net CO2 mitigation of electricity sector and transport sector is increased to 6.5 M t CO2 and the mitigation potential is
38 ….

DEFINE: Market development and CO2 emissions (Germany)
almost fully exploited. The net CO2 balance is even better when applying the user-driven charging mode in electricity dispatch modelling as the utilization of lignite and hard-coal power plants is decreased. The emissions of the electricity system can even be reduced compared to the case without electric vehicles and without additional renewables in two sub-scenarios, since hydro pump storage power plants can integrate the added capacities and replace lignite and hard-coal power plant operation.
Although the added renewable capacities are very well integrated, it might come about that potential renewable electricity is curtailed in some hours due to a lack of load consumers. The renewable curtailment rate is between 0.29 % and 0.55 % in the model runs without additional renewable capacities. This rate increases to 0.4 % - 0.91 % after adding renewable capacities. Since the potential renewable feed is almost completely integrated into the system, these curtailment rates are regarded as remaining very low even after adding renewable capacities to the system.
However, it can be concluded that electric vehicles have the potential to reduce CO2 emissions that are caused by motorised transport. It has also been illustrated that the energy system might be adapted to the added electricity demand from the electric vehicles to achieve the CO2 mitigation to the fullest.
6. Conclusion
The market penetration of electric vehicles and the vehicle stock in Germany up to 2030 are derived as part of the modelling framework developed in DEFINE that analyses the emission and economic effects of the market introduction of electromobility. The vehicle stock data serves as an input parameter for DIW Berlin’s dispatch model, which illustrates the interactions of electric vehicles and the electricity production. The dispatch model also determines the CO2 emissions of the power sector. Finally, the CO2 emissions of transport and electricity sector are compared in order to show the net CO2 impact of electromobility.
Two scenarios are developed to compare the impact of different electric vehicle market developments and to better understand the impact of policy measures for supporting the electromobility market. Three policy measures that improve the economics of electric vehicle usage in comparison to conventional car usage are applied in the EM+ scenario. Continuation of current policies is assumed in BAU scenario.
The market penetration of electric vehicles and electric vehicle stock are derived by considering restrictions of electric vehicles and analysing acceptance data of electromobility. The impact of the applied supporting policy measure (EM+ scenario) is clear and the electric vehicle stock increases to 5.1 million passenger cars in 2030. The electric vehicle stock is made up of approx. 3.9 million passenger cars in 2030 if no additional policy measures are implemented (BAU scenario). The major share of the electric car stock is PHEVs/REEVs.
The net CO2 emission balance of CO2 mitigation in the transport sector and the potential CO2 emission increase in the electricity sector is analysed. A net gain in CO2 emission is evident in the BAU scenario. The EM+ scenario shows a small CO2 benefit in 2030 which is attributed to lower energy consumption levels of conventional cars. If additional renewable capacities are added to the power plant fleet that has been derived before from the Netzentwicklungsplan Strom 2013, it can be seen that the CO2 mitigation potential of electromobility can be (almost) completely exploited and the emission reduction is as high as 6.8 M t CO2 in 2030.
39

DEFINE: Market development and CO2 emissions (Germany)
It is evident from the work conducted for this study that electromobility contains the potential for CO2 emission mitigation of the transport sector, but this potential is not exploited automatically. The electricity production capacities have to be carefully assessed in order to not add CO2 emissions in the electricity production sector compared to a scenario without electromobility. In the case of the assumptions derived from the Netzentwicklungsplan Strom 2013, the electricity model runs show higher CO2 emissions and additional renewable capacities are required to prevent an increase in GHG emissions due to electromobility. However, it is also illustrated that it is possible to achieve the full potential of GHG emission mitigation of electric vehicles and that electric vehicles are able to fulfil their role as one part of a GHG emission mitigation strategy for the transport sector.
40 ….

DEFINE: Market development and CO2 emissions (Germany)
List of References
50Hertz Transmission GmbH et al. 2013 Netzentwicklungsplan Strom 2013. 2013.
EEA (European Environment Agency) 2011 Monitoring of CO2 emissions from passenger cars – Regulation 443/2009 – CO2 Monitoring database 2010. December 06, 2011.
Götz et al. 2011 Akzeptanz und Attraktivität von Elektroautos – Arbeitspaket 1 des Projekts OPTUM: Optimierung von Umweltentlastungspotenzialen von Elektrofahrzeugen. 2011.
Hacker et al. 2011 Marktpotenziale und CO2-Bilanz von Elektromobilität – Arbeitspakete 2 bis 5 des Forschungsvorhabens OPTUM: Optimierung von Umweltentlastungspotenzialen von Elektrofahrzeugen. 2011.
Hacker et al. 2014 eMobil 2050 - Szenarien zum möglichen Beitrag der Elektromobilität zum langfristigen Klimaschutz. 2014.
Hülsmann et al. 2014 Working Paper. Konventionelle und alternative Fahrzeugtechnologien bei Pkw und schweren Nutzfahrzeugen - Potenziale zur Minderung des Energieverbrauchs bis 2050. Öko- Institut Working Paper 3/2014. 2014.
KBA (Kraftfahr-Bundesamt) 2011 Fahrzeugzulassungen (FZ) – Neuzulassungen und Besitzumschreibungen von Kraftfahrzeugen nach Emissionen und Kraftstoffen – Jahr 2010. 2011.
MiD (Mobilität in Deutschland) 2008 Follmer et al. Mobilität in Deutschland 2008. 2010.
Nitsch et al. 2012 Langfristszenarien und Strategien für den Ausbau der erneuerbaren Energien in Deutschland bei Berücksichtigung der Entwicklung in Europa und global. 2012.
Repenning et al. 2014 Klimaschutzszenario 2050. 2014.
Schill et al. 2014 Project: Development of an Evaluation Framework for the Introduction of Electromobility. Project Report: Power System Impact of Electric Vehicles in Germany. Combined Report on three deliverables: 2.2: Report regarding interactions with the power grid. 7.1: Report on the updated Dataset and the calibrated and validated Electricity Market Model including different scenarios. 7.2: study regarding interactions between e-mobility and power market. 2014.
Schlesinger et al 2010 Energieszenarien für ein Energiekonzept der Bundesregierung.2010.
41

DEFINE: Market development and CO2 emissions (Germany)
Annex
Annex I. Electric vehicle car usage pattern
Table I-1: Electric vehicle car usage pattern – weekday; core city
Source: own assumptions (derived from MiD 2008)
Table I-2: Electric vehicle car usage pattern – weekday; outskirts/rural area
Source: Authors’ own assumptions (derived from MiD 2008)
start end start end day nightsmall cars1 0 - - - - - - 10.119 42%2 85 07:35 09:22 16:21 18:57 06:59 12:38 17.173 11%3 20 07:24 08:08 16:11 17:34 08:03 13:50 11.774 19%4 16 09:17 10:11 13:56 15:04 03:45 18:13 9.954 16%5 33 15:08 15:54 18:55 19:38 03:01 19:30 10.692 12%average 20 11.245mid-size cars1 0 - - - - - - 11.361 41%2 85 07:43 09:29 15:58 18:37 06:29 13:06 17.468 14%3 21 07:17 07:57 16:10 17:40 08:13 13:37 14.427 18%4 16 09:32 10:27 13:33 14:49 03:06 18:43 10.480 15%5 25 15:39 16:14 18:18 18:53 02:04 20:46 12.222 12%average 21large cars1 0 - - - - - - 12.497 43%2 110 08:15 10:11 16:21 18:59 06:10 0,55 24.586 14%3 21 07:20 08:01 16:24 17:49 08:23 0,56 14.118 17%4 17 09:41 10:45 14:04 15:29 03:19 0,76 12.827 14%5 27 15:31 16:09 18:30 19:14 02:21 0,85 13.298 11%average 24 14.573
yearly mileage (km) shareprofile daily mileage (km) first trip (hh:mm) second trip (hh:mm) parking (hh:mm)
start end start end day nightsmall cars1 0 - - - - - - 9.768 39%2 84 07:27 08:48 15:50 18:18 07:02 13:09 16.921 17%3 21 07:21 08:01 15:41 17:25 07:40 13:56 11.262 18%4 18 09:10 10:05 13:39 14:55 03:34 18:15 10.492 15%5 23 15:16 15:50 18:30 19:04 02:40 20:12 11.731 11%average 23 11.582mid-size cars1 0 - - - - - - 14.026 39%2 84 07:42 09:05 15:54 18:31 06:49 13:11 21.384 20%3 21 07:16 08:08 15:55 17:40 07:47 13:36 15.541 16%4 17 09:25 10:26 13:37 14:49 03:11 18:36 12.277 16%5 28 15:24 16:02 18:25 19:02 02:23 20:22 14.989 10%average 25 15.538large cars1 0 - - - - - - 12.883 38%2 91 07:36 09:01 15:55 18:17 06:54 13:19 21.891 20%3 21 07:14 08:04 16:08 17:42 08:04 13:32 16.558 15%4 17 09:18 10:11 13:16 14:19 03:05 18:59 13.129 15%5 27 15:07 15:41 17:57 18:34 02:16 20:33 15.007 11%average 27 15.563
profile daily mileage (km) first trip (hh:mm) second trip (hh:mm) parking (hh:mm) yearly mileage (km) share
42 ….

DEFINE: Market development and CO2 emissions (Germany)
Table I-3: Electric vehicle car usage pattern – Saturday; core city
Source: Authors’ own assumptions (derived from MiD 2008)
Table I-4: Electric vehicle car usage pattern – Saturday; outskirts/rural area
Source: Authors’ own assumptions (derived from MiD 2008)
start end start end day nightsmall cars1 0 - - - - - - 9.976 57%2 133 07:27 10:12 17:20 19:60 07:08 11:27 17.370 7%3 19 07:17 07:46 14:30 15:42 06:44 15:35 8.255 5%4 16 09:21 10:17 14:00 14:48 03:43 18:33 11.598 17%5 39 14:60 15:35 17:54 18:50 02:19 20:10 13.003 15%average 19mid-size cars1 0 - - - - - - 8.458 48%2 108 09:09 10:42 15:27 17:20 04:45 15:49 16.877 11%3 13 09:15 09:43 15:10 16:18 05:27 16:57 12.761 3%4 15 10:07 10:60 13:49 14:39 02:49 19:28 13.988 25%5 25 15:44 16:24 18:27 19:02 02:03 20:42 12.174 13%average 19 11.384large cars1 0 - - - - - - 8.368 48%2 81 09:20 12:13 16:08 19:23 03:55 13:57 22.454 12%3 18 06:21 06:53 13:06 15:42 06:13 14:39 18.058 3%4 19 09:57 10:53 13:49 15:04 02:56 18:53 14.535 25%5 19 15:16 16:12 19:21 19:52 03:09 19:24 12.812 12%average 17 12.461
yearly mileage (km) shareprofile daily mileage (km) first trip (hh:mm) second trip (hh:mm) parking (hh:mm)
start end start end day nightsmall cars1 0 - - - - - - 9.291 49%2 92 08:32 10:44 15:50 18:54 05:06 13:38 15.345 10%3 20 06:59 07:43 15:11 16:57 07:28 14:02 10.703 5%4 16 09:59 10:51 13:58 14:39 03:07 19:20 10.821 20%5 21 14:26 14:56 16:53 17:21 01:57 21:05 10.408 16%average 17mid-size cars1 0 - - - - - - 14.355 49%2 115 09:01 11:36 16:39 18:56 05:03 14:05 18.836 13%3 21 07:32 08:20 14:33 17:21 06:13 14:11 14.317 3%4 15 09:32 10:23 13:27 14:13 03:04 19:19 12.270 22%5 30 14:38 15:25 17:57 18:44 02:32 19:54 17.005 13%average 23large cars1 0 - - - - - - 14.592 46%2 103 08:32 10:32 15:42 18:07 05:10 14:25 18.793 14%3 20 07:50 08:59 14:49 15:50 05:50 16:00 14.438 3%4 16 09:32 10:31 13:35 14:34 03:04 18:58 14.390 24%5 34 14:29 15:12 17:41 18:26 02:29 20:03 15.983 13%average 23 15.305 0%
profile daily mileage (km) first trip (hh:mm) second trip (hh:mm) parking (hh:mm) yearly mileage (km) share
43
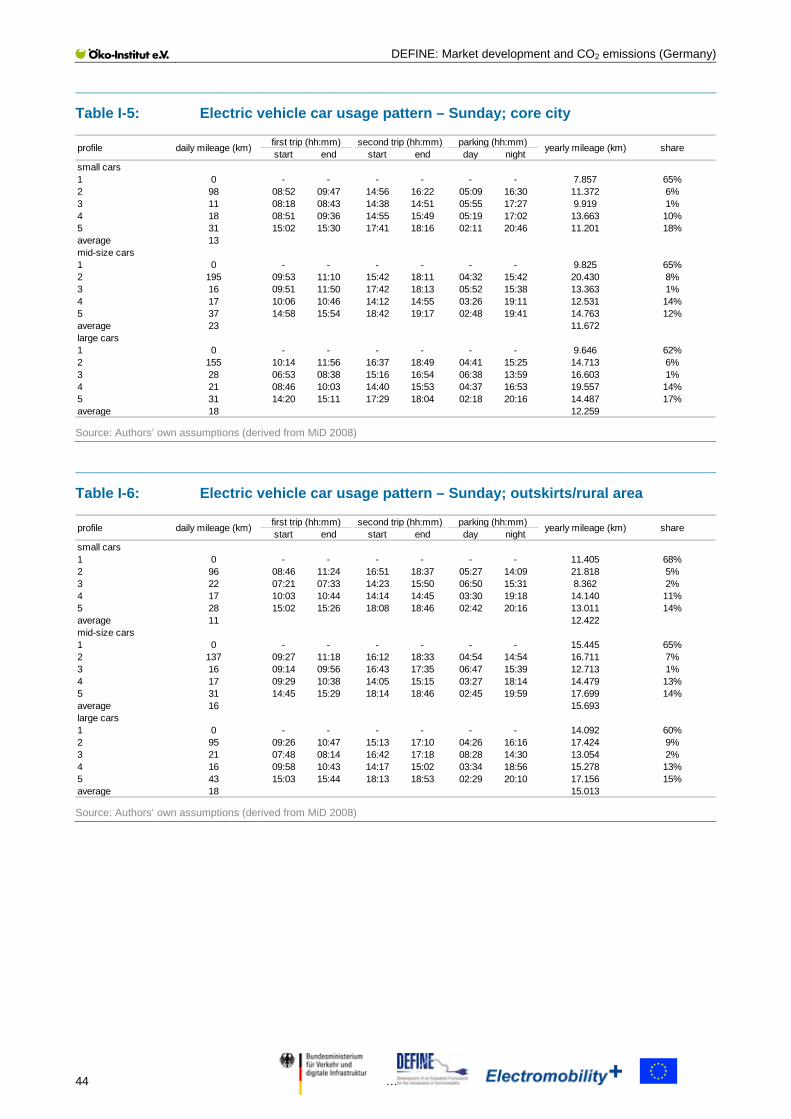
DEFINE: Market development and CO2 emissions (Germany)
Table I-5: Electric vehicle car usage pattern – Sunday; core city
Source: Authors’ own assumptions (derived from MiD 2008)
Table I-6: Electric vehicle car usage pattern – Sunday; outskirts/rural area
Source: Authors’ own assumptions (derived from MiD 2008)
start end start end day nightsmall cars1 0 - - - - - - 7.857 65%2 98 08:52 09:47 14:56 16:22 05:09 16:30 11.372 6%3 11 08:18 08:43 14:38 14:51 05:55 17:27 9.919 1%4 18 08:51 09:36 14:55 15:49 05:19 17:02 13.663 10%5 31 15:02 15:30 17:41 18:16 02:11 20:46 11.201 18%average 13mid-size cars1 0 - - - - - - 9.825 65%2 195 09:53 11:10 15:42 18:11 04:32 15:42 20.430 8%3 16 09:51 11:50 17:42 18:13 05:52 15:38 13.363 1%4 17 10:06 10:46 14:12 14:55 03:26 19:11 12.531 14%5 37 14:58 15:54 18:42 19:17 02:48 19:41 14.763 12%average 23 11.672large cars1 0 - - - - - - 9.646 62%2 155 10:14 11:56 16:37 18:49 04:41 15:25 14.713 6%3 28 06:53 08:38 15:16 16:54 06:38 13:59 16.603 1%4 21 08:46 10:03 14:40 15:53 04:37 16:53 19.557 14%5 31 14:20 15:11 17:29 18:04 02:18 20:16 14.487 17%average 18 12.259
shareyearly mileage (km)parking (hh:mm)second trip (hh:mm)first trip (hh:mm)daily mileage (km)profile
start end start end day nightsmall cars1 0 - - - - - - 11.405 68%2 96 08:46 11:24 16:51 18:37 05:27 14:09 21.818 5%3 22 07:21 07:33 14:23 15:50 06:50 15:31 8.362 2%4 17 10:03 10:44 14:14 14:45 03:30 19:18 14.140 11%5 28 15:02 15:26 18:08 18:46 02:42 20:16 13.011 14%average 11 12.422mid-size cars1 0 - - - - - - 15.445 65%2 137 09:27 11:18 16:12 18:33 04:54 14:54 16.711 7%3 16 09:14 09:56 16:43 17:35 06:47 15:39 12.713 1%4 17 09:29 10:38 14:05 15:15 03:27 18:14 14.479 13%5 31 14:45 15:29 18:14 18:46 02:45 19:59 17.699 14%average 16 15.693large cars1 0 - - - - - - 14.092 60%2 95 09:26 10:47 15:13 17:10 04:26 16:16 17.424 9%3 21 07:48 08:14 16:42 17:18 08:28 14:30 13.054 2%4 16 09:58 10:43 14:17 15:02 03:34 18:56 15.278 13%5 43 15:03 15:44 18:13 18:53 02:29 20:10 17.156 15%average 18 15.013
daily mileage (km)profile shareyearly mileage (km)parking (hh:mm)second trip (hh:mm)first trip (hh:mm)
44 ….