defense working capital funds - pdi 2016 · defense working capital funds ... proprietary and...
TRANSCRIPT

Defense Working Capital FundsCurrent Issues
Gretchen Anderson
Director, Program & Financial Control
June 2016

2
Agenda
I. Department-Wide Initiatives with WCF impacts
1. Inventory Baseline Values
2. OM&S Expense Recognition
3. Initial Spares
4. Progress Billing
5. Minor Equipment
II. WCF Management Issues
1. Proprietary and Budgetary Accounting
2. Capital Investment Program
3. Transportation Financial Auditability
4. Fuel
5. Congressional Interest
6. OUSD(C) Reorganization
Goal: Present WCF initiatives in context of Departmental objectives

Inventory/OM&S Initial Baseline Valuation
• OSD worked with FASAB to create a new standard for Inventory Baseline
Valuation to allow for a wider use of estimates than were previously allowed
– Allows for alternative valuation methodologies of existing Inventory assets
(e.g., Fair Market Value, Standard Cost, Latest Acquisition Cost, etc.)
– Requires Management’s Unreserved Assertion that SFFAS 3-compliant
systems and processes are in place and effective prior to establishing the
baseline value
– Baseline can only be established once – all future purchases and
sales/issuances of Inventory and Related property assets must be done in
accordance with SFFAS 3 and DoDFMR valuation methodologies
(Generally Moving Average Cost [MAC], but Specific Identification allowed
where applicable).
• Requirements codified in SFFAS 48: Opening Balances for Inventory,
Operating Materials and Supplies, and Stockpile Materials, January 27, 2016
3
Document Title Status Embedded
Alternative Valuation Methodologies for
Establishing Opening Balances for
Inventory, Operating Materials and
Supplies, and Stockpile Materials
Final - Signed by DCFO on August 28,
2015
To be included in DoD FMR Volume 4,
Chapter 4

OM&S Expense Recognition
• SFFAS 3 requires the use of the consumption method of
accounting for OM&S unless one of three criteria exist
– The OM&S is not a significant amount
– The OM&S is in the hands of an end user for use in normal
operations
– The benefit of using the consumption method is outweighed by the
cost
• OSD established a framework for Components to assess:
– Whether the purchases method can be justified under SFFAS 3
– If the consumption method is used, at what point can OM&S be
expensed as consumed
4
Document Title Status Embedded
Accounting Policy Update for the
Expense Recognition of Operation
Materials and Supplies Memorandum
Final - Signed by DCFO on September 4,
2015
To be included in DoD FMR Volume 4,
Chapter 4

Initial Spares
Initial Spares Definition
• Consumable or reparable spare and repair parts that support newly fielded weapons systems during the initial period of operation until the supply system can support the demand generated by the systems.
Funding
• The Component activity that owns the weapon system is responsible for funding the initial spares.
• The program office must acquire initial and inventory augmentation spares based on the materiel support date. Program managers must use their appropriated funds and may use supply management activities’ contracting capabilities to acquire initial spares and stock level increases.
Acquisition of Initial Spares by the Working Capital Fund
• The acquiring program office will transfer the initial spares or augmented inventory without reimbursement to the Supply Activity.
• This transfer must be evidenced with sufficient supporting documentation (e.g., form DD1150 Request for Issue/Transfer/Turn-in).
• Reimbursable or direct cite MIPRS are no longer permitted.
5
Document Title Status Embedded Document
Inventory and Related Property Policy
Requirements Memorandum
Final - Signed by DCFO on November
13, 2015
To be included in DoD FMR Volume 4,
Chapter 4

Progress Billing for Manufactured Items
• Supply management activities will record manufactured inventory
that is incrementally billed as Work in Process (Other Government
Activities).
• A subsidiary account must be maintained for each contract to track
the value of work performed as represented by progress payments.
• Sources for entries to this account include interagency agreements,
invoices, payment vouchers, and property acceptance documents.
• When the completed item is received, it is moved to the appropriate
inventory account.
6
Document Title Status Embedded Document
Inventory and Related Property Policy
Requirements Memorandum
Final - Signed by DCFO on November
13, 2015
To be included into DoD FMR Volume 4,
Chapter 4

Minor Equipment
• Establishes criteria for minor equipment that does not fit the definition
of OM&S
• Relates to tangible personal property that
– Has a useful life of 2 years or more
– Not intended for sale in the ordinary course of operations
– Is intended for use by the reporting entity
– Falls under the capitalization threshold
• Components must analyze items in their stores that meet the above
criteria and document the analysis in accordance with Components’
audit needs
7
Document Title Status Embedded Document
Inventory and Related Property Policy
Requirements Memorandum
Final - Signed by DCFO on
November 13, 2015
Will be included in DoD FMR
Volume 4, Chapter 4

8
Agenda
I. Department-Wide Initiatives with WCF impacts
1. Inventory Baseline Values
2. OM&S Expense Recognition
3. Initial Spares
4. Progress Billing
5. Minor Equipment
II. Applied Initiatives and WCF Management Issues
1. Proprietary and Budgetary Accounting
2. Capital Investment Program
3. Transportation Financial Auditability
4. Fuel
5. Congressional Interest
6. OUSD(C) Reorganization
Goal: Present WCF initiatives in context of Departmental objectives

9
WCF Management Issues:
Proprietary and Budgetary Accounting
Proprietary Accounting
Assets = Liabilities + Equity
• Designed to convey the financial
health and value of an entity
• Focus on Assets, Liabilities,
Operating Results, and Cash
• Traditional view for managing
Working Capital Funds
Budgetary Accounting
Budgetary Resources =
Status of Budgetary Resources
• Designed to ensure the proper use of
budgetary authority
• Focus on the status of resources
from appropriation through
disbursement (life cycle)
• Traditional view for managing most
Federal entities appropriation-funded
activities
Both proprietary and budgetary accounting are required
(Chief Financial Officers Act, 1990)

10
Budgetary Authorities for WCFs
1. Direct Appropriation
• May have been the source of the initial operating corpus
• Provided for specific purposes other than normal operations
2. Spending (Reimbursable) Authority
• Authority to accept budgetary resources in the form of customer
orders
• Obligations cannot be incurred prior to receipt of a funded
customer order
3. Contract Authority
• Authority to obligate in advance of budgetary resources
• Used for supply operations and capital investments
• DoD application of contract authority is unique
• Temporary authority, eventually replaced by customer order

11
Budgetary Authorities Matrix
Authority to
Accept
Reimbursable
Orders
Authority to
Obligate
Budgetary
ResourceCash
Direct Appropriation
Spending (Reimbursable)
Authority
Customer Order
Contract Authority
WCF Obligation Authority and Resources
12
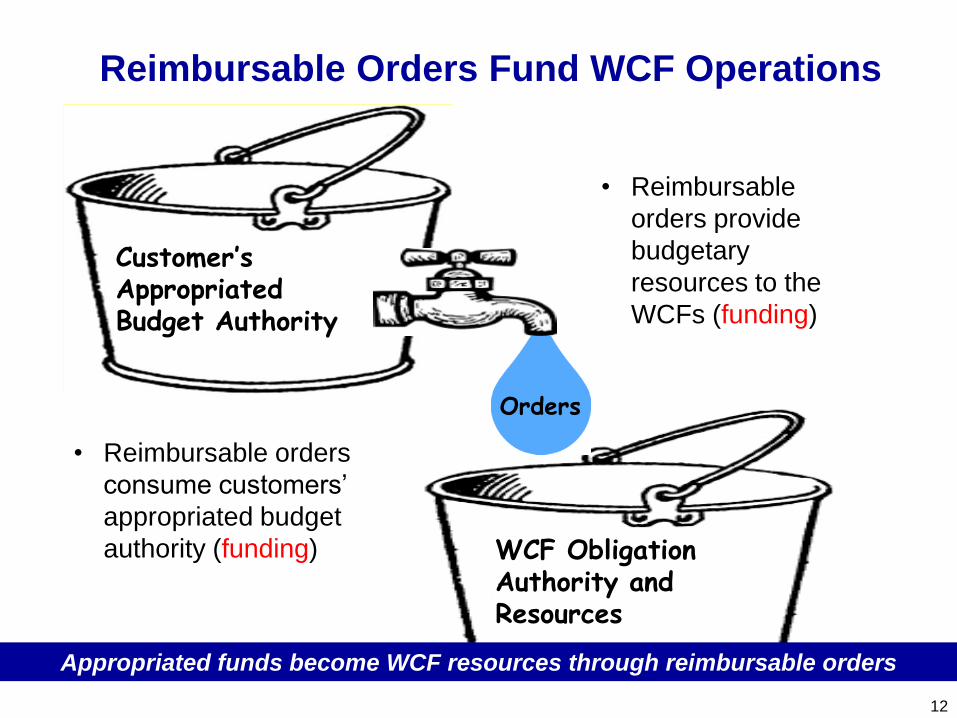
Reimbursable Orders Fund WCF Operations
Appropriated funds become WCF resources through reimbursable orders
Orders
Customer’s Appropriated Budget Authority
• Reimbursable orders
consume customers’
appropriated budget
authority (funding)
• Reimbursable
orders provide
budgetary
resources to the
WCFs (funding)
13
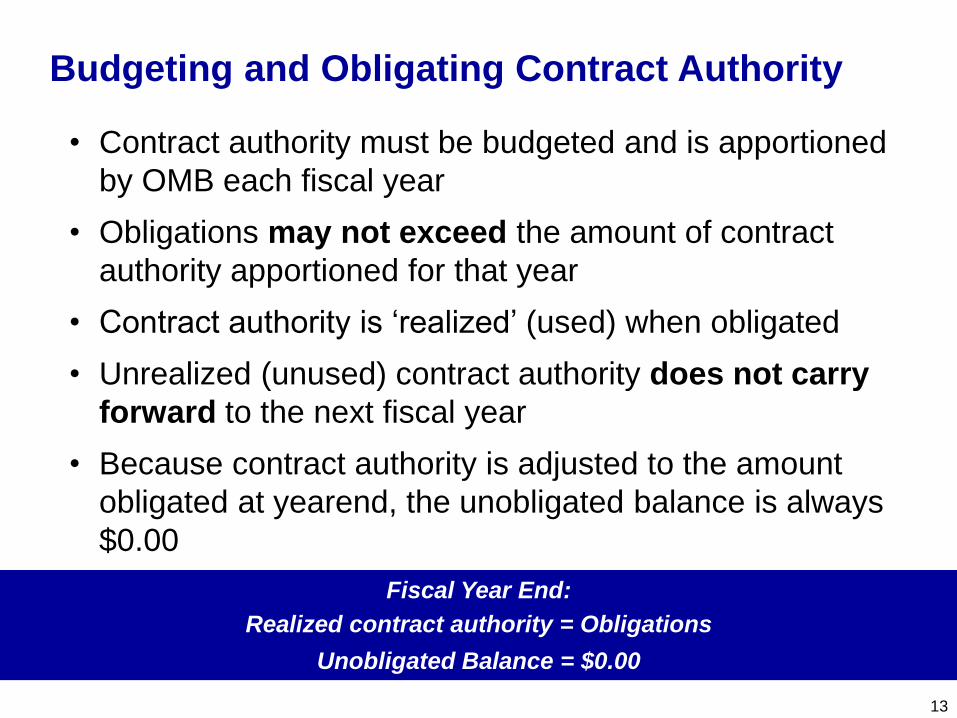
Budgeting and Obligating Contract Authority
• Contract authority must be budgeted and is apportioned
by OMB each fiscal year
• Obligations may not exceed the amount of contract
authority apportioned for that year
• Contract authority is ‘realized’ (used) when obligated
• Unrealized (unused) contract authority does not carry
forward to the next fiscal year
• Because contract authority is adjusted to the amount
obligated at yearend, the unobligated balance is always
$0.00
Fiscal Year End:
Realized contract authority = Obligations
Unobligated Balance = $0.00

14
Contract Authority and Resources
• Contract authority is a temporary resource that
provides authority to obligate only
• Contract authority must be replaced with actual
budgetary resources (customer orders) to fund the
obligation
• The replacement of contract authority with customer
orders is tracked in the budgetary accounting records
• USSGL 4139, Contract Authority Carried Forward,
reflects the cumulative balance of contract authority
that has not been funded (replaced with actual
resources) in prior fiscal years
USSGL 4139, Contract Authority Carried Forward
=
Prior Year Contract Authority Realized – Prior Year Customer Orders

• Every obligation against CA and every order replacing CA contributes
to the cumulative balance of unfunded contract authority and rolls
into USSGL 4139 at fiscal year close
• Some sales result in gains (green boxes), some result in losses (pink
boxes), while some items have not yet been sold (gray boxes)
• A normal (debit) balance in USSGL 4139 means more CA was
realized (used) than was replaced with customer orders (funded)
• As with credit cards, a positive balance indicates amounts owed
15
Cumulative Balance
of Unfunded Contract Authority (CA)
Item cost obligated (CA Used) $90
Standard price order
(CA Replaced)
-$100
Net CA Effect -$10
Item cost obligated (CA Used) $100
Standard price order
(CA Replaced)
-$85
Net CA Effect $15
Item cost obligated (CA Used) $105
Standard price order
(CA Replaced)
-
Net CA Effect $105

16
Contract Authority, Cash, and Resources
• The cash to liquidate contract authority obligations comes
from the collection of customer orders
• The same customer orders that generate the cash will
replace the contract authority, thus funding the obligation
• Usually before the collection with supply operations
• Simultaneous with the collection in the case of capital investment
Contract Authority
“Disconnected” from Cash and Resources
• With contract authority, the
authority to obligate is
disconnected from cash and the
resources that generate it

Non-Supply and Non-Energy WCFs
17
Anticipate Spending Authority (SA):
No $ - No OA
Accept Customer Orders:
OA – No $
Perform Work:
Obligate
OA is used – still no $
Bill and Collect $
Outlay $ to Pay the Bill for Work Performed
SA established at
beginning of year and only
increased as needed
From obligation to
perform work to
outlay: generally
30 days or less

Supply and Energy WCFs
18
Apportion Contract Authority (CA):
OA – No $
Stock Shelves/Fill Tanks:
Obligate = Realized CA
OA used No $
Accept Customer Orders:
Replace the CA
Outlay $ to Pay the Bill for Stock
Deliver Goods; Collect $
WCFs need cash to
cover the outlay-to-
collection cycle
CA established at
beginning of year and only
increased as needed
Inventory
turns quickly
Ever-revolving cycle
moves quickly
Orders/Goods/
$ constantly
churning

19
Available Resources
• Cash does not stand alone as a resource; it comes
with or results from a budgetary resource
• A positive cash balance does not always indicate
available resources – amounts may be obligated but
not yet disbursed
• Likewise, available resources may be masked in the
standard accounting for contract authority
How can there be available resources with no unobligated balance?
• All customer orders (valued at standard
price) are applied to replace contract
authority
• Contract authority is realized at actual cost
• The unobligated balance is always $0.00

20
Budgetary (Resource) Impacts Occur at the Beginning of the Process
Proprietary (Cash) Impacts Occur at the End of the Process
Timing of Proprietary and Budgetary Impacts
BudgetaryProprietary
Accounts
Payable
Cash
Balance
Unobligated
Balance
Obligation,
Undelivered
Obligation,
Delivered,
Unpaid
Obligation,
Delivered,
Paid
100 Beginning Balance 100
100 Obligate Item, $60 40 60
60 100 Receive Item, $60 40 0 60
0 40 Pay for Item, $60 40 0 60
Accounts
Receivable
Cash
Balance
Unobligated
Balance
Ordered,
Unfilled
Order,
Filled,
Uncollected
Order,
Filled,
Collected
40 Beginning Balance 40
40 Order Received, $50 90 50
50 40 Fill Order, $50 90 0 50
0 90 Collect, $50 90 50

21
BudgetaryProprietary
“Budgetary Cash” Concept
Proprietary cash can be calculated from budgetary accounting information
Cash
Balance
Unobligated
Balance+
Obligation,
Undelivered+
Obligation,
Delivered,
Unpaid
=Budgetary
Cash
100 Beginning Balance 100 100
100 Obligate Item, $60 40 + 60 = 100
100 Receive Item, $60 40 + 0 + 60 = 100
40 Pay for Item, $60 40 + + 0 + 40
Cash
Balance
Unobligated
Balance -Ordered,
Unfilled -Order,
Filled,
Uncollected
=Cash
Balance
40 Beginning Balance 40 40
40 Order Received, $50 90 - 50 = 40
40 Fill Order, $50 90 - 0 - 50 = 40
90 Collect, $50 90 - - 0 = 90
The basic calculation for entities with contract authority is:
Budgetary Cash = Unobligated Balance + Unpaid Obligations
– Uncollected Orders – Unfunded Contract Authority

22
Flexibilities: Contract Authority and Available Resources
• Although the unobligated balance is always $0.00, it is
possible to accumulate resources (and excess cash)
when revenues exceed costs – resources can “hide” in
Contract Authority
• Excess cash may be transferred out of the fund, as long
as available resources are transferred with it
• “Hidden” resources made available by reversing the entry
that applies customer orders to replace contract authority
23
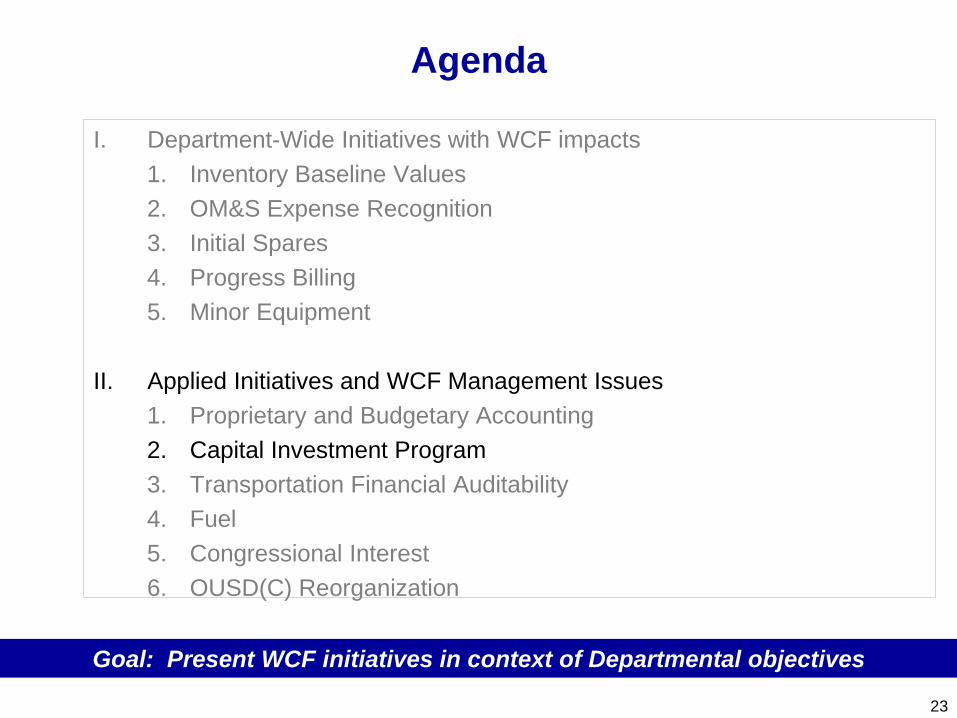
Agenda
I. Department-Wide Initiatives with WCF impacts
1. Inventory Baseline Values
2. OM&S Expense Recognition
3. Initial Spares
4. Progress Billing
5. Minor Equipment
II. Applied Initiatives and WCF Management Issues
1. Proprietary and Budgetary Accounting
2. Capital Investment Program
3. Transportation Financial Auditability
4. Fuel
5. Congressional Interest
6. OUSD(C) Reorganization
Goal: Present WCF initiatives in context of Departmental objectives

Capital Investment Program (CIP) Workshops
• Six CIP Policy Workshops (March-April)
• Overview for Revolving Fund and DWCF Senior Leaders across
the Department – set ground rules and goals
• Subject Matter Experts (SMEs) briefed each other on:
• CIP program management status
• Approach to CIP requirements
• Successes and challenges
• Management tools, triggers and actions
• Best business practices and good ideas
• Group discussed recommendations to improve CIP program
management including policy improvements and best practices
24
Addressed Agency Requests to Streamline the CIP

CIP Background
25
• CIP makes up less than 1 percent of the Revolving Fund
budget• Consistent with full costing nature of working capital fund
• Provides ability to fund Revolving Fund investment requirements
without having to compete for procurement funding
• BUT--Requires proportionally more effort to manage effectively
• Prior to Defense Business Operations Fund (DBOF)• Prior to FY 1983, no capital program existed within revolving
funds
• In 1983, DoD established the Asset Capitalization Program
(ACP) for industrial fund activity capital requirements using
reimbursable authority
• Aug 1989 GAO Report critical of management of ACP program
• FY 1990- FY 1991, ACP program suspended by Congress
• Under DBOF in FY 1994, 10 Sec 2208 was amended to its
current state in regards to the capital asset subaccount
The current CIP has evolved over time

Legal Framework
• 10 USC 2208. Working Capital Funds
• (k)(1) “…a contract for the procurement of a capital asset financed by
a working capital fund may be awarded in advance of the availability
of funds in the working-capital fund for the procurement.”
• (2) Paragraph (2) applies to any of the following capital assets that
have a development or acquisition cost of not less than $250,000:
• (A) An unspecified minor military construction project under
section 2805(c) of this title.
• (B) Automatic data processing equipment or software.
• (C) Any other capital equipment.
• (D) Any other capital improvement.
• 2 USC 622. Definitions
• (iii) contract authority, which means the making of funds available for
obligation but not for expenditure
26
CIP is funded with apportioned contract authority

Regulatory Framework
• OMB Circular A-11, Sec 20, p.5
– “Contract Authority is a type of budget authority that permits you to incur
obligations in advance of an appropriation, offsetting collections, or
receipts that enable you to make outlays to liquidate the obligations.”
NOTE: Contract authority is apportioned by OMB each fiscal year.
Unobligated amounts do not carry forward into the next fiscal year.
• DoD FMR Vol 2B, 091404
– “The CIP consists of the following four major categories of assets:
1) Automated Data Processing Equipment (ADPE);
2) Non-ADPE Equipment;
3) Software Development, whether internally or externally developed; and
4) Minor Construction.”
27
CIP categories align with Title 10

Depreciation
• Budgeted “depreciation”
– the amount factored into the standardized rate to recoup cash outlays
associated with the CIP and is described in DoD FMR Vol 2B Chapter 9.
– “Depreciation” is actually just a cost recovery method for use in rate
setting.
– Uses the straight-line method applied equally among accounting periods.
Amount is not decreased by residual (salvage) value.
• Accounting depreciation
– is described in DoD FMR Vol 4 Chapter 6.
– Differs from budgeted depreciation.
– Straight-line method uses residual value if it exceeds 10% of asset cost.
Alternatively, equipment can use the activity-based method of
depreciation.
28
Budgeted and Accounting Depreciation Differ
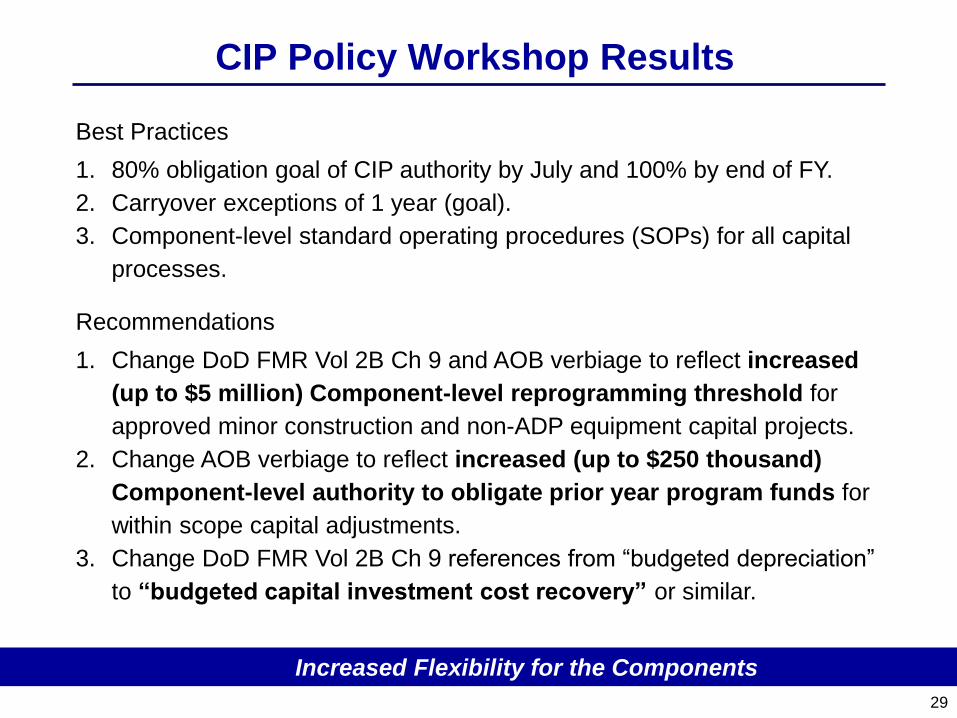
CIP Policy Workshop Results
29
Best Practices
1. 80% obligation goal of CIP authority by July and 100% by end of FY.
2. Carryover exceptions of 1 year (goal).
3. Component-level standard operating procedures (SOPs) for all capital
processes.
Recommendations
1. Change DoD FMR Vol 2B Ch 9 and AOB verbiage to reflect increased
(up to $5 million) Component-level reprogramming threshold for
approved minor construction and non-ADP equipment capital projects.
2. Change AOB verbiage to reflect increased (up to $250 thousand)
Component-level authority to obligate prior year program funds for
within scope capital adjustments.
3. Change DoD FMR Vol 2B Ch 9 references from “budgeted depreciation”
to “budgeted capital investment cost recovery” or similar.
Increased Flexibility for the Components

30
Agenda
I. Department-Wide Initiatives with WCF impacts
1. Inventory Baseline Values
2. OM&S Expense Recognition
3. Initial Spares
4. Progress Billing
5. Minor Equipment
II. Applied Initiatives and WCF Management Issues
1. Proprietary and Budgetary Accounting
2. Capital Investment Program
3. Transportation Financial Auditability
4. Fuel
5. Congressional Interest
6. OUSD(C) Reorganization
Goal: Present WCF initiatives in context of Departmental objectives

Transportation Financial Auditability (TFA)
• Continues to move toward enterprise solutions for efficient and
effective transportation financial reporting and processes
• Nearing completion of their efforts for a Proof of Delivery Solution and
a Department-wide MOA for Key Supporting Documents (KSDs)
• Moving forward to define a Department-wide system to manage the
storage and retrieval of KSDs
31

32
Agenda
I. Department-Wide Initiatives with WCF impacts
1. Inventory Baseline Values
2. OM&S Expense Recognition
3. Initial Spares
4. Progress Billing
5. Minor Equipment
II. Applied Initiatives and WCF Management Issues
1. Proprietary and Budgetary Accounting
2. Capital Investment Program
3. Transportation Financial Auditability
4. Fuel
5. Congressional Interest
6. OUSD(C) Reorganization
Goal: Present WCF initiatives in context of Departmental objectives

33
Fuel Humor

• Fuel Basics
• OMB and OSD set the projected fuel product cost.
• OSD sets the fuel price for customers. All customers pay the same
price per gallon.
• The DWCF finances fuel and attempts to stabilize customer prices
with available cash balances.
• DLA purchases fuel IAW industry standards
• Jet fuel is the most widely consumed fuel product (82%)
• DoD consumption ranks 5th in the US jet fuel petroleum market
• About the same as Southwest Airlines
• 88 million barrels (99m/bbl including non-DoD customers)
• Two parts to the fully burdened standard fuel price:
• Product – The cost of refined petroleum products
• Non-product – The costs for transportation, terminal operation, facility
sustainment restoration & maintenance, and operations
WCF Fuel Management
Currently re-evaluating FY 2016 fuel rates
34

• Can create execution year turbulence
• Bill or surplus ($1.4 billion bill in FY 2013 reprogramming,
$1.6 billion surplus in FY 2015 used for Departmental priorities)
• WCF goal is to preserve customer program but swings of such
magnitude exceed WCF’s ability to absorb the shock
• Leads to price changes
• Twice in FY 2005 through FY 2007, 5 times in FY 2009
• Reprogrammed in FY 2013 and FY 2014 to avoid price change
• The DWWCF is the Department’s hedge against turbulence
• Congress has a role
• FY 2016 OMNIBUS (P.L. 114-113) set an enacted rate of $114.38bbl
• Department further reduced to $78.96bbl (April 1st)
35
Market Volatility
Users accrue the $35.42/bbl savings (April 1 change)

36
Agenda
I. Department-Wide Initiatives with WCF impacts
1. Inventory Baseline Values
2. OM&S Expense Recognition
3. Initial Spares
4. Progress Billing
5. Minor Equipment
II. Applied Initiatives and WCF Management Issues
1. Proprietary and Budgetary Accounting
2. Capital Investment Program
3. Transportation Financial Auditability
4. Fuel
5. Congressional Interest
6. OUSD(C) Reorganization
Goal: Present WCF initiatives in context of Departmental objectives

• FY 2017
– National Defense Authorization Act (H.R.4909):
• Reduces the Department’s Operation and Maintenance accounts by
$1,454.5 million for fuel
– House Appropriations Committee – Defense:
• Reduces Title II appropriations $1,493 million for fuel costs
• Proposes reducing Army’s Operation and Maintenance account by $336
million for excess cash
• FY 2018
– New Administration after Inauguration Day
– Prepare budget by end of December
– Stand by for additional guidance from the Administration on
submitting the FY 2018 budget
Setting the Stage for FY 2017 – FY 2018
The Department does not intend to appeal FY 2017 House marks.37

38
Agenda
I. Department-Wide Initiatives with WCF impacts
1. Inventory Baseline Values
2. OM&S Expense Recognition
3. Initial Spares
4. Progress Billing
5. Minor Equipment
II. Applied Initiatives and WCF Management Issues
1. Proprietary and Budgetary Accounting
2. Capital Investment Program
3. Transportation Financial Auditability
4. Fuel
5. Congressional Interest
6. OUSD(C) Reorganization
Goal: Present WCF initiatives in context of Departmental objectives

39
Revolving Funds Team in the Operations Directorate
As of September 2015
SME: Rate
development
Accounts
DISA
DLA Disposition
Services
DLA Document
Services
Navy Base Support:
Naval Facilities
Engineering
Command (NAVFEC)
Navy Base Support:
Naval Facilities
Engineering and
Expeditionary
Warfare Center
(NAVFAC EXWC)
Organizations
DISA, NII, DLA, Navy
The Joint Staff
Backs up
Mark Notar
Jacqueline DePaulitte
703 571-9210
GS-15
Cynthia Jones
703 571-9212
GS-15
SME: Cash
management &
accounting
Accounts
Cash
PRMRF
BMF
DFAS
DLA Strategic
Materials
Organizations
WHS
DFAS
Army
Backs up
Jacque DePaulitte
SME: Funds
control & FIAR
Accounts
Army Industrial
Operations
Army Supply
AFRH
ANC
Organizations
Army
P&R
AT&L
LA
BAA
Backs up
JK McKay
Chris Heinbach
703 571-9198
GS-15
John Raisigel
703 571-9213
GS-15
SME: Fuel &
Supply
management
Accounts
DLA Supply
Chain Mgmt
DLA
Distribution
DLA Energy
Mgmt
Organizations
Navy
AT&L
DLA
Backs up
Cindy Jones
Mark Notar
703 697-3201
GS-15
SME: DoD FMR
& accounting
Accounts
Navy R&D
Navy Supply
USMC Supply
USMC Depots
Fleet Readiness
Centers
Organizations
Navy
USMC
P&R
Backs up
Chris Heinbach
SME: Depots &
Transportation
Accounts
TRANSCOM
USAF Supply
USAF Depot
Maint
Military Sealift
Command
DeCA
Organizations
TRANSCOM
Air Force
AT&L
P&R
Navy
Backs up
John Raisigel
JK McKay
703 571-9211
GS-15
Monique Dilworth703 697-2506
Director
SESTom Constable
703 697-2808
Associate Director
SES
Tom McClutchy703 697-3324
Associate Director
SES
Backups
40

DoD’s Place in the Petroleum Market
Non-Airline Consumption 16%
Other Airlines 11%
JetBlue Airways 3%United Parcel Service
3%
Federal Express Corporation 5%
Southwest Airlines Co. 8%
Delta Air Lines Inc. 15%
United Air Lines Inc. 14%
American Airlines Inc. 15%
DoD 10%
Total US Jet Fuel Consumption - FY2015
DoD91 mbbl
1.33%
All Other US Consumption 6,830.8 mbbl
Fuel Type Army Navy USMC USAF Total DoD
JAA 2.16 3.73 0.13 22.96 28.98
JP8 0.59 1.73 0.07 23.25 25.64
F76 0.22 10.89 0.00 0.00 11.11
JP5 0.04 8.28 0.02 0.74 9.09
Total 3.01 24.63 0.22 46.95 74.81
FY 2015 Principal Mil-Spec and Jet Fuel Sales (Barrels in Millions)
82% of the
total
consumption
41
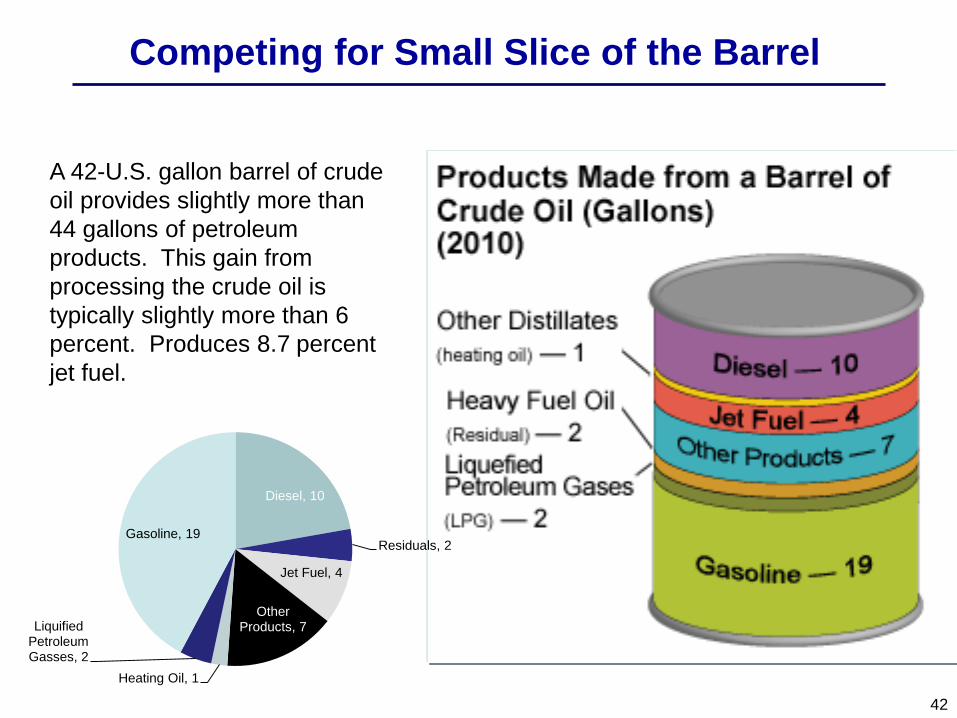
A 42-U.S. gallon barrel of crude
oil provides slightly more than
44 gallons of petroleum
products. This gain from
processing the crude oil is
typically slightly more than 6
percent. Produces 8.7 percent
jet fuel.
Competing for Small Slice of the Barrel
42
Diesel, 10
Residuals, 2
Jet Fuel, 4
Other Products, 7
Heating Oil, 1
Liquified Petroleum Gasses, 2
Gasoline, 19

FY 2016 Fuel Requirement
43
DLA Energy Sales99.3 million barrels
DoD (87.5 mbbls)
Non-DoD (11.8 mbbls)
Non-DoD Sales include ~ 5.2 mbbls of
sales to USTRANSCOM Commercial
Contract Carriers

7
W A RFIGHTER-FOCUSED, GL OB A L L Y RESPON SIVE, F ISCA L L Y RESPON SIB L E SUPPL Y CHA IN L EA DERSHIP
BULK BUSINESS MODEL
Refinery Intermediate Depot ConsumerInstallation-Level Depot
Aviation
Contract Facility ConsumerInstallation-Level DepotGround
Vessel
Refinery Intermediate
DepotFleet Logistics
Center
Point of SaleEnergy Supply Chain
Point of Sale
Point of SaleDLA Energy Pays
Market Price for
Product Purchases
Service Pays
Standard Price for
Product Received
DLA Capitalized
Fuel Inventory
Defense Working Capital Fund
Bulk Fuel Business Model
44
FY 2017 PB Price
per Barrel Breakout
Refined product $82.99
Transportation
$4.59
Terminals
$4.21
FSRM
$6.09
Operations
$6.41
Product Loss$0.87
Rounding
($0.16)
Total
$105.00
FY 2015 total sales of 101.8m/bbls with an average refined product cost, $91.51/bbl ($42.95/bbl Below budgeted )
FY 2016 Enacted Price
per Barrel Breakout
Refined product $92.88
Transportation
$4.43
Terminals
$4.23
FSRM
$5.15
Operations
$5.97
Product Loss$1.00
Rounding
$0.72
Total
$114.38
FY 2016 sales through April 55.8m/bbls with an average refined product cost, $63.94/bbl ($28.94./bbl Below enacted )
FY 2016 April 1 Price
per Barrel Breakout
Refined product $57.68
Transportation
$4.43
Terminals
$4.23
FSRM
$5.15
Operations
$5.97
Product Loss$1.00
Rounding
$0.50
Total
$78.96

Annual Average Fiscal Year 1996 – Present
• Crude oil should only be used for reference purposes. The Defense Logistics Agency buys refined petroleum products for
resale to the Department’s customers.
• The biggest challenge in developing the standard price is determining the mark up between crude oil and refined petroleum.
• The refining mark up from the spot price for West Texas Intermediate crude is not constant. The range has been between
22% (FY 2000) to 68% (First Half FY 2016).
• The proposed FY 2017 standard fuel price of $105.00bbl assumes a refined product price of $82.99bbl and non-product
costs of $22.01bbl.
• The FY 2017 refined product price of $82.99bbl is based on a crude oil price of $55.33bbl.
$23.91 $30.11
$25.42 $20.15
$27.37
$44.55
$30.78 $38.34
$45.88
$68.48
$86.33 $86.72
$137.36
$80.33
$101.60
$138.73
$152.80 $150.96
$140.94
$91.51 $64.66
$22.10 $20.70
$14.51
$19.25
$28.40
$28.81
$24.18
$30.26
$37.13
$53.65
$66.16
$64.70
$107.63
$57.44
$77.29
$92.91 $95.84 $95.47
$99.03
$56.64
$38.38
$0
$20
$40
$60
$80
$100
$120
$140
$160
Average Refined Product Cost Average WTI CrudeCost Per Barrel
$93.61
Standard Fuel Prices (non-product
cost Plus product cost estimate)
are not reflected in the chart.
45

Crude Market Drives Standard Price Changes
Monthly Average Fiscal Year 2005 – Present
5 PriceChanges
$25
$45
$65
$85
$105
$125
$145
$165
$185
Budget Execution Pricing for WTI Crude
WTI Crude
Budget Forecast for WTI Crude
Standard Price
Product Cost
Refined Product Forecast
Cost Per Barrel
FY 2009FY 2008
FY 2007FY 2006FY 2005
FY 2016
FY 2007
FY 2014FY 2013FY 2012FY 2011FY 2010 FY 2015
As of: 10 May 2016
4PriceChanges
$2.9 BRescission
$1.283 BCongressionalTransfer Out
$1.0 BASFF TransferIn
$1.394 BO&M TransferIn
$0.3475 BCongressionalTransfer Out
$1.622 BReprogramedOut
• No price change in FY 2013 and FY 2014.
• Except in FY 2011 & FY 2015 multiple price changes every year:
- FY 2005 through FY 2007 two upward prices changes per year - FY 2008 price changed 3 times, $170.94 to $97.02
- FY 2009 price changed 5 times, $170.94 to $89.46 - FY 2010 price changed 3 times, $116.76 to $98.28
- FY 2012 price changed 4 times, $165.90 to $97.02 - FY 2015 price changed February 1st to $136.92
• FY 2016 PB price budgeted at $144.06 per barrel
- October 1 price change to $123.90
- Section 8128 of the FY 2016 OMNIBUS appropriation (P.L. 114-113) reduced amounts appropriated in Title II, Operation and Maintenance, by $2,576 million to reflect savings duet to lower that budgeted fuel costs.
- February 1, 2016 price change to $109.62.
- Due to timing of the price changes required to implement the congressional intent, the calculated enacted composite standard price in FY 2016 is $114.38bbl consisting of $92.88 for refined product and $21.50 for non-product.
- April 1, 2016 price change to $78.96.
46

Comparison To Airlines
DLA Energy Acquisition Tool Airlines
One Year Contract Length Typically One Year
75 percent Min Lift Guarantee ~ 90 percent
Tied To Market Index Pricing Tied To Market Index
Primarily Producers (Refiners)
Military & Commercial SpecsSuppliers
Producers & Third Parties
Commercial Specs Only
Majority Origin – Intermediary
Storage and Distribution PointsDelivery
Destination (Pipeline) Direct to
Airport Point of Use
~2 percent of Overall DoD Budget
Percent of Total
Budget/Operating Costs
Financing Mechanism
~30-40 percent
DWCF Financing MeansVaries – Use of Financial
Instruments
Comparison to Commercial Practices
47June 21, 2016Draft Pre-Decisional

June 21, 2016
Bulk Fuels Purchase ProgramsStaggered Annual Programs
Always in the Market
Award
Contract
Issue
Solicitation
ATLANTIC EUROPE MED.Jul 14 – Jun 15F76, JP8, JP5, JA1
ROCKY MOUNT & W. COASTOct 14 – Sep 15F76, JAA, JP4, JP5, JP8
WESTERN PACIFICJan – Dec 15F76, JA1, JP5, JP8, RME
INLAND/E. & GULF COASTApr 15 – Mar 16F76, JAA, JP4, JP5, JP8
ATLANTIC EUROPE MED.Jul 15 – Jun 16F76, JP8, JP5, JA-1
Nov 15
Nov 14
Jun 15
Feb 15
Dec 14
May 15
Sept 15
Nov 15
Mar 16
May 16
Close Solicitation → Evaluate Offers → Conduct Negotiations → Evaluate Final Offers
Note: Procurement Process Changes Necessitate Need to Adjust from Historical Timeframes. Reset in Process.
48
2014 2015 2016
Draft Pre-Decisional