defects engineering in metal−organic frameworks: a new ... · spectrometer (icp-oes, horiba...
TRANSCRIPT

Electronic Supplementary Information For
Defects Engineering in Metal−Organic Frameworks: A new Strategy to
Develop Applicable Actnide Sorbents
Li-Yong Yuan, †
a Ming Tian,†
ab Jian-Hui Lan,
a Xing-Zhong Cao,
a Xiao-Lin Wang,
c Zhi-Fang Chai,
a,d
John K. Gibson,eWei-Qun Shi
a*
a Laboratory of Nuclear Energy Chemistry, Institute of High Energy Physics, Chinese Academy of
Sciences, Beijing 100049, China.
b School of Chemistry and Chemical Engineering, University of South China, Hengyang 421001,
China.
c Institute of Nuclear Physics and Chemistry, China Academy of Engineering Physics, Mianyang,
Sichuan 621900, China.
d School of Radiological&Interdisciplinary Sciences, Soochow University, Suzhou 215123, China.
e Chemical Sciences Division, Lawrence Berkeley National Laboratory (LBNL), Berkeley,
California 94720, United States.
† These two authors contributed equally to this work.
*Corresponding author: E-mail: [email protected];
Corresponding information:
Prof. Dr. Wei-Qun Shi
Tel:86-10-88233968; E-mail: [email protected];
Electronic Supplementary Material (ESI) for Chemical Communications.This journal is © The Royal Society of Chemistry 2017

SI-1 Preparation of the MOFs with tunable defects
Synthesis of near defect-free UiO-66: ZrCl4 (233 mg, 1.0 mmol), H2BDC (332 mg, 2.0 mmol), and
DMF (6 ml) were mixed in a Teflon liner at room temperature, then concentrated HCl (0.16 ml, 37%,
2.0 mmol) was added. The vessel was sealed, placed in an oven and heated to 220℃ and held for 20
h. After cooling to room temperature, the resulting white product was filtered off, washed with DMF
to remove unreacted reagents, then washed again with acetone five times and dried under vacuum at
150 oC.
UiO-66 synthesis with modulator: ZrCl4 (233 mg,1 mmol), terephthalic acid (H2BDC, 166 mg, 1
mmol), and different equivalents of benzoic acid (HBC 5,10, 15, 20 mmol, respectively) with respect
to H2BDC were ultrasonically dissolved in 18 mL of DMF in a Pyrex vial. The synthesis mixture
was transferred to a preheated oven at 120℃ for 48 h. After cooling down to room temperature, the
products were isolated by centrifugation, washed with DMF and acetone five times, and dried at
80℃for 12 h. To extract the benzoic acid entrapped in the UiO-66, the as-synthesized samples were
dispersed in 20 mL DMF with 0.4 mL concentrated HCl added at 90 oC for 12 h. The samples were
then washed with DMF three times, and subsequently washed with acetone repeatedly to displace
the trapped DMF. Finally, the obtained particles were dried at 150 oC in vacuo for 24 h. The samples
were denoted as UiO-66-5D, UiO-66-10D, UiO-66-15D, and UiO-66-20D, respectively. (5, 10, 15,
20 are the molar equivalents of modulator with respect to H2BDC in the initial synthesis mixture; D
designates defects).
SI-2 Analytical techniques
The morphologies and microstructures of the samples were characterized with a field emission
scanning electron microscopy (SEM, HITACHI S-4800). Powder X-ray diffraction (PXRD) patterns
were obtained on a Bruker D8-Advance X-ray Diffractometer with a Cu Kα radiation.
Thermogravimetric curves were recorded on a thermal gravimetric analyzer (TGA, TA Instruments,
Q500) from 20-900 oC with a heating rate of 10
oC min
-1 under an air flow. The N2 sorption
experiments were measured on a micromeritics ASAP 2020 HD88 instrument at liquid nitrogen
temperature (-196 oC). The samples were degassed under vacuum at 120
oC before measurements.
The specific surface area was calculated by the Brunauer–Emmett–Teller (BET) method. The pore
size distributions were derived using the nonlocal density functional theory model. The total pore
volume was evaluated by the single point method. Inductively coupled plasma optical emission

spectrometer (ICP-OES, Horiba JY2000-2) was used to determine the residual concentration of
U(VI) in supernatants in all the sorption experiments.
Table S1 The BET surface areas and pore volumes of UiO-66-DF and the defected UiO-66
Sample Synthesis
condition
BET surface area
(m2/g)
Total pore volumea
(cm3/g)
UiO-66-DF 220 oC, 20 h, no BC 790 0.42
UiO-66-5D 120 oC, 48 h, 5 eq BC 993 0.47
UiO-66-10D 120 oC, 48 h, 10 eq BC 1214 0.65
UiO-66-15D 120 oC, 48 h, 15 eq BC 1543 0.75
UiO-66-20D 120 oC, 48 h, 20 eq BC 1730 0.84
a Single point adsorption total pore volume of pores at P/Po = 0.975
1.0 1.5 2.0 2.5
UiO-66-DF
UiO-66-5D
UiO-66-10D
UiO-66-15D
UiO-66-20D
Inte
ns
ity
Pore Width (nm)
Fig. S1 pore size distributions of UiO-66-DF and the defected UiO-66s.
The positron annihilation lifetime spectroscopy (PALS) measurements were at room
temperature using a standard fast-slow coincidence system with a time resolution of about 210 ps
full width at half maximum (FWHM). The positron source (22Na, 16 μCi) was carrier free NaCl
deposited between two 7 μm thick Kapton foils, and then sandwiched in two stacks of essentially
identical pieces of sample (with a diameter of 1 cm and a thickness of 1.5 mm) ensuring that all
positrons annihilate within the sample. All the positron lifetime spectra were recorded with total
counts of ~2×10⁶. A standard nickel sample was used to calculate the fraction of positrons
annihilating within the source and kapton foils. Correction for source components was performed in
the analysis of positron lifetime spectra of the samples. The routine LT-9 was used for analysis of
the positron lifetime spectra, taking into account the annihilation in the source; all of the collected
spectra were analyzed by three exponential components.

Table S2 the fitting results obtained from PALS
TGA results for the prepared UiO-66s provided quantitative information about missing-linker
defects. For perfect UiO-66, i.e. UiO-66-DF, an inner Zr6O4(OH)4 core connects to 12 linkers, i.e.
1,4-benzene- dicarboxylate (BDC), while one linker bridges two metal cores, thus forming a
structural unit of Zr6O4(OH)4(CO2)12 or Zr6O4(OH)4(BDC)6. Accordingly, each unit in perfect
UiO-66 includes 6 linkers. Upon heat treatment, the dehydroxylation of the Zr6O4(OH)4 cluster starts
at ca. 250 °C and ends at ca. 400 °C,1 resulting in a Zr6O6 inner cluster (Zr6O6(BDC)6). Complete
collapse of the framework occurs at ca. 450 °C, forming the only solid product of ZrO2. Since the
molecular weight of Zr6O6(BDC)6 is a factor of 2.2 higher than that of ZrO2, the plateau in the
temperature range of 400-450 °C for the solvent free material should ideally reach 220% when
normalized to the final end weight as 100%. For the defected UiO-66s, however, the plateau is
clearly below the expected value (highlighted by a horizontal dashed line in Fig. 1(d)), implying that
the framework is less dense than that for nearly-undefected UiO-66. This is in accord with the
absence of some linkers in the frameworks of defected UiO-66s.
SI-3 U(VI) sorption experiments
In a typical experiment, 4 mg of sorbent was added to either 10 mL of U(VI) solution in a flask (the
solid-liquid ratio was 0.4 g/L). The control experiments were performed simultaneously using the
identical U(VI) solution in the absence of the sorbent. After stirring for the desired time, the solid
phase was separated from the aqueous solution using a 0.22 μm nylon membrane filter, and then the
concentration of U(VI) in the aqueous phase was determined by ICP-OES (the detection limit is
below 0.01 ppm). Before the ICP-OES measurement, the supernatant was diluted 25~100 times to
ensure that the concentration of U(VI) in the analyzed solution was 1~5 μg/mL. The sorption
capacity (q) of U(VI) were defined as q=(C0-Ce)×Vsolution/msorbent, where C0 and Ce represent the
concentrations of metal ions in the aqueous phase for the control experiment and the sorption
experiment after 2 h stirring, respectively; msorbent and Vsolution designate the weight of the sorbent
and the solution volume used in the sorption experiment, respectively. All values were measured in
duplicate with the uncertainty within 5%.
Sample τ3(ns) error(ns) I3(%) error(ns) R factor
UiO-66-20D 4.357 0.058 5.78 0.110 1.0649
UiO-66-DF 3.359 0.029 7.433 0.094 1.0967

SI-4. The sorption data fitted by isotherm models
The Langmuir model assumes that the sorption of metal ions occurs on a homogenous surface by
monolayer sorption and there no interaction between adsorbed ions, with homogeneous binding sites
and equivalent sorption energies. The linear equation of the Langmuir isotherm model is expressed
as follows:
c c1 e e
e m L mq q k q (S1)
where qm is the maximum sorption capacity corresponding to complete monolayer coverage (mg/g)
and kL is a constant indirectly related to sorption capacity and energy of sorption (L/mg), which
characterizes the affinity of the adsorbate and adsorbent. A linear plot was obtained when ce/qe was
plotted against ce; qm and kL were derived from the slope and intercept.
The Freundlich equation is an empirical equation based on sorption on a heterogeneous surface.
The isotherm assumes that adsorbent surface sites have a spectrum of different binding energies. The
linear equation can be expressed by:
1ln ln ln c e F eq k
n (S2)
where kF and n are the Freundlich constants related to the sorption capacity and the sorption intensity,
respectively. A linear relationship was obtained by plotting lnqe against lnce, and the values of kF and
n were calculated from the slope and intercept of the straight line.
0 100 200 300 400
0
2
4
6
8
10Langmuir Model
Ce
/Qe
Ce(mg/L)
UiO-66-DF
UiO-66-5D
UiO-66-10D
UiO-66-15D
UiO-66-20D
0 1 2 3 4 5 6
2
3
4
5
6
lnQ
e
lnCe
UiO-66-20D
UiO-66-15D
UiO-66-10D
UiO-66-5D
UiO-66-DF
Fig. S2 Langmuir isotherm (left) and Freundlich isotherm (right) linearized plots for U(VI) sorption
on UiO-66-DF and the defected UiO-66s
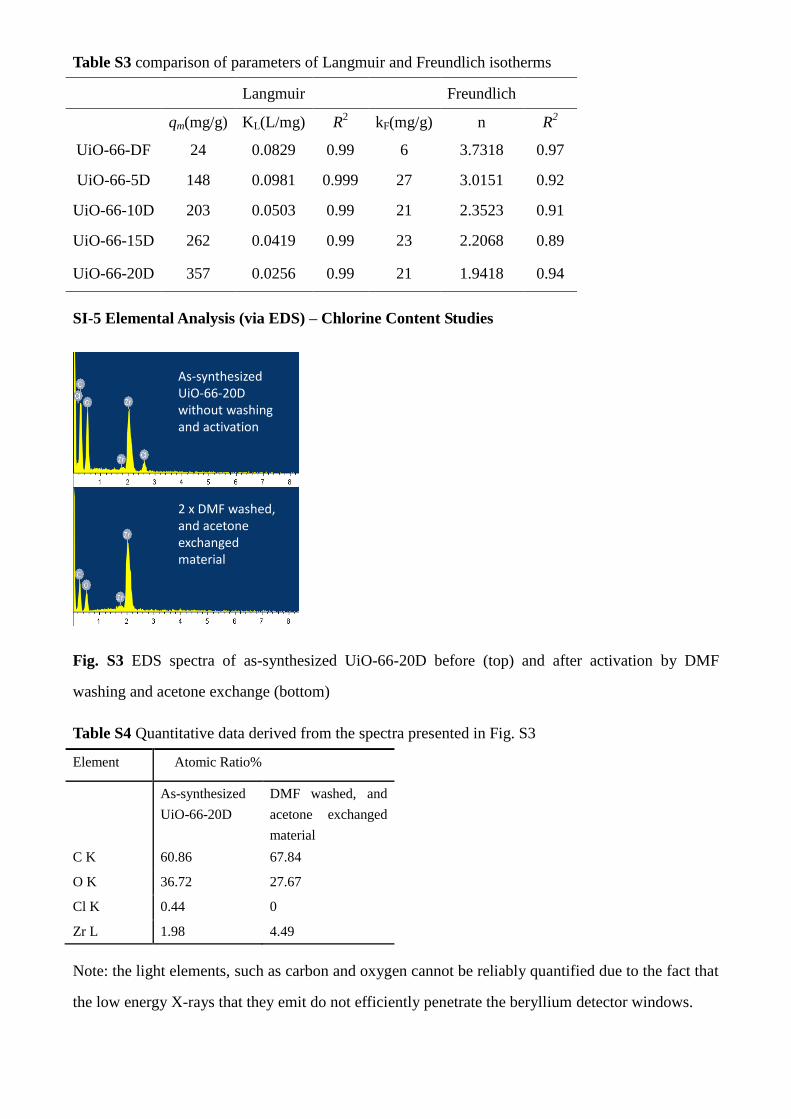
Table S3 comparison of parameters of Langmuir and Freundlich isotherms
Langmuir Freundlich
qm(mg/g) KL(L/mg) R2 kF(mg/g) n R
2
UiO-66-DF 24 0.0829 0.99 6 3.7318 0.97
UiO-66-5D 148 0.0981 0.999 27 3.0151 0.92
UiO-66-10D 203 0.0503 0.99 21 2.3523 0.91
UiO-66-15D 262 0.0419 0.99 23 2.2068 0.89
UiO-66-20D 357 0.0256 0.99 21 1.9418 0.94
SI-5 Elemental Analysis (via EDS) – Chlorine Content Studies
As-synthesized UiO-66-20D without washing and activation
2 x DMF washed, and acetone exchanged material
Fig. S3 EDS spectra of as-synthesized UiO-66-20D before (top) and after activation by DMF
washing and acetone exchange (bottom)
Table S4 Quantitative data derived from the spectra presented in Fig. S3
Element Atomic Ratio%
As-synthesized
UiO-66-20D
DMF washed, and
acetone exchanged
material
C K 60.86 67.84
O K 36.72 27.67
Cl K 0.44 0
Zr L 1.98 4.49
Note: the light elements, such as carbon and oxygen cannot be reliably quantified due to the fact that
the low energy X-rays that they emit do not efficiently penetrate the beryllium detector windows.

SI-6 Comparison of U(VI) uptake in UiO-66-20D and reported MOFs
Table S5 A summary of U(VI) uptake by MOFs
MOFs Experimental pH U(VI) uptake
(mg g-1
)
Ref.
UiO-66-NH2 5.5 ± 0.1 115 2
MIL-101-NH2 5.5 ± 0.1 90 3
MIL-101-ED 5.5 ± 0.1 200 3
MIL-101-DETA 5.5 ± 0.1 350 3
MOF-76(Y) 3.0 ± 0.1 300 4
UiO-68-P(O)(OEt)2 2.5 217 5
Zn-MOF-74 4.0 360 6
Zn(HBTC)(L)·(H2O)2 2.0 115 7
UiO-66-20D 5.0 ± 0.1 350 This work
SI-7 Reusablity and selectivity test
Considering that little U(VI) sorption occurred in all the MOF sorbents at lower pH as denoted in
Fig. 2a, regeneration of the MOF was performed by eluting the sorbed U(VI) using an acid solution,
and the results were given in Table S6. It was found that a complete U(VI) leaching (> 99%) for
UiO-66-20D can be easily achieved using a 0.2 mol/L HNO3 solution, suggesting an apparent
reversability of the U(VI) sorption into the defective UiO-66. Moreover, the comparison of PXRD
patterns shows no discernable changes (Fig. 2d), implying that the MOF sorbents remain stable even
after acidic desorption of U(VI).
Table S6. Regeneration and reusability of UiO-66-20D following U(VI) sorption
Desorption bReusability (mg/g)
aHNO3(mol/L) 0.2 0.1 0.05
Fresh Reclaimed
Efficiency(%) 99.9 90.2 86.3 191 172 a Concentration of HNO3 in the eluent;
b m/V=0.4 mg/mL, [U]initial=100 mg/L, pH=5.00.05, t=4h.
To test selectivity of the present MOFs toward U(VI), the U(VI) sorption by UiO-66-DF and
UiO-66-20D from an aqueous solution containing 0. 5 mmol/L Zn2+
, Cr3+
, Pb2+
, Ni2+
, Co2+
, Yb3+
,
and Sr2+
was performed at pH 5.0, and the results were shown in Fig. S4. It was found that the

defective UiO-66 exhibit superior U(VI) sorption over all the test competing metal ions, whereas for
UiO-66-DF, the sorption of all the test metal ions including U(VI) kept in a low level. This result
clearly indicates desirable selectivity of the defective UiO-66 towards U(VI).
Zn Cr Pb Ni Co Yb Sr U0
50
100
150
200
250
Qe
(mg
/g)
Metal ions
UiO-66-DF
UiO-66-20D
Fig. S4 competitive sorption of U(VI) by UiO-66-DF and UiO-66-20D from a solution containing
competing metal ions. The concentration of all metal ions was 0.5 mmol/L. m/V=0.4 mg/mL,
pH=5.00.05, t=4h.
SI-8 Molecular dynamics simulations
The migration of a uranyl ion in both perfect and defective frameworks of UiO-66 was modeled
using classical molecular dynamic simulations implemented in the Lammps package. During all the
simulations, the host material was modeled by a cubic 2×2×2 supercell with the lattice parameter of
41.493 Å. The measured pore volume is 0.47 cm3/g
8, and correspondingly 1325 water molecules
were inserted into the pores of the supercell to achieve water density at room temperature. Periodic
boundary conditions were applied in all the three directions. The van der Waals interaction of
framework atoms was described by the Lennard-Jones potential with the parameters taken from the
Universal force field (UFF)9. The atomic charges for the perfect structure were derived from the
work of Yang et al,8 and those for the defective one were calculated at the PBE/6-31+g* level of
theory (Fig. S3). The potential parameters developed by Pomogaev et al.10
were used for the uranyl
ion, along with the Simple Point Charge (SPC/E) water model11
for the solvent water. The geometry
of the water molecule was fixed using the SHAKE algorithm.12
The geometric mixing rule was
adopted to produce the interaction force field parameters between different species. The particle
mesh-Ewald (PME) method was used for long range electrostatic interactions. The host material was
kept rigid during simulations.
To estimate the migration path of uranyl in UiO-66, numerous free energy simulations were

performed as displayed in Fig. 3 and Fig. S5,S6. For the perfect structure, we considered the
following migration path: moving the uranyl ion through one window connecting an octahedral cage
and one of its neighboring tetrahedral cages along the [111] direction (Fig. 3b, Fig. S5, S6). The
above window consists of three linkers. Here, we have employed the umbrella sampling approach13
,
in which the reaction coordinate to describe the migration event of uranyl was chosen. In this case,
the distance of uranium relative to the center of the octahedral cage was chosen as the reaction
coordinate. The interval of distance is set to be 0.3 Å, which was validated by plotting the histogram
from individual trajectory of uranium along the reaction coordinate displayed in Figure S7. At all
stages of the migration path, the system is in thermodynamic equilibrium. The distance of uranium
relative to the center is harmonically restrained to 0.3 Å to allow the whole adsorption system to
sample all possible configurations in the phase space. To do this, a spring force was applied to the
uranium atom with the form,
2
0
1( ) ( )
2V k (S3)
where 0 is the target reaction coordinate distance in Å and k is the force constant in kcal mol-1
Å-2
.
The value of k is set to be 100 kcal mol-1
Å-2
. With the collected biased probability, we can then
evaluated the unbiased probability of finding the system at , ( ) , using the weighted histogram
analysis method (WHAM)14
. The free energy (or the potential of mean force, PMF), ( )W , is then
given by the following equation.
( ) l n ( ( ) )W R T p (S4)
O A
C
O A
C
Fig. S5. Illustration of uranyl migration in perfect structure of UiO-66. Blue sphere and gray sphere
denote the starting point and end point of the migration, respectively.

O A
C
O A
C
Fig. S6. Illustration of uranyl migration in defective UiO-66. Blue sphere and gray sphere denote the
starting point and end point of the migration, respectively. The white X denotes where the aromatic
linker is broken in the defective framework.
Fig. S7. Histograms from individual trajectory of uranium. The x-axis represents the distance of
uranium relative to the origin of the simulation box along the [111] direction. And the starting point
(0.25, 0.25, 0.25) corresponds to a distance of 18.17 A

HD OD
atomtype charge
HD 0.351
OD -0.615
Fig. S8 Models for atomic partial charge (e) calculation. HD and OD are the two new atom types we
added to describe the newly formed hydroxyl groups bonded to Zr atoms in the defective UiO-66.
Hydrogen, oxygen, carbon, Zr and U are colored in white, red, cyan, pink and blue, respectively.
In this section, we firstly probed the equilibration adsorption state of uranyl ion, [UO2(H2O)5]2+
,
by locating the ion at the center of the octahedral cage (as shown in yellow sphere in Fig. 3(a)). After
an initial steepest descent energy minimization, 1 ns of canonical ensemble (NVT) simulations at
298.15 K were performed with a time step of 1 fs. Based on the predicted radial distribution function
(RDF) (Fig. S9), we find that the uranyl ion at the equilibrium state is trapped around the center
rather than migrating outside the cage. Within this cage, the uranyl ion is equatorially
penta-coordinated to oxygen atoms of water in the first coordination sphere. The two sharp peaks at
about 1.76 and 2.45 Å in Fig. S4 correspond to the predicted average U=O and U-O(H2) bond
lengths, which agree very well with experiments (1.7615
and 2.4216
Å, respectively).

1 2 3 4 5 60
5
10
15
20
25
g(r
)
r (Å)
1 2 3 4 5 60
10
20
N(r
)
r(Å)
Fig. S9 The RDF and number integral (inset) of An=O and An-O(H2) for UO22+
in UiO-66, derived
from the trajectory information of our MD simulation in NVT ensemble with the initial position of
uranyl at the center of the octahedral cage.
REFERENCES
1. J. H. Cavka, S. Jakobsen, U. Olsbye, N. Guillou, C. Lamberti, S. Bordiga and K. P. Lillerud, J. Am. Chem. Soc., 2008,
130, 13850-13851.
2. B. C. Luo, L. Y. Yuan, Z. F. Chai, W. Q. Shi and Q. Tang, J. Radioanal. Nucl. Chem., 2016, 307, 269-276.
3. Z. Q. Bai, L. Y. Yuan, L. Zhu, Z. R. Liu, S. Q. Chu, L. R. Zheng, J. Zhang, Z. F. Chai and W. Q. Shi, J. Mater. Chem. A,
2015, 3, 525-534.
4. W. T. Yang, Z. Q. Bai, W. Q. Shi, L. Y. Yuan, T. Tian, Z. F. Chai, H. Wang and Z. M. Sun, Chem. Commun., 2013, 49,
10415-10417.
5. M. Carboni, C. W. Abney, S. B. Liu and W. B. Lin, Chem. Sci., 2013, 4, 2396-2402.
6. L. Zhang, L. L. Wang, L. L. Gong, X. F. Feng, M. B. Luo and F. Luo, J. Hazard. Mater., 2016, 311, 30-36.
7. L. L. Wang, F. Luo, L. L. Dang, J. Q. Li, X. L. Wu, S. J. Liu and M. B. Luo, J. Mater. Chem. A, 2015, 3, 13724-13730.
8. Q. Yang, V. Guillerm, F. Ragon, A. D. Wiersum, P. L. Llewellyn, C. Zhong, T. Devic, C. Serre and G. Maurin, Chem.
Commun., 2012, 48, 9831-9833.
9. A. K. Rappe, C. J. Casewit, K. S. Colwell, W. A. G. Iii and W. M. Skiff, J. Am. Chem. Soc., 1992, 114, 10024-10035.
10. V. Pomogaev, S. P. Tiwari, N. Rai, G. S. Goff, W. Runde, W. F. Schneider and E. J. Maginn, Phys.Chem. Chem.
Phys., 2013, 15, 15954-15963.
11. H. J. C. Berendsen, J. R. Grigera and T. P. Straatsma, J. Phys. Chem., 1987, 91, 6269-6271.
12. J. P. Ryckaert, G. Ciccotti and H. J. C. Berendsen, J. Comput. Phys., 1977, 23, 327-341.
13. S. Kumar, J. M. Rosenberg, D. Bouzida, R. H. Swendsen and P. A. Kollman, J. Comput. Chem., 1992, 13,
1011-1021.
14. B. Roux, Comput. Phys. Commun., 1995, 91, 275-282.
15. P. G. Allen, J. J. Bucher, D. K. Shuh, N. M. Edelstein and T. Reich, Inorg. Chem., 1997, 36, 4676-4683.
16. H. A. Thompson, G. E. Brown and G. A. Parks, Am. Mineral., 1997, 82, 483-496.