defect detection in friction stir welding by online...
TRANSCRIPT

Defect Detection in Friction Stir Welding
by Online Infrared Thermography
I.Kryukov, M.Hartmann, S.Böhm, M.Mund, K.Dilger and F.Fischer
Journal of Welding and Joining(Vol. 32, No. 5)
2014. 10

This is an Open-Access article distributed under the terms of the Creative Commons Attribution Non-Commercial License(http://creativecommons.org/licenses/by-nc/3.0) which permits unrestricted non-commercial use, distribution, and reproduction in any medium, provided the original work is properly cited.
Journal of Welding and Joining, Vol.32 No.5(2014) pp50-57
http://dx.doi.org/10.5781/JWJ.2014.32.5.50
50
Defect Detection in Friction Stir Welding
by Online Infrared Thermography
Igor Kryukov*,†, Michael Hartmann*, Stefan Böhm*, Malte Mund**, Klaus Dilger** and Fabian Fischer**
*Department for Cutting and Joining (tff), University of Kassel, 34125 Kassel, Germany**Institute of Joining and Welding (ifs), University of Braunschweig, 38106 Braunschweig, Germany
†Corresponding author : [email protected](Received July 12, 2014 ; Accepted July 23, 2014)
Abstract Friction Stir Welding (FSW) is a complex process with several mutually interdependent parameters. A slight difference from known settings may lead to imperfections in the stirred zone. These inhomogeneities affect on the mechanical properties of the FSWed joints. In order to prevent the failure of the welded jointit is necessary to detect the most critical defects non-destructive. Especially critical defects are wormhole and lack of penetration (LOP), because of the difficulty of detection. Online thermography is used process-accompanying for defect detecting. A thermographic camera with a fixed position relating to the welding tool measures the heating-up and the cool down of the welding process. Lap joints with sound weld seam surfaces are manufactured and monitored. Different methods of evaluation of heat distribution and intensity profiles are introduced. It can be demonstrated, that it is possible to detect wormhole and lack of penetration as well as surface defects by analyzing the welding and the cooling process of friction stir welding by passive online thermography measurement. Effects of these defects on mechanical properties are shown by tensile testing.
Key Words : Friction Stir Welding (FSW), Non-destructive testing (NDT), infrared thermography, online processmonitoring, defect detection, quality of joint
ISSN 1225-6153
Online ISSN 2287-8955
1. Introduction
The friction stir welding (FSW) is an innovative
pressure welding process which was developed
in 1991 at the TWI (The Welding Institute,
England). A rotating tool is moved through the
workpieces and heats these by friction to shortly
below the melting point. Afterwards, the materials,
that are to be joined, are stirred, resulting in a
metallic connection. An important advantage of
the FSW is that no auxiliaries or additive
materials are necessary for this process. Fur-
thermore, the preferential use of low melting
metals like aluminium and magnesium creates a
strong interest in the FSW for applications in
the light weight construction.
The FSW is a process with a lot of interacting
parameters which are divided in tool and
process parameters. Variations of known setting
can lead to diverse irregularities in the weld
seam1). These anomalies reduce the bending
and breaking strength of the friction stir
welded joint. To avoid the failure of weld joints
and to secure a consistent weld quality, it is
necessary to detect critical defects non-destructive.
An adequate non-destructive testing should
offer a quick availability of test results as well
as the possibility to perform a 100% inspection
of the welds.
For the FSW, the infrared thermography
serves as an instrument for the online non-
Research Paper
Defect Detection in Friction Stir Welding by Online Infrared Thermography
大韓熔接․接合學 誌 第32卷 第5號, 2014年 10月 481
51
Direction of welding
rφ
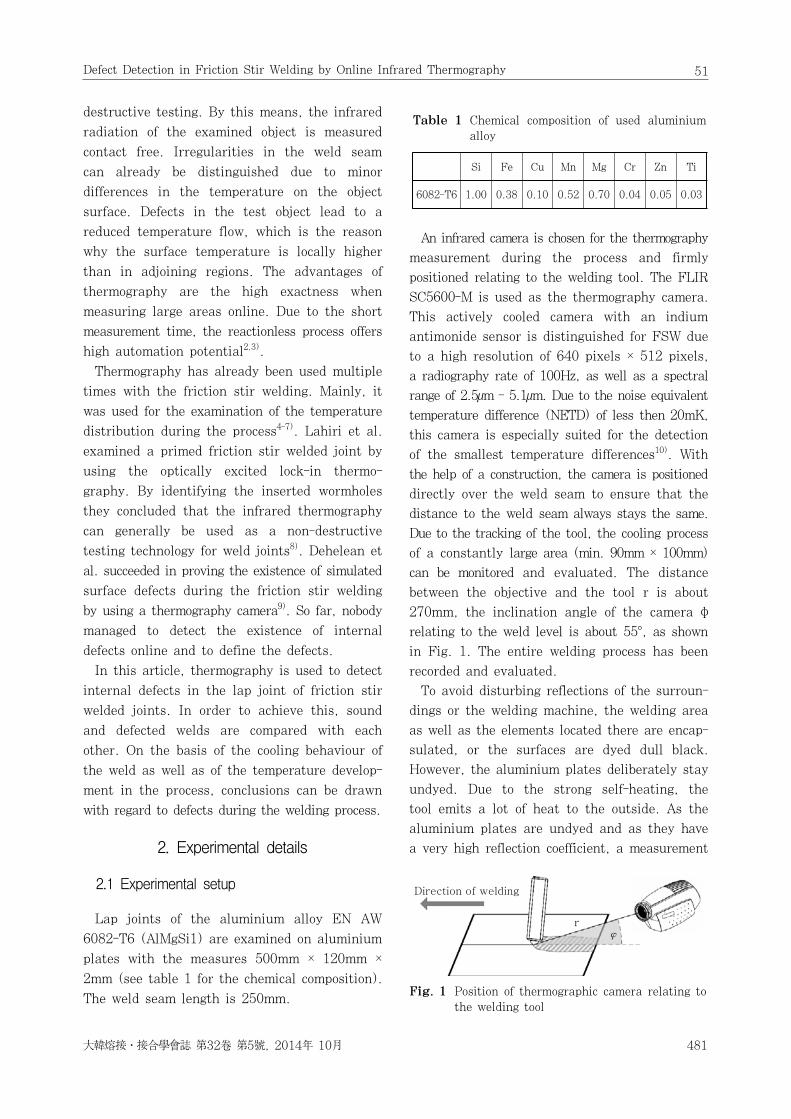
Fig. 1 Position of thermographic camera relating to
the welding tool
Si Fe Cu Mn Mg Cr Zn Ti
6082-T6 1.00 0.38 0.10 0.52 0.70 0.04 0.05 0.03
Table 1 Chemical composition of used aluminium
alloy
destructive testing. By this means, the infrared
radiation of the examined object is measured
contact free. Irregularities in the weld seam
can already be distinguished due to minor
differences in the temperature on the object
surface. Defects in the test object lead to a
reduced temperature flow, which is the reason
why the surface temperature is locally higher
than in adjoining regions. The advantages of
thermography are the high exactness when
measuring large areas online. Due to the short
measurement time, the reactionless process offers
high automation potential2,3).
Thermography has already been used multiple
times with the friction stir welding. Mainly, it
was used for the examination of the temperature
distribution during the process4-7). Lahiri et al.
examined a primed friction stir welded joint by
using the optically excited lock-in thermo-
graphy. By identifying the inserted wormholes
they concluded that the infrared thermography
can generally be used as a non-destructive
testing technology for weld joints8). Dehelean et
al. succeeded in proving the existence of simulated
surface defects during the friction stir welding
by using a thermography camera9). So far, nobody
managed to detect the existence of internal
defects online and to define the defects.
In this article, thermography is used to detect
internal defects in the lap joint of friction stir
welded joints. In order to achieve this, sound
and defected welds are compared with each
other. On the basis of the cooling behaviour of
the weld as well as of the temperature develop-
ment in the process, conclusions can be drawn
with regard to defects during the welding process.
2. Experimental details
2.1 Experimental setup
Lap joints of the aluminium alloy EN AW
6082-T6 (AlMgSi1) are examined on aluminium
plates with the measures 500mm × 120mm ×
2mm (see table 1 for the chemical composition).
The weld seam length is 250mm.
An infrared camera is chosen for the thermography
measurement during the process and firmly
positioned relating to the welding tool. The FLIR
SC5600-M is used as the thermography camera.
This actively cooled camera with an indium
antimonide sensor is distinguished for FSW due
to a high resolution of 640 pixels × 512 pixels,
a radiography rate of 100Hz, as well as a spectral
range of 2.5µm - 5.1µm. Due to the noise equivalent
temperature difference (NETD) of less then 20mK,
this camera is especially suited for the detection
of the smallest temperature differences10). With
the help of a construction, the camera is positioned
directly over the weld seam to ensure that the
distance to the weld seam always stays the same.
Due to the tracking of the tool, the cooling process
of a constantly large area (min. 90mm × 100mm)
can be monitored and evaluated. The distance
between the objective and the tool r is about
270mm, the inclination angle of the camera φ
relating to the weld level is about 55°, as shown
in Fig. 1. The entire welding process has been
recorded and evaluated.
To avoid disturbing reflections of the surroun-
dings or the welding machine, the welding area
as well as the elements located there are encap-
sulated, or the surfaces are dyed dull black.
However, the aluminium plates deliberately stay
undyed. Due to the strong self-heating, the
tool emits a lot of heat to the outside. As the
aluminium plates are undyed and as they have
a very high reflection coefficient, a measurement

I.Kryukov, M.Hartmann, S.Böhm, M.Mund, K.Dilger and F.Fischer
482 Journal of Welding and Joining, Vol. 32, No. 5, 2014
52
feed rate [mm/min] rotation speed [min-1] tilt angle [°] plunge depth [mm] pin length [mm]
sound weld 800 -1000 2 2.68 2.3
wormhole defect 1000 +800 2 2.68 2.3
lack of penetration v1 800 -1000 2 2.30 2.0
lack of penetration v2 800 -1000 2 2.23 2.0
Table 2 Welding parameters
of the area directly surrounding the tool is
strongly distorted. In order to keep this area
out of the measurement, the tool including the
tool holding device was encased with a thin
walled, dull black hollow cylinder which almost
reaches the aluminium plates. It can absorb
most of the radiation. Thus, the heat radiating
from the tool is mostly isolated from the measure-
ment. Only a small part of residual radiation
can be seen on the edge of the hollow cylinder.
2.2 Imperfections in FSW
Significant irregularities in the friction stir
welding are defined by the AWS D17.3/D17.3M:
201011) as well as DIN EN ISO 25239-512).
Among the most crucial defects are internal defects,
like wormholes and the lack of penetration
(LOP), which cannot be detected by a simple
visual inspection. These defects influence the
static and dynamic strength of the weld seam.
Other than the thermography, no testing method
can detect these defects online.
A wormhole (also referred as cavities or voids)
results from insufficient material flow during
the process. Due to low rotational speeds and
high feed rates, not enough heat is inserted in
the weld seam. In case of such a cold weld, a
tunnel is generated on the advancing side
which is continuing along the weld.
A “lack of penetration” (LOP) is the conse-
quence of an inadequate mixture of the work-
pieces at the root of the weld. The reason for
this is the insufficient plunge depth of the pin
into the material. While this defect can be
detected in case of a butt joint by inspecting of
the reverse side, it is not possible to identify
this type of defect in case of a lap joint.
By varying the weld parameters, both sound
welds and welds with wormholes as well as
“lack of penetrations” have been generated. Two
different parameters have been chosen for the
“lack of penetration”, variant 1 with barely a
penetration and variant 2 where the workpieces
are not connected to each other. The used weld
parameters are shown in table 2. The used
tools have a concave shoulder with a diameter
of 10mm and a cylindrical pin with a diameter
of 4mm. The tools are adjusted to a counter-
clockwise rotation (negative rotation speed, see
table 2) and have a thread support to improve
the material flow.
With regard to the wormholes, the rotating
direction has been changed from counter-clockwise
to clockwise (positive rotation speed, see table
2). Furthermore, the rotation speed has been
reduced and the feed rate increased. To generate
the “lack of penetration”, a tool with a shortened
pin has been used. Additionally, the plunge depth
has been reduced. With these parameters, it
has been ensured that the welds seem to be
sound on the outside despite the inserted defects.
Fig. 2 shows the produced welds a) sound
weld, b) weld with wormhole, c) “lack of penetra-
tion” variation 1, connection still existing, d) “lack
of penetration” variation 2, without connection
between the workpieces.
3. Results and discussion
3.1 Evaluation of online measurement
Sound welds as well as weld specimens with
the mentioned defects have been successfully
produced. Related to the process, thermographic
measurements have been made throughout the

Defect Detection in Friction Stir Welding by Online Infrared Thermography
大韓熔接․接合學 誌 第32卷 第5號, 2014年 10月 483
53
(a)
(c)
(b)
(d)
Fig. 2 Surface of welded joints: (a) sound weld, (b) weld containing wormhole defect, (c) lack of penetration
defect v1 (with connection between workpieces), (d) lack of penetration defect v2 (without connection
between workpieces)
(a) (b)
(c) (d)
Fig. 3 Thermographic exposure in the welding process: (a) sound weld, (b) weld containing wormhole
defect, (c) lack of penetration defect v1 (with connection between workpieces), (d) lack of penetration
defect v2 (without connection between workpieces)
whole process. Infrared images of the single
weld tests are presented in Fig. 3. In the centre,
the imbricated weld can be seen which proceeds
from the bottom to the top. Above it, the men-
tioned hollow cylinder can be seen which does
not radiate or reflect heat. On the left of the
weld, the edge of the plate is distinctly visible.
The defective heat conduction leads to a heating
of the plate edge, while the aluminium plate
lying below is considerably less influenced by
the heat. The single, round heat sources, as well
as the heat sources along the weld are flashes,
which were generated during the process. Flashing
and other surface defects are a major problem
for the thermography. As these defects have a
higher heat radiation than the weld seam, the

I.Kryukov, M.Hartmann, S.Böhm, M.Mund, K.Dilger and F.Fischer
484 Journal of Welding and Joining, Vol. 32, No. 5, 2014
54
8000
9000
10000
11000
12000
13000
14000
0, 2
2, 7
5, 3
8, 0
10
, 7
13
, 4
16
, 0
18
, 7
21
, 4
24
, 1
26
, 7
29
, 4
32
, 1
34
, 7
37
, 4
40
, 1
42
, 8
45
, 4
48
, 1
50
, 8
53
, 5
56
, 1
58
, 8
61
, 5
64
, 1
66
, 8
69
, 5
72
, 2
74
, 8
77
, 5
Distance from sheath [mm]Sound Weld Wormhole Defect Lack of Penetration V1 Lack of Penetration V2
Inte
nsi
ty
Fig. 4 Intensity profiles on the basis of figure 3:
mean intensity value per distance at an
optional time
lower lying defects are overlaid at this position
and, consequently, not discernible.
To achieve a better comparability of the single
thermography images, they have been equally
scaled. It is impossible to display the absolute
temperature of the weld seam at this position.
The reason for this is the not exactly known
but low emissivity of the workpieces. However,
this is not important for the evaluation. The
scale describes a dimensionless intensity quantity.
As each measurement has been made under the
same conditions, the measured intensity distributions
can be compared directly with each other.
A first comparison of the thermographic images
at any time during the process already provides
first insights. The thermography image of the
sound weld serves as a reference for further
comparisons. The temperature distribution of
the weld seam with the wormhole (see Fig. 3 b))
shows low intensity compared with the sound
weld seam. This suggests a cold weld. The uneven
intensity distribution along the weld seam
suggests a continuous wormhole. Other cold weld
defects change the seam surface and can be easily
detected by strong local increase of intensity or
even visual inspection. The shortened pin in
Fig. 3 c) still leads to a joining of the workpieces.
The thermographic image shows a similar result
as the reference weld. Only the stated intensities
display slightly higher data. In comparison to
that, it is possible to detect a heat accumulation
on the surface in Fig. 3 d). The heat generated
during the process cannot flow off into the
lower workpiece which can be attributed to a
“lack of penetration”.
3.2 Evaluation of intensity profiles
For a more distinct evaluation, a quadratic
area around the weld seam has been chosen
during each measurement, and the measured
intensities have been examined. The area has
a size of 100 pixels × 450 pixels and complies
with an evaluated weld seam area of about
20mm × 80mm. This area is encircled by the
black mark in Fig. 3.
At first, the cooling behaviour of the weld seams
during the process, shown in Fig. 3 a) to 3 d),
has been evaluated. Thereby, the average intensities
along each row with the same distance to the
sheath within the mark have been determined.
The cooling behaviour of the welds is demonst-
rated in Fig. 4. Defects caused by flashes on the
surface in form of sudden temperature rises
can be easily distinguished due to the intensity
profiles.
The almost linear intensity profile of the reference
weld can be clearly recognized. A sound weld
proportionally cools down with increasing
distance to the tool. In case of the cold weld,
less heat is inserted into the weld. Though the
temperature shortly after the welding process
is almost as high as in other welding processes,
this weld cools down exponentially. With regard
to the lack of penetration variant 1, the com-
pletely welded area is considerably smaller com-
pared with the reference weld. The reduced
area lowers the heat conduction into the lowest
aluminium plate, causing a slower but never-
theless linear decline of temperature and intensity.
Compared to that, there is no connection between
both workpieces in case of the lack of penet-
ration variant 2. The produced heat can only
be spread within the upper aluminium plate.
Due to the smaller material volume and the
smaller surface, the cooling down is slower, which
can be seen in Fig. 4.
In addition to the evaluation of the single
thermography images at particular points in
time, the intensity distribution over the whole
weld process has been evaluated. In order to
Defect Detection in Friction Stir Welding by Online Infrared Thermography
大韓熔接․接合學 誌 第32卷 第5號, 2014年 10月 485
55
Fig. 6 Location of removal of the specimen (drawing
without scale)
(a)
(b)
264.02㎛
1000㎛
1000㎛
2847.89㎛
Fig. 7 Metallographic confirmation for accurate
seam (a) and wormhole defect (b)
0, 0
0
1, 1
0
2, 2
0
3, 3
0
4, 4
0
5, 5
0
6, 6
0
7, 7
0
8, 8
0
9, 9
0
11, 0
0
12, 1
0
13, 2
0
14, 3
0
15, 4
0
16, 5
0
17, 6
0
18, 7
0
19, 8
0
20, 9
0
22, 0
0
23, 1
0
24, 2
0
25, 3
0
26, 4
0
27, 5
0
28, 6
0
29, 7
0
30, 8
0
7000
8000
9000
10000
11000
12000
13000
Time [s]Sound Weld Wormhole Defect Lack of Penetration V1 Lack of Penetration V2
Inte
nsi
ty
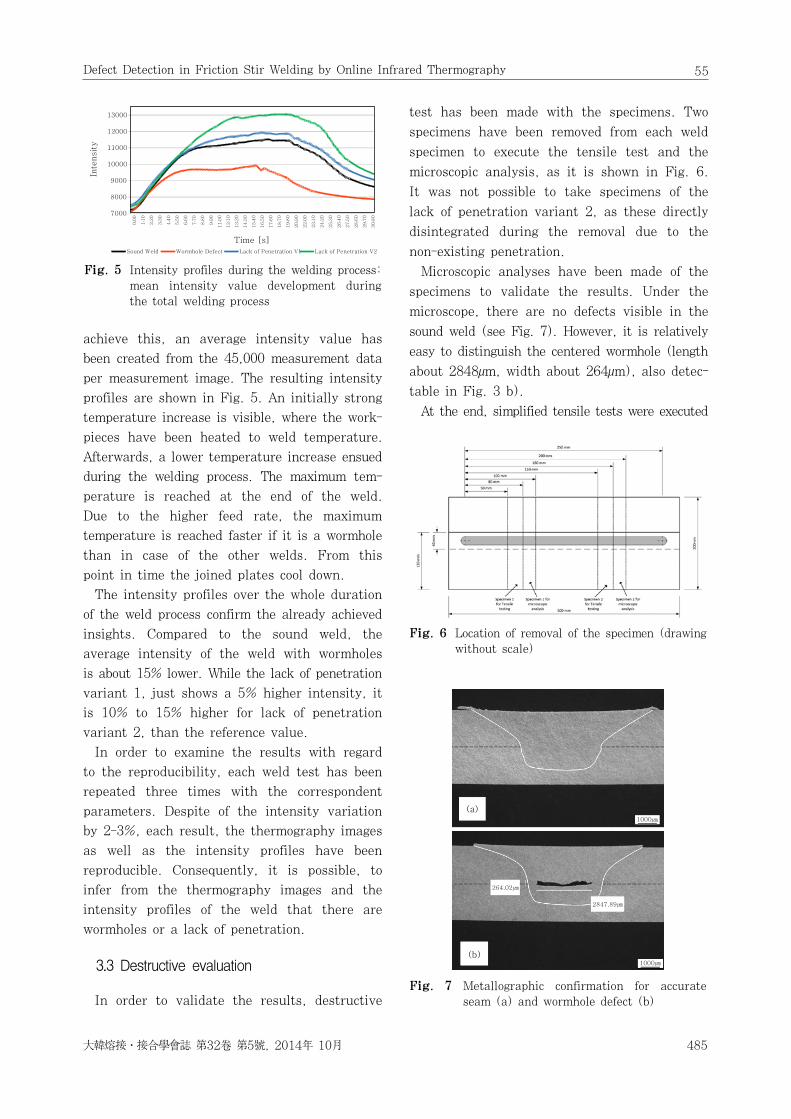
Fig. 5 Intensity profiles during the welding process:
mean intensity value development during
the total welding process
achieve this, an average intensity value has
been created from the 45,000 measurement data
per measurement image. The resulting intensity
profiles are shown in Fig. 5. An initially strong
temperature increase is visible, where the work-
pieces have been heated to weld temperature.
Afterwards, a lower temperature increase ensued
during the welding process. The maximum tem-
perature is reached at the end of the weld.
Due to the higher feed rate, the maximum
temperature is reached faster if it is a wormhole
than in case of the other welds. From this
point in time the joined plates cool down.
The intensity profiles over the whole duration
of the weld process confirm the already achieved
insights. Compared to the sound weld, the
average intensity of the weld with wormholes
is about 15% lower. While the lack of penetration
variant 1, just shows a 5% higher intensity, it
is 10% to 15% higher for lack of penetration
variant 2, than the reference value.
In order to examine the results with regard
to the reproducibility, each weld test has been
repeated three times with the correspondent
parameters. Despite of the intensity variation
by 2-3%, each result, the thermography images
as well as the intensity profiles have been
reproducible. Consequently, it is possible, to
infer from the thermography images and the
intensity profiles of the weld that there are
wormholes or a lack of penetration.
3.3 Destructive evaluation
In order to validate the results, destructive
test has been made with the specimens. Two
specimens have been removed from each weld
specimen to execute the tensile test and the
microscopic analysis, as it is shown in Fig. 6.
It was not possible to take specimens of the
lack of penetration variant 2, as these directly
disintegrated during the removal due to the
non-existing penetration.
Microscopic analyses have been made of the
specimens to validate the results. Under the
microscope, there are no defects visible in the
sound weld (see Fig. 7). However, it is relatively
easy to distinguish the centered wormhole (length
about 2848µm, width about 264µm), also detec-
table in Fig. 3 b).
At the end, simplified tensile tests were executed

I.Kryukov, M.Hartmann, S.Böhm, M.Mund, K.Dilger and F.Fischer
486 Journal of Welding and Joining, Vol. 32, No. 5, 2014
56
10000900080007000600050004000300020001000
00,00 0,04 0,17 0,34 0,51 0,67 0,84 1,01 1,17 1,34 1,51 1,67 1,84 2,01 2,17 2,35 2,52 2,69 2,88
Elongation [mm]
Sound Weld 1 Sound Weld 2 Wormhole 1
Wormhole 2 Lack of Penetration V1 1 Lack of Penetration V1 2
Forc
e [
N]
Fig. 8 Tensile testing of defective and sound weld
seams
350
300
250
200
150
100
50
0
Max
. te
nsi
le f
orc
e p
er
mm
weld
seam
[Fm
ax/m
m]
Sound Weld Wormhole Defect Lack of Penetration V1
301
100
124
Fig. 9 Maximal tensile force per mm weld seam for
defective and accurate specimen
on the diverse specimens. They shall demonst-
rate the influence of detected defects on the
tensile strength. With regard to the simplification,
the maximum tensile forces have been examined.
The progress of the tensile tests is demon-
strated in Fig. 8.
The tensile tests demonstrate that the inserted
defects considerably reduce the maximum tensile
forces. The maximum force per mm weld seam
of the specimen of the regular weld seam is
about 301N/mm, the specimen of the wormhole
is at about 100N/mm (about 33% of the regular
seam) and the one of the lack of penetration
variant 1 lies at about 124N/mm (about 41%
of the regular seam), as it is shown in Fig. 9.
Contrary to the defected specimens, both accurate
tension tests failed outside the weld seam.
4. Conclusions
In this article, the first results of the current
project, aiming at the confirmation of the sui-
tability of the thermography as a non-destructive
testing method, have been demonstrated. During
the course of the project it shall be proven that
internal defects, like wormholes and “lack of
penetration”, occurring in the friction stir welding
can be detected during the cooling process. This
shall enable a process-related control of the
weld seam.
The most important results of this article are:
• Thermography can be used with the friction
stir welding to examine the heating and cooling
progress of weld seams
• A good thermal shield from surrounding and
process disturbing factors as well as from
the tool is compulsory for thermography to reduce
disturbances
• Surface defects like flashing distort the ther-
mography measurement due to a higher heat
radiation and, consequently, impede the detec-
tion of subjacent defects
• By considering the variations of intensity
distribution compared to the reference measure-
ment, internal defects like “wormholes” and
“lack of penetration” can be detected with online-
thermography
During the course of the project it will be
examined which further defects can be detected
from the intensity profiles. In addition to that
the transferability of the results to other geometries
and aluminium alloys is tested.
Acknowledgement
The authors would like to acknowledge the
DVS - Deutscher Verband für Schweißen und
verwandte Verfahren e.V. for its financial support
via project ThermoFSW (DVS-Nr.: 05.049) and
the technical support of all project participants.
References
1. W.J. Arbegast: A flow-partitioned deformation zone
model for defect formation during friction stir welding,
Scripta Materialia, 58 (2008), 372-376
2. S. Bagavathiappan, B.B. Lahiri, T. Saravanan, J.
Philip, T. Jayakumar: Infrared thermography for
condition monitoring - A review, Infrared Physics &
Technology, 60 (2013), 35-55
3. X.P. Maldague, P.O. Moore: Infrared and Thermal

Defect Detection in Friction Stir Welding by Online Infrared Thermography
大韓熔接․接合學 誌 第32卷 第5號, 2014年 10月 487
57
Testing - Volume 3: Nondestructive Testing Handbook
- Third edition, American Society for Non-destruc-
tive Testing, Columbus, 2001
4. A. Forcellese, M. Martarelli, G. Pandarese, M. Simoncini:
Similar and Dissimilar FSWed Joints in Lightweight
Alloys: Heating Distribution Assessment and IR Ther-
mography Monitoring for On-Line Quality Control,
Key Engineering Materials, 554-557 (2013), 1055-1064
5. S. Beccari, L. D'Acquisto, L. Fratini, C. Salamone:
Thermal Characterization of Friction Stir Welded
Butt Joints, Advanced Materials Research, 6-8 (2005),
583-590
6. C.C. Rusu, L.R. Mistodie: Thermography used in
friction stir welding processes, Welding equipment
and technology, 21 (2010), 62-65
7. B.M. Darras, M.A. Omar, M.K. Khraisheh: Experimental
Thermal Analysis of Friction Stir Processing, Materials
Science Forum, 539-543 (2007), 3801-3806
Igor Kryukov received the first graduate engineer and the second graduate engineer in mechatronics from University of Kassel, Germany, in 2010 and 2013.He is a Research Engineer at the
Department for Cutting and Joining (tff)
at the University of Kassel, Germany.
His current research interests include large-area
non-destructive testing (NDT) in the field of welding
and bonding.
Michael Hartmann received the first
graduate engineer and the second
graduate engineer in mechatronics
from University of Kassel, Germany,
in 2011 and 2013.
He is a Research Engineer at the
Department for Cutting and Joining
(tff) at the University of Kassel, Germany. His
current research interests include Friction Stir
Welding, tool development and combined process in
Friction Stir Welding.
Stefan Böhm received the graduate
engineer in electrical engineering from
TU Darmstadt, Germany, in 1994, and the
Ph.D. degree in Mechanical Engineering
from RWTH Aachen, in 1999.
From 2002-2010 he was the chair of
the Department for Micro joining at the
Technical University of Braunschweig. Since 2010, he
is the chair of the Department for Cutting and Joining
(tff) at the University of Kassel, Germany. The research
priorities of the Department for Cutting and Joining
are the welding, bonding and cutting technologies.
8. B.B. Lahiri, S. Bagavathiappan, T. Saravanan, K.V.
Rajkumar, A. Kumar, J. Philip, T. Jayakumar: Defect
Detection in Weld Joints by Infrared Thermography,
NDESAI 2011, 191-197
9. D. Dehelean, V. Safta, R. Cojocaru, T. Hälker, C. Ciuca:
Monitoring the quality of friction stir welded joints
by infrared thermography, Safety and Reliability of
Welded Components In Energy and Processing Industry
(2008), 621-626
10. FLIR Systems, Inc.: FLIR® Silver SC5000 MWIR,
Rev. 10/09-R1, URL: http://www.flir.com/WorkArea/
DownloadAsset.aspx?id=20006
11. An American National Standard, AWS D17.3/
D17.3M:2010, American Welding Society Specification
for friction stir welding of aluminum alloys for aerospace
applications (2010)
12. DIN Deutsches Institut für Normung e.V., DIN EN
ISO 25239-5: Rührreibschweißen - Aluminium - Teil
5: Qualitäts-und Prüfungsanforderungen (2012)
Malte Mund received the diploma degree in mechanical engineering from the University of Paderborn, Germany, in 2011. Since then he works as a research associate at the Institute of Joining and Welding at the TU Braunschweig, Germany. His research interests are non-destructive testing of joints by
thermography, the behavior of joined sandwich structures and debonding of structural adhesive joints.
Klaus Dilger received the diploma degree in 1987 and the Ph.D. degree in mechanical engineering in 1991 from the TU München, Germany. In 1997, he became professor of adhesive bonding at the RWTH Aachen, Germany. In 2002 he became head of the Institute of Joining and welding of the TU Braun-
schweig, Germany. His research focuses on joining technologies for lightweight materials including material properties, joining processes and quality assurance by means of non destructive testing.
Fabian Fischer received his diploma
degree in chemistry (2000) as well the
Ph.D. degree in chemistry (2007) from
the Friedrich Wilhelm Leibniz Universität
Hannover, Germany. Since 2011, he is
head of the departments of composite
materials and beam technologies of the
Institute for Joining and Welding at the TU Braunsch-
weig, Germany which includes the research unit for non
destructive testing. His work focuses on laser and
electron beam welding, the laser machining of
composite materials and the quality assurance of both
welded structures and composites.