deere & companyone john deere placemoline, il 61265 ... · as previously forecasted, company...
TRANSCRIPT
SECURITIES AND EXCHANGE COMMISSION
Washington, D.C. 20549
FORM 8-K
CURRENT REPORT
Pursuant to Section 13 or 15(d) of the
Securities Exchange Act of 1934
Date of Report: August 12, 2003 (Date of earliest event reported)
D E E R E & C O M P A N Y
(Exact name of registrant as specified in charter)
DELAWARE (State or other jurisdiction of incorporation)
1-4121
(Commission File Number)
36-2382580 (IRS Employer Identification No.)
One John Deere Place Moline, Illinois 61265
(Address of principal executive offices and zip code)
(309)765-8000 (Registrant's telephone number, including area code)
(Former name or former address, if changed since last report.)

Item 5. Other Events.
The following consists of Deere & Company's press release dated August 12, 2003 concerning third-quarter of fiscal 2003 financial results and supplemental financial information filed as Exhibit 20 to this report and incorporated by reference herein.
Item 7. Financial Statements, Pro Forma Financial Information and Exhibits.
(c) Exhibits
(20) Press release and supplemental financial information
Item 12. Results of Operations and Financial Condition.
The attached schedule of Other Financial Information is furnished under Form 8-K Item 12 (Results of Operations and Financial Condition). The information is not filed for purposes of the Securities Exchange Act of 1934 and is not deemed incorporated by reference by any general statements incorporating by reference this report or future filings into any filings under the Securities Act of 1933 or the Securities Exchange Act of 1934, except to the extent Deere & Company specifically incorporates the information by reference.
2

Signature Pursuant to the requirements of the Securities Exchange Act of 1934, the Registrant has duly caused this report to be signed on its behalf by the undersigned hereto duly authorized. DEERE & COMPANY
By: /s/ JAMES H. BECHT
Secretary Dated: August 12, 2003
3

Exhibit Index
Number and Description of Exhibit
Sequential Page Number
(20) Press release and supplemental financial information Pg. 5
4

Deere & Company One John Deere Place Moline, IL 61265 USA Phone: 309-765-8000 www.JohnDeere.com
NEWS RELEASE for Tuesday August 12, 2003 Contact: Ken Golden Manager, Public Relations Deere & Company 309-765-5678 DEERE THIRD-QUARTER EARNINGS INCREASE 68 PERCENT ● Results boosted by improved profitability in Construction & Forestry and Commercial & Consumer
Equipment Divisions. ● New customers and company’s focus on operating efficiencies help produce strong quarter. ● As previously forecasted, company reports lower production levels in agricultural equipment.
MOLINE, Illinois (August 12, 2003) -- Deere & Company today reported worldwide net income of $247.5 million, or $1.02 per share, for the third quarter ended July 31, a 68 percent increase over last year's $147.6 million, or $0.61 per share. For the first nine months, net income was $572.4 million, or $2.37 per share, compared with $251.2 million, or $1.04 per share, last year. "These results build on the success of prior quarters and reflect strong sales of new products and the company’s ongoing efforts to hold down costs and operate more efficiently at lower asset levels," said Robert W. Lane, chairman and chief executive officer. “We have achieved increased profitability in our construction and forestry and commercial and consumer operations, which more than offset our planned lower production volumes in the agricultural equipment division.” Worldwide net sales and revenues grew 11 percent to $4.402 billion for the third quarter compared with a year ago and increased 11 percent to $11.595 billion for the nine months. Net sales were $3.833 billion for the quarter and $9.974 billion for the nine months, compared with $3.410 billion and $8.756 billion, respectively, last year. Net sales for both periods increased primarily due to higher physical volumes of commercial and consumer equipment and construction and forestry equipment. Exchange rates and price realization also had a favorable impact on this year's sales. Overseas net sales increased 9 percent for the quarter and 16 percent for nine months. Excluding the impact of changes in currency-exchange rates, overseas sales were down 3 percent for the quarter but up 5 percent year-to-date. Deere's equipment operations reported operating profit of $288 million for the quarter and $669 million for nine months, compared with $247 million and $329 million, respectively, last year.
5

(Operating results exclude the impact of external interest expense, taxes and certain other corporate expenses.) The increases for both periods were primarily due to improved price realization and higher physical volume of sales. Partially offsetting these factors were higher postretirement benefit costs of $68 million for the quarter and $211 million for the nine months. Last year's results for both periods were negatively affected by the costs of closing certain facilities. Both periods last year also were affected by higher costs associated with the company's minority investment in Nortrax Inc., a venture involved in the ownership and development of several Deere construction-equipment dealer locations. Deere's equipment operations had net income of $152.5 million for the quarter and $329 million for the nine months, compared with $91.3 million and $75.6 million, respectively, last year. The same operating factors mentioned above affected these results. In addition, last year's quarterly and year-to-date net income was negatively impacted by a higher tax rate. Summary of Equipment Operating Profit ● Agricultural Equipment. Compared with last year, division sales increased 4 percent for the
quarter and 9 percent for nine months. The increase for both periods was primarily due to the impact of stronger foreign-exchange rates and improved price realization. Partially offsetting the increase in the third quarter was a lower physical volume of sales. Operating profit was $127 million for the quarter and $329 million for the nine months, compared with $205 million and $362 million, respectively, last year. The decrease for the quarter was primarily due to higher postretirement benefit costs of $52 million as well as lower North American production volumes of tractors and combines. Lower nine-month operating profit was primarily due to higher postretirement benefit costs of $147 million. Offsetting these factors in both periods was the impact of improved price realization.
● Commercial and Consumer Equipment. Compared with last year, division sales were up 18 percent for the quarter and 19 percent for the nine months. The increases were primarily due to strong retail demand for recently introduced products and the impact of expanded distribution channels. Operating profit increased to $104 million for the quarter and $237 million for nine months, compared with $61 million and $97 million, respectively, last year. The improved results were primarily due to higher sales and production volumes. Partially offsetting these factors were higher promotional and support costs related to new products, as well as higher postretirement benefit costs of $7 million for the quarter and $23 million for nine months. Results for both periods last year were negatively affected by restructuring costs related to the closure of certain facilities.
● Construction and Forestry. Division sales rose 29 percent for the quarter and 25 percent for the nine months. Excluding sales from the Deere-Hitachi marketing relationship in the U.S. and Canada, division sales rose 24 percent and 17 percent, respectively, for the third quarter
6

and year-to-date. These increases were primarily due to higher physical volumes, reflective of
improved retail activity. The division's operating profit improved to $59 million for the quarter and $111 million for the nine months, compared with operating losses of $10 million and $97 million, respectively, last year. The improvement for both periods was primarily due to higher sales and production volumes. Improved price realization also had a favorable impact on this year's results. Partially offsetting these factors were higher postretirement benefit costs of $10 million for the quarter and $41 million for the nine months. Last year's third quarter results were negatively affected by higher costs related to the company's investment in Nortrax, which also had an impact on the company’s year-to-date results a year ago as did costs related to the closing of a factory.
● Special Technologies. Lower costs and expenses and the absence of goodwill amortization led to improvements in these operations, which reported operating losses of $2 million for the quarter and $8 million for the nine months, compared with operating losses of $9 million and $33 million, respectively, last year.
Consistent with the company's asset management goals, trade receivables and inventories remained at favorable levels. Trade receivables at the end of third-quarter 2003 were $3.355 billion, representing 26 percent of the previous 12-month sales, compared with $3.302 billion a year ago, equal to 29 percent of prior 12-month sales. Based on constant exchange rates, trade receivables were down by $67 million. Inventories were $1.711 billion, representing 16 percent of the previous 12-month cost of sales, compared with $1.607 billion a year ago, or 17 percent of the previous 12-month cost of sales. Approximately $64 million of the inventory increase was due to the fluctuation of foreign exchange rates. Summary of Financial Services Net Income ● Credit. Net income of the credit operations increased to $85.5 million for the quarter and $227.3
million for the nine months, compared with $56.9 million and $180.2 million, respectively, last year. The increase in quarterly net income was primarily due to higher gains resulting from an increased volume of retail note sales, growth in the portfolio and lower loan losses. The year-to-date increase was primarily due to lower loan losses, growth in the portfolio, and the absence of losses from Argentina, partially offset by lower gains on a lower volume of note sales and narrower financing spreads.
● Health Care. Health care operations reported net income of $5.7 million for the quarter and $13.4 million for the nine months, compared with $4.9 million and $13.2 million, respectively, last year. Both periods benefited from increases in administrative service fee income. Investment income for the quarter was also higher.
7

Market Conditions and Outlook Based on the conditions outlined below, Deere's net equipment sales for the fourth quarter of 2003 are currently forecast to be up approximately 5 percent. Excluding the impact of currency and price, sales are forecast to be slightly lower for the fourth quarter, as previously projected. Also consistent with earlier forecasts, production volumes are expected to be down about 5 percent in the fourth quarter from the low levels of last year. For the full year, net income is now projected in a range of $575 to $625 million. ● Agricultural Equipment. Retail sales of farm machinery in the U.S. and Canada have moved
higher in recent weeks due to increased farmer cash flow and crop conditions that are more favorable than last year. New tax legislation that includes expanded depreciation and expense-write-off provisions is also expected to be supportive of higher farm machinery sales in coming months. As a result, industry retail sales in the U.S. and Canada are now expected to be flat to down 5 percent for the year. In other areas, industry retail sales in Western Europe are expected to be down by 5 to 7 percent for the year mainly due to dry weather and lower farm income. Paced by a strong improvement in Argentina, industry retail sales in South America are now expected to be about 5 percent higher for the year. On a worldwide basis, net sales of John Deere agricultural equipment are now forecast to be up 7 to 9 percent for the year. The physical volume of sales is expected to be down slightly. Production in the U.S. and Canada will be down about 7 percent in the fourth quarter, as inventories are reduced in line with our asset management objectives.
● Commercial and Consumer Equipment. John Deere commercial and consumer equipment sales are expected to continue to benefit from the success of recently introduced products, particularly compact tractors and lawn tractors. As a result, sales are expected to be up over 15 percent for the year. As previously projected, fourth quarter production levels are expected to be down by more than 25 percent, consistent with the division’s build-to-demand strategy.
● Construction and Forestry. Retail activity in the construction and forestry sectors has increased dramatically in recent months from depressed year-ago levels mainly as a result of improved replacement demand. Deere sales have risen strongly in virtually all market categories, including forestry and rental. As a result, sales of Deere construction and forestry equipment are now expected to be up 18 percent for the year (up 13 percent without the inclusion of sales from the Deere-Hitachi marketing relationship).
8
● Credit. Credit results for the full year are expected to benefit from lower write-offs and further
growth in the loan portfolio. On this basis, the division continues to expect net income for the year of about $300 million.
Gaining Through Greater Efficiency and New Customers “Deere's success in simultaneously making major gains in operating efficiency and attracting new customers throughout the world, is helping the company achieve much higher financial results despite softness in the crucial U.S. and Canadian farm sector,” Lane said. "Our performance to date is on track and we are delivering higher value for investors. However, we know there is more work to be done to achieve the improvements necessary to reach our goals." John Deere Capital Corporation The following is disclosed on behalf of the company's credit subsidiary, John Deere Capital Corporation (JDCC), in connection with the disclosure requirements applicable to its periodic issuance of debt securities in the public market. JDCC's net income was $79.8 million for the third quarter and $209.6 million for the first nine months of 2003, compared with $58.9 million and $173.4 million, respectively, last year. The increase in quarterly net income was primarily due to higher gains resulting from an increased volume of retail note sales and growth in the portfolio. The year-to-date increase was primarily due to lower loan losses, growth in the portfolio and the absence of losses from Argentina, partially offset by lower gains on the sales of retail notes and narrower financing spreads. Net receivables and leases financed by JDCC were $11.971 billion at July 31, 2003, compared with $10.747 billion one year ago. The increase resulted from acquisitions exceeding collections during the last twelve months partially offset by sales of retail notes. Net receivables and leases administered, which include receivables previously sold, totaled $14.750 billion at July 31, 2003 compared with $13.576 billion one year ago. Safe Harbor Statement under the Private Securities Litigation Reform Act of 1995 Statements herein that relate to future operating periods are subject to important risks and uncertainties that could cause actual results to differ materially. Some of these risks and uncertainties could affect particular lines of business, while others could affect all of the company's businesses. Forward-looking statements involve certain factors that are subject to change, including for the company’s agricultural equipment segment the many interrelated factors that affect farmers’ confidence, including worldwide demand for agricultural products, world grain stocks, prices realized for commodities and livestock, crop production expenses (most notably fuel and fertilizer costs), weather and soil conditions, real estate values, available acreage for farming, the level, complexity and distribution of government farm programs, animal diseases (including further outbreaks or the
9
spread of “mad cow” and “foot-and-mouth” diseases), crop pests, harvest yields and the level of farm product exports (including concerns about genetically modified organisms). The outlook for harvest prices and the size and condition of the crop especially affect retail sales of agricultural equipment in the fall. Factors affecting the outlook for the company's commercial and consumer equipment segment include general economic conditions in the United States, consumer confidence, consumer borrowing patterns and weather conditions. Another important assumption is continued consumer acceptance of the company's new products, including the new 100-series lawn tractors. The number of housing starts is especially important to sales of the company's construction equipment. The levels of public and non-residential construction also impact the results of the company’s construction and forestry segment. Prices for pulp, lumber and structural panels are important to sales of forestry equipment. All of the company's businesses are affected by general economic conditions in and the political stability of the global markets in which the company operates (including Brazil, Argentina and other South American countries); monetary and fiscal policies of various countries; wars and other international conflicts and the threat thereof; actions by the United States Federal Reserve Board and other central banks; actions by the United States Securities and Exchange Commission and other regulatory bodies; actions by rating agencies; capital market disruptions; investor sentiment; inflation and deflation rates; interest rate levels and currency exchange rates; customer borrowing and repayment practices, and the number of customer loan delinquencies and defaults; actions of competitors in the various industries in which the company competes, particularly price discounting; dealer practices, especially as to levels of new and used field inventories; production and technological difficulties, including capacity and supply constraints; oil and energy prices and supplies; labor relations; changes to accounting standards; the effects of terrorism and the response thereto; and legislation affecting the sectors in which the company operates. Company results are also affected by significant changes in health care costs and in market values of investment assets, which impact post-retirement benefit and pension expenses. In addition, further outbreaks or the spread of severe diseases such as Severe Acute Respiratory Syndrome (SARS) could affect the company’s businesses and results. The company's outlook is based upon assumptions relating to the factors described above, which are sometimes based upon estimates and data prepared by government agencies. Such estimates and data are often revised. The company, however, undertakes no obligation to update or revise its outlook, whether as a result of new developments or otherwise. Further information concerning the company and its businesses, including factors that potentially could materially affect the company's financial results, is included in the company's most recent annual report on Form 10-K and other filings with the Securities and Exchange Commission.
10

Third Quarter 2003 Press Release (millions of dollars and shares except per share amounts)
Three Months Ended July 31 Nine Months Ended July 31
2003 2002 %
Change 2003 2002%
ChangeNet sales and revenues: Agricultural equipment net sales $ 1,955 $ 1,872 +4 $ 5,392 $ 4,960 +9 Commercial and consumer equipment net sales 1,081 913 +18 2,555 2,154 +19 Construction and forestry net sales 788 612 +29 1,997 1,601 +25 Other net sales 9 13 -31 30 41 -27 Total net sales * 3,833 3,410 +12 9,974 8,756 +14 Credit revenues 355 337 +5 1,007 1,086 -7 Other revenues 214 222 -4 614 636 -3 Total net sales and revenues * $ 4,402 $ 3,969 +11 $ 11,595 $ 10,478 +11 Operating profit (loss): ** Agricultural equipment $ 127 $ 205 -38 $ 329 $ 362 -9 Commercial and consumer equipment 104 61 +70 237 97 +144 Construction and forestry 59 (10) 111 (97) Credit 132 88 +50 350 285 +23 Other 7 (1) 14 (12) Total operating profit * 429 343 +25 1,041 635 +64Interest, corporate expenses and income taxes (181) (195) -7 (469) (384) +22 Net income $ 248 $ 148 +68 $ 572 $ 251 +128 Per Share: Net income - basic $ 1.03 $ .62 +66 $ 2.39 $ 1.06 +125 Net income - diluted $ 1.02 $ .61 +67 $ 2.37 $ 1.04 +128 * Includes overseas equipment operations: Net sales $ 1,132 $ 1,034 +9 $ 3,029 $ 2,603 +16 Operating profit $ 93 $ 108 -14 $ 289 $ 209 +38 ** In the third quarter of 2002, the operating profit (loss) of the agricultural equipment, commercial and consumer equipment,
construction and forestry and other segments included pretax goodwill amortization of $3, $4, $4 and $3, respectively, for a total of $14. In the first nine months of 2002, these amounts were $10, $11, $12 and $9, respectively, for a total of $42. In the third quarter of 2002, the operating profit (loss) of the agricultural equipment, commercial and consumer equipment, construction and forestry and other segments also included pretax costs (income) for special items related to restructuring of $1, $24, $(2) and $1, respectively, for a total of $24. In the first nine months of 2002, these amounts were $9, $22, $20 and $7, respectively, for a total of $58. In the first nine months of 2003, there was no goodwill amortization and the costs or income for special items were not material.
July 31, 2003 October 31, 2002 July 31, 2002 Consolidated: Trade accounts and notes receivable - net $ 3,355 $ 2,734 $ 3,302 Inventories $ 1,711 $ 1,372 $ 1,607 Financial Services: Financing receivables and leases financed – net $ 10,868 $ 10,604 $ 9,974 Financing receivables and leases administered – net $ 13,755 $ 13,225 $ 12,908 Average shares outstanding 239.4 238.2 238.0
11
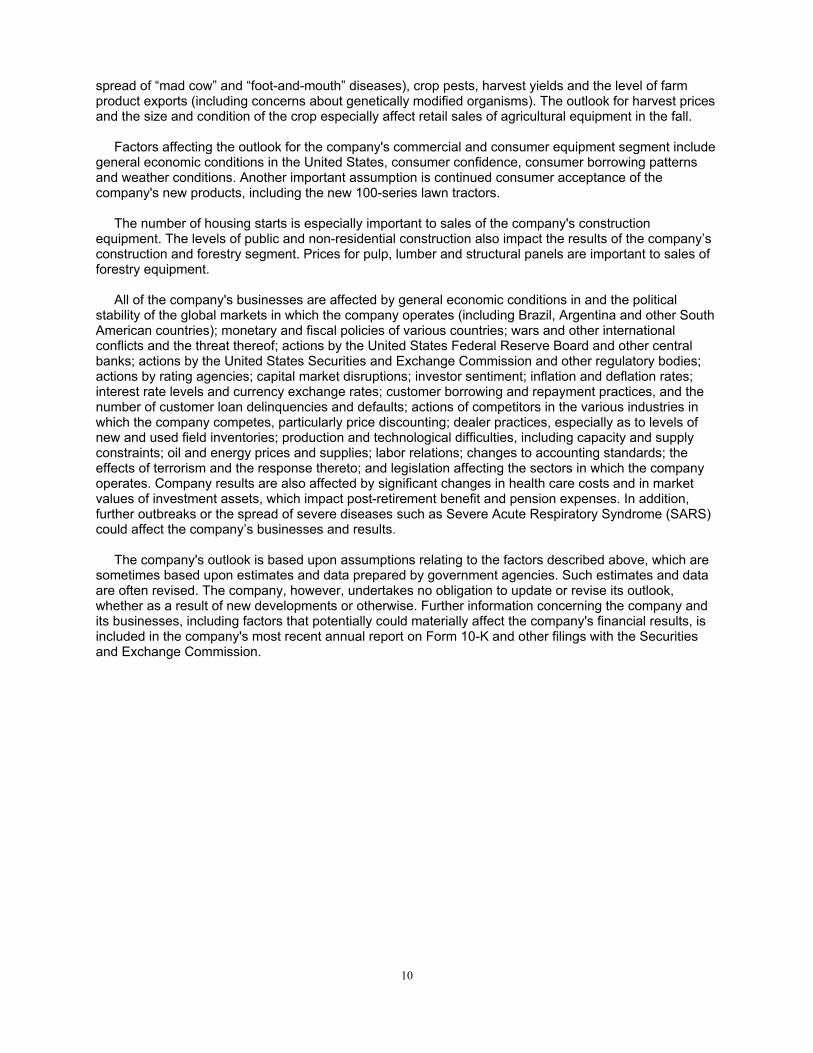
DEERE & COMPANY STATEMENT OF CONSOLIDATED INCOME For the Three Months Ended July 31, 2003 and 2002 (In millions of dollars except per share amounts) Unaudited 2003 2002 Net Sales and Revenues Net sales $ 3,833.0 $ 3,409.6 Finance and interest income 328.6 336.5 Health care premiums and fees 173.6 174.9 Other income 66.4 48.0 Total 4,401.6 3,969.0 Costs and Expenses Cost of sales 3,065.1 2,746.9 Research and development expenses 143.3 125.2 Selling, administrative and general expenses 447.8 406.3 Interest expense 162.4 158.3 Health care claims and costs 139.2 142.5 Other operating expenses 73.5 101.0 Total 4,031.3 3,680.2 Income of Consolidated Group Before Income Taxes 370.3 288.8 Provision for income taxes 126.7 134.8 Income of Consolidated Group 243.6 154.0 Equity in Income (Loss) of Unconsolidated Affiliates Credit (.9 ) Other 3.9 (5.5 ) Total 3.9 (6.4 ) Net Income $ 247.5 $ 147.6 Per Share: Net income – basic $ 1.03 $ .62 Net income – diluted $ 1.02 $ .61 See Notes to Interim Financial Statements.
12

DEERE & COMPANY STATEMENT OF CONSOLIDATED INCOME For the Nine Months Ended July 31, 2003 and 2002 (In millions of dollars except per share amounts) Unaudited 2003 2002 Net Sales and Revenues Net sales $ 9,974.1 $ 8,756.1 Finance and interest income 957.4 1,004.3 Health care premiums and fees 490.7 506.4 Other income 173.0 210.8 Total 11,595.2 10,477.6 Costs and Expenses Cost of sales 7,977.8 7,175.1 Research and development expenses 405.1 384.5 Selling, administrative and general expenses 1,230.5 1,222.3 Interest expense 474.9 476.9 Health care claims and costs 395.5 417.5 Other operating expenses 237.4 325.8 Total 10,721.2 10,002.1 Income of Consolidated Group Before Income Taxes 874.0 475.5 Provision for income taxes 304.6 203.5 Income of Consolidated Group 569.4 272.0 Equity in Income (Loss) of Unconsolidated Affiliates Credit .2 (3.0 ) Other 2.8 (17.8 ) Total 3.0 (20.8 ) Net Income $ 572.4 $ 251.2 Per Share: Net income – basic $ 2.39 $ 1.06 Net income – diluted $ 2.37 $ 1.04 See Notes to Interim Financial Statements.
13

DEERE & COMPANY CONDENSED CONSOLIDATED BALANCE SHEET (In millions of dollars) Unaudited
July 31 October 31 2003 2002 2002 Assets Cash and cash equivalents $ 3,757.2 $ 2,814.9 $ 2,327.5
232.7 189.2 211.6 Receivables from unconsolidated affiliates 333.4 265.8 273.8 Trade accounts and notes
3,355.3 2,733.6 3,302.4 Financing receivables – net 9,522.0 9,067.5 8,351.2 Other receivables 333.5 426.4 273.6
1,384.3 1,609.2 1,663.6 Inventories 1,710.5 1,371.8 1,606.5 Property and equipment – net 2,021.7 1,998.3 2,008.0
July 31
Marketable securities
receivable – net
Equipment on operating leases – net
Investments in unconsolidated affiliates 181.6 180.6 186.7 Goodwill 859.7 804.0 835.1 Other intangible assets – net 90.0 90.9 25.9 Prepaid pension costs 57.1 49.6 687.6 Other assets 576.4 582.1 610.0 Deferred income taxes 1,479.7 1,490.1 1,030.0 Deferred charges 102.7 94.0 93.3 Total assets $ 25,997.8 $ 23,768.0 $ 23,486.8 Liabilities and Stockholders’ Equity Short-term borrowings $ 4,403.0 $ 4,437.3 $ 5,121.6 Payables to unconsolidated affiliates 100.5 64.0 51.7 Accounts payable and accrued expenses 3,169.6 3,142.2 2,957.7 Health care claims and reserves 111.8 92.8 109.2 Accrued taxes 228.3 87.4 126.6 Deferred income taxes 29.0 24.5 19.5 Long-term borrowings 10,544.8 8,950.4 8,163.1 Retirement benefit accruals and other liabilities 3,618.6 3,806.2 2,753.5 Total liabilities 22,205.6 20,604.8 19,302.9 Stockholders’ equity 3,792.2 3,163.2 4,183.9 Total liabilities and stockholders’ equity $ 25,997.8 $ 23,768.0 $ 23,486.8 See Notes to Interim Financial Statements.
14

DEERE & COMPANY CONDENSED STATEMENT OF CONSOLIDATED CASH FLOWS For the Nine Months Ended July 31, 2003 and 2002 (In millions of dollars) Unaudited 2003 2002 Cash Flows from Operating Activities Net income $ 572.4 $ 251.2 Adjustments to reconcile net income to net cash provided by operating activities (377.4) 427.4 Net cash provided by operating activities 195.0 678.6 Cash Flows from Investing Activities Collections of receivables 6,472.8 5,479.3 Proceeds from sales of financing receivables 1,542.9 2,789.1 Proceeds from maturities and sales of marketable securities 46.4 43.6 Proceeds from sales of equipment on operating leases 398.6 437.7 Proceeds from sales of businesses 22.5 50.1 Cost of receivables acquired (8,199.0) (7,548.8) Purchases of marketable securities (88.6) (78.1) Purchases of property and equipment (185.4) (229.3) Cost of operating leases acquired (333.6) (430.1) Acquisitions of businesses, net of cash acquired (10.6) (15.4) Decrease (increase) in receivables with unconsolidated affiliates (25.7) 15.3 Other (7.9) (80.6) Net cash provided by (used for) investing activities (367.6) 432.8 Cash Flows from Financing Activities Increase (decrease) in short-term borrowings 503.8 (1,020.0) Proceeds from long-term borrowings 2,857.2 3,592.1 Principal payments on long-term borrowings (2,171.9) (2,273.6) Proceeds from issuance of common stock 41.5 39.7 Repurchases of common stock (.4) (1.2) Dividends paid (157.8) (156.5) Other (1.4) (1.5) Net cash provided by financing activities 1,071.0 179.0 Effect of Exchange Rate Changes on Cash 43.9 7.1 Net Increase in Cash and Cash Equivalents 942.3 1,297.5 Cash and Cash Equivalents at Beginning of Period 2,814.9 1,030.0 Cash and Cash Equivalents at End of Period $ 3,757.2 $ 2,327.5
See Notes to Interim Financial Statements.
15
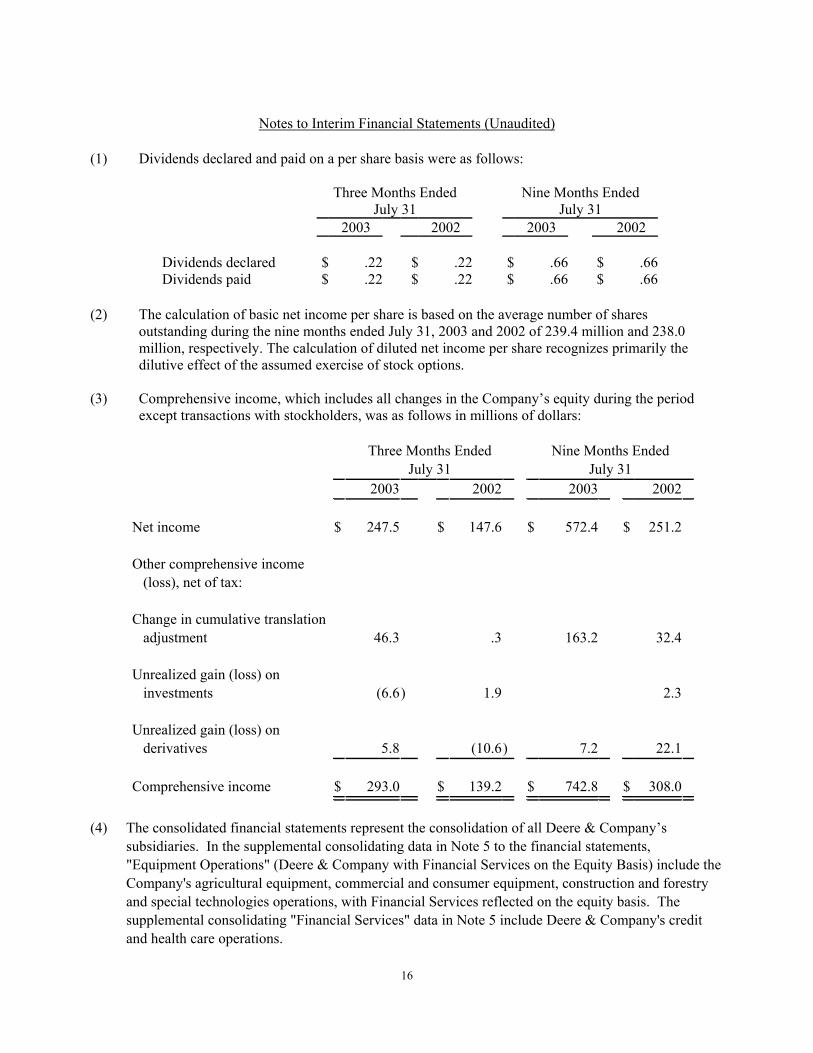
Notes to Interim Financial Statements (Unaudited)
(1) Dividends declared and paid on a per share basis were as follows: Three Months Ended
July 31 Nine Months Ended
July 31
2003 2002 2003 2002 Dividends declared $ .22 $ .22 $ .66 $ .66 Dividends paid $ .22 $ .22 $ .66 $ .66
(2) The calculation of basic net income per share is based on the average number of shares outstanding during the nine months ended July 31, 2003 and 2002 of 239.4 million and 238.0 million, respectively. The calculation of diluted net income per share recognizes primarily the dilutive effect of the assumed exercise of stock options.
(3) Comprehensive income, which includes all changes in the Company’s equity during the period
except transactions with stockholders, was as follows in millions of dollars:
Three Months Ended July 31
Nine Months Ended July 31
2003 2002 2003 2002 Net income $ 247.5 $ 147.6 $ 572.4 $ 251.2 Other comprehensive income (loss), net of tax:
Change in cumulative translation adjustment
46.3
.3
163.2
32.4
Unrealized gain (loss) on investments (6.6)
1.9
2.3
Unrealized gain (loss) on derivatives
5.8
(10.6)
7.2
22.1
Comprehensive income $ 293.0 $ 139.2 $ 742.8 $ 308.0
(4) The consolidated financial statements represent the consolidation of all Deere & Company’s
subsidiaries. In the supplemental consolidating data in Note 5 to the financial statements, "Equipment Operations" (Deere & Company with Financial Services on the Equity Basis) include the Company's agricultural equipment, commercial and consumer equipment, construction and forestry and special technologies operations, with Financial Services reflected on the equity basis. The supplemental consolidating "Financial Services" data in Note 5 include Deere & Company's credit and health care operations.
16
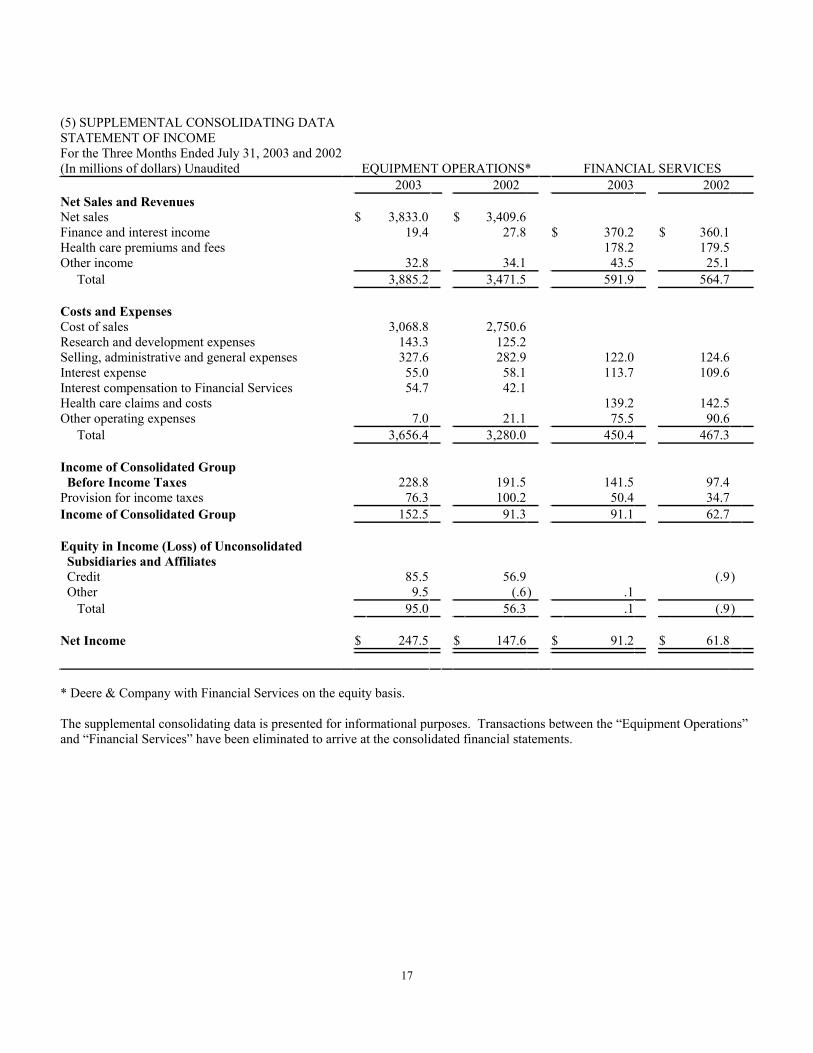
(5) SUPPLEMENTAL CONSOLIDATING DATA STATEMENT OF INCOME For the Three Months Ended July 31, 2003 and 2002 (In millions of dollars) Unaudited EQUIPMENT OPERATIONS* FINANCIAL SERVICES 2003 2002 2003 2002Net Sales and Revenues Net sales $ 3,833.0 $ 3,409.6 Finance and interest income 19.4 27.8 $ 370.2 $ 360.1 Health care premiums and fees 178.2 179.5 Other income 32.8 34.1 43.5 25.1 Total 3,885.2 3,471.5 591.9 564.7 Costs and Expenses Cost of sales 3,068.8 2,750.6 Research and development expenses 143.3 125.2 Selling, administrative and general expenses 327.6 282.9 122.0 124.6 Interest expense 55.0 58.1 113.7 109.6 Interest compensation to Financial Services 54.7 42.1 Health care claims and costs 139.2 142.5 Other operating expenses 7.0 21.1 75.5 90.6 Total 3,656.4 3,280.0 450.4 467.3 Income of Consolidated Group Before Income Taxes 228.8 191.5 141.5 97.4 Provision for income taxes 76.3 100.2 50.4 34.7 Income of Consolidated Group 152.5 91.3 91.1 62.7 Equity in Income (Loss) of Unconsolidated Subsidiaries and Affiliates Credit 85.5 56.9 (.9) Other 9.5 (.6) .1 Total 95.0 56.3 .1 (.9) Net Income $ 247.5 $ 147.6 $ 91.2 $ 61.8 * Deere & Company with Financial Services on the equity basis. The supplemental consolidating data is presented for informational purposes. Transactions between the “Equipment Operations” and “Financial Services” have been eliminated to arrive at the consolidated financial statements.
17

SUPPLEMENTAL CONSOLIDATING DATA (Continued) STATEMENT OF INCOME For the Nine Months Ended July 31, 2003 and 2002 (In millions of dollars) Unaudited EQUIPMENT OPERATIONS* FINANCIAL SERVICES 2003 2002 2003 2002Net Sales and Revenues
Net sales $ 9,974.1 $ 8,756.1 Finance and interest income 56.9 60.0 $ 1,070.2 $ 1,079.8 Health care premiums and fees 504.7 519.9 Other income 103.3 106.0 103.4 137.8 Total 10,134.3 8,922.1 1,678.3 1,737.5 Costs and Expenses Cost of sales 7,988.9 7,186.0 Research and development expenses 405.1 384.5 Selling, administrative and general expenses 892.1 834.3 343.5 393.2 Interest expense 163.0 166.1 331.9 330.3 Interest compensation to Financial Services 149.6 115.9Health care claims and costs 395.5 417.5Other operating expenses 33.3 69.2 235.8 287.2 Total 9,632.0 8,756.0 1,306.7 1,428.2 Income of Consolidated Group Before Income Taxes 502.3 166.1 371.6 309.3 Provision for income taxes 173.3 90.5 131.1 112.9Income of Consolidated Group 329.0 75.6 240.5 196.4 Equity in Income (Loss) of Unconsolidated Subsidiaries and Affiliates Credit 227.3 180.2 .2 (3.0) Other 16.1 (4.6) .1
Total 243.4 175.6 .3 (3.0) Net Income $ 572.4 $ 251.2 $ 240.8 $ 193.4 * Deere & Company with Financial Services on the equity basis. The supplemental consolidating data is presented for informational purposes. Transactions between the “Equipment Operations” and “Financial Services” have been eliminated to arrive at the consolidated financial statements.
18

SUPPLEMENTAL CONSOLIDATING DATA (Continued) CONDENSED BALANCE SHEET (In millions of dollars) Unaudited
EQUIPMENT OPERATIONS *
FINANCIAL SERVICES
July 312003
October 312002
July 31 2002
July 31 2003
October 312002
July 31 2002
Assets Cash and cash equivalents $ 3,372.5 $ 2,638.5 $ 1,940.0 $ 384.6 $ 176.3 $ 387.5 Cash equivalents deposited with unconsolidated subsidiaries 203.5 790.8 1,074.7 Cash and cash equivalents 3,576.0 3,429.3 3,014.7 384.6 176.3 387.5 Marketable securities 232.7 189.2 211.6 Receivables from unconsolidated subsidiaries and affiliates 253.0 220.1 236.6 300.3 259.8 271.1 Trade accounts and notes receivable - net 891.2 909.4 1,338.5 2,864.6 2,137.7 2,298.2 Financing receivables - net 26.3 60.1 29.0 9,495.7 9,007.4 8,322.2 Other receivables 145.3 279.1 121.8 188.3 147.3 151.9 Equipment on operating leases - net 12.5 12.4 12.3 1,371.8 1,596.8 1,651.3 Inventories 1,710.5 1,371.8 1,606.5 Property and equipment - net 1,988.1 1,963.4 1,971.2 33.7 34.9 36.8 Investments in unconsolidated subsidiaries and affiliates 2,416.2 2,248.5 2,223.4 3.5 7.7 9.5 Goodwill 859.6 803.9 834.9 .2 .2 .2 Other intangible assets - net 89.6 90.4 25.5 .3 .4 .5 Prepaid pension costs 57.1 49.6 687.6 Other assets 202.5 208.1 205.1 373.9 374.0 404.9 Deferred income taxes 1,565.0 1,576.3 1,077.9 1.4 1.8 .1 Deferred charges 81.5 73.4 74.1 22.8 20.6 19.2 Total assets $ 13,874.4 $ 13,295.8 $ 13,459.1 $ 15,273.8 $ 13,954.1 $ 13,765.0 Liabilities and Stockholders' Equity Short-term borrowings $ 580.5 $ 398.1 $ 675.9 $ 3,822.5 $ 4,039.2 $ 4,445.7 Payables to unconsolidated subsidiaries and affiliates 111.5 79.4 68.9 412.5 989.7 1,291.4 Accounts payable and accrued expenses 2,867.5 2,800.7 2,737.8 704.3 654.9 554.2 Health care claims and reserves 111.8 92.8 109.2 Accrued taxes 194.4 83.2 115.2 34.0 4.2 11.3 Deferred income taxes 11.4 9.5 1.9 104.3 102.9 65.5 Long-term borrowings 2,740.0 2,988.8 2,956.9 7,804.7 5,961.5 5,206.2 Retirement benefit accruals and other liabilities 3,576.9 3,772.9 2,718.6 41.7 33.3 35.0 Total liabilities 10,082.2 10,132.6 9,275.2 13,035.8 11,878.5 11,718.5 Stockholders' equity 3,792.2 3,163.2 4,183.9 2,238.0 2,075.6 2,046.5 Total liabilities and stockholders’ equity $ 13,874.4 $ 13,295.8 $ 13,459.1 $ 15,273.8 $ 13,954.1 $ 13,765.0 * Deere & Company with Financial Services on the equity basis. The supplemental consolidating data is presented for informational purposes. Transactions between the "Equipment Operations" and "Financial Services" have been eliminated to arrive at the consolidated financial statements.
19

SUPPLEMENTAL CONSOLIDATING DATA (Continued) CONDENSED STATEMENT OF CASH FLOWS For the Nine Months Ended July 31, 2003 and 2002 (In millions of dollars) Unaudited EQUIPMENT OPERATIONS* FINANCIAL SERVICES 2003 2002 2003 2002Cash Flows from Operating Activities Net income $ 572.4 $ 251.2 $ 240.8 $ 193.4 Adjustments to reconcile net income to net cash provided by operating activities (77.4) 330.7 310.7 309.3 Net cash provided by operating activities 495.0 581.9 551.5 502.7 Cash Flows from Investing Activities Collections of receivables 45.2 27.6 13,644.9 11,111.5 Proceeds from sales of financing receivables 1,542.9 2,789.1 Proceeds from maturities and sales of marketable securities 46.4 43.6 Proceeds from sales of equipment on operating leases .1 1.3 398.6 436.3 Proceeds from sales of businesses 22.5 50.1 Cost of receivables acquired (8.0) (8.8) (16,123.3) (13,273.2)Purchases of marketable securities (88.6) (78.1)Purchases of property and equipment (181.0) (225.8) (4.3) (3.5)Cost of operating leases acquired (2.8) (4.9) (330.9) (425.2)Acquisitions of businesses, net of cash acquired (10.6) (7.3) (8.1)Decrease (increase) in receivables with unconsolidated affiliates (40.4) 45.8 Other 4.1 37.3 (10.0) (117.9) Net cash provided by (used for) investing activities (130.5) (130.5) (964.7) 520.3 Cash Flows from Financing Activities Increase (decrease) in short-term borrowings (113.4) (61.8) 617.2 (958.1)Change in intercompany receivables/payables (13.1) 12.7 (574.3) (581.3)Proceeds from long-term borrowings 7.4 711.4 2,849.7 2,880.7 Principal payments on long-term borrowings (12.5) (81.5) (2,159.3) (2,192.1)Proceeds from issuance of common stock 41.5 39.7 Repurchases of common stock (.4) (1.2) Dividends paid (157.8) (156.5) (123.7) (363.0)Other (1.4) (1.6) Net cash provided by (used for) financing activities (249.7) 461.2 609.6 (1,213.8) Effect of Exchange Rate Changes on Cash
31.9 11.9 3.63.5
Net Increase (Decrease) in Cash and Cash Equivalents (187.2)Cash and Cash Equivalents at Beginning of Period 3,429.3 2,098.6 176.3 574.7
146.7 916.1 208.3
Cash and Cash Equivalents at End of Period $ 3,576.0 $ 3,014.7 384.6 $ 387.5 $ * Deere & Company with Financial Services on the equity basis.
The supplemental consolidating data is presented for informational purposes. Transactions between the “Equipment Operations” and “Financial Services” have been eliminated to arrive at the consolidated financial statements.
20

Item 12 DisclosureDeere & Company
Other Financial Information
Equipment Operations Agricultural Equipment Commercial and Consumer
Equipment Construction & Forestry For the Nine Months Ended July 31, Other Equipment Dollars in millions 2002 2003 2002 2003 2002 2003 2003 2002 2003 2002Net Sales $ 8,756 $ 4,960 $ 2,555 2,154 9,974 $ 5,392 $ $ $ 1,997 $ 30
Identifiable Assets With Inventories at LIFO 6,077 6,336 $ 3,020 $ 1,521
$ 1,601 $ 41Average
$ $ 3,284 $ 1,541 $ $ 1,446 $ 1,442 $ $ 7,035 3,612 $
70 89 With Inventories at Standard Cost $ $ 7,251 $ $ 3,850 1,751 $ 1,708 $ 1,602 1,604
$ $ $ $ $ 70 $ 89
Operating Profit (Loss) 669 329 329 $ 362 $ 237 $ 97 $ 111 (97) $ (8) $ (33) % % % % % 4.5% % (6.1 (26.7 (80.5
11.0 5.2 % % 7.7 % (37.1)%
ard Cost 9.5 4.5 6.9 )% $ $ (653 $ (325) $ (347) $ )
$ Percent of Net Sales 6.7 3.8 6.1 7.3 9.3 5.6 )% )% )% Operating Return on Assets With Inventories at LIFO With Inventories at Stand
% %
%%
10.99.1
%%
11.09.4
15.4 6.4%%
%%
(6.7(6.0
)%)%
(11.4)% 13.5
(158%)
5.7 (11.4 (37.1)%SVA Cost of Assets (633) ) $ (154 $ (144) ) )
$ (324 4 15 $ 79 $ $ (144 $ (6 $ (8)
SVA 36 $ ) $ $ (57) $ (33) ) )
$ (241) $
(14 $
(41
For the Nine Months Ended July 31, Financial Services Dollars in millions 2003 2002 Net Income Average Equity
$ 2
11.216.1
$ 306 wance for Doubtful Receivables 61
367 $
Doubtful Receivables
$ $
241,160
$ 193
$ $ 2,130
9.1
Return on Equity % %%
SVA Return on SVA Average Equity 16.8
372%
Operating Profit Change in Allo
$ $
$18
390 $
$SVA Income Average Equity Average Allowance for
$ 2,160
2,130 $ 158 $ 154
SVA Average Equity $ 2,318(328
$ 2,284 Cost of Equity
A $ )
2$ (328)
9
SV
6
The Company evaluates its business results on the basis of generally accepted accounting principles. In addition, it uses a metric referred to as Shareholder Value Added (SVA), which management believes is an appropriate measure for the performance of its businesses. SVA is, in effect, the pretax profit left over after subtracting the cost of enterprise capital. The Company is aiming for a sustained creation of SVA and is using this metric for various performance goals. Certain compensation is also determined on the basis of performance using this measure. For purposes of determining SVA, each of the equipment segments is assessed a pretax cost of assets, which on an annual basis is 12 percent of the segment’s average identifiable operating assets during the applicable period with inventory at standard cost. Management believes that valuing inventories at standard cost more closely approximates the current cost of inventory and the Company’s investment in the asset. Financial Services is assessed a pretax cost of equity, which on an annual basis is approximately 19 percent of its average equity during the period excluding the allowance for doubtful receivables. The cost of assets or equity, as applicable, is deducted from the operating profit or added to the operating loss of the equipment segments or Financial Services to determine the amount of SVA. For this purpose, the operating profit of Financial Services is net income before income taxes and changes to the allowance for doubtful receivables. The average equity and operating profit of Financial Services is adjusted for the allowance for doubtful receivables in order to more closely reflect credit losses on a write-off basis. To create SVA using metrics relevant to their daily operations, the Company’s equipment segments are targeting an annual operating return on operating assets (OROA) of 20 percent at normal sales volumes, and other returns at other points in the cycle. For purposes of this OROA calculation, operating assets consist of average identifiable assets during the applicable period with inventory at standard cost. Refer to Deere & Company’s annual report on Form 10-K for additional information.
3
21