deep density networks and uncertainty in …
TRANSCRIPT

Under review as a conference paper at ICLR 2018
DEEP DENSITY NETWORKS AND UNCERTAINTY INRECOMMENDER SYSTEMS
Anonymous authorsPaper under double-blind review
ABSTRACT
Building robust online content recommendation systems requires learning com-plex interactions between user preferences and content features. The field hasevolved rapidly in recent years from traditional multi-arm bandit and collabora-tive filtering techniques, with new methods integrating Deep Learning models thatenable to capture non-linear feature interactions. Despite progress, the dynamicnature of online recommendations still poses great challenges, such as finding thedelicate balance between exploration and exploitation. In this paper we provide anovel method, Deep Density Networks (DDN) which deconvolves measurementand data uncertainties and predicts probability density of CTR (Click ThroughRate), enabling us to perform more efficient exploration of the feature space. Weshow the usefulness of using DDN online in a real world content recommendationsystem that serves billions of recommendations per day, and present online andoffline results to evaluate the benefit of using DDN.
1 INTRODUCTION
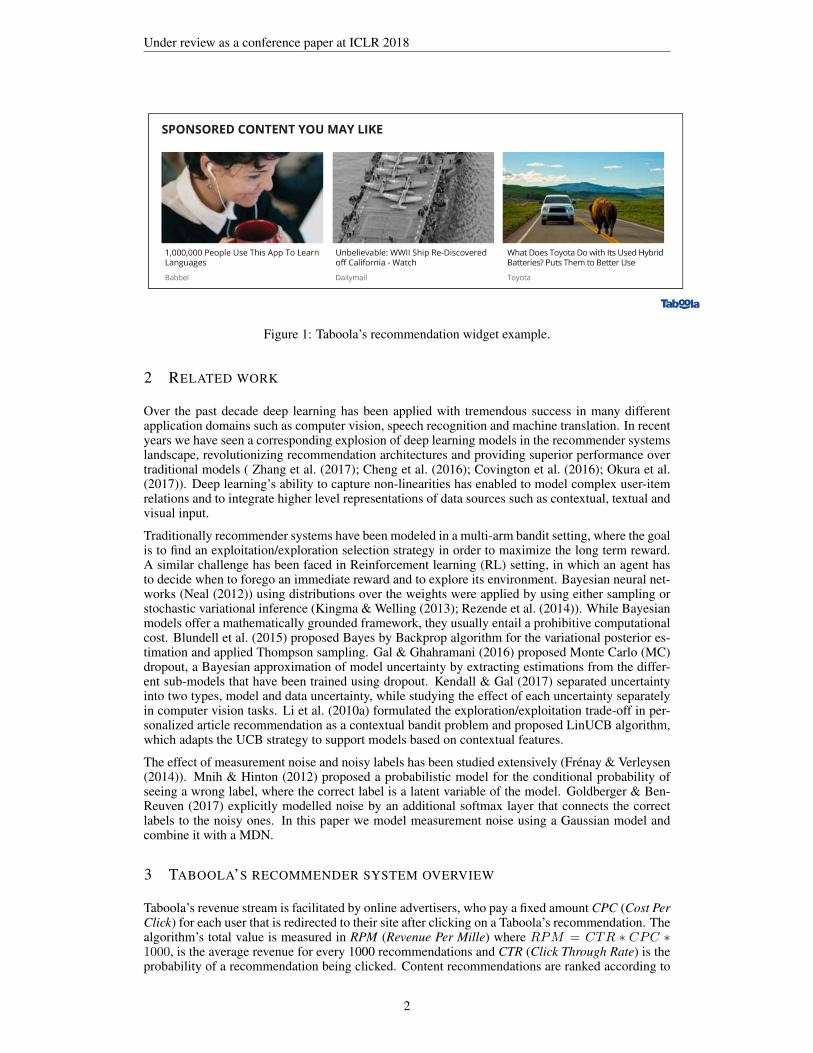
In order to navigate the vast amounts of content on the internet, users either rely on active searchqueries, or on passive content recommendations. As the amount of the content on the internetgrows, content discovery becomes an increasingly crucial challenge, shaping the way content isconsumed by users. Taboola’s content discovery platform aims to perform ”reverse search”, usingcomputational models to match content to users who are likely to engage with it. Taboola’s contentrecommendations are shown in widgets that are usually placed at the bottom of articles (see Fig. 1)in various websites across the internet, and serve billions of recommendation per day, with a userbase of hundreds of millions of active users.
Traditionally recommender systems have been modeled in a multi-arm bandit setting, in which thegoal is to a find a strategy that balances exploitation and exploration in order to maximize the longterm reward. Exploitation regimes try to maximize the immediate reward given the available in-formation, while exploration seeks to extract new information from the feature space, subsequentlyincreasing the performance of the exploitation module.
One of the simplest approaches to deal with multi-arm bandit problems is the ε-greedy algorithm, inwhich with probability ε a random recommendation is chosen, and with probability 1− ε the recom-mendation with the highest predicted reward is chosen. Upper Confidence Bound -UCB- (Auer et al.(2002)) and Thompson sampling techniques (Thompson (1933)) use prediction uncertainty estima-tions in order to perform more efficient exploration of the feature space, either by explicitly addingthe uncertainty to the estimation (UCB) or by sampling from the posterior distribution (Thompsonsampling). Estimating prediction uncertainty is crucial in order to utilize these methods. Online rec-ommendations are noisy and probabilistic by nature, with measured values being only a proxy to thetrue underlying distribution, leading to additional interesting challenges when predicting uncertaintyestimations.
In this paper we present DDN, a unified deep neural network model which incorporates both mea-surement and data uncertainty, having the ability to be trained end-to-end while facilitating the ex-ploitation/exploration selection strategy. We introduce a mathematical formulation to deconvolvemeasurement noise, and to provide data uncertainty predictions that can be utilized to improveexploration methods. Finally, we demonstrate the benefit of using DDN in a real world contentrecommendation system.
1
Under review as a conference paper at ICLR 2018
Figure 1: Taboola’s recommendation widget example.
2 RELATED WORK
Over the past decade deep learning has been applied with tremendous success in many differentapplication domains such as computer vision, speech recognition and machine translation. In recentyears we have seen a corresponding explosion of deep learning models in the recommender systemslandscape, revolutionizing recommendation architectures and providing superior performance overtraditional models ( Zhang et al. (2017); Cheng et al. (2016); Covington et al. (2016); Okura et al.(2017)). Deep learning’s ability to capture non-linearities has enabled to model complex user-itemrelations and to integrate higher level representations of data sources such as contextual, textual andvisual input.
Traditionally recommender systems have been modeled in a multi-arm bandit setting, where the goalis to find an exploitation/exploration selection strategy in order to maximize the long term reward.A similar challenge has been faced in Reinforcement learning (RL) setting, in which an agent hasto decide when to forego an immediate reward and to explore its environment. Bayesian neural net-works (Neal (2012)) using distributions over the weights were applied by using either sampling orstochastic variational inference (Kingma & Welling (2013); Rezende et al. (2014)). While Bayesianmodels offer a mathematically grounded framework, they usually entail a prohibitive computationalcost. Blundell et al. (2015) proposed Bayes by Backprop algorithm for the variational posterior es-timation and applied Thompson sampling. Gal & Ghahramani (2016) proposed Monte Carlo (MC)dropout, a Bayesian approximation of model uncertainty by extracting estimations from the differ-ent sub-models that have been trained using dropout. Kendall & Gal (2017) separated uncertaintyinto two types, model and data uncertainty, while studying the effect of each uncertainty separatelyin computer vision tasks. Li et al. (2010a) formulated the exploration/exploitation trade-off in per-sonalized article recommendation as a contextual bandit problem and proposed LinUCB algorithm,which adapts the UCB strategy to support models based on contextual features.
The effect of measurement noise and noisy labels has been studied extensively (Frenay & Verleysen(2014)). Mnih & Hinton (2012) proposed a probabilistic model for the conditional probability ofseeing a wrong label, where the correct label is a latent variable of the model. Goldberger & Ben-Reuven (2017) explicitly modelled noise by an additional softmax layer that connects the correctlabels to the noisy ones. In this paper we model measurement noise using a Gaussian model andcombine it with a MDN.
3 TABOOLA’S RECOMMENDER SYSTEM OVERVIEW
Taboola’s revenue stream is facilitated by online advertisers, who pay a fixed amount CPC (Cost PerClick) for each user that is redirected to their site after clicking on a Taboola’s recommendation. Thealgorithm’s total value is measured in RPM (Revenue Per Mille) where RPM = CTR ∗ CPC ∗1000, is the average revenue for every 1000 recommendations and CTR (Click Through Rate) is theprobability of a recommendation being clicked. Content recommendations are ranked according to
2

Under review as a conference paper at ICLR 2018
Figure 2: High level overview of candidation and ranking architecture.
their predicted RPM; recommendations with the highest predicted RPM will be shown to the user.Taboola’s main algorithmic challenge is to provide an estimate of the CTR in any given context.
Taboola’s recommendation engine needs to provide recommendations within strict time constraints(< 50ms). It is infeasable to rank millions of recommendations in that time frame; in order tosupport this we have partitioned the system into a two-step process, candidation and ranking (seeFig. 2). During the candidation phase, we narrow down the list of possible recommendations to thou-sands based on their RPM prediction in a specific context. CTR prediction in this setting is based onfeatures such as the creative of recommendations (text and image) and empirical click statistics. Thisrelatively small list of recommendations is written to distributed databases in worldwide data cen-ters, and are re-calculated by Taboola’s servers continuously throughout the day. When the frontendservers get a request for recommendations from the browser, they retrieve the relevant ready-maderecommendation list, and perform an additional ranking of the recommendations based on additionaluser features using a DNN, further personalizing recommendations. This system architecture showssimilarities to (Cheng et al. (2016)).
The dynamic nature of Taboola’s marketplace means that our algorithm constantly needs to evaluatenew recommendations, with tens of thousands of new possible recommendations every day. Tosupport this, we split the algorithm into exploration and exploitation modules. The exploitationmodule aims to choose the recommendations that maximize the RPM, while the exploration moduleaims to enrich the dataset available for exploitation models by showing new recommendations.
In this paper we focus on the candidation phase and the corresponding CTR prediction task, leavingout of this scope the second ranking step.
4 DEEP DENSITY NETWORK AND UNCERTAINTY
In this section we present Deep Density Network (DDN) and describe its ability to deconvolvemeasurement noise and integrate it with data uncertainty in a unified model. Employing uncertaintyduring the training phase can be interpreted as loss attenuation, making our model more robustto noisy data. In addition, accurate uncertainty estimations enable us to employ more efficientexploitation/exploration selection strategies as discussed below.
4.1 DEEP ARCHITECTURE
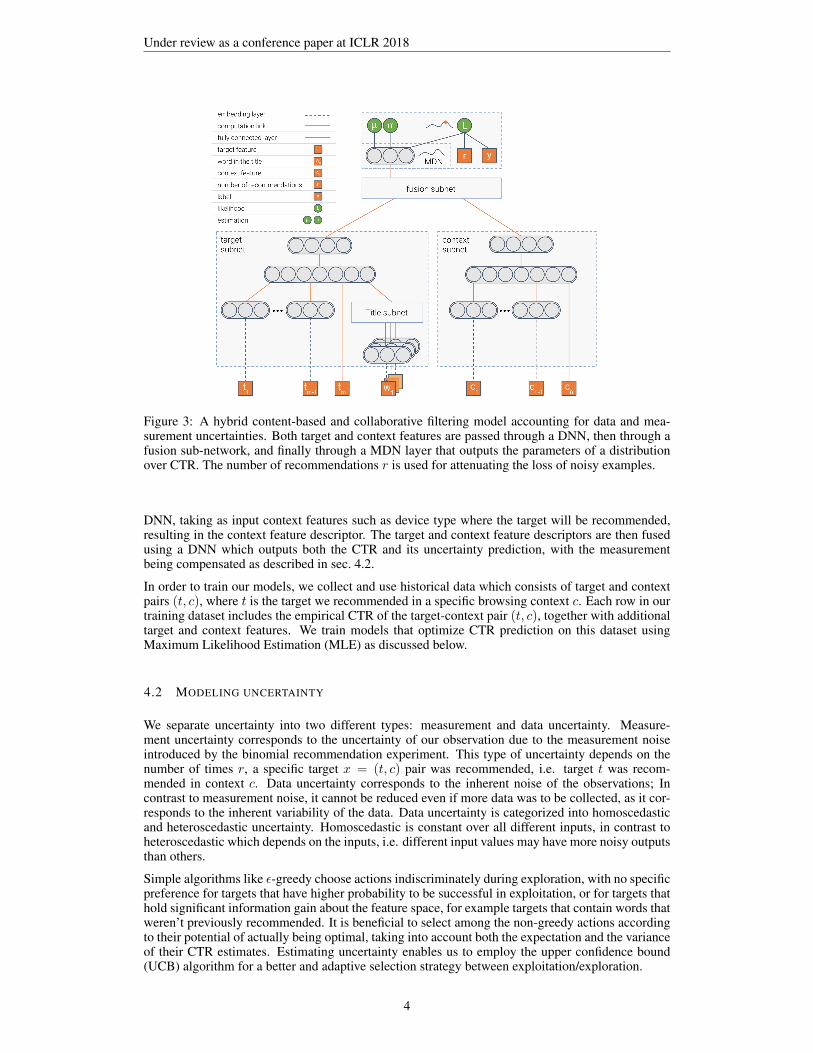
Our deep recommender model is a hybrid of a content-based and a collaborative filtering (CF) rec-ommendation system. A high level overview is depicted in Fig. 3. We use two separate subnetswhich model the target and the context features. The target subnet receives as input the contentfeatures seen by the user and additional features such as the recommendation age which are unseento the user. The categorical features are passed through an embedding layer and concatenated alongwith the numerical features, followed by fully connected layers with a RELU activation function.The result is the target feature descriptor. Similarly, the context features are modeled using a separate
3
Under review as a conference paper at ICLR 2018
Figure 3: A hybrid content-based and collaborative filtering model accounting for data and mea-surement uncertainties. Both target and context features are passed through a DNN, then through afusion sub-network, and finally through a MDN layer that outputs the parameters of a distributionover CTR. The number of recommendations r is used for attenuating the loss of noisy examples.
DNN, taking as input context features such as device type where the target will be recommended,resulting in the context feature descriptor. The target and context feature descriptors are then fusedusing a DNN which outputs both the CTR and its uncertainty prediction, with the measurementbeing compensated as described in sec. 4.2.
In order to train our models, we collect and use historical data which consists of target and contextpairs (t, c), where t is the target we recommended in a specific browsing context c. Each row in ourtraining dataset includes the empirical CTR of the target-context pair (t, c), together with additionaltarget and context features. We train models that optimize CTR prediction on this dataset usingMaximum Likelihood Estimation (MLE) as discussed below.
4.2 MODELING UNCERTAINTY
We separate uncertainty into two different types: measurement and data uncertainty. Measure-ment uncertainty corresponds to the uncertainty of our observation due to the measurement noiseintroduced by the binomial recommendation experiment. This type of uncertainty depends on thenumber of times r, a specific target x = (t, c) pair was recommended, i.e. target t was recom-mended in context c. Data uncertainty corresponds to the inherent noise of the observations; Incontrast to measurement noise, it cannot be reduced even if more data was to be collected, as it cor-responds to the inherent variability of the data. Data uncertainty is categorized into homoscedasticand heteroscedastic uncertainty. Homoscedastic is constant over all different inputs, in contrast toheteroscedastic which depends on the inputs, i.e. different input values may have more noisy outputsthan others.
Simple algorithms like ε-greedy choose actions indiscriminately during exploration, with no specificpreference for targets that have higher probability to be successful in exploitation, or for targets thathold significant information gain about the feature space, for example targets that contain words thatweren’t previously recommended. It is beneficial to select among the non-greedy actions accordingto their potential of actually being optimal, taking into account both the expectation and the varianceof their CTR estimates. Estimating uncertainty enables us to employ the upper confidence bound(UCB) algorithm for a better and adaptive selection strategy between exploitation/exploration.
4

Under review as a conference paper at ICLR 2018
We estimate both the mean payoff µt and the standard deviation σt of each target t and select thetarget that achieves the highest UCB score, where a is a tunable parameter:
A = argmaxt
(µt + a · σt) (1)
Our marketplace is defined by a very high recommendation turnover rate, with new content beinguploaded everyday and old one becoming obsolete. Probabilistic modeling of the data uncertaintyassists us in using the exploration model in order to sample targets that have the highest potentialvalue, by employing the UCB strategy.
In contrast to the variance captured by data uncertainty, model uncertaintiy corresponds to what themodel ”knows” about the feature space. Gal & Ghahramani (2016) show that model uncertaintycan capture the confidence about different values in the feature space. This however comes at aprohibitive computational cost when calculated using dropout. We explore the feature space bysetting to Out Of Vocabulary (OOV) categorical feature values which have been shown less than aminimal threshold. As shown in Fig.4, OOV values indeed get larger uncertainty estimations.
4.2.1 INTEGRATING MEASUREMENT NOISE
In order to deconvolve the data and measurement uncertainties we explicitly model them together.Let Y , Y ∗ and ε be three random variables given x = (t, c). Y corresponds to observed CTR, afterrecommending (t, c) pair, r times. Y ∗ corresponds to the true/clean CTR without the measurementnoise, i.e. the observed CTR had we recommended t infinite times in c. ε corresponds to the binomialnoise error distribution.
Y = Y ∗ + ε(2)
We are modelling data uncertainty by placing a distribution over the output of the model and learningit as a function of the different inputs. To this end, we are using Mixture Density Network (MDN),which employ a Gaussian Mixture Model (GMM) to model Y ∗ (Bishop (1994)).
Y ∗ ∼∑i
αiN (µi, σ2i ) (3)
For every input the MDN model predicts the coefficients of the GMM; These are the mixing co-efficients, αi, µi and σi, from which we estimate the expected value and the standard deviation ofY ∗.
The measurement uncertainty ε corresponds to the measurement noise distribution which we ap-proximate with a Gaussian distribution:
ε ∼ N (0, σ2ε ) (4)
Due to the fact that data noise is small given x, we enforce constant σε = f(µ, r) for every y∗|xwhere µ is the expected value of y∗|x. In this way, Y ∗ |= ε given x, as σε depends only on r and µ.We can rewrite eq. 2 using eq. 3 and 6 to:
Y ∼∑i
αiN (µi, σ2i + σ2
ε ) (5)
This enables us to deconvolve and model both data and measurement uncertainties, using a singlemodel which combines MDN and a Gaussian model. Given this probability estimation, the trainingprocess uses SGD for minimizing the loss:
L = − log(P (y|x)) (6)
5 EXPERIMENTS
5.1 DATA AND MODELS
Data: For the purpose of this paper we use the browsed website (i.e. publisher) as the user context.In all of the experiments we used three months of historical data, containing ∼10M records of
5

Under review as a conference paper at ICLR 2018
Figure 4: Ratio of estimated σ, before and after feature values are set to OOV. Dashed vertical linesare the median values.
Dataset MDN DDN ImprovementD1 0.2681 0.25368 5.3%D2 0.25046 0.24367 2.7 %
Table 1: Relative improvement in the MSE between MDN and DDN when trained over two datasetsthat differ by the amount of measurement noise.
target-publisher pairs. The dataset contains ∼ 1M unique targets and ∼10K unique publishers.Every experiment has been run on multiple time slots to validate that the results were statisticallysignificant.
Models: We have experimented with the following models:
1. REG is a regression model that outputs a point estimate of the CTR where the loss is the MSEbetween the actual and the predicted CTR.
2. MDN is a model that estimates the distribution over the CTR utilizing a mixture of Gaussians(see sec. 4.2.1).
3. DDN is a model that estimates the distribution over the CTR combining the data and measurementuncertainties (see sec. 4.2.1).
In order to have a fair comparison, we tuned the hyper-parameters (e.g. embedding sizes, numberof layers, number of mixtures) for each model separately; we performed thousands of iterations ofrandom search, and chose the parameters that yielded the best results.
5.2 METRICS AND EVALUATION
We evaluate our models using Mean Square Error (MSE). Due to the dynamic nature of onlinerecommendations it is crucial that we evaluate our models online within an A/B testing framework,by measuring the average RPM of models across different publishers. In addition we utilize anonline throughput metric which aims to capture the effectiveness of the exploration mechanism.Prior works have put an effort on how to measure exploration; Li et al. (2010b) built an offlinesimulator that enabled them to test different models to see which one achieves target coverage faster.This is not feasible in our case given the large turnover rate in the recommendation pool. Instead,we use the following targets throughput metric.
Let < ti, pi > be the set of target-publisher pairs that accumulated enough data to achieve empiricbinomial statistical significance in a given day. A model is said to be contributing to < ti, pi >if it has recommended ti in pi in the previous day more times than a predefined threshold. Ourthroughput metric is defined by the number of targets that a specific model contributed to this set.
6

Under review as a conference paper at ICLR 2018
Model REG MDN DDNRPM lift 0% 1.2% 2.9%
Table 2: A comparison of the online RPM lift between the different models.
a 0 0.5 1 1.5RPM lift 0% -0.05% -0.2% -0.3%
Throughput lift 0% 6.5% 9.1% 11.7%
Table 3: RPM lift vs targets throughput as a function of different values of c.
5.3 EXPERIMENTAL RESULTS
Feature importance: Understanding the parameters of deep learning networks poses a significantchallenge compared to linear and tree based models. We utilize the fact that our models output a fulldistribution rather than a point estimate to evaluate feature importance. In our analysis, we evaluatethe effect on the σ prediction when a feature is ”hidden” from the model during inference, by settingit to OOV. For each feature, we calculate statistics over the ratio σoov/σ, between the predicted σbefore and after setting it to OOV.
In Fig. 4 we observe that the analyzed features have a large impact on data uncertainty. The medianvalues of the various features are greater than one, validating our assumption that feature values thatdid not appear in the training data will obtain a higher uncertainty estimation. In addition, we see adistinct ordering of feature importance, where new advertisers yield a larger ratio than new targets.Using σ in a UCB setting (as in equation 1) will prioritize new targets, especially ones from newadvertisers - a desired behaviour both in terms of information gain and advertiser satisfaction.
Measurement noise: In Table 1 we compare the MDN and DDN models by training them on twodifferent datasets, D1 and D2. D1 differs from D2 by the amount of noise in the training samples;D1 contains noisy data points with relatively small amount of empirical data, while D2 containsexamples with higher empirical statistical significance. We observe that DDN improves on MDNperformance by 2.7% when using D1 for training, and by 5.3% when using D2. This validates thatintegrating measurement noise into our modeling is crucial when the training data contains verynoisy samples, by attenuating the impact of measurement noise on the loss function. (see sec. 4.2.1)
Model comparison: In Table 2 we compare the three different models discussed previously in termsof online RPM. We observe that DDN is the best performing model, outperforming MDN and REGby 1.7% and 2.9% respectively. These results verify once again that the loss attenuation achieved byDDN during training has enabled it to converge to better parameters, generalizing better to unseenexamples.
RPM lift vs. targets throughput: We analyzed the effect of the parameter a found in 1. From atheoretical standpoint, increasing this value is supposed to prioritize higher information gain at theexpense of RPM, by choosing targets that the model is uncertain about. This trade-off is worthwhilein the long term. In Table 3 we observe that there is an inverse correlation between RPM andthroughput which is triggered by different values of a, with targets throughput increasing by 11.7%when setting a = 1.5. Choosing the right trade-off is an application specific concern, and we chosethe trade-off induced by a = 0.5, resulting in a good throughput gain with a small RPM cost.
6 CONCLUSIONS
We have introduced Deep Density Network (DDN), a unified DNN model that is able to predictprobability distributions and to deconvolve measurement and data uncertainties. DDN is able tomodel non-linearities and capture complex target-context relations, incorporating higher level rep-resentations of data sources such as contextual and textual input. We have shown the added valueof using DNN in a multi-arm bandit setting, yielding an adaptive selection strategy that balancesexploitation and exploration and maximizes the long term reward. We presented results validat-ing DDN’s improved noise handling capabilities, leading to 5.3% improvement on a noisy dataset.
7

Under review as a conference paper at ICLR 2018
Furthermore, we observed that DDN outperformed both REG and MDN models in online experi-ments, leading to RPM improvements of 2.9% and 1.7% respectively. Finally, by employing DDN’sdata uncertainty estimation and UCB strategy, we improved our exploration strategy, depicting 6.5%increase of targets throughput with only 0.05% RPM decrease.
REFERENCES
Peter Auer, Nicolo Cesa-Bianchi, and Paul Fischer. Finite-time analysis of the multiarmed banditproblem. Machine learning, 47(2-3):235–256, 2002.
Christopher M Bishop. Mixture density networks. Technical report, 1994.
Charles Blundell, Julien Cornebise, Koray Kavukcuoglu, and Daan Wierstra. Weight uncertainty inneural networks. arXiv preprint arXiv:1505.05424, 2015.
Heng-Tze Cheng, Levent Koc, Jeremiah Harmsen, Tal Shaked, Tushar Chandra, Hrishi Aradhye,Glen Anderson, Greg Corrado, Wei Chai, Mustafa Ispir, et al. Wide & deep learning for rec-ommender systems. In Proceedings of the 1st Workshop on Deep Learning for RecommenderSystems, pp. 7–10. ACM, 2016.
Paul Covington, Jay Adams, and Emre Sargin. Deep neural networks for youtube recommendations.In Proceedings of the 10th ACM Conference on Recommender Systems, pp. 191–198. ACM, 2016.
Benoıt Frenay and Michel Verleysen. Classification in the presence of label noise: a survey. IEEEtransactions on neural networks and learning systems, 25(5):845–869, 2014.
Yarin Gal and Zoubin Ghahramani. Dropout as a bayesian approximation: Representing modeluncertainty in deep learning. In international conference on machine learning, pp. 1050–1059,2016.
Jacob Goldberger and Ehud Ben-Reuven. Training deep neural-networks using a noise adaptationlayer. In ICLR, 2017.
Alex Kendall and Yarin Gal. What uncertainties do we need in bayesian deep learning for computervision? arXiv preprint arXiv:1703.04977, 2017.
Diederik P Kingma and Max Welling. Auto-encoding variational bayes. arXiv preprintarXiv:1312.6114, 2013.
Lihong Li, Wei Chu, John Langford, and Robert E Schapire. A contextual-bandit approach topersonalized news article recommendation. In Proceedings of the 19th international conferenceon World wide web, pp. 661–670. ACM, 2010a.
Wei Li, Xuerui Wang, Ruofei Zhang, Ying Cui, Jianchang Mao, and Rong Jin. Exploitation andexploration in a performance based contextual advertising system. In Proceedings of the 16thACM SIGKDD international conference on Knowledge discovery and data mining, pp. 27–36.ACM, 2010b.
Volodymyr Mnih and Geoffrey E Hinton. Learning to label aerial images from noisy data. InProceedings of the 29th International Conference on Machine Learning (ICML-12), pp. 567–574,2012.
Radford M Neal. Bayesian learning for neural networks, volume 118. Springer Science & BusinessMedia, 2012.
Shumpei Okura, Yukihiro Tagami, Shingo Ono, and Akira Tajima. Embedding-based news rec-ommendation for millions of users. In Proceedings of the 23rd ACM SIGKDD InternationalConference on Knowledge Discovery and Data Mining, pp. 1933–1942. ACM, 2017.
Danilo Jimenez Rezende, Shakir Mohamed, and Daan Wierstra. Stochastic backpropagation andapproximate inference in deep generative models. arXiv preprint arXiv:1401.4082, 2014.
William R Thompson. On the likelihood that one unknown probability exceeds another in view ofthe evidence of two samples. Biometrika, 25(3/4):285–294, 1933.
8

Under review as a conference paper at ICLR 2018
Shuai Zhang, Lina Yao, and Aixin Sun. Deep learning based recommender system: A survey andnew perspectives. arXiv preprint arXiv:1707.07435, 2017.
9