deeltijds beroepsgericht onderwijs en de …
TRANSCRIPT

DEELTIJDS BEROEPSGERICHT ONDERWIJS EN DE OVERGANG VAN SCHOOL NAAR WERK: EEN DYNAMISCHE ANALYSE
Brecht Neyt, Dieter Verhaest, en Stijn Baert
DEELTIJDS BEROEPSGERICHT ONDERWIJS EN DE OVERGANG VAN SCHOOL NAAR WERK: EEN DYNAMISCHE ANALYSE
Brecht Neyt, Dieter Verhaest, & Stijn Baert
Promotoren: Dieter Verhaest en Stijn Baert
Research paper SONO/2018.OL1.7/3
Gent, 29/10/2018

Het Steunpunt Onderwijsonderzoek is een samenwerkingsverband van UGent, KU Leuven, VUB, UA en ArteveldeHogeschool.
Gelieve naar deze publicatie te verwijzen als volgt: Neyt, B., Verhaest, D., & Baert S. (2018) Deeltijds beroepsgericht onderwijs en de overgang van school naar werk: een dynamische analyse. Steunpunt Onderwijsonderzoek, Gent
Voor meer informatie over deze publicatie [email protected]
Deze publicatie kwam tot stand met de steun van de Vlaamse Gemeenschap, Ministerie voor Onderwijs en Vorming.
In deze publicatie wordt de mening van de auteur weergegeven en niet die van de Vlaamse overheid. De Vlaamse overheid is niet aansprakelijk voor het gebruik dat kan worden gemaakt van de opgenomen gegevens.
© 2018 STEUNPUNT ONDERWIJSONDERZOEK
p.a. Coördinatie Steunpunt Onderwijsonderzoek UGent – Vakgroep Onderwijskunde Henri Dunantlaan 2, BE 9000 Gent
Deze publicatie is ook beschikbaar via www.steunpuntsono.be
1
Voorwoord
Deze studie meet de impact van het instromen in deeltijds beroepsgericht secundair onderwijs in
Vlaanderen met betrekking tot gekwalificeerde uitstroom en eerste arbeidsmarktuitkomsten. Ze
draagt bij tot de internationale wetenschappelijke literatuur door een dynamisch econometrisch
model te schatten, waarbij opeenvolgende onderwijs- en arbeidsmarktuitkomsten gemodelleerd
worden en gecontroleerd wordt voor niet-waarneembare verschillen tussen scholieren die al dan
niet instromen in deeltijds beroepsgericht secundair onderwijs. In lijn met de eerdere,
internationale literatuur wordt gevonden dat scholieren die instromen in de leertijd sneller
werkzaam zijn na het schoolverlaten en sneller een vast contract bemachtigen (in vergelijking met
verder gelijkaardige scholieren). Daar staat tegenover dat na het starten in de leertijd er vaker
ongekwalificeerde uitstroom is. Beide effecten worden niet teruggevonden voor het instromen in
een DBSO-opleiding (deeltijds beroepssecundair onderwijs).

2
Inhoud
Voorwoord 1
Inhoud 2
Beleidssamenvatting 3
Bijlage: wetenschappelijk artikel 6
3
Beleidssamenvatting
Wereldwijd overtreft de werkloosheidsgraad van jongeren die van niet-jongeren, wat een
gebrekkige overgang van school naar werk suggereert. Een mogelijke manier om deze transitie te
verbeteren, is door school en werk dichter bij elkaar te brengen, bijvoorbeeld door het aanbieden
van (deeltijds) beroepsgericht onderwijs. Eerder onderzoek naar beroepsgericht onderwijs toont
aan dat dit soort onderwijs, in vergelijking tot (voltijds) algemeen onderwijs, leidt tot meer
tewerkstelling en hogere lonen aan het begin van de carrière. Een mogelijke verklaring voor dit
voordeel van beroepsgericht onderwijs is dat de afgestudeerde jongere met haar/zijn
beroepsspecifieke kennis en vaardigheden meteen kan bijdragen aan de productiviteit van de
werkgever. Dit geldt in het bijzonder voor beroepsopleidingen met een sterke
werkleerplekcomponent, omdat op die manier gefocust wordt op die vaardigheden die gevraagd
worden op de arbeidsmarkt. Bovendien kan deze werkleerplekcomponent dienstdoen als
“screeningmechanisme”: werkgevers kunnen jongeren in een leercontract “uittesten” om hen
nadien vast in dienst te nemen. Echter, het kortetermijnvoordeel van een focus op specifieke kennis
en vaardigheden slaat mogelijk om in een nadeel op lange termijn omwille van drie redenen. Ten
eerste veroudert, zeker in tijden van snelle technologische vooruitgang, de beroepsspecifieke
kennis van jongeren uit beroepsgericht onderwijs snel. Ten tweede is deze beroepsspecifieke
kennis sterk gevoelig aan de vraag naar deze specifieke kennis op de arbeidsmarkt. Ten derde komt
beroepsgerichte vorming in de plaats van algemene vorming, waar meer gefocust wordt op
cognitief, probleemoplossend, en kritisch denken. Deze afname in algemene vorming kan ervoor
zorgen dat het vermogen tot levenslang leren voor jongeren uit het (deeltijds) beroepsgericht
onderwijs beperkter is, wat hun kansen op de arbeidsmarkt in hun latere carrière hypothekeert.
De uitgevoerde studie onderzoekt specifiek de impact van de beroepsopleidingen uit het stelsel
van Leren en Werken in Vlaanderen voorafgaand aan de hervorming van 2008 op de kans op
gekwalificeerde uitstroom uit het onderwijs en de tewerkstellingskansen tijdens de eerste vijf jaar
na het verlaten van het onderwijs.
De studie draagt ook op drie manieren bij tot eerdere literatuur rond dit onderwerp. Ten eerste
vergelijkt deze studie twee types beroepsgericht onderwijs met elkaar binnen hetzelfde
institutioneel kader: de leertijd en het DBSO (deeltijds beroepssecundair onderwijs). Het grootste
verschil tussen deze twee types onderwijs is dat de leertijd meer aangedreven wordt vanuit de
bedrijfswereld, terwijl dat in het DBSO meer door de school (via het Centrum voor Deeltijds
Onderwijs) gebeurt. Daarnaast is het belang van de werkleerplekcomponent in de leertijd in
principe groter (vier dagen per week in de leertijd in vergijking met drie dagen per week in het
DBSO). Onze tweede bijdrage is veeleer methodologisch van aard. Voor de eerste keer in deze
literatuur wordt een dynamisch discretekeuzemodel aangewend om causale effecten te schatten.
Cruciaal hierbij is dat gecorrigeerd wordt voor individuele kenmerken die niet waarneembaar zijn
in de longitudinale SONAR-data. Ten derde maakt deze studie een onderscheid tussen het directe
en indirecte effect van de beroepsopleidingen uit het stelsel van Leren en Werken op het
arbeidsmarktsucces. Het indirecte effect is te wijten aan het effect van de instroom in deze

4
programma’s op de kans om een kwalificatie te behalen in het secundair onderwijs, wat op zijn
beurt de arbeidsmarktuitkomsten beïnvloedt. Het directe effect meet de impact van de leertijd en
het DBSO los van dit indirecte effect. Dit is een belangrijk onderscheid, gezien deze stelsels een
alternatief bieden voor jongeren die niet gemotiveerd zijn om klassiek voltijds onderwijs te volgen
en hen toelaten om alsnog een kwalificatie van het secundair onderwijs te behalen.
In deze studie wordt gebruik gemaakt van de SONAR-data, op basis van longitudinale bevragingen
van 9000 Vlamingen geboren in 1976, 1978 en 1980. De beschrijvende statistieken van deze data
leggen een duidelijk verschil tussen scholieren in het klassieke voltijds onderwijs en de
programma’s die leren en werken combineren bloot. De latere groep bevat meer jongens, jongeren
met een migratieachtergrond en jongeren met minder hoog opgeleide ouders. Bovendien lopen
jongeren in deeltijds onderwijs voordien meer vertraging op in zowel het primair als secundair
onderwijs en dienen ze vaker hun jaar over te doen, een bevestiging van het belang van het
controleren voor observeerbare en niet-observeerbare verschillen tussen jongeren in het stelsel
van Leren en Werken en jongeren in voltijds onderwijs.
In lijn met de eerdere, internationale literatuur wordt gevonden dat scholieren die instroomden in
de leertijd (voor de hervorming van 2008) sneller werkzaam waren na het schoolverlaten en sneller
een vast contract bemachtigden (in vergelijking met verder gelijkaardige scholieren). Dit effect
werd gedreven door de mannelijke scholieren in de Vlaamse data. Daar staat tegenover dat na het
starten van de leertijd er vaker ongekwalificeerde uitstroom was. Hoewel de resultaten voor
jongeren uit het DBSO met werkleerplekervaring in dezelfde richting wijzen, zijn de geschatte
effecten minder groot en statistisch niet significant. Een mogelijke verklaring voor deze bevinding
is dat het kortetermijnvoordeel van de leertijd toegeschreven kan worden aan de hogere focus op
werkplekleren en dus ook op specifieke vaardigheden in dit programma. Vermits jongeren alleen
maar in de leertijd kunnen instromen wanneer ze een werkleerplek hebben gevonden, wordt de
leertijd mogelijk ook vaker als screeningsinstrument gebruikt.
Wat de impact van de leertijd op de initiële arbeidsmarktkansen betreft, is de evaluatie van de
leertijd (voor de hervorming van 2008) dus vrij positief. Ook jongeren die het DBSO combineerden
met een werkleerplek scoorden op dit vlak minstens evengoed als jongeren uit het voltijds
secundair onderwijs. Wel suggereert het onderzoek dat de programma’s in het stelsel van Leren en
Werken van voor 2008 niet effectief waren in het reduceren van de ongekwalificeerde uitstroom.
Tot slot is het ook belangrijk om te benadrukken dat deze studie geen uitspraken kan doen over de
effecten op de arbeidsmarktkansen van de geanalyseerde individuen in de periode na de eerste vijf
jaar op de arbeidsmarkt.
Deze beleidsreflecties dienen voorzichtig benaderd te worden. De geanalyseerde data kunnen
immers in zekere zin omschreven worden als “historische data”. Enerzijds was de hervorming van
2008 van de stelsels substantieel. Bij deze hervorming werd de afstemming tussen beide
programma’s vergroot en de doelstelling naar voren geschoven om, meer dan vroeger, een
beroepsgericht traject op maat van elke jongere aan te bieden en elke jongere een volwaardige
kwalificatie aan te reiken. Op basis van deze doelstelling zou dan ook kunnen verwacht worden dat
de weergegeven effecten een ondergrens voor de effecten anno 2018 vormen. Anderzijds is ook
de sociologische context veranderd sinds de bestudeerde individuen de trajecten doorliepen in de
jaren ’90. Ongekwalificeerde uitstroom werd sindsdien teruggedrongen en er vond een hogere

5
doorstroom vanuit het (regulier) technisch secundair onderwijs richting het hoger onderwijs plaats.
Het is onduidelijk in welke richting deze veranderde context de gemeten effecten zou beïnvloed
hebben. We kijken dan ook uit naar het toepassen van onze methode op meer recentere data –
eventueel gerealiseerd door het koppelen van administratieve data – wat ons zou toelaten om ook
de oorzakelijke impact van deeltijds onderwijs na de hervorming van 2008 in kaart te brengen.

6
BIJLAGE: WETENSCHAPPELIJK ARTIKEL
7
The Impact of Apprenticeship
Programs on Early Labour Market
Outcomes: A Dynamic Approach
By Brecht Neyt,i Dieter Verhaest,ii and Stijn Baertiii
Abstract
This study examines the impact of inflowing into dual apprenticeship
programs in secondary education on six early employment outcomes. Our
contribution to the literature is threefold. First, we estimate the effects of
two distinct types of dual programs that combine part-time school based
instruction with an apprenticeship in a firm within the same, Belgian
secondary education framework. Second, these effects are identified by
estimating a dynamic model, capturing subsequent educational and labour
market outcomes, to control for the dynamic selection of students into dual
programs. Third, this approach enables us to distinguish between the
programs’ direct effects (conditional on educational achievement) and
indirect effects (via educational achievement). We find evidence for short-
term labour market advantages but only for the program with the most days
of in-field training.
Keywords: Vocational education; transitions in youth; dynamic selection;
education; labour.
JEL-codes: I21; I26; J21.
i Corresponding author. Ghent University, Sint-Pietersplein 6, 9000 Ghent, Belgium. [email protected].
+32499164992
ii KU Leuven, Ghent University, and GLO.
iii Ghent University, Research Foundation—Flanders, University of Antwerp, Université catholique de Louvain, IZA,
GLO, and IMISCOE.
8
Introduction
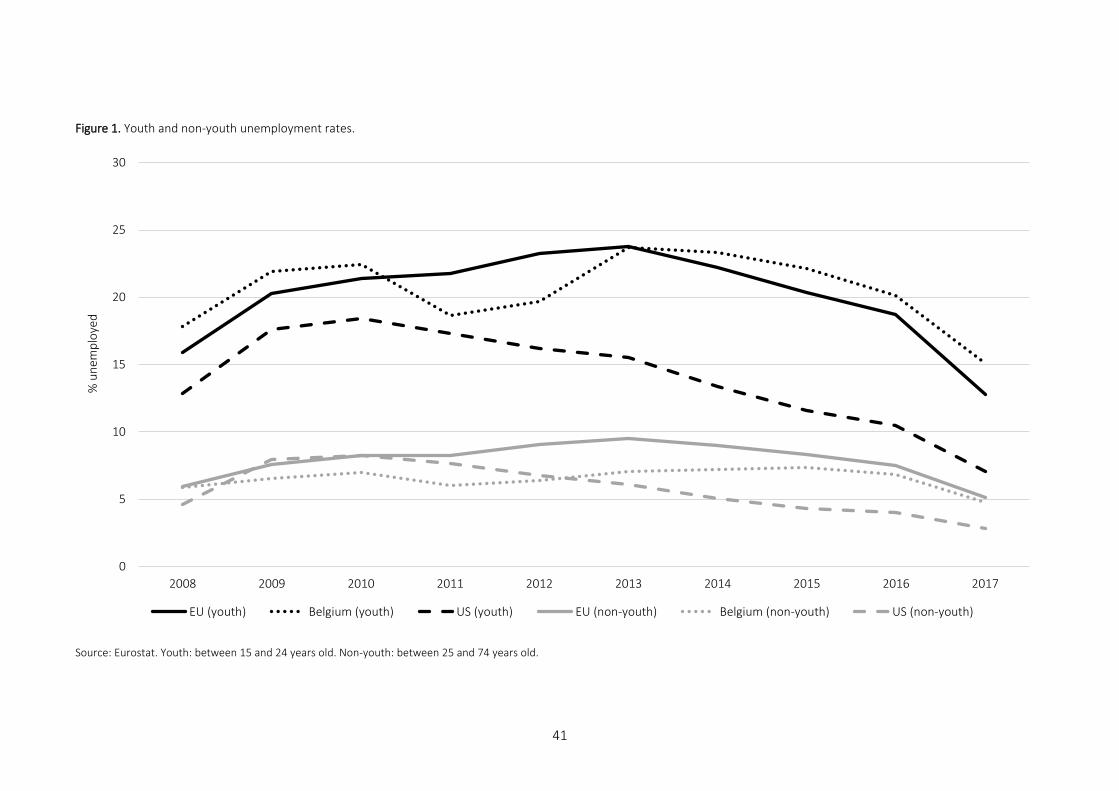
Worldwide, youth unemployment rates greatly exceed unemployment rates of non-youth.1
For example, Figure 1 clearly shows that the youth unemployment rates in the EU-28, Belgium
(the country from which we analyse data), and the US are consistently higher compared to
the unemployment rates of non-youth. These imbalances indicate a rather poor transition
from school to the labour market for youngsters in these economies. Therefore not
surprisingly, improving the smoothness of this transition is a key ambition of many OECD
countries (van de Werfhorst, 2014).
<Figure 1 about here>
One potential way of pursuing this is by more closely linking education to the labour
market, for example by encouraging students to enrol in vocational education and
apprenticeship programs (Zimmerman et al., 2013). By completing vocational education and,
in particular, participating in work-based learning through apprenticeship training, students
gain ready to use skills which immediately increase their employability when they enter the
labour market (Hanushek et al., 2017). Moreover, apprenticeships may even provide
immediate access to a job if employers use them as a screening device (Wolter and Ryan,
2011). But for three main reasons, this advantage when first entering the labour market might
decrease (and even turn into a disadvantage) over time. First, the occupation-specific skills
gathered in vocational education may quickly become obsolete (“external depreciation of
human capital”; Weber, 2014). This might be especially true today, with automation and
1 The youth unemployment rate is calculated as the ratio between the unemployed in the age group of 15 to 24
years old and the total labour force (employed and unemployed, i.e. youth in education excluded) for that age
group. The non-youth unemployment rate is measured as the ratio between the unemployed in the age group 25
to 74 years old and the total labour force (employed and unemployed) for that age group.
9
digitalisation leading to rapid technological change (Hampf and Woessman, 2017; Krueger
and Kumar, 2004). Second, occupation-specific skills are highly sensitive to changes in the
labour demand, so that their premiums might not be robust to these changes (Goldsteyn and
Stenberg, 2014). Third, vocational education comes at the cost of less general education,
which focuses more on cognitive skills, problem solving, and critical thinking. A lower
development of these skills is expected to decrease students’ potential for lifelong learning
and learning on-the-job, so that students in vocational education are expected to be less
capable of adapting to changing labour market conditions, and, therefore, less employable in
the long run (Hanushek et al., 2017; Weber, 2014).
Recent research has empirically investigated this trade-off between short-term
advantages and long-term disadvantages of vocational education. Several studies have
indeed found that the positive short-term effect on the probability of finding a job after
leaving school turns into a negative effect over time (Forster et al., 2016; Hampf and
Woessman, 2017; Hanushek et al., 2017; Lavrijsen and Nicaise, 2017). Additionally, Brunello
and Rocco (2017) find that the short-term advantages in terms of employment of vocational
education decrease over time, but their results however do not indicate a negative effect
later. Furthermore, the trade-off between short term advantages and long term
disadvantages of vocational education has also been found in studies that look at the effect
of vocational education on earnings (Cörvers et al., 2011; Goldsteyn and Stenberg, 2014;
Laurijssen and Glorieux, 2017; Lavrijsen and Nicaise, 2017) and on the quality of the match in
terms of attained and required skills (Verhaest et al., 2018). Finally, some of these studies also
concluded that both the initial advantage and the extent to which this advantage diminishes
over time is more pronounced in countries like Germany or Denmark, which are characterised
by a dual system in which students combine one or two weekly days of school-based learning
10
with an apprenticeship of three or four weekly days at a firm (Forster et al., 2016; Hampf and
Woessman, 2017; Hanushek et al., 2017; Verhaest et al., 2018).
The present study adds to this previous literature examining the trade-off between the
short-term advantages and long-term disadvantages of vocational education in three ways.
First, in the present study, we directly compare the effectiveness of two distinct VET
(Vocational Education and Training) programs that combine part-time school based
instruction with an apprenticeship in a firm within the same institutional setting. In most
previous studies, a comparison between different vocational education programs was done
only by comparing the effect of vocational education between countries with different
vocational education systems (Forster et al., 2016; Hampf and Woessman, 2017; Hanushek
et al., 2017; Verhaest et al., 2018). As a consequence, it cannot be ruled out that the diverging
effects of the programs might be driven by other forms of heterogeneity between these
countries.2 In contrast, in the present study, we compare the effect of two types of
apprenticeship programs in terms of obtaining a secondary education qualification and the
transition from these programs to the regular labour market. While the first program includes
more hours of workplace learning and, as in traditional dual system countries like in Germany,
gives a more profound role to employers in the organisation and design of the program, the
second program is much more school-led and also allows students to participate as a part-
time student in case they do not manage to find a workplace for their apprenticeship. As such,
our study also contributes to the discussion on the optimal design of dual programs in general
2 One other study indirectly evaluated the labour market effects of alternative types of apprenticeship programs.
By evaluating a reform of the Italian apprenticeship system, Albanese et al. (2017) recently concluded that bringing
the system closer the German system—mainly by increasing the importance of on-the-job training—improved the
employment chances and wages in the first few years after the expiration of the apprenticeship contract. However,
in contrast with our study, Albanese et al. (2017) did not test whether this new apprenticeship program fares
better than other, non-apprenticeship programs.

11
and dual apprenticeship programs in particular.
Second, we are the first to estimate a dynamic model that corrects for the dynamic
selection of students into the dual programs. That is, we estimate a dynamic discrete choice
model, in which subsequent educational and early labour market outcomes are explained,
based on observed and unobserved characteristics. To this end, unique longitudinal data are
exploited.
Third, we are novel in distinguishing between the direct and indirect effect of
apprenticeship programs with respect to first labour market outcomes. While the former
effect is conditional on students’ academic achievement, the latter one goes via the effect of
inflowing in dual programs on educational attainment. This distinction is an important one
given that the practical focus in vocational programs may motivate certain students that
would otherwise have dropped out, to leave school with a secondary education qualification
(Bishop and Mane, 2004; Eichhorst et al., 2012; Grubb and Lazerson, 2005; Hanushek et al.,
2017).
The remainder of this study is organised as follows. In the next section, we discuss the
investigated dual programs within the context of education in Flanders. Next, we discuss the
data and econometric model that we use to estimate the relationship between dual programs
and first labour market outcomes. In Section 5, the results of our analyses are presented. We
end this article with a brief conclusion including policy recommendations and suggestions for
future research.

12
Institutional Setting
In this section, we discuss some crucial characteristics of the education system in Flanders, as
this is the region from where we got our data. In Flanders, there is compulsory education
starting from September 1st of the year in which the child turns 6, until their 18th birthday or
until June 30th of the year in which the child turns 18, whichever comes first. Full-time
education is compulsory until the age of 16 or until the age of 15 when they already
completed the first two years of secondary education. From that moment on, students are
allowed to start dual programs, which consist of learning on a part-time basis at a school or
training centre that may be combined with an apprenticeship in a firm or organisation.
There are two types of dual programs and apprenticeships in Flanders. First, students
can enrol in part-time vocational education (‘Deeltijds Beroepssecundair Onderwijs’), which
is organised by Centres for Part-time Education (CPE). In this program, students follow classes
in a CPE for two days a week. The remaining three days they are either employed as an
apprentice or follow a preliminary phase in a Centre for Part-time Training (PTE) to develop
their attitudes and skills before starting employment. The CPE’s are often affiliated to a
secondary education school and are governed by one of the educational providers that also
govern standard schools. Therefore, we will label the programs offered at these institutions
as school-based dual programs. Based on whether students combine classes with an
apprenticeship, we will distinguish between school-based dual programs with apprenticeship
and school-based dual programs without apprenticeship.
Second, students can choose to start the so-called leertijd (literally translated “Training
Time”), an apprenticeship-based program which is organised by the Flemish Agency for
Entrepreneurial Training (SYNTRA) and is recognised by the Flemish government. In these

13
programs, which we will refer to as training centre-based dual programs with apprenticeship,
students follow theoretical training in a SYNTRA training centre for one day a week, consisting
of four hours of general education and four hours of vocational training. The four remaining
days they follow practical training with an employer. Having an employer that is willing to
instruct them is therefore a necessary condition that should be met before students can start
in the program.
The main differences between students enrolled in school-based and training centre-
based dual programs are that in the latter, the practical training is more intensive and
employer organisations take relatively more the lead in the organisation and design of the
programs. Moreover, unlike with the school-based dual programs, enrolment is only allowed
for students who manage to secure an apprenticeship at a firm.
Students who complete full-time education are unconditionally allowed to start tertiary
education. In contrast, students who complete dual programs get a secondary education
qualification but are not allowed to enrol in tertiary education programs.
Data
Sample
Our analyses are based on the SONAR data, which contain exceptionally rich data on
education and labour market outcomes for Flemish youth. More concretely, SONAR includes
data on three cohorts of about 3,000 individuals born in 1976, 1978, and 1980. These
individuals were interviewed at age 23, age 26, and age 29. In this study, we use data on the
last two cohorts, as for these individuals we have uniform information on their school career
14
and labour market outcomes. To have a sample of pupils with a homogeneous education
background, we excluded students who (i) already experienced more than one year of
retention at the start of primary education, (ii) needed special help and were therefore in
special schools,3 and (iii) enrolled in a dual program for the first time after the end of
compulsory education. Additionally, we excluded students with erroneous or inconsistent
data. The final sample consists of 5541 individuals.
Exogenous Variables
In our econometric model, which we discuss in detail in Section 4, we use six strictly
exogenous background characteristics of the students. More specifically, we include students’
(i) gender, (ii) migration background, (iii) number of siblings, (iv and v) maternal and paternal
education level (in years of education after primary education), and (vi) day of birth within
the calendar year. The first five variables are standard and have also been included by other
researchers (Baert and Cockx, 2013; Cameron and Heckman, 2001; Belzil and Poinas, 2010).
The day of birth is included to control for relative age within the birth cohort, which is found
to positively affect cognitive and non-cognitive achievements in both the short- and long-
term (Angrist and Krueger, 1991; Baert and Cockx, 2013; Bedard and Dhuey, 2006; Fumarco
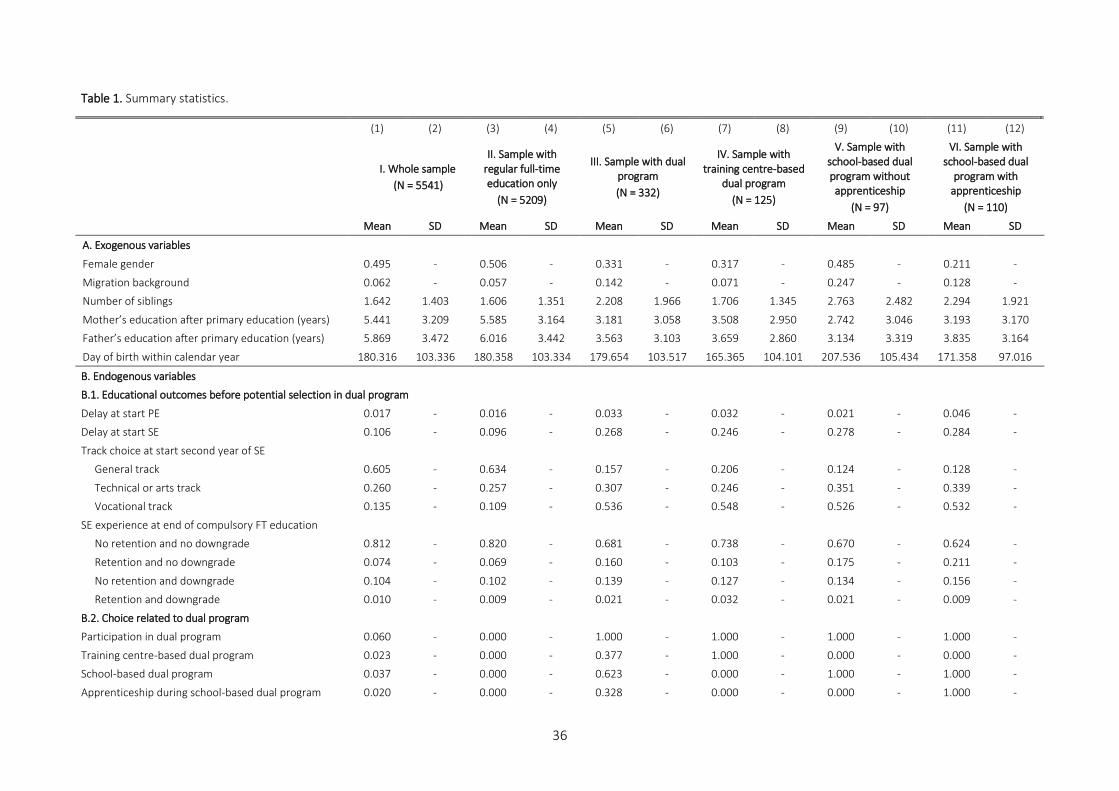
and Baert, 2017). The summary statistics of these variables can be found in Panel A of Table
1. When we compare students with regular full-time education only to students who inflowed
in a dual program, we see that boys, students with a migration background, and students with
a higher number of siblings are overrepresented within the latter sample.
3 Due to physical and/or mental disability, serious behavioural and/or emotional problems, or serious learning
difficulties.
15
<Table 1 about here>
Additional to these background characteristics, we include the unemployment rate at
the district level, in the year of the modelled outcomes (source: Public Employment Agency
of Flanders). This way, we aim to control for time-varying labour market conditions and (to
some extent) for the economic differences by region (and, thereby, family wealth).
Endogenous Variables
In our econometric model, we jointly model twelve outcomes. More specifically, we model
students’ (i) delay at the start of primary education, (ii) delay at the start of secondary
education, (iii) track choice in the second year of secondary education (either general track,
technical or arts track, or vocational track),4 and (iv) secondary education experience (in terms
of whether they experience study delay and/or downgrade)5 at the end of compulsory full-
time education. Additionally, we model (v) whether students enrolled in a dual program, and
(vi-vii) the kind of dual program (training centre-based versus school-based and with or
without apprenticeship in case of a school-based dual program). Finally, we also model
whether students (viii) obtained a secondary education qualification, (ix) enrolled in tertiary
education, and (x-xii) were employed three months, one year, and five years after leaving
school. In an alternative approach with respect to the first labour market outcomes, we model
4 Students have to make their track choice after successful completion of the first year of secondary education.
5 At the end of each academic year during secondary education, students receive an A, B, or C evaluation. Those
getting an A are promoted to the next education year. However, if they wish, they can downgrade the track. In
the present article, we define a downgrade as a transition from general secondary education to another track or
from technical or arts secondary education to vocational secondary education. Transitions in the opposite
direction are hardly observed. Students obtaining a C must repeat the education year and, if they wish, can
downgrade the track. Students with a B evaluation are forced to downgrade in case they want to be promoted to
the next education year (Cockx et al., in press).
16
whether students secured a permanent contract after leaving school (in comparison to be
either not employed or employed without permanent contract).
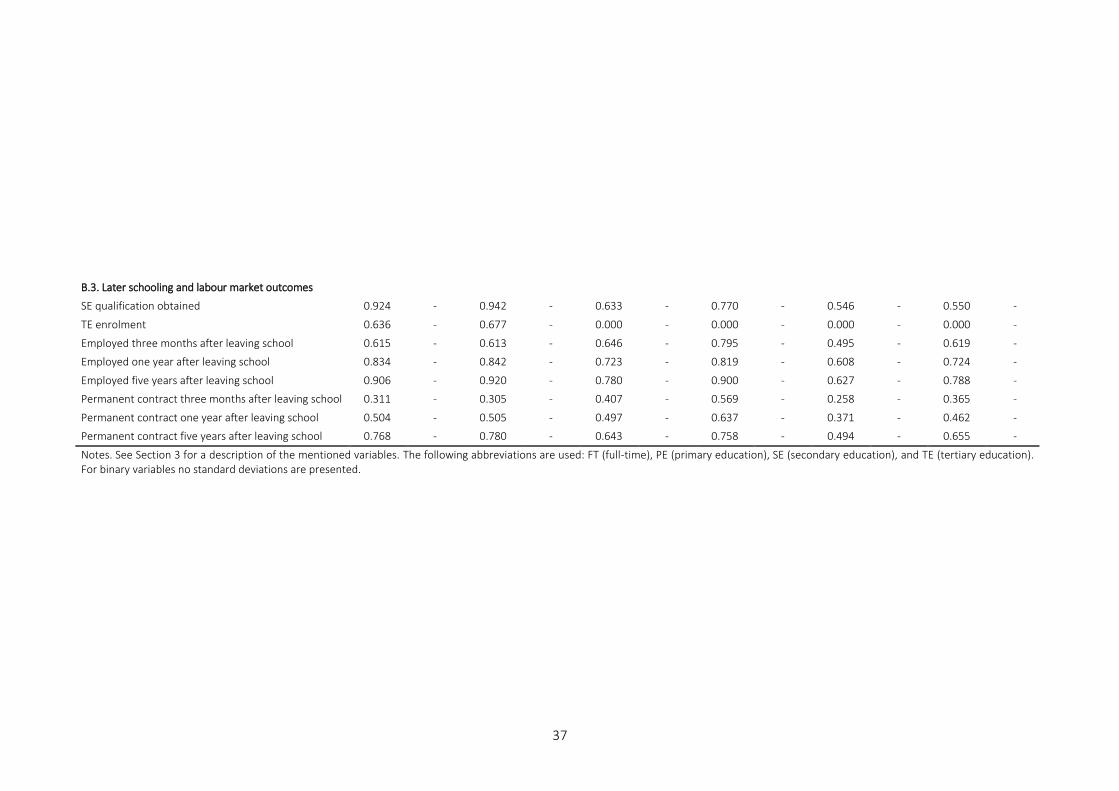
The descriptive statistics of these endogenous variables are given in Panel B of Table 1.
Comparing students in regular full-time education with students in a dual program, we see
indications that students in the latter group performed worse in school by the end of
compulsory full-time education. Indeed, they more often had a delay at the start of primary
and secondary education, were more delayed, and downgraded more.
Among the 5541 students observed in our full sample, 332 left regular full-time
secondary education for a dual program. Of the latter group, 37.7% (i.e. 125/332) opted for
a training centre-based dual program, while the remaining 62.3% opted for the school-based
dual program. These students in dual programs less often obtained a secondary education
qualification. When we look at transition to work success, students in dual programs more
often had a job three months after leaving school. Contrarily, they were less often employed
one year or five years after leaving school. This pattern is also observed when looking at the
alternative labour market outcome ‘permanent contract after leaving school’. These
observations are in line with the theoretical arguments outlined in Section 1 for dual
programs offering short-term advantages, at the cost of long-term disadvantages (Hanushek
et al., 2017).
Endogeneity Problem
By simply comparing the descriptive statistics for students in and out of dual programs, we
are, however, unable to deduce the causal impact of these programs on first labour market
outcomes. Indeed, the observed association may also be driven by observable or
unobservables differences between students in and out of dual programs.
17
The biggest barrier to estimating the causal relationship between dual programs and
transition to work success, is the presence of unobservable differences between students in
and out of dual programs (Ryan, 2001). Indeed—and in line with our discussion of Panel B.1.
of Table 1—several studies report that these programs are mostly attended by students with
lower ability and motivation (Altonji et al., 2012; Eichhorst et al., 2012; Malamud and Pop-
Eleches, 2010). This unobserved heterogeneity may yield a classic omitted variable problem:
as they may also impact labour market outcomes, naively estimated effects are unable to
distinguish between the effect of these unobservables and the effect of dual programs. In
addition, bias may be introduced by the dynamic sorting that takes place in the educational
progression. Cameron and Heckman (1998) show this formally. Intuitively, the latter bias is
brought about by the progressively growing negative correlation between observed
characteristics such as parental educational attainment and unobserved characteristics
because students with adverse observables realise successful outcomes only if their
unobserved endowments are sufficiently favourable. This biases the coefficients of
observables negatively and more so as one proceeds to higher grades (Baert and Cockx, 2013;
Cockx et al., in press).
In this study, we simultaneously model schooling outcomes up to the end of compulsory
full-time education, inflow into dual programs, and first labour market outcomes and control
for the unobservable differences between students. We outline this approach in more detail
in the next section.
18
Method
In this section, we present the econometric model used to estimate the causal impact of
leaving regular full-time secondary education for one of the two discussed dual programs on
later transition from school to work success. The added value of this approach is twofold.
First, it enables us to control for unobservable factors that influence both the enrolment of
students in dual programs and later employment outcomes. Second, this model allows us to
make a distinction between the direct effect of these dual programs (conditional on their
effect on the probability of obtaining a secondary education qualification, tertiary education
enrolment, and earlier labour market outcomes) and their indirect effect (through these
earlier outcomes).
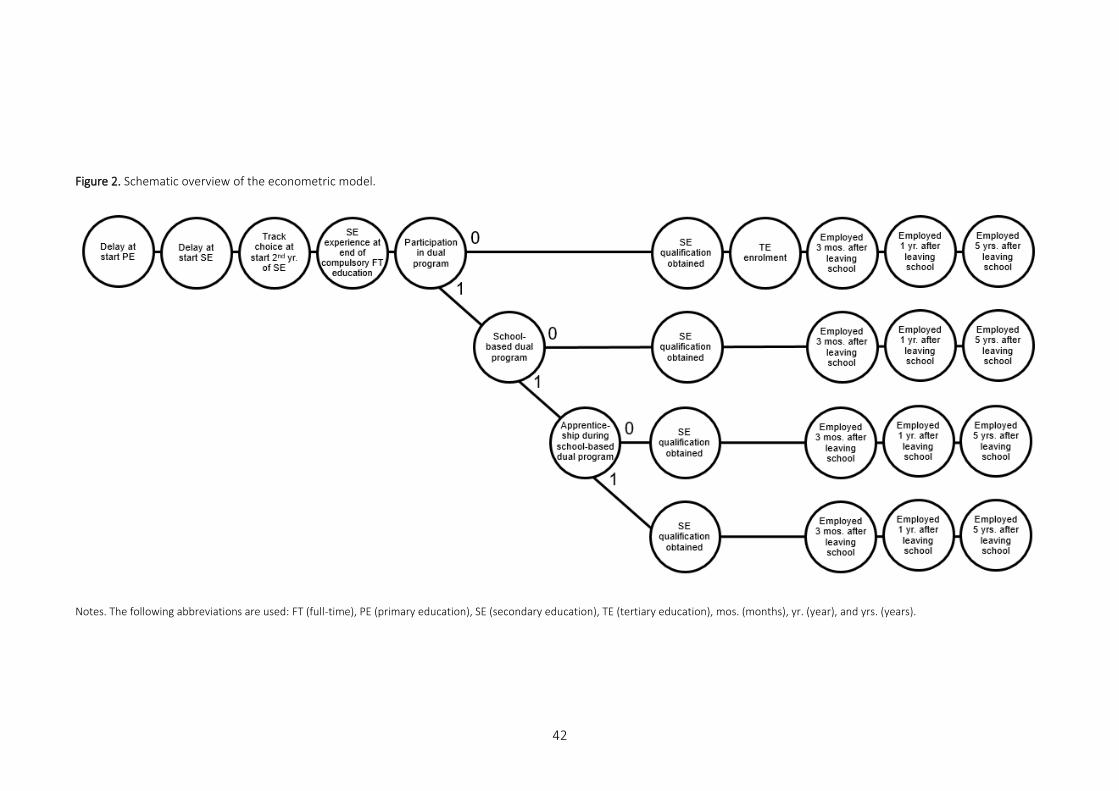
Dynamic Discrete Choice Model
We build on dynamic discrete choice models that were used in the past (Baert and Cockx,
2013; Baert et al., 2017; Cameron and Heckman, 1998, 2001; Cockx et al., in press). In line
with this literature, our model is a sequence of binary and multinomial probabilities. More
concretely, in our benchmark model, we jointly explain the twelve outcomes mentioned in
Section 3.3: (i) delay at the start of primary education, (ii) delay at the start of secondary
education, (iii) track choice at the start of the second year of secondary education, (iv)
secondary education experience at the end of full-time compulsory education, (v-vii) type of
dual program (if any), (viii) secondary education qualification, (ix) tertiary education
enrolment, and (x-xii) employment three months, one year, and five years after leaving
school. See Figure 2 for a schematic overview of this model. In an alternative model, the
impact of dual programs on the chances of securing a permanent contract is investigated. The
19
outcomes (x-xii) then become whether or not students had a permanent contract three
months, one year, and five years after leaving school.
<Figure 2 about here>
The choice set for a specific outcome, denoted by C
O, is a set of multinomial numbers:
C
O = {0,1,...,nO}, where nO defines the number of choices that can be made for outcome O
minus 1. With respect to outcome (iii), three outcome values are possible: general track
(outcome value 0), technical or arts track (outcome value 1), and vocational track (outcome
value 2). With respect to outcome (iv), four outcome values are possible: no retention and no
downgrade (outcome value 0), retention but no downgrade (outcome value 1), no retention
but downgrade (outcome value 2), and retention and downgrade (outcome value 3). All other
outcomes are binary in nature.
The optimal choice ĉOi of an individual i with respect to outcome O is the following:
O
1cO
c,iOc
OOi UifCcc (1),
where Oc,iU is the latent utility of choice c for outcome O, and O
c and O
1c are threshold
utilities (‘cut-off values’) that determine the ordered choice ( O0 and
O
1On ). In
line with the literature, we approximate this Oc,iU by a linear index:
Oc,i
OOi
OOi
Oi
Oc,i VβRZU
(2).
In this equation, iZ is a vector representing the exogenous variables as observed for individual
i, and OiR captures the unemployment rate at the district level at the moment of outcome O,
both of which are described in Section 3.2. OiV is the vector of endogenous outcomes that are
realised before outcome O, which are described in Section 3.3. O , Oβ , and O are the

20
vectors of associated parameters and Oc,i is unobservable from the researcher’s point of
view.
We follow Cameron and Heckman (2001) by assuming that Oc,i is characterised by a
factor structure. However, in line with the more recent literature (Carneiro et al., 2003; Cockx
et al., 2018; Fruehwirth et al., 2016; Heckman and Navarro, 2007), we generalise by allowing
that the factor “loadings” depend on our main treatment status (whether or not students
enrolled in a dual program) Pi:
O
cii
OOO
ci P ,, (3),
in which is a random effect, independent of Oc,i , and independent across people, which
captures unobserved determinants of the outcomes in the model. The outcome-specific
coefficients O and O are normalised to 1 for the first modelled outcome. Oc,i is the i.i.d.
error term, which is assumed to be logistically distributed.
As a consequence, we can write the probability of a particular outcome value as:
)VR(
)PVR(
)VR(
)PVR(VRcc
O
ci
OOO
i
O
i
O
c
O
cii
OOOO
i
O
i
O
c
O
ci
OOO
i
O
i
O
c
O
cii
OOOO
i
O
i
O
cO
i
O
i
O
i
,
OO
i
,
OO
i
,
OO
i1
,
OO
i1
i
βZexp1
βZexp
βZexp1
βZexp);,,,ZˆPr(
(4),
in which we denote the vector of unknown parameters by θ . The likelihood contribution
)θ;,V,R,Z( Oi
Oiii for any sampled individual, conditional on the unobservable , is then
constructed by the product of the probabilities of the choices realised in the data for the
twelve modelled outcomes.
Following the literature, we adopt a non-parametric discrete distribution for the
unobserved random variable . We assume that this distribution is characterised by an a
21
priori unknown number of K points of support k to which are assigned probabilities )q(pk
specified as logistic transforms:
0qand'q,...,q,qq;K,...2,1kwith
)qexp(
)qexp(qp 1K21K
1jj
kk
(5).
Hence, the unconditional individual likelihood contribution for individual i is:
K
1kk
Oi
Oiiik
Oi
Oiii )θ;,V,R,Z(qp)qθ,;V,R,Z(
(6).
As Cameron and Heckman (1998; 2001) show, identification of the random effect is
proven if our initial condition, i.e. delay at the start of primary education, is free of selection.
This means that should be independent of iZ and OiR .
Model Selection
We estimated the coefficients for the model presented in the previous subsection with a
maximum likelihood estimation following Gaure et al. (2007). Heterogeneity types were
gradually added until the log-likelihood value of the model failed to increase.
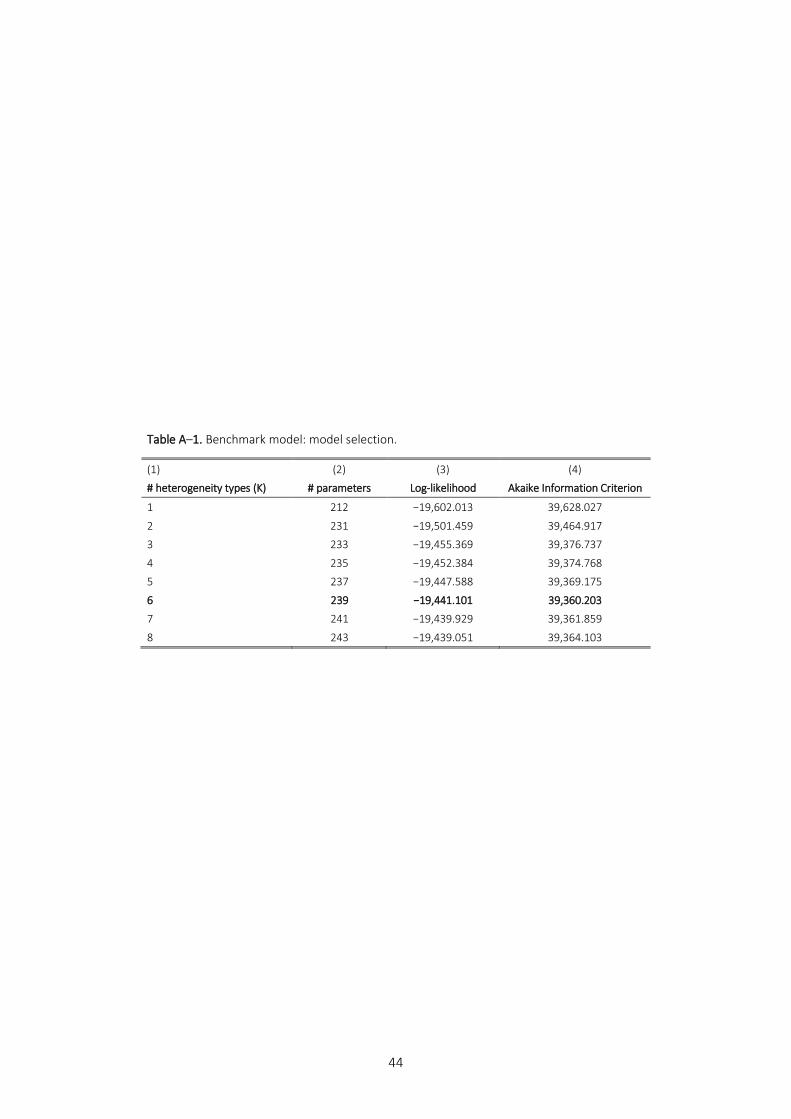
Table A–1 in Appendix A reports the number of parameters, the log-likelihood, and the
Akaike Information Criterion (AIC)6 values of the model according to the number of
heterogeneity types K included. The lowest AIC is obtained for K = 6. The coefficient estimates
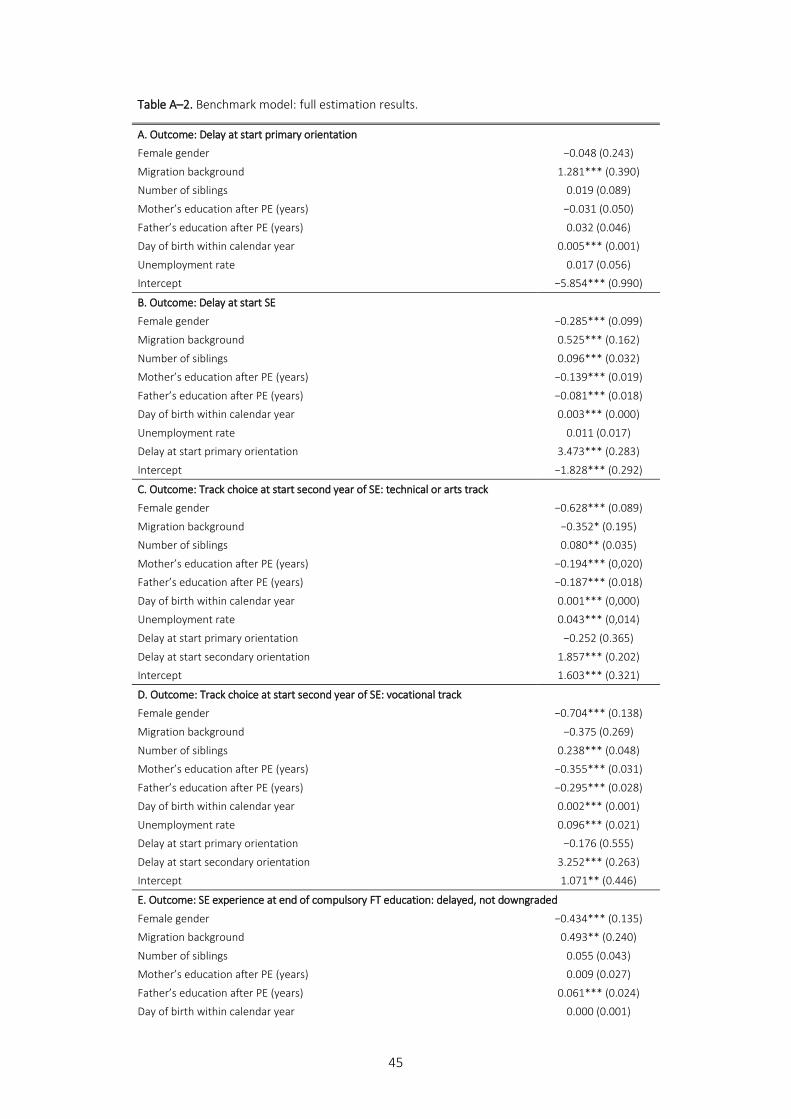
for this model are displayed in Table A–2. Unless otherwise stated, the simulations below are
based on these parameter estimates.
The coefficient estimates in Table A–2 provide further evidence that controlling for
6 Following the argument in Gaure et al. (2007), we believe that the AIC is the preferable criterion for our sample
size.
22
unobserved heterogeneity is important. First, the proportions of multiple heterogeneity types
are substantial (p1 = 40.1%, p2 = 6.0%, p3 = 35.4%, p4 = 16.5%, p5 = 0.9%, and p6 = 1.2%).7
Second, almost all (other) parameters of the unobserved heterogeneity distribution (i.e. all
k ’s and most O ’s) are highly significantly different from 0.
Simulation Strategy
Based on the estimated parameters for our preferred model, we simulate students’ schooling
career (among which their enrolment in dual programs) and early labour market outcomes.
To answer our research questions, we run these simulations under different scenarios with
respect to students’ enrolment in dual programs.
For each analysis, we randomly draw 999 vectors from the asymptotic normal distribution
of the preferred model’s parameters. Subsequently, in each of the 999 draws, the parameters
are used to calculate the probabilities associated with each heterogeneity type. These
probabilities are then used to randomly assign a heterogeneity type to each pupil in the
sample.8 Thereafter, based on these randomly drawn parameters and the assignment of
individuals to a heterogeneity type, the full sequence of schooling and labour market
outcomes is simulated for each student in the sample (for each draw).
More concretely, each outcome is simulated sequentially based on its (multinomial) logit
specification reported in Section 4.1. These specifications yield, for each individual in each
draw, a probability for each potential outcome value. These probabilities are then translated
7 For instance, following equation (5), p2 = exp(-1.899) / (exp(0) + exp(-1.899) + exp(-0.124) + exp(-0.887) + exp(-
3.787) + exp(-3.538)).
8 As we assume that observables and unobservables are orthogonal at the start of our model (supra, Section 4.1),
we have no way of knowing which individual belongs to a specific heterogeneity type.
23
to segments on the unit interval. To determine the particular outcome value for each
individual in each draw, a random number is generated from the standard uniform
distribution. The outcome value assigned to the individual depends on the segment in which
this random number falls. Once an outcome is assigned, it is saved and conditioned upon for
the subsequent outcomes.
In the sequel, the model prediction of a particular outcome refers to the average of these
999 replications. The 95% confidence intervals are constructed by choosing the appropriate
percentiles of the 999 simulated probabilities.
Goodness of Fit
To determine the benchmark model’s goodness of fit, for each endogenous variable we
compared the actual probability (as observed in our data) with the simulated probability (as
estimated by our model). As can be seen from Table A–3 and Figure 3, the simulated
probabilities are closely distributed around the actual probabilities. Only for the outcome
‘Employed five years after leaving school’, the simulated probability deviates significantly (on
the 5% confidence level) from the actual probability. Nonetheless, also for this outcome the
simulated probability approaches the actual probability quite well in economic terms (i.e. the
probabilities are 0.923 and 0.906, respectively).
<Figure 3 about here>
Average Treatment Effects
To answer our research questions, we simulated, following the strategy presented in the
former subsection, two series of Average Treatment Effects (ATEs): one for the treatment
24
‘training centre-based dual program’ and one for the treatment ‘school-based dual program
with apprenticeship’. As in a school-based dual program without apprenticeship there is no
real work component (supra, Section 2), we do not report the ATEs for this program. These
results for this treatment are available on request.
The ATEs are a combination of Average Treatment effects on the Treated (ATTs) and
Average Treatment effects on the Non-Treated (ATNTs). ATTs were based on the simulated
outcomes of individuals who were assigned to the treatment of a certain dual program given
a particular parameter draw. Similarly, for individuals who were assigned to no treatment, we
calculated the ATNTs. First, the ATT for a certain treatment is calculated for each outcome of
interest (and for each of the 999 parameter draws) as follows:
𝑎𝑣𝑒𝑟𝑎𝑔𝑒 𝑜𝑢𝑡𝑐𝑜𝑚𝑒 𝑎𝑐𝑟𝑜𝑠𝑠 𝑡𝑟𝑒𝑎𝑡𝑒𝑑 𝑖𝑛𝑑𝑖𝑣𝑖𝑑𝑢𝑎𝑙𝑠
𝑎𝑣𝑒𝑟𝑎𝑔𝑒 𝑜𝑢𝑡𝑐𝑜𝑚𝑒 𝑎𝑐𝑟𝑜𝑠𝑠 𝑡𝑟𝑒𝑎𝑡𝑒𝑑 𝑖𝑛𝑑𝑖𝑣𝑖𝑑𝑢𝑎𝑙𝑠, 𝑖𝑛 𝑡ℎ𝑒 𝑐𝑜𝑢𝑛𝑡𝑒𝑟𝑓𝑎𝑐𝑢𝑡𝑎𝑙 𝑜𝑓 𝑛𝑜 𝑡𝑟𝑒𝑎𝑡𝑚𝑒𝑛𝑡 (7).
The counterfactual outcomes were realised by forcing all indicator variables for treatment
(i.e. participation in dual program, school-based dual program, and apprenticeship during
school-based dual program) to 0 for each treated individual. Second, the ATNT is calculated
for each outcome of interest as follows:
𝑎𝑣𝑒𝑟𝑎𝑔𝑒 𝑜𝑢𝑡𝑐𝑜𝑚𝑒 𝑎𝑐𝑟𝑜𝑠𝑠 𝑢𝑛𝑡𝑟𝑒𝑎𝑡𝑒𝑑 𝑖𝑛𝑑𝑖𝑣𝑖𝑑𝑢𝑎𝑙𝑠, 𝑖𝑛 𝑡ℎ𝑒 𝑐𝑜𝑢𝑛𝑡𝑒𝑟𝑓𝑎𝑐𝑢𝑡𝑎𝑙 𝑜𝑓 𝑡𝑟𝑒𝑎𝑡𝑚𝑒𝑛𝑡
𝑎𝑣𝑒𝑟𝑎𝑔𝑒 𝑜𝑢𝑡𝑐𝑜𝑚𝑒 𝑎𝑐𝑟𝑜𝑠𝑠 𝑢𝑛𝑡𝑟𝑒𝑎𝑡𝑒𝑑 𝑖𝑛𝑑𝑖𝑣𝑖𝑑𝑢𝑎𝑙𝑠 (8).
In this case, the counterfactual outcomes in case of treatment were realised by forcing the
indicator variables for treatment to the appropriate status. More concretely, in the
counterfactual situation of a training centre-based dual program only variable ‘participation
in dual program’ was forced to 1, while in the counterfactual situation of a school-based dual
program with apprenticeship also ‘school-based dual program’ and ‘apprenticeship during
school-based dual program’ were forced to 1, for each untreated individual. Third, the ATE is
realised by combining both strategies and calculated as follows:
25
𝑎𝑣𝑒𝑟𝑎𝑔𝑒 𝑜𝑢𝑡𝑐𝑜𝑚𝑒 𝑎𝑐𝑟𝑜𝑠𝑠 𝑡𝑟𝑒𝑎𝑡𝑒𝑑 𝑖𝑛𝑑𝑖𝑣𝑖𝑑𝑢𝑎𝑙𝑠
𝑎𝑣𝑒𝑟𝑎𝑔𝑒 𝑜𝑢𝑡𝑐𝑜𝑚𝑒 𝑎𝑐𝑟𝑜𝑠𝑠 𝑢𝑛𝑡𝑟𝑒𝑎𝑡𝑒𝑑 𝑖𝑛𝑑𝑖𝑣𝑖𝑑𝑢𝑎𝑙𝑠 (9).
For each parameter draw, the numerator is the average outcome in case of treatment for all
individuals (so the factual simulated outcome for the individuals assigned to the treatment or
the counterfactual outcome in case of no such assignment) while the denominator is the
average outcome in case of no treatment for all the individuals (so the counterfactual
outcome for the individuals assigned to the treatment or the factual simulated outcome in
case of no such assignment). If the ATE is above (below) 1, this means there is a positive
(negative) effect of the treatment on the outcome of interest. Below, we discuss the
distribution of this ATE, i.e. its average over the 999 draws and its 95% confidence intervals.
Total and Direct Effects
For outcomes realised after the decision (not) to enrol in a dual program, we make a
distinction between total effects and direct effects. For the total effects, we do not condition
equation (9) on earlier outcomes. Consequently, the treatment impacts these outcomes both
directly (via the model’s coefficients capturing the direct effect of a dual program) and
indirectly (via the model’s coefficients capturing the effects of earlier outcomes, which in turn
were (potentially) affected by inflowing into a dual program). In contrast, for the direct
effects, we condition equation (9) on earlier outcomes as realised in the factual situation.
Consequently, the treatment impacts the analysed outcomes only directly (via the model’s
coefficients capturing the direct effect of a dual program on these outcomes).
26
Results
In this section we present the results of our analyses. We start with a brief discussion of the
coefficient estimates of our benchmark model and three alternative models (to inspect
whether the effect of the dual programs is heterogeneous by observed early labour market
outcome and by gender). Next, we discuss our ATEs and contrast the total effects of inflowing
into a dual program with its direct effects. All these analyses are based on our preferred
model, i.e. the model with six heterogeneity types.
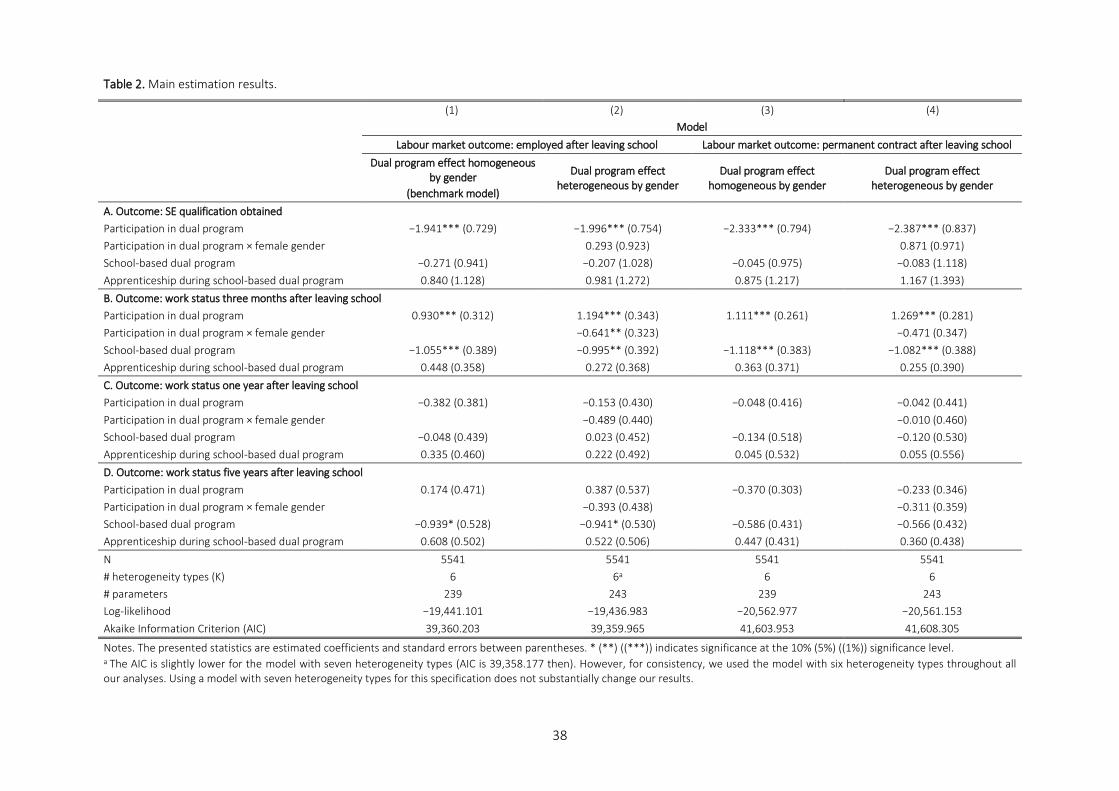
Table 2 shows the main coefficient estimates for several specifications of our model—
the full estimation results of our benchmark model are presented in Table A–2. The models
of which the main results are presented in the first two columns of Table 2 use ‘employed
after leaving school’ as the labour market outcome, while the other models use ‘permanent
contract after leaving school’. Column (1) and (3) show the results for models without an
interaction effect between participation in a dual program and female gender while column
(2) and (4) provide the estimation results for an extended version of the model in which this
interaction is added. The coefficients should be interpreted relative to 0. If the coefficients
are above (below) 0, there is a positive (negative) effect of inflowing into a dual program
compared to regular full-time education. The effect of inflowing into a training centre-based
dual program is measured by the coefficient of ‘participation in dual program’. For students
in a school-based dual program without apprenticeship (with apprenticeship), this coefficient
should be increased with the coefficient of ‘school-based dual program’ (with the coefficients
of ‘school-based dual program’ and ‘apprenticeship during school-based dual program’).
<Table 2 about here>
We first focus on the results in column (1) and (3). Panel A of Table 2 clearly shows a

27
highly significantly negative effect of enrolling in a dual program on the probability of
obtaining a secondary education qualification. We cannot reject that this effect is
homogeneous by whether one inflows into a training centre-based or school-based dual
program (i.e. ‘school-based dual program’ is not significant) or by whether one is employed
during one’s school-based dual program (i.e. ‘apprenticeship during school-based dual
program’ is not significant).
Regarding the work status (employment and having a permanent contract after leaving
school) of students three months after leaving school (Panel B), we observe a highly
significantly positive effect for students doing a training centre-based dual program
(conditional on the included education outcomes). For students with an experience of a
school-based dual program, we cannot reject the null hypothesis of a 0 effect (i.e. the sum of
the coefficients of ‘participation in dual program’ and ‘school-based dual program’ is never
statistically significantly different from 0). Further, no significant effects of the dual programs
are found with respect to the later labour market outcomes (conditional on earlier education
and labour market outcomes).
Concerning heterogeneous effects by gender, we find a negative effect of the interaction
term ‘participation in a dual program × female gender’ on the probability of being employed
three months after leaving school but not on the probability of having a permanent contract
then. So, the premium of a dual program is found to be lower for females, ceteris paribus.
The mentioned results based on parameter estimates are direct effects, i.e. they are
conditional on all earlier outcomes. Moreover, their magnitude is difficult to interpret.
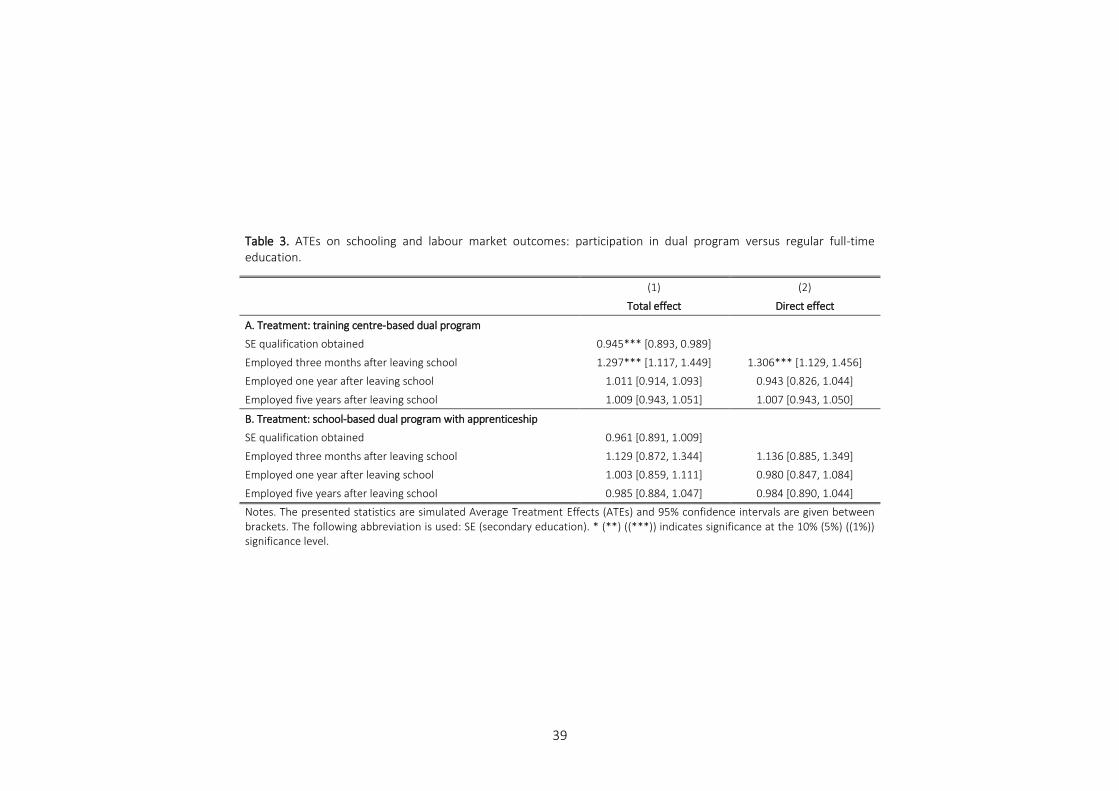
Therefore, in Table 3 and 4, we present various ATEs of the dual programs. The treatment is
a particular dual program. The counterfactual is the scenario where the same individuals do

28
not follow any dual program (i.e. they are enrolled in regular full-time regular education).9
The ATEs should be interpreted relative to 1. If the ratio is above (below) 1, there is a positive
(negative) effect of the dual program compared to regular full-time education.
Column (1) of Table 3 shows the total effects of dual programs on secondary education
qualification and employment three months, one year and five years after leaving school. In
line with our discussion of Panel A of Table 2, we find that students doing a training centre-
based dual program (Panel A of Table 3) are 5.5% less likely to obtain a secondary education
qualification compared to students in regular full-time education. Next, students in a school-
based dual program with apprenticeship (Panel B), are 3.9% less likely to obtain this
qualification (compared to students without in inflow in a dual program). However, the latter
effect is not statistically significantly different from 0. Concerning the labour market
outcomes, we find that students in training centre-based dual programs are 29.7% more likely
to have a job three months after leaving school, but that this effect fades out over time. That
is, there is no effect on the probability of having a job one year and five years after leaving
school. For students doing a school-based dual program with apprenticeship, we see the same
pattern, although we do not find a statistically significant effect. Also in economic terms, the
ATEs are lower (compared with those for a training centre-based dual program).
<Table 3 about here>
Column (2) of Table 3 presents the direct effects of the two dual programs.10 These effects
capture the same empirical pattern as that presented in column (2) of Table 2, since the
coefficient estimates also measure direct effects. For students doing a training centre-based
9 Results do not substantially differ when estimating ATTs or ATNTs (see Table A–4 in Appendix A).
10 Given that for the outcome ‘secondary education qualification obtained’, we do not condition on prior
endogenous outcome variables, the direct effects equal the total effects and are therefore not reported.

29
dual program, the direct effect on finding a job three months after leaving school (30.6%), is
slightly bigger than the total effect (29.7%). This means that the direct effect
overcompensates a very small negative indirect effect, via the negative effect of doing a
training centre-based dual program on obtaining a secondary education qualification, which
in turn has a positive effect on finding work (Panel M of Table A–2).11
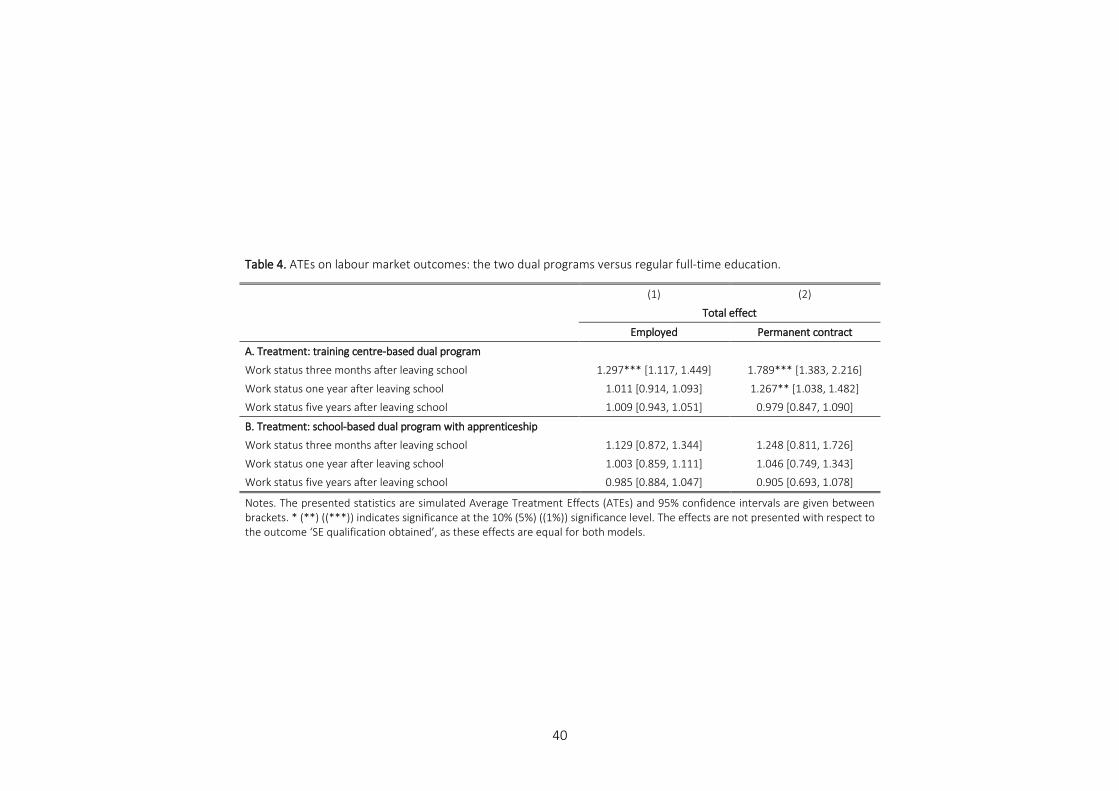
Table 4 compares the total effects on the labour market outcome ‘employed after
leaving school’ with the alternative labour market outcome ‘permanent contract after leaving
school’. For this alternative outcome the results are somewhat more pronounced. Students
doing a training centre-based dual program have a 78.9% higher probability of having a
permanent contract three months after leaving school and a 26.7% higher probability of
having a permanent contract one year after leaving school. The fact that a significant total
effect on having a permanent contract one year after leaving school is found while column
(3) of Table 2 points in the direction of no direct effect, can be explained by the significant
effect of having a contract three months after leaving school on having such a contract one
year after leaving school. Again, for students in the school-based dual program with
apprenticeship (Panel B), no statistically significant treatment effects are found.
<Table 4 about here>
Conclusion
In this study we examined the effect of training centre-based and school-based dual programs
11 When using the outcome ‘permanent contract after leaving school’, the differences between total effects and
direct effects are similar. These additional results are available on request.
30
within the context of the Belgian secondary education system on educational achievement
and labour market outcomes. We found that students doing a training centre-based dual
program less often obtain a secondary education qualification compared to students in
regular full-time education, whereas this effect was not significant for students in a school-
based dual program. In addition, students doing a training centre-based dual program had an
increased probability of finding a job when entering the labour market and this impact
diminished over time. This advantage was not found for students in the school-based dual
program, suggesting that the positive effect of doing a training centre-based dual program is
due to its closer ties to the labour market. The finding that the advantage of training centre-
based dual programs in the short run fades out over time, is consistent with previous
literature that also found evidence for a positive effect of vocational education on
employment outcomes only in the short run (Brunello and Rocco, 2017; Forster et al., 2016;
Hampf and Woessman, 2017; Hanushek et al., 2017; Lavrijsen and Nicaise, 2017).
Our results have several implications for policy makers. First, overall, our evaluation of
the Flemish dual programs in secondary education is rather positive. Although students
inflowing into this system face a slightly higher unqualified drop-out, they have a substantially
higher probability of a smooth transition to work (especially with respect to getting a
permanent contract) compared with students with the same endowments who did not inflow
in a dual program. Second, and in line with Albanese et al. (2017), our results suggest that this
advantage may be enforced by increasing the importance of in-field training. Third, our results
also suggest that policy makers face a trade-off when designing dual programs since programs
with more in-field training also seem to result in more unqualified drop-out, with potential
negative effects beyond early labour market outcomes (Hanushek et al., 2017; Weber, 2014).
Finally, we recommend several directions for future research. First, we suggest to
31
investigate the effect of dual programs (in Belgium and abroad) on other labour market
outcomes than those considered in this study. In particular, it would be interesting to see
what the direct and indirect causal effects of the studied programs on later wages are.
Second, due to data constraints, we were unable to investigate the mechanisms underlying
the smoother transition from school to work after a (training centre-based) dual program in
secondary education. In particular, our data did not allow us to examine the extent to which
students enrolled in such a program start to work with the employer who they worked for
during these programs. Finding evidence for this screening channel could support the idea
that programs with more in-field training are more effective due to the realised stronger ties
with the labour market. Third, as Verhaest and Baert (2018) already examined for vocational
education in higher studies, it would be interesting to see what the effect of vocational
education programs in secondary education is on school leavers’ job match. In particular, it
would be interesting to examine whether there also exists a decline in the short-term
advantages of dual programs with respect to this outcome. Fourth, since we only observed
the first five years after labour market entry, we were not able to assess whether the declining
advantage of dual programs in terms of labour market outcomes ultimately turns into a
disadvantage, as found in some former contributions. Relying on a similar type of modelling
to investigate whether this is the case is a final interesting avenue for further research.
References
Albanese, A., Cappellari, L., & Leonardi, M. (2017). The Effects of Youth Labor Market
Reforms: Evidence from Italian Apprenticeships. IZA Discussion Papers, 10766.
32
Altonji, J. G., Blom, E., & Meghir, C. (2012). Heterogeneity in human capital investments:
High school curriculum, college major, and careers. Annual Review of Economics, 4, 185–223.
Angrist, J. D., & Krueger, A. B. (1991). Does Compulsory School Attendance Affect
Schooling and Earnings. Quarterly Journal of Economics, 106, 979–1074.
Baert, S., & Cockx, B. (2013). Pure Ethnic Gaps in Educational Attainment and School to
Work Transitions. When Do They Arise? Economics of Education Review, 36, 276–294.
Baert, S., Neyt, B., Omey, E., & Verhaest, D. (2017). Student Work, Educational
Achievement, and Later Employment: A Dynamic Approach. IZA Discussion Papers, 11127.
Bedard K., & Dhuey, E. (2006). The persistence of early childhood maturity: International
evidence of long-run age effects. Quarterly Journal of Economics, 121, 1437–1472.
Belzil, C., & Poinas, F. (2010). Education and Early Career Outcomes of Second-
Generation Immigrants in France. Labour Economics, 17, 101–110.
Bishop, J. H., & Mane, F. (2004). The impacts of career-technical education on high school
labor market success. Economics of Education Review, 23, 381–402.
Brunello, G., & Rocco, L. (2017). The Labor Market Effects of Academic and Vocational
Education over the Life Cycle: Evidence Based on a British Cohort. Journal of Human Capital,
11, 106–166.
Cameron, S. V., & Heckman, J. J. (1998). Life Cycle Schooling and Dynamic Selection Bias:
Models and Evidence for Five Cohorts of American Males. Journal of Political Economy, 106,
262–333.
Cameron, S. V., & Heckman, J. J. (2001). The Dynamics of Educational Attainment for
Black, Hispanic and White Males. Journal of Political Economy, 109, 455–499.
Carneiro, P., Hansen, K., & Heckman, J. J. (2003). Estimating Distributions of Treatment
Effects with an Application to the Returns to Schooling and Measurement of the Effects of
33
Uncertainty on College Choice. International Economic Review, 44, 361–422.
Cockx, B., Picchio, M., & Baert, S. (in press). Modeling the Effects of Grade Retention in
High School. Journal of Applied Econometrics.
Cörvers, F., Heijke, H., Kriechel, B., & Pfeifer, H. (2011). High and steady or low and rising?
Life-cycle earnings patterns in vocational and general education. Mimeo.
Eichhorst, W., Rodríguez-Planas, N., Schmidl, R., & Zimmermann, K. (2012). A roadmap
to vocational education and training systems around the world. IZA Discussion Papers, 7110.
Forster, A. G., Bol, T., & van de Werfhorst, H. G. (2016). Vocational education and
employment over the life cycle. Sociological Science, 3, 473–494.
Fruehwirth, J. C., Navarro, S., & Takahashi, Y. (2016). How the timing of grade retention
affects outcomes: Identification and estimation of time-varying treatment effects. Journal of
Labor Economics, 34, 979–1021.
Fumarco, L., & Baert, S. (2017). Relative Age Effect on European Adolescents’ Social
Network. Mimeo.
Gaure, S., Røed, K., & Zhang, T. (2007). Time and causality: A Monte Carlo assessment of
the timing-of-events approach. Journal of Econometrics, 141, 1159–1195.
Golsteyn, B. H., & Stenberg, A. (2014). Comparing long term earnings trajectories of
individuals with general and specific education. Work, 04–20.
Grubb, W. N., & Lazerson, M. (2005). Vocationalism in higher education: The triumph of
the education gospel. Journal of Higher Education, 76, 1–25.
Hanushek, E. A., Schwerdt, G., Woessmann, L., & Zhang, L. (2017). General Education,
Vocational Education, and Labor-Market Outcomes over the Lifecycle. Journal of Human
Resources, 52, 48–87.
Hampf, F., & Woessmann, L. (2017). Vocational vs. General Education and Employment
34
over the Life Cycle: New Evidence from PIAAC. CESifo Economic Studies, 63, 255–269.
Heckman, J. J., & Navarro, S. (2007). Dynamic Discrete Choice and Dynamic Treatment
Effects. Journal of Econometrics, 136, 341–396.
Krueger, D., & Kumar, K. B. (2004). US–Europe differences in technology-driven growth:
quantifying the role of education. Journal of Monetary Economics, 51, 161–190.
Laurijssen, I., & Glorieux, I. (2017). De arbeidsmarktperspectieven van een
beroepsgerichte opleiding. Een analyse van de eerste jaren van Vlaamse schoolverlaters op de
arbeidsmarkt. Gent: Steunpunt Onderwijsonderzoek.
Lavrijsen, J., & Nicaise, I. (2017). Returns on vocational education over the life cycle:
Between immediate labour market preparation and lifelong employability. International
Review of Education, 63, 257–280.
Malamud, O., & Pop-Eleches, C. (2010). General education versus vocational training:
Evidence from an economy in transition. Review of Economics and Statistics, 92, 43–60.
Ryan, P. (2001). The school-to-work transition: a cross-national perspective. Journal of
Economic Literature, 39, 34–92.
van de Werfhorst, H. G. (2014). Changing societies and four tasks of schooling:
Challenges for strongly differentiated educational systems. International Review of Education,
60, 123–144.
Verhaest, D., & Baert, S. (2018). The effects of workplace learning in higher education on
employment and match quality: Is there an early-career trade-off? Empirical Economics, 55,
1229–1270.
Verhaest, D., Lavrijsen, J., Van Trier, W., Nicaise, I., & Omey, E. (2018). General education,
vocational education and skill mismatches: short-run versus long-run effects. Oxford
Economic Papers, 70, 974–993.
35
Weber, S. (2014). Human capital depreciation and education level. International Journal
of Manpower, 35, 613–642.
Wolter, S. C., & Ryan, P. (2011). Chapter 11 - Apprenticeship. In E. A. Hanushek, S.
Machin, & L. Woessmann (Eds.), Handbook of the Economics of Education Vol. 3, 521–576.
Amsterdam: Elsevier.
Zimmermann, K. F., Biavaschi, C., Eichhorst, W., Giulietti, C., Kendzia, M. J., Muravyev, A.,
Pieters, J., Rodríguez-Planas, N., & Schmidl, R. (2013). Youth unemployment and vocational
training. Foundations and Trends in Microeconomics, 9, 1–157.
Appendix A
<Table A–1 about here>
<Table A–2 about here>
<Table A–3 about here>
<Table A–4 about here>
36
Table 1. Summary statistics.
(1) (2) (3) (4) (5) (6) (7) (8) (9) (10) (11) (12)
I. Whole sample
(N = 5541)
II. Sample with regular full-time education only
(N = 5209)
III. Sample with dual program
(N = 332)
IV. Sample with training centre-based
dual program
(N = 125)
V. Sample with school-based dual program without apprenticeship
(N = 97)
VI. Sample with school-based dual
program with apprenticeship
(N = 110)
Mean SD Mean SD Mean SD Mean SD Mean SD Mean SD
A. Exogenous variables
Female gender 0.495 - 0.506 - 0.331 - 0.317 - 0.485 - 0.211 -
Migration background 0.062 - 0.057 - 0.142 - 0.071 - 0.247 - 0.128 -
Number of siblings 1.642 1.403 1.606 1.351 2.208 1.966 1.706 1.345 2.763 2.482 2.294 1.921
Mother’s education after primary education (years) 5.441 3.209 5.585 3.164 3.181 3.058 3.508 2.950 2.742 3.046 3.193 3.170
Father’s education after primary education (years) 5.869 3.472 6.016 3.442 3.563 3.103 3.659 2.860 3.134 3.319 3.835 3.164
Day of birth within calendar year 180.316 103.336 180.358 103.334 179.654 103.517 165.365 104.101 207.536 105.434 171.358 97.016
B. Endogenous variables
B.1. Educational outcomes before potential selection in dual program
Delay at start PE 0.017 - 0.016 - 0.033 - 0.032 - 0.021 - 0.046 -
Delay at start SE 0.106 - 0.096 - 0.268 - 0.246 - 0.278 - 0.284 -
Track choice at start second year of SE
General track 0.605 - 0.634 - 0.157 - 0.206 - 0.124 - 0.128 -
Technical or arts track 0.260 - 0.257 - 0.307 - 0.246 - 0.351 - 0.339 -
Vocational track 0.135 - 0.109 - 0.536 - 0.548 - 0.526 - 0.532 -
SE experience at end of compulsory FT education
No retention and no downgrade 0.812 - 0.820 - 0.681 - 0.738 - 0.670 - 0.624 -
Retention and no downgrade 0.074 - 0.069 - 0.160 - 0.103 - 0.175 - 0.211 -
No retention and downgrade 0.104 - 0.102 - 0.139 - 0.127 - 0.134 - 0.156 -
Retention and downgrade 0.010 - 0.009 - 0.021 - 0.032 - 0.021 - 0.009 -
B.2. Choice related to dual program
Participation in dual program 0.060 - 0.000 - 1.000 - 1.000 - 1.000 - 1.000 -
Training centre-based dual program 0.023 - 0.000 - 0.377 - 1.000 - 0.000 - 0.000 -
School-based dual program 0.037 - 0.000 - 0.623 - 0.000 - 1.000 - 1.000 -
Apprenticeship during school-based dual program 0.020 - 0.000 - 0.328 - 0.000 - 0.000 - 1.000 -
37
B.3. Later schooling and labour market outcomes
SE qualification obtained 0.924 - 0.942 - 0.633 - 0.770 - 0.546 - 0.550 -
TE enrolment 0.636 - 0.677 - 0.000 - 0.000 - 0.000 - 0.000 -
Employed three months after leaving school 0.615 - 0.613 - 0.646 - 0.795 - 0.495 - 0.619 -
Employed one year after leaving school 0.834 - 0.842 - 0.723 - 0.819 - 0.608 - 0.724 -
Employed five years after leaving school 0.906 - 0.920 - 0.780 - 0.900 - 0.627 - 0.788 -
Permanent contract three months after leaving school 0.311 - 0.305 - 0.407 - 0.569 - 0.258 - 0.365 -
Permanent contract one year after leaving school 0.504 - 0.505 - 0.497 - 0.637 - 0.371 - 0.462 -
Permanent contract five years after leaving school 0.768 - 0.780 - 0.643 - 0.758 - 0.494 - 0.655 -
Notes. See Section 3 for a description of the mentioned variables. The following abbreviations are used: FT (full-time), PE (primary education), SE (secondary education), and TE (tertiary education). For binary variables no standard deviations are presented.
38
Table 2. Main estimation results.
(1) (2) (3) (4)
Model
Labour market outcome: employed after leaving school Labour market outcome: permanent contract after leaving school
Dual program effect homogeneous by gender
(benchmark model)
Dual program effect heterogeneous by gender
Dual program effect homogeneous by gender
Dual program effect heterogeneous by gender
A. Outcome: SE qualification obtained
Participation in dual program −1.941*** (0.729) −1.996*** (0.754) −2.333*** (0.794) −2.387*** (0.837)
Participation in dual program × female gender 0.293 (0.923) 0.871 (0.971)
School-based dual program −0.271 (0.941) −0.207 (1.028) −0.045 (0.975) −0.083 (1.118)
Apprenticeship during school-based dual program 0.840 (1.128) 0.981 (1.272) 0.875 (1.217) 1.167 (1.393)
B. Outcome: work status three months after leaving school
Participation in dual program 0.930*** (0.312) 1.194*** (0.343) 1.111*** (0.261) 1.269*** (0.281)
Participation in dual program × female gender −0.641** (0.323) −0.471 (0.347)
School-based dual program −1.055*** (0.389) −0.995** (0.392) −1.118*** (0.383) −1.082*** (0.388)
Apprenticeship during school-based dual program 0.448 (0.358) 0.272 (0.368) 0.363 (0.371) 0.255 (0.390)
C. Outcome: work status one year after leaving school
Participation in dual program −0.382 (0.381) −0.153 (0.430) −0.048 (0.416) −0.042 (0.441)
Participation in dual program × female gender −0.489 (0.440) −0.010 (0.460)
School-based dual program −0.048 (0.439) 0.023 (0.452) −0.134 (0.518) −0.120 (0.530)
Apprenticeship during school-based dual program 0.335 (0.460) 0.222 (0.492) 0.045 (0.532) 0.055 (0.556)
D. Outcome: work status five years after leaving school
Participation in dual program 0.174 (0.471) 0.387 (0.537) −0.370 (0.303) −0.233 (0.346)
Participation in dual program × female gender −0.393 (0.438) −0.311 (0.359)
School-based dual program −0.939* (0.528) −0.941* (0.530) −0.586 (0.431) −0.566 (0.432)
Apprenticeship during school-based dual program 0.608 (0.502) 0.522 (0.506) 0.447 (0.431) 0.360 (0.438)
N 5541 5541 5541 5541
# heterogeneity types (K) 6 6a 6 6
# parameters 239 243 239 243
Log-likelihood −19,441.101 −19,436.983 −20,562.977 −20,561.153
Akaike Information Criterion (AIC) 39,360.203 39,359.965 41,603.953 41,608.305
Notes. The presented statistics are estimated coefficients and standard errors between parentheses. * (**) ((***)) indicates significance at the 10% (5%) ((1%)) significance level. a The AIC is slightly lower for the model with seven heterogeneity types (AIC is 39,358.177 then). However, for consistency, we used the model with six heterogeneity types throughout all our analyses. Using a model with seven heterogeneity types for this specification does not substantially change our results.
39
Table 3. ATEs on schooling and labour market outcomes: participation in dual program versus regular full-time education.
(1) (2)
Total effect Direct effect
A. Treatment: training centre-based dual program
SE qualification obtained 0.945*** [0.893, 0.989]
Employed three months after leaving school 1.297*** [1.117, 1.449] 1.306*** [1.129, 1.456]
Employed one year after leaving school 1.011 [0.914, 1.093] 0.943 [0.826, 1.044]
Employed five years after leaving school 1.009 [0.943, 1.051] 1.007 [0.943, 1.050]
B. Treatment: school-based dual program with apprenticeship
SE qualification obtained 0.961 [0.891, 1.009]
Employed three months after leaving school 1.129 [0.872, 1.344] 1.136 [0.885, 1.349]
Employed one year after leaving school 1.003 [0.859, 1.111] 0.980 [0.847, 1.084]
Employed five years after leaving school 0.985 [0.884, 1.047] 0.984 [0.890, 1.044]
Notes. The presented statistics are simulated Average Treatment Effects (ATEs) and 95% confidence intervals are given between brackets. The following abbreviation is used: SE (secondary education). * (**) ((***)) indicates significance at the 10% (5%) ((1%)) significance level.
40
Table 4. ATEs on labour market outcomes: the two dual programs versus regular full-time education.
(1) (2)
Total effect
Employed Permanent contract
A. Treatment: training centre-based dual program
Work status three months after leaving school 1.297*** [1.117, 1.449] 1.789*** [1.383, 2.216]
Work status one year after leaving school 1.011 [0.914, 1.093] 1.267** [1.038, 1.482]
Work status five years after leaving school 1.009 [0.943, 1.051] 0.979 [0.847, 1.090]
B. Treatment: school-based dual program with apprenticeship
Work status three months after leaving school 1.129 [0.872, 1.344] 1.248 [0.811, 1.726]
Work status one year after leaving school 1.003 [0.859, 1.111] 1.046 [0.749, 1.343]
Work status five years after leaving school 0.985 [0.884, 1.047] 0.905 [0.693, 1.078]
Notes. The presented statistics are simulated Average Treatment Effects (ATEs) and 95% confidence intervals are given between brackets. * (**) ((***)) indicates significance at the 10% (5%) ((1%)) significance level. The effects are not presented with respect to the outcome ‘SE qualification obtained’, as these effects are equal for both models.
41
Figure 1. Youth and non-youth unemployment rates.
Source: Eurostat. Youth: between 15 and 24 years old. Non-youth: between 25 and 74 years old.
0
5
10
15
20
25
30
2008 2009 2010 2011 2012 2013 2014 2015 2016 2017
% u
nem
plo
yed
EU (youth) Belgium (youth) US (youth) EU (non-youth) Belgium (non-youth) US (non-youth)
42
Figure 2. Schematic overview of the econometric model.
Notes. The following abbreviations are used: FT (full-time), PE (primary education), SE (secondary education), TE (tertiary education), mos. (months), yr. (year), and yrs. (years).

43
Figure 3. Goodness of fit.
Notes. The y-axis indicates how many times (on a total of 999) a particular probability (x-axis) was simulated. The full line indicates the actual probability, the dotted lines indicate the median and the 95% confidence interval of the simulated probabilities. The following abbreviations are used: CFTE (compulsory full-time education), PE (primary education), SE (secondary education), TE (tertiary education), mos. (months), yr. (year), and yrs. (years).
44
Table A–1. Benchmark model: model selection.
(1) (2) (3) (4)
# heterogeneity types (K) # parameters Log-likelihood Akaike Information Criterion
1 212 −19,602.013 39,628.027
2 231 −19,501.459 39,464.917
3 233 −19,455.369 39,376.737
4 235 −19,452.384 39,374.768
5 237 −19,447.588 39,369.175
6 239 −19,441.101 39,360.203
7 241 −19,439.929 39,361.859
8 243 −19,439.051 39,364.103
45
Table A–2. Benchmark model: full estimation results.
A. Outcome: Delay at start primary orientation
Female gender −0.048 (0.243)
Migration background 1.281*** (0.390)
Number of siblings 0.019 (0.089)
Mother’s education after PE (years) −0.031 (0.050)
Father’s education after PE (years) 0.032 (0.046)
Day of birth within calendar year 0.005*** (0.001)
Unemployment rate 0.017 (0.056)
Intercept −5.854*** (0.990)
B. Outcome: Delay at start SE
Female gender −0.285*** (0.099)
Migration background 0.525*** (0.162)
Number of siblings 0.096*** (0.032)
Mother’s education after PE (years) −0.139*** (0.019)
Father’s education after PE (years) −0.081*** (0.018)
Day of birth within calendar year 0.003*** (0.000)
Unemployment rate 0.011 (0.017)
Delay at start primary orientation 3.473*** (0.283)
Intercept −1.828*** (0.292)
C. Outcome: Track choice at start second year of SE: technical or arts track
Female gender −0.628*** (0.089)
Migration background −0.352* (0.195)
Number of siblings 0.080** (0.035)
Mother’s education after PE (years) −0.194*** (0,020)
Father’s education after PE (years) −0.187*** (0.018)
Day of birth within calendar year 0.001*** (0,000)
Unemployment rate 0.043*** (0,014)
Delay at start primary orientation −0.252 (0.365)
Delay at start secondary orientation 1.857*** (0.202)
Intercept 1.603*** (0.321)
D. Outcome: Track choice at start second year of SE: vocational track
Female gender −0.704*** (0.138)
Migration background −0.375 (0.269)
Number of siblings 0.238*** (0.048)
Mother’s education after PE (years) −0.355*** (0.031)
Father’s education after PE (years) −0.295*** (0.028)
Day of birth within calendar year 0.002*** (0.001)
Unemployment rate 0.096*** (0.021)
Delay at start primary orientation −0.176 (0.555)
Delay at start secondary orientation 3.252*** (0.263)
Intercept 1.071** (0.446)
E. Outcome: SE experience at end of compulsory FT education: delayed, not downgraded
Female gender −0.434*** (0.135)
Migration background 0.493** (0.240)
Number of siblings 0.055 (0.043)
Mother’s education after PE (years) 0.009 (0.027)
Father’s education after PE (years) 0.061*** (0.024)
Day of birth within calendar year 0.000 (0.001)
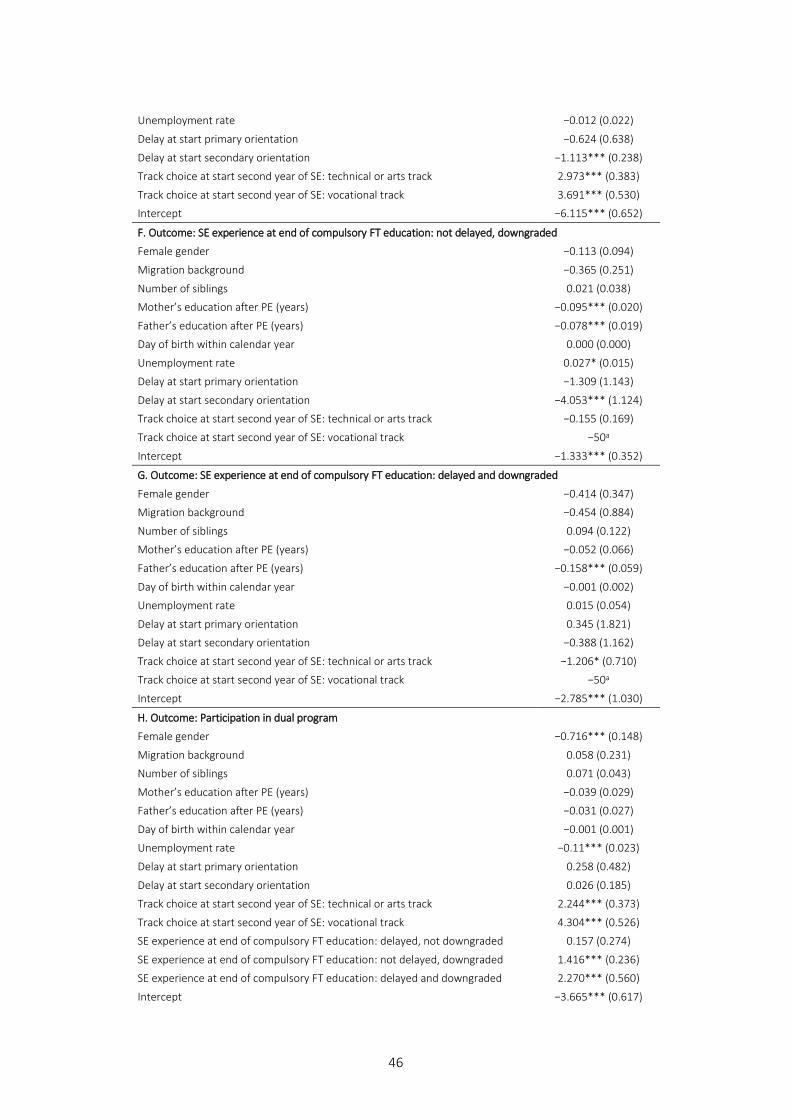
46
Unemployment rate −0.012 (0.022)
Delay at start primary orientation −0.624 (0.638)
Delay at start secondary orientation −1.113*** (0.238)
Track choice at start second year of SE: technical or arts track 2.973*** (0.383)
Track choice at start second year of SE: vocational track 3.691*** (0.530)
Intercept −6.115*** (0.652)
F. Outcome: SE experience at end of compulsory FT education: not delayed, downgraded
Female gender −0.113 (0.094)
Migration background −0.365 (0.251)
Number of siblings 0.021 (0.038)
Mother’s education after PE (years) −0.095*** (0.020)
Father’s education after PE (years) −0.078*** (0.019)
Day of birth within calendar year 0.000 (0.000)
Unemployment rate 0.027* (0.015)
Delay at start primary orientation −1.309 (1.143)
Delay at start secondary orientation −4.053*** (1.124)
Track choice at start second year of SE: technical or arts track −0.155 (0.169)
Track choice at start second year of SE: vocational track −50a
Intercept −1.333*** (0.352)
G. Outcome: SE experience at end of compulsory FT education: delayed and downgraded
Female gender −0.414 (0.347)
Migration background −0.454 (0.884)
Number of siblings 0.094 (0.122)
Mother’s education after PE (years) −0.052 (0.066)
Father’s education after PE (years) −0.158*** (0.059)
Day of birth within calendar year −0.001 (0.002)
Unemployment rate 0.015 (0.054)
Delay at start primary orientation 0.345 (1.821)
Delay at start secondary orientation −0.388 (1.162)
Track choice at start second year of SE: technical or arts track −1.206* (0.710)
Track choice at start second year of SE: vocational track −50a
Intercept −2.785*** (1.030)
H. Outcome: Participation in dual program
Female gender −0.716*** (0.148)
Migration background 0.058 (0.231)
Number of siblings 0.071 (0.043)
Mother’s education after PE (years) −0.039 (0.029)
Father’s education after PE (years) −0.031 (0.027)
Day of birth within calendar year −0.001 (0.001)
Unemployment rate −0.11*** (0.023)
Delay at start primary orientation 0.258 (0.482)
Delay at start secondary orientation 0.026 (0.185)
Track choice at start second year of SE: technical or arts track 2.244*** (0.373)
Track choice at start second year of SE: vocational track 4.304*** (0.526)
SE experience at end of compulsory FT education: delayed, not downgraded 0.157 (0.274)
SE experience at end of compulsory FT education: not delayed, downgraded 1.416*** (0.236)
SE experience at end of compulsory FT education: delayed and downgraded 2.270*** (0.560)
Intercept −3.665*** (0.617)
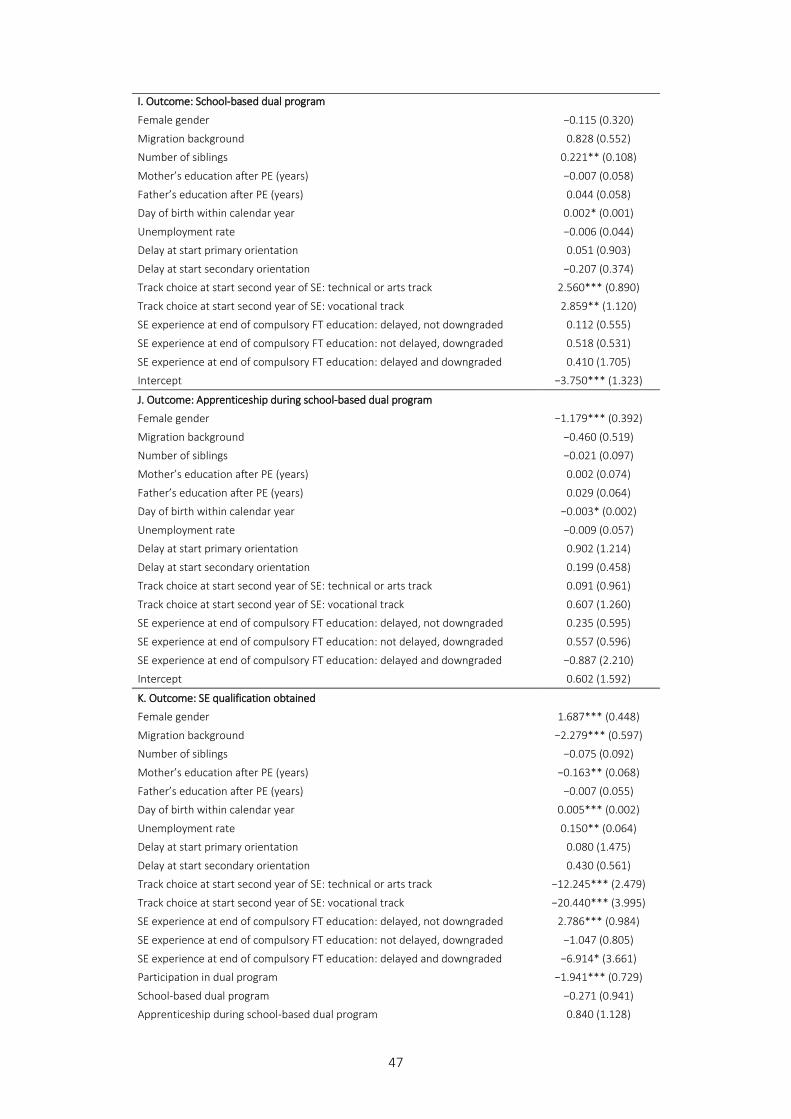
47
I. Outcome: School-based dual program
Female gender −0.115 (0.320)
Migration background 0.828 (0.552)
Number of siblings 0.221** (0.108)
Mother’s education after PE (years) −0.007 (0.058)
Father’s education after PE (years) 0.044 (0.058)
Day of birth within calendar year 0.002* (0.001)
Unemployment rate −0.006 (0.044)
Delay at start primary orientation 0.051 (0.903)
Delay at start secondary orientation −0.207 (0.374)
Track choice at start second year of SE: technical or arts track 2.560*** (0.890)
Track choice at start second year of SE: vocational track 2.859** (1.120)
SE experience at end of compulsory FT education: delayed, not downgraded 0.112 (0.555)
SE experience at end of compulsory FT education: not delayed, downgraded 0.518 (0.531)
SE experience at end of compulsory FT education: delayed and downgraded 0.410 (1.705)
Intercept −3.750*** (1.323)
J. Outcome: Apprenticeship during school-based dual program
Female gender −1.179*** (0.392)
Migration background −0.460 (0.519)
Number of siblings −0.021 (0.097)
Mother’s education after PE (years) 0.002 (0.074)
Father’s education after PE (years) 0.029 (0.064)
Day of birth within calendar year −0.003* (0.002)
Unemployment rate −0.009 (0.057)
Delay at start primary orientation 0.902 (1.214)
Delay at start secondary orientation 0.199 (0.458)
Track choice at start second year of SE: technical or arts track 0.091 (0.961)
Track choice at start second year of SE: vocational track 0.607 (1.260)
SE experience at end of compulsory FT education: delayed, not downgraded 0.235 (0.595)
SE experience at end of compulsory FT education: not delayed, downgraded 0.557 (0.596)
SE experience at end of compulsory FT education: delayed and downgraded −0.887 (2.210)
Intercept 0.602 (1.592)
K. Outcome: SE qualification obtained
Female gender 1.687*** (0.448)
Migration background −2.279*** (0.597)
Number of siblings −0.075 (0.092)
Mother’s education after PE (years) −0.163** (0.068)
Father’s education after PE (years) −0.007 (0.055)
Day of birth within calendar year 0.005*** (0.002)
Unemployment rate 0.150** (0.064)
Delay at start primary orientation 0.080 (1.475)
Delay at start secondary orientation 0.430 (0.561)
Track choice at start second year of SE: technical or arts track −12.245*** (2.479)
Track choice at start second year of SE: vocational track −20.440*** (3.995)
SE experience at end of compulsory FT education: delayed, not downgraded 2.786*** (0.984)
SE experience at end of compulsory FT education: not delayed, downgraded −1.047 (0.805)
SE experience at end of compulsory FT education: delayed and downgraded −6.914* (3.661)
Participation in dual program −1.941*** (0.729)
School-based dual program −0.271 (0.941)
Apprenticeship during school-based dual program 0.840 (1.128)
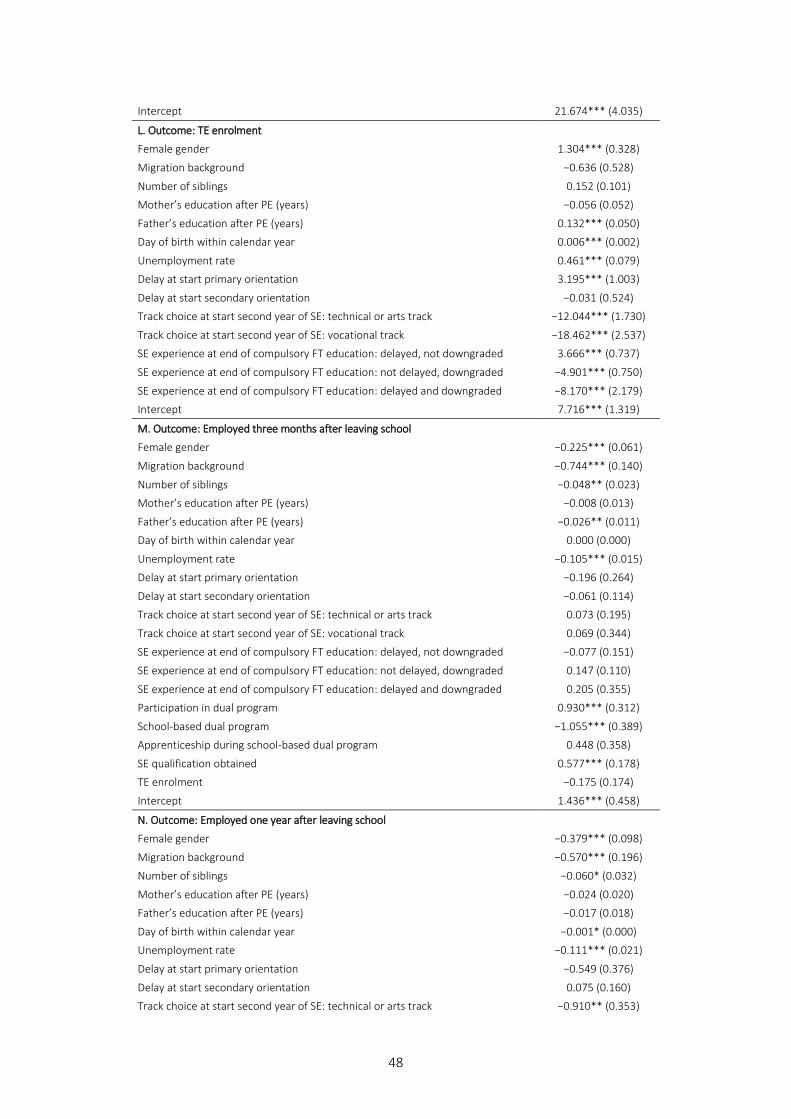
48
Intercept 21.674*** (4.035)
L. Outcome: TE enrolment
Female gender 1.304*** (0.328)
Migration background −0.636 (0.528)
Number of siblings 0.152 (0.101)
Mother’s education after PE (years) −0.056 (0.052)
Father’s education after PE (years) 0.132*** (0.050)
Day of birth within calendar year 0.006*** (0.002)
Unemployment rate 0.461*** (0.079)
Delay at start primary orientation 3.195*** (1.003)
Delay at start secondary orientation −0.031 (0.524)
Track choice at start second year of SE: technical or arts track −12.044*** (1.730)
Track choice at start second year of SE: vocational track −18.462*** (2.537)
SE experience at end of compulsory FT education: delayed, not downgraded 3.666*** (0.737)
SE experience at end of compulsory FT education: not delayed, downgraded −4.901*** (0.750)
SE experience at end of compulsory FT education: delayed and downgraded −8.170*** (2.179)
Intercept 7.716*** (1.319)
M. Outcome: Employed three months after leaving school
Female gender −0.225*** (0.061)
Migration background −0.744*** (0.140)
Number of siblings −0.048** (0.023)
Mother’s education after PE (years) −0.008 (0.013)
Father’s education after PE (years) −0.026** (0.011)
Day of birth within calendar year 0.000 (0.000)
Unemployment rate −0.105*** (0.015)
Delay at start primary orientation −0.196 (0.264)
Delay at start secondary orientation −0.061 (0.114)
Track choice at start second year of SE: technical or arts track 0.073 (0.195)
Track choice at start second year of SE: vocational track 0.069 (0.344)
SE experience at end of compulsory FT education: delayed, not downgraded −0.077 (0.151)
SE experience at end of compulsory FT education: not delayed, downgraded 0.147 (0.110)
SE experience at end of compulsory FT education: delayed and downgraded 0.205 (0.355)
Participation in dual program 0.930*** (0.312)
School-based dual program −1.055*** (0.389)
Apprenticeship during school-based dual program 0.448 (0.358)
SE qualification obtained 0.577*** (0.178)
TE enrolment −0.175 (0.174)
Intercept 1.436*** (0.458)
N. Outcome: Employed one year after leaving school
Female gender −0.379*** (0.098)
Migration background −0.570*** (0.196)
Number of siblings −0.060* (0.032)
Mother’s education after PE (years) −0.024 (0.020)
Father’s education after PE (years) −0.017 (0.018)
Day of birth within calendar year −0.001* (0.000)
Unemployment rate −0.111*** (0.021)
Delay at start primary orientation −0.549 (0.376)
Delay at start secondary orientation 0.075 (0.160)
Track choice at start second year of SE: technical or arts track −0.910** (0.353)
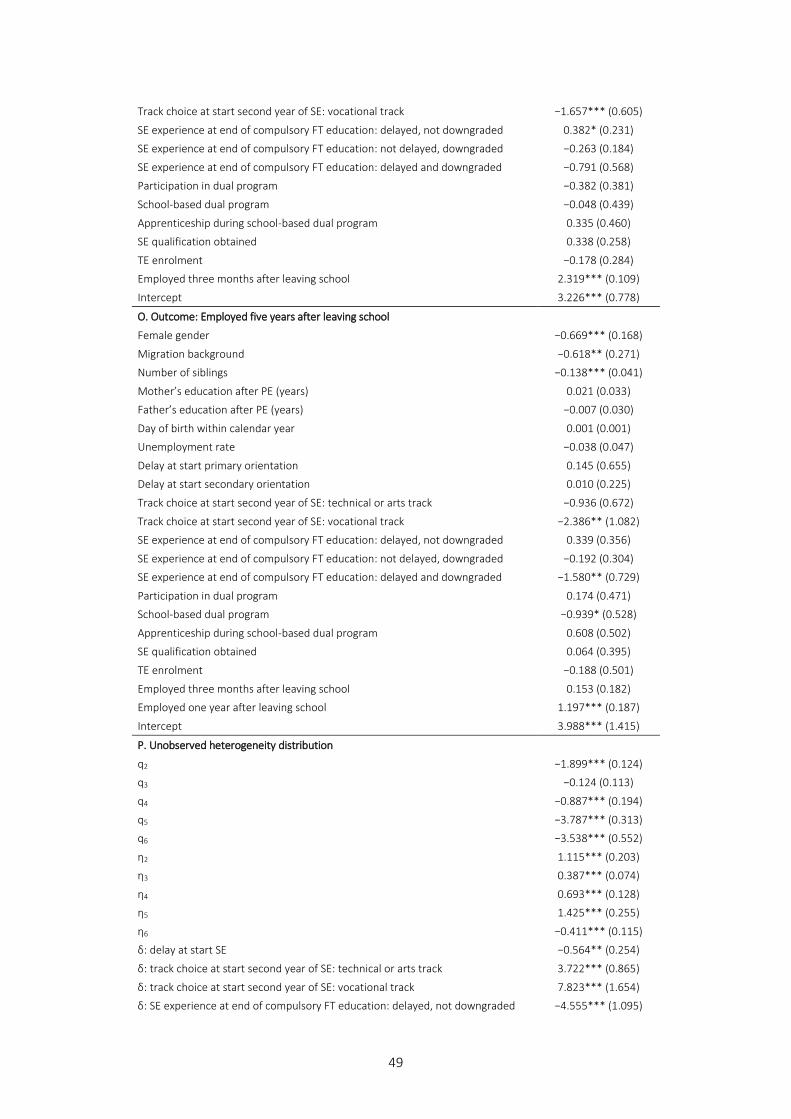
49
Track choice at start second year of SE: vocational track −1.657*** (0.605)
SE experience at end of compulsory FT education: delayed, not downgraded 0.382* (0.231)
SE experience at end of compulsory FT education: not delayed, downgraded −0.263 (0.184)
SE experience at end of compulsory FT education: delayed and downgraded −0.791 (0.568)
Participation in dual program −0.382 (0.381)
School-based dual program −0.048 (0.439)
Apprenticeship during school-based dual program 0.335 (0.460)
SE qualification obtained 0.338 (0.258)
TE enrolment −0.178 (0.284)
Employed three months after leaving school 2.319*** (0.109)
Intercept 3.226*** (0.778)
O. Outcome: Employed five years after leaving school
Female gender −0.669*** (0.168)
Migration background −0.618** (0.271)
Number of siblings −0.138*** (0.041)
Mother’s education after PE (years) 0.021 (0.033)
Father’s education after PE (years) −0.007 (0.030)
Day of birth within calendar year 0.001 (0.001)
Unemployment rate −0.038 (0.047)
Delay at start primary orientation 0.145 (0.655)
Delay at start secondary orientation 0.010 (0.225)
Track choice at start second year of SE: technical or arts track −0.936 (0.672)
Track choice at start second year of SE: vocational track −2.386** (1.082)
SE experience at end of compulsory FT education: delayed, not downgraded 0.339 (0.356)
SE experience at end of compulsory FT education: not delayed, downgraded −0.192 (0.304)
SE experience at end of compulsory FT education: delayed and downgraded −1.580** (0.729)
Participation in dual program 0.174 (0.471)
School-based dual program −0.939* (0.528)
Apprenticeship during school-based dual program 0.608 (0.502)
SE qualification obtained 0.064 (0.395)
TE enrolment −0.188 (0.501)
Employed three months after leaving school 0.153 (0.182)
Employed one year after leaving school 1.197*** (0.187)
Intercept 3.988*** (1.415)
P. Unobserved heterogeneity distribution
q2 −1.899*** (0.124)
q3 −0.124 (0.113)
q4 −0.887*** (0.194)
q5 −3.787*** (0.313)
q6 −3.538*** (0.552)
η2 1.115*** (0.203)
η3 0.387*** (0.074)
η4 0.693*** (0.128)
η5 1.425*** (0.255)
η6 −0.411*** (0.115)
δ: delay at start SE −0.564** (0.254)
δ: track choice at start second year of SE: technical or arts track 3.722*** (0.865)
δ: track choice at start second year of SE: vocational track 7.823*** (1.654)
δ: SE experience at end of compulsory FT education: delayed, not downgraded −4.555*** (1.095)
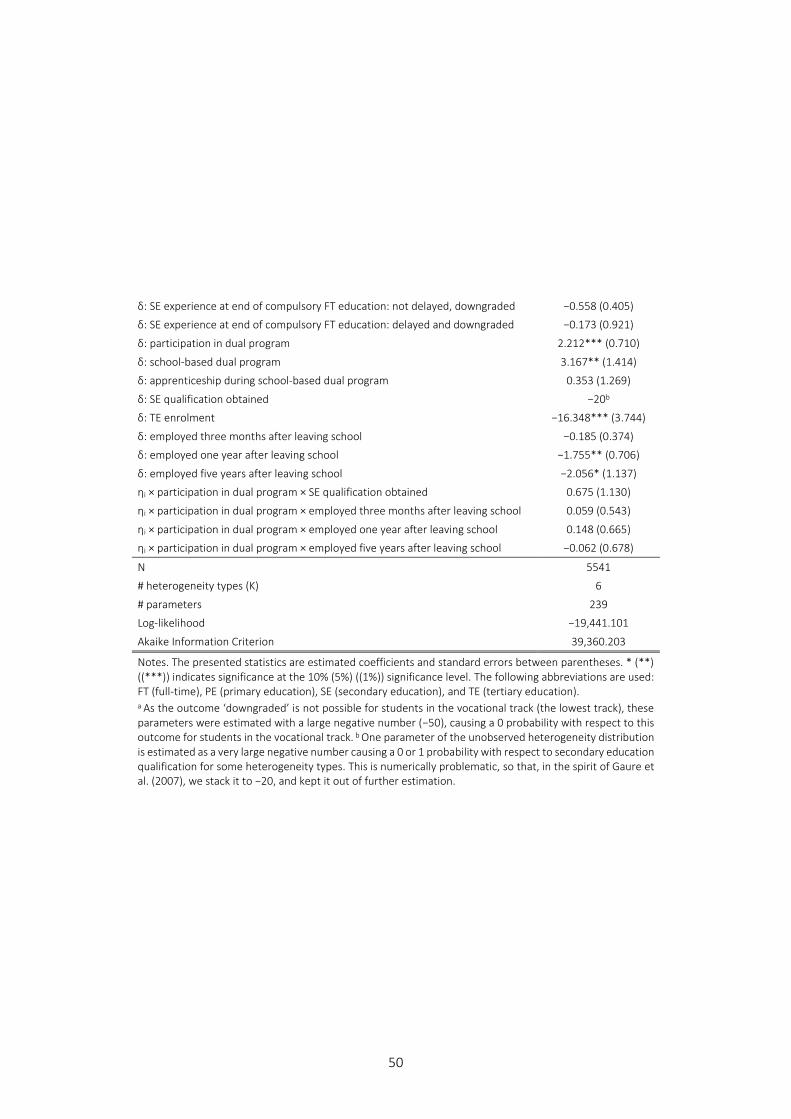
50
δ: SE experience at end of compulsory FT education: not delayed, downgraded −0.558 (0.405)
δ: SE experience at end of compulsory FT education: delayed and downgraded −0.173 (0.921)
δ: participation in dual program 2.212*** (0.710)
δ: school-based dual program 3.167** (1.414)
δ: apprenticeship during school-based dual program 0.353 (1.269)
δ: SE qualification obtained −20b
δ: TE enrolment −16.348*** (3.744)
δ: employed three months after leaving school −0.185 (0.374)
δ: employed one year after leaving school −1.755** (0.706)
δ: employed five years after leaving school −2.056* (1.137)
ηi × participation in dual program × SE qualification obtained 0.675 (1.130)
ηi × participation in dual program × employed three months after leaving school 0.059 (0.543)
ηi × participation in dual program × employed one year after leaving school 0.148 (0.665)
ηi × participation in dual program × employed five years after leaving school −0.062 (0.678)
N 5541
# heterogeneity types (K) 6
# parameters 239
Log-likelihood −19,441.101
Akaike Information Criterion 39,360.203
Notes. The presented statistics are estimated coefficients and standard errors between parentheses. * (**) ((***)) indicates significance at the 10% (5%) ((1%)) significance level. The following abbreviations are used: FT (full-time), PE (primary education), SE (secondary education), and TE (tertiary education). a As the outcome ‘downgraded’ is not possible for students in the vocational track (the lowest track), these parameters were estimated with a large negative number (−50), causing a 0 probability with respect to this outcome for students in the vocational track. b One parameter of the unobserved heterogeneity distribution is estimated as a very large negative number causing a 0 or 1 probability with respect to secondary education qualification for some heterogeneity types. This is numerically problematic, so that, in the spirit of Gaure et al. (2007), we stack it to −20, and kept it out of further estimation.
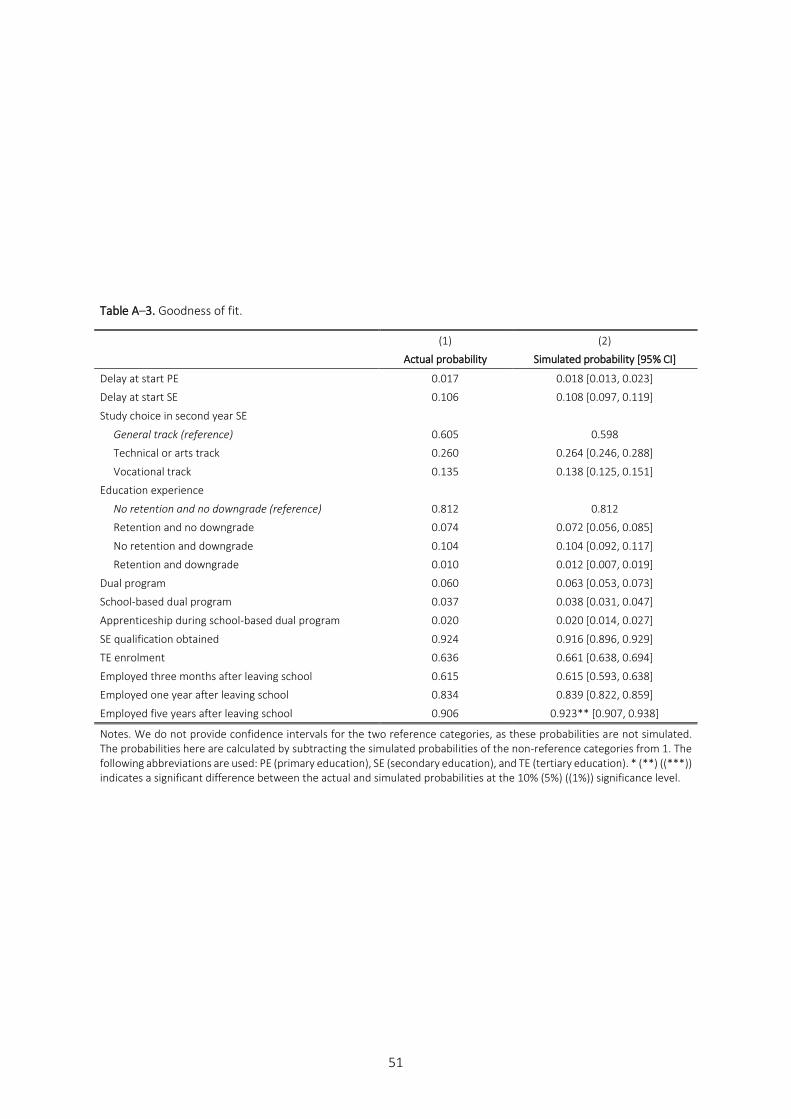
51
Table A–3. Goodness of fit.
(1) (2)
Actual probability Simulated probability [95% CI]
Delay at start PE 0.017 0.018 [0.013, 0.023]
Delay at start SE 0.106 0.108 [0.097, 0.119]
Study choice in second year SE
General track (reference) 0.605 0.598
Technical or arts track 0.260 0.264 [0.246, 0.288]
Vocational track 0.135 0.138 [0.125, 0.151]
Education experience
No retention and no downgrade (reference) 0.812 0.812
Retention and no downgrade 0.074 0.072 [0.056, 0.085]
No retention and downgrade 0.104 0.104 [0.092, 0.117]
Retention and downgrade 0.010 0.012 [0.007, 0.019]
Dual program 0.060 0.063 [0.053, 0.073]
School-based dual program 0.037 0.038 [0.031, 0.047]
Apprenticeship during school-based dual program 0.020 0.020 [0.014, 0.027]
SE qualification obtained 0.924 0.916 [0.896, 0.929]
TE enrolment 0.636 0.661 [0.638, 0.694]
Employed three months after leaving school 0.615 0.615 [0.593, 0.638]
Employed one year after leaving school 0.834 0.839 [0.822, 0.859]
Employed five years after leaving school 0.906 0.923** [0.907, 0.938]
Notes. We do not provide confidence intervals for the two reference categories, as these probabilities are not simulated. The probabilities here are calculated by subtracting the simulated probabilities of the non-reference categories from 1. The following abbreviations are used: PE (primary education), SE (secondary education), and TE (tertiary education). * (**) ((***)) indicates a significant difference between the actual and simulated probabilities at the 10% (5%) ((1%)) significance level.
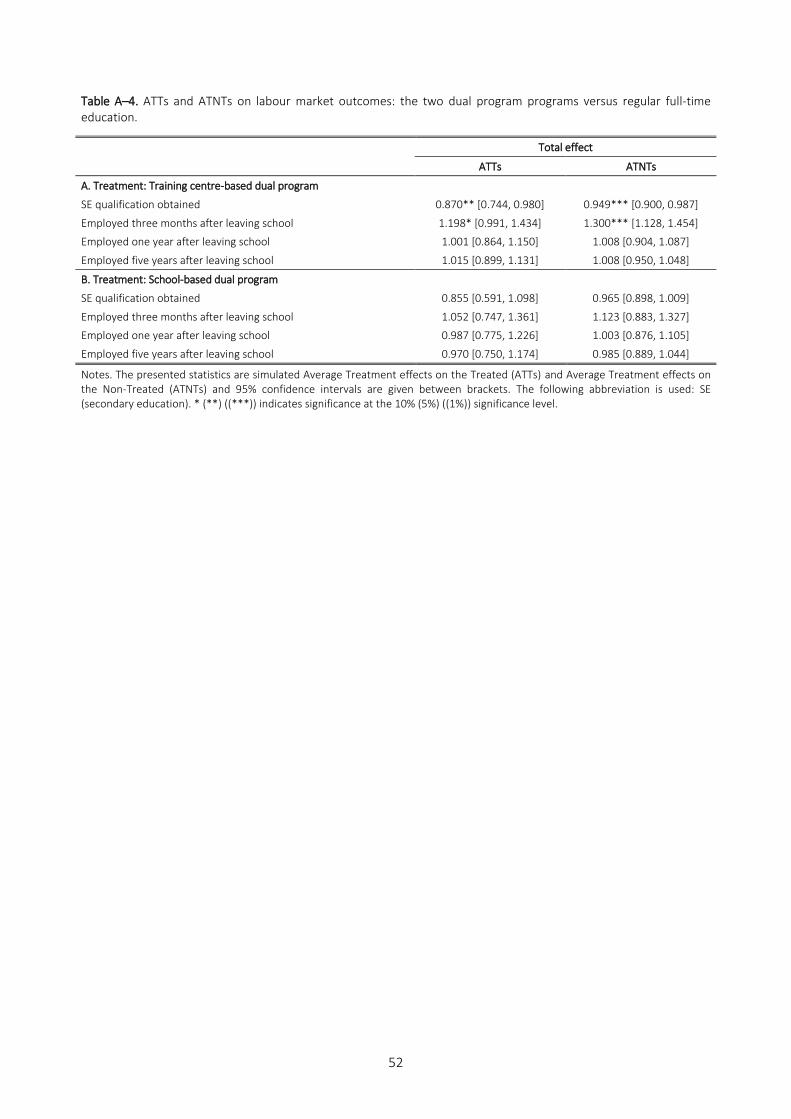
52
Table A–4. ATTs and ATNTs on labour market outcomes: the two dual program programs versus regular full-time education.
Total effect
ATTs ATNTs
A. Treatment: Training centre-based dual program
SE qualification obtained 0.870** [0.744, 0.980] 0.949*** [0.900, 0.987]
Employed three months after leaving school 1.198* [0.991, 1.434] 1.300*** [1.128, 1.454]
Employed one year after leaving school 1.001 [0.864, 1.150] 1.008 [0.904, 1.087]
Employed five years after leaving school 1.015 [0.899, 1.131] 1.008 [0.950, 1.048]
B. Treatment: School-based dual program
SE qualification obtained 0.855 [0.591, 1.098] 0.965 [0.898, 1.009]
Employed three months after leaving school 1.052 [0.747, 1.361] 1.123 [0.883, 1.327]
Employed one year after leaving school 0.987 [0.775, 1.226] 1.003 [0.876, 1.105]
Employed five years after leaving school 0.970 [0.750, 1.174] 0.985 [0.889, 1.044]
Notes. The presented statistics are simulated Average Treatment effects on the Treated (ATTs) and Average Treatment effects on the Non-Treated (ATNTs) and 95% confidence intervals are given between brackets. The following abbreviation is used: SE (secondary education). * (**) ((***)) indicates significance at the 10% (5%) ((1%)) significance level.